Embed Size (px)
Citation preview

“Inspecting the mechanism:Leverage and the Great Recession in Europe”
by Philippe Martin and Thomas Philippon
Gernot Muller (U Bonn and CEPR)
ESSIM, May 27, 2014
The issue
Interesting and thought-provoking paper on challenging issue
Boom-bust cycle in some euro area countries
I Pre-2008: “excessive” borrowing by private and public sector
I Post-2008: reduction of private debt
Paper aims at quantifying the contribution of
i.) Fiscal policy
ii.) Sudden stop
1/13
Analysis proceeds in three steps
1. Model
I Small open economy (member of currency union)
I Patient and impatient households
2. Reduced-form simulations
I Feed exogenous variables into model: private debt (limit),spread, government spending, foreign demand
I Model predicts actual outcomes fairly well
3. Structural experiments: outcome under counterfactual
I Uses innovative (if not fully convincing) mix ofmodel-based/model-free tools
2/13
1. Model
Deliberately simple
I Some closed-form results (e.g. patient households do notrespond to demand shocks)
I Still: main results numerical (“inspecting the mechanism”?)
Key feature: impatient agents sit at exogenous borrowingconstraint
I Model maps exogenous changes of borrowing constraint intooutput and employment
3/13
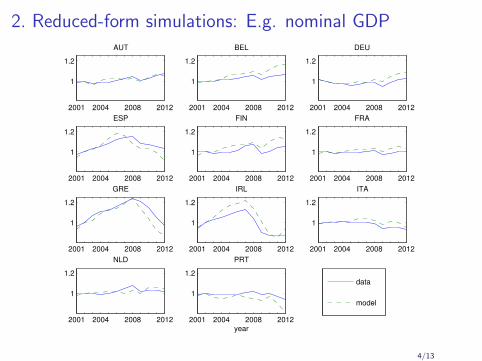
2. Reduced-form simulations: E.g. nominal GDP
Just to be clear, there is no degree of freedom in our simulations of nominal variables. There is no
parameter which is set to match any moment in the data. The model is entirely constrained by observable
micro estimates and by equilibrium conditions. The only parameter that we can adjust is the slope of the
Phillips curve κ but it does not affect the GDP in euros, it only pins down the allocation of nominal GDP
between prices (unit labor cost) and quantities (employment).
Figures (10), (11), (12), (13), (14), show the simulated and observed nominal GDP, net exports, employ-
ment, prices and public debt. The reduced form model reproduces very well the cross sectional dynamics
in the euro zone for nominal GDP and net exports. In particular, it replicates well the boom and bust
dynamics on GDP and the current account reversal for the crisis hit countries. For employment, the model
does also well for the crisis countries and for countries that were hit less severely. This is also true for unit
labor costs, apart from Italy in the later period and also to some extent Greece. Finally, the reduced form
model also generates public debt dynamics that are very close to the observed data.
Figure 10: Simulated and observed nominal GDP; all shocks
2001 2004 2008 2012
1
1.2
AUT
2001 2004 2008 2012
1
1.2
BEL
2001 2004 2008 2012
1
1.2
DEU
2001 2004 2008 2012
1
1.2
ESP
2001 2004 2008 2012
1
1.2
FIN
2001 2004 2008 2012
1
1.2
FRA
2001 2004 2008 2012
1
1.2
GRE
2001 2004 2008 2012
1
1.2
IRL
2001 2004 2008 2012
1
1.2
ITA
2001 2004 2008 2012
1
1.2
NLD
2001 2004 2008 2012
1
1.2
PRT
year
data
model
25
4/13
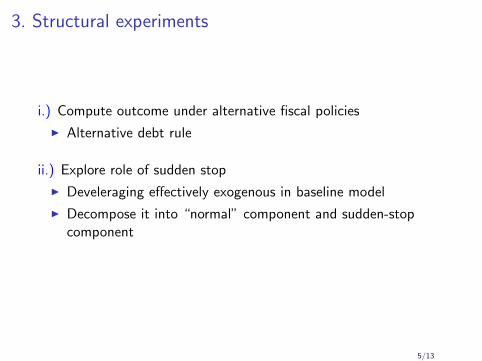
3. Structural experiments
i.) Compute outcome under alternative fiscal policies
I Alternative debt rule
ii.) Explore role of sudden stop
I Develeraging effectively exogenous in baseline model
I Decompose it into “normal” component and sudden-stopcomponent
5/13
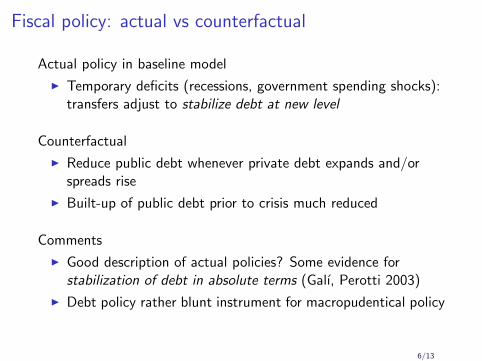
Fiscal policy: actual vs counterfactual
Actual policy in baseline model
I Temporary deficits (recessions, government spending shocks):transfers adjust to stabilize debt at new level
Counterfactual
I Reduce public debt whenever private debt expands and/orspreads rise
I Built-up of public debt prior to crisis much reduced
Comments
I Good description of actual policies? Some evidence forstabilization of debt in absolute terms (Galı, Perotti 2003)
I Debt policy rather blunt instrument for macropudentical policy
6/13
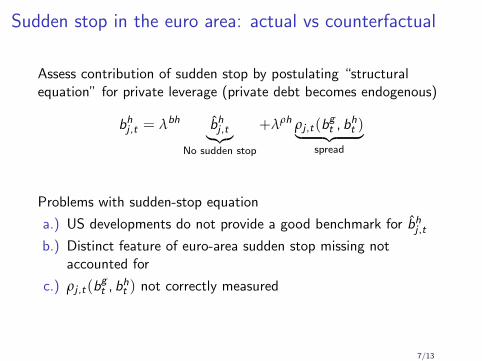
Sudden stop in the euro area: actual vs counterfactual
Assess contribution of sudden stop by postulating “structuralequation” for private leverage (private debt becomes endogenous)
bhj ,t = λbh bhj ,t︸︷︷︸No sudden stop
+λρh ρj ,t(bgt , bht )︸ ︷︷ ︸
spread
Problems with sudden-stop equation
a.) US developments do not provide a good benchmark for bhj ,tb.) Distinct feature of euro-area sudden stop missing not
accounted for
c.) ρj ,t(bgt , bht ) not correctly measured
7/13
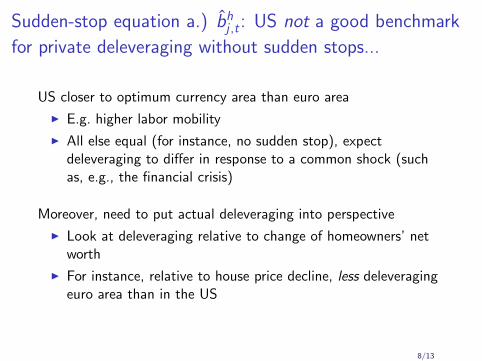
Sudden-stop equation a.) bhj ,t : US not a good benchmark
for private deleveraging without sudden stops...
US closer to optimum currency area than euro area
I E.g. higher labor mobility
I All else equal (for instance, no sudden stop), expectdeleveraging to differ in response to a common shock (suchas, e.g., the financial crisis)
Moreover, need to put actual deleveraging into perspective
I Look at deleveraging relative to change of homeowners’ networth
I For instance, relative to house price decline, less deleveragingeuro area than in the US
8/13
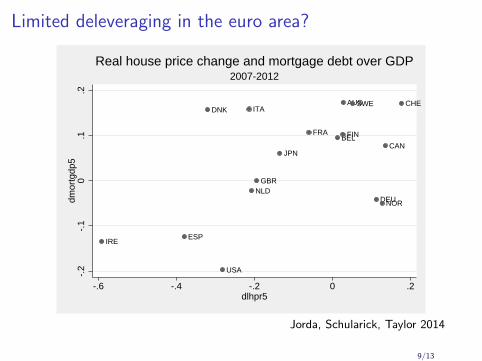
Limited deleveraging in the euro area?
AUS
BELCAN
CHE
DEU
DNK
ESP
FINFRA
GBR
ITA
JPN
NLD
NOR
SWE
USA
IRE
-.2
-.1
0.1
.2dm
ortg
dp5
-.6 -.4 -.2 0 .2dlhpr5
2007-2012Real house price change and mortgage debt over GDP
Jorda, Schularick, Taylor 2014
9/13
Sudden-stop equation b.) Distinct feature of euro-areasudden stop
Paper focuses on bust period 2008–2012
I Private capital leaves crisis countries
I Replaced by public funds (e.g. TARGET2)
I Current account adjustment only very gradual
Model ignores this
I Understates the extent of private capital flight
I Overstates its effect
10/13
06
BR U EGE LPOLICYCONTRIBUTION SUDDEN STOPS IN THE EURO AREA Silvia Merler and Jean Pisani-Ferry
Source: Bruegel calculations with national and Eurostat data. Figures show cumulative capital inflows relative to the inter-national investment position debt in 2001.
Jan-
02
Sep-
02
May
-03
Jan-
04
Sep-
04
May
-05
Jan-
06
Sep-
06
May
-07
Jan-
08
Sep-
08
May
-09
Jan-
10
Sep-
10
May
-11
0
20
40
60
80
100
120Greece
Private inflows
Total inflows
Jan-
02
Sep-
02
May
-03
Jan-
04
Sep-
04
May
-05
Jan-
06
Sep-
06
May
-07
Jan-
08
Sep-
08
May
-09
Jan-
10
Sep-
10
May
-11
Jan-
02
Sep-
02
May
-03
Jan-
04
Sep-
04
May
-05
Jan-
06
Sep-
06
May
-07
Jan-
08
Sep-
08
May
-09
Jan-
10
Sep-
10
May
-11
Jan-
02
Sep-
02
May
-03
Jan-
04
Sep-
04
May
-05
Jan-
06
Sep-
06
May
-07
Jan-
08
Sep-
08
May
-09
Jan-
10
Sep-
10
May
-11
Jan-
02
Sep-
02
May
-03
Jan-
04
Sep-
04
May
-05
Jan-
06
Sep-
06
May
-07
Jan-
08
Sep-
08
May
-09
Jan-
10
Sep-
10
May
-11
0
20
40
60
80
100
120
0
20
40
60
80
100
120
0
20
40
60
80
100
120
-60
-40
-20
0
20
40
60
80
100
120Ireland
Portugal Spain
Italy
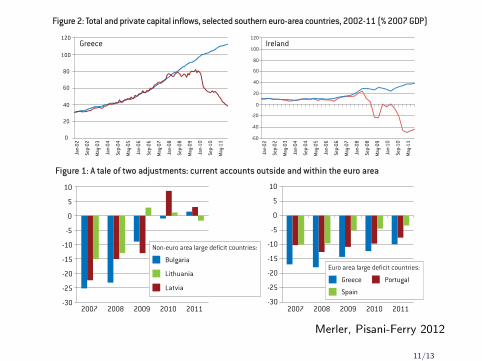
Figure 2: Total and private capital inflows, selected southern euro-area countries, 2002-11 (% 2007 GDP)
Source: Bruegel.
Jan
07
Mar
07
May
07
Jul 0
7
Sep
07
Nov
07
Jan
08
Mar
08
May
08
Jul 0
8
Sep
08
Nov
08
-30,000
-25,000
-20,000
-15,000
-10,000
-5,000
5,000
10,000
15,000
Jan
09
Mar
09
May
09
Jul 0
9
Sep
09
Nov
09
Jan
10
Mar
10
May
10
Jul 1
0
Sep
10
Nov
10
Jan
11
Mar
11
May
11
Jul 1
1
Sep
11
Nov
11
Year-on-year change
Sudden stop episode
Threshold 1
Threshold 2
Figure 3: Identifying sudden stops: Greece (€ millions)
balance-of-payment crises within the euro areawould become as unthinkable as they are withincountries5.
To our knowledge, the only one to challenge thisbenign view was Peter Garber in a 1998 paper onthe role of TARGET in a crisis of monetary union(Garber, 1998). The paper insightfully recognisedthat the federal structure of the Eurosystem andthe corresponding continued existence of nationalcentral banks with separate individual balancesheets made it possible to imagine a speculativeattack within monetary union. According to Garber,the precondition for an attack “must be scepticismthat a strong currency national central bank willprovide through TARGET unlimited credit in eurosto the weak national central banks”. His conclu-sion is that “as long as some doubt remains aboutthe permanence of Stage III exchange rates, theexistence of the currently proposed structure ofthe ECB and TARGET does not create additionalsecurity against the possibility of an attack. Quitethe contrary, it creates a perfect mechanism tomake an explosive attack on the system”.
As said, the benign view prevailed during the firstten years of EMU. It even continues to dominatetoday. Indeed, casual data observation seems tovindicate it. Figure 1 reports the 2007-11 evolu-tion of current-account balances in the three non-euro area EU countries and the three euro-areacountries with the highest deficits in 20076. It isapparent that the two groups of countries havenot followed the same path: whereas adjustmenthas been brutal for the first group, with deficitsamounting to 15 to 25 percent of GDP transformedinto surpluses over three or four years, it has been
5. The literature of the1990s explored thiscomparison and showedthat the Feldstein-Horiokaparadox vanishes entirelywhen applied to regionswithin countries. See forexample Bayoumi (1999).
6. We have excluded Cyprusbecause of its small size.
03
BR U EGE LPOLICYCONTRIBUTION
very slow for the second. One may even wonder ifGreece and Portugal have adjusted at all.
2 PRIVATE CAPITAL FLOWS
Assessing if there has been a balance-of-payment crisis by looking at the evolution of thecurrent account is however a flawed approach. It isadequate to look at the evolution of current-account balances as long as it offers a mirrorimage of net private capital flows. In a stand-alonecountry, this is largely the case except for foreignexchange interventions by the central bank – atleast as long as the country is not under an Inter-national Monetary Fund programme. This is how-ever not the case for monetary union, because thefinancial account includes official capital flows.The correct accounting identity (neglecting thebalance of the capital account as well as errorsand omissions) is:
(1) CAB + PCI + T2F + PGM +SMP = 0
in which CAB stands for the current-account bal-ance, PCI for private capital inflows, T2F forEurosystem financing through the TARGET2system (change in the net liability of the nationalcentral bank vis-à-vis the rest of the Eurosystem),PGM for financing through official IMF and Euro-pean assistance, and SMP (Securities MarketsProgramme) for European Central Bank purchasesof government securities from residents. Of thesefive flows, four are recorded statistically and onlyone (SMP) is not known.
In what follows we evaluate private capital inflowsto southern Europe from 2002-11 using monthly
Source: ECFIN Forecasts November 2011.
2007 2008 2009 2010 2011-30
-25
-20
-15
-10
-5
0
5
10
2007 2008 2009 2010 2011-30
-25
-20
-15
-10
-5
0
5
10
Bulgaria
Latvia
Lithuania
Non-euro area large deficit countries:
Greece Portugal
Spain
Euro area large deficit countries:
Figure 1: A tale of two adjustments: current accounts outside and within the euro area
Silvia Merler and Jean Pisani-Ferry SUDDEN STOPS IN THE EURO AREA
Merler, Pisani-Ferry 2012
11/13
Sudden-stop equation c.) How to measure ρj ,t(bgt , bht )?
Spread explains “excess” deleveraging
I Meant to reflect higher funding costs/fear of exit from euro,also “risk shifting, adverse selection, runs, etc...”
I Measured as the difference of sovereign yields relative to euroarea median
Need to look at private loan rate spreads
I Reflect raising funding costs relevant for deleveraging
I Imperfectly proxied by sovereign yield spreads
12/13
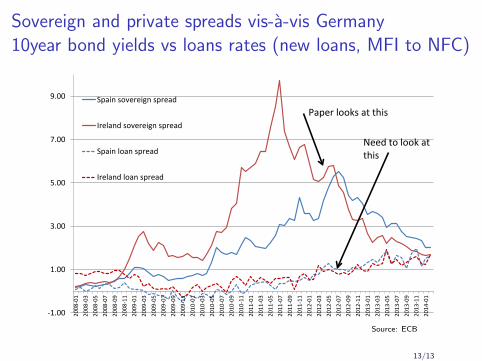
Sovereign and private spreads vis-a-vis Germany10year bond yields vs loans rates (new loans, MFI to NFC)
-1.00
1.00
3.00
5.00
7.00
9.00
2008
-01
2008
-03
2008
-05
2008
-07
2008
-09
2008
-11
2009
-01
2009
-03
2009
-05
2009
-07
2009
-09
2009
-11
2010
-01
2010
-03
2010
-05
2010
-07
2010
-09
2010
-11
2011
-01
2011
-03
2011
-05
2011
-07
2011
-09
2011
-11
2012
-01
2012
-03
2012
-05
2012
-07
2012
-09
2012
-11
2013
-01
2013
-03
2013
-05
2013
-07
2013
-09
2013
-11
2014
-01
Spain sovereign spread
Ireland sovereign spread
Spain loan spread
Ireland loan spread
Paper looks at this
Need to look at this
Source: ECB
13/13


![[Pipeline] Inspecting Pipeline Installation](https://img.pdfslide.us/doc/110x75/55cf8d045503462b1391543e/pipeline-inspecting-pipeline-installation.jpg)


![[Mesh] Inspecting for Hazardous](https://img.pdfslide.us/doc/110x75/5695d02a1a28ab9b029144f9/mesh-inspecting-for-hazardous.jpg)