Embed Size (px)
Citation preview
HAL Id: hal-01458114https://hal.archives-ouvertes.fr/hal-01458114
Submitted on 6 Feb 2017
HAL is a multi-disciplinary open accessarchive for the deposit and dissemination of sci-entific research documents, whether they are pub-lished or not. The documents may come fromteaching and research institutions in France orabroad, or from public or private research centers.
L’archive ouverte pluridisciplinaire HAL, estdestinée au dépôt et à la diffusion de documentsscientifiques de niveau recherche, publiés ou non,émanant des établissements d’enseignement et derecherche français ou étrangers, des laboratoirespublics ou privés.
Insights into saline intrusion and freshwater resources incoastal karstic aquifers using a lumped
Rainfall–Discharge–Salinity model (the Port-Mioubrackish spring, SE France)Bruno Arfib, Jean-Baptiste Charlier
To cite this version:Bruno Arfib, Jean-Baptiste Charlier. Insights into saline intrusion and freshwater resources in coastalkarstic aquifers using a lumped Rainfall–Discharge–Salinity model (the Port-Miou brackish spring,SE France). Journal of Hydrology, Elsevier, 2016, 540, pp.148–161. �10.1016/j.jhydrol.2016.06.010�.�hal-01458114�
Accepted Manuscript
Research papers
Insights into saline intrusion and freshwater resources in coastal karstic aquifers
using a lumped Rainfall-Discharge-Salinity model (the Port-Miou brackish
spring, SE France)
Bruno Arfib, Jean-Baptiste Charlier
PII: S0022-1694(16)30361-4
DOI: http://dx.doi.org/10.1016/j.jhydrol.2016.06.010
Reference: HYDROL 21328
To appear in: Journal of Hydrology
Received Date: 4 February 2016
Revised Date: 17 May 2016
Accepted Date: 3 June 2016
Please cite this article as: Arfib, B., Charlier, J-B., Insights into saline intrusion and freshwater resources in coastal
karstic aquifers using a lumped Rainfall-Discharge-Salinity model (the Port-Miou brackish spring, SE France),
Journal of Hydrology (2016), doi: http://dx.doi.org/10.1016/j.jhydrol.2016.06.010
This is a PDF file of an unedited manuscript that has been accepted for publication. As a service to our customers
we are providing this early version of the manuscript. The manuscript will undergo copyediting, typesetting, and
review of the resulting proof before it is published in its final form. Please note that during the production process
errors may be discovered which could affect the content, and all legal disclaimers that apply to the journal pertain.
1
Insights into saline intrusion and freshwater resources in
coastal karstic aquifers using a lumped Rainfall-Discharge-
Salinity model (the Port-Miou brackish spring, SE France)
Bruno ARFIB (1,*), Jean-Baptiste CHARLIER (2)
(1) Aix-Marseille Université, CNRS, IRD, CEREGE UM34, ECCOREV, F-13545 Aix en
Provence, France
(2) BRGM, 1039 rue de Pinville, F-34000 Montpellier, France
* corresponding author: Tel: +33-(0)413 55 07 48, Fax: +33-(0)413 55 12 81, E-mail:
Abstract
The aim of this study was to develop a conceptual model of saline intrusion within coastal
karst aquifers by analyzing rainfall-discharge-salinity data and to assess freshwater resources
using a lumped modeling approach. In a first step, we analyzed 4 years of data (rainfall,
discharge and salinity times series) of the Port-Miou brackish submarine spring in South
France (400 km²). A conceptual model of the aquifer was then designed to differentiate a deep
brackish reservoir and a shallower fresh one. Salinity variations at the spring are assumed to
be controlled mainly by dilution originating from the fresh water in the shallower reservoir. In
a second step, a lumped modeling approach was developed based on the conceptual model to
simulate discharge as well as salinity over time. We proposed a reservoir-model to take into
account slow and fast components in the shallower part of the aquifer and a saline intrusion in
the deeper one. This Rainfall-Discharge-Salinity model was calibrated and validated for two
periods of 1.5 years at a daily time step and was also tested to reproduce a multi-annual
evolution of the available discharge and salinity time series. Good simulation results were
obtained to reproduce water and mass budgets as well as discharge and salinity dynamics
2
during several hydrological cycles. The simultaneous modeling of hydrodynamics and quality
data showed the robustness of the model in addition to its easy implementation. Our results
led us to propose a new type of seawater mixing mechanism for brackish springs: the dilution
type, in addition to the well-known Ventury suction and Head balance types. The application
of the lumped model on the Port-Miou brackish spring validated the hydrogeological
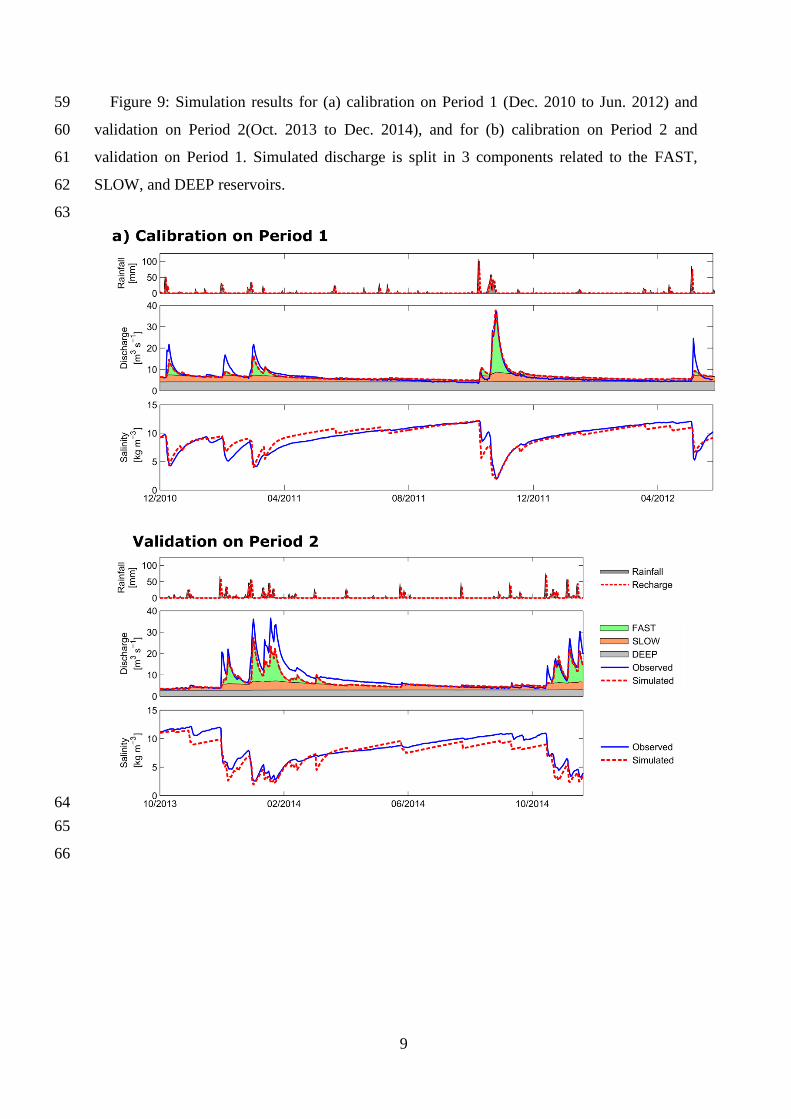
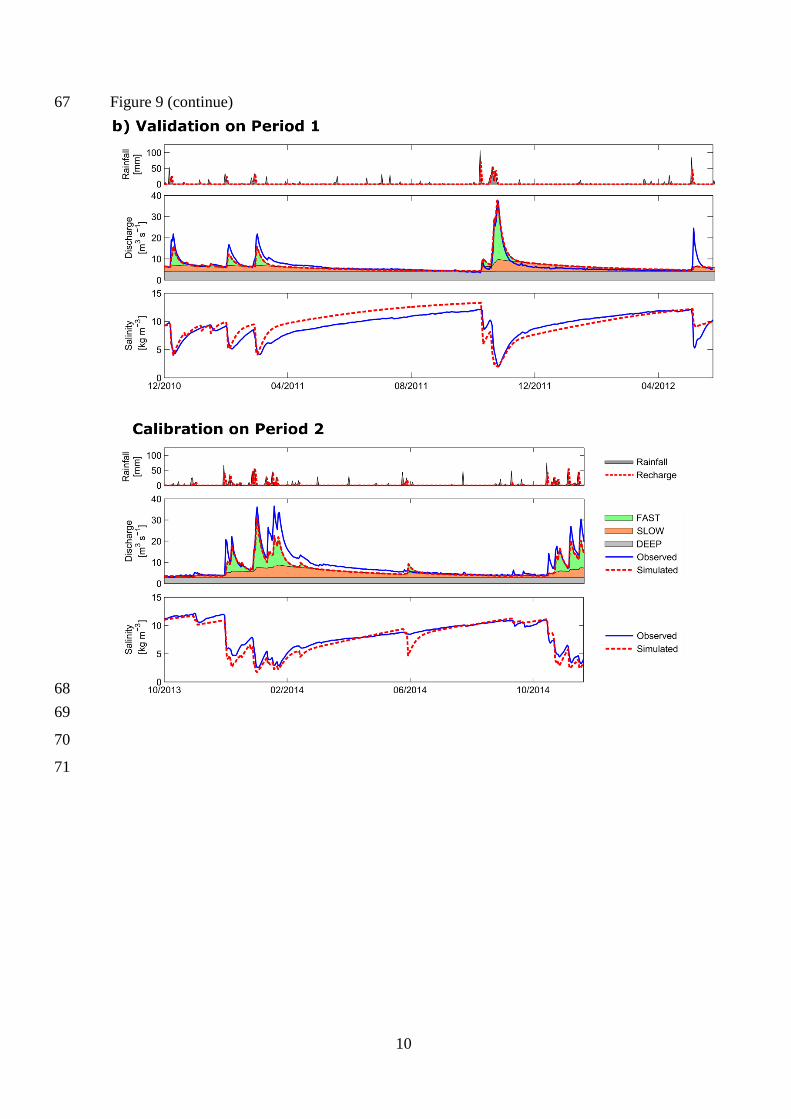
processes deduced from experimental data, given an initial quantification of the freshwater
resources available in such complex brackish karstic aquifers.
Key words: karst, coastal aquifer, lumped model, water resources, saline intrusion,
Mediterranean Sea
3
1 Introduction
Coastal karstic aquifers may constitute important groundwater resources, notably in the
Mediterranean region (e.g. Custodio, 2010; Bakalowicz, 2015). The exploitation of such a
type of aquifer calls for, first of all, an evaluation of the available freshwater. Secondly, the
withdrawal must be done with a special regard to the saline intrusion processes. This requires
knowledge of the hydrogeology of the aquifer. A classical scheme of seawater intrusion may
represent a saltwater wedge within the aquifer, with a thick transition zone between
freshwater and saltwater. But this simplified view cannot explain the presence of a large
brackish submarine groundwater discharge to the ocean as observed in many places, notably
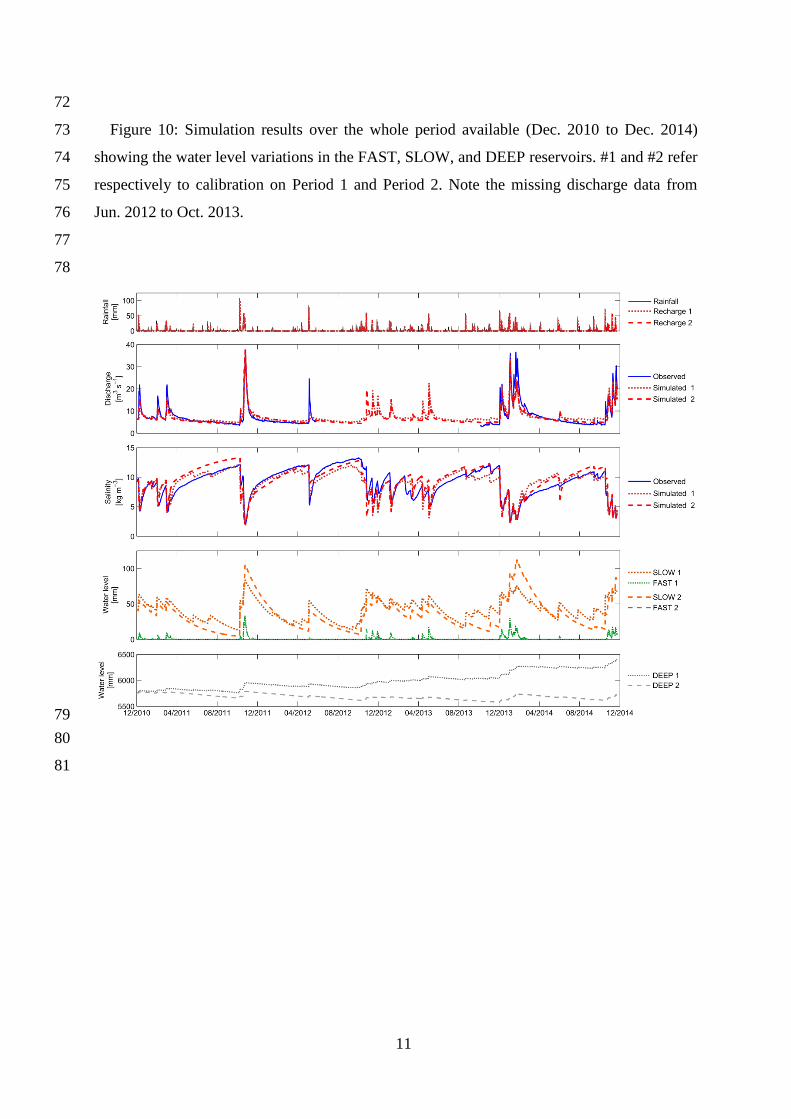
in karstic areas. In these heterogeneous aquifers, the saline intrusion distribution appears more
complex than when compared to porous media, due to preferential flow paths into large
conduit networks.
Many authors (e.g. Stringfield and Legrand 1971; Arfib et al. 2007; Fleury et al. 2007a)
have pointed out that submarine karstic springs are connected to preferential flows below sea
level within karst conduits. Current karst flows are closely linked to paleo-base levels (Audra
and Palmer 2013). In the Mediterranean environment, two recent main stages of karst
development were identified (Mocochain et al. 2006): the Messinian salinity crisis (5.95 to
5.32 My) and the Pliocene and Quaternary period. Mediterranean sea level decreased by 1500
m during the Messinian, and by ~120 m during the last glaciation (e.g. Kominz 2001).
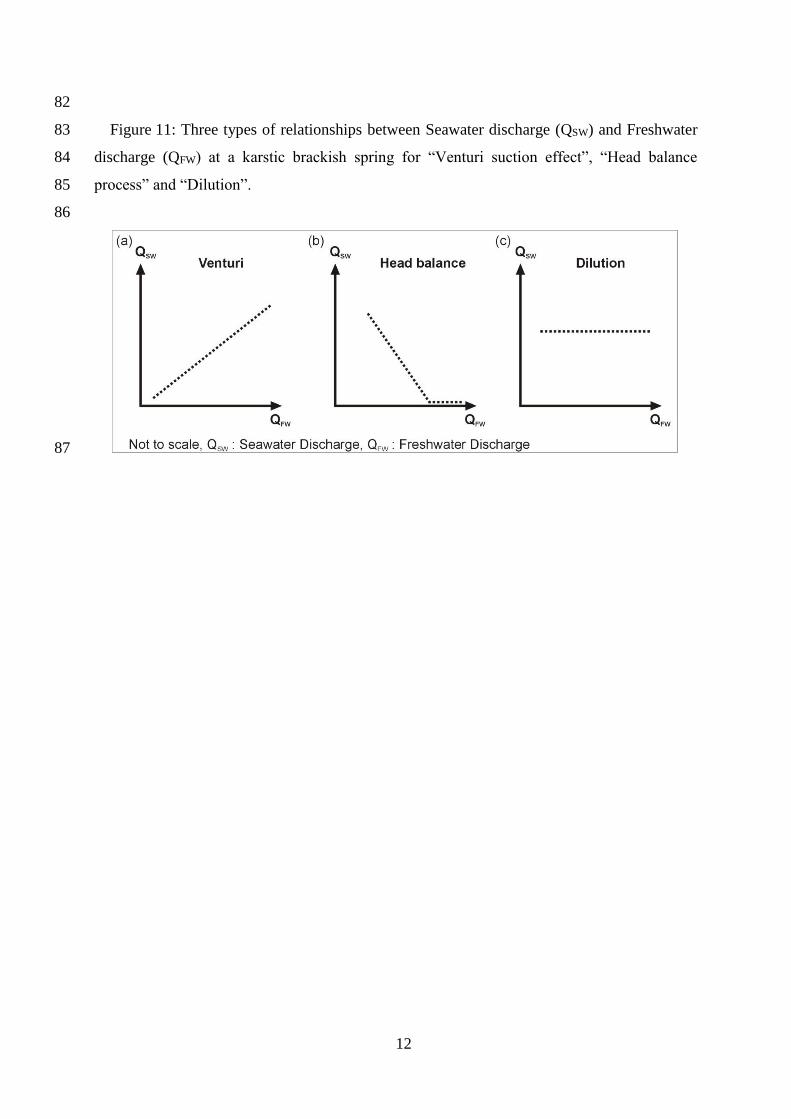
Eustatic variations of the Mediterranean Sea impacted coastal carbonate aquifers. Karst
features that form a network for groundwater flows may exist deep below the current sea level
and may be connected to the current submarine springs by karst chimney-shafts (Mocochain
et al. 2011). Paleo-springs that drained the karst aquifer during the low sea level stage may
have been partially or totally clogged during the following transgression stage, either by
marine sediments or by deposits from inside the karst (Fleury et al. 2007a, Tassy et al. 2014).
The current submarine brackish springs in the Mediterranean Sea are close to sea level
(Fleury et al. 2007a). The salinity of such springs may be highly variable timewise, and is
usually related variations in discharge. Main submarine karst springs are brackish, with a
salinity decrease in relation with the rainfall events. Two categories of brackish coastal
springs can be proposed regarding the salinity minimum. Some springs can be fresh during
flood events, like the Almyros of Heraklio spring in Crete (Arfib et De Marsily 2004,
Maramathas et al. 2006), the Mortola spring in France (Fleury et al. 2007d), the Blaz spring in
Croatia (Bonacci and Roje-Bonacci 1997), or the Spring Creek springs in Florida (Davis and
4
Verdi 2014). In these cases, the saline intrusion into the karst conduit connected to the spring
is limited by the water head. When the head increases in the karst conduit, the discharge rate
of intruded salt water decreases, and can be reversed when a threshold is exceeded (the spring
water is then fresh). The second type of brackish spring remains brackish even during high
water events, as the Moraig-Toix in Spain (Fleury et al. 2007c) or Port-Miou in France (Arfib
et al. 2006, Cavalera 2007). In these latter cases, freshwater discharge increases during flood
events diluting the brackish water. The behavior of the aquifer is more complex since the
saline intrusion seems to not be totally reduced by the head increase at the spring and in the
karst network. This kind of karstic aquifer has been poorly described in literature, yet it can
drain major regional groundwater resources, as is the case with the Port-Miou aquifer (400
km²) in France.
Coastal springs, as they are brackish, are not directly usable for freshwater supply.
However, these springs have, at least, three main advantages. Firstly, they are the main outlet
of aquifers which can drain out several hundred km². Their discharge gives a quantitative
value of the flow through the aquifer, which is needed to quantify water storage. Secondly,
they integrate all the processes that occur within the aquifer: the hydrodynamic functioning of
the karst (head and discharge variations related to rainfall) and the saline intrusion mechanism
(variations of salinity related to the hydrodynamic functioning). Thirdly, they are a major
monitoring point needed for groundwater model fittings and/or validation.
Water managers need to know where to withdraw freshwater and how much. Lumped
hydrological models are useful to assist the managers and give a quantitative answer to their
questions. But, the modeler may have to face 2 challenges: having a sufficient knowledge of
the aquifer behavior, and using a tool that produces helpful results. To do that, Voss (2011,
2012) proposed to use simple, or parsimonious, models. In fact, karst aquifers and saline
intrusion in such heterogeneous media are so complex that simple modeling appears to be an
efficient approach instead of the application of a distributed approach, for which
parameterization remains highly uncertain. Reservoir models are an example of such simple
models that are frequently used as lumped at the catchment scale to study the rainfall –
discharge relationships. They have been widely applied to investigate hydrogeological
functioning of karst aquifers (e.g. Rimmer and Salingar, 2006; Fleury et al.,2007b; Nikolaïdis
et al., 2013; Tritz et al., 2011). Furthermore, such conceptual models were improved to
simulate solute transport using mixing equations (Charlier et al., 2012; Hartmann, 2012a),
showing the ability of lumped approaches to simulate water and mass balances as well as the
fluxes dynamics.
5
The aim of our study is to develop a conceptual model of saline intrusion within a coastal
karst aquifer analyzing rainfall-discharge-salinity data and to assess freshwater resources
using a lumped modeling approach. The Port-Miou case study in South France is used since it
is a major brackish submarine karst spring (mean discharge was higher than 7 m3/s in 2011),
with varying salinity and since for the first time, four years of new data is available. The
approach combined two steps. In a first experimental step, hydrogeological response was
investigated from the analysis of rainfall-discharge-salinity time series at the spring. In a
second modeling step, a lumped model was developed to simulate spring discharge and
salinity at a daily time-step to quantify the fresh and saline discharges that flow through the
aquifer. Model application is used to validate the previously built conceptual model and to
evaluate the freshwater resources in the aquifer that are affected by seawater intrusion.
2 Study site and data
2.1 General setting
The Port-Miou coastal aquifer is located in the south-east of France (Figure 1a), along the
Mediterranean Sea, in a carbonate environment (Jurassic and Cretaceous limestone, dolomite,
and mixed siliciclastic-carbonate rocks). The region consists of a fold-thrust belt system (see
e.g. Bestani et al., 2015 for an extensive literature review). From South to North, the Port-
Miou aquifer extends over the Beausset syncline, the Sainte-Baume thrusts, the Huveaune
area, and the Olympe-Aurélien thrust. The present-day structure results from poly-phase
deformation events which sequentially interrupted the sedimentary basin development from
Cretaceous to present (see e.g. Lamarche et al. 2012). This complex structure forms a vast
fractured aquifer reaching 2000 to 3000 meters of thickness, with continuity from inland to
the sea (Tassy et al. 2014).
Two main localized submarine outlets, the Port-Miou and Bestouan brackish springs, drain
the aquifer to the sea in the bay of Cassis (15 km from Marseilles). They are a few meters
below sea level in an early Cretaceous platform of limestones (Urgonian facies). The
catchment area extends mainly over a natural landscape made of hills, karst plateau, and polje.
The northern boundary of the recharge area is not well-known, but considering the geological
context, the area is set to 400 km². The altitudes range from the sea to the summit of the
"Sainte Baume massif” and culminates at 1148 meters. The climate is Mediterranean, with the
mean annual rainfall ranging between 500 and 1000 mm. Rainfall intensities during spring
6
and autumn storm events may attain more than 100 mm per day, whereas droughts of long
duration occur during the summer season.
2.2 Submarine caves, springs and in-situ underground laboratory
Port-Miou is one of the main coastal karst springs of Europe (Tulipano et al., 2005;
Custodio, 2010; Bakalowicz, 2015). The conduit network has been explored from the outlet
by cave-divers. They discovered a huge saturated sub-horizontal 20 m diameter karst conduit
developing at more than 2 km inland (Figure 1b). The exploration ended at 223 meters below
sea level in a karst shaft (Meniscus, 2013). This vertical shaft acts as a connection between
the deeper part of the aquifer below sea-level to the surface. The submarine spring of
Bestouan, one kilometer eastward, gives access to a 3 km long saturated karst conduit (Romey
et al. 2014).
In the 1970's, a submarine dam was built in the saturated karst conduit of Port-Miou, 500 m
inland upstream from the spring (Figure 1b). This dam stopped the direct seawater intrusion
from the mouth of the submarine spring, but had no effect on the salinity of the groundwater
upstream. Groundwater flows across the dam through four pipes. Downstream from the dam,
the water level is controlled by sea level (head boundary). Upstream from the dam, the water
level varies with the discharge rate, rising from a few centimeters above sea level at low flow
to up to 3 meters when the discharge exceeds 40 m3/s (and that point, the water overflows by
a spillway). Since the 2000’s, the underground dam is an in-situ laboratory used to monitor
the submarine groundwater discharge and the salinity of the coastal karst.
2.3 Previous studies
Brackish groundwater flows through the two sub-horizontal karst conduits of Port-Miou
and Bestouan. The salinity of the water originates from seawater intrusion (Blavoux et al.
2004). Measurements during dive surveys with a CTD sensor showed that the salinity of the
water remained constant along the horizontal conduits (Arfib and Douchet, 2011). It showed
that the brackish water comes from the deepest zones upstream from the cave-divers
exploration. Moreover, the lag time between the discharge and salinity changes at the dam at
the beginning of flood events also showed that the mixing of the freshwater and the saltwater
occurs far upstream from the monitoring point (Arfib et al. 2006). Upstream from the dam,
there is no mixing with reversal flow from the outlet through the karst conduit. This deep
saline intrusion within the karst network was also used by Gilli (2015) to discuss the mixing

7
of fresh and salt water in a turbulent flow within coastal karst conduits. Previous works
between 2004 and 2007 (Arfib et al. 2006, Cavalera 2007, Cavalera et al. 2009) were
performed during a long period of drought with few flood events. It showed that the salinity
reaches a sill during the low flow periods, of about 14 kg/m3, when daily discharge ranged
between 2 and 3 m3/s. In December 2008, the discharge of the highest flood event ever
recorded at the dam was close to 50 m3/s (Tassy et al. 2010). Even if salinity decreases during
high flood events, it has never decreased below 2 kg/m3, due to seawater intrusion, which
never stops.
2.4 Data
Daily precipitation and potential evapotranspiration (PET) measurements are available at
two weather stations (Météo-France, 2015) in the catchment area (Figure 1a): Plan d'Aups
(elevation of 605m, north of the “Sainte Baume massif”) and Castellet (elevation of 417m, on
a topographic plateau between the sea and the mountainous area).The mean precipitation of
the catchment is calculated combining the two stations using a rough estimate of their area of
influence. As no meteorological station is available above the Plan d’Aups elevation in the
mountainous area, we used this station as a representative of the surface above 500 meters
(27% of the assumed catchment area), and the Castellet station for the remainder. Mean
precipitation and PET are calculated as follows:
(1) P = 27%.PPlan d’Aups + 73%.PCastellet with P: precipitation or PET.
Water level and specific electrical conductivity (SEC) were recorded by CTD sensors at a
15 minute-time-step in the in-situ laboratory. Spring discharge Q is calculated by head
differences between water levels recorded in the conduit upstream and downstream from the
dam. Salinity is calculated from SEC.
Average daily discharge data is used to remove noise due to high frequency waves and tidal
variations. Spring water salinity at the dam, recorded at a 15 minute-time-step, is not
influenced by the tide, but average daily salinity data was also computed to have a consistent
time-step with rainfall and discharge time series. Two continuous data sets are available, with
missing discharge data in between due to equipment failure: Period 1 extends from Dec. 16th
2010 to Jun. 12th
2012 (545 days), and Period 2 from Oct. 21st 2013 to Dec.11
th 2014 (417
days). The salinity time series is complete from 2010 to 2014. This constitutes a unique
database for the study of karst submarine springs. Furthermore, a few data is available for the
years 2005-2006 in Cavalera 2007 and Cavalera et al. 2009.
8
3 Modeling approach
3.1 Model structure
The aim of our model is to simulate the discharge and the salinity time series at the outlet
of karst aquifers having deep and continuous contributions of saltwater. The model is thus a
tool to quantify volumes of freshwater and saltwater that flow through the aquifer. As the
modeling approach is carried out at the catchment scale, the modeling approach proposed in
this paper belongs to parsimonious lumped models. The aquifer is represented as a succession
of reservoirs drained by the karstic spring. The structure and the parameters of the conceptual
model are presented in Figure 2 It is an adaptation of the conceptual behavior of the aquifer
that will be described in the next section (Figure 8). This model is developed from a recently
described and tested modeling approach with good performances on rainfall-discharge-solute
data by Charlier et al. (2012).
Our model is based on 4 connected reservoirs: a SOIL reservoir that recharges the aquifer
partitioned into three DEEP, SLOW and FAST reservoirs. The DEEP reservoir is
characterized by brackish water, with low variations of discharge. This reservoir represents
the storage function of the aquifer, with a long residence time, affected by saline intrusion.
Both the SLOW and the FAST reservoirs are characterized by freshwater. The SLOW
reservoir represents the storage and the long recession after rainfall events, whereas the FAST
reservoir represents rapid infiltration and transfers through the aquifer during flood events. In
this model, one part of the water recharge stays fresh in the aquifer, and the second part is
mixed with seawater by saline intrusion in the deeper part of the aquifer. Both of these
groundwater flows are then mixed close to the outlet to result in a brackish karst spring.
3.2 Governing equations
Recharge (or effective rainfall) is calculated in the SOIL reservoir from mean rainfall P and
PET. If the level of the Soil Reservoir is higher than a threshold (HSOIL threshold parameter), then
there is a recharge. The percentage of recharge flowing from SOIL to DEEP reservoir is given
by the X parameter. FAST flows are activated when the water level in the SLOW reservoir
becomes superior to a threshold parameter (HSLOW/FAST parameter). At this time, SLOW and
FAST partitioning is given by the Y parameter.
Discharge Q [L3 T
-1] at the outlet of each reservoir is calculated as a function of the
reservoir height H [L] using a linear relation:

9
(2) Q = Hout× Area with Hout = H × k
where k [T-1
] is a constant characterizing the recession curve of the reservoir. Once Q is
calculated for each reservoir, then salinity is calculated using the following mass balance
equations:
(3) QSpring .SalSpring = QBW×SalBW + QFW×SalFW
(4) QSpring = QBW + QFW
Where Sal is the salinity (M L-3
), with subscript Spring for the spring, subscript BW for
Brackish Water, and subscript FW for Fresh Water.
In the DEEP reservoir, intruded seawater mixes with fresh water. Seawater discharge and
freshwater discharge feeding this reservoir control the salinity of the deep brackish water. It
can be calculated from in-situ measurements of spring salinity and discharge (equations 3 and
4, substituting BW by seawater). In the case that the discharge variations in the reservoir are
low, we can assume that the salinity is constant (SalBW parameter). Deep brackish water
discharge (QDEEP BW) is then calculated from the discharge of freshwater (QDEEP FW) and
salinity as follows:
(5)
where SalSW is the salinity of the seawater. Knowing seawater and freshwater salinities (i.e
SalSW = 38 kg/m3, andSalFW≈0.5 kg/m
3 respectively), SalBW is the parameter that controls the
deep saline intrusion contribution.
3.3 Parameterization and calibration strategy
The model inputs are the rainfall and PET, and the outputs are the simulated discharge and
salinity, which were compared to the observed ones to test model performances Since we
chose a lumped modeling approach, the assessment of the input signal was necessarily quite
simple: precipitation and recharge rate were fixed constant for the whole recharge area. They
were assumed to be well-estimated as the water budget was well-simulated. The model needs
10
a total of 8 parameters that may be fixed or optimised. We chose to fix a maximum of
parameters, especially those that could be estimated from a previous data analysis: the
constant salinity of the DEEP brackish reservoir (SalBW), and the three recession coefficients
kDEEP, kSLOW and kFAST using recession analysis. In order to simulate inertial functioning of the
DEEP reservoir, with very low changes in discharge, kDEEP has to be much lower than
recession coefficient generally assessed from karstic spring hydrographs. A value of kDEEP =
1.10-4
day-1
was fixed since recession of karstic springs found in the literature ranged generally
between 1.10-2
and 1.10-3
day-1
(e.g. Rimmer and Salingar, 2006; Fleury et al., 2007;Trizt et
al., 2011; Hartmann et al., 2012a). Knowing kDEEP, kSLOW was fixed during low-water periods
since only slow and deep components contributed to discharge. Then, kFAST was fixed on the
highest flood events, knowing both previously fixed recession coefficients. Finally, 4
parameters needed to be optimised: HSOILthreshold, X, HSLOW/FAST, and Y.
A warm-up period is often used to limit the influence of parameter initialization on model
performances. But this kind of approach needs a sufficiently long data set that it is not always
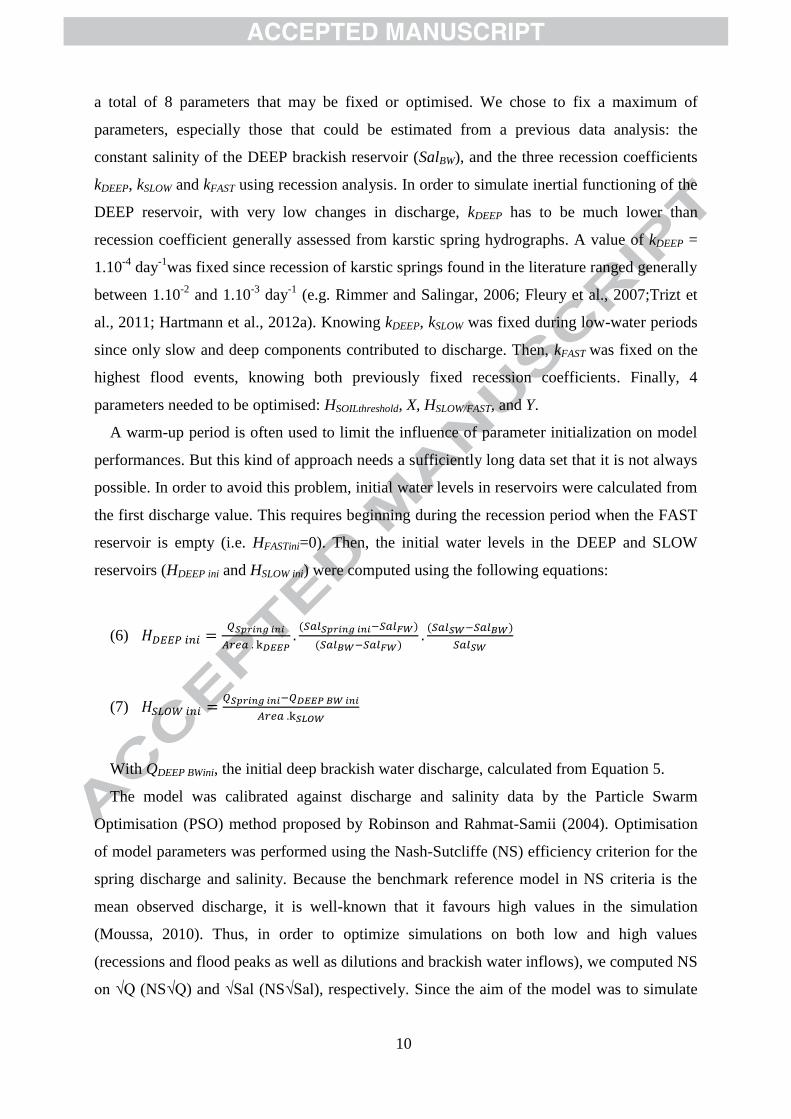
possible. In order to avoid this problem, initial water levels in reservoirs were calculated from
the first discharge value. This requires beginning during the recession period when the FAST
reservoir is empty (i.e. HFASTini=0). Then, the initial water levels in the DEEP and SLOW
reservoirs (HDEEP ini and HSLOW ini) were computed using the following equations:
(6)
(7)
With QDEEP BWini, the initial deep brackish water discharge, calculated from Equation 5.
The model was calibrated against discharge and salinity data by the Particle Swarm
Optimisation (PSO) method proposed by Robinson and Rahmat-Samii (2004). Optimisation
of model parameters was performed using the Nash-Sutcliffe (NS) efficiency criterion for the
spring discharge and salinity. Because the benchmark reference model in NS criteria is the
mean observed discharge, it is well-known that it favours high values in the simulation
(Moussa, 2010). Thus, in order to optimize simulations on both low and high values
(recessions and flood peaks as well as dilutions and brackish water inflows), we computed NS
on √Q (NS√Q) and √Sal (NS√Sal), respectively. Since the aim of the model was to simulate
11
both discharge and salinity, we used the mean of NS√Q and NS√Sal as the goodness of fit for
the calibration procedure. The quality of the simulation is also assessed using the Root Mean
Square Error on Q (RMSE Q) and Sal (RMSE Sal), on the relative error on the water balance
(Er V) and on the salinity mass balance (Er M).
3.4 Sensitivity analysis
In order to assess model behaviour, a sensitivity analysis was carried out on the case study
presented in this paper (Period 1 of the time series). For each of the height parameters, several
discharge and salinity simulations were tested for differences of ±5%, ±10%, ±25%, and
±50% around the calibrated value. Results of the three NS, RMSE and Er performance criteria
variations are plotted in Figure 3 and are interpreted as follows: the fewer the variation of
performance criteria, the less sensitive the parameter. As expected, kDEEP is the least sensitive
parameter, since its value was fixed so that the discharge from the DEEP reservoir was very
little influenced by rainfall events. Globally, parameters controlling flows in the fresh
reservoirs (SLOW and FAST) are also less sensitive to discharge as well as salinity
simulations: HSOILthreshold, HSLOW/FAST, Y, kSLOW and kFAST. The two most sensitive parameters
are X and SalBW that control the contribution of brackish water. Analysing these two most
sensitive parameters regarding especially the water and mass balances (Er V and Er M) results
in : i) a X increase that limits the contribution of freshwater to the karst spring and increases
water storage in the DEEP reservoir (which has a limited effect on Q because kDEEP is very
low) and consequently leads to a slight salinity over-estimation as well as to a discharge
under-estimation, and ii) a SalBW increase that generates a salinity over-estimation, but also a
water budget under-estimation as a consequence of the model calibration procedure
performed with a combination of both variables. These first results of the model behaviour
show the robustness of our conceptual approach.
4 Results
4.1 Hydrogeological behaviour
4.1.1 The climatological context
The reference weather station with decades of data in the catchment area is the Castellet
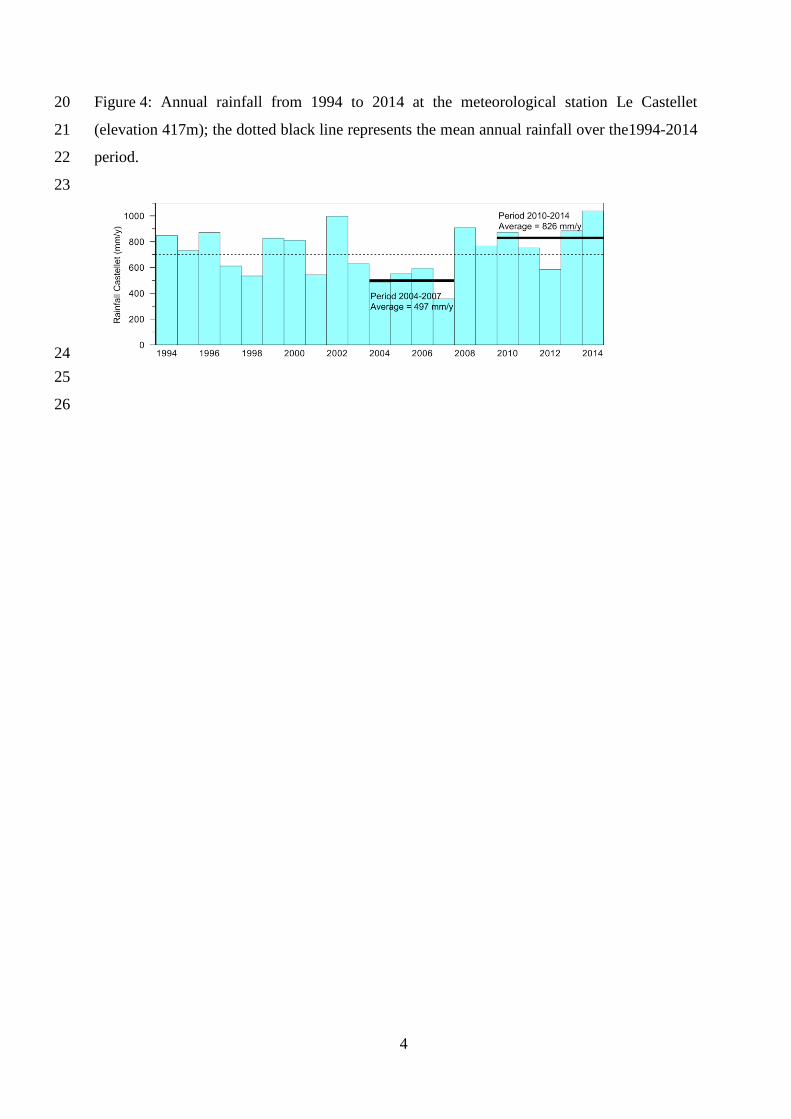
station (Figure 1). The mean inter-annual rainfall over the last twenty years is 700 mm/y.
Over the last ten years, the 2004-2007 period (Figure 4) had a peculiar climatological context,
with a low mean annual rainfall close to 500 mm/y. In 2008 and 2009, the annual rainfall has
12
exceeded the mean inter-annual value. The discharge and salinity time series available for the
present study are encompassed between 2010 and 2014. During this latter period, the mean
annual rainfall was 826 mm/y (Figure 5), with a minimum in 2012 (585 mm/y) and a
maximum in 2014 (1038 mm/y). This climatological context gives the trend of the annual
recharge of the aquifer: from 2003 to 2007 the recharge was low, and then the recharge
recovered a normal value from 2009 to 2014 (with a lower value in 2012), resulting in two
normal years (2008 and 2009) before the beginning of the studied period.
4.1.2 Hydrodynamic response
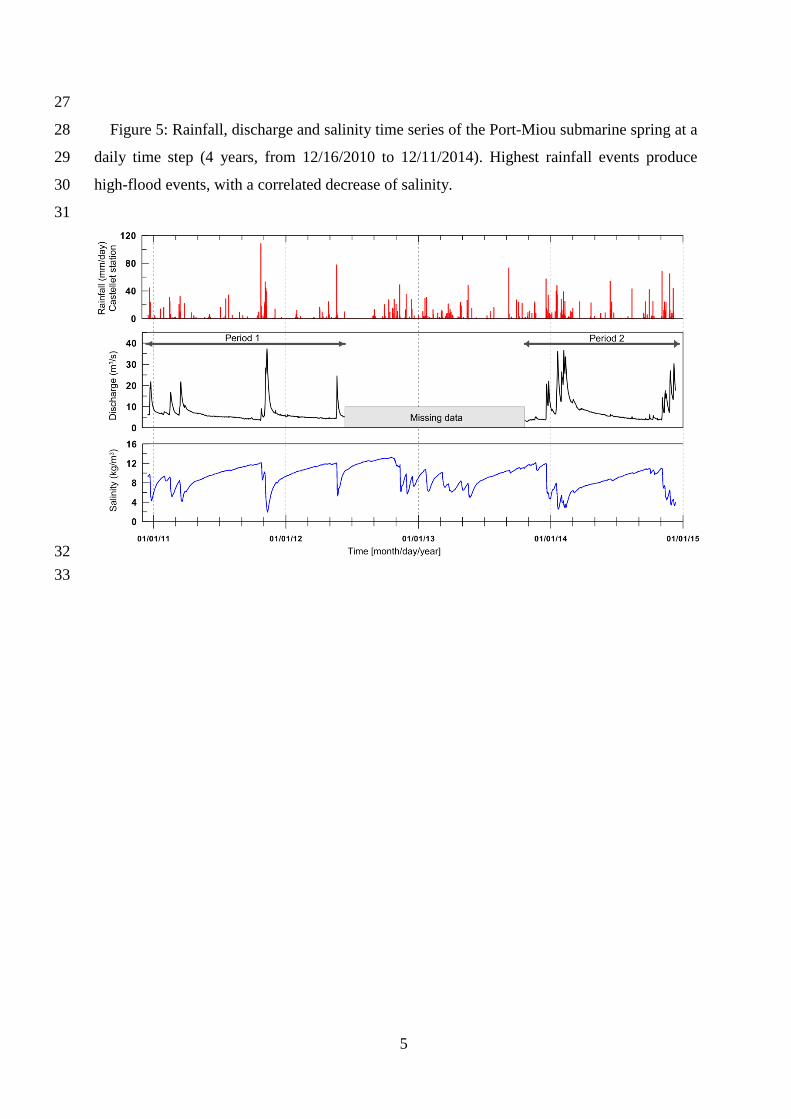
Figure 5 shows 4 years of daily rainfall, discharge and salinity data recorded between 2010
and 2014. The spring hydrograph shows an annual pattern (seasonal variations) with large
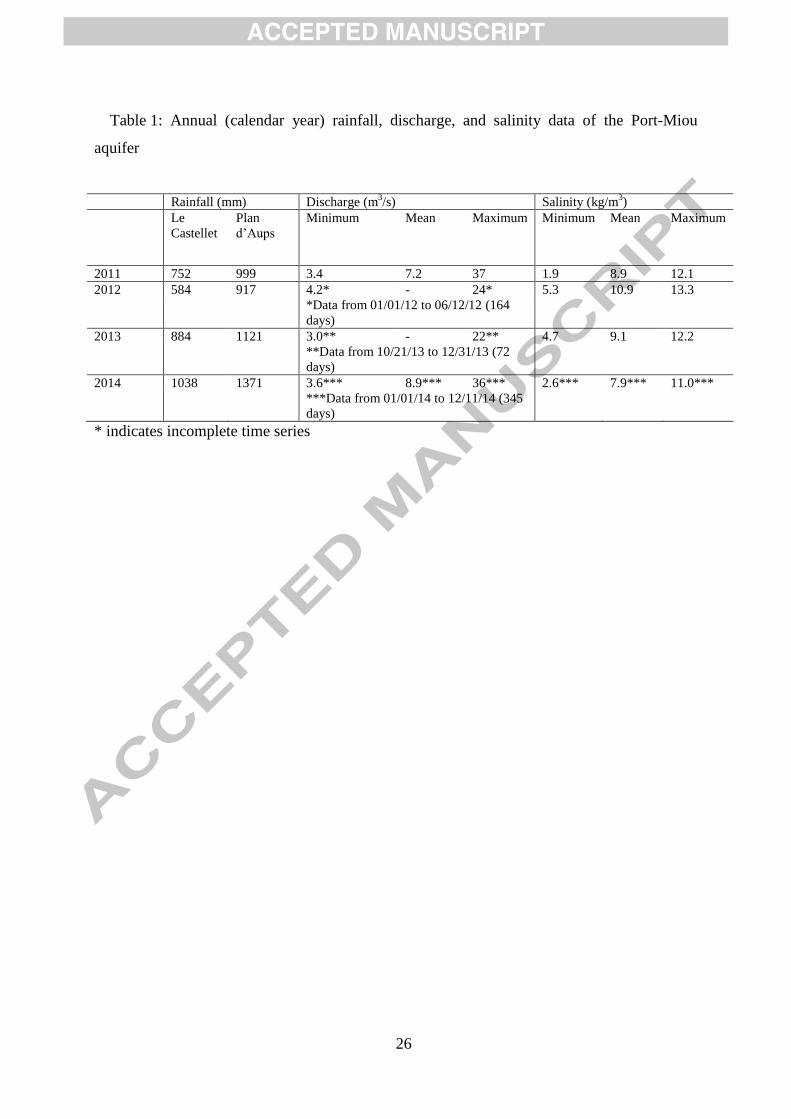
peaks corresponding to large storm-events. Table 1 gives the available main data for each
year. The minimum discharge was 3 m3/s at the end of the low-flow period (end of summer or
autumn). The maximum annual discharge peaks reached 37 m3/s. Mean annual discharge can
be calculated for two (almost) complete calendar years: 7.2 m3/s in 2011 (rainfall close to
mean inter-annual value) and 8.9 m3/s in 2014 (rainfall superior to mean). The spring is then
characterized by a high base-flow value, and a typical karst-type functioning with high-flood
events of relative short duration related to the rainfall. It is commonly interpreted as a two
component flow: a low flow and storage in matrix (small fractures and intergranular porosity)
and a conduit flow within high transmissive karst network.
Furthermore, cumulative probability plots of discharge time series (or flow duration curves)
are presented in Figure 6. This is useful to illustrate data from many years in one plot. This
method has been used to assess distribution of discharge time series comparing the envelop
plots of several springs (Florea and Vacher, 2009), or to search for fitting straight-lines and
slope variations of spring flow data (Mangin, 1975; Jeannin and Sauter, 1998). Straight lines
on cumulative probability plots indicate that the data are distributed following the chosen
probability law (usually log-normal law), with deviations from linearity indicating additional
sources or sinks. As the discharge time series is divided in two periods (Figure 5), three plots
are drawn on Figure 6: period 1 (2010-2012) in blue, period 2 (2013-2014) in red, and total
available data set from 2010 to 2014 (962 days) in grey. The three plots have the same trend:
the higher the discharge, the lower the slope of the plots. It is possible to identify 3 main
slopes, showing a change of the hydrodynamic response for discharge lower than 5 and higher
than 8.2 m3/s. According to Mangin (1975), a higher slope for the lowest discharge values
shows storage inflows from previous hydrological cycles, and a lower slope for the highest

13
discharge values can be explained by a recharge increase (an additional source), for instance
by the contribution of a fast infiltration from stream flows through sinkholes. These results
show that the hydrodynamic response of the aquifer is highly non-linear.
4.1.3 Discharge and salinity relationship
The salinity time series for the whole available period is plotted in Figure 5. The previously
described general trends for the hydrograph are also observed for the salinity: an annual
pattern (seasonal variations) with a large drop corresponding to large storm-events. The
salinity slowly increases during the low-flow period and decreases sharply during high
discharge events. The minimum salinity was 1.9 kg/m3 during the highest discharge event in
November 2011, whereas the maximum salinity was 13.3 kg/m3 after long recession periods.
The annual average salinity ranged between 7.9 and 10.9 kg/m3 (Table 1). Salinity is plotted
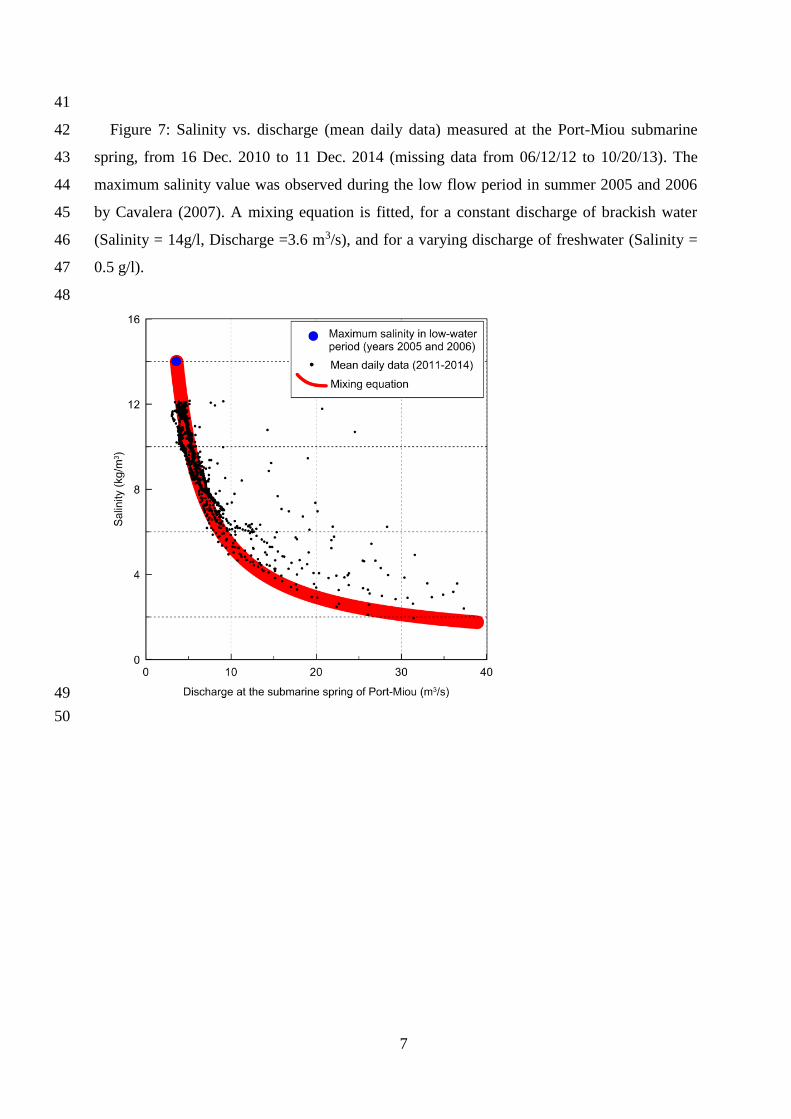
versus discharge in Figure 7. Three main results are detailed here-after:
- First of all, Figure 7 encloses the available daily time series between 2010 and 2014, and a
data representative of the maximum salinity observed during the previous 2005 to 2007
drought period. Indeed, during the years 2004-2007, the rainfall deficit (Figure 4) led to the
highest salinity of 14 kg/m3 (Cavalera et al. 2009) recorded at the Port-Miou submarine
spring.
- Second of all, the general trend between discharge and salinity is very salient. For the
entire period, a relationship links the salinity to the discharge. This relationship is also
coherent with highest salinity data (14 kg/m3) observed in 2005-2006 during the drought
period. The red line on Figure 7 shows that the groundwater salinity-discharge relationship
can be roughly modeled by a simple mixing equation with two components (mass
conservation equations, Eq.3 and Eq.4): salt or brackish water diluted by freshwater. This is
equivalent to the mixing of a varying discharge of freshwater (with a salinity of SalFW= 0.5
kg/m3) with a constant discharge of saltwater. The mixing line (Figure 7) can be fitted using
the salinity of local Mediterranean seawater (SalSW =38 kg/m3) for a constant discharge of
1.3 m3/s, or it can be fitted considering a conceptual brackish reservoir with a constant salinity
(SalBW = 14 kg/m3) for a constant discharge of 3.6 m
3/s. Following this relationship, the
salinity of the spring remains brackish even during high-discharge events (Figure 6), and
reaches a steady state during long low-flow periods up to 14 kg/m3.
14
- Finally, the general correlation between the discharge and salinity emphasized by the red
line in Figure 7 seems true most of the time, but a few data remains outside the general trend.
The domain can be divided in two subareas, below or above the red line. No dots are located
below the red line, meaning that for a given discharge the salinity is never fresher than the
mixing model. However, a few dots are located above the general trend. These dots belong to
hysteresis loops in concentration-discharge plots, due to the lag between pressure and mass
transfer, which are common in karst aquifers due to the piston effect in the conduit network
(Arfib et al. 2006, Valdes et al. 2006, Ford and Williams 2007, Charlier et al. 2012). During
storm events, the discharge increases rapidly and pushes the brackish pre-event water
(constant salinity) stored in the conduit that was explored by the cave-divers (and maybe more
upstream). This pattern illustrates the stored volume in the karst conduits between the in-situ
measurement point and the upstream zone of mixing of the brackish water with the freshwater
in the depth of the aquifer. It confirms that the salinity of the brackish spring is not due to
saline intrusion close to the outlet at the submarine spring, but from a deep mixing in the
aquifer.
4.2 Rainfall-Discharge-Salinity modeling
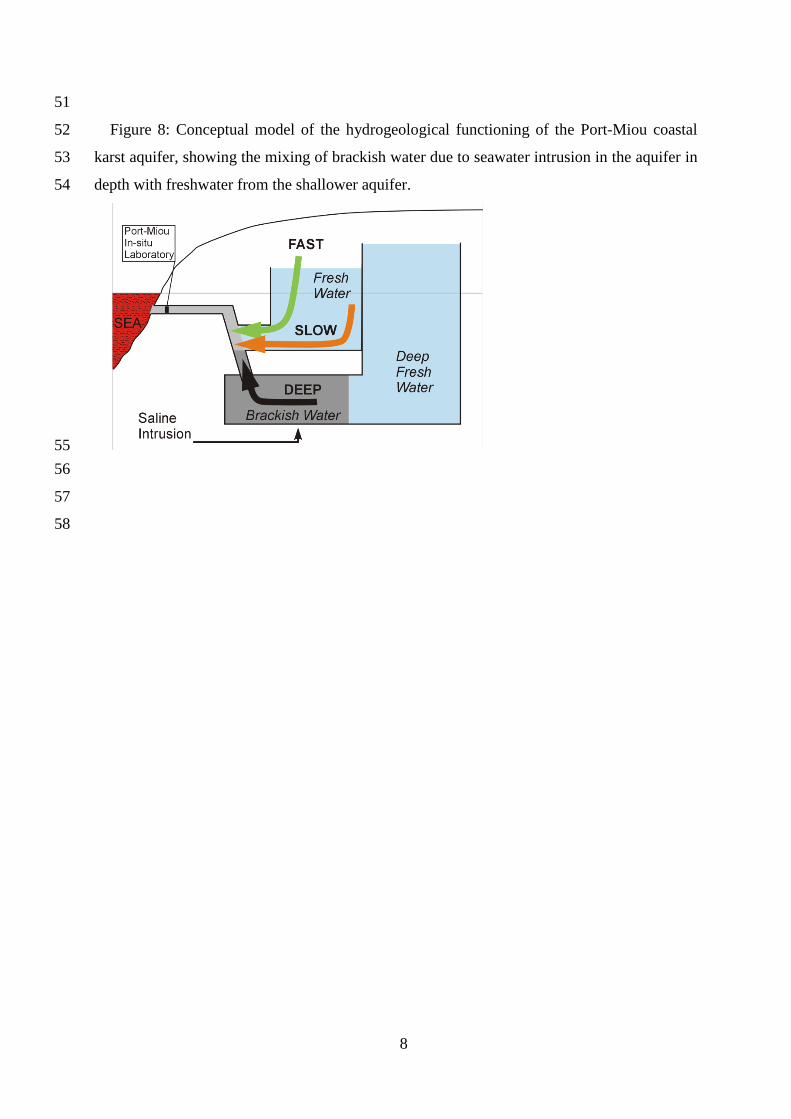
4.2.1 Conceptual model and modeling constraints
The time series analysis showed insights on the hydrogeological functioning of the aquifer.
A conceptual model of the Port-Miou aquifer is detailed herein and illustrated in Figure 8:
- The aquifer is a typical karst aquifer, with a large change in discharge due to rainfall
recharge and flow in conduits. There is a fast infiltration component through karst features.
- The groundwater storage in the aquifer appears high according to the long recession flow.
A slow component drains the aquifer and supplies the spring during low-flow period.
- The salinity of the water comes from a deep reservoir where saline intrusion occurs. From
the salinity-discharge relationship we may hypothesize that the contribution of this reservoir
is almost constant, with a constant salinity of 14 kg/m3.
Consequently, our conceptual model shows that saline water due to seawater intrusion is
mixed in depth with freshwater in a deep brackish water reservoir. A continuous discharge
from this deep brackish reservoir is mixed with freshwater coming from a shallower reservoir,
having typical karst response (fast and slow components) to rainfall events.
The conceptual model (Figure 8) summarizes water flows from each involved compartment
and the transfer processes that link them. In order to verify the main hypothesis about the
15
hydrogeological processes that were highlighted above, a modeling application is presented in
the next section. The experimental step was conducted at the aquifer scale, and thus a lumped
approach was chosen for the modeling step. The modeling constraints were: (i) to equally
represent discharge and salinity fluctuations; (ii) to integrate the three DEEP, SLOW and
FAST reservoirs; and (iii) to accurately simulate the water and mass budget. The discharge for
the three reservoirs will be calculated in relationship to the recharge. It differs from the
previous section, where we used a constant saltwater discharge to roughly estimate the
discharge-salinity relationship (Figure 7). So in the lumped reservoirs model the discharge of
brackish water will be variable according to Eq.5.
4.2.2 Model application
The model was applied on the two periods with continuous rainfall, discharge and salinity
data (Figure 5): Period 1 from Dec. 2010 to Jun. 2012, and Period 2 from Oct. 2013 to Dec.
2014. Since the two time periods have different lengths, which could lead to a difficult
comparison of model performances, a split-sample test (Klemeš, 1986) was conducted. This
test considers that both periods should be used in turn for calibration and validation.
Parameterizations used for calibration and validation procedures on both periods 1 and 2
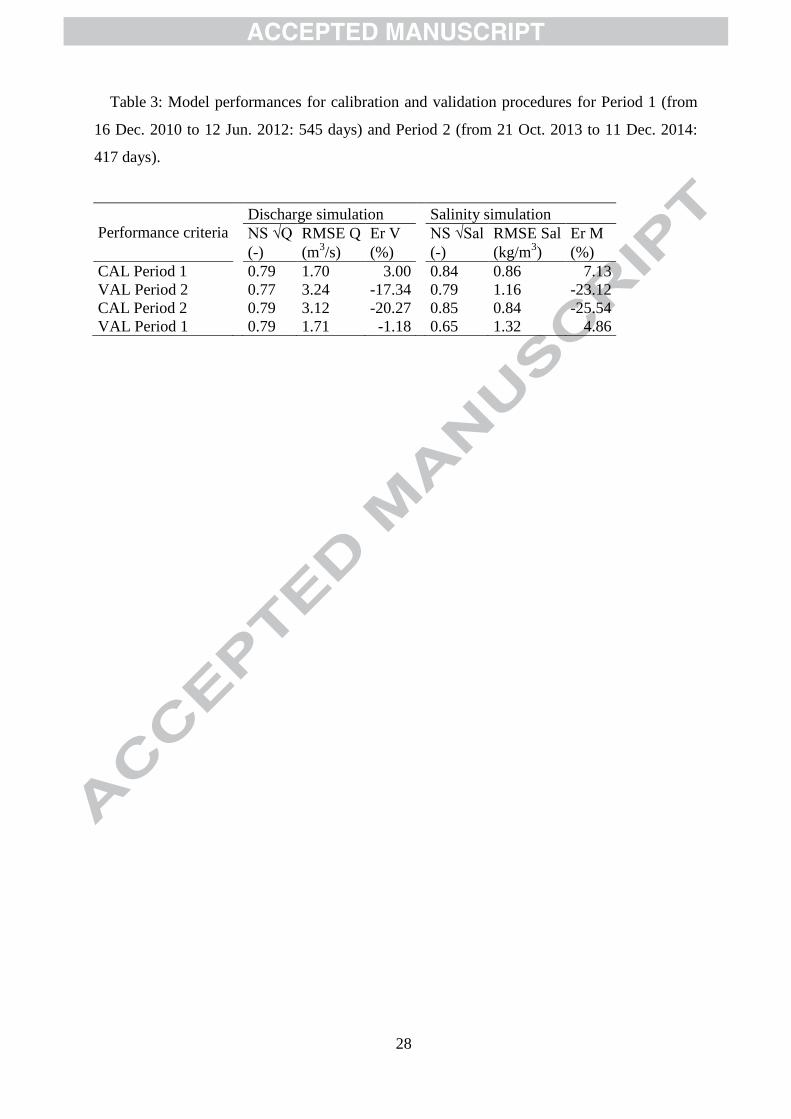
are given in Table 2. According to performance criteria shown in Table 3, modeling results
show good accuracy on discharge and salinity simulations for calibration and validation,
given the same goodness of fit regarding the NS criterion. Mean NS criterion (mean of NS √Q
and NS √Sal) is 0.82 for calibration on both periods, and is 0.72 and 0.78 for validation on
Period 1 and Period 2, respectively. Regarding simulations of calibration on Period 1 and
validation on Period 2, the budget is globally equilibrated for flows and salinity with Er V
between -1.2% and 3.0%, and Er M between 4.9% and 7.1%. Regarding procedure 2
(calibration on Period 2, validation on Period 1), an underestimation of about 20% of fluxes is
observed (ErV and ErM).
Figure 9a and 9b show the simulated time series for calibration and validation procedures
of Period 1 and 2, respectively. The general shape of discharge and salinity is well reproduced
during high-discharge events as well as during recession periods, regardless of the period of
calibration that was used. Focusing on Period 2, in February 2014 the simulated discharge is
underestimated while the salinity seems well estimated, explaining the previously noticed
underestimation of balances (ErV and ErM) (Table 3). During this specific period, the model
highlights that the rainfall-discharge-salinity relationships changed, but returned to a general
16
behaviour for the next eight months. All these results validate our hydrogeological conceptual
model at the catchment scale.
4.2.3 Modeling multi-annual trend
The aim of this section is to assess the model efficiency in simulating multi-annual time
series. The previously calibrated model for Periods 1 and 2 was used to simulate discharge
and salinity for the whole four-year period (Dec. 2010 to Dec. 2014). Measured discharge
data was only available for Periods 1 and 2, with 15 months of missing data, whereas the
salinity data was available for the whole period (Figure 5). Figure 10 shows rainfall, and
discharge and salinity at the spring. Simulated water levels in the three DEEP, SLOW, and
FAST reservoirs are also plotted. The water level of the reservoir FAST naturally decreased
quickly and dried up in a few days. The water level of the reservoir SLOW did not dry up in
the low-flow period, feeding continuously the spring with freshwater, so that the salinity at
the spring remained inferior to 14 kg/m3. The water level of the DEEP reservoir is about 100-
fold higher compared to the SLOW one, and remains more or less close to its initial level due
to its strong inertial properties (kDEEP=1.10-4
day-1
).
As expected, both calibration procedures (Period 1 and 2) showed similar results over the
whole period. Focusing on the beginning of the Period 2 (October 2013), after 15 months
without discharge measurements, discharge and salinity data were very well simulated. The
model is able to predict discharge and salinity not only for several months (Period 1 or Period
2) but also for at least a few years, giving efficiency results for a multi-annual trend.
5 Discussion
The aim of our study was to develop a conceptual model of saline intrusion within a coastal
karst aquifer analyzing rainfall-discharge-salinity data and to assess freshwater resources
using a lumped modeling approach. The application of a lumped model on the Port-Miou
brackish spring validated the hydrogeological processes that were deduced from experimental
data and showed its ability to reproduce water and mass budget at the spring as well as
discharge and salinity dynamics during several hydrological cycles. The following discussion
aims to explore four questions: (1) What is new in our modeling approach? (2) What is new
about the Port-Miou case-study, analyzing the modeling results? (3) What can we learn about
saline intrusion in coastal karst aquifers? (4) What can we deduce about the freshwater
resources in similar contexts?
17
5.1 A simple modeling approach to simulate discharge as well as salinity
One original aspect of our model is the combined use of quantity and quality measurements
with model simulations to characterize the hydrogeological functioning of complex karst
aquifers as coastal karsts drained by brackish springs. This gives more robustness in the
modeling approach, because both discharge and salinity variables are controlled by all
parameters, as was illustrated in the sensitivity analysis (Figure 3). Our calibration procedure
on both variables is a first step to limit the equifinality – that is the fact that acceptable
simulations can be reached by many potential sets of parameterizations - which is a recurrent
question during model calibration (Beven, 2006). In the case of aquifers having little internal
data, the use of quantity and quality measurements may improve the realism of conceptual
model structures (Charlier et al., 2012; Hartmann, 2013). This is one of the main strengths of
this model which is parsimonious if we consider that only 8 parameters are needed to
adequately simulate two independent time series (that is discharge and salinity). Finally,
advantages of such reservoir models are their simple implementation and easy adaptation to
various case-studies.
5.2 Insights on the hydrodynamic functioning of the Port-Miou aquifer
We can deduct from the conceptual scheme and the lumped model that groundwater flow is
spread out in several compartments inside the aquifer, each with its own hydrogeological
behavior. These compartments, viewed as reservoirs for modeling purposes (Figure 8), are all
connected together to the main karst conduit of the Port-Miou spring, which has been
explored by cave-divers and discharges into the Mediterranean Sea.
The conceptual model includes two reservoirs of freshwater and a third one with brackish
water in depth. During recession periods, both SLOW and DEEP reservoirs - but especially
the DEEP one - contributed to the discharge. The discharge of the DEEP reservoir is almost
constant; consequently, it is characterized by a high storage (small water level variations
compared to the saturated zone) and a very low recession coefficient. For the 4 years which
were studied (Dec. 2010 to Dec. 2014), this reservoir contributes in average to 4.2 m3/s
(Table 4) of the spring discharge (including the discharge of deep intruded seawater), that is
about 60% of the total discharge.
The freshwater that dilutes the deep brackish water and decreases the salinity of the spring
when the discharge increases, comes from the two reservoirs SLOW and FAST. They drain
the last 40% of the outflow. The fast flow has a very high recession coefficient, but it needs a
18
threshold to be activated. In this latter case, 20 to 25% of the total effective rainfall (from
Table 2: (1-X).Y) contributes to fast infiltration and to groundwater flows through karst
conduits, with temporal streams losing water through sinkholes in poljes and karstic valleys.
The analysis of the three reservoirs’ contribution (Figure 9a and 9b) illustrates that FAST
flows generated high flood events, while the sum of the SLOW component and the DEEP
component is less than 8 m3/s. This discharge value was previously identified in the
cumulative probability plots (Figure 6) as a breakpoint below contributions of another storage
zone (lower slope for higher discharge). The maximum discharge at the spring is then highly
correlated to the recharge duration and intensity, and to the water level in the SLOW
reservoir. For the entire period that was studied, the FAST and SLOW flows represent in
average 1.0 and 2.0 m3/s of freshwater at the spring, respectively (Table 4).
During Period 2, between December 2013 and February 2014, the model under-estimated
slightly (20%) the discharge whereas the salinity is well fitted (Figures 9). Two assumptions
can be proposed to explain this change: it may be due i) to the increase of the catchment area
during this rainy period, or ii) to a second fast flow component of fresh and brackish water
that have been neglected for parsimonious modeling.
5.3 Saline intrusion mechanism in coastal karst aquifer
Coastal karsts are specific aquifers due to conduit networks that are located below the
current sea water level. Coastal karst aquifers, as with all coastal aquifers, are intruded by sea
water inland that can occur by several different processes (Fleury et al. 2007a). For instance,
Davis and Verdi (2014) recently illustrated that saline intrusion can flow through the coastal
karst network connected to the sea, leading to a direct flow of sea water into submarine
springs during backflow conditions. However, our study clearly showed that even if the
seawater can flow inland at the bottom of the karst conduit open to the sea, the Port-Miou
submarine spring is brackish due to saline intrusion occurring in depth within the aquifer. One
of the main features of the coastal karst is that deep karst conduits can cross the saline
intrusion zone. Therefore karst conduits drain a large zone of the aquifer from deep horizons
to the surface. Thus, deep brackish water of more or less long resident time mixes with water
from fast infiltration flow. This is achieved at the Port-Miou spring by the 2 km long karst
conduit that goes down to at least 223 meters below the sea level. Previous studies (e.g.
Maramathas et al. 2006; Fleury et al. 2007a) have shown that the seawater flow rate at
brackish springs (inland or submarine) can increase with the total discharge of the spring
because of the Venturi suction effect, or decrease when the hydraulic head in the karst
19
network balances the seawater inflow. These processes can be viewed on schematic plots
representing saltwater discharge (QSW) vs. freshwater discharge (QFW) -as illustrated in
Figure 11 (the plots have no scale because the mathematical laws that link both variables are
not discussed): the “Venturi suction effect” has a rising slope (Figure 11a), and the “head
balance process” has a decreasing slope (Figure 11b) down to QSW=0 when the saltwater
inflow can be stopped or reversed (see for example the Almyros case study in Arfib and
Marsily (2004) and Maramathas et al. (2006)). The Port-Miou case study illustrates a third
case (Figure 11c): the flowrate of saltwater (seawater or brackish water) at the spring has a
very low variation during all of the hydrological cycle despite big total discharge variations.
In this third case, the salinity evolution of the brackish spring is mainly due to freshwater
dilution. For the Port-Miou spring, there is no evidence of a decrease of the deep saltwater
intrusion within the main karst conduit supplying the spring, while the submarine dam built in
the 1970’s across the karst conduit forces the water level to rise 3 meters above the sea level
during high discharge events (for a discharge superior to 40 m3/s).
To address the mixing issue, we may consider karst as a set of storage or reservoirs, and
conduit networks as connectors that link them. As saline intrusion does not encroach on all of
the aquifer, some reservoirs stay fresh, whereas others are brackish. The mixing of the water
from the different reservoirs results finally in brackish water that flows to the spring, with
variable salinity according to the contribution of each reservoir. In the case of the Port-Miou
spring, one part of the aquifer behaves as a brackish reservoir with smooth and low changes in
hydraulic gradient as a porous aquifer. The mixing zone needs a certain width and a certain
transit time so that the aquifer provides some brackish water with an almost constant salinity
and discharge. This concept of brackish reservoir that was used for the Port-Miou conceptual
model is coherent with other studied karst aquifers such as the Moraig-Toix aquifer (Fleury,
2007c).
5.4 Freshwater resources
We showed that the water head increase at the spring did not decrease the brackish water
flow rate at the spring. In natural conditions, the saline intrusion process is not reversible.
This results in the fact that freshwater resources are never available at the spring. Freshwater
must thus be withdrawn inland.
The FAST and SLOW reservoirs can be viewed as the two components of freshwater
flowing through an aquifer not influenced by saline intrusion. This compartment of the Port-
20
Miou aquifer can be called the upper aquifer, in contrast to the deeper one. The FAST
reservoir constitutes the flow through conduits, with a very low storage, and mainly a
transmissive function during flood events.
The SLOW reservoir simulates the baseflow of the upper aquifer, which stores the
freshwater. Based on four years of simulation, the mean available discharge from this
reservoir is around 2.0 m3/s (Table 4). We can also estimate the time needed to drain the
volume of water stored in this SLOW reservoir (equivalent to freshwater without saline
intrusion) above the spring outlet, using Eq.2 (with kSLOW=0.011 day-1
, Table 2). Starting
from a water level of 100 mm in the reservoir, i.e. the maximum level simulated with the
model (Figure 10), it needs 356 days without recharge to simulate a discharge lower than 100
L/s (or 360 m3/hour) at the reservoir outlet. This freshwater is then mixed with the deep
brackish water downstream from the DEEP reservoir. Once the freshwater of the upper
aquifer and the brackish deep water are mixed, the freshwater is no longer available in the
karst conduit supplying the spring. For water management purposes, this freshwater has to be
withdrawn upstream from its connection with the karst conduit where the deep brackish water
flows.
Finally, our model calculated that between 45% to 60% (Table 2) of the recharge supplied
the DEEP reservoir. A large amount of groundwater is stored in this inertial part of the aquifer
(very low kDEEP, Table 2). Deep saline intrusion limits the availability of the freshwater
resources at the brackish spring, but inland, the groundwater must be fresh.
From the preceding discussion, we can conclude that groundwater is available as freshwater
resources in two target zones: (1) in the upper karst aquifer (SLOW and FAST reservoirs),
upstream from the connection with the deep brackish water flowing to the spring through the
karst features, (2) in the deep aquifer (DEEP reservoir equivalent to a porous aquifer
behavior), upstream from the saline intrusion zone. Further work is still needed to locate the
connection zone between the upper aquifer and the deep karst conduit.
As future perspectives, since a hydrogeological scheme is now well defined, a geochemical
approach could help to gain insights into the water transit-times, water origin, and mixing
between brackish and fresh water compartments. Chemical and isotopic tracers may be
applied, using e.g. Br/Cl, δ18
O/2H, Rn on spring waters sampled during contrasted
hydrological conditions and during flood events.
21
6 Conclusion
To quantify the discharge of fresh and brackish water flowing in a coastal karst aquifer, a
Rainfall-Discharge-Salinity reservoir model was developed in accordance with the conceptual
model built from the analysis of 4 years of in-situ monitoring of salinity and discharge at the
submarine spring of Port-Miou.
On the contrary to other case studies in the Mediterranean context, where springs can be
fresh when deep saline intrusion is stopped due to water head increase, our data shows that the
saline intrusion can be almost constant over time. We claim that the salinity variations were
mainly due to dilution of deep brackish water flows by a shallower fresh aquifer. The
contribution of the deep reservoir is never stopped or reversed. Consequently, actual
freshwater resources exist in this aquifer inland but are not available at the outlet. Our results
led us to propose a new type of seawater mixing mechanism for brackish aquifers: the dilution
type in addition to the well-known Ventury suction, and Head balance types.
In conclusion, our combined experimental and modeling approach appears to be relevant
for managers to carry out a robust diagnostic of the available freshwater resources in brackish
aquifers. As the presented Rainfall-Discharge-Salinity model is easy to implement, we expect
it to be a generic tool, which could be tested as a first step to help characterize the
hydrogeological functioning of such complex brackish aquifers.
Acknowledgments : This paper is part of the KarstEAU project (http://www.karsteau.fr)
funded by the “Agence de l’Eau Rhône-Méditerranée-Corse”, “Conseil Général du Var”,
“Conseil Général des Bouches-du-Rhône” and “Région Provence Alpes Côte d’Azur”. We
thank N. Mauger (MS Student) who helped to this project. We also thank "Météo France" for
the meteorological data, the "Conservatoire du Littoral" for the access to the Port-Miou in-situ
underground laboratory, the cave-diving team CRPS for submarine survey, and Catherine
Novaes for the English language improvement. The Port-Miou spring is part of the network of
research sites on KARST (www.sokarst.org), one observatory network of INSU (CNRS).
References
22
Arfib, B., and de Marsily G. (2004), Modeling the salinity of an inland coastal brackish karstic spring
with a conduit-matrix model, Water Resour. Res., 40, W11506, doi:10.1029/2004WR003147.
Arfib B., Cavalera T. and Gilli E. (2006) Influence of hydrodynamics on saline intrusion in coastal
karstic aquifers.ComptesRendus Geoscience, 338, pp757-767
Arfib B., de Marsily G., Ganoulis J. (2007) Locating the zone of saline intrusion in a coastal karst
aquifer using springflow data. Ground Water 45 No1, pp.28-35
Arfib B, Douchet M. (2011) State of hydrogeological and cave-diving knowledge about the submarine
rivers of Port-Miou and Bestouan (Cassis, France). Proceedings 9th Conference on Limestone
Hydrogeology, 1-3 Sept. 2011, Besançon, France [in French]
Audra, Ph., Palmer, A.N. (2013) The vertical dimension of karst: controls of vertical cave pattern. In:
Shroder Jr., J., Frumkin, A. (Eds.), Treatise on Geomorphology, vol. 6. Academic Press, San
Diego, CA, pp. 186–206
Bakalowicz M. (2015) Karst and karst groundwater resources in the Mediterranean, Environ Earth Sci
74:5–14. DOI 10.1007/s12665-015-4239-4
Beven K (2006) A manifesto for the equifinality thesis. J Hydrol 320(1–2):18–36.
doi:10.1016/j.jhydrol.2005.07.007
Bestani L., Espurt N., Lamarche J., Floquet M., Philip J., Bellier O. And Hollender F. (2015)
Structural style and evolution of the Pyrenean-Provence thrustbelt, SE France. Bull. Soc. Géol.
France, 2015, t. 186, no4-5, p.223-242
Bonacci, O., Roje-Bonacci, T., (1997) Sea water intrusion in coastal karst springs: example of the Blaz
Spring (Croatie). Hydrological Sciences Journal 42, 89–100.
Blavoux B., Gilli E., Rousset C. (2004) Watershed and origin of the salinity of the karstic submarine
spring of Port-Miou. Comptes rendus Geoscience, Vol.336 – N.6 – pp.523-533
Cavalera T., Gilli E., Arfib B. (2009) Brackish karstic springs of Port-Miou and Bestouan (BdR –
France) : insight the functionning of coastal karstic aquifers. Géologues n°160.pp.77-81 [in
French]
Cavalera Thomas (2007) Study of the hydrogeological functioning and the catchment area of the
submarine spring of Port-Miou (South-East France).PhD. thesis.University of Provence-
Marseille. 403p.[in French] http://tel.archives-ouvertes.fr/tel-00789232
Charlier J.B., C. Bertrand, J Mudry (2012) Conceptual hydrogeological model of flow and transport of
dissolved organic carbon in a small Jura karst system. Journal of Hydrology, Vol. 460–461, p.52-
64
Custodio E. (2010) Coastal aquifers of Europe: an overview. Hydrogeology Journal 18: 269–280
Davis J.H. and Verdi R. (2014) Groundwater Flow Cycling Between a Submarine Spring and an
Inland Fresh Water Spring.No. 5–Groundwater.p.705–716
Fleury P., Bakalowicz M., Marsily de G. (2007a) Submarine springs and coastal karst aquifers:A
review. Journal of Hydrology 339, 79– 92
23
Fleury P., Plagnes V., Bakalowicz M. (2007b) Modelling of the functioning of karst aquifers with a
reservoir model: Application to Fontaine de Vaucluse (South of France). Journal of
Hydrology345, 38– 49
Fleury P., Bakalowicz M. ,Marsily de G., Cortes J. M. (2007c) Functioning of a coastal karstic system
with a submarine outlet, in southern Spain. Hydrogeology Journal DOI 10.1007/s10040-007-
0215-8
Fleury P., Bakalowicz M., Becker P. (2007d) Characterising a karst system with a submarine spring:
the example of La Mortola (Italy). C. R. Geoscience 339. p. 407–417
Ford D. and Williams P. (2007) Karst Hydrogeology and Geomorphology. Wiley ed. 576 pages
Florea L.J. and Vacher H.L. (2006) Springflow Hydrographs: Eogenetic vs. Telogenetic Karst.Vol. 44,
No. 3. Groundwater p. 352–361
Gilli E. (2015) Deep speleological salt contamination in Mediterranean karst aquifers: perspectives for
water supply. Environ Earth Sci. Vol. 74:1, pp 101-113 DOI 10.1007/s12665-015-4042-2
Hartmann A., Kralik M., Humer F., Lange J., Weiler M. (2012a) Identification of a karst system’s
intrinsic hydrodynamic parameters: upscaling from single springs to the whole aquifer. Environ.
Earth Sci. 65:2377–2389. DOI 10.1007/s12665-011-1033-9
Hartmann A., J.s Lange, À. VivóAguado, N. Mizyed, G. Smiatek, H. Kunstmann (2012b) A multi-
model approach for improved simulations of future water availability at a large Eastern
Mediterranean karst spring, Journal of Hydrology, Volumes 468–469, p.130-138.
doi:10.1016/j.jhydrol.2012.08.024.
Hartmann, A., T. Wagener, A. Rimmer, J. Lange, H. Brielmann, and M. Weiler (2013) Testing the
realism of model structures to identify karst system processes using water quality and quantity
signatures, Water Resour. Res., 49, 3345–3358, doi:10.1002/wrcr.20229.
Jeannin, P.-Y., and M. Sauter. 1998. Analysis of karst hydrodynamic behavior using global
approaches: A review. In Modeling in Karst Systems, ed. P.-Y.Jeannin and M. Sauter. Bulletin
d’Hydrogéologie 16: 31–48
Klemeš, V. (1986) Operational testing of hydrological simulation models, Hydrolog. Sci. J., 31(1),
13–24
Kominz M.A. (2001) Sea Level Variations Over Geologic Time. Encyclopedia of Ocean Sciences.p.
2605–2613. DOI: 10.1006/rwos.2001.0255
Lamarche J, Lavenu APC, Gauthier BDM, Guglielmi Y, Jayet O (2012) Relationships between
fracture patterns, geodynamics and mechanical stratigraphy in Carbonates (South-East Basin,
France). Tectonophysics 581, 231-245
Mangin A. (1975) Contribution à l’étude hydrodynamique des aquifères karstiques. Thèse de Docteur
ès Sciences, Université de Dijon [in French]
24
Maramathas A., Pergialiotis P., Gialamas I. (2006) Contribution to the identification of the sea
intrusion mechanism of brackish karst springs. Hydrogeology Journal 14: 657–662 DOI
10.1007/s10040-005-0466-1
Météo France (2015), Rainfall data, 2010-2014. METEO France, Toulouse, France.
Mocochain L., Clauzon G., Bigot J.Y., Brunet P. (2006) Geodynamic evolution of the peri-
Mediterranean karst during theMessinian and the Pliocene: evidence from the Ardèche and Rhône
Valley systems canyons, Southern France. Sedimentary Geology.188–189 p.219–
233.doi:10.1016/j.sedgeo.2006.03.006
Mocochain L., Audra P., Bigot J.Y. (2011) Base level rise and per ascensum model of speleogenesis
(PAMS).Interpretation of deep phreatic karsts, vauclusian springs and chimney-shafts. Bull. Soc.
géol. Fr., t. 182, no 2, pp. 87-93
Moussa R (2010) When monstrosity can be beautiful while normality can be ugly: assessing the
performance of event-based flood models. Hydrological Sciences Journal, 55: 6, 1074-1084.
Meniscus X. (2013) Spring of Port Miou: -223 m on 7 May 2012. Spelunca n°132.pp.23-27 [in
French]
Nash, J.E., Sutcliffe, J.V., 1970. River flow forecasting through conceptual models part I – a
discussion of principles. Journal of Hydrology 10 (3), 282–290.
Nikolaïdis N.P., F. Bouraoui, G. Bidoglio (2013) Hydrologic and geochemical modeling of a karstic
Mediterranean watershed. Journal of Hydrology, Volume 477, p.129-138
Rimmer, A., Salingar, Y., 2006. Modelling precipitation-streamflow processes in karst basin: The case
of the Jordan River sources, Israel. Journal of Hydrology, 331: 524-542
Robinson J. and Rahmat-Samii Y. (2004) Particle swarm optimization in electromagnetics. IEEE
Trans. Antenn. Propag., 52, pp. 397–407.
Romey C., P. Rochette, C. Vella, B. Arfib, V. Andrieu-Ponel, R. Braucher, C. Champollion, M.
Douchet, P. Dussouillez, D. Hermitte, E. Mattioli, J-C Parisot, J-L Schwenninger (2014)
Geophysical and geomorphological investigations of a quaternary karstic paleolake and its
underground marine connection in Cassis (Bestouan, Cassis, S.E. France).
Geomorphology.Vol.214, p. 402–415. http://dx.doi.org/10.1016/j.geomorph.2014.02.021
Stringfield V.T. & Legrand H.E. (1971) Effects of karst features on circulation of water in carbonate
rocks in coastal areas. Journal of Hydrology, 14, pp.139-157
Tassy A., B. Arfib, E. Gilli (2010) Better understanding of coastal water resources through a salinity
study during an exceptional high-water event: the case of Port-Miou (Cassis, SE France)-
Advances in Research in Karst Media, B. Andreo, F. Carrasco, J.J. Durán and J. LaMoreaux
(eds). Springer, Berlin Heidelberg New York.pp.49-55. DOI : 10.1007/978-3-642-12486-0_8
Tassy A., F. Fournier, P. Münch, J. Borgomano, I. Thinon, M-C.Fabri, M. Rabineau, B. Arfib, J.
Begot; M-O.Beslier, J-J.Cornée, A. Fournillon, C. Gorini, P. Guennoc, P. Leonide, J. Oudet, F.
Paquet, F. Sage, R. Toullec, (2014) Discovery of Messinian Canyons and New Seismic
25
Stratigraphic Model, Offshore Provence (SE France): Implications for the Hydrographic Network
Reconstruction. Marine & Petroleum Geology. Vol.55, p.25-50.
DOI:10.1016/j.marpetgeo.2014.05.001
Tritz, S., Guinot, V., Jourde, H., (2011) Modelling the behaviour of a karst system catchment using
non-linear hysteretic conceptual model. Journal of Hydrology 250–262
Tulipano, L., M. D. Fidelibus, and A. Panagopoulos (Eds.) (2005) COST Action 621 Groundwater
management of coastal karstic aquifers, 367 pp., COST Office
Valdes, D., Dupont, J.-P., Massei, N., Laignel, B. and Rodet, J., 2006. Investigation of karst
hydrodynamics and organization using autocorrelations and T-[Delta]C curves. Journal of
Hydrology, 329(3-4): 432-443.
Voss C. 2011, Editor’s message: Groundwater modeling fantasies —part 1, adrift in the details:
Hydrogeology Journal, v. 19, iss. 7, p. 1281-1284
Voss C. 2012 Using groundwater models for coastal management : why simple modeling is best. 22nd
Salt Water Intrusion Meeting. Brazil. 2012.
26
Table 1: Annual (calendar year) rainfall, discharge, and salinity data of the Port-Miou
aquifer
Rainfall (mm) Discharge (m3/s) Salinity (kg/m
3)
Le
Castellet
Plan
d’Aups
Minimum Mean Maximum Minimum Mean Maximum
2011 752 999 3.4 7.2 37 1.9 8.9 12.1
2012 584 917 4.2* - 24* 5.3 10.9 13.3
*Data from 01/01/12 to 06/12/12 (164
days)
2013 884 1121 3.0** - 22** 4.7 9.1 12.2
**Data from 10/21/13 to 12/31/13 (72
days)
2014 1038 1371 3.6*** 8.9*** 36*** 2.6*** 7.9*** 11.0***
***Data from 01/01/14 to 12/11/14 (345
days)
* indicates incomplete time series
27
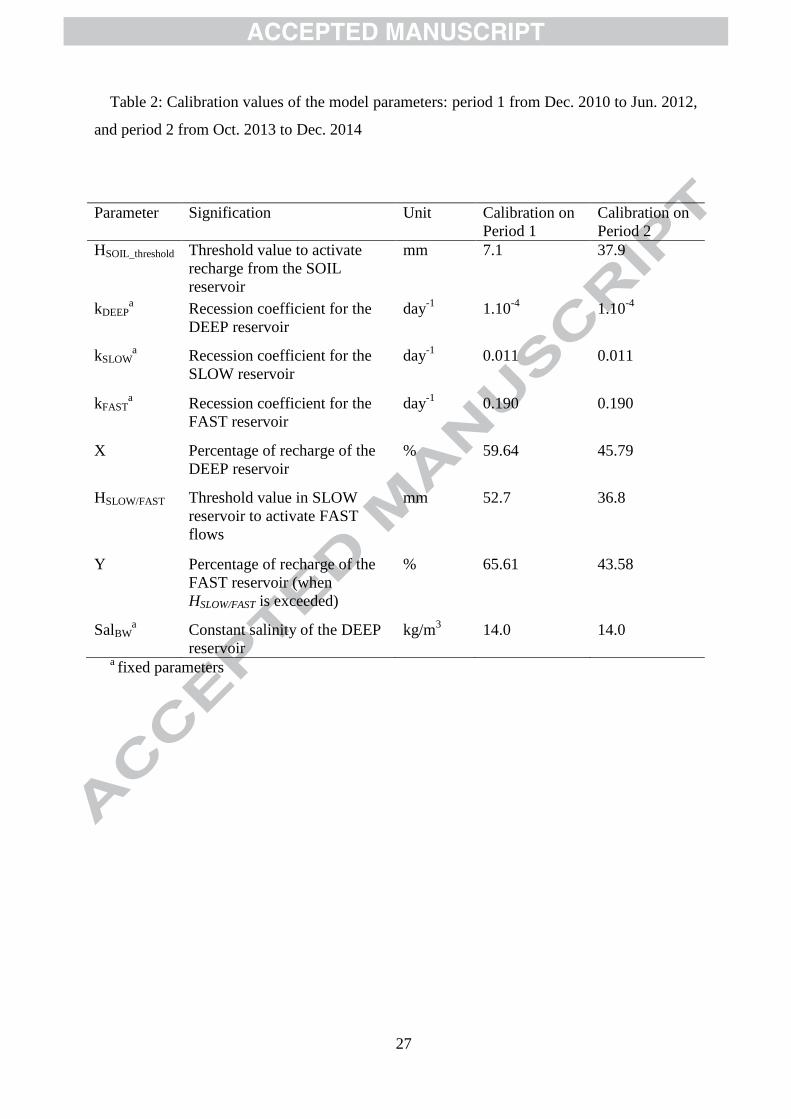
Table 2: Calibration values of the model parameters: period 1 from Dec. 2010 to Jun. 2012,
and period 2 from Oct. 2013 to Dec. 2014
Parameter Signification Unit Calibration on
Period 1
Calibration on
Period 2
HSOIL_threshold Threshold value to activate
recharge from the SOIL
reservoir
mm 7.1 37.9
kDEEPa Recession coefficient for the
DEEP reservoir
day-1
1.10-4
1.10-4
kSLOWa Recession coefficient for the
SLOW reservoir
day-1
0.011 0.011
kFASTa Recession coefficient for the
FAST reservoir
day-1
0.190 0.190
X Percentage of recharge of the
DEEP reservoir
% 59.64 45.79
HSLOW/FAST Threshold value in SLOW
reservoir to activate FAST
flows
mm 52.7 36.8
Y Percentage of recharge of the
FAST reservoir (when
HSLOW/FAST is exceeded)
% 65.61 43.58
SalBWa Constant salinity of the DEEP
reservoir
kg/m3 14.0 14.0
a fixed parameters
28
Table 3: Model performances for calibration and validation procedures for Period 1 (from
16 Dec. 2010 to 12 Jun. 2012: 545 days) and Period 2 (from 21 Oct. 2013 to 11 Dec. 2014:
417 days).
Performance criteria
Discharge simulation
Salinity simulation
NS √Q RMSE Q Er V
NS √Sal RMSE Sal Er M
(-) (m3/s) (%)
(-) (kg/m
3) (%)
CAL Period 1
0.79 1.70 3.00 0.84 0.86 7.13
VAL Period 2
0.77 3.24 -17.34 0.79 1.16 -23.12
CAL Period 2 0.79 3.12 -20.27 0.85 0.84 -25.54
VAL Period 1 0.79 1.71 -1.18 0.65 1.32 4.86

29
Table 4: Mean values of observed and simulated discharge and salinity at the Port-Miou
brackish spring for the whole monitoring period (Dec. 2010 to Dec. 2014) according to the
two calibration procedures.
Parameter
name Signification Unit Observations.
Calibration
on Period 1
Calibration on
Period 2.
QMean Mean total discharge at the
brackish spring m
3/s 7.45* 7.48 6.92
SalMean Mean salinity at the spring kg/m3 9.19 9.15 9.6
QMean_DEEP_FW
Mean simulated discharge of
freshwater flowing out of the
DEEP reservoir
m3/s n.a. 2.78 2.63
QMean_DEEP_BW
Mean simulated discharge of
brackish water flowing out of
the DEEP reservoir
(including the QMean_DEEP_FW
previously given)
m3/s n.a. 4.34 4.11
QMean_FAST
Mean simulated discharge of
freshwater flowing out of the
FAST reservoir
m3/s n.a. 1.01 0.95
QMean_SLOW
Mean simulated discharge of
freshwater flowing out of the
SLOW reservoir
m3/s n.a. 2.14 1.86
* Observed discharge only available on Periods 1 and 2 (missing data from 13 Jun. 2012 to 20 Oct. 2013)
30
Figure 1: (a) Structural map (modified from Lamarche et al. 2012) of the Provence region
(South-East France), with the location of the Port-Miou spring and its recharge area. (b)
Schematic cross section of the Port-Miou karst conduit explored by cave-divers (Meniscus
2013) 2 km upstream of the sea and down to 223 m below sea-level.
Figure 2: Structure of the rainfall-discharge-salinity reservoir model devoted to a brackish
spring.
Figure 3: Sensitivity analysis for model parameters (see Table 2 for parameters
signification) on Period 1; plots show the variation of three performance criteria (NS, RMSE
and Er) for differences of ±5%, ±10%, ±25%, and ±50% of the tested parameters around the
calibrated value. Note that negative NS values are not represented.
Figure 4: Annual rainfall from 1994 to 2014 at the meteorological station Le Castellet
(elevation 417m); the dotted black line represents the mean annual rainfall over the1994-2014
period.
Figure 5: Rainfall, discharge and salinity time series of the Port-Miou submarine spring at a
daily time step (4 years, from 12/16/2010 to 12/11/2014). Highest rainfall events produce
high-flood events, with a correlated decrease of salinity.
Figure 6: Cumulative probability plot of daily discharge data at the Port-Miou spring
(Period 1 and 2 referred to time series from 16 Dec. 2010 to 12 Jun. 2012, and from 21 Oct.
2013 to 11 Dec. 2014, respectively).
31
Figure 7: Salinity vs. discharge (mean daily data) measured at the Port-Miou submarine
spring, from 16 Dec. 2010 to 11 Dec. 2014 (missing data from 06/12/12 to 10/20/13). The
maximum salinity value was observed during the low flow period in summer 2005 and 2006
by Cavalera (2007). A mixing equation is fitted, for a constant discharge of brackish water
(Salinity = 14g/l, Discharge =3.6 m3/s), and for a varying discharge of freshwater (Salinity =
0.5 g/l).
Figure 8: Conceptual model of the hydrogeological functioning of the Port-Miou coastal
karst aquifer, showing the mixing of brackish water due to seawater intrusion in the aquifer in
depth with freshwater from the shallower aquifer.
Figure 9: Simulation results for (a) calibration on Period 1 (Dec. 2010 to Jun. 2012) and
validation on Period 2(Oct. 2013 to Dec. 2014), and for (b) calibration on Period 2 and
validation on Period 1. Simulated discharge is split in 3 components related to the FAST,
SLOW, and DEEP reservoirs.
Figure 10: Simulation results over the whole period available (Dec. 2010 to Dec. 2014)
showing the water level variations in the FAST, SLOW, and DEEP reservoirs. #1 and #2 refer
respectively to calibration on Period 1 and Period 2. Note the missing discharge data from
Jun. 2012 to Oct. 2013.
Figure 11: Three types of relationships between Seawater discharge (QSW) and Freshwater
discharge (QFW) at a karstic brackish spring for “Venturi suction effect”, “Head balance
process” and “Dilution”.
32
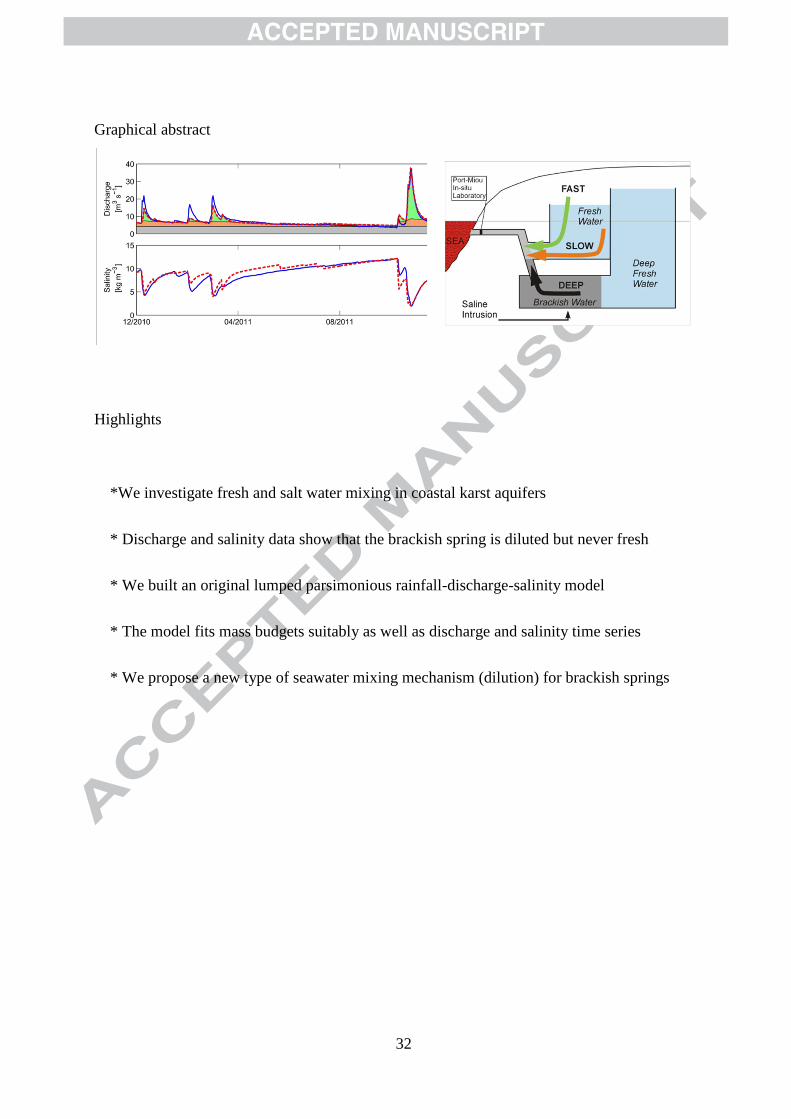
Graphical abstract
Highlights
*We investigate fresh and salt water mixing in coastal karst aquifers
* Discharge and salinity data show that the brackish spring is diluted but never fresh
* We built an original lumped parsimonious rainfall-discharge-salinity model
* The model fits mass budgets suitably as well as discharge and salinity time series
* We propose a new type of seawater mixing mechanism (dilution) for brackish springs
1
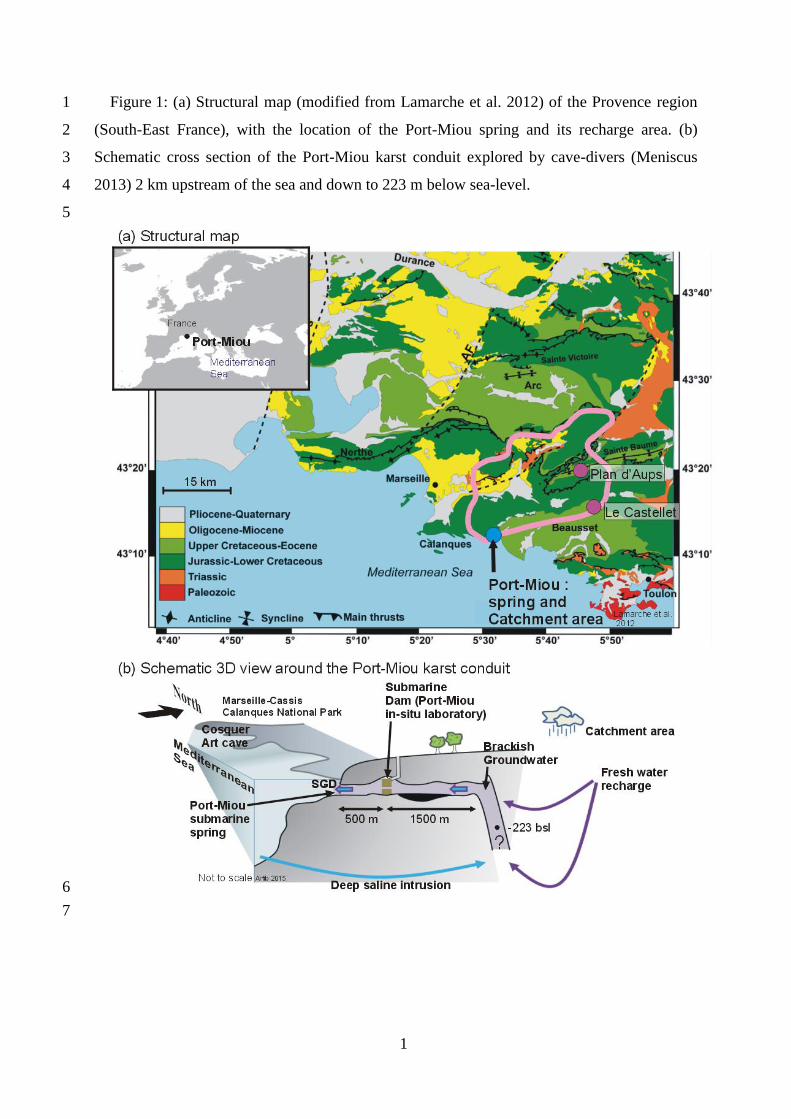
Figure 1: (a) Structural map (modified from Lamarche et al. 2012) of the Provence region 1
(South-East France), with the location of the Port-Miou spring and its recharge area. (b) 2
Schematic cross section of the Port-Miou karst conduit explored by cave-divers (Meniscus 3
2013) 2 km upstream of the sea and down to 223 m below sea-level. 4
5
6
7
2
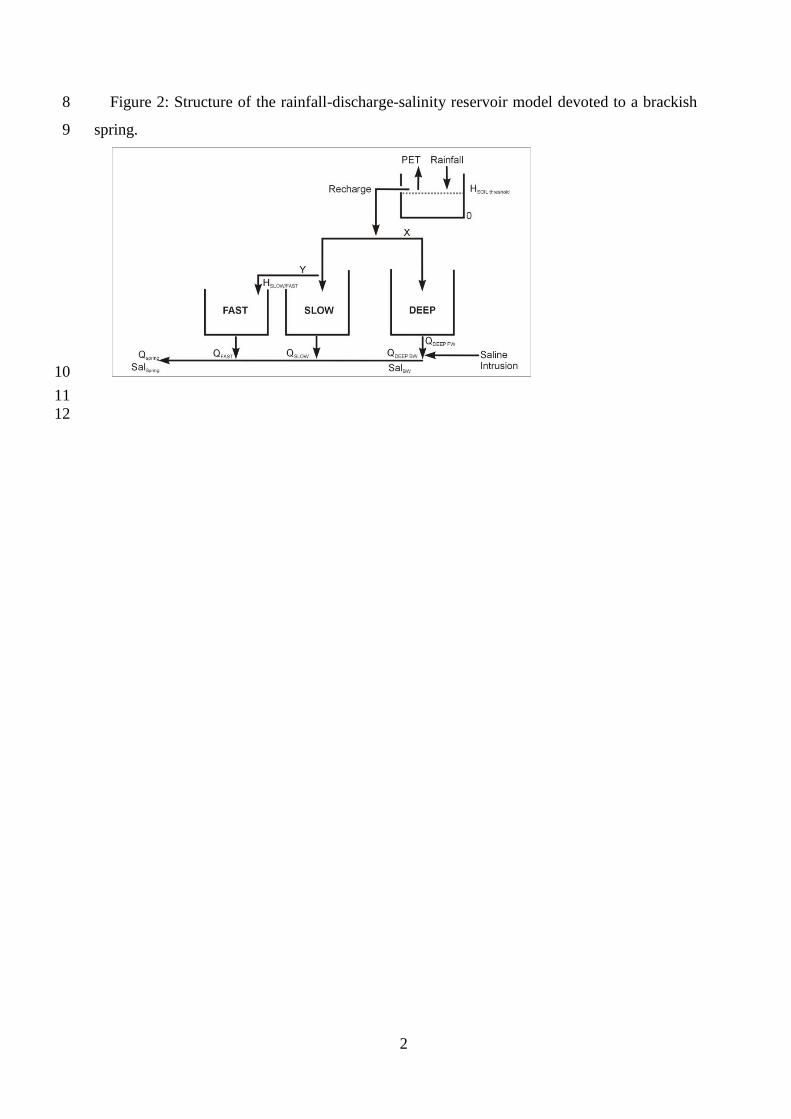
Figure 2: Structure of the rainfall-discharge-salinity reservoir model devoted to a brackish 8
spring. 9
10
11
12

3
Figure 3: Sensitivity analysis for model parameters (see Table 2 for parameters 13
signification) on Period 1; plots show the variation of three performance criteria (NS, RMSE 14
and Er) for differences of ±5%, ±10%, ±25%, and ±50% of the tested parameters around the 15
calibrated value. Note that negative NS values are not represented. 16
17
18
19
4
Figure 4: Annual rainfall from 1994 to 2014 at the meteorological station Le Castellet 20
(elevation 417m); the dotted black line represents the mean annual rainfall over the1994-2014 21
period. 22
23
24
25
26
5
27
Figure 5: Rainfall, discharge and salinity time series of the Port-Miou submarine spring at a 28
daily time step (4 years, from 12/16/2010 to 12/11/2014). Highest rainfall events produce 29
high-flood events, with a correlated decrease of salinity. 30
31
32
33

6
34
Figure 6: Cumulative probability plot of daily discharge data at the Port-Miou spring 35
(Period 1 and 2 referred to time series from 16 Dec. 2010 to 12 Jun. 2012, and from 21 Oct. 36
2013 to 11 Dec. 2014, respectively). 37
38
39
40
7
41
Figure 7: Salinity vs. discharge (mean daily data) measured at the Port-Miou submarine 42
spring, from 16 Dec. 2010 to 11 Dec. 2014 (missing data from 06/12/12 to 10/20/13). The 43
maximum salinity value was observed during the low flow period in summer 2005 and 2006 44
by Cavalera (2007). A mixing equation is fitted, for a constant discharge of brackish water 45
(Salinity = 14g/l, Discharge =3.6 m3/s), and for a varying discharge of freshwater (Salinity = 46
0.5 g/l). 47
48
49
50
8
51
Figure 8: Conceptual model of the hydrogeological functioning of the Port-Miou coastal 52
karst aquifer, showing the mixing of brackish water due to seawater intrusion in the aquifer in 53
depth with freshwater from the shallower aquifer. 54
55
56
57
58
9
Figure 9: Simulation results for (a) calibration on Period 1 (Dec. 2010 to Jun. 2012) and 59
validation on Period 2(Oct. 2013 to Dec. 2014), and for (b) calibration on Period 2 and 60
validation on Period 1. Simulated discharge is split in 3 components related to the FAST, 61
SLOW, and DEEP reservoirs. 62
63
64
65
66
10
Figure 9 (continue) 67
68
69
70
71
11
72
Figure 10: Simulation results over the whole period available (Dec. 2010 to Dec. 2014) 73
showing the water level variations in the FAST, SLOW, and DEEP reservoirs. #1 and #2 refer 74
respectively to calibration on Period 1 and Period 2. Note the missing discharge data from 75
Jun. 2012 to Oct. 2013. 76
77
78
79
80
81
12
82
Figure 11: Three types of relationships between Seawater discharge (QSW) and Freshwater 83
discharge (QFW) at a karstic brackish spring for “Venturi suction effect”, “Head balance 84
process” and “Dilution”. 85
86
87