Embed Size (px)
Citation preview
Journal of Geophysical Research: Solid Earth
Insights into anisotropy development and weakeningof ice from in situ P wave velocity monitoringduring laboratory creep
M. J. Vaughan1 , D. J. Prior1 , M. Jefferd2 , N. Brantut2 , T. M. Mitchell2 , and M. Seidemann1
1Department of Earth Sciences, University of Otago, Dunedin, New Zealand, 2Rock and Ice Physics Laboratory, Departmentof Earth Sciences, University College London, London, UK
Abstract Polycrystalline ice weakens significantly after a few percent strain, during high homologoustemperature deformation. Weakening is correlated broadly with the development of a crystallographicpreferred orientation (CPO). We deformed synthetic polycrystalline ice at −5∘C under uniaxial compression,while measuring ultrasonic P wave velocities along several raypaths through the sample. Changes inmeasured P wave velocities (Vp) and in the velocities calculated from microstructural measurements ofCPO (by cryo-electron backscatter diffraction) both show that velocities along trajectories parallel andperpendicular to shortening decrease with increasing strain, while velocities on diagonal trajectoriesincrease. Thus, in these experiments, velocity data provide a continuous measurement of CPO evolution increeping ice. Samples reach peak stresses after 1% shortening. Weakening corresponds to the start of CPOdevelopment, as indicated by divergence of P wave velocity changes for different raypaths, and initiates at≈3% shortening. Selective growth by strain-induced grain boundary migration (GBM) of grains favorablyoriented for basal slip may initiate weakening through the formation of an interconnected network ofthese grains by 3% shortening. After weakening initiates, CPO continues to develop by GBM and nucleationprocesses. The resultant CPO has an open cone (small circle) configuration, with the cone axis parallel toshortening. The development of this CPO causes significant weakening under uniaxial compression, wherethe shear stresses resolved on the basal planes (Schmid factors) are high.
1. Introduction
At terrestrial conditions, ice 1h exhibits high viscoplastic anisotropy, with dislocation glide being easiest bymore than an order of magnitude along basal planes [Duval et al., 2010; Duval and Castelnau, 1995]. This leadsto the development of strong crystallographic preferred orientations (CPOs) during deformation in the dislo-cation creep regime. CPOs change the creep behavior significantly [Azuma, 1995], generally weakening theice for flow compared to a random CPO. However, CPOs evolve as ice accumulates strain [Faria et al., 2014;Wilson et al., 2014] and any change in deformation kinematics, flow stress, or temperature will likely modifythe CPO and resultant micromechanics of creep.
With an ever increasing interest in the role polar ice sheets play in controlling sea level rise, understandingthe flow of ice on the microstructural scale has become increasingly important [Llorens et al., 2016; Montagnatet al., 2014]. An improved knowledge of large-scale ice dynamics, and thus our ability to predict futurechanges of ice sheets, is limited by our understanding of the microstructural mechanics of ice [Alley, 1992;Treverrow et al., 2015]. Constraining the mechanisms and rates by which CPOs and corresponding mechani-cal behavior evolve will be crucial to understanding how ice flow properties develop as boundary conditionschange (e.g., grounding zones where ice streams flow into ice shelves), in the Antarctic or Greenland icesheets [Bamber et al., 2000; Rignot et al., 2011; Zwinger et al., 2014]. It is fundamentally important to under-stand the response of ice sheets to climate change and their future contributions to sea level rise [Pollard andDeConto, 2009].
In laboratory experiments, ice weakens after very small strains, corresponding to the transition from sec-ondary to tertiary creep. At high homologous temperatures (temperature of a material as a fraction of itsmelting point temperature, in degrees Kelvin), weakening and associated CPO development is strongly influ-enced by mechanisms of dynamic recrystallization, which relax the internal stress fields induced by strong
RESEARCH ARTICLE10.1002/2017JB013964
Key Points:• In situ measurements of elastic wave
velocity evolution during the ductiledeformation of ice can be used as aproxy for CPO evolution
• Weakening at almost equal to 3%axial shortening may result fromconnected networks of grains welloriented for basal slip in themacroscopic stress field
• CPO development starts at theonset of weakening; the evolution ofCPO leads to significant mechanicalweakening in vertical shortening
Supporting Information:• Supporting Information S1
Correspondence to:M. J. Vaughan,[email protected]
Citation:Vaughan, M. J., D. J. Prior, M. Jefferd,N. Brantut, T. M. Mitchell, andM. Seidemann (2017), Insightsinto anisotropy development andweakening of ice from in situ Pwave velocity monitoring dur-ing laboratory creep, J. Geophys.Res. Solid Earth, 122, 7076–7089,doi:10.1002/2017JB013964.
Received 9 JAN 2017
Accepted 6 AUG 2017
Accepted article online 10 AUG 2017
Published online 12 SEP 2017
The copyright line for this article was
changed on 9 FEB 2018 after original
online publication.
©2017. The Authors.This is an open access article under theterms of the Creative CommonsAttribution License, which permits use,distribution and reproduction in anymedium, provided the original work isproperly cited.
VAUGHAN ET AL. VELOCITY MONITORING DURING CREEP IN ICE 7076
Journal of Geophysical Research: Solid Earth 10.1002/2017JB013964
strain heterogeneities between neighboring grains [Duval et al., 1983; Schulson et al., 2009]. Nucleation pro-cesses associated with recrystallization in ice [Chauve et al., 2017a] must also play a role, as decreases in mediangrain sizes have been observed as a function of strain [Montagnat et al., 2015; Piazolo et al., 2013; Peternell andWilson, 2016]. At high temperatures, CPOs evolve dominantly through recrystallization by rapid grain bound-ary migration (GBM), termed “migration recrystallization” [Thorsteinsson et al., 1997; De La Chapelle et al., 1998;Montagnat et al., 2015] in the glaciological community. While macroscopic weakening is broadly related to thecombination of CPO development and mechanisms of dynamic recrystallization [De La Chapelle et al., 1998;Faria et al., 2014; Hudleston, 2015; Piazolo et al., 2013; Wilson et al., 2014], a comprehensive and satisfactoryunderstanding of this relationship does not currently exist, for ice or other rock-forming minerals.
The majority of ice deformation experiments that show microstructures and CPOs do so for the start and endof experiments only. Some studies conduct several experiments with equivalent starting materials to differentfinite strains [e.g., Jacka and Maccagnan, 1984; Montagnat et al., 2015] to get a strain series. Quasi-continuousCPO and grain size measurements have been made during deformation experiments using neutron diffrac-tion [Piazolo et al., 2013; Wilson et al., 2014, 2015; Cyprych et al., 2016]. Quasi-continuous microstructuralanalysis and CPO measurements have also been made using synkinematic optical microscopy [Peternell et al.,2014; Wilson et al., 2014; Peternell and Wilson, 2016]. These experiments that track the development of CPO asa function of strain (or time) provide new insight into the relationships of CPO development to mechanicalevolution. The methods used have limitations. The neutron beam approach requires D2O ice, becomes prob-lematic for nonsymmetric samples, and, because experiments need to be fast (beam time is limited), is limitedto high strain rates. The experiments are unconfined so that high temperatures are required to allow highstrain rates. The synkinematic microscopy approaches have limited sample sizes and do not provide robustmechanical data. We looked to ultrasonic wave velocities to provide quasi-continuous measurements of CPOevolution during ice experiments.
Much work has been undertaken to quantify the relationship between CPO and elastic wave velocityanisotropy using measurements in natural samples and boreholes [Kohnen and Gow, 1979; Bentley, 1972;Anandakrishnan and Alley, 1994; Gusmeroli et al., 2012; Kluskiewicz et al., 2017], modeling techniques [Diezand Eisen, 2015; Maurel et al., 2015], and recently to infer CPO from active-source seismic field measurements[Picotti et al., 2015; Vélez et al., 2016] and passive listening to natural events at the base of flowing ice [Smithet al., 2017; Harland et al., 2013]. In situ real-time ultrasonic velocity measurements have been used to mon-itor physical property evolution during brittle rock deformation experiments [Ayling et al., 1995; Guillaumeet al., 1997; Fortin et al., 2007; Stanchits et al., 2010; Fortin et al., 2011; Brantut et al., 2011, 2014]. Experimentsthat make such measurements during high-temperature ductile creep have only been achieved with metals[Hirao et al., 1990; Tang et al., 2007] and never before with rock or ice samples.
In this paper we make in situ ultrasonic velocity measurements during deformation experiments on ice at highhomologous temperatures. We chose deformation conditions and kinematics where the CPOs are already wellknown [Budd and Jacka, 1989; Wilson et al., 2014; Montagnat et al., 2015] so that we can assess fully the newinformation from the ultrasonic velocity measurements. Our approach was to conduct experiments to differ-ent final strains, with repeated (every 5 min) P wave velocity measurements, so that final microstructures andCPO measured using cryo-electron backscatter diffraction (cryo-EBSD) [Prior et al., 2015] could be comparedwith P wave velocity data at the end of each experiment. The overall objective was to assess ultrasonic velocitymeasurements as a proxy for CPO development during ice deformation and to explore the new informationthat the proxy yields.
2. Methods
In this section, we outline the details of sample manufacturing and the deformation conditions (2.1), themeasurement of ultrasonic travel times (2.2), and the acquisition of cryo-EBSD data (2.3).
2.1. Samples and DeformationWe prepared cylindrical samples (40 mm diameter, 95–100 mm long) of polycrystalline ice (derived from dis-tilled and deionized water) using the “standard” ice method [Stern et al., 1997]. We began by filling a mold(supporting information Figure S1) with controlled grain size seed ice (200–250 μm), evacuating the air outof the mold and flooding it with degassed (by boiling) water at 0∘C. Once flooded, we encased the samplesin an insulated sleeve and placed them in a chest freezer at −30∘C. We froze the samples uniaxially from thebase (with the bottom of the sample mold resting on a cold copper plate) to prevent cracking, extracted them,
VAUGHAN ET AL. VELOCITY MONITORING DURING CREEP IN ICE 7077
Journal of Geophysical Research: Solid Earth 10.1002/2017JB013964
Figure 1. Schematic diagram of sample chamber and sample assembly configuration for unconfined uniaxial shorteningwith in situ ultrasonic measurements. The sample was immersed in a silicon oil bath. The oil temperature was controlledusing a Peltier element linked to a temperature controller and k type thermocouple. Heat was removed by a liquidcooled heat sink designed for cooling computer components. Uniaxial compression was supplied by an Instronservohydraulic press controlled by a LabView interface. Displacement rate was controlled by a displacement transducercoupled to the piston. The transducers were coupled to the sample using spring-loaded mounting rings which providedprecise positioning control and coupling. Load was recorded using an in-line load cell. Temperature was monitored andrecorded on LabView using a National Instruments thermocouple module on four channels.
made rough cuts to approximate length using a band saw, and machined the samples on a lathe to producethe final cylindrical shape. The starting material had a homogeneous microstructure, a random CPO, a meangrain size of 360 μm and up to ≈1% porosity.
The sample assembly consisted of two 42 mm diameter alumina platens on either end of the sample, toppedwith a hardwood piston, and bounded on the bottom by a hardwood disc (Figure 1). We place a hemispher-ical seat between the upper wooden piston and the loading piston. These components were held in line bya custom neoprene jacket. We placed the sample assembly in an insulated, thermoelectrically cooled (Peltierceramic) aluminum sample chamber (see Vaughan et al. [2016] for a full description of the sample chamber)filled with silicone oil (dimethylsiloxane, 0.965 g/cm3), kept in circulation using a small self-priming pump(TM200S-SUB from TCS Micropumps) in order to homogenize the temperature of the cooling medium. Atemperature controller (Carel IR33 Universale Proportional integral derivative (PID)) maintained the systemoil temperature within ±0.5∘C of the target temperature using feedback from a k-type thermocouple placedinside the chamber. Fluctuations in oil temperature (Figure 4c) were an order of magnitude more than thosein the ice sample (supporting information Figure S2).
A uniaxial servohydraulic press was used as a deformation apparatus (Servotechnique, UCL Rock PhysicsLab) with displacement rate controlled by a high-precision linear variable differential transducer (LVDT). Werecorded load and displacement continuously on a LabView and national instruments data acquisition card
VAUGHAN ET AL. VELOCITY MONITORING DURING CREEP IN ICE 7078
Journal of Geophysical Research: Solid Earth 10.1002/2017JB013964
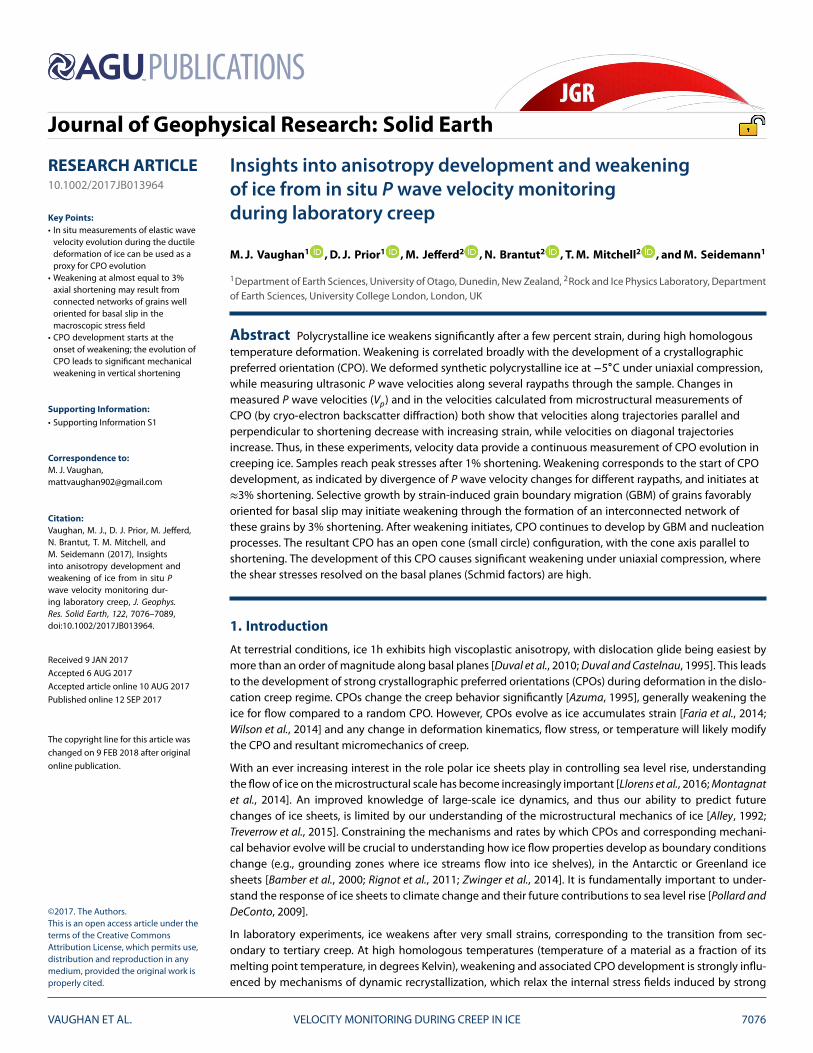
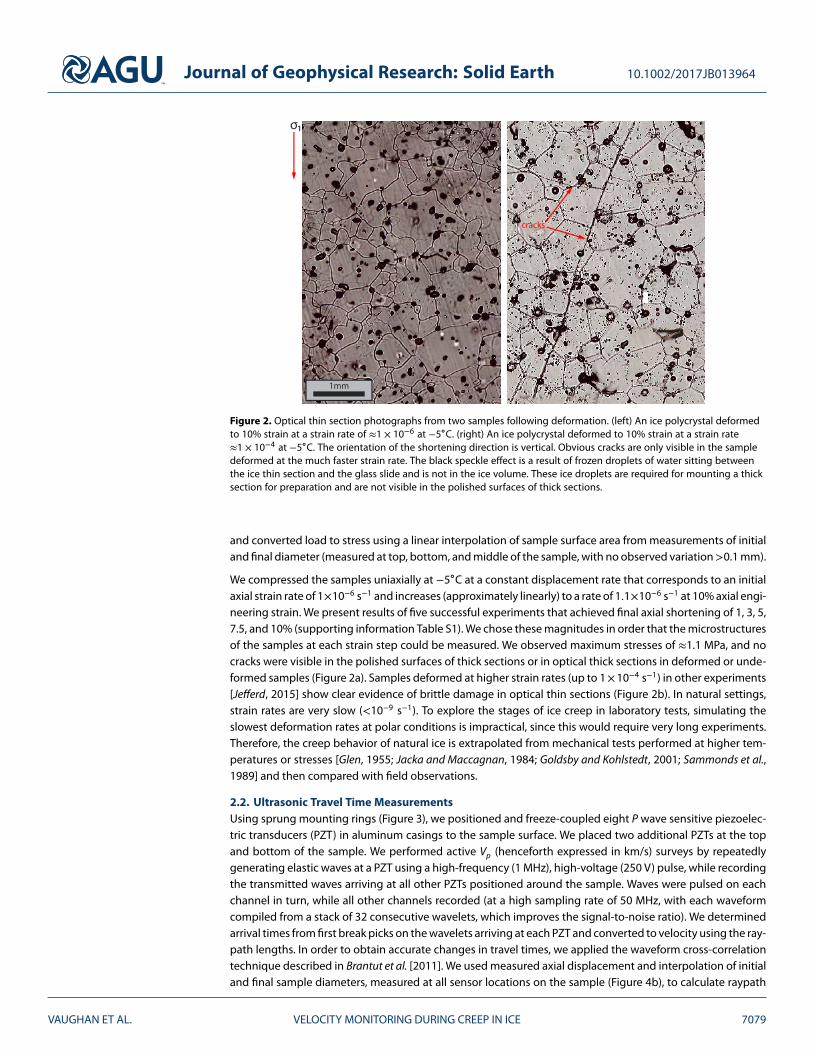
Figure 2. Optical thin section photographs from two samples following deformation. (left) An ice polycrystal deformedto 10% strain at a strain rate of ≈1 × 10⁻⁶ at −5∘C. (right) An ice polycrystal deformed to 10% strain at a strain rate≈1 × 10⁻⁴ at −5∘C. The orientation of the shortening direction is vertical. Obvious cracks are only visible in the sampledeformed at the much faster strain rate. The black speckle effect is a result of frozen droplets of water sitting betweenthe ice thin section and the glass slide and is not in the ice volume. These ice droplets are required for mounting a thicksection for preparation and are not visible in the polished surfaces of thick sections.
and converted load to stress using a linear interpolation of sample surface area from measurements of initialand final diameter (measured at top, bottom, and middle of the sample, with no observed variation>0.1 mm).
We compressed the samples uniaxially at −5∘C at a constant displacement rate that corresponds to an initialaxial strain rate of 1×10⁻⁶ s−1 and increases (approximately linearly) to a rate of 1.1×10⁻⁶ s−1 at 10% axial engi-neering strain. We present results of five successful experiments that achieved final axial shortening of 1, 3, 5,7.5, and 10% (supporting information Table S1). We chose these magnitudes in order that the microstructuresof the samples at each strain step could be measured. We observed maximum stresses of ≈1.1 MPa, and nocracks were visible in the polished surfaces of thick sections or in optical thick sections in deformed or unde-formed samples (Figure 2a). Samples deformed at higher strain rates (up to 1×10⁻⁴ s−1) in other experiments[Jefferd, 2015] show clear evidence of brittle damage in optical thin sections (Figure 2b). In natural settings,strain rates are very slow (<10−9 s−1). To explore the stages of ice creep in laboratory tests, simulating theslowest deformation rates at polar conditions is impractical, since this would require very long experiments.Therefore, the creep behavior of natural ice is extrapolated from mechanical tests performed at higher tem-peratures or stresses [Glen, 1955; Jacka and Maccagnan, 1984; Goldsby and Kohlstedt, 2001; Sammonds et al.,1989] and then compared with field observations.
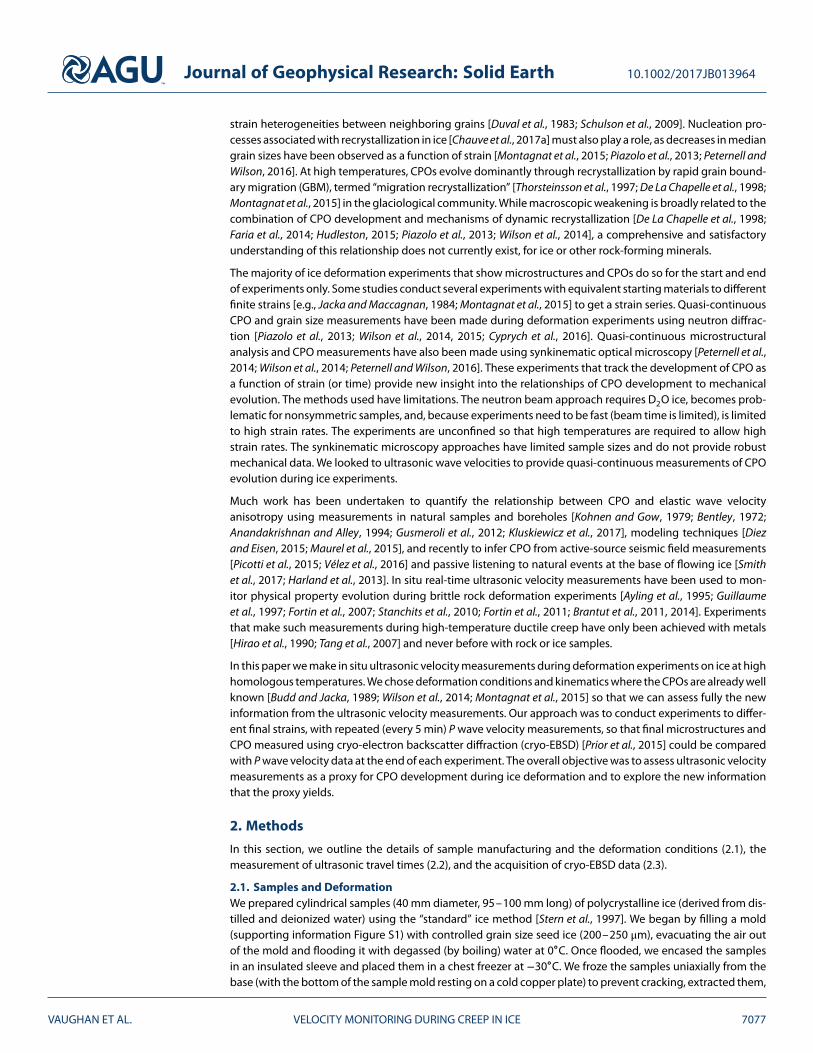
2.2. Ultrasonic Travel Time MeasurementsUsing sprung mounting rings (Figure 3), we positioned and freeze-coupled eight P wave sensitive piezoelec-tric transducers (PZT) in aluminum casings to the sample surface. We placed two additional PZTs at the topand bottom of the sample. We performed active Vp (henceforth expressed in km/s) surveys by repeatedlygenerating elastic waves at a PZT using a high-frequency (1 MHz), high-voltage (250 V) pulse, while recordingthe transmitted waves arriving at all other PZTs positioned around the sample. Waves were pulsed on eachchannel in turn, while all other channels recorded (at a high sampling rate of 50 MHz, with each waveformcompiled from a stack of 32 consecutive wavelets, which improves the signal-to-noise ratio). We determinedarrival times from first break picks on the wavelets arriving at each PZT and converted to velocity using the ray-path lengths. In order to obtain accurate changes in travel times, we applied the waveform cross-correlationtechnique described in Brantut et al. [2011]. We used measured axial displacement and interpolation of initialand final sample diameters, measured at all sensor locations on the sample (Figure 4b), to calculate raypath
VAUGHAN ET AL. VELOCITY MONITORING DURING CREEP IN ICE 7079

Journal of Geophysical Research: Solid Earth 10.1002/2017JB013964
Figure 3. A photograph of the (a) sample assembly prior to deformation, (b) shown diagrammatically. The ice samplewas surrounded by eight side transducers and two end transducers. Each sensor was housed in a custom aluminumcasing that maintained the connection to a coaxial cable. Coupling between the sample and each sensor wasmaintained by spring-loaded sensor rings. The sample and pistons were held in alignment by rubber jacketing.
lengths as a function of sample shortening. Elastic length changes were too small to affect calculated veloc-
ities significantly. Adjustments for travel time through the PZT sensor casings were applied to the arrival
times. We estimate the error on changes in velocity along a single raypath at <±0.01 km/s, which relates
to how accurately we could measure sample diameter. Absolute measurements of velocity can be affected
Figure 4. Stress, sample diameter, and temperature with strain, and displacement with time, during five uniaxialshortening experiments. (a) Stress versus strain curves, derived from combined load (load cell) and LVDT data. Maximum% strain for each experiment is indicated. (b) Measured sample diameters (from caliper measurements, averaged fromseveral points on the sample) after unloading and model diameters (Model 1 = constant volume. Model 2 = nodiameter change until 1% shortening, then constant volume) versus strain. (c) Oil bath temperatures were recordedthroughout the experiments at four depths in the chamber, with an observed deviation of <0.1∘C from the mean.
VAUGHAN ET AL. VELOCITY MONITORING DURING CREEP IN ICE 7080
Journal of Geophysical Research: Solid Earth 10.1002/2017JB013964
by any nonuniform distribution of porosity within the sample, or slight variations in the quality of the cou-pling between the sample and each transducer. We estimate these effects on absolute velocity calculationsto be <±0.05 km/s.
2.3. Cryo-EBSDWe acquired EBSD maps using a Zeiss Sigma VP FEGSEM fitted with on Oxford Instruments Nordlys cameraand AZTEC software. Modifications required for cryo-EBSD are described in Prior et al. [2015]. We cut ≈1 cmthick, parallel-sided slices, along the cylinder axis of each deformed sample and one undeformed referencesample, and manually polished them at −60∘C on fine-grit diamond disks. We removed frost and surfacedamage by pressure sublimation cycling in the scanning electron microscope chamber [Prior et al., 2015]. Wecollected EBSD maps at a stage temperature of ≈ −90∘C with 30 kV accelerating voltage, 60 nA beam current,10 Pa partial pressure nitrogen at a 40 μm step size. We generated montage maps to capture large areas of thesamples, with the largest maps generated being over 30 mm in their longest dimension, characterizing themajority of the sample surface and providing robust statistical parameters. The stability of the sample surfaceat these very low temperatures made it possible to acquire such large data sets. We processed the raw EBSDdata using the band contrast as a template [Pearce, 2015] and generated microstructural information usingthe open-source MTEX toolbox [Bachmann et al., 2011]. We use eigenvectors calculated from the EBSD datato describe the shape and strength of alignment of c axes [Woodcock, 1977]. The eigenvalues (magnitudes ofthe eigenvectors) sum to 1 and by convention a1 ≤ a2 ≤ a3.
3. Results3.1. Mechanical DataThe stress-strain curves (Figure 4a) indicate hardening during shortening from 0 to ≈1%. At ≈1% shortening,peak stresses between 1.1 and 1.2 MPa are reached. Stresses remain at peak values up to the onset of weak-ening between 2.5 and 3% shortening. The maximum rate of weakening is between 3% and 5% shortening,corresponding to a stress drop to 0.75 MPa. Weakening rate decreases continually with further shorteningwith stresses at 0.55 to 0.6 MPa at 7.5% and 0.5 MPa at 10%. These mechanical results are comparable to thoseobtained in slightly faster, constant displacement rate experiments (with initial strain rates of 2–2.5×10⁻⁶ s−1)by Qi et al. [2017], on H2O ice at −10∘C, and by Piazolo et al. [2013] on D2O ice at −7∘C (which correspondsto −10.7∘C for H2O). In those experiments peak stresses, while higher, occurred at the same magnitudes ofstrain, as did the onset of weakening and the approach to quasi steady state creep (≈10% strain). In ourslower, higher-temperature experiments, the samples underwent a larger degree of weakening, reducing inmacroscopic strength by ≈0.5 times peak stress.
Sample diameter remains unchanged after 1% shortening and unloading. A permanent sample diameterincrease is measured in all samples with 3% or more shortening (Figure 4b). These data fit a model wherevolume is conserved beyond 1% of uniaxial shortening (Model 2 in Figure 4b) except for results at 6.8, and7.5% shortening where the diameter increase is less than this model predicts. The low-amplitude oscillationsin stress during these experiments are related to oscillations in oil temperature of the cryostat (Figure 4c),and not to oscillation in displacement rate with time. The pattern of mechanical behavior described aboveis observed in repeat experiments, where samples were deformed to 10% strain under the same conditions(supporting information Figure S3).
3.2. Microstructure, Crystallographic Preferred Orientation, and AnisotropyThe content of this paper is of interest to at least three distinct research communities; glaciology, geology,and materials science. There are differences in terminology between these communities and to maximizeclarity we outline briefly here our chosen terminology. CPO (crystallographic preferred orientation) is a termused extensively in the geoscience literature and is synonymous with LPO (lattice preferred orientation,also a geoscience term), COF (crystal orientation fabric, used in glaciology), fabric (used in glaciology andgeology) and texture (used in material science and metallurgy). We avoid the terms fabric and texture asthey have opposite meanings for geoscientists and material scientists. CPOs in ice are usually describedbased on the pattern of c axes on a stereonet (pole figure). Common patterns [e.g., Alley, 1992] includethe following:
1. The c axes are subparallel to each other. We call this a cluster CPO as the points on the stereonet form acluster or single maximum. Some glaciological literature calls this a cone, as the bounding surface of thedistribution is conical.
VAUGHAN ET AL. VELOCITY MONITORING DURING CREEP IN ICE 7081

Journal of Geophysical Research: Solid Earth 10.1002/2017JB013964
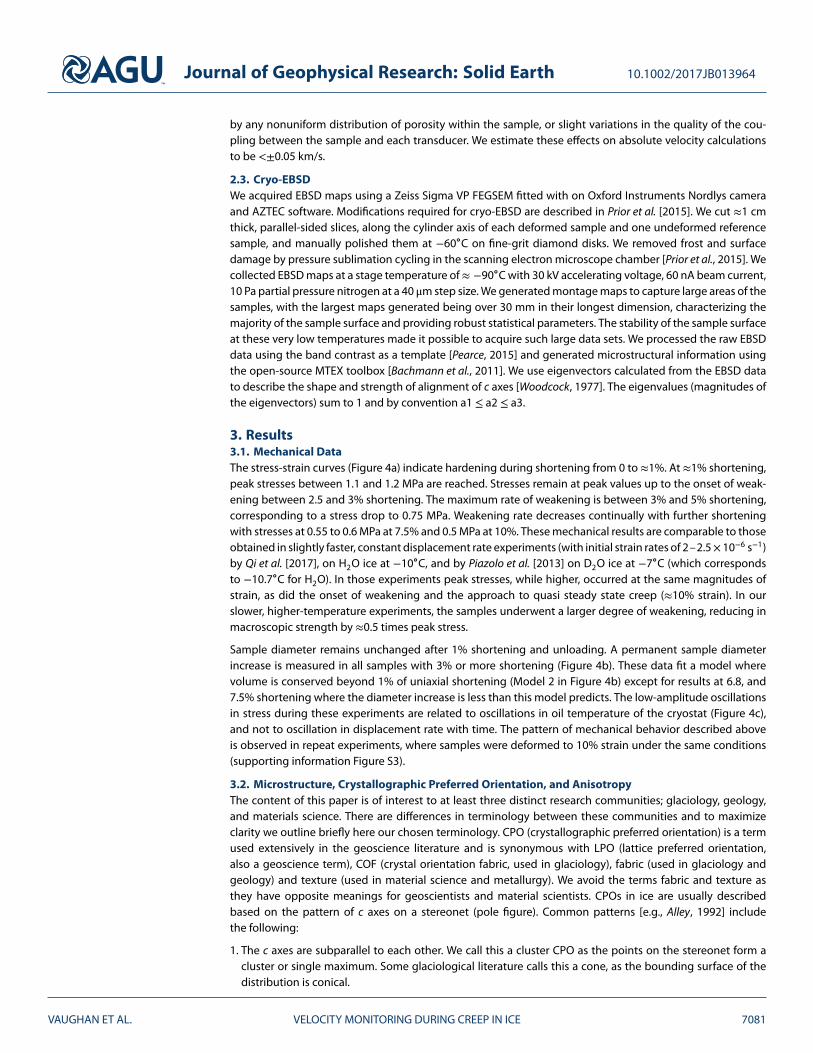
Figure 5. EBSD data sets from each deformed sample and one reference sample, with their respective pole figures andpredictions of elastic wave velocity and anisotropy for each strain step, deformed at −5∘C. (a) EBSD data from eachsample are coloured by Schmid factor, a measure of the shear stress resolved on the basal planes (0–0.5). We showsubsets of larger full data sets so that microstructural detail can be seen. Grain size data for each sample are presentedas the median area equivalent diameter in micrometers, with the number of grains in each complete data set. (b) c axispole figures in upper hemisphere projection, each with 2 × 10⁴ randomly selected points from the complete data sets.(c) Vp velocity predictions from CPO, with the magnitude (%) of Vp anisotropy below each pole figure. (d) Shear wavesplitting anisotropy (%) as a function of propagation direction through the sample, predicted from CPO data. Theorientation of the maximum principal stress, 𝜎1, is vertical.
VAUGHAN ET AL. VELOCITY MONITORING DURING CREEP IN ICE 7082
Journal of Geophysical Research: Solid Earth 10.1002/2017JB013964
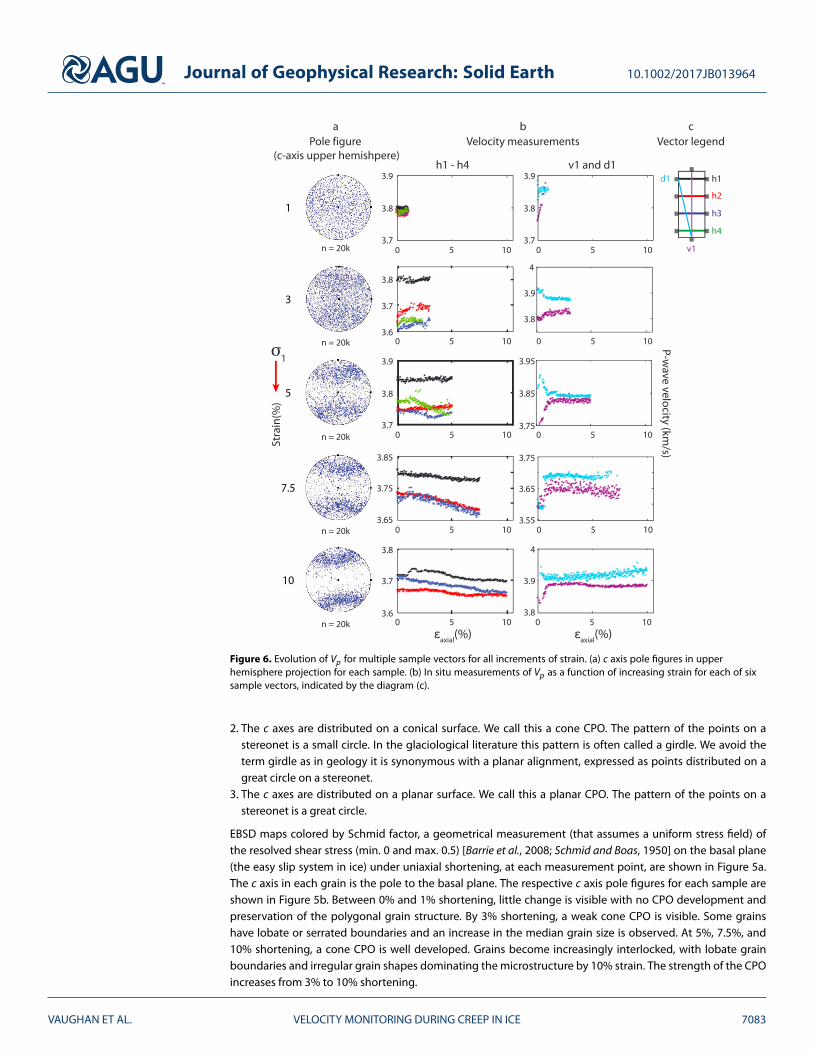
Figure 6. Evolution of Vp for multiple sample vectors for all increments of strain. (a) c axis pole figures in upperhemisphere projection for each sample. (b) In situ measurements of Vp as a function of increasing strain for each of sixsample vectors, indicated by the diagram (c).
2. The c axes are distributed on a conical surface. We call this a cone CPO. The pattern of the points on astereonet is a small circle. In the glaciological literature this pattern is often called a girdle. We avoid theterm girdle as in geology it is synonymous with a planar alignment, expressed as points distributed on agreat circle on a stereonet.
3. The c axes are distributed on a planar surface. We call this a planar CPO. The pattern of the points on astereonet is a great circle.
EBSD maps colored by Schmid factor, a geometrical measurement (that assumes a uniform stress field) ofthe resolved shear stress (min. 0 and max. 0.5) [Barrie et al., 2008; Schmid and Boas, 1950] on the basal plane(the easy slip system in ice) under uniaxial shortening, at each measurement point, are shown in Figure 5a.The c axis in each grain is the pole to the basal plane. The respective c axis pole figures for each sample areshown in Figure 5b. Between 0% and 1% shortening, little change is visible with no CPO development andpreservation of the polygonal grain structure. By 3% shortening, a weak cone CPO is visible. Some grainshave lobate or serrated boundaries and an increase in the median grain size is observed. At 5%, 7.5%, and10% shortening, a cone CPO is well developed. Grains become increasingly interlocked, with lobate grainboundaries and irregular grain shapes dominating the microstructure by 10% strain. The strength of the CPOincreases from 3% to 10% shortening.
VAUGHAN ET AL. VELOCITY MONITORING DURING CREEP IN ICE 7083
Journal of Geophysical Research: Solid Earth 10.1002/2017JB013964
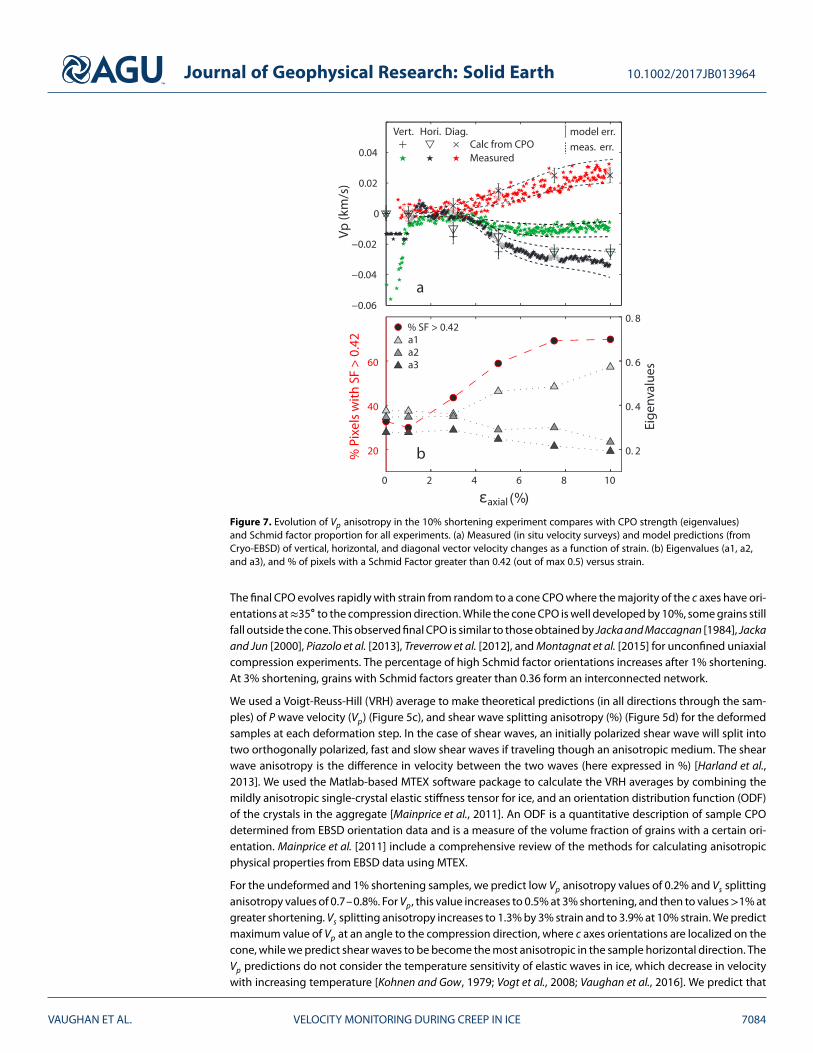
Figure 7. Evolution of Vp anisotropy in the 10% shortening experiment compares with CPO strength (eigenvalues)and Schmid factor proportion for all experiments. (a) Measured (in situ velocity surveys) and model predictions (fromCryo-EBSD) of vertical, horizontal, and diagonal vector velocity changes as a function of strain. (b) Eigenvalues (a1, a2,and a3), and % of pixels with a Schmid Factor greater than 0.42 (out of max 0.5) versus strain.
The final CPO evolves rapidly with strain from random to a cone CPO where the majority of the c axes have ori-entations at≈35∘ to the compression direction. While the cone CPO is well developed by 10%, some grains stillfall outside the cone. This observed final CPO is similar to those obtained by Jacka and Maccagnan [1984], Jackaand Jun [2000], Piazolo et al. [2013], Treverrow et al. [2012], and Montagnat et al. [2015] for unconfined uniaxialcompression experiments. The percentage of high Schmid factor orientations increases after 1% shortening.At 3% shortening, grains with Schmid factors greater than 0.36 form an interconnected network.
We used a Voigt-Reuss-Hill (VRH) average to make theoretical predictions (in all directions through the sam-ples) of P wave velocity (Vp) (Figure 5c), and shear wave splitting anisotropy (%) (Figure 5d) for the deformedsamples at each deformation step. In the case of shear waves, an initially polarized shear wave will split intotwo orthogonally polarized, fast and slow shear waves if traveling though an anisotropic medium. The shearwave anisotropy is the difference in velocity between the two waves (here expressed in %) [Harland et al.,2013]. We used the Matlab-based MTEX software package to calculate the VRH averages by combining themildly anisotropic single-crystal elastic stiffness tensor for ice, and an orientation distribution function (ODF)of the crystals in the aggregate [Mainprice et al., 2011]. An ODF is a quantitative description of sample CPOdetermined from EBSD orientation data and is a measure of the volume fraction of grains with a certain ori-entation. Mainprice et al. [2011] include a comprehensive review of the methods for calculating anisotropicphysical properties from EBSD data using MTEX.
For the undeformed and 1% shortening samples, we predict low Vp anisotropy values of 0.2% and Vs splittinganisotropy values of 0.7–0.8%. For Vp, this value increases to 0.5% at 3% shortening, and then to values>1% atgreater shortening. Vs splitting anisotropy increases to 1.3% by 3% strain and to 3.9% at 10% strain. We predictmaximum value of Vp at an angle to the compression direction, where c axes orientations are localized on thecone, while we predict shear waves to be become the most anisotropic in the sample horizontal direction. TheVp predictions do not consider the temperature sensitivity of elastic waves in ice, which decrease in velocitywith increasing temperature [Kohnen and Gow, 1979; Vogt et al., 2008; Vaughan et al., 2016]. We predict that
VAUGHAN ET AL. VELOCITY MONITORING DURING CREEP IN ICE 7084

Journal of Geophysical Research: Solid Earth 10.1002/2017JB013964
P waves propagating horizontally or vertically through the sample will show a progressive decrease in wavespeeds with increasing CPO strength, while diagonal vectors are predicted to increase in velocity, approachinga maximum around 10% shortening. In the case of single cluster fabrics, one would anticipate the highest Vp
raypaths to align with orientation of the cluster, as is predicted in models [Maurel et al., 2015; Diez and Eisen,2015] and measured in natural ice core samples [Kohnen and Gow, 1979; Kohnen and Bentley, 1977]. Indeed,Smith et al. [2017] were able to make interpretations of subsurface ice fabrics using field seismic observationsof shear wave data (although the anisotropy of a cone CPO geometry was not considered in their analysis).
3.3. Ultrasonic Velocity MeasurementsResults of the in situ velocity surveys from each experiment are presented in Figure 6 as a function of increas-ing strain and the evolution of CPO. Changes in Vp along a horizontal, vertical (parallel to shortening), and adiagonal wave paths through the sample are shown. Vp for the vertical and horizontal vectors shows a smallincrease between 0% and 1% shortening. The horizontal vectors Vp begin to decrease after 2% to 3% shorten-ing, with most of the change developing between 3% and 7.5%. Vertical Vp remains constant from 1% to 3%shortening and then decreases with further shortening. First arrival picks on the diagonal vector in the first1% shortening have very high uncertainties (likely due to poor coupling of the top and bottom transducersat low stress), leading to variable velocity trends. After 3% shortening the diagonal vector Vp increases withfurther strain.
Figure 7a compares the results of Vp anisotropy modeled from the EBSD orientations to in situ measurementsof Vp, from the 10% shortening experiment. We show good agreement between calculated and measuredvelocity changes for the horizontal and diagonal vectors. The decrease in measured vertical velocities is less(≈0.01 km/s) than that predicted from the CPO (0.025 km/s) but shows the same trend. Most of the change invelocity develops between 3 and 7.5% shortening, corresponding to the biggest change in CPO strength asshown by c axis eigenvalue data [in Figure 7b Woodcock, 1977].
4. Discussion
The constant sample diameter, rapid increase in vertical velocities, and lack of microstructural and CPO devel-opment in the first 1% of shortening suggests that this phase is partially accommodated by pore collapse anda small component of recoverable elastic strain. This hardening stage is often referred to as “primary creep”and involves the redistribution of internal stresses between grains [Duval et al., 1983] and dislocation accu-mulation at grain boundaries [Montagnat et al., 2009]. Primary creep may also involve load transfer from easyslip to hard slip systems [Faria et al., 2014] and evidence for this is rare [Piazolo et al., 2015; Vaughan, 2017]. Itis anticipated that during this stage, strain incompatibilities between the grains will lead to the accumulationof heterogeneous internal stresses [Piazolo et al., 2015], and therefore heterogeneous strain, as a triggeringmechanism for recrystallization.
Microstructure and CPO development starts after 1% shortening. Divergence of velocities along differentelastic wave propagation directions and divergence of CPO eigenvalues does not start until 3% shortening(Figure 7b), suggesting that CPO only starts to develop and impact anisotropy at ≈3% strain. Microstructuredoes change between 1% and 3%, with development of lobate grain boundaries, an increase in grain sizefrom 355 to 425 μm (median area equivalent diameter, Figure 5a), and an increase in the percentage of pixelswith high Schmid factors (Figure 7b). CPO evolution likely initiates with rotation of grains toward the shorten-ing direction by intracrystalline dislocation slip on basal planes [Weertman, 1973], a mechanism which alonewould result in the formation of a single cluster CPO aligned with the shortening direction.
Microstructural observations in ice [Jacka and Maccagnan, 1984; Duval and Castelnau, 1995; De La Chapelleet al., 1998] and other minerals [Urai et al., 1986] have been used to infer that strain-induced grain boundarymigration (GBM) favors the growth of grains well oriented for slip. Similarly, we infer that grains with easy sliporientations (those with high basal plane Schmid factors) grow by GBM, into neighboring grains with higherstored strain energies. Grains may rotate to high Schmid factor orientations where they are then able to growby GBM. Grains which are in hard basal slip orientations will experience higher stress and attempt to activatenonbasal slip systems [Chauve et al., 2017b], storing greater magnitudes of internal strain. This is supportedby the observed progressive loss of grains in hard slip orientations with increasing strain. The consumptionof grains nonsuitably oriented for easy slip by grains which are oriented in an easy slip orientation has beenpreviously observed in experimentally deformed quartzite [Kilian et al., 2011]. We infer that deformation after
VAUGHAN ET AL. VELOCITY MONITORING DURING CREEP IN ICE 7085

Journal of Geophysical Research: Solid Earth 10.1002/2017JB013964
≈10% is likely to proceed with the rate of grain rotation (driven by intracrystalline slip by glide on the basalplanes) balanced by the rate at which easy slip grains consume other (rotated) grains. The observation thatcone CPOs often evolve into a stable configuration where c axes dominantly have orientations at 35∘ to theshortening direction, rather than the easiest basal slip orientation of 45∘, may be a product of this balance.
The final CPO configuration observed in these experiments is consistent with previous laboratory observa-tions under similar conditions in dynamically recrystallized ice [among others, Montagnat et al., 2015; Jacka,1984; Piazolo et al., 2013; Jacka and Maccagnan, 1984] where grain boundary migration recrystallizationcoupled with nucleation, and rotation by basal slip are considered the dominant mechanisms controllingCPO evolution.
Substantial weakening (Figure 4a) corresponds to the start of CPO formation and velocity anisotropy devel-opment at 3% shortening (Figures 5 and 7). At 3% shortening, grains with high basal Schmid factors begin togrow at the expense of grains with low basal Schmid factors and dominate the microstructure by 7.5% strain(Figure 5a). If these easy slip grains grow enough to become neighbours, forming an interconnected networkof grains whose basal planes are in alignment, weakening may be accommodated by deformation along sucha network of shear planes.
At least two of our experiments had a component of localized simple shear, expressed as a slight deviationalong the vertical axis of the sample observed post-deformation (supporting information Table S1), and thedeviation of some diameter measurements (Figure 4b) from that predicted (model 2) can be explained bycomponents of simple shear. These minor deviations from homogeneous deformation may result from partiallocalization of strain on shear bands, although these are not obvious in the microstructure.
A decrease in grains size between 3 and 7.5% shortening (425 μm to 349 μm, Figure 5a) is interpreted asthe contribution of nucleation mechanisms to generating new grains. Grain size increases between 7.5% and10% shortening and is interpreted as the continued consumption, by GBM, of low Schmid factor grains thatlie between networks of easy slip grains. Since grain shapes change dramatically between the undeformed(equiaxed grains of uniform size distribution) and deformed samples (highly interlocked, lobate grain shapes),a 2-D sectioning effect could account for a component of this observed change in grain size. Weakening ratereduces after 5% shortening. CPO strength (as indicted by eigenvalues) and the proportion of high Schmidfactor grains approach maximum values at 10% shortening (Figure 7).
We observe that Vp anisotropy increases with increasing strain and CPO strength (as indicated by eigenvalues)and that our model predictions of Vp from EBSD are in close agreement with our in situ measurements forthe horizontal and diagonal vector. Vp progressively increases on the diagonal vector as c axes of the grainsbecome more tightly localized at an approximate 35∘ angle to the compression direction. This observationis similar to opening angle effects predicted by modelling [Maurel et al., 2015], and physical measurements[Gusmeroli et al., 2012] from vertical single maxima CPOs were velocity anisotropy increases as the singlecluster CPO tightens (opening angle decreases). We find that our high-temperature cone CPO has lower pre-dicted and measured magnitudes of Vp and Vs anisotropy than those observed or predicted for single maximaCPOs [Maurel et al., 2015; Harland et al., 2013]. Although our high-temperature CPOs are much less commonlyobserved in natural ice than are single maxima CPOs [De La Chapelle et al., 1998; Obbard et al., 2011], theirimpact on ice flow behavior could be significant. While single cluster CPOs are mechanically hard in verti-cal shortening, the evolution of a cone CPO leads to weakening under vertical shortening and may play animportant role (particularly in high-temperature settings) if uniaxial compression dominates. It is important torecognize the change in the orientation and magnitude of seismic anisotropy that will result from a transitionbetween single cluster and cone CPOs, as the deformation kinematics in an ice sheet vary spatially.
5. Conclusions
Changes in ultrasonic velocity during laboratory ice deformation can be used as a continuous proxy forCPO evolution and can quantify the relationship between velocity anisotropy and CPO development. Ourtime-lapse measurements of ultrasonic velocity in multiple directions for an evolving cone CPO match closelyour predictions of anisotropy derived from EBSD data sets and reveal a detailed nonlinear increase in CPOstrength and anisotropy with increasing strain. It is essential for interpretation of englacial reflections thatthe geometry and magnitude of anisotropy be used to discriminate between cone and cluster CPOs [Horganet al., 2011, 2008]. These two CPO geometries form under different temperature regimes and have contrasting
VAUGHAN ET AL. VELOCITY MONITORING DURING CREEP IN ICE 7086
Journal of Geophysical Research: Solid Earth 10.1002/2017JB013964
impacts on mechanical anisotropy, with cones leading to weakening in uniaxial shortening. While ultrasonicmeasurements have been used as a proxy for single clusters [Gusmeroli et al., 2012], there are no such mea-surements for cone CPOs, nor ultrasonic measurements that reveal the complex way in which CPO and theresulting anisotropy evolve with strain under known deformation conditions.
Substantial weakening at ≈3% axial shortening at −5∘ C may result, in part, from the formation of a con-nected network of grains well oriented for basal slip. CPO development starts at the onset of weakening(3% shortening) and is close to fully developed at 10% shortening. The observed cone CPO is formed by theselective growth of easy slip grains by dislocation density-driven grain boundary migration at the expense ofhard slip grains, because hard slip grains accumulate greater internal strain energy (nonbasal dislocations).Our ultrasonic observations support our suggestion that CPO does not begin to manifest until close to 3%strain. This suggests that grains in easy slip orientations may undergo rotation more readily when neighbor-ing grains well oriented for basal slip, than when surrounded by grains in hard slip orientations. Weakening byconnecting easy slip grains during recrystallization could be mechanism relevant to rocks where grain bound-ary migration is the dominant recrystallization process. Such weakening could be important in localization ofstrain in ice sheets, and the initiation of high-temperature shear zones. Additional analysis is required in orderto further substantiate this network formation hypothesis.
The approach used in these experiments for real-time ultrasonic measurements during unconfined ductilecreep in ice could be applied in a wider range of temperature and stress configurations. For these experiments,we chose to work at higher temperatures because the CPOs and mechanical behavior are already well known,and because the experiments can be executed relatively quickly. We do not infer a relationship to colderconditions, but these experiments are possible, although they present some practical challenges. A modifica-tion of this technique for measurements in simple shear would be of considerable value to the glaciologicalcommunity.
ReferencesAlley, R. B. (1992), Flow-law hypotheses for ice-sheet modeling, J. Glaciol., 38(129), 245–256.Anandakrishnan, S., and R. B. Alley (1994), Ice stream C, Antarctica, sticky spots detected by microearthquake monitoring, Ann. Glaciol.,
20(1), 183–186.Ayling, M. R., P. G. Meredith, and S. A. Murrell (1995), Microcracking during triaxial deformation of porous rocks monitored by changes in
rock physical properties: I. Elastic-wave propagation measurements on dry rocks, Tectonophysics, 245(3), 205–221.Azuma, N. (1995), A flow low for anisotropic polycrystalline ice under uniaxial compressive deformation, Cold Reg. Sci. Technol., 23(2),
137–147, doi:10.1016/0165-232x(94)00011-l.Bachmann, F., R. Hielscher, and H. Schaeben (2011), Grain detection from 2D and 3D EBSD data—Specification of the MTEX algorithm,
Ultramicroscopy, 111(12), 1720–1733, doi:10.1016/j.ultramic.2011.08.002.Bamber, J. L., D. G. Vaughan, and I. Joughin (2000), Widespread complex flow in the interior of the Antarctic Ice Sheet, Science, 287(5456),
1248–1250, doi:10.1126/science.287.5456.1248.Barrie, C., A. Boyle, S. Cox, and D. J. Prior (2008), Slip systems and critical resolved shear stress in pyrite: An electron backscatter diffraction
(EBSD) investigation, Mineral. Mag., 72(6), 1181–1199.Bentley, C. R. (1972), Seismic-wave velocities in anisotropic ice: A comparison of measured and calculated values in and around the deep
drill hole at Byrd Station, Antarctica, J. Geophys. Res., 77(23), 4406–4420.Brantut, N., A. Schubnel, and Y. Gueguen (2011), Damage and rupture dynamics at the brittle-ductile transition: The case of gypsum,
J. Geophys. Res., 116, B01404, doi:10.1029/2010jb007675.Brantut, N., M. J. Heap, P. Baud, and P. G. Meredith (2014), Mechanisms of time-dependent deformation in porous limestone, J. Geophys. Res.
Solid Earth, 119, 5444–5463, doi:10.1002/2014JB011186.Budd, W., and T. Jacka (1989), A review of ice rheology for ice sheet modelling, Cold Reg. Sci. Technol., 16(2), 107–144.Chauve, T., M. Montagnat, F. Barou, K. Hidas, A. Tommasi, and D. Mainprice (2017a), Investigation of nucleation processes during dynamic
recrystallization of ice using cryo-EBSD, Philos. Trans. R. Soc. A: Mathe., Phys. Eng. Sci., 375, 20150345, doi:10.1098/rsta.2015.0345.Chauve, T., M. Montagnat, S. Piazolo, B. Journaux, J. Wheeler, F. Barou, D. Mainprice, and A. Tommasi (2017b), Non-basal dislocations should
be accounted for in simulating ice mass flow, Earth Planet. Sci. Lett., 473, 247–255.Cyprych, D., S. Piazolo, C. J. Wilson, V. Luzin, and D. J. Prior (2016), Rheology, microstructure and crystallographic preferred orientation
of matrix containing a dispersed second phase: Insight from experimentally deformed ice, Earth Planet. Sci. Lett., 449, 272–281.De La Chapelle, S., O. Castelnau, V. Lipenkov, and P. Duval (1998), Dynamic recrystallization and texture development in ice as revealed
by the study of deep ice cores in Antarctica and Greenland, J. Geophys. Res., 103, 5091–5105.Diez, A., and O. Eisen (2015), Seismic wave propagation in anisotropic ice. Part 1: Elasticity tensor and derived quantities from ice-core
properties, The Cryosphere, 9(1), 367–384.Duval, P., and O. Castelnau (1995), Dynamic recrystallization of ice in polar ice sheets, J. Phys. IV , 5(C3), C3–197 – C3-205.Duval, P., M. F. Ashby, and I. Anderman (1983), Rate-controlling processes in the creep of polycrystalline ice, J. Phys. Chem., 87(21),
4066–4074.Duval, P., M. Montagnat, F. Grennerat, J. Weiss, J. Meyssonnier, and A. Philip (2010), Creep and plasticity of glacier ice: A material science
perspective, J. Glaciol., 56(200), 1059–1068.Faria, S. H., I. Weikusat, and N. Azuma (2014), The microstructure of polar ice. Part II: State of the art, J. Struct. Geol., 61, 21–49,
doi:10.1016/j.jsg.2013.11.003.
AcknowledgmentsThis research was supported byMarsden Fund UOO1116, grantedto D.P. by the Royal Society of NewZealand, a University of OtagoResearch Grant, and the Micro-DICEResearch Networking Programmeunder the European ScienceFoundation. N.B. received supportfrom the UK Natural EnvironmentResearch Council through grantNE/K009656/1. M.V. and M.S. weresupported by University of Otagopostgraduate research scholarships.We thank Erin Petit and an anonymousreviewer for extensive constructivecomments on the manuscript. Wethank Pat Langhorne for the useof cold rooms at Otago, and PeterSammonds for use of the cold roomsat UCL. We would like also to thankJim Woods, Peter Fleury, Leo vanRens, Brent Pooley, Steve Boon, JohnBowles, and Neil Hughes for technicaland engineering support. For accessto full data sets, please contact thecorresponding author (M.J. Vaughan).
VAUGHAN ET AL. VELOCITY MONITORING DURING CREEP IN ICE 7087

Journal of Geophysical Research: Solid Earth 10.1002/2017JB013964
Fortin, J., Y. Guéguen, and A. Schubnel (2007), Effects of pore collapse and grain crushing on ultrasonic velocities and VP/VS, J. Geophys. Res.,112, B08207, doi:10.1029/2005JB004005.
Fortin, J., S. Stanchits, S. Vinciguerra, and Y. Guéguen (2011), Influence of thermal and mechanical cracks on permeability andelastic wave velocities in a basalt from Mt. Etna volcano subjected to elevated pressure, Tectonophysics, 503(1), 60–74,doi:10.1016/j.tecto.2010.09.028.
Glen, J. W. (1955), The creep of polycrystalline ice, Philos. Trans. R. Soc. London, Ser. A, 228(1175), 519–538.Goldsby, D., and D. Kohlstedt (2001), Superplastic deformation of ice: Experimental observations, J. Geophys. Res., 106(B6), 11,017–11,030.Guillaume, S., J. D. Mouza, and J. Brulhet (1997), The use of ultrasonics to monitor long-term creep tests of salt rock samples, Geol. Soc.,
London, Eng. Geol. Spec. Publ., 12(1), 373–380.Gusmeroli, A., E. C. Pettit, J. H. Kennedy, and C. Ritz (2012), The crystal fabric of ice from full-waveform borehole sonic logging, J. Geophys.
Res., 117, F03021, doi:10.1029/2012JF002343.Harland, S. R., J. M. Kendall, G. W. Stuart, G. E. Lloyd, A. F. Baird, A. M. Smith, H. D. Pritchard, and A. M. Brisbourne (2013), Deformation
in Rutford ice stream, West Antarctica: Measuring shear-wave anisotropy from icequakes, Ann. Glaciol., 54(64), 105–114,doi:10.3189/2013AoG64A033.
Hirao, M., T. Morishita, and H. Fukuoka (1990), Ultrasonic velocity change with creep damage in copper, Metall. Trans. A, 21(6), 1725–1732.Horgan, H. J., S. Anandakrishnan, R. B. Alley, L. E. Peters, G. P. Tsoflias, D. E. Voigt, and J. P. Winberry (2008), Complex fabric development
revealed by englacial seismic reflectivity: Jakobshavn Isbræ, Greenland, Geophys. Res. Lett., 35, L10501, doi:10.1029/2008GL033712.Horgan, H. J., S. Anandakrishnan, R. B. Alley, P. G. Burkett, and L. E. Peters (2011), Englacial seismic reflectivity: Imaging crystal-orientation
fabric in West Antarctica, J. Glaciol., 57(204), 639–650.Hudleston, P. J. (2015), Structures and fabrics in glacial ice: A review, J. Struct. Geol., 81, 1–27.Jacka, T. (1984), Laboratory studies on relationships between ice crystal size and flow rate, Cold Reg. Sci. Technol., 10(1), 31–42.Jacka, T., and M. Maccagnan (1984), Ice crystallographic and strain rate changes with strain in compression and extension, Cold Reg. Sci.
Technol., 8(3), 269–286.Jacka, T. H., and L. Jun (2000), Flow rates and crystal orientation fabrics in compression of polycrystalline ice at low temperatures and
stresses, in Physics Ice Core Records, edited by T. Hondoh, pp. 83–102, Hokkaido Univ. Press, Sopporo.Jefferd, M. (2015), Relating the evolution of microstructures during the uniaxial deformation of standard ice to seismic anisotropy,
Master’s thesis, Dep. of Earth Sciences, Univ. College London, London, U. K.Kilian, R., R. Heilbronner, and H. Stünitz (2011), Quartz microstructures and crystallographic preferred orientation: Which shear sense
do they indicate?, J. Struct. Geol., 33(10), 1446–1466.Kluskiewicz, D., E. D. Waddington, S. Anandakrishnan, D. E. Voigt, K. Matsuoka, and M. P. McCarthy (2017), Sonic methods for measuring
crystal orientation fabric in ice, and results from the West Antarctic Ice Sheet (WAIS) divide, J. Glaciol., 1–15, doi:10.1017/jog.2017.20.Kohnen, H., and C. Bentley (1977), Ultrasonic measurements on ice cores from Ross Ice Shelf, Antarctica, drill hole, Antarct. J. US, 12(4),
148–150.Kohnen, H., and A. J. Gow (1979), Ultrasonic velocity investigations of crystal anisotropy in deep ice cores from Antarctica, J. Geophys. Res.,
84(C8), 4865–4874.Llorens, M.-G., A. Griera, P. D. Bons, R. A. Lebensohn, L. A. Evans, D. Jansen, and I. Weikusat (2016), Full-field predictions of ice dynamic
recrystallisation under simple shear conditions, Earth Planet. Sci. Lett., 450, 233–242.Mainprice, D., R. Hielscher, and H. Schaeben (2011), Calculating anisotropic physical properties from texture data using the MTEX open
source package, Geol. Soc. London, Spec. Publ. Geol. Soc., 360, 175–192.Maurel, A., F. Lund, and M. Montagnat (2015), Propagation of elastic waves through textured polycrystals: Application to ice, Proc. R. Soc.
London, Ser. A, 471, 20140988.Montagnat, M., G. Durand, and P. Duval (2009), Recrystallization processes in granular ice, Phys. Ice Core Records II, 68, 81–90.Montagnat, M., N. Azuma, D. Dahl-Jensen, S. Fujita, F. Gillet-Chaulet, S. Kipfstuhl, D. Samyn, A. Svensson, and I. Weikusat (2014), Fabric along
the NEEM ice core, Greenland: Comparison with GRIP and NGRIP ice cores, Cryosphere Discuss., 8(1), 307–335.Montagnat, M., T. Chauve, F. Barou, A. Tommasi, B. Beausir, and C. Fressengeas (2015), Analysis of dynamic recrystallization of ice from EBSD
orientation mapping, Front. Earth Sci., 3, 81.Obbard, R., K. Sieg, I. Baker, D. Meese, and G. Catania (2011), Microstructural evolution in the fine-grained region of the Siple Dome
(Antarctica) ice core, J. Glaciol., 57(206), 1046–1056.Pearce, M. A. (2015), EBSDinterp 1.0: A MATLAB((r)) program to perform microstructurally constrained interpolation of EBSD data, Microsc.
Microanal., 21(4), 985–993, doi:10.1017/s1431927615000781.Peternell, M., and C. J. Wilson (2016), Effect of strain rate cycling on microstructures and crystallographic preferred orientation during
high-temperature creep, Geology, 44(4), 279–282.Peternell, M., M. Dierckx, C. J. Wilson, and S. Piazolo (2014), Quantification of the microstructural evolution of polycrystalline fabrics using
FAME: Application to in situ deformation of ice, J. Struct. Geol., 61, 109–122.Piazolo, S., C. J. Wilson, V. Luzin, C. Brouzet, and M. Peternell (2013), Dynamics of ice mass deformation: Linking processes to rheology,
texture, and microstructure, Geochem. Geophys. Geosyst., 14(10), 4185–4194, doi:10.1002/ggge.20246.Piazolo, S., M. Montagnat, F. Grennerat, H. Moulinec, and J. Wheeler (2015), Effect of local stress heterogeneities on dislocation fields:
Examples from transient creep in polycrystalline ice, Acta Mater., 90, 303–309.Picotti, S., A. Vuan, J. M. Carcione, H. J. Horgan, and S. Anandakrishnan (2015), Anisotropy and crystalline fabric of Whillans Ice Stream
(West Antarctica) inferred from multicomponent seismic data, J. Geophys. Res. Solid Earth, 120, 4237–4262, doi:10.1002/2014JB011591.Pollard, D., and R. M. DeConto (2009), Modelling West Antarctic Ice Sheet growth and collapse through the past five million years, Nature,
458(7236), 329–U89, doi:10.1038/nature07809.Prior, D. J., et al. (2015), Making EBSD on water ice routine, J. Microsc., 259(3), 237–256, doi:10.1111/jmi.12258.Qi, C., D. Goldsby, and D. Prior (2017), The down-stress transition from cluster to cone fabrics in experimentally deformed ice, Earth Planet.
Sci. Lett., 471, 136–147, doi:10.1016/j.epsl.2017.05.008.Rignot, E., J. Mouginot, and B. Scheuchl (2011), Ice flow of the antarctic ice sheet, Science, 333(6048), 1427–1430,
doi:10.1126/science.1208336.Sammonds, P., S. Murrell, and M. Rist (1989), Fracture of multi-year sea ice under triaxial stresses: Apparatus description and preliminary
results, J. Offshore Mech. Arct. Eng., 111(3), 258–263.Schmid, E., and W. Boas (1950), Plasticity of Crystals, p. 353, F. A. Hughes and Co. Ltd., London.Schulson, E. M., et al. (2009), Creep and Fracture of Ice, vol. 1, Cambridge Univ. Press, Cambridge.Smith, E. C., A. F. Baird, J. M. Kendall, C. Martín, R. S. White, A. M. Brisbourne, and A. M. Smith (2017), Ice fabric in an Antarctic ice stream
interpreted from seismic anisotropy, Geophys. Res. Lett., 44, 3710–3718, doi:10.1002/2016GL072093.
VAUGHAN ET AL. VELOCITY MONITORING DURING CREEP IN ICE 7088
Journal of Geophysical Research: Solid Earth 10.1002/2017JB013964
Stanchits, S., et al. (2010), Formation of Faults in Diorite and Quartzite Samples Extracted From a Deep Gold Mine (South Africa), vol. 12,p. 5605, EGU General Assembly Conference, Vienna.
Stern, L. A., W. B. Durham, and S. H. Kirby (1997), Grain-size-induced weakening of H2O ices I and II and associated anisotropicrecrystallization, J. Geophys. Res., 102(B3), 5313–5325.
Tang, S., S. Wu, M. Kobayashi, and H. Pan (2007), Effects of texture evolutions and point defects on ultrasonic waves under simple shearand pure shear, Int. J. Solids Struct., 44(3), 1277–1290.
Thorsteinsson, T., J. Kipfstuhl, and H. Miller (1997), Textures and fabrics in the GRIP ice core, J. Geophys. Res., 102(C12), 26,583–26,599.Treverrow, A., W. F. Budd, T. H. Jacka, and R. C. Warner (2012), The tertiary creep of polycrystalline ice: Experimental evidence for
stress-dependent levels of strain-rate enhancement, J. Glaciol., 58(208), 301–314.Treverrow, A., R. C. Warner, W. F. Budd, T. Jacka, and J. L. Roberts (2015), Modelled stress distributions at the Dome Summit South borehole,
Law Dome, East Antarctica: A comparison of anisotropic ice flow relations, J. Glaciol., 61(229), 987–1004.Urai, J., W. Means, and G. Lister (1986), Dynamic recrystallization of minerals, in Mineral and Rock Deformation: Laboratory Studies: The
Paterson Volume, pp. 161–199, AGU Geophys. Monogr., Washington, D. C.Vaughan, M. J., K. van Wijk, D. J. Prior, and M. H. Bowman (2016), Monitoring the temperature-dependent elastic and anelastic properties
in isotropic polycrystalline ice using resonant ultrasound spectroscopy, Cryosphere, 10(6), 2821–2829, doi:10.5194/tc-10-2821-2016.Vaughan, M. J. H. (2017), The creep behaviour, and elastic and anelastic properties of polycrystalline ice, PhD thesis, Dep. of Earth Sciences,
Univ. of Otago, Dunedin, New Zealand.Vélez, J. A., G. P. Tsoflias, R. A. Black, C. J. Van der Veen, and S. Anandakrishnan (2016), Distribution of preferred ice crystal orientation
determined from seismic anisotropy: Evidence from Jakobshavn Isbræ and the North Greenland Eemian Ice Drilling facility, Greenland,Geophysics, 81(1), WA111–WA118.
Vogt, C., K. Laihem, and C. Wiebusch (2008), Speed of sound in bubble-free ice, J. Acoust. Soc. Am., 124(6), 3613–3618.Weertman, J. (1973), Creep of ice, in Physics and Chemistry of Ice, vol. Ottawa, pp. 320–337, R. Soc. Canada.Wilson, C. J., V. Luzin, S. Piazolo, M. Peternell, and D. Hammes (2015), Experimental deformation of deuterated ice in 3D and 2D:
Identification of grain-scale processes, Proc. R. Soc. Victoria, 127(1), 99–104.Wilson, C. J. L., M. Peternell, S. Piazolo, and V. Luzin (2014), Microstructure and fabric development in ice: Lessons learned from in situ
experiments and implications for understanding rock evolution, J. Struct. Geol., 61, 50–77, doi:10.1016/j.jsg.2013.05.006.Woodcock, N. H. (1977), Specification of fabrics shapes using an eigenvalue method, Geol. Soc. Am. Bull., 88(9), 1231–1236.Zwinger, T., M. Schäfer, C. Martín, and J. C. Moore (2014), Influence of anisotropy on velocity and age distribution at Scharffenbergbotnen
blue ice area, Cryosphere, 8(2), 607–621.
VAUGHAN ET AL. VELOCITY MONITORING DURING CREEP IN ICE 7089