Embed Size (px)
Citation preview

USING QUANTITATIVE COMPUTED TOMOGRAPHY TO PROVIDE IMPORTANT AND NOVEL
INSIGHTS INTO AIRWAY REMODELLING IN ASTHMA AND COPD.
Thesis submitted for the degree of
Doctor of Philosophy
At the University of Leicester
by
Ruth Hartley MBChB, MRCS
Department of Infection, Immunity and Inflammation
University of Leicester
June 2017
Supervisor: Professor Christopher E. Brightling
Co-Supervisor: Professor Salman Siddiqui

I
MAIN TABLE OF CONTENTS
ABSTRACT II
ACKNOWLEDGMENTS III
STATEMENT DETAILING WORK PERSONALLY PERFORMED V
PUBLICATIONS VII
CONTENTS XIV
LIST OF TABLES XXII
TABLE OF FIGURES XXV
LIST OF ABBREVIATIONS XXVIII
MAIN BODY OF THESIS 1
REFERENCES 216

II
ABSTRACT
Over the past 20 years, the technology behind Computed Tomography (CT) scan
acquisition and image analysis has improved dramatically. The potential for CT to be a
non-invasive method to probe the lungs has long been recognised, but there remain
large gaps in our knowledge of how changes in airway structure influences airway
physiology and clinical outcomes.
In this thesis I examine quantitative CT (QCT) measures of airway remodelling
between asthma, COPD and healthy controls, its relationship with immunohistology
and its application in stratified medicine intervention studies.
First I present one of the largest studies to date comparing QCT parameters in asthma,
COPD and healthy controls. It confirms the heterogeneity within both diseases.
However there are still distinct structural differences observed within each cohort, with
striking differences seen within and between the cohorts when grouped by airflow
limitation.
I then present one of the largest studies to date looking at QCT measures and bronchial
biopsies. This shows that changes seen on QCT correlate with typical remodelling
parameters such as percentage airway smooth muscle, but not markers of inflammation.
It also shows that the QCT marker of air trapping is associated with increased
vascularity.
Finally I present a study looking at the use of QCT in assessing the effects of a new
drug, fevipiprant, aimed at reducing sputum eosinophilia, over a 12 week course. This
study shows that fevipiprant, improves some clinical outcomes such as spirometry and
reduces sputum eosinophilia, but no structural changes are seen on QCT.

III
ACKNOWLEDGEMENTS
Firstly I would like to thank all the patient and healthy volunteers. Their willingness to
come and give up their time and energy to aid this research is greatly appreciated. They
are the cornerstone of this work, without them this research and thesis would have been
impossible.
I would also like to acknowledge all the different sources of funds and institutions who
have enabled this research: The University of Leicester, University Hospitals of
Leicester Trust, EU FP7 fund, AirPROM, EvA study, Medical Research Council,
Novartis, Roche and Glaxo Smith Kline.
I am also extremely grateful to Professor Chris Brightling, my supervisor. His hard
work, and his involvement in national and international projects allowed him to create
this job. It has given me the opportunity to be involved in some fantastic studies. It has
brought me into close contact with academics in engineering, physics, maths, to name
but a few. And has enabled me to participate in various conferences and study start up
meetings. All this experience has been enlightening, valuable and I have learnt a lot,
including many things I never thought I would!
Chris has also been a very knowledgeable and supportive supervisor. He has always
been willing to read through abstracts, results, papers and meet up at short notice
despite his own very busy schedule. His ability to see the bigger picture, his enthusiasm
and energy have always impressed me and I admire these qualities.
I would like to thank my co-supervisor, Professor Salman Siddiqui. He has challenged
my work, created discussion, kept things moving and given me plenty of food for
thought.
Dr Sumit Gupta has been also been a co-supervisor in all but name. He has tirelessly
explained things to me, read through numerous abstracts, manuscripts, helped me
prepare for presentations. Not only has he helped with research, but his generosity with
his time has extended to my clinical career too. He has helped me prepare for clinical
interviews and exams.
I would also like to thank the other senior academics in the department, whose input at
the scientific weekly meetings have been valuable. My progress review panel have also
been supportive and encouraging and I appreciate all they have done for me over the
past few years.

IV
It has been pleasure to work with the clinical team at Leicester BRU. In particular I
would like to thank Bethan Barker, Sally Stinson and Leonarda Di Candia for putting
up with my almost constant request to have the office “comfortable” while slowly
melting! And for keeping me sane and for explaining SPSS and graphpad to me! I
would also like to mention the members of the second office, Rachid Berair, Alys
Scadding, Raman Verma and Sherif Gonem. They have put up with my respiratory
related questions and were always willing to help when I needed a med reg opinion on a
patient. And also put up with my constant complaints about the temperature of the
office! I’d also like to thank Chris Newby for his immense patience and seemingly
inexhaustible good nature despite all my statistics related questions and requests for
help.
Amisha Singapuri is a tireless worker and without her, I would have struggled with a lot
of my work. Her ability to be organised, her memory and helpfulness have saved me a
lot of sweat and tears. I would also like to thank Sarah Parker, Karen Edwards, Maria
Shelly, Michelle Bourne, Marcia Soares, Kate Hadley and Beverly Hargadon for their
huge efforts in various studies I was involved with.
I would also like to thank Jean MacDonald, Gail Fretter, Jane Middletone, Selina Finny,
Sue __ and Pam___ for all their help. The radiology department, Dean Mawby and
Joanna Wormleighton have also been very generous with their time and help burning
scans, sorting protocols and scanning patients. Mini Pakkal, our reporting radiologist,
has encouraged me and spurred me on and supported me, especially in my pursuit of a
clinical radiology career.
I would like to thank friends for being understanding when I’ve had to decline
invitations to meet up when deadlines approach, for coming across to see me when I’ve
not had time to go to them. For their encouragement and enthusiasm, which makes me
feel the hard work has been worthwhile
Finally I would like to thank my family. My husband Tom has not only supported and
encouraged me throughout, but he has also provided invaluable help. He taught me
some basics with excel and formulas that allowed me to sort through hundreds of
thousands of data points, which otherwise would have taken months and months of
work. He’s calmed me and cheered me up when I’ve been stressed and he’s listened to
many practice presentations and shown me how to improve it. His quiet calm optimism
and just knowing I can talk through any problems with him has been priceless. My
parents, Richard and Carolyn Davey have helped so much, especially in the write up
year by looking after our baby son. For the past year they have given up a day a week to
come to our house and look after Benjamin while I work on this thesis. I don’t think I’d
have been able to write this and stay sane without their help! My sister too has been a
source of encouragement and enthusiasm.
V
STATEMENT DETAILING WORK
PERSONALLY PERFORMED.
Study 3.1: Relationship Between Lung Function and Quantitative
Computed Tomography Parameters of Airway Remodelling, Air-
trapping and Emphysema in Asthma and COPD: A Single Center
Study.
I supervised all the COPD CT scans, and all the healthy and asthma CT scans done
from September 2011 onwards. I was part of the clinical team involved in recruiting
and characterising the COPD patients, and the asthmatic patients who were seen after
September 2011. I analysed all the scans, irrespective of acquisition date and did all the
statistical analysis, with the exception of the cluster analysis which was performed by
our biostatistician Dr Chris Newby. The scans used for the inter user variability analysis
was done by Dr Sumit Gupta (SG). I did quality control checks on pre September 2011
clinical data and filled in gaps where possible, and recorded any new clinical data. I
wrote the manuscript for this study.
Study 3.2: Associations in asthma between quantitative computed
tomography and bronchial biopsy-derived airway remodelling
I was part of the research team involved in the design of this study. I supervised scans
done after September 2011 and analysed all the scans included in this study. Biopsy
analysis was done by Dr Rachid Berair (RB). I did quality control checks on pre

VI
September 2011 clinical data and filled in gaps where possible, and helped with
recording new clinical data. I co-wrote, with Rachid Beriar, the manuscript for this
study.
Study 3.3: Randomised controlled trial of the prostaglandin D2
receptor 2 antagonist fevipiprant in persistent eosinophilic asthma
I was part of the clinical team involved in recruiting and characterising patients. I
supervised all the CT scans and performed the analysis on all the CT scans. I performed
the statistical analysis on the CT data. I was part of the team involved in writing the
manuscript.

VII
PUBLICATIONS Original Articles:
Berair R*, Hartley R*, Mistry V, Sheshadri A, Gupta S, Singapuri A, et al.
Associations in asthma between quantitative computed tomography and bronchial
biopsy-derived airway remodelling. Eur Respir J 2017 May
1;49(5):10.1183/13993003.01507-2016. Print 2017 May.
*Joint first author
Wright AK, Newby C, Hartley RA, Mistry V, Gupta S, Berair R, et al. Myeloid-
derived suppressor cell-like fibrocytes are increased and associated with preserved
lung function in chronic obstructive pulmonary disease. Allergy 2017
Apr;72(4):645-655.
Hartley RA, Barker BL, Newby C, Pakkal M, Baldi S, Kajekar R, Kay R,
Laurencin M, Marshall RP, Sousa AR, Parmar H, Siddiqui S, Gupta S, Brightling
CE. Relationship between lung function and quantitative computed tomographic
parameters of airway remodeling, air trapping, and emphysema in patients with
asthma and chronic obstructive pulmonary disease: A single-center study. J Allergy
Clin Immunol 2016.
Kim M, Bordas R, Vos W, Hartley RA, Brightling CE, Kay D, Grau V, Burrowes
KS. Dynamic flow characteristics in normal and asthmatic lungs. Int J Numer
Method Biomed Eng 2015.

VIII
Gonem S, Hardy S, Buhl N, Hartley R, Soares M, Kay R, Costanza R, Gustafsson
P, Brightling CE, Owers-Bradley J, Siddiqui S. Characterization of acinar airspace
involvement in asthmatic patients by using inert gas washout and hyperpolarized
helium magnetic resonance. J Allergy Clin Immunol 2015.
Tahir BA, Van Holsbeke C, Ireland RH, Swift AJ, Horn FC, Marshall H,
Kenworthy JC, Parra-Robles J, Hartley R, Kay R, Brightling CE, De Backer J, Vos
W, Wild JM. Comparison of CT-based Lobar Ventilation with He MR Imaging
Ventilation Measurements. Radiology 2015:142278.
Gupta S, Hartley R, Singapuri A, Hargadon B, Monteiro W, Pavord ID, Sousa AR,
Marshall RP, Subramanian D, Parr D, Entwisle JJ, Siddiqui S, Raj V, Brightling
CE. Temporal assessment of airway remodeling in severe asthma using quantitative
computed tomography. Am J Respir Crit Care Med 2015;191:107-110
Tahir BA, Swift AJ, Marshall H, Parra-Robles J, Hatton MQ, Hartley R, Kay R,
Brightling CE, Vos W, Wild JM, Ireland RH. A method for quantitative analysis of
regional lung ventilation using deformable image registration of CT and hybrid
hyperpolarized gas/(1)H MRI. Phys Med Biol 2014;59:7267-7277.
Gupta S, Hartley R, Khan UT, Singapuri A, Hargadon B, Monteiro W, Pavord ID,
Sousa AR, Marshall RP, Subramanian D, Parr D, Entwisle JJ, Siddiqui S, Raj V,
Brightling CE. Quantitative computed tomography-derived clusters: Redefining
airway remodeling in asthmatic patients. J Allergy Clin Immunol 2013.

IX
Review Articles:
Hartley R, Baldi S, Brightling C, Gupta S. Novel imaging approaches in adult
asthma and their clinical potential. Expert Rev Clin Immunol 2015:1-16.
Hartley R, Berair R, Brightling CE. Severe asthma: novel advances in the
pathogenesis and therapy. Pol Arch Med Wewn 2014;124:247-254.
Walker C, Gupta S, Hartley R, Brightling CE. Computed tomography scans in
severe asthma: utility and clinical implications. Curr Opin Pulm Med 2012;18:42-
47.
Abstracts:
Can Quantitative Computed Tomography (QCT) differentiate between asthma and
COPD in patients with similar degree of Airflow Limitation? Hartley R, Barker B,
Pakkal M, Newby C, Siddiqui S, Brightling CE, Gupta S
ERS 2014 (poster)
Quantitative Computed Tomography (QCT) measured 5th generation airways,
emphysema and airflow obstruction in Chronic Obstructive Pulmonary Disease
(COPD) from a COPDMAP cohort. Hartley R, Barker B, Pakkal M, Deshpande A,
Gupta S, Brightling CE
ERS 2014 (poster)

X
Clinical validation of a CT-based impulse oscillometry model. R. Bordas, S.
Gonem, C. Lefevre, B. Veeckmans, R. Hartley, J. Pitt-Francis, C. Faetitia, C.
Brightling, D. Kay, S. Siddiqui, K. Burrowes
ERS 2014.
Characterisation of acinar airspace involvement in patients with asthma using
hyperpolarised 3He magnetic resonance and quantitative computed tomography. S.
Gonem, S. Hardy, N. Buhl, R. Hartley, M. Soares, R. Kay, R. Costanza, P.
Gustafsson, C. Brightling, J. Owers-Bradley, S. Siddiqui
ERS 2014
Comparison of CT-based lobar ventilation models with 3He MRI ventilation
measurements in asthmatics. B. Tahir, C. Van Holsbeke, I. Rob, S. Andy, F. Horn,
H. Marshall, J. Parra-Robles, R. Hartley, R. Kay, B. Chris, J. De Backer, W. Vos,
J. Wild
ERS 2014
Relationship between heterogeneous bronchoconstriction and impulse oscillometry
resistance: A simulation study. R. Bordas, S. Gonem, W. Vos, R. Hartley, J. Pitt-
Francis, J. De Backer, C. Brightling, J. Owers-Bradley, D. Kay, S. Siddiqui, K.
Burrowes
ERS 2014
Phase 2a randomized placebo-controlled trial of the oral prostaglandin D2 receptor
(DP2/ CRTh2) antagonist QAW039 in eosinophilic asthma. S. Gonem, R. Berair, A.

XI
Singapuri, R. Hartley, M. Laurencin, G. Bacher, C. Lu, B. Holzhauer, M. Bourne,
V. Mistry, I. Pavord, A. Mansur, A. Wardlaw, S. Siddiqui, R. Kay, C. Brightling
ERS2014
3D Mapping of airway wall thickening in asthma with MSCT: a level set approach.
Cataling Fetita, Pierre-Yves Brillet, Ruth Hartley, Philippe A Grenier, Christopher
Brightling.
Medical Imaging 2014
Understanding the interdependence between parenchymal deformation and
ventilation in obstructive lung disease. L.U. Berger, Dphil, R. Bordas, K.
Burrowes, C.E. Brightling, R. Hartley, D. Kay
ATS 2014.
Comparison Of CT-Based Lobar Ventilation Models With Helium-3 MRI
Ventilation Measurements In Asthmatics. B.A. Tahir, MSc, C. Van Holsbeke,
BSc, R. Ireland, A. Swift, H. Marshall, J. Parra-Robles, R. Hartley, M.
Laurencin, R. Kay, S. Siddiqui, C. Brightling, J. De Backer, W. Vos, J. Wild
ATS 2014
Quantification of lung microstructure in asthma using a 3He fractional diffusion
approach. J. Parra-Robles, H. Marshall, Ruth A. Hartley, C.E. Brightling, J.M.
Wild.
ISMRM 2014.

XII
Comparing airway morphometry and lung density in Asthma, COPD and Healthy
controls using Quantitative CT (QCT). Hartley R, Barker B, Pakkal M, Siddiqui S,
Bafadhel M, Gupta S, Brightling C.
ERS 2013 (poster).
Quantitative CT in COPD MAP: Emphysema and small airways disease
independently contribute to FEV1. Hartley R, Barker B, Edwards K, Finch J,
Shelley M, Parker S, Pakkal M, Bafadhel M, Gupta S, Brightling C
ERS 2013 (poster).
CT- PRM: A Novel Imaging Biomarker of Small Airways Disease in Asthma.
Hartley R, Gonem S, Boes J, Bule M, Ross B, Gupta S, Brightling C, Galban C,
Siddiqui S
RSNA 2013 (oral presentation).
Association between quantitative CT measures and airway inflammation in COPD.
Barker B, Hartley R, Pancholi M, Rana N, Edwards K, Shelley M, Parker S,
Brightling C.
ERS 2013.
Correlation Between Functional Respiratory Imaging And Pulmonary Function
Tests In Health And Different Degrees Of Asthma Severity
W. Vos, J. De Backer, R. Hartley, S. Gupta, S. Siddiqui, C.E. Brightling
ATS 2013

XIII
Cluster analysis reveals a distinct small airway-predominant phenotype of asthma.
Sherif Gonem, Sushiladevi Natarajan, Ruth Hartley, Sumit Gupta, Dhananjay
Desai, Steven Corkill, Amisha Singapuri, Peter Bradding, Per Gustafsson,
Christopher E Brightling, Salman Siddiqui
BTS 2012.
Asthma Phenotypes based on Quantitative Computed Tomography Analysis of
Proximal and Distal Airway, Gupta S, Khan U, Hartley R, Raj V, Entwistle J,
Brightling C
RSNA 2012.
The effectiveness of Synvisc (hyaluronice Acid) intra-articular injections in the
management of osteoarthritis, Hussian M, Hartley R.
UKRC June 2011.

XIV
CONTENTS 1 INTRODUCTION 1
1.1 Asthma 2
1.1.1 Disease burden of asthma 3
1.1.2 Severe asthma 3
1.1.3 Pathogenesis of severe asthma 4
1.1.3.1 Spatial Scales 4
1.1.3.1.1 Genes to cells: functional ‘omics’ 4
1.1.3.1.2 Cell to tissue: airway inflammation 4
1.1.3.1.3 Cell to tissue: airway remodelling 5
1.1.3.1.4 Tissue to organ: The roles of large and small airways 6
1.1.3.1.5 Tissue to organ: The role of Quantitative Computed
Tomography (QCT) 7
1.1.3.2 Temporal scales of severe asthma 7
1.1.4 Treating severe asthma 8
1.1.4.1 Th2-directed therapies –current therapies 9
1.1.4.1.1 Corticosteroids 9
1.1.4.1.2 Anti-leukotriene drugs 9
1.1.4.1.3 Anti-IgE 10
1.1.4.2 Th2-directed therapies –future therapies 10
1.1.4.2.1 Chemoattractant Receptor-homologous molecule expressed on Th2
cells (CRTh2) antagonism 10
1.1.4.2.2 Anti-IL5, Anti-IL4 and Anti-IL13 10
1.1.4.3 Airway Smooth Muscle Dysfunction – current therapies 12
1.1.4.3.1 Long-acting Beta-2 adrenergic agonists (LABAs) 12

XV
1.1.4.3.2 Methylxanthines 12
1.1.4.4 Airway Smooth Muscle Dysfunction – future therapies 13
1.1.4.4.1 Long-acting anticholinergic agents (LAMAs) 12
1.1.4.5 Airway remodelling – current Therapies 13
1.1.4.5.1 Mechanotransduction and breathing exercises 13
1.1.4.5.2 Bronchial Thermoplasty 13
1.2 Chronic Obstructive Airways Disease (COPD) 15
1.2.1 Disease burden of COPD 15
1.2.2 COPD exacerbations 16
1.2.3 Phenotyping COPD 16
1.2.3.1 Cells to Tissue 17
1.2.3.1.1 Cigarette smoke 17
1.2.3.1.2 Neutrophils and eosinophils 18
1.2.3.1.3 Bacterial infections 18
1.2.3.1.4 Viral Infections 18
1.2.3.1.5 Adaptive immune response 19
1.2.3.2 Tissue – Organ 19
1.2.3.2.1 Emphysema 20
1.2.3.2.2 Airway remodelling 21
1.2.3.2.3 The role of QCT 21
1.3 Asthma and COPD; the clinical picture 22
1.3.1 Comparing symptoms 22
1.3.2 Comparing physiology 23
1.4 The discovery of x-rays, and origins of CT imaging 25
1.4.1 Wilhem Roentgen (27th March 1845 – 10th February 1923) 25

XVI
1.4.2 CT scan development – Sir Godfrey Hounsfield and Allan Cormack 28
1.4.3 CT scan development – Technology 30
1.4.4 CT and image analysis 32
1.4.4.1 Development of Densitometry – emphysema markers 32
1.4.4.1.1 Voxel Index and Density masks 32
1.4.4.1.2 Lung volume and densitometry 33
1.4.4.1.3 Percentile 15 34
1.4.4.2 Development of Densitometry – Air trapping markers 35
1.4.4.3 Development of airway analysis 36
1.5 Hypothesis 38
1.6 Aims 39
1.7 Tables and Figures 41
2 METHODS 50
2.1 Clinical Methods 51
2.1.1 Tests in both Asthmatic and COPD cohorts 51
2.1.1.1 Baseline demographics 51
2.1.1.2 Electrocardiogram (ECG) 51
2.1.1.3 Peripheral blood samples 51
2.1.1.4 Spirometry and lung function tests 51
2.1.1.5 Sputum Collection/Induction 52
2.1.1.6 Visual Analogue Scores 54
2.1.1.7 Bronchoscopy and biopsy sampling 54
2.1.2 Tests performed only in Asthma cohorts 56
2.1.2.1 Skin Prick Testing 56
2.1.2.2 Fractional exhaled nitric oxide (FENO) 56

XVII
2.1.2.3 Methacholine challenge test (PC20) 56
2.1.2.4 Asthma Control Questionnaire (ACQ) 57
2.1.2.5 Asthma Quality of Life Questionnaires with Standardised
Activities (AQLQ(S)) 58
2.1.3 Tests performed only in COPD cohorts 59
2.1.4.4 Modified Medical Research Council Dyspnoea scale 59
2.1.4.5 St George’s Respiratory Questionnaire for COPD patients 59
2.2 Laboratory Methods 60
2.2.1 Sputum processing 60
2.2.2 Biopsy processing 60
2.2.2.1 Glycol methacrylate samples 60
2.2.2.2 Paraffin samples 62
2.3 Radiological Methods 63
2.3.1 Scanning protocols 63
2.3.1.1 Full thoracic Inspiratory and expiratory CT protocol 63
2.3.1.2 Inter-observer repeatability of co-primary QCT parameters 65
2.3.1.3 Limited Thoracic CT scan protocol 65
2.3.1.4 Electron Dense (ED) Rods 65
2.3.2 Analysis of computed tomography scans 66
2.3.2.1 Airway Segmentation 66
2.3.2.2 Apollo® (by VIDA Diagnostics, Inc) airway segmentation 66
2.3.2.3 Apollo® (by VIDA Diagnostics, Inc) cross sectional
measurements 67
2.3.2.4 Apollo® (by VIDA Diagnostics, Inc) lung and lobe
segmentation 68
XVIII
2.3.2.5 Low attenuation area (terminal airspace) complexity (LAC-D) 69
2.3.2.6 Pi10, Po20 69
2.4. Correction methods 71
2.4.1 Density correction 71
2.4.2 Interscanner correction 72
2.4.3 Morphometry correction 73
2.5 Radiation safety 74
2.6 Tables and Figures 75
STUDIES 79
STUDY 3.1 80
3.1.1 Abstract 80
3.1.1.1 Background 80
3.1.1.2 Methods 80
3.1.1.3 Measurements & main results 81
3.1.1.4 Conclusions 81
3.1.2 Introduction 82
3.1.3 Methods 84
3.1.3.1 Subjects 84
3.1.2.2 Computed Tomography 84
3.1.2.4 Statistical Analysis 85
3.1.2.4.1 General analysis 85
3.1.2.4.2 Factor and cluster on COPD and severe Asthma cohort 86
3.1.4 Results 88
3.1.4.1. Clinical characteristics 88
3.1.4.2 QCT parameters: Comparison between asthma, COPD and

XIX
healthy subjects 88
3.1.4.3 Univariate analysis to explore structure and function relationship in
asthma and COPD 89
3.1.4.4 Multiple regression analysis to explore structure and function
relationship in asthma and COPD 90
3.1.4.5 Univariate and multiple regression analysis to explore structure
and function relationship in asthma and COPD subjects with airflow
limitation 90
3.1.4.6 Asthma and COPD sub-group analysis 91
3.1.4.7 Unbiased phenotyping of airway disease (asthma and COPD) subjects
using factor analysis of QCT parameters 92
3.1.5 Discussion 93
3.1.6 Conclusion 98
3.1.7 Figures and Tables 99
3.2 STUDY 2: Associations in asthma between quantitative computed tomography
and bronchial biopsy-derived airway remodelling 129
3.2.1 Abstract 129
3.2.1.1 Background 129
3.2.1.2 Methods 129
3.2.1.3 Measurements and main results 130
3.2.1.4 Conclusions 130
3.2.2 Introduction 131
3.2.3 Method 133
3.2.3.1 Subjects 133
3.2.3.2 Computed tomography 134

XX
3.2.3.3 Endobronchial biopsies 134
3.2.3.4 Statistical analysis 136
3.2.4 Results 137
3.2.4.1 Airway inflammation and remodelling univariate correlation with lung
function 137
3.2.4.2 CT-derived quantitative morphometry and densitometry univariate
correlation with lung function 138
3.2.4.3 Univariate correlations between bronchial biopsy airway remodelling
and QCT morphometry and air-trapping 138
3.2.4.4 Multivariate analysis of the association between bronchial biopsy
immunohistology, lung function and QCT parameters 139
3.2.4.5 Validation group: replication of the correlation between vascularity and
air-trapping 140
3.2.5 Discussion 141
3.2.6 Conclusion 145
3.2.6 Tables and Figures 146
3.3 STUDY 3: Randomised controlled trial of the prostaglandin D2 receptor 2
antagonist fevipiprant in persistent eosinophilic asthma 158
3.3.1 Abstract 158
3.3.1.1 Background 158
3.3.1.2 Methods 158
3.3.1.3 Measurements & main results 159
3.3.1.4 Conclusions 159
3.3.2 Introduction 160
3.3.3 Methods 162

XXI
3.3.3.1 Subjects 162
3.3.3.2 Design of the study 163
3.3.3.3 Randomisation and masking 165
3.3.3.4 Statistical analysis 165
3.3.4 Results 167
3.3.5 Discussion 170
3.3.6 Conclusion 174
3.3.7 Tables and Figures 175
4 CONCLUSIONS 197
4.1 Final Discussion 198
4.2 Study 3.1: Relationship Between Lung Function and Quantitative Computed
Tomography Parameters of Airway Remodelling, Air-trapping and Emphysema
in Asthma and COPD: A Single Center Study 200
4.3 Study 3.2: Associations in asthma between quantitative computed tomography
and bronchial biopsy-derived airway remodelling 204
4.4 Study 3.3: Randomised controlled trial of the prostaglandin D2 receptor 2
antagonist fevipiprant in persistent eosinophilic asthma 206
4.5 Key questions and future directions 208
4.6 Limitations 212
4.7 Concluding remarks 215
5 REFERENCES 216
XXII
LIST OF TABLES
Table 1.1 Clinical features differentiating COPD and asthma 41
Table 1.2 Guidelines to diagnosis COPD based on clinical history/symptoms 42
Table 2.1 Scanning protocol 75
Table 2.2 Summary of most frequently used QCT parameters 76
Table 3.1.1 Factor analysis of QCT variables with combined cohort of both
asthma and COPD 99
Table 3.1.2 Demographics, both clinical and QCT of clusters in combined cohort
of asthma and COPD 100
Table 3.1.3 Clinical Characteristics of all the subjects with asthma or COPD
and healthy controls 102
Table 3.1.4 Airway morphometry and lung densitometry of subjects with asthma,
COPD and healthy controls 104
Table 3.1.5 LA/BSA for segmental airways in asthma and COPD subjects
and healthy controls 106
Table 3.1.6 %WA for segmental airways for subjects with asthma, COPD
and healthy controls 108

XXIII
Table 3.1.7 Correlations between clinical outcomes and QCT parameters 110
Table 3.1.8 Correlations between clinical outcomes and QCT parameters for asthma
(upper value) and COPD (lower value) 111
Table 3.1.9 Multiple regression to determine the strongest independent QCT
parameters of post-bronchodilator FEV1% predicted 112
Table 3.1.10 Correlations between QCT parameters and clinical outcomes in asthma
(upper panel) and COPD subjects (lower value) with FEV1 %
predicted <80% 113
Table 3.1.11 Multiple regression to determine the strongest independent QCT
parameters of FEV1% predicted in those subjects with FEV1 %
predicted <80% 114
Table 3.2.1 Demographics, clinical and laboratory characteristics 146
Table 3.2.2 Univariate correlations between primary QCT parameters and lung
function, airway inflammation and remodelling 148
Table 3.2.3 QCT morphometry and air-trapping parameters 149
Table 3.2.4 Quantitative morphometry 150
Table 3.2.5 Demographics, clinical and laboratory characteristics 152
Table 3.3.1 Summary of visit days and tests 175
Table 3.3.2 Baseline characteristics of randomised population 177

XXIV
Table 3.3.3 Outcome Measures at Baseline and Post-Treatment in the Full Analysis Set
Population 179
Table 3.3.4 Bronchial biopsy outcome measures 182
Table 3.3.5 Quantitative computed tomography and densitometry 185
Table 3.3.6 Summary of Adverse Events 187

XXV
TABLE OF FIGURES
Figure 1.1 Schematic diagram of the pathogenesis of asthma 43
Figure 1.2 Asthma pathological domains, current and future (italicised)
treatments 44
Figure 1.3 Schematic diagram of the pathogenesis of COPD 45
Figure 1.4 CT scanner evolution 46
Figure 1.5 Graphical representation of the method of calculating percentile 15
and %VI-950 47
Figure 1.6 Plot of VI -950 against Percentile 15 in asthmatics 48
Figure 1.7 Schematic representation of full width half maximum principle 49
Figure 2.1 Linear regression log-log plot 77
Figure 2.2 Density Correction 78
Figure 3.1.1: Visual representation of QCT parameters 115
Figure 3.1.2: Cluster dendrogram 116
Figure 3.1.3 A&B: Percentage Wall Area and Mean Lumen Area/Body
Surface Area 117
Figure 3.1.3 C&D: Mean Lung Density Expiratory to Inspiratory ratio

XXVI
and Percentile 15 119
Figure 3.1.3 E: Fractal Dimensions of Low Attenuation Areas below -950 121
Figure 3.1.4 A&B: Percentage WA and LA/BSA 122
Figure 3.1.4 C&D: MLDE/I and Percentile 15 123
Figure 3.1.5 A&B: Percentage WA and LA/BSA 124
Figure 3.1.5 C&D: Percentage WA and LA/BSA 125
Figure 3.1.6 A&B: Percentage WA and LA/BSA 126
Figure 3.1.6 C&D: MLDE/I and Percentile 15 127
Figure 3.1.6 E: LAC-D -950 128
Figure 3.2.1 Comparing airway smooth muscle percentage and vascularity in those
with and without persistent airflow limitation 153
Figure 3.2.2 Scatterplots of correlations, airway smooth muscle 154
Figure 3.2.3 Scatterplots of correlations, epithelial thickness 155
Figure 3.2.4 Scatterplots of correlations, vascularity 156
Figure 3.2.5 Scatterplots of correlation, vascularity and air trapping in the
replication group 157
Figure 3.3.1 Summary of study protocol and participant flow 188
Figure 3.3.2 Comparison of eosinophilic inflammation outcomes between the

XXVII
study groups 189
Figure 3.3.3 Comparison of patient-reported and lung function outcome measures
between the study groups 190
Figure 3.3.4 Comparison of epithelial damage outcome measures between the
study groups 192
Figure 3.3.5 Correlations between changes in eosinophilic airway inflammation
and changes in epithelial damage between the baseline and
post-treatment visits 193
Figure 3.3.6 A-D Correlations between changes in computed tomography-derived
lung volumes and changes in lung function outcomes between the baseline
and post-treatment visits 194
Figure 3.3.6 E-H Correlations between changes in computed tomography-derived
lung volumes and changes in lung function outcomes between the baseline0
and post-treatment visits 195

XXVIII
LIST OF ABBREVIATIONS
%WA Percentage Wall Area
ACQ 6 Asthma Control Questionnaire (first 6 questions)
ACQ 7 Asthma Control Questionnaire (all 7 questions)
AHR Airway hyperresponsiveness
ASM Airway smooth muscle
ATS American Thoracic Society
AQLQ Asthma Quality of Life Questionnaire
BAL Bronchoalveolar lavage
BD response Bronchodilator response
BDP Beclomethasone dipropionate
Blood eos Blood eosinophil count
Blood neut Blood neutrophil count
BMI Body mass index
BODE Body mass index, airflow Obstruction, Dyspnea and
Exercise capacity
BSA Body Surface Area (m2)
BT Bronchial thermoplasty
CRTH2 chemoattractant receptor-homologous molecule expressed
on Th2 cells, (also known as Prostaglandin D2 receptor,
DP2)
COPD Chronic obstructive pulmonary disease
CT Computed Tomography
CTLVE/I CT Lung Volume Expiratory to Inspiratory ratio
DALYs Disability-adjusted life years
DAMP Damage-Associated Molecular Patterns
DNA Deoxyribonucleic acid
D-PBS Dulbecco’s phosphate buffered saline

XXIX
DP1 Prostaglandin D1 receptor
DP2 Prostaglandin D2 receptor, also known as CRTH2
DC Dendritic cells
ECG Electrocardiogram
EC Epithelial cells
ED Electron Dense
ERS European Respiratory Society
Exp VI-856 Expiratory Voxel Index below -856 HU
FC Fuzzy Connectivity
FDA Food and Drug Administration
FENO Fractional exhaled nitric oxide
FEV1 Forced Expiratory Volume in 1 second
FEV1/FVC Forced Expiratory Volume in 1 second/Forced Vital
Capacity
FRC Functional Residual Capacity
GOLD Global initiative for chronic Obstructive Lung Disease
GINA Global Initiative for Asthma
H&E Haematoxylin & Eosin
HU Hounsfield Unit
ICS Inhaled corticosteroids
IgE Immunoglobulin E
IL-4 Interleukin 4
IL-5 Interleukin 5
IL-13 Interleukin 13
Insp VI -950 (-950%VI) Inspiratory Voxel Index below -950 HU
IQR Interquartile range,
JACQ/ACQ (Juniper) Asthma Control Questionnaire
kVp Peak kilovoltage
KCO% Transfer Coefficient

XXX
LA Lumen Area (mm2)
LABA Long-acting Beta-2 adrenergic agonists
LAMA Long-acting anticholinergic agents
LB1 Left upper lobe apical
LB2 Left upper lobe posterior
LB3 Left upper lobe anterior
LB4 Left lingular superior
LB5 Left lingular inferior
LB6 Left lower lobe apical
LB1+2 Left upper lobe apicoposterior
LB8 Left lower lobe anteriomedial
LB9 Left lower lobe lateral
LB10 Left lower lobe posterior
LAC-D -950 Low Attenuation Clusters below -950 HU Fractal
Dimension value
mAb Monoclonal antibody
mAs Milliamperage second
MCH Major-histocompatibility-complex
MLDE/I Mean Lung Density Expiratory to Inspiratory ratio
mSv millisieverts
NK Natural Killer
PC20 Methacholine challenge test
PAMP Pathogen-Associated Molecular Patterns
PAS Periodic acid-Schiff
Perc15 The Hounsfield Unit value at which 15% of the voxels lie
below
PGD2 Prostaglandin-D2
Pi10 The wall area of theoretical airway with an internal
perimeter of 10mm

XXXI
Po20 (%WA) The percentage wall area of a theoretical airway with an
external perimeter of 20mm
Post-BD Post Bronchodilator
Pre-BD Pre Bronchodilator
PRR(s) Pattern Recognition Receptor(s)
QCT Quantitative Computed Tomography
RB1 Right upper apical
RB2 Right upper posterior
RB3 Right upper anterior
RB4 Right middle lateral
RB5 Right middle medial
RB6 Right lower apical
RB7 Right lower medial
RB8 Right lower anterior
RB9 Right lower lateral
RB10 Right lower posterior
RBM Reticular Basement Membrane
ROI Region of interest
RVC Relative Voxel Change
RV/TLC Residual Volume/Total Lung Capacity
SD Standard deviation
SGRQ-C St George’s Respiratory Questionnaire for COPD patients
SMA anti-human smooth muscle actin
SNPs Single nucleotide polymorphisms
Sputum eos (%) Percentage of sputum eosinophils
Sputum neut (%) Percentage of sputum neutrophils
TA Total Area (mm2)
Tc1 Cytotoxic T cell-type 1
Th1 T helper lymphocytes, type 1

XXXII
Th2 T helper lymphocytes, type 2
Th17 T helper lymphocytes, type 17
TGF-β Transforming growth factor - beta
TLC Total Lung Capacity
VC Vital capacity
VEGF Vascular endothelial growth factor
VI Voxel Index
WA Wall Area (mm2)
WHO World Health Organisation
WDP Warwick Density Phantom

1
1 INTRODUCTION

2
1.1 Asthma
The word “Asthma”, (from the Greek word “wind” or “to blow”), was first used by
Hippocrates around 400 BC, to describe respiratory distress. The Romans were also
aware of the condition, with Pliny the elder noting that pollen was a common trigger for
respiratory difficulty. It was only in the latter half of the 19th
century that the term
asthma was refined by Henry Hyde Salter, an asthma sufferer himself, in his treatise
“On Asthma and its Treatment”. He described a disease where smooth muscle
contraction in the airways causes them to narrow (1). In 1892 Sir William Osler
described asthma in the textbook “Principles and Practice of Medicine”, and treating
asthma focused mainly on treating bronchospasm.
Despite the availability of a selection of bronchodilators by 1960s, and the knowledge
that asthma was associated with airway inflammation, there was little understanding as
to why it occurred, and little thought given to long term treatment/control (2). The bulk
of the working looking into the pathogenesis of asthma has mostly taken place from the
1970s and onwards (2).
The World Health Organisation (WHO), has defined asthma (3)
“Asthma is a chronic inflammatory disorder of the airways in which many cells and
cellular elements play a role. The chronic inflammation is associated with airway
hyperresponsiveness that leads to recurrent episodes of wheezing, breathlessness, chest
tightness, and coughing, particularly at night or in the early morning. These episodes
are usually associated with widespread, but variable, airflow obstruction within the lung
that is often reversible either spontaneously or with treatment”

3
1.1.1 Disease burden of asthma
Asthma affects an estimated 300 million worldwide and is increasing in prevalence,
with an additional 100 million suffers anticipated by 2025 (4). Asthma is on par with
diseases such as diabetes, schizophrenia and liver cirrhosis for the number of disability-
adjusted life years (DALYs) lost per year (4). In 2011-2012 it was estimated that 5.4
million people were being treated for asthma in the UK with over 65,000 hospital
admissions for asthma (5).
Approximately 10% of sufferers have severe asthma (6). Morbidity and mortality is
highest in severe asthma consuming over 50% of the healthcare costs attributed to
asthma (7).
1.1.2 Severe asthma
Severe asthma requires treatment with high dose inhaled corticosteroids (ICS) plus a
second controller and/or systemic corticosteroids to prevent it from becoming
“uncontrolled” or remains “uncontrolled” despite this therapy. Uncontrolled disease is
determined by one or more of the following: poor symptom control, frequent severe
exacerbations requiring high dose corticosteroid therapy or resulting in hospital
admissions, and/or persistent airflow limitation.
Prior to confirming a diagnosis of severe asthma, it is critical to confirm adherence to
therapy and optimise treatment of co-morbidities. Whether treatment of co-morbidities
modulates asthma severity directly or indirectly, through improving asthma control,
remains controversial. Intriguingly, recent evidence has suggested that in obese
asthmatics with severe disease there is increased eosinophilic infiltration of the airway

4
wall, perhaps suggesting in this example a direct effect upon the underlying
pathogenesis (7).
Less controversial is the increasing recognition that asthma, particularly severe asthma,
is a complex heterogeneous condition encompassing several underlying pathologies that
develop as a consequence of a variety of gene-environment interactions that give rise to
a clinical phenotype.
1.1.3 Pathogenesis of severe asthma
1.1.3.1 Spatial Scales
1.1.3.1.1 Genes to cells: functional ‘omics’
Heterogeneity within asthma is most obviously seen at the genetic level. A number of
genes have been implicated in modulating the response of epithelial repair in response
to damage in genome wide association studies (8,9). Single nucleotide polymorphisms
(SNPs) have been associated with airflow obstruction and lung function impairment
(10) and SNPs in the IL-4 receptor are associated with persistent airway inflammation
and severe asthma exacerbations (11).
1.1.3.1.2 Cell to tissue: airway inflammation
At the cellular level the numerous permeations of heterogeneity are restricted somewhat
as there are a limited number of cells for the genetic/protein differences to exert an
influence upon. Nonetheless there are still many permeations which can occur. For
example, persistent airway inflammation, despite full treatment is one of the hallmarks
of severe asthma. However, critically, there is no clear pathological definition of severe

5
asthma (12). In allergic asthma airway inflammation is orchestrated by dendritic cell-
Th2 cell interactions mediated by epithelial derived-thymic stromal lymphopoietin
leading to mast cell activation and eosinophil recruitment. Evidence is emerging,
particularly in severe asthma, that Th1/Tc1 and Th17 pathways with activation of
neutrophils may play a role (13). Importantly, although these inflammatory profiles
may co-exist to varying degrees within an individual, they do not necessarily occur
independently. Cellular interactions considered to play important roles in airway
inflammation and remodelling are summarised in figure 1.1. It is unclear if these
inflammatory profiles are a consequence of environmental exposure to pollutants,
smoking and infection, or primary abnormalities. Indeed, persistent bacterial
colonisation, which is traditionally associated with chronic obstructive pulmonary
disease (COPD), is also evident in some subjects with asthma (14). Fungal colonisation
and sensitisation is also observed in severe disease (15).
1.1.3.1.3 Cell to tissue: airway remodelling
A consequence of this inflammation is epithelial damage and ciliary dysfunction (16).
Impaired ciliary function, goblet cell hyperplasia and mucus gland enlargement all lead
to increased mucus production, which is likely to perpetuate exacerbations and lead to
further epithelial damage. Activated epithelium releases various growth factors
including transforming growth factor-beta (TGF-) and pro-angiogenic factors e.g.
vascular endothelial growth factor (VEGF). In concert with pro-inflammatory cells
TGF- activates sub-epithelial mesenchymal cells to release matrix and proliferate (17).
Fibrocytes, which are blood-borne mesenchymal progenitors, are recruited to the airway
in response to the ‘chronic wound’, and differentiation of these cells together with local
proliferation of resident mesenchymal stem cells promotes an increase in airway

6
smooth muscle (ASM) mass (18). ASM mass is the strongest predictor of airflow
obstruction. Once activated, ASM in asthma recruits mast cells by releasing
chemotactic factors. Mast cells interact with the ASM to promote airway
hyperresponsiveness (AHR) (19,20), whilst mast cells and neutrophils localize to glands
and are associated with increased mucus plugging (21). In addition to the pathogenesis
of persistent disease, recurrent exacerbations are an important component of severe
disease and are often associated with pathogens, suggesting abnormalities in
innate/adaptive immunity. In asthma the secretion of beta and lambda interferons from
the airway epithelium is impaired in response to rhinovirus (22). This leads to decreased
viral clearance and is associated with worsening symptoms at exacerbation.
1.1.3.1.4 Tissue to organ: The roles of large and small airways
Both large and small airway disease leads to airflow obstruction and airway
hyperresponsiveness (AHR), in asthma. Large airways account for the majority of
airflow resistance behaving effectively like resistors in series. Small airways provide
parallel resistance pathways and contribute <10% of total airway resistance. It was only
from the 1960s onwards that the role of small airways was investigated and appreciated,
prior to this it was thought to be mainly due to large airway disease. A review by Kraft
(23) nicely outlines the timeline of the then emerging physiological and pathological
evidence which showed the vital role the small airways plays in asthma.
Traditionally, histopathology has been used to study the structural and inflammatory
changes seen in the large and small airways in asthma. This requires ex vivo tissue
samples to be obtained. The most commonly used techniques are sputum samples,
biopsies and bronchoalveolar lavages taken during bronchoscopy. Direct examination
of small airways is only really feasible if transbronchial biopsies are obtained or if

7
resected lung tissue is available. Direct histopathological examination of small airways
in asthma is therefore difficult.
1.1.3.1.5 Tissue to organ: The role of Quantitative Computed Tomography (QCT)
As discussed above, there is thought to be great variation between asthmatics in their
inflammatory and remodelling responses, these abnormal responses often lead to
structural changes. However, irrespective of the exact histopathological cause behind
the altered structure, abnormal structure leads to generalised symptoms at the clinical
level; such as breathlessness, wheeze, cough. It is at this point it is possible to
appreciate how a disease like asthma, despite the histopathological heterogeneity, can
be hard to phenotype at a clinical level. As yet there is not an accepted single “best
tool” which probes the lungs at organ level, examining abnormal structure. This is
where QCT would fit in.
Quantitative Computed Tomography,(QCT) is able to examine lung structure, proximal
and distal, in in vivo, and when done responsibly, repeatedly. It is therefore uniquely
placed to run alongside the more traditional methods to probe the lungs at the
tissue/organ level.
QCT, its background and parameters is discussed in Introduction section 1.4.
1.1.3.2 Temporal scales of severe asthma
Interactions across the spatial scales occur over different timescales. Airway
inflammation is diverse, but results in a common pathway of airway wall remodelling,
alterations in geometry and biomechanical properties, airway obstruction with mucus
plugging and small airway closure. Together these processes result in impaired airflow

8
and gas exchange, increased susceptibility to exacerbations and “pruning” of airways as
seen on CT. Traditionally, these events are considered to occur sequentially over years,
but this is inconsistent with some observations related to severe asthma. For example,
whether severe asthma represents a distinct disease entity or part of the asthma
spectrum remains controversial. The basis of this controversy is largely our lack of
understanding of whether severe asthma develops over time in sufferers with initially
mild disease or whether severe disease presents de novo. The natural history of the
disease is poorly understood and severe disease can occur very early in life 'early onset'
or later in life 'late onset'. Both hospital admission and need for intensive care can be
the first presentation of asthma without any apparent history of mild disease.
Remodelling might occur largely in parallel with inflammation or the development of
remodelling might occur over shorter timescales than previously considered. To fully
understand the dynamics of the interactions between the spatial scales described above
we need to focus future attention to the natural history of disease. In order to do this a
repeatable and reliable tool is needed. QCT, when done responsibly and with careful
monitoring can be used repeatedly over time. Another way to probe natural history is by
observing response to therapy particularly if emerging therapies are able to modify
disease.
1.1.4 Treating severe asthma
ICS and long-acting bronchodilators have remained the mainstay of therapy in asthma
for the past 20 years despite an increase in the understanding of asthma pathogenesis.
Current therapies and treatments in late phase development predominately target
specific severe asthma domains. The greatest focus has been upon Th2-mediated

9
eosinophilic airway inflammation and ASM dysfunction. However, new targets are
emerging as it has become apparent that there is a complex role for inflammation
beyond Th2. Critically, in addition to persistent symptoms and exacerbations, severe
asthma is also characterised by progressive decline in lung function and development of
persistent airflow obstruction, as a consequence of remodelling. To date this is largely
refractory to current therapy. Therefore, targeting airway remodelling remains a major
challenge of severe asthma. These domains and the role of current and future therapies
approaching the clinic in targeting these domains is summarised in Figure 1.2.
1.1.4.1 Th2-directed therapies –current therapies
1.1.4.1.1 Corticosteroids
ICS are well studied and convincingly demonstrate a reduction in exacerbation
frequency across the spectrum of severity. However, studies consistently show that the
major benefit occurs in patients with eosinophilic airway inflammation (26). A meta-
analysis of randomised controlled trials looking at titrating corticosteroid dose
according to sputum eosinophilia concluded that sputum-based strategies were effective
in reducing exacerbations in adults with asthma without a net increase in mean inhaled
corticosteroid dose (27).
1.1.4.1.2 Anti-leukotriene drugs
Anti-leukotriene drugs are an adjunctive in the management of chronic asthma. They
are primarily used in patients who are not controlled on ICS. Evidence suggests that
anti-leukotriene drugs may be particularly effective in exercise-induced
bronchoconstriction and aspirin-intolerant asthma (28).

10
1.1.4.1.3 Anti-IgE
Omalizumab is a humanised anti-IgE monoclonal antibody. A systematic review of
placebo-controlled trials of omalizumab in moderate or severe allergic asthma showed
that it reduced exacerbation frequency and facilitated corticosteroid withdrawal (29).
Currently omalizumab is only used in severe uncontrolled allergic asthmatics that have
raised IgE levels and a positive skin prick test to a perennial allergen.
1.1.4.2 Th2-directed therapies –future therapies
1.1.4.2.1 Chemoattractant Receptor-homologous molecule expressed on Th2 cells
(CRTh2) antagonism
Prostaglandin-D2 (PGD2) is primarily released by IgE-activated mast cells. PDG2
recruits Th2 helper cells and recruits and activates eosinophils through its action on
CRTH2, (also known as Prostaglandin D2 receptor DP2), G-protein-coupled receptor
expressed on these cells (30,31). DP2 has also been identified on airway epithelial cells
(32), and epithelial cells are known to be involved with airway remodelling (33), it is
therefore possible, that a drug targeting DP2 receptor may also influence remodelling.
A 12 week study showed reduced eosinophilic inflammation in bronchial biopsy and
sputum as well as improvements in lung function and health status (study 3.3).
1.1.4.2.2 Anti-IL5, Anti-IL4 and Anti-IL13
Interleukin-5 (IL-5) is vital for eosinophil survival, maturation and activation.
Mepolizumab, an IL-5 monoclonal antibody, has been shown to significantly reduce
exacerbation frequency, improve Asthma Quality of Life Questionnaire (AQLQ) scores
and allow oral prednisolone dose reduction (34,35), in subjects with refractory

11
eosinophilic asthma despite high dose corticosteroids. Following cessation of therapy
benefits were lost within 3 months (34). Reslizumab, another IL-5 monoclonal
antibody, has demonstrated encouraging results when used by eosinophilic asthmatics
with uncontrolled asthma despite medium-high dose ICS. It has been found to
significantly reduce exacerbation frequency, increase time to first exacerbation and
there were statistically significantly improvements in FEV1, Asthma questionnaires and
blood eosinophil levels (36).
Benralizumab, targets the IL-5 receptor, is effective in reducing blood, sputum and
tissue eosinophilic inflammation (34,37). It has also been shown to reduce asthma
exacerbations in higher doses (38) and in the acute setting, improved rate of recovery
when given at the onset of an exacerbation (39). Results from further phase III studies
are awaited (40).
Tralokinumab, a humanized IL-13 antibody improved lung function in a trial of 219
poorly controlled asthmatics (41,42). The effects were more pronounced in patients
who had high serum periostin, an extracellular protein produced by epithelial cells in
response to IL-13 activation. Phase IIb study subgroup analysis, showed a trend of
exacerbation reduction in asthmatics not on oral corticosteroids. Phase III trials
evaluating the targeted treatment of this sub group with Tralokinumab are currently on
going (40). Lebrikizumab, also an IL-13 monoclonal antibody currently being evaluated
at phase III stage (40). It too appears to have the greatest effect when targeted to
asthmatics with high periostin levels and blood eosinophilia (43).

12
Dupilumab is an IL-4 receptor (subunit)antibody, with the ability to block both the
IL-4 and IL-13 pathways is also at phase III trial stage (40). Phase II studies suggested
that Dupliumab reduced asthma exacerbations when compared to placebo (44).
1.1.4.3 Airway Smooth Muscle Dysfunction – current therapies
1.1.4.3.1 Long-acting Beta-2 adrenergic agonists (LABAs)
The addition of LABAs to ICS improves symptoms, lung function and reduces
exacerbations. Evidence suggests that clinical response to LABAs may be affected by
polymorphisms in the β2-adrenoceptor gene. Most commonly seen polymorphisms are
at codons 16 (Arg16Gly) and 27 (Gln27Glu) (45). Patients who are Arg/Arg
homozygous at codon 16 may be at increased risk of exacerbations, particularly when
treated with LABAs.
1.1.4.3.2 Methylxanthines
Methylxanthines exert both bronchodilator and anti-inflammatory effects on the
airways and improve AHR and lung function. It is thought to inhibit phosphodiesterase
type VI isoenzyme, which has been shown to relax human ASM and also to have a
direct anti-inflammatory effect (46). Methylxanthines also increase corticosteroid
responsiveness (47). However, the use of methylxanthines in asthma has always been
limited by their significant adverse event profile and a narrow therapeutic index.

13
1.1.4.4 Airway Smooth Muscle Dysfunction – future therapies
1.1.4.4.1 Long-acting anticholinergic agents (LAMAs)
There is growing evidence that LAMAs may have a role in achieving control in cases of
refractory asthma. Peters et al. looked at 210 asthmatics requiring ICS and showed that
the addition of tiotropium bromide, a LAMA widely used in the treatment of COPD, to
asthma treatment was superior to doubling ICS dose, and non-inferior to adding
salmeterol, a LABA commonly used in asthma, when measuring morning peak flows
(48). It has also been found to increase in FEV1 which was positively correlated to the
proportion of neutrophils in induced sputum (49), and reduce exacerbations (50).
1.1.4.5 Airway remodelling – current Therapies
1.1.4.5.1 Mechanotransduction and breathing exercises
Mechanotransduction refers to the effects mechanical forces have on cellular function.
In asthma this particularly refers to the mechanical distortion of airway muscosa during
bronchoconstriction. Grainge et al. found that irrespective of the stimulus of
bronchoconstriction, airway remodelling was evident in mild atopic asthmatics, and it
was independent of eosinophil recruitment (51). Another study, which focused more on
clinic measures, found that attending personal breathing training improved AQLQ
scores more than attending non personalised asthma teaching sessions (52).
1.1.4.5.2 Bronchial Thermoplasty
The therapeutic use of radiofrequency is well established in cardiology for treating
arrhythmias. Bronchial thermoplasty (BT), a novel technique that uses radiofrequency
to heat the airways, is the only FDA-approved asthma therapy that directly targets

14
airway remodelling. BT is directed to the proximal conducting airways and aims to
reduce the airway smooth muscle mass as demonstrated in earlier dos studies (53). The
first human trial was in 9 cancer patients who had BT applied to lung segments that
were due for resection. This showed a 50% reduction in airway smooth muscle mass
(54). The AIR trial showed improvements, following BT, in asthma control and AQLQ
scores in mild-to-moderate asthmatics, but not lung function (55). Similar benefits were
confirmed in patients with severe asthma (56). The AIR2 trial studied 288 asthmatics
and showed beneficial effects in the BT group when compared to the sham treatment,
including health status and reduced exacerbations (57). Initial follow up studies suggest
that the improvement in symptoms seem to last at least 5 years. All studies have shown
a small increase in short term adverse events in patients undergoing bronchial
thermoplasty, including higher rates of pneumonia, hospitalisation and lobar collapse.
Therefore predictors of benefit and risk are required.

15
1.2 Chronic Obstructive Airways Disease (COPD)
Emphysema was described as “voluminous lung” by Bonet in 1679. Other descriptions
of emphysema in the lungs came from Morgagni in 1769 and Baille in 1789 (58). It was
not until 1814 that Badham identified chronic bronchitis, but he did not identify the
connection to emphysema. It was Laennec, the inventor of the stethoscope, a
pathologist and clinician who first described emphysema and chronic bronchitis
together (58) in 1837. Although the spirometer was invented in 1846, it was not until
the mid-1900s that the concept of FEV1 and FVC were introduced, and only in 1962
that the foundations for our current definitions of COPD were laid.
WHO, has defined COPD (59):
“Chronic Obstructive Pulmonary Disease (COPD) is a preventable and treatable
disease with some significant extrapulmonary effects that may contribute to the severity
in individual patients. Its pulmonary component is characterized by airflow limitation
that is not fully reversible. The airflow limitation is usually progressive and associated
with an abnormal inflammatory response of the lung to noxious particles or gases”
1.2.1 Disease burden of COPD
Globally, the leading causes of death are ischaemic heart disease, cerebrovascular
disease, lower respiratory tract infections and COPD, (currently 4th
). It is projected to
overtake lower respiratory tract infections and become third by 2030 (60). In the UK, in
2004, over 27,000 people died of COPD (61). It was also the leading respiratory related
reason for emergency hospital admission and accounted for over 20% of all respiratory

16
related hospital bed days (61), with an estimated healthcare cost of >£800 million a
year.
1.2.2 COPD exacerbations
Exacerbations are associated with increased severity of disease (62), poorer quality of
life and increased inflammation, both systemic and in the airways (63). An exacerbation
is defined as an event that results in hospitalisation or the prescription of a course of
antibiotics or corticosteroids (64). There are a subgroup of COPD sufferers who are
considered frequent exacerbators, >2 exacerbations per year. Prolonged exacerbations
in COPD patients are also associated with faster lung function decline (63).
1.2.3 Phenotyping COPD
COPD is thought to be mainly driven by two processes in particular, small airway
remodelling/obstruction and loss of lung elastic recoil leading to emphysema (65,66).
Emphysema was defined in the 1960s as “a condition of the lung characterized by
abnormal, permanent enlargement of the air spaces distal to the terminal bronchiole,
accompanied by destruction of their walls” (67).
Increased susceptibility to developing COPD is thought to be due to genetic factors, but
also the degree of oxidative stress the patient experiences (68). Imbalance between
oxidants and antioxidants not only increases the level of inflammation, but it disrupts
the balance between cell death and replenishment. This is thought to contribute to the
development of emphysema (68). Figure 1.3 outlines COPD pathogenesis.

17
1.2.3.1 Cells to Tissue
1.2.3.1.1 Cigarette smoke
Cigarette smoking accounts for more than 90 per cent of COPD cases in developed
countries (69). Smoking also appears to be a driving force behind the accelerated lung
function decline seen in COPD patients. Smoking cessation usually results in a return to
normal, or near normal lung function decline, whereas intermittent stopping confers less
benefit (70). However the inflammatory process may stay present for years after
smoking cessation in those with COPD (71).
All smokers have an inflammatory process occurring in the lung (72-79), but not all
will develop COPD. It is not yet possible to predict who will develop an amplified
response and who will never suffer from any symptoms (80). One hypothesis is that
those who develop COPD have a shift away from innate immunity response to an
adaptive autoimmune response (80,81). Exposure to cigarette smoke will activate the
innate immune system directly as well as indirectly through causing damage to the
epithelial cells (68).
As well as inducing chronic inflammation in the lung, chronic cigarette smoke causes
damage to epithelial cells and their tight junctions; this breaks the natural protective
physical barrier between the lung and the outside world, thereby promoting acute
inflammation (82-84). In addition, chronic cigarette exposure is known to supress the
mucocillary clearance, allowing bacterial pathogens are able to establish a foothold
(85). And cigarette smoke is thought to increase the expression of NK receptors on
epithelial cells, leading to NK cells attacking epithelial cells and perpetuating lung
damage (86). In mice, the chronic activation of this system leads to emphysema (87).
18
1.2.3.1.2 Neutrophils and eosinophils
Neutrophils are strongly associated with COPD and are found with increased frequency
in BAL, ASM and sputum (88). Increased levels of neutrophils in sputum are associated
with air flow obstruction (89). However levels in airways and lung parenchyma are not
increased (90). Neutrophils are thought to perpetuate the damage in the airways and
alveoli by increasing the release of, and directly secreting, proteolytic enzymes,
proteinases and oxidants.
The role of eosinophils in COPD is not well known. However increased numbers have
been seen in COPD sputum samples as well increased levels of IL-5 (91). It has been
thought they might represent a subgroup of COPD as, like in asthma, those with an
eosinophilia tend to have a better response to corticosteroids (89).
1.2.3.1.3 Bacterial infections
The role of bacterial induced inflammation in the airways in stable COPD is unclear,
but, infections are a cause of exacerbations. When stable, 25% of COPD patients will
be colonised by bacteria, most commonly H.Influenzae, S.Pneumonia, Moraxella
catarrhalis, however this doubles to 50% during exacerbations (92). Even in stable
COPD, H.Influenzae has been associated with neutrophilic airway inflammation and
poorer clinical outcomes (93).
1.2.3.1.4 Viral Infections
Viruses are seen in the sputum of 10-15% of stable COPD sufferers, and again this goes
up to 30-60% in exacerbations (94). Most commonly seen are rhinoviruses, influenza
and respiratory syncytial virus (95). One study inoculated a small number of COPD and
healthy smokers with experimental rhinovirus. COPD subjects recorded more severe

19
symptoms, worsening lung function, and longer duration of symptoms than healthy
smokers. In addition sputum viral load, sputum neutrophils and neutrophil elastase were
all higher in COPD subjects than the control group (94). Inoculation with rhinovirus has
also been associated with an increased bacterial load, H. Influenzae in particular (62).
1.2.3.1.5 Adaptive immune response
Adaptive immune response can be triggered by the DNA released by apoptotic cells,
including the body’s own cells and DNA, a potential trigger for an autoimmune
reaction. The main players in COPD’s adaptive immune response are CD8+ T cells,
CD4+ T cells, T helper 1 and Th helper 17 (90).
The innate and adaptive immune systems can enhance the other’s reactions to produce
excessive inflammation (81). It has been suggested that if, at an early stage, the innate
response does not dampen down, it may over stimulate the adaptive response leading to
lung damage and the development of COPD (81).
COPD sufferers have reduced levels of T-regulatory cells. They supress inflammation
and inhibit autoimmunity by producing anti-inflammatory cytokines like IL-10 and
TGF-β as well as supressed DCs (90).
1.2.3.2 Tissue – Organ
With advances in medical imaging, especially CT, it has become increasingly important
in the diagnosis and management of COPD. As well as providing insight into the
heterogeneity of the disease, clinical CT scans are able to demonstrate co-morbidities
such as interstitial lung disease and bronchiectasis, which may impact upon the
management of COPD (96), and emphysema is now essentially a radiological
diagnosis..

20
The extent to which multiple different pathologies may be seen on CT, in COPD, was
highlighted by a study by Bafadhel et al. They looked at 75 subjects with a diagnosis of
COPD whose CT scans underwent semi quantitative analysis by trained respiratory
radiologists. They found that emphysema, bronchiectasis and bronchial wall thickening
was seen in 67%, 27% and 27% of scans respectively, with almost 20% of subjects
having a combination of findings (96).
1.2.3.2.1 Emphysema
The lung is split into units, divided by septa. These represent areas of the lung supplied
by a single terminal bronchiole; this is made up of several acini. Centrilobular
emphysema is due to the destruction of these terminal bronchioles and is the most
common form of emphysema seen in smokers and predominates in the upper lobes.
Panacinar emphysema is seen more commonly in those with α-1 anti-trypsin deficiency
and in the lower lobes. Paraseptal emphysema occurs when the damage is near the septa
of the lung units (97).
It has been suggested that the distribution of emphysema influences lung function, as
those who have predominantly basal emphysema often have a larger reduction in FEV1,
but less impairment of gas exchange (98). An increase in emphysematous changes as
seen on CT have also been associated with worsening spirometry (99-102), gas
exchange (99), an increase in exacerbations (102), quality of life scores and worse
BODE index, (Body-mass index, airflow Obstruction, Dyspnoea and Exercise. The
BODE index uses these parameters to form a scoring system in COPD to try to predict
long term outcomes) (103).

21
1.2.3.2.2 Airway remodelling
Changes seen in the airways with COPD include smooth muscle hypertrophy, airway
fibrosis, inflammatory cell infiltration, mucus hypersecretion and disruption to the
epithelial layer (104).
Direct analysis by QCT can be made of the larger airways, to about the 6th
or 7th
generation (105). Studies have found that increase airway wall thickness has been
associated with worsening FEV1 (100), patients with worse chronic bronchitis
symptoms have higher percentage wall areas (106) and increased airway thickness is
associated with COPD exacerbations (102,107).
Terminal and respiratory bronchioles are beyond the resolution of CT scanners, and can
only be assessed indirectly. However it is thought to be in these small airways where
the earliest signs of COPD can be found, proceeding even emphysema (108,109). One
hypothesis for this is that the size of toxic particles is such that they reach, and remain
in, the transitional region of the airways (110) and are then able to stimulate an
inflammatory response.
Measurements of air trapping are the most commonly used indirect measure of small
airways on CT scans.
1.2.3.2.3 The role of QCT
When assessing the impact of inflammation and remodelling in COPD has on the lung,
QCT is uniquely placed to provide a global overview of the structural changes at the
organ level. As with asthma, QCT can run alongside and compliment histopathological
examination and clinical assessment.

22
1.3 Asthma and COPD; the clinical picture
Asthma and COPD, although different in many ways have a lot of clinical similarities
(111). In 1961, at the first Bronchitis Symposium, it was debated if asthma and COPD
were different disease entities or different expressions of the same disease (112). Now it
is generally accepted that they are different disease entities, with similarities, however
there is no hard evidence for this and debate still remains around this issue (112,113).
1.3.1 Comparing symptoms
Clinically, it can be difficult to distinguish between COPD and asthma. Clinical
differences are most apparent when comparing young non-smoking asthmatics to older
(>60years), COPD patients with an extensive smoking history (114-116). However it is
within the elderly population that it is hardest to distinguish between asthma and
COPD, with the incidence of both diseases increasing with age (117). A study done in
the UK showed that in males aged 40-49 COPD was present in 4.9%, where the
incidence for males aged 60-69 was 12.3%. The incidence of asthma also increased
with age; 4% of males aged 40-49 being affected compared to 9.6% in the 60-69 age
group (117).
Traditionally symptoms are used to distinguish between the diseases. Table 1.1
highlights the most common clinical differences between COPD and asthma. However
there can be a lot of cross over, and typical symptoms such as wheeze, cough, dyspnoea
can also be due to non-respiratory pathology, such as heart disease, reflux. Nonetheless
NICE still recommends using symptoms as the primary method to suspect and diagnose
COPD with spirometry (pre and post bronchodilator), to confirm it (118). History of

23
exposure to a possible aetiological agent, such as cigarette smoke, is also taken into
account when diagnosing COPD. Table 1.2 outlines the NICE guidelines for diagnosing
COPD.
Asthma and COPD are thought to share risk factors. It has been suggested that asthma
itself increases the risk of developing COPD (119).
Other risk factors include increased age, tobacco smoke exposure, bronchial hyper-
responsiveness and lower respiratory tract infections (119). COPD is strongly
associated with smoking whereas asthma is not. The majority of COPD sufferers are
current or ex-smokers, however only about 20% of smokers develop COPD (120).
1.3.2 Comparing physiology
Physiologically it can also be difficult to tell the diseases apart. As per the definitions in
sections 1.1 and 1.2, airflow obstruction in asthma is “often” reversible, whereas COPD
is “characterised” by non-reversible airflow obstruction. Again allowing overlap
between the two.
In 2010 NICE stated that reversibility is not necessary for diagnosing either disease,
and may at times be misleading (118).
Chronic asthma can lead to a fixed airflow obstruction picture, thought in part, to be
due to chronic bronchial hyper-responsiveness and remodelling (121). Vonk et al
followed up 228 asthmatics after 21-33 years (aged 13-44 at baseline) and found that
16% of them had developed irreversible airflow obstruction. These patients also had

24
more COPD like symptoms, whereas those who retained reversibility still had asthma-
like symptoms (122).
However there are some trends that do differentiate between COPD and asthma for the
majority of sufferers. For example, on the whole, those with COPD experience a
steadier decline in health. For most COPD sufferers, the rate of decline of FEV1
exceeds that seen in healthy individuals. Decline of FEV1 in COPD subjects is highly
variable (123), with published means of 50ml and 33ml, compared to ~20ml seen in
healthy subjects (69,123,124). In asthma, the annual decline in lung function has been
estimated to be around 38ml/yr, (124).
The other major difference between the diseases is that asthmatics rarely, if ever, get
emphysema, whereas in COPD this is a major aspect of the disease, often linked to
increased morbidity and mortality (125). McDonough et al (109) have shown that in
COPD small airway destruction precedes emphysema onset. Although similar work has
not yet been carried out in asthmatics, currently knowledge does suggest small airways
are also affected in asthma, however emphysema does not ensue.
Both diseases feature airway remodelling, thought to be due to airway inflammation.
However on the whole, mechanisms are different, as discussed above.

25
1.4 The discovery of x-rays, and origins of CT imaging
In the latter half of the 19th century the discoveries were made which formed the basic
principles for developing medical imaging with radiation.
Rontgen is considered to be the founding father of radiology as he discovered X-rays.
Within a few years of this Becquerel had discovered radioactivity and the Curies
isolated various radioactive isotopes.
1.4.1 Wilhem Roentgen (27th March 1845 – 10th February
1923)
Philipp Lenard had adapted a Crookes tube in order to have a window to allow the
cathode rays (electrons) out. These windows were covered with aluminium, thin enough
to allow “cathode rays” through, but also strong enough to maintain the vacuum in the
tube (126).
Roentgen, a German physicist, was working with the Lenard tubes confirming the
findings of Lenard, that cathode rays could penetrate the aluminium. He was wrapping
up the tube in tinfoil and cardboard to ensure no visible light was emanating from the
tube, and placing a screen, (a piece of cardboard painted with barium platinocyanide),
close to the window and observing the fluorescence.
He then repeated the experiment with the Hittorf-Crookes tube (no window present).
He wrapped this tube up and turned off the lights. He again observed the fluorescence
of the screen in front of the tube. As he was about to turn the lights back on, he noticed
out of the corner of his eye a faint light further away. It became apparent that this

26
fluorescence was also due to the cathode ray tube as the light flickered in time with the
discharges of the coil energising the tube.
This finding was unexpected as “cathode rays” were not known to travel those
distances. Over the next few weeks he investigated this phenomenon in order to
determine if this was simply unobserved properties of cathode rays or in fact an
undiscovered ray. He interrupted the rays with objects that were known to block
cathode rays. Whilst holding an object he noticed the outline of his finger bones could
be seen. He also investigated the effect magnetism had on these new rays, as it was
known that the direction of cathode rays would change in response to a magnetic field.
The final step in establishing that these were new rays as opposed to unobserved effects
of cathode rays, was to place a photographic plate in place of the screens (127).
On the 27th December 1895 he took the first radiograph; an exposure of his wife’s
hand.
He then concluded that this was a new type of ray, a highly penetrating one. Due to the
lack of knowledge about these new rays, he called them X-rays.
There are conflicting accounts of when he first made his discovery public knowledge
(126,127), however his paper, called “On a New Kind of Rays” was definitely known to
the rest of the world by 6th January 1896. The news of the discovery circulated fast and
the importance recognised immediately. His work was easily reproducible and the
scientific world was gripped by this discovery. This accumulated in Roentgen receiving
the first Nobel prize for physics in 1901.

27
Both the Lancet and the British Medical Journal hailed the discovery as remarkable
with far reaching consequences for medicine. The first x-rays taken in the UK were by
Mr AA Campbell Swinton and Mr G Stanton in the second week of January.
28
1.4.2 CT scan development – Sir Godfrey Hounsfield and
Allan Cormack
The invention of the CT scanner is attributed to Sir Godfrey Hounsfield (29th August
1919 – 12th August 2004), a British engineer in the 1960s, he first thought of the
theoretical principles of CT scanning image reconstruction while working for EMI Ldt.
He was inspired by work Cormack had done in the early 1960s. He had started to think
about the possibility of measuring X-rays through an object numerous times, “along
parallel lines”. Each line would then undergo mathematical analysis to establish the
linear attenuation coefficient of each line (128). Despite the papers being published,
they generated little interest until Hounsfield took it the next step and found a practical
application for it.
Hounsfield’s work was key in establishing the image reconstruction aspect of CT
scanning. He proved his theory, that it was possible to create accurate images using X-
rays, and by 1968 and began to do the initial tests.
His very first practical test was to use a gamma radiation source, Americium 95 to x-ray
the object in 160 slices. Each slice was x-rayed through at every degree through 180o. A
photon counter acted as the detector. It took him 9 days to complete this scan and 2.5
hours to reconstruction the data on an ICL 1905 mainframe computer. Hounsfield and
his team then moved onto to scanning animal body parts obtained from abattoirs.
However, this tended to produce artefact as the specimens would often decay due to the
long scanning time.

29
Hounsfield began to contact radiologists about his work, and in 1969 met Dr James
Ambrose, who arranged for Hounsfield to scan a bottled brain specimen (129). This
generated enough interest in the UK for the Department of Health to part fund the
building of the first clinical prototype. This was installed in Akinson Morley’s Hospital
in South London, where in 1971 the first patient (with a frontal lobe tumour) was
scanned.
Initially it was just heads that were scanned as the part of the body being scanned had to
be surrounded by water to reduce the dynamic range of the X-rays and hence improve
the attenuation. At this stage the images were being taken back to EMI to be processed,
(often taking about 20 minutes) and were brought back the following day to the hospital
(129).
By 1975 the first body scanner had been installed in Northwick Park Hospital. This
scanner model, known as the CT5005 became the prototype for the commercial
scanners, and by the following year 17 different companies were selling CT scanners.

30
1.4.3 CT scan development - Technology
Sir Godfrey’s initial CT scans (1st generation scanners,Figure 1.2 A), were simple
pencil beam radiation sources with a single detector (tube-detector assembly). The
movement of the radiation source and detector in a linear manner across the subject was
called translation.
After a translation is completed, the tube-detector assembly rotated by 1o and repeated
the translation process. In order to acquire the information for a single slice, the tube-
detector assembly had to rotate through 180o. These scans (only head scans at this
stage), would typically take 5-6 minutes.
In second generation scanners (Figure 1.2 B) the introduction of multiple X-ray beams
(form one source) and multiple detectors allowed scanning time to be reduced
dramatically.
Third generation scanners (Figure 1.4 C) kept the theory of multiple detectors, but the
main difference was the use of a fan beam. A fan beam took away the need for the
translation movement of the CT scanner. In place of separate detectors picking up a
single beam, an array of continuous detectors was placed. Third generation scanners are
also known as “single slice scanners”, and form the basis for the design of modern day
multi-slice scanners.
The next big step came over a decade later in the late 80s when slip-ring technology
removed the need for numerous wires in the gantry. With the slip ring speeding up
rotation times, the next issue to address to improve scanning time was to remove the

31
time taken to move the table. Up until now, the scanners were scanning, stopping,
moving the patient and then scanning again. ith the advent of the slip ring gantry, it
was now possible to continuously move and scan the patient. This gave rise to the
development of helical/spiral scanner. Finally it was possible to have continuous data
collection.
The last big leap in the structure of CT scanners came with the development of Multi-
Slice CT (MSCT) scanning (Figure 1.4. D) which is the basis for current scanners.

32
1.4.4 CT and image analysis
1.5.4.1 Development of Densitometry – emphysema markers
Densitometry is well established in quantifying emphysema. CT was shown to be a
more accurate method of diagnosing and quantifying emphysema (130,131) in the
1980s. As well as finding it more accurate than pulmonary function tests, Bergin et al
concluded that it also better distinguished moderate emphysema from healthy (130). All
these studies compared CT and pathological assessment and diagnosis of emphysema.
1.4.4.1.1 Voxel Index and Density masks
Density masks and the cut off of -950 Hounsfield Units (HU) were first investigated in
the 1980s, and was one of the first respiratory applications of QCT.
Hayhurst et al (132) studied eleven patients who had a diagnosis of bronchial
carcinoma, who had had CT prior to lung resection. All patients had similar lung
function, but six had mild centri-acinar emphysema.
They found that when those with emphysema had significantly more pixels with
attenuation values of -900 to -1000 HU.
Muller et al (133) took the next step to further define CT values for emphysema. The
General Electric scanner they were using had an inbuilt programme that highlighted
voxels within a given density range, “density masks”. Twenty-eight patients who were
undergoing lung resection for tumours were recruited. They compared density masks (-
920, -910, -900 HU) on a representative CT slice to the corresponding pathological
slice. All three had good correlation with the pathology score of emphysema, but -910
HU was the best. Kinsella et al later showed that increased emphysema (as defined by

33
amount of voxels under -910 HU), correlated well with various markers of decreased
lung function (e.g. FEV/FVC per cent predicted) (134).
The current use of -950 HU as the cut off for emphysema is due to some work done by
Gevenois et al (135). They looked at total of 63 patients who had been referred for
thoracic surgery over the course of one year. Patients were undergoing lobectomy or
pulmonectomy, however 4 were having transplants. Emyphsema was quantified
pathologically, and then compared to density masks at various levels (-900 to -970 HU
in increments of -10 HU). They found that the only level that produced the same
quantification as the pathological method was -950 HU.
1.4.4.1.2 Lung volume and densitometry
More recently studies have begun to look into quantifying the effects of lung volume on
density measures. In a study by Madani et al (136) 20 healthy subjects and 16 COPD
patients were scanned. Three 1mm thick slices, (level of the aortic arch, 2cm below the
carina, 3cm above the top of the diaphragm), were taken from each subject. Respiratory
effort was measured by patients breathing into a mouth piece which was attached to a
hand held spirometer. Vital Capacity (VC) was measured. Each anatomical level was
scanned at 100%, 90%, 80%, 70% and 50% of VC.
They found that per cent below -950HU in inspiration, (-950%VI) was significantly
different between the all levels of VC. Of interest, they did note that -950%VI for
70%VC-100%VC was relatively linear in both COPD and health. At 90% VC the under
estimation of -950I% was 3% in the control group and 2% in the COPD group. Total
Lung Capacity (TLC) is a highly reproducible measure. Taking these two factors into
consideration, they concluded that in practice, spirometric gating is too time consuming
34
and technically awkward to be worth doing, if patients are actively encouraged to reach
TLC when being scanned.
1.4.4.1.3 Percentile 15
The HU at which 15% of the voxels lie below, also known as Percentile 15 (Perc15), is
another marker of emphysema that was developed after -950%VI, but is widely used in
QCT COPD papers. Figure 1. 5 shows how both Perc15 and -950%VI are calculated.
There is no direct evidence suggesting one method is superior to the other; however
there are suggestions that Perc15 is a more consistent measure, not threshold dependent
and less dependent on inspiratory volume (137,138). Parr et al found good correlation
between Perc15 and -950%VI, and in particular noted that it was a curvilinear
relationship. This means that Perc15 is a more sensitive measure in early disease,
whereas -950%I is more sensitive to small changes in severe disease (139,140). Perc15
has also been shown to be a reliable method to follow emphysema changes over time
(139,141). An expert review also found Perc15 to be a more reliable measure than -
950%VI (138).
Density measures have been, to a very large extent, been disregarded in asthma, and
certainly have not undergone the same pathological validation. Therefore, we only have
the measures provided in COPD to use in asthma. In our own cohort, we plotted
asthmatic Perc15 against -950%VI, Figure 1.6. This showed the same pattern that Parr
et al described, however it appears to be more linear. As asthmatics are generally
considered not to have emphysema, therefore should have low levels of low density, it
adds weight to the argument to use Perc15 when comparing asthma and COPD as
Perc15 is better at distinguishing between low levels of low attenuation areas (139,142).

35
One study looked at 70 healthy young men’s lung density measures and found that the
upper limit of normal for -950%VI was 2.73% and -936 HU for Perc15 (143).
1.4.4.2 Development of Densitometry – Air trapping markers
Various methods have been developed to look at air trapping. Unlike emphysema, it is
not possible to conduct pathological validation of air trapping markers as this is a
physiological state. Air trapping refers to a dysfunction of the lung that leads to air not
being fully expelled in expiration, therefore reducing the efficiency of the lung.
An early attempt at quantifying air trapping in asthmatics was done by Newman et al,
who scanned part of the lower lobes in 18 asthmatics and 22 healthy controls. They
found the asthmatics had a significantly lower mean pixel index than the healthy
controls (144). This finding, assumed to be due to air trapping, correlated with
worsening lung function.
However it was noted that just looking at the Mean Lung Density (MLD), or Mean
Pixel Index, in expiration, did not fully remove the influence of emphysema.
In 1997, the ratio between Mean Lung Density in Expiration over Inspiration (MLDE/I,)
was reported by Eda et al (145). Another group found that MLDE/I reflected small
airway dysfunction irrespective of levels of emphysema (146). Since the late 1990s,
MLDE/I has been increasingly used and is now a well-established, and frequently quoted
surrogate measure of air trapping/small airway disease.
Another method developed to try to remove the influence of emphysematous voxels on
measures of small airway disease was Relative Volume Change. This is defined as “the
difference between expiratory and inspiratory values for relative lung volumes, which is
the limited lung volume with attenuation between -856 to -950HU divided by the lung
volume without emphysema”(147). Matsuoka et al, one of the first to describe this

36
method found the best range to look at to assess small airway disease was -860HU to -
950HU (148). However since then -856 HU and -850 HU have been established as the
upper end of normal lung attenuation in expiration.
A study was done to look at which of the two methods, (-856%E and MLDE/I), were the
most robust. This study included 45 smokers who were in lung cancer screening
programmes and had had 2 CT scans in a space of 3 months. They found that MLDE/I
was more reliable (149). Hersh et al (147) however looked at 3 surrogates of small
airway disease, -856%E, MLDE/I and Relative Volume Change. They found that both
MLDE/I and Relative Volume Change were good markers of small airway disease and
were unable to claim one was superior to the other, but noted that MLDE/I was a simpler
calculation.
1.4.4.3 Development of airway analysis
Airway remodelling is an area of research in both asthma and COPD. Post mortem
studies in asthmatics have shown that patients who die of asthma attacks have thickened
airways. This is partly due to acute changes such as inflammatory cell infiltration and
into the airways and oedema. But structural changes have also been noted, involving all
layers, especially ASM (150,151). The latter is considered a product of chronic
inflammation (152-154), so in theory should be possible to study in a non-acute setting.
Initially, geometry measures were mostly done based on subjective methods. In 1993
Lynch et al did a study looking at bronchial dilatation. Dilatation was defined as the
airway lumen circumference greater than the outer circumference of the accompanying

37
artery (155). Boulet et al (156) added a little more objectivity to their study looking at
airway wall thickness by measuring the smallest internal diameter of the right
intermediary bronchus, and the adjacent airway wall, with electronic callipers. Another
early method used to better quantify airway dimensions was manually tracing the lumen
and outer perimeters (157-159). However this was still dependent on subjective analysis
of the oblique-ness of the airway being measured and the manual tracing of areas. It
was from these early days, when the orientation of the branch was important, that RB1
became the standard branch to measure as it was most often perpendicular to the slice
of the scan. Wood et al (160) became one the first to computationally segment the
airways and used the reconstruction to orientate the airway obliquely so that it was a
true cross section that was being measured.
One of the first quantitative methods introduced was determining airway wall
boundaries using the “Full Width Half Maximum” principle (159,161), Explained in
Figure 1.7. However this method has been shown to systematically under estimate
lumen area, overestimate total area and therefore over estimate wall thickness (161) in
smaller airways.
Currently there are many methods for airway segmentation available, further discussion
can be found the methods section 2.3.2.

38
1.5 Hypothesis
I hypothesise that quantitative computed tomography measures of airway wall
remodelling, gas trapping and emphysema can be applied to provide important insights
into the phenotypic heterogeneity of asthma and COPD; the association with lung
function and immunohistology and its application in stratified medicine intervention
studies.
Sub-hypotheses
1. I hypothesise that QCT morphometry and densitometry measures of proximal
airway remodelling, air-trapping and emphysema are different between asthma,
COPD and healthy subjects.
2. I hypothesise that in asthma and COPD, the association between lung function
impairment (post-bronchodilator FEV1 % predicted) and QCT morphometry and
densitometry measures are distinct.
3. I hypothesis that airway remodelling, determined in bronchial biopsies, is
associated with QCT morphometry and densitometry measures of proximal
airway remodelling and air-trapping.
4. I hypothesis QCT can detect changes in the airway and lungs of patients who
receive targeted treatment of eosinophilic asthma.

39
1.6 Aims
Relationship Between Lung Function and Quantitative Computed Tomography
Parameters of Airway Remodelling, Air-trapping and Emphysema in Asthma and
COPD: A Single Center Study.
Sub-hypotheses 1&2
Aim 1. To assess the differences of QCT derived measures of proximal
(segmental) airways, between obstructive airway diseases (asthma and COPD),
as well as comparing them to healthy airways.
Aim 2. To assess the differences of QCT derived measures of emphysema and
air trapping, between obstructive airway diseases (asthma and COPD), as well
as comparing them to healthy airways.
Aim 3. To demonstrate distinct QCT groups within, and between, asthma and
COPD according to airflow limitation.
Aim 4. To identify links between clinical measures of disease and health status,
and QCT parameters.
Associations in asthma between quantitative computed tomography and bronchial
biopsy-derived airway remodelling
Sub-hypothesis 3
Aim 5. To demonstrate a link between biopsy assessment of airway remodelling
and QCT changes.
40
Aim 6. To investigate and develop novel interpretations of densitometry
findings in asthma.
Randomised controlled trial of the prostaglandin D2 receptor 2 antagonist
fevipiprant in persistent eosinophilic asthma
Sub-hypothesis 4
Aim 7. To assess the effects of 12 weeks of therapy with Fevipiprant, a CRTH2
receptor antagonist, on sputum eosinophilia, spirometry and QCT assessed
morphometry, densitometry and lung volumes.

41
1.7 Tables and Figures
Table 1.1 Clinical features differentiating COPD and asthma
(118)
COPD Asthma
Smoker or ex-smoker Nearly all Possibly
Symptoms under age 35 Rare Often
Chronic productive cough Common Uncommon
Breathlessness Persistent and progressive Variable
Night waking with breathlessness
and/or wheeze
Uncommon Common
Significant diurnal or day to day
variability
Uncommon Common

42
Table 1.2 Guidelines to diagnosis COPD based on clinical
history/symptoms (118)
History (≥2 features) Risk Factors Uncommon features
>35 years Weight loss Chest pain
Smoking history Effort intolerance Haemoptysis
Dyspnoea* Waking at night
Chronic cough Occupational hazards
Regular sputum production Fatigue
Frequent winter bronchitis
Wheeze

43
Figure 1.1
Schematic diagram of the pathogenesis of asthma illustrating the role of Th2 and non-Th2 pathways driving interactions between
inflammatory cells and the structural components of the airway and the consequent development of airway remodelling

44
Figure 1.2 Asthma pathological domains, current and future (italicised) treatments
Asthma
Th2 Inflammation
Non-Th2 Inflammation
Airway remodelling
Smooth muscle dysfunction
Corticosteriods Anti-leukotrienes Anti-IgE
IL-5 (R), IL-13, IL-4R, CrTh2, tyrosine kinase inhibitors
Antibiotics Antifungals
Anti-IL-17 Anti-CXCR2 (Anti-TNF alpha)
Bronchial thermoplasty Corticosteriods Breathing techniques
Anti-Th2/Non Th2 Anti-angiogensis
SABA SAMA LABA Theophylline
LAMA Anti IL-13, Anti IL-17
Co-morbidities
Adherence

45
Figure 1.3 Schematic diagram of the pathogenesis of COPD

46
Figure 1.4 CT scanner evolution
A – first generation scanner, B – second generation scanner, C – third generation scanner, D – multi slice CT scanner

47
Figure 1.5 Graphical representation of the method of calculating percentile 15 and
%VI-950.
-1000 HU
-950 HU
100%
50%
15%
-950%VI
Perc15
Cumulative frequency graph of voxels
0%

48
Figure 1.6 Plot of VI -950 against Percentile 15 in asthmatics.

49
Figure 1.7 Schematic representation of full width half maximum principle. This
method plots the HU of the voxels across a “ray” which starts at the lumen centre and
goes into the tissues beyond the bronchus. The HU level half way between the
maximum and minimum HU levels is noted and this is considered the HU of the wall.
The area that is within that level is defined as the airway wall
HU
+1000
-1000
Half maximum attenuation
Path of the ray
Full width of the half max area = airway wall

50
2 METHODS

51
2.1 Clinical Methods
2.1.1 Tests in both Asthmatic and COPD cohorts
2.1.1.1 Baseline demographics
The basic demographics that were collected were details such as; clinical history,
medication, smoking status and history, age, height, weight, occupational history,
exacerbation frequency.
2.1.1.2 Electrocardiogram (ECG)
These were done as routine in the COPD cohort. However it was not done as routine in
all the asthmatics. It was done if the subjects were going to have a bronchoscopy, or if
they were part of an interventional study.
2.1.1.3 Peripheral blood samples
Routine clinical bloods were taken to include full blood count, in particular eosinophil
and neutrophil count.
In Asthmatics total IgE was also collected. If Skin Prick Testing (see section 2.1.2.1),
was not done, blood IgEs were obtained where possible in the asthmatic cohort.
If subjects were going on to have a bronchoscopy, then a coagulation screen was also
done.
2.1.1.4 Spirometry and lung function tests
Spirometry was done by the clinical team, or as part of the pulmonary function tests,
according to ATS/ERS guidelines (162).

52
The clinical team used a wedge bellow spirometer (Vitalograph, Gold Standard,
Buckinghamshire, UK).
Where possible, reversibility was assessed 15-20 minutes after taking 200-400µg of
salbutamol via a spacer, or 2.5mg of salbutamol via a nebuliser. FEV1, FVC were
repeated, best effort was recorded.
Full lung function was assessed in respiratory physiology by trained physiologists
according to American Thoracic Society (ATS)/European Respiratory Socieity (ERS)
guidelines (163,164). Either body plethysmography (Medisoft, constant volume, body
box) or helium dilution (Spiro Air, Medisoft, Belguim) was used.
2.1.1.5 Sputum Collection/Induction
All subjects were required to provide a sputum sample. Same participants provided
spontaneous sputum samples and others needed induced sputum to provide a sample.
Induced sputum was completed after spirometry and bronchodilator response. Baseline
spirometry was measured, as occasionally saline can case bronchospasm. Subjects
inhaled 200-400 µg of salbutamol and waited 15-20 mins after which spirometry
measurements were repeated. The highest FEV1 value post salbutamol administration
was used to calculate any subsequent fall in FEV1 during the test.
Saline was administered in increasing concentrations (3%, 4% and 5% if needed), by an
ultrasonic nebuliser (Easyneb II ultrasonic nebuliser. Flow rate up to 1.0 ml/min,
FLAEMNUOVA). Subjects were instructed to continue normal tidal breathing via the
nebuliser for the duration of the saline administration, (5minutes).

53
After each administration of saline, subjects were asked to rinse their mouth and blow
their noses prior to sputum expectoration. Subjects were asked to attempt to cough
sputum into a plastic sputum pot using a deep cough. Several attempts at coughing were
made until the sound of the cough became dry and unproductive.
After each administration FEV1 was repeated, and the test repeated if needed, with a
higher concentration of saline as long as the FEV1 had not fallen by more than or equal
to 10% of the highest post-bronchodilator value. If the FEV1 had fallen by more than or
equal to 10% then the same concentration of saline was administered for the remaining
induction procedure. Subjects did not breathe saline for > 15 minutes in total.
The test finished when any of these outcomes was reached:
Sufficient sputum obtained
Subject unable to tolerate test
Breathing saline for 15 minutes
No sputum after administration of 5% saline
FEV1 falls by ≥20% baseline value
If subjects FEV1 had dropped by 20% or more or they experienced severe symptoms
such as breathlessness or wheeze a further 200µg of salbutamol was administered and
the subjects were monitored until their FEV1 returned to 95% of baseline pre-
bronchodilator FEV1.
54
2.1.1.6 Visual Analogue Scores
This questionnaire assessed the subject’s perception of the severity of their symptoms.
Asthmatic subjects are asked to assess the symptoms of cough, breathlessness and
wheeze. Whereas COPD subjects assess the symptoms of cough, dyspnoea, sputum
production and sputum purulence.
Each symptom is beside a 100 mm line, this represents a continuous scale, with the left
hand side being no symptoms, and the right hand end of the scale representing the worst
they have ever felt with that symptom. They are then asked to mark along the 100mm
line where they feel they lie along that scale on that day.
This is repeated for each symptom.
The healthcare professional then measures the length of the mark in mm which gives
the score for each symptom (165).
2.1.1.7 Bronchoscopy and biopsy sampling
Bronchoscopies were performed by blinded senior clinicians, according to guidelines
(166). Endobronchial biopsies were obtained from the carinas of the segmental or
subsegmental airways.
Subjects provided informed, written consent for the procedure, which was taken in the
setting of a clinical visit weeks or months before the procedure. Consent was also
confirmed on the day.
In order to eligible to undergo a research bronchoscopy +/- biopsy +/- BAL subjects
had spirometry, ECG and clotting checked. In order to proceed, FEV1 had to be greater
than 1L, ECG had to be stable and clotting normal.
On the day asthmatics and COPD subjects had 5ml nebulised salbutamol pre
bronchoscopy and a cannula placed if sedation was requested. All subjects had a local

55
anaesthetic spray pre procedure. During the procedure all subjects had nasal oxygen and
had oxygen sats, pulse and three lead ECG monitoring.
Post bronchoscopy subjects were observed for 2 hours, whilst being nil by mouth, and if
stable they would be discharged home.

56
2.1.2 Tests performed only in Asthma cohorts
2.1.2.1 Skin Prick Testing
Common allergens were tested, such as sensitivity to; dog, cat, house dust mite, grass
pollen and moulds. Histamine and saline were used as positive and negative controls
respectively. The test was considered positive if, after 15 minutes there was a weal with
a diameter 2mm greater than the negative control. Subjects were asked to not take any
anti-histamine medication 48-72 hours prior to testing.
2.1.2.2 Fractional exhaled nitric oxide (FENO)
Using an online chemoluminescence analyser (NIOX Mino; Aerocrine, Stockholm,
Sweden) FENO was measured at a flow rate of 50 mL/s (167).
2.1.2.3 Methacholine challenge test (PC20)
1 is measured. Bronchial hyper-responsiveness is diagnosed when there is a 20% drop in
FEV1. The concentration of methacholine needed to induce this change is then
documented.
Anti-histamines were withheld for 48 hours prior to testing. Long acting beta agonists
and ipratropium bromide were withheld for 24 hours prior to testing. Short acting beta
agonists were withheld for 6 hours prior to testing.
This test was contraindicated if subjects had:
FEV1 <60% predicted
FEV1 < 1L
Poorly controlled hypertension
Aortic aneurysm
Myocardial infarction or stroke in past 3 months

57
FEV1 drop of >10% after inhaling saline
Providing they were fit to continue with the test, they were given methacholine via a
Wrights nebuliser, with a nose clip to ensure tidal breathing was entirely via the mouth.
The methacholine concentration started at 0.03 mg/ml. Each dose was administered for
2 minutes and doubled with each successive administration to a maximum of 16 mg/ml.
FEV1 was tested at 30 seconds and 90 seconds post administration. If the reading at 90
seconds was less than the reading at 30 then an third reading was taken 3 minutes post
administration. The lowest FEV1 was used to calculate the drop from baseline. If this
was 20% or more the test was considered positive at that concentration and the test was
stopped.
2.1.2.4 Asthma Control Questionnaire (ACQ)
This questionnaire is set out into seven parts. It requests that the subjects answer the
questions in relation to how they have been in the past week.
Six of the seven parts are questions dependant on the subject’s perception of their
symptoms. A score of ≥1.57 represents suboptimal control and a change of 0.5 or more
is considered clinically significant (168).
The seventh part to the questionnaire is FEV1 dependent and is filled out by the
healthcare professional. The modified ACQ (averaging the first 6 questions only), has
also been validated (169).
Each question has options 0-6 as answers, with 6 always denoting the most severe and 0
most mild.
The questions relate to either how the subject’s asthma, or “symptoms of asthma” have
been at various time points, such as at night, first thing in the morning, when doing
daily activities, or how bad the specific symptoms of shortness of breath and wheeze

58
have been. The final question for the subject to answer is the average frequency with
which they took their short acting beta agonist per day.
2.1.2.5 Asthma Quality of Life Questionnaires with Standardised Activities
(AQLQ(S))
This questionnaire is set out into four domains, each with their own set of questions.
The four domains are as follows; Symptoms (12 questions), activities (11 questions),
emotion (5 questions) and environment (4 questions). Each question is answered with a
scale of 1-7, with 7 always representing 7 the best quality of life and 1 the worst. It
requests that the subjects answer the questions in relation to how they have been in the
previous two weeks. Once filled out, the mean for whole questionnaire, and each
domain’s mean are calculated (170).

59
2.1.3 Tests performed only in COPD cohorts
2.1.4.4 Modified Medical Research Council Dyspnoea scale
This is the same as the MRC Dyspnoea scale, except it is graded 0-4 rather than 1-5. It
is simply a scale for subjects to state their level of breathlessness, with 0 representing
breathlessness only with strenuous exercise and 4 representing breathlessness onset
with dressing.
2.1.4.5 St George’s Respiratory Questionnaire for COPD patients (SGRQ-C)
This is in two parts. Part 1 is designed to assess how the subject has been over a longer
period of time, 1, 3 or 12 months. They are asked to score symptoms of cough, sputum,
shortness of breath, wheeze, chest trouble, good days and if the wheeze was worse in
the mornings.
Part 2 assesses how they are now and asks various questions about their chest condition
and what activities (if any) cause breathlessness. The score is calculated on a SGRQ-C
specific excel spreadsheet.

60
2.2 Laboratory Methods
2.2.1 Sputum processing
Collected sputum was inspected, and samples selected if it was free from salivary
contamination. Selected samples were weighed, processed as previously described
(171) and the resulting supernatant was assessed for viability, squamous cell
contamination and a total cell count was performed using a Neubauer haemocytometer
and the tryptan blue exclusion method. A differential cell count was carried out on a
Romanowski stained cytospin and was attained by counting more than 400 non
squamous cells.
2.2.2 Biopsy processing
Endobronchial biopsies were obtained as described in section 2.1.1.7. Biopsy samples
were embedded in glycol methacrylate or paraffin (replication group).
2.2.2.1 Glycol methacrylate samples
Once embedded in glycol methacrylate, sections measuring two micrometeres were cut
and stained with Haematoxylin & Eosin (H&E) and/or Periodic acid-Schiff (PAS).
Immunohistochemical staining required several different monoclonal antibodies (mAb)
in order to test for cells of a specific phenotype. The following mAbs or appropriate
isotope controls were used:
Anti–mast cell tryptase clone AA1 (Dako UK, Ely, United Kingdom).
Anti-alpha smooth muscle actin clone 1A4 (Dako UK, Ely, United Kingdom).

61
Anti-eosinophil major basic protein clone BMK-13 (Monosan, Uden, The
Netherlands).
Anti-neutrophil elastase clone NP57 (Dako UK, Ely, United Kingdom)A
Anti-endothelium clone EN4 (Monosan, Uden, The Netherlands).
ZEN 2012 image analysis software for light microscopy, (Carl Zeiss AG, Jena,
Germany) was used to evaluate the slides. A single researcher (RB), blinded to the
clinical characteristics of the subjects, assessed the slides.
Tissue section areas were measured in H&E and SMA stained sections. Total area,
airway smooth muscle area and epithelial area were measured directly, while lamina
propria area was calculated by subtracting the all the other areas and the area occupied
by vessels and lymphatics from the total section area. All areas were expressed in mm2
and also as percentages of the total area. All morphometry measurements and cellular
counts were performed by one blinded observer on two non-contiguous tissue sections
at least 20µm apart from the same biopsy block.
Reticular basement membrane (RBM) thickness was measured at x200 magnification
by measuring 50 points 20µm apart according to the method validated by Sullivan et al
(172). Epithelial thickness was measures using the method described by Cohen et al
(173). Briefly, areas of intact and tangentially orientated epithelium were identified and
measured. Subsequently, to calculate the epithelial thickness, this area was divided by
the lengths of the corresponding RBM. Both RBM and epithelial thickness were
expressed in µm. Vascularity was measured using the Chalkley count, a surrogate of
both vessel density and vascular area. As described previously, a Chalkley eyepiece
graticule (NG52 Chalkley Point Array, Pyser-SGI Ltd, Edenbridge, UK) was used at

62
x200 to measure Chalkley counts in four non-overlapping vascular hotspots (1-
2/section) (174). The mean Chalkley count (MCC) was calculated as the mean of the
four measurements. Epithelial integrity was assessed by measuring the lengths of intact
epithelial denuded epithelium. These were expressed as percentage of all the RBM
length present in the section. For inflammatory cell counts, submucosal nucleated
stained inflammatory cells (eosinophils, mast cells and neutrophils) were counted on the
corresponding stained sections and expressed at cells/mm2 of lamina propria.
2.2.2.2 Paraffin samples
Four micrometre sections were cut from the paraffin embedded biopsies and stained
with appropriate mAb or corresponding isotype control. This method was used in the
replication group of Study 3.2
63
2.3 Radiological Methods
2.3.1 Scanning protocols
2.3.1.1 Full thoracic Inspiratory and expiratory CT protocol
The scans are done caudo-crainally to try to reduce breathing artefacts.
This scanning protocol was specifically designed to be a high resolution, low dose
volumetric scan
The scans were obtained at full inspiration (near TLC) and at the end of expiration (near
FRC). All subjects were coached in the breath holding techniques, and practised breath
holding, immediately prior to scanning. All asthmatic and COPD subjects were scanned
within 60 minutes of receiving 400 micrograms of salbutamol via a spacer
kVp – The voltage going through the x-ray tube. It can be likened to the strength of the
beams.
mAs – The current going through the x-ray tube and can be likened to the volume of the
beams.
Care dose – This is an in built function to allow the mAs to change over the course of
the scan to allow for different mass of the body part(s) being imaged to maintain image
quality whilst not over irradiating (e.g. the head would need more mAs to get through
the skull than the chest wall and lungs). Care dose is turned off to ensure that the whole
thorax is scanned with the same “strength” of radiation beam. If this was not consistent,
it would not be possible to know if changes seen in attenuation are due to disease or
increased/decreased radiation reaching the detectors.

64
Det Configuration – (Detector Configuration), The numbers 16 x 0.75 means that 16
detectors with a length of 0.75 mm were used to collect the data (therefore 0.75mm is
also the minimum slice thickness).
Rotation time – Is the length of time the tube/detector mechanism takes to cover 360o.
Pitch – The meaning of this term is dependent on scanner type. For the scanners used in
these studies, it is a combination of the speed at which the table is moving through the
gantry and the rotation time. It can be likened to a telephone wire – a pitch of 1 is a coil
with no gaps, all of the body part undergoing investigation has been scanned in each
360o rotation. A pitch of less than 1 means there is overlap in what has been scanned. A
pitch of more than 1 means that by the time the 360o rotation has finished the table
would have moved, like the telephone wire has been pulled apart.
The radiographer would select the whole thorax from the scout images, using the lateral
scout image to ensure lung bases were included.
Reconstructions were done in accordance with the recommended settings by the QCT
software producers. Apollo® (by VIDA Diagnostics, Inc), recommended using B35,
and the other recons were taken over a range of kernels to allow for the possibility of
future software programmes needing different reconstructions.
All scans were analysed by a single observer (RH) using semi-automated software,
Apollo® (by VIDA Diagnostics, Inc) and various QCT parameters were obtained.
Scans from 76 subjects were analysed by two observers (RH and SG) for assessment of
inter-observer repeatability (see section 2.3.1.2).

65
2.3.1.2 Inter-observer repeatability of co-primary QCT parameters
Inter-observer repeatability was assessed (Cronbach’s alpha intra-class correlation
[ICC]) between two observers (RH and SG) in 76 subjects for Percentile 15
(ICC=0.996; p<0.001), MLD at inspiration (ICC=0.997; p<0.001) and expiration
(ICC=0.997; p<0.001), RB1 LA (ICC=0.873; p<0.001) and TA (ICC=0.873; p<0.001).
2.3.1.3 Limited Thoracic CT scan protocol
Study 3.2 used RB1 measurements from 14 limited scans. The limited scan protocol
was devised to specifically image RB1.
The same scanning protocol outlined in table 2.1 (Siemens 16) was used, with the
exception of length of the scan. Instead of selecting the whole thorax on the scout
image, the radiographer was instructed to scan only 53mm, using the carina as the lower
boundry.
Images were reconstructed using the B35 and B70 kernals, (as described in table 2.1).
2.3.1.4 Electron Dense (ED) Rods
In all scans, a lightweight foam box, (LD15, Styrotech Ldt, West Bromich), housing
three acrylic rods of known density, was placed on and lightly strapped to the subject’s
chest.
The three acrylic rods, (LN300, LN450 and “solid water”, Gammex – RMI Ldt,
Nottingham), were selected as they represented densities seen the lung and blood.
LN300, LN450 and “solid water” have and electron density relative to water of
0.28,0.40 and 0.99 respectively.

66
2.3.2 Analysis of computed tomography scans
For a summary of the main QCT parameters used please see table 2.2
2.3.2.1 Airway Segmentation
In general the main issues surrounding any method of airway segmentation are; airway
obstruction, movement artefacts, image reconstruction artefacts, low dose scans
(reduces contrast) (175), and severely diseased lungs (176). All these conditions make it
hard to segment correctly and runs a high risk of “leakage” of the airway growth into
lung parenchyma (177). Numerous different techniques have been developed for airway
segmentation (177).
Most segmentation methods have been validated against phantoms rather than
histological validation reference (178) lists studies that have used phantoms to validate
airways whilst presenting original data looking at histological airway validation.
Despite the paucity of studies that have directly compared QCT airway segmentation to
histology, the available data does suggest that QCT tends to over-estimate WA and
underestimate LA (178,179). Therefore, as long the analysis is all done on the same
software then it is comparable, but inter-software comparisons remain difficult.
2.3.2.2 Apollo® (by VIDA Diagnostics, Inc) airway segmentation
Fuzzy connectivity (FC) works on the principle that adjacent voxels belonging to the
same object are connected. Although the theory was developed in the late 70s, it wasn’t
until 1996 that it was used more practically for image segmentation (180).
The strength and similarity of the voxels is measured using an affinity function,
depending on the strength of the connection, a value between 0 and 1 is assigned to the
affinity function. As long as the value is greater than 0, voxels will be considered to be
67
fuzzy adjacent, this can be likened to the strength of a link in a chain. Often multiple
paths can be made between 2 voxels, the strength of the chain is determined by the
weakest link. However the overall level of connectedness is determined by the strongest
chain (181).
One disadvantage of the FC approach is the processing time. In order to combat this
issue, Apollo® (by VIDA Diagnostics, Inc) used small cylindrical regions of interest
(ROI). These ROIs reduce the need to process unnecessary voxels (therefore reduces
computing time), and will allow quicker detection of leaks (176). They validated their
method by comparing it to a well-established, published, region growing algorithm
which was developed to analyse low dose scans. They found that their algorithm
identifies more airway segments, identifies them more consistently and can reliably
segment low dose scans (176).
2.3.2.3 Apollo® (by VIDA Diagnostics, Inc) cross sectional measurements
Detection of the airway walls are guided by the airway tree centrelines and the
boundaries of the segmentation. The process is done firstly creating 2D slices in a plane
perpendicular to the airway. Each slice is then segmented into wall area and lumen area,
and these parameters are measured. This is repeated 10 times at regular intervals along
the airway. It is therefore possible to get values from 10% along the airway, 20%, 30%
etc. Throughout the studies, the measurements used to obtain the morphometry values
was the average of the middle 40% (i.e. at 30%, 40%, 50% and 60% point). This was to
reduce the influence of bifurcations of the airways on the values.

68
2.3.2.4 Apollo® (by VIDA Diagnostics, Inc) lung and lobe segmentation
Most lung segmentation can be divided into direct and indirect methods (182). Direct
methods (183-185) use algorithms to “look” for the fissures, as they are usually quite
bright thin lines when compared to the rest of the lung tissue. Indirect methods utilise
anatomical information to define the area that should belong to each lobe (182). An
important part of lung segmentation is to distinguish the lungs from the surrounding
cardiovascular and chest wall structures.
Apollo® (by VIDA Diagnostics, Inc) uses a multi-step method and utilises anatomical
information such as the airway branches and the vessel segmentation to guide lobar
segmentation into a Region of Interest (ROI), and then uses an algorithm to look for
contrast within this ROI to pin point fissure lines.
Apollo® (by VIDA Diagnostics, Inc) lung and lobe segmentation process was
investigated by Henne et al (186). They obtained human lungs that were not
transplantable. There were no restrictions placed on the lungs examined such as
underlying disease, age, gender or height of the donor. The ex vivo lungs were scanned
after being filled with air to a static pressure of 20-30cm H2O (~TLC) and these images
were analysed using Apollo® (by VIDA Diagnostics, Inc) software.
Once scanned the lungs were deflated the lobes were demarcated. This was done by
inflating each lobe and marking the boundaries. The lungs weighed and then the lobes
were dissected along the marked lines. They found that the Apollo® (by VIDA
Diagnostics, Inc) software accurately estimate the mass of the lungs and lobes.

69
2.3.2.5 Low attenuation area (terminal airspace) complexity (LAC-D)
Density measurements traditionally quoted in texts focus on the overall area or volume
of lung tissue that falls within certain boundaries. For example, using percentile 15 or
percentage of voxels under -950 HU as a marker of emphysema.
However it is also possible to assess the number of, and size of, these low attenuation
clusters, drawing on the concept of fractal geometry. Fractals are scale free and self-
similar, many objects in nature display fractal patterns, including the lungs (187).
A study by Mishima et al (188) demonstrated the existence of a power law distribution
of Low Attenuation Clusters (LACs) and the numerical value of D, (where D represents
the gradient of a linear regression log-log plot of cluster size (x) against cumulative
frequency (y), Figure 2.1), in COPD and healthy subjects.
The value of D, is strongly related to the fractal dimension of the terminal air space, and
a low number indicates loss of complexity, as seen in emphysema (188).
2.3.2.6 Pi10, Po20
The use of Pi10 to assess small airways using linear regression from larger airway
dimensions was first introduced by Nakano et al (189). They compared geometry of
airways on CTs to the geometry of the same airways on histology. They found that the
larger airways did accurately predict the geometry of the smaller airways, (airways less
that 2mm diameter are below the resolution of most current CT scanners.) It was also
noted that CTs overestimated the %WA, especially in those airways less than 7.5mm.
Therefore they only used airways larger than 7.5mm diameter in the regression.
Subsequent papers have calculated Pi10 using at least 3 airways with a minimum
diameter of 6mm (65,190). Po20 is derived by applying the same concept of using
larger airways to predict smaller ones, but rather than predicting the dimensions of the

70
an airway with a 10mm internal perimeter, an airway with an external perimeter of
20mm is instead predicted.

71
2.4. Correction methods
2.4.1 Density correction
Recalibrating density measure to take into account blood and air values reduces the
effect of tube aging (191,192) and interscanner variability. It is thought that different
scanners can have a difference of up to 8 or 9 HU in their measurement of air
(137,193). Bakker et al found that this scanner difference can cause changes in lung
density of between -3.2HU and 47.8HU (192). These differences are caused by the
aging of the x-ray tube and/or replacement and are greater than the variability
introduced from users obtaining the measurements needed for recalibration.
For each scan, a regression equation was calculated using 5 densitometry standards,
extra thoracic air, aortic blood, and three ED rods (see section 2.3.1.4), as shown in
Figure 2.2. Each of the five standards was measured at three separate points and the
mean of the three measurements was used in the regression equation.
If the Siemens 128 scanner was used, an extra nine measurements were used to
standardise the scans to the Siemens 16, as outlined in section 2.4.3 and Figure 2.3.

72
2.4.2 Interscanner correction
From 2006-2013 the same Siemens 16 scanner was used until it was replaced with a
Siemens 128.
Phantoms were scanned when the new scanner came into use, including the Warwick
Density Phantom, (WDP) (Figure 2.4). The WDP has a milled housing with an
equivalent density of “solid water”, containing nine cores of random and heterogeneous
density designed to mimic lung densities. The WDP was scanned in the reference
scanner, (Siemens 16), and these readings were taken to be the gold standard to which
the Siemens 128 was adjusted.

73
2.4.3 Morphometry correction
Airway size is affected by the size of the person. In order to compare airways and
remove the influence of body habitus, airway measurements are corrected for Body
Surface Area (115,194,195). Excluded from this correction are parameters such as
%WA and Pi calculations.
BSA = (√Height (cm)x Weight (kg)
3600)
The reconstruction kernel in which the scans are analysed is also important, and must
be standardised (194,196-199). In all the studies B35 was used.

74
2.5 Radiation safety
According the HPA, [http://www.hpa.org.uk/Topics/Radiation], the average UK annual
total radiation dose is ~2.7 millisieverts (mSv), whereas in Cornwall it is estimated to
be 7.8 mSv. The annual exposure limit for nuclear industry workers is 20mSv, although
the average occupational exposure is only 0.18 mSv. Acute radiation effects would be
seen at 1000 mSv, and 5000mSV would kill half of those receiving it within a month. In
the research studies, we aim to keep radiation exposure of the subjects to 10mSv
(research scans only, clinical scan doses are excluded), over 3 years.
Average DLP for the research scans was 213, which equates to an approximate dose of
3.6 mSv (using the thoracic conversion factor of 0.017)

75
Make Siemens Siemens
Model 16 (sensation) 128 Somatom Definition
Scan Type Spiral Spiral
Rotation Time (sec) 0.5 0.5
Det Configuration 16 x 0.75 128 x 0.6
Pitch 1.5 1.5
kVp 120 120
mAs 40 40
Dose modulation CARE dose off CARE dose off
Scan Comment Full thoracic (Insp & Exp) Full thoracic (Insp & Exp)
Scan Direction caudio-cranial caudio-cranial
RECON 1
Algorithm B30 B30
Thickness (mm) 0.75 0.75
Interval (mm) 0.5 0.5
DFOV (cm) Lungs* Lungs*
RECON 2
Algorithm B35 B35
Thickness (mm) 0.75 0.75
Interval (mm) 0.5 0.5
RECON 3
Algorithm B60 B60
Thickness (mm) 0.75 0.75
Interval (mm) 0.5 0.5
RECON 4
Algorithm B70 B70
Thickness (mm) 0.75 0.75
Interval (mm) 0.5 0.5
RECON 5
Algorithm B30 B30
Thickness (mm) 5 5
Interval (mm) 2.5 2.5
2.6 Tables and Figures
Table 2.1: Scanning protocol

76
Table 2.2 Summary of most frequently used QCT parameters
Parameter Abbreviation Units Equation (where applicable)
Lumen Area* LA mm2
Total Area* TA mm2
Wall Area* WA mm2 (𝑇𝐴 − 𝐿𝐴)
Percentage Wall Area %WA (100 𝑥 (
(𝑇𝐴 − 𝐿𝐴)
𝑇𝐴))
Mean Lung Density Expiratory to
Inspiratory ration
MLDE/I HU
Relative Voxel Change RVC HU 𝐸𝑥𝑝((𝑉𝐼 − 856) − (𝑉𝐼 − 950)) − 𝐼𝑛𝑠𝑝((𝑉𝐼 − 856) − (𝑉𝐼 − 950))
Percentile 15 Perc15 HU
Fractal dimensions of low
attenuation clusters (inspiration)
LAC-D -950
*When used clinically, these parameters are corrected for Body Surface Area, BSA. See section 2.4.3.

77
Figure 2.1: Linear regression log-log plot (188)
Linear regression log-log plot of cluster size (x) against cumulative frequency (y) to
give D, the gradient.
The value of D, is strongly related to the fractal dimension of the terminal air space, and
a low number indicates loss of complexity, as seen in emphysema

78
Figure 2.2 Density Correction
The derivation of the regression equation for subject A113’s expiratory scan. The linear
regression equations were used to standardise all densitometry values for the specific
scan for each subject. The equation was performed for every individual scan.
y = 1.0081x + 13.265 R² = 0.9984
-1200
-1000
-800
-600
-400
-200
0
200
-1200 -1000 -800 -600 -400 -200 0 200
Series1
Linear (Series1)
Linear (Series1)

79
STUDIES

80
STUDY 3.1
Relationship between lung function and
quantitative computed tomography parameters
of airway remodelling, air-trapping and
emphysema in asthma and COPD: A single
centre study
3.1.1 Abstract
3.1.1.1 Background
There is a paucity of studies comparing asthma and COPD based on quantitative
thoracic computed tomography (QCT) parameters. The aim of this study is to compare
QCT parameters of airway remodeling, air-trapping and emphysema between asthma
and COPD and explore their relationship with airflow limitation.
3.1.1.2 Methods
Asthma (n=171), COPD (n=81) and healthy (n=49) subjects, recruited from a single
centre, underwent QCT and clinical characterisation.
81
3.1.1.3 Measurements & main results
Proximal airway percent wall area was significantly increased in asthma (62.5% [2.2])
and COPD (62.7% [2.3]) compared to healthy controls (60.3% [2.2]; p<0.001). Air-
trapping measured by mean lung density expiratory to inspiratory ratio was
significantly increased in COPD (0.922 [0.037]) and asthma (0.852 [0.061]) compared
with health (0.816 [0.066]; p<0.001). Emphysema assessed by lung density measured
by Percentile 15 was a feature of COPD only [COPD -964 (19.62), versus asthma -937
(22.7) and health -937 (17.1); p<0.001]. Multiple regression analyses showed that the
strongest predictor of lung function impairment in asthma was percent wall area,
whereas in COPD and the asthma sub-group with post-bronchodilator FEV1% predicted
<80%, it was air-trapping. Factor analysis of QCT parameters in asthma and COPD
subjects combined determined 3 components with percent wall area, air-trapping and
Percentile 15 being the highest loading factors. Cluster analysis identified 3 clusters
with mild, moderate or severe lung function impairment with corresponding decreased
lung density (percentile 15) and increased air-trapping.
3.1.1.4 Conclusions
In asthma and COPD lung function impairment is strongly associated with air trapping
with a contribution from proximal airway narrowing in asthma.

82
3.1.2 Introduction
Asthma and chronic obstructive pulmonary disease (COPD) cause considerable
morbidity and consume substantial health-care resources (200,201). Both airway
diseases are characterised by airflow obstruction, which is typically variable and
reversible in asthma, but fixed in COPD (202). However, there is overlap between the
two conditions, particularly between severe asthma and COPD as severe asthma can be
characterised by persistent airflow obstruction and some COPD subjects have partially
reversible airflow obstruction. Similarly, there is emerging evidence of overlap between
asthma and COPD in terms of inflammatory profiles with the former typically
associated with eosinophilic and the latter neutrophilic inflammation; there are
subgroups of both asthma who have neutrophilic inflammation and COPD sufferers
who have and eosinophilic inflammation (113,116,202).
Quantitative computed tomography (QCT) has become an established technique for
airway morphometry and lung densitometry in airway disease (24,34,203). This
approach allows for quantification of proximal airway remodelling by assessment of
airway lumen and wall geometry, air-trapping as an indirect measure of small airway
disease and emphysema determined by lung densitometry. QCT has been applied
extensively to COPD. Indeed, a systematic review in 2012 found that both markers of
emphysema and peripheral airway measurements correlated to airflow obstruction in
COPD (204). QCT in COPD is generally accepted as a robust method especially for
quantifying emphysema (205). QCT measured emphysema has been shown to predict
mortality (206) and has been linked to lung function decline (123). QCT in asthma has
demonstrated tremendous heterogeneity in airway remodelling; shown that change in

83
lumen dimension is an important aspect of proximal airway remodelling (24) and
identified that changes in airway geometry are associated with histological features of
airway remodelling (25,207,208). Whether the relationships between lung function and
QCT parameters are different in asthma and COPD is uncertain.
Our hypotheses were: (1) QCT morphometry and densitometry measures of proximal
airway remodelling, air-trapping and emphysema are different between asthma, COPD
and healthy subjects, and (2) In asthma and COPD the association between lung
function impairment (post-bronchodilator FEV1 % predicted) and these QCT
morphometry and densitometry measures are distinct. The co-primary QCT outcome
variables were: for proximal airway remodelling: mean airway lumen area (LA) /body
surface area (BSA) and percentage wall area; air-trapping: mean lung density expiratory
to inspiratory ratio (MLDE/I); and emphysema: Percentile 15. To test our hypotheses we
undertook a QCT observational study of asthma and COPD subjects across the
spectrum of disease severity and investigated the relationship between lung function
and QCT parameters firstly in each disease and secondly in QCT-derived clusters of the
disease groups combined.
Some of the results of this study have been previously reported in the form of an
abstract (209,210).

84
3.1.3 Methods
3.1.3.1 Subjects
Adults with COPD (n=81) or asthma (n=171) and healthy control subjects (n=49) were
recruited at a single centre, Glenfield Hospital, Leicester. COPD and asthma subjects
were recruited from respiratory outpatient clinics and healthy controls were recruited
through posters and advertisements placed in public areas including outpatient clinics in
the hospital, support group meetings and leisure centres. COPD and asthma subjects
fulfilled diagnostic criteria as per GOLD and GINA guidelines respectively (211,212).
COPD subjects had >10 pack year smoking history and were >40 years old. Twenty-
nine healthy control subjects and 60 subjects with asthma had participated in previous
studies (24,34). The study was approved by the Leicestershire Ethics Committee and
patients gave their written informed consent.
It was ensured that all subjects with airway disease at the time of their study visit were
free from an exacerbation requiring systemic corticosteroids and or antibiotics for at
least 6 weeks. All subjects underwent extensive clinical characterization, as described
in Methods sections 2.1.1-2.1.3.
3.1.2.2 Computed Tomography
Scans were acquired using the protocol outlined Methods section 2.3. QCT parameters
obtained included; morphometry, Lumen Area (LA), Total Area (TA), Wall Area (WA)
and percentage Wall Area (%WA). Air-trapping measures were Mean Lung Density
Expiratory to Inspiratory ratio (MLDE/I) (19) Relative Voxel Change (RVC).
Emphysema was quantified using 15th
percentile point (Perc15). Fractal dimensions of

85
the low attenuation clusters on inspiratory scans (LAC-D -950) and on expiratory scans
(LAC-D -856) were also measured. Detailed descriptions of QCT parameters are given
in Introduction section 1.4.4 and Methods section 2.3.2.
A representative example of an inspiratory and expiratory scan, airway reconstruction
from the inspiratory scan and densitometry maps from both the inspiratory and
expiratory scans are as shown Figure 3.4.
3.1.2.4 Statistical Analysis
3.1.2.4.1 General analysis
Statistical analyses were performed on IBM SPSS Statistics for Windows, Version 20.0,
(Armonk, NY: IBM Corp) and GraphPad Prism version 6 for windows (San Diego
California USA). A priori subject stratification determined by post-bronchodilator
FEV1% predicted was performed and exploratory outcomes were not tested for
multiplicity. Non-parametric and parametric data were presented as median
(Interquartile Range [IQR]), or mean (Standard Deviation [SD]) respectively.
Comparisons across groups were analysed by parametric and non-parametric ANOVA
with post hoc testing for pairwise comparisons. Pairwise comparisons were made by t-
tests or Mann-Whitney tests as appropriate. Statistical significance was reached if the p
value was less than 0.05. Factor analysis and cluster analysis was carried out using IBM
SPSS Statistics for Windows, Version 20.0, (Armonk, NY: IBM Corp). The Kaiser
criterion was used to select the number of the factors and Wards hierarchical clustering
was used to determine the number of clusters, k. Cluster membership was derived using
k-means clustering, see online supplement for further details.

86
3.1.2.4.2 Factor and cluster on COPD and severe Asthma cohort
We undertook de novo cluster analysis on the COPD and asthma patients together using
the same methodology carried out in Gupta et al (24) but using the QCT variables:
(1) Mean lumen area/body surface area
(2) Mean wall area/body surface area
(3) Mean total area/BSA
(4) Mean % wall area
(5) Expiratory voxel index -856
(6) MLD E/I ratio
(7) Voxel index change of percent voxels between -950 HU and -856 HU on paired
inspiratory and expiratory CT scan
(8) Expiratory fractal dimension of low attenuation cluster at threshold of -856 HU
(9) Inspiratory voxel index -950
(10) Percentile 15
(11) Inspiratory fractal dimension of low attenuation cluster at threshold of -950 HU.
The QCT variables listed were first used in a factor analysis with three factors being
found allowing for 81% of the variation. The Kaiser criteria to determine the number of
factors was used which picking all factors that have an eigen value greater than 1.
Varimax rotation was also used to determine the best clinical interpretable factors, see
table 3.1.1. The highest loading variables on each factor were taken forward into a
cluster analysis. These were mean lumen area adjusted for BSA, Percentile15 and
MLDE/I.

87
First hierarchical cluster analysis was applied to determine the number of clusters that
best fitted the data. Then the number of clusters determined (3 in this case) (Figure
3.1.2) was inputted into a k-means cluster analysis to determine cluster membership for
each patient. Cluster demographics and comparisons are as shown table 3.1.12.

88
3.1.4 Results
3.1.4.1. Clinical characteristics
The baseline demographics and clinical characteristics of asthma, COPD and healthy
subjects are shown in Table 3.1.3. COPD subjects were older, had a greater smoking
pack year history, poorer lung functions (airflow limitation, post-bronchodilator FEV1%
predicted < 80%; and airflow obstruction, post-bronchodilator FEV1/FVC ratio < 70%)
and higher neutrophilic airway inflammation compared to asthma. Asthma subjects had
higher eosinophilic airway inflammation compared to the other two groups. Body mass
index (BMI) of asthma subjects was greater than the COPD subjects. Poorer lung
functions were also demonstrated in asthma subjects compared to healthy controls.
3.1.4.2 QCT parameters: Comparison between asthma,
COPD and healthy subjects
Examples of CT images for subjects with asthma, COPD or healthy controls are as
shown (Figure 3.1.1). The airway morphometry and lung densitometry for subjects with
asthma, COPD and healthy subjects are summarised in Table 3.1.4. Segmental airway
morphometry is shown in Tables 3.1.5 and 3.1.6. Inter-observer repeatability for QCT
parameters was good to excellent. Mean wall area WA/BSA was not significantly
different between the three groups. However, the mean percentage wall area was
increased in both asthma and COPD subjects compared to healthy controls, with mean
LA/BSA being significantly smaller in asthma subjects. The mean LA/BSA was smaller
in COPD subjects compared to healthy controls, although it did not reach statistical
significance (Table 3.1.4 and Figure 3.1.3a, b). The MLDE/I was increased in both
asthma and COPD subjects compared to healthy controls, with highest values seen in

89
COPD subjects (Table 3.1.4, Figure 3.1.3c). Percentile 15 was decreased only in COPD
subjects with comparable values in asthma and healthy subjects (Table 3.1.4, Figure
3.1.3d). Low Attenuation Clusters below -950 HU Fractal Dimension value (LAC-D-
950), was significantly decreased in COPD subjects (Figure 3.1.3e). Wall area of
theoretical airway with an internal perimeter of 10mm (Pi10 WA) and Percentage wall
area of a theoretical airway with an external perimeter of 20mm (Po20 %WA) were
increased in both asthma and COPD compared to healthy controls (Table 3.1.4). Age-
adjusted comparison of the co-primary QCT parameters between asthma, COPD and
healthy subjects was performed as mean age of COPD subjects was higher compared to
other groups and all of the comparisons (one-way ANOVA) remained statistically
significant (p<0.001).
3.1.4.3 Univariate analysis to explore structure and function
relationship in asthma and COPD
Correlations between the QCT indices and clinical or physiological parameters are
shown in Table 3.1.7 and 3.1.8. Moderate-to-good correlations were observed between
QCT parameters and lung physiology indices. Percentile 15 was strongly correlated
with Transfer Coefficient (KCO) % predicted in COPD subjects and MLDE/I with
Residual Volume (RV) / Total Lung Capacity (TLC)[%] in all three groups. Airflow
obstruction was most strongly associated with Percentile 15 and MLDE/I with a weaker
association with percentage wall area and LA/BSA in asthma and COPD (Table 3.1.7).
Airflow limitation, in asthma subjects was strongly correlated with mean percentage
wall area and weakly with MLDE/I and Percentile 15. In contrast, airflow limitation in
COPD subjects was most strongly associated with MLDE/I and to a lesser extent with
Percentile 15 and percentage wall area (Table 3.1.7, Figure 3.1.4). Sputum neutrophil

90
count showed positive correlation with mean percentage wall area in asthma subjects
and sputum eosinophil count was inversely correlated with mean percentage wall area
in COPD subjects. Correlations were also observed between (i) airway narrowing and
asthma control, and (ii) between MLDE/I and COPD quality of life (Table 3.1.8).
3.1.4.4 Multiple regression analysis to explore structure and
function relationship in asthma and COPD
Multiple linear regression analysis in asthma subjects showed that mean Percentage
wall area, MLDE/I and Percentile 15 made a statistically significant contribution to the
regression model for prediction of post-bronchodilator FEV1% predicted with mean
percentage wall area making the strongest unique contribution. Multiple linear
regression analysis in COPD subjects showed that MLDE/I and mean percentage wall
area made a statistically significant contribution to the regression model for prediction
of post-bronchodilator FEV1% predicted with MLDE/I making the strongest unique
contribution (Table 3.1.9).
3.1.4.5 Univariate and multiple regression analysis to explore
structure and function relationship in asthma and COPD
subjects with airflow limitation
A subset of asthma and COPD subjects with post-bronchodilator FEV1% predicted
<80% were assessed for correlations between the QCT and lung physiology parameters
(Table 3.1.10, Figure 3.1.5). The correlations between KCO% predicted or RV/TLC
(%) and Percentile 15 or MLDE/I were stronger compared to previous analysis of
unselected patients (Table 3.1.10). Post-bronchodilator FEV1% predicted showed
91
correlations with MLDE/I in asthma subjects and with both MLDE/I and Percentile 15 in
COPD subjects. Multiple linear regression analysis demonstrated that in this subset of
COPD subjects as well MLDE/I made the strongest unique contribution to the regression
model for prediction of post-bronchodilator FEV1% predicted (Table 3.1.11). Multiple
regression analysis was not performed in asthma subjects as univariate analysis only
showed correlation between post-bronchodilator FEV1% predicted and MLDE/I.
3.1.4.6 Asthma and COPD sub-group analysis
We stratified the asthma and COPD subjects into three sub-groups each based on post-
bronchodilator FEV1% predicted, (i) >80% (asthma, n=101; COPD, n=5), (ii) 50-80%
(asthma, n=56; COPD, n=43), and (iii) <50% (asthma, n=14; COPD, n=34). As only 5
subjects with COPD had a post-bronchodilator FEV1% predicted >80% they were
excluded from further analyses. The asthma subjects with post-bronchodilator FEV1%
predicted >80% compared to healthy controls, have significantly greater mean
percentage wall area with no significant difference in MLDE/I or Percentile 15 (Figures
3.1.6a-d). In asthma sub-group with post-bronchodilator FEV1% predicted 50-80%,
mean percentage wall area was higher and LA/BSA smaller compared to sub-group
with post-bronchodilator FEV1% predicted >80% (Figures 3.1.6a,b). Asthma sub-group
with FEV1% predicted <50% did not show significant difference in airway
morphometry compared to other asthma sub-groups. In COPD subjects, the mean
percentage wall area and LA/BSA were not significantly different between the sub-
groups with post-bronchodilator FEV1% predicted 50-80% versus <50%. In sub-groups
with post-bronchodilator FEV1% predicted 50-80%, the asthma subjects have greater
mean percentage wall area and smaller LA/BSA compared to COPD subjects (Figures
3.1.6a,b).

92
In both asthma and COPD subjects, sub-groups with lower post-bronchodilator FEV1%
predicted had higher MLDE/I and lower Percentile 15 (Figures 3.1.6c,d). The asthma and
COPD sub-groups with similar degree of lung function impairment showed no
significant difference in MLDE/I (Figure 3.1.6c). COPD subjects with post-
bronchodilator FEV1% predicted 50-80% showed decreased Percentile 15 compared to
asthma subjects with similar degree of lung function impairment (Figure 3.1.6d). In
sub-groups with post-bronchodilator FEV1% predicted <50%, COPD and asthma
subjects showed no significant difference in Percentile 15 (Figure 3.1.6d), but the Low
Attenuation Clusters below -950 HU Fractal Dimension value was significantly
decreased in COPD subjects (Figure 3.1.6e).
3.1.4.7 Unbiased phenotyping of airway disease (asthma and
COPD) subjects using factor analysis of QCT parameters
We undertook a de novo factor analysis of the QCT parameters in those subjects with
asthma or COPD which revealed 3 components with the strongest loading variables
being mean LA/BSA, Percentile 15 and MLDE/I (Table 3.1.1). A cluster analysis using
these three highest loading variables revealed 3 clusters (Table 3.1.2 and Figure 3.1.2).
The 3 clusters had mild (asthma n=40, COPD n=2), moderate (asthma n=94, COPD
n=24) and severe (asthma n=25, COPD n=47) lung function impairment respectively
with decreased percentile 15 and increased MLDE/I particularly a feature of cluster 3.

93
3.1.5 Discussion
We describe here the airway morphometry and lung densitometry of asthma and COPD
subjects with reference to healthy controls and their relationship with lung function. We
found that proximal airway remodelling and air trapping were features of both asthma
and COPD. Airway wall area, expressed as a percentage of total area (%WA), was
increased in both diseases. Air trapping in subjects with COPD was more severe
compared to asthma. Emphysema was only seen in COPD subjects with Percentile 15
being significantly lower compared to other groups. Comparable values of Percentile 15
between asthma and healthy subjects confirm absence of emphysema in asthma.
Assessment of structure function relationship revealed a significant contribution of
proximal airway remodelling, represented by percentage wall area and air trapping,
represented by MLDE/I in prediction of airflow limitation in asthma. In contrast, similar
assessment in COPD showed that only QCT-determined air trapping and emphysema
contributed to airflow limitation. Both disease groups when further stratified by the
degree of lung function impairment showed that in the sub-group with post
bronchodilator FEV1 % predicted < 80%, air trapping remained a significant predictor
of lung function impairment. Proximal airway remodelling in this group of subjects did
not contribute towards prediction of airflow limitation. With asthma and COPD
combined in a factor and cluster analysis the findings were consistent with our a priori
stratification. Factor analysis revealed 3 components with highest loading factors being
measures of proximal airway narrowing, air-trapping and emphysema; and cluster
analysis demonstrated 3 clusters that could be distinguished by their degree of airflow
obstruction.

94
Changes in proximal airway geometry in COPD are common and our findings of
increased mean segmental percentage wall area compared to control subjects was
consistent with previous studies (213). This is consistent with proximal airway
remodelling in asthma subjects in the current study as well as previous studies (24,214).
Diaz et al. have also demonstrated proximal airway lumen narrowing in mild COPD
subjects (215). No significant difference was seen in proximal airway remodelling
between asthma and COPD subjects, consistent with previous literature (216).
Conversely, other studies report significantly greater proximal airway remodelling in
asthma subjects compared to COPD (217,218). In our study asthma sub-group with
post-bronchodilator FEV1% predicted 50-80% have greater mean percentage wall area
and smaller LA/BSA compared to COPD subjects with similar degree of airflow
limitation. Moreover, airway disease subgroups with post-bronchodilator FEV1%
predicted <50% when compared to healthy controls, proximal airway lumen narrowing
was seen in COPD, but not in asthma. These findings highlight the heterogeneity of
airway disease and importance of multi-level disease phenotyping and suggest that
proximal lumen dimensions in those with severe airflow impairment in asthma might
become relatively dilated perhaps to compensate for progressive small airway disease.
Results from COPDgene studies have shown that physiological airway obstruction
correlates with both QCT air trapping indices (147,219) and QCT-determined
emphysema (219), with the former showing stronger correlations. Similarly, in asthma,
QCT-determined air trapping has been associated with increased disease severity (220).
Emphysema in asthma has not been extensively studied. However a few studies have
suggested that emphysema in asthma subjects is likely secondary to smoking (221). In
our study we did not find any evidence of emphysema in asthma subjects, as the

95
Percentile 15 was comparable to healthy controls. Percentile 15 in asthma sub-group
with severe airflow limitation was similar to COPD subgroup with matched airflow
limitation, which may suggest that these asthma subjects have emphysema. However,
high fractal dimension of low attenuation clusters in the asthma sub-group compared to
COPD sub-group indicate that Percentile 15 in this cohort represents air trapping rather
than emphysema. Other researchers have found low attenuation on CT in asthma
subjects which is comparable to emphysema (222,223) and has been attributed to
peribronchial fibrosis or a rupture of dilated bronchial glands, rather than the alveolar
disruption as seen in COPD (224). Fractal dimension of the low attenuation cluster is
therefore an important QCT parameter in differentiating CT low attenuation secondary
to emphysema and air-trapping (188,223).
The findings presented here for COPD are consistent with previous studies and support
the view that airflow limitation and obstruction are due to a combination of small
airway obliteration and emphysema (109). We found that changes in proximal airway
geometry contribute to post-bronchodilator FEV1% predicted in the multiple regression
model for the whole COPD cohort. This is in keeping with previous studies, which have
shown that both emphysema and proximal airway remodelling contribute towards the
prediction of lung function in COPD (100). Proximal airway geometry, particularly
airway lumen narrowing was associated with airflow limitation in asthma. However
when the asthma sub-group with airflow limitation was assessed, only air trapping was
a significant predictor of lung function suggesting that small airway disease is
particularly important in this group. This may be important for our understanding of
disease pathogenesis, monitoring response to therapy and identification for therapeutic
targets. Importantly, emphysema is absent in asthma subjects with varying degree of
96
severity and smoking history. Whether the absence of emphysema is a critical
distinction between the pathogenesis of asthma and COPD or simply is a consequence
of classification of COPD is unclear. Air trapping determined by QCT was closely
related to RV/TLC (%) in both asthma and COPD and QCT determined emphysema
was related to KCO % predicted in COPD. Even though important differences were
observed between asthma and COPD there was marked heterogeneity within both
disease groups supporting the view that classification of obstructive airways disease
needs to consider multiple dimensions of the disease rather than rely on simple disease
labels.
Beyond the associations between QCT and lung function we explored the relationship
between QCT and sputum cell counts or health status. The clinical significance of the
weak correlations seen between airway inflammation and Percentile 15 or Low
Attenuation Clusters below -950 HU Fractal Dimension value, in asthma is uncertain.
Proximal airway narrowing in asthma was associated with an increased blood
neutrophil count. Previous studies have reported similar relationships in asthma with
airway remodelling and lung function decline (214). There were also weak relationships
between proximal airway morphometry and health status in asthma with decreased wall
and luminal area associated with poorer asthma control and health status. In COPD,
increased air trapping, but neither proximal wall remodelling nor emphysema, was
weakly associated with poorer health status. How closely changes in airway
morphometry or densitometry over time or in response to interventions are related to
these clinical outcomes needs to be further investigated.

97
The major limitation of this report is that it is a cross-sectional study and therefore
neither the natural history of disease nor temporal repeatability of the measures was
examined. In previous reports QCT is highly repeatable so we are confident that the
measures are robust, but longitudinal studies are needed to study the dynamic
relationships between airway structure and function. Subjects with COPD were older
than those with asthma and healthy controls and therefore age as well as disease effects
need to be considered. Importantly, in our study population, age did not influence the
differences in QCT parameters between groups for any of the co-primary QCT outcome
measures. Although this is the largest study to date comparing QCT parameters in
asthma and COPD, to further explore the heterogeneity of QCT in both asthma and
COPD further larger studies that include complex phenotyping are required. The
investigation of the relationship between QCT and airway inflammation was limited to
sputum cell counts and needs to be extended in larger studies of airway inflammation
and remodelling determined from bronchial biopsies. In addition the impact of disease
exacerbations and exposure to pathogens upon structure-function relationships needs to
be further explored.

98
3.1.6 Conclusion
In conclusion, proximal airway remodelling, and air trapping are QCT features shared
by asthma and COPD compared to healthy controls, but emphysema is largely restricted
to COPD. In both disease groups air-trapping is an independent major determinant for
lung function impairment, with an additional important contribution from proximal
airway remodelling particularly in asthma subjects with mild lung function impairment.

99
3.1.7 Figures and Tables
Table 3.1.1: Factor analysis of QCT variables with combined
cohort of both asthma and COPD. The three factors
accounted for 81% of the variation of all the variables
Factors
1 2 3
Mean LA/BSA
(mm2/m
2)
.99 .02 -.05
Mean TA/BSA
(mm2/m
2)
.94 .02 .00
Mean WA/BSA
(mm2/m
2)
.98 .02 -.02
Mean %WA -.78 .03 .16
Insp VI -856 -.06 .73 .60
MLDE/I -.04 .33 .87
mean voxel index change -.18 -.04 .87
Mean fractal 856 .15 .57 .38
Insp VI -950 -.08 .92 .08
Perc15 (HU) .06 -.94 .13
Mean fractal 950 .07 .75 .18
The three factors accounted for 81% of the variation of all the variables

100
Table 3.1.2 Demographics, both clinical and QCT of clusters
in combined cohort of asthma and COPD
Cluster 1
Asthma
n=42
COPD n=2
Cluster 2
Asthma n=94
COPD n=24
Cluster 3
Asthma
n=25
COPD n=47
Significanc
e
(p value)
Age (years) 49.7 (13.1) 58.0 (12.4) 62.8 (12.5) <0.0001*
0.03∞
0.001δ
Gender§ Female 73.8% 27.8% 45.8% <0.0001
Male 26.2% 72.2% 54.2%
BMI (kg/m2) 29.0 (6.0) 28.9 (5.7) 28.7 (6.3) 0.97
Smoking
status §
Current
Smoker
4.8% 9.7% 9.3% <0.0001
Ex-Smoker 31% 68.1% 44.9%
Never
Smoked
64.3% 22.2% 45.7%
Pack years (if smoked) 4.8 (10.6) 13.8 (28.0) 34.3 (36.7) <0.0001*
<0.0001∞
0.2δ
Severe exacerbations per
year
2 (3) 2 (2) 2 (2) 0.51
Blood eosinophil count
(x109/L)#
0.28 [0.14-
0.42]
0.25 [0.15-
0.36]
0.23 [0.14-
0.29]
0.29
Blood neutrophil count
(x109/L)#
4.6 [3.4-5.7] 4.4 [3.6-5.7] 4.6 [3.6-5.7] 1
Total sputum cell count
106/g#
1.77 [0.92-
7.84]
2.33 [1.01-
5.10]
3.37[1.23-
7.00]
0.27
Sputum % neutrophil# 44.8 [19.3-
73.0]
49.3 [22.0-
71.3]
61.5 [17.0-
88.5]
0.21
Sputum % eosinophil# 0.5 [0-2.3] 1.9[0.3-6.3] 1.0[0.3-2.5] 0.08
Pre BD FEV1 %
predicted
82.3 (24.4) 77.6 (23.3) 52.2 (21.7) <0.0001*
<0.0001∞
0.77δ
Post BD FEV1 %
predicted
89.2 (21.9) 82.7 (23.5) 57.8 (24.0) <0.0001*
<0.0001∞
0.38δ
Pre BD FEV1/FVC (%) 72.7 (9.8) 67.0 (12.0) 50.3 (12.5) <0.0001*
<0.0001∞
0.28δ
Post BD FEV1/FVC (%) 76.1 (9.6) 68.5 (11.4) 52.2 (12.7) <0.0001*
<0.0001∞
0.001δ
BD response 0.19 (0.24) 0.16 (0.21) 0.18 (0.23) 0.79
KCO % predicted 107 (18.5) 101 (20.3) 79.7 (29.6) <0.0001*
<0.0001∞
0.82δ

101
RV/TLC (%) 37.7 (12) 41.2 (11) 32.7 (12) <0.0001*
<0.0001∞
0.40δ
Mean LA/BSA (mm2/m
2) 10.7 (2.94) 11.4 (2.46) 11.0 (3.05) 0.29
Mean TA/BSA (mm2/m
2) 27.9 (6.19) 29.6 (5.13) 28.5 (6.16) 0.19
Mean WA/BSA
(mm2/m
2)
17.2 (3.32) 18.2 (2.78) 17.4 (3.20) 0.12
Mean %WA 62.7 (2.21) 62.2 (2.05) 62.6 (2.36) 0.3
MLDE/I 0.866
(0.056)
0.856 (0.061) 0.910 (0.058) <0.0001*
<0.0001∞
1.00δ
RVC -12.93
(11.34)
-23.96 (10.47) -30.59
(12.22) <0.0001*
<0.0001∞
0.71δ
Insp VI -950 4.6 (2.0) 13.0 (3.2) 26.6 (6.13) <0.0001*
<0.0001∞
<0.0001δ
Exp VI-856 13.3 (8.3) 21.7 (12.6) 45.8 (18.8) <0.0001*
<0.0001∞
0.004 δ
CTLVE/I 0.65 (0.09) 0.58 (0.11) 0.66 (0.13) 1.00*
<0.0001∞
0.004δ
Perc15 (HU) -905 (14.7) -943 (8.7) -972 (11.1) <0.0001*
<0.0001∞
<0.0001δ
LAC-D -950 -1.92 (0.20) -1.84 (0.12) -1.80 (0.13) 0.22
Pi10 (mm2) 14.9 (1.28) 15.0 (1.41) 14.8 (1.28) 0.73
Po20 %WA 56.2 (2.37) 56.0 (2.34) 56.0 (2.83) 0.88
%WA
(number [%] #)
6 (14.3) 15 (12.7)
11 (15.3) 0.88
MLDE/I (number [%] #) 2 (4.8) 8 (6.8)
20 (27.8) <0.0001
Perc15 (number [%] 0 (0) 0 (0) 31 (43.1) <0.0001
Data expressed as mean (SD), # median [IQR], or § proportions. # >2SD of healthy
controls, <2SD of healthy controls. Intergroup comparison: parametric (non-
parametric) data, p value for one-way ANOVA (Kruskal-Wallis) has been presented
unless the ANOVA (Kruskal-Wallis) was significant (p<0.05), in which case the p
value has been presented for Tukey (Dunn’s) test pairwise comparisons- *cluster 1
versus cluster 3, ∞cluster 2 versus cluster 3, δ cluster1 versus cluster 2. Differences in
proportions were tested by Chi Square Test.
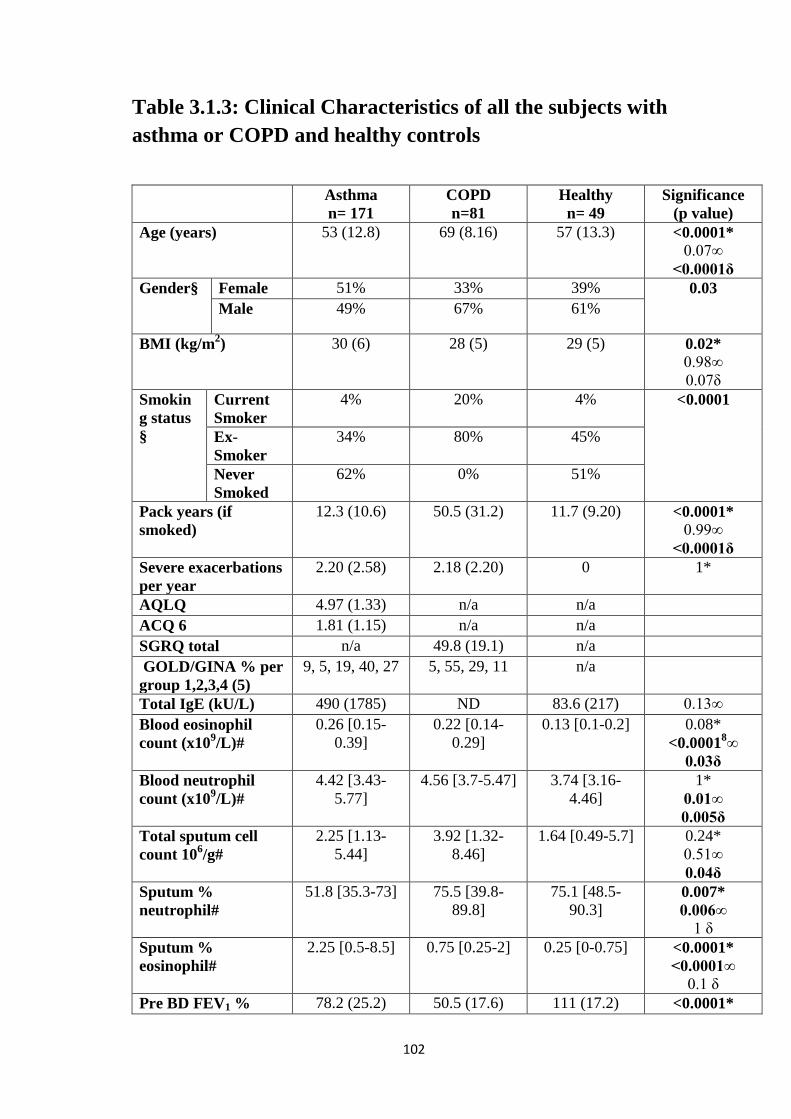
102
Table 3.1.3: Clinical Characteristics of all the subjects with
asthma or COPD and healthy controls
Asthma
n= 171
COPD
n=81
Healthy
n= 49
Significance
(p value)
Age (years) 53 (12.8) 69 (8.16) 57 (13.3) <0.0001*
0.07∞
<0.0001δ
Gender§ Female 51% 33% 39% 0.03
Male 49% 67% 61%
BMI (kg/m2) 30 (6) 28 (5) 29 (5) 0.02*
0.98∞
0.07δ
Smokin
g status
§
Current
Smoker
4% 20% 4% <0.0001
Ex-
Smoker
34% 80% 45%
Never
Smoked
62% 0% 51%
Pack years (if
smoked)
12.3 (10.6) 50.5 (31.2) 11.7 (9.20) <0.0001*
0.99∞
<0.0001δ
Severe exacerbations
per year
2.20 (2.58) 2.18 (2.20) 0 1*
AQLQ 4.97 (1.33) n/a n/a
ACQ 6 1.81 (1.15) n/a n/a
SGRQ total n/a 49.8 (19.1) n/a
GOLD/GINA % per
group 1,2,3,4 (5)
9, 5, 19, 40, 27 5, 55, 29, 11 n/a
Total IgE (kU/L) 490 (1785) ND 83.6 (217) 0.13∞
Blood eosinophil
count (x109/L)#
0.26 [0.15-
0.39]
0.22 [0.14-
0.29]
0.13 [0.1-0.2] 0.08*
<0.00018∞
0.03δ
Blood neutrophil
count (x109/L)#
4.42 [3.43-
5.77]
4.56 [3.7-5.47] 3.74 [3.16-
4.46]
1*
0.01∞
0.005δ
Total sputum cell
count 106/g#
2.25 [1.13-
5.44]
3.92 [1.32-
8.46]
1.64 [0.49-5.7] 0.24*
0.51∞
0.04δ
Sputum %
neutrophil#
51.8 [35.3-73] 75.5 [39.8-
89.8]
75.1 [48.5-
90.3] 0.007*
0.006∞
1 δ
Sputum %
eosinophil#
2.25 [0.5-8.5] 0.75 [0.25-2] 0.25 [0-0.75] <0.0001*
<0.0001∞
0.1 δ
Pre BD FEV1 % 78.2 (25.2) 50.5 (17.6) 111 (17.2) <0.0001*

103
predicted <0.0001∞
<0.0001δ
Post BD FEV1 %
predicted
85.3 (24.3) 53.7 (17.2) 113 (18.4) <0.0001*
<0.0001∞
<0.0001δ
Pre BD FEV1/FVC
(%)
68.5 (13.3) 50.6 (10.6) 78.5 (5.55) <0.0001*
<0.0001∞
<0.0001δ
Post BD FEV1/FVC
(%)
70.7 (12.0) 51.7 (10.2) 78.5 (12.6) <0.0001*
0.00015∞
<0.0001δ
BD response (%) 11.3 (15.1) 8.12 (9.56) 1.78 (4.36) 0.17*
0.000019∞
0.019 δ
KCO % predicted 107 (18.4) 74.8 (25.6) 98.9 (13.5) <0.0001*
0.08∞
<0.0001δ
RV/TLC (%) 39.7 (12) 55.1 (12) 34.5 (9) <0.0001*
0.04∞
<0.0001δ
Data expressed as mean (SD), # median [IQR], or § proportions
Intergroup comparison: parametric (non-parametric) data, p value for one-way ANOVA
(Kruskal-Wallis) has been presented unless the ANOVA (Kruskal-Wallis) was
significant (p<0.05), in which case the p value has been presented for Tukey (Dunn’s)
test pairwise comparisons- *asthma versus COPD, ∞asthma versus health, δCOPD
versus health. Differences in proportions were tested by Chi Square Test.
n/a – not applicable.
ND – not done

104
Table 3.1.4 Airway morphometry and lung densitometry of
subjects with asthma, COPD and healthy controls
Asthma
n=171
COPD
n=81
Health
n=49
Significance
(p value)
Mean
LA/BSA
(mm2/m
2)
11.0 (2.58) 11.3 (3.02) 12.3 (2.75) 0.67*
0.006∞
0.08δ
Mean
TA/BSA
(mm2/m
2)
28.5 (5.32) 29.3 (6.20) 30.5 (5.40) 0.09
Mean
WA/BSA
(mm2/m
2)
17.5 (2.84) 18.1 (3.31) 18.1 (2.76) 0.29
Mean %WA 62.5 (2.19) 62.7 (2.26) 60.3 (2.17) 0.79*
<0.0001∞
<0.0001δ
MLDE/I 0.852 (0.061) 0.922 (0.037) 0.816 (0.066) <0.0001*
0.00047∞
<0.0001δ
RVC -29.3 (12.4) -12.2 (9.36) -36.8 (10.2) <0.00019*
0.000268∞
<0.0001δ
Insp VI -950 12.17 23.32 11.40 <0.0001*
0.79
<0.0001δ
Exp VI-856 20.27 47.57 14.81 <0.00019*
<0.05∞
<0.0001δ
CTLVE/I 0.58 (0.13) 0.67 (0.18) 0.51 (0.12) <0.0001*
0.009∞
<0.0001δ
Perc15 (HU) -937 (22.7) -964 (19.62) -937 (17.07) <0.0001*
1∞
<0.0001δ
LAC-D -950 1.96 (0.104) 1.810 (0.132) 1.989 (0.107) <0.0001*
0.26∞
<0.0001δ
Pi10 WA
(mm2)
15.1 (1.42) 15.0 (1.46) 14.4 (1.10) 0.89*
0.011∞
0.06δ
Po20 %WA 56.1 (2.57) 56.4 (2.97) 54.6 (1.71) 0.7*
0.001∞
0.0002δ
%WA
(number [%]
above #)
27 (15.8%) 13 (7.60%) n/a 1.0

105
MLDE/I
(number [%]
above #)
8 (4.68%) 22 (27.16%) n/a <0.0001
Perc15
(number [%]
7 (4.09%) 26 (32.1%) n/a <0.0001
Data expressed as mean (SD), # >2SD of healthy controls, <2SD of healthy controls
Intergroup comparison: p value for one-way ANOVA has been presented unless the
ANOVA was significant (p<0.05), in which case the p value has been presented for
Tukey test pairwise comparisons- *asthma versus COPD, ∞asthma versus health,
δCOPD versus health.
n/a – not applicable.

106
Table 3.1.5 LA/BSA for segmental airways in asthma and
COPD subjects and healthy controls
Asthma COPD Healthy Significance
p value
RB1 LA/BSA
(mm2/m
2)
11.3 (4.04) 10.6 (3.68) 11.8 (3.95) 0.25
RB2 LA/BSA
(mm2/m
2)
11.4 (3.87) 11.2 (4.26) 12.1 (4.34) 0.42
RB3 LA/BSA
(mm2/m
2)
15.0 (5.71) 15.3 (5.64) 16.1 (4.58) 0.48
RB4 LA/BSA
(mm2/m
2)
8.42 (3.36) 8.65 (3.12) 9.17 (3.35) 0.37
RB5 LA/BSA
(mm2/m
2)
9.38 (3.01) 9.98 (4.41) 10.9 (2.92) 0.42*
0.02∞
0.29δ
RB6 LA/BSA
(mm2/m
2)
13.8 (6.51) 15.9 (13.9) 16.0 (6.95) 0.19
RB7 LA/BSA
(mm2/m
2)
8.86 (4.08) 8.07 (3.07) 9.27 (3.22) 0.19
RB8 LA/BSA
(mm2/m
2)
10.4 (3.32) 10.3 (3.05) 11.9 (3.06) 0.98*
0.02∞
0.02δ
RB9 LA/BSA
(mm2/m
2)
8.83 (3.77) 8.20 (3.35) 9.96 (3.25) 0.41*
0.13∞
0.02δ
RB10 LA/BSA
(mm2/m
2)
11.9 (3.84) 11.84 (4.42) 13.38 (3.71) 0.07
LB1 LA/BSA
(mm2/m
2)
8.71 (3.11) 8.43 (3.34) 9.92 (3.18) 0.81*
0.07∞
0.03δ
LB2 LA/BSA
(mm2/m
2)
6.04 (2.67) 6.45 (3.23) 7.66 (4.16) 0.63*
0.007∞
0.10δ
LB3 LA/BSA
(mm2/m
2)
13.6 (4.65) 14.4 (5.50) 14.2 (4.35) 0.44
LB4 LA/BSA
(mm2/m
2)
8.26 (3.25) 8.08 (3.53) 8.77 (3.83) 0.54
LB5 LA/BSA
(mm2/m
2)
7.58 (2.80) 8.11 (3.09) 8.39 (2.27) 0.16
LB6 LA/BSA
(mm2/m
2)
17.1 (6.86) 18.6 (7.74) 20.4 (5.63) 0.32*
0.01∞
0.34δ
LB1+2 LA/BSA
(mm2/m
2)
13.6 (5.32) 15.3 (7.13) 15.7 (5.69) 0.08*
0.08∞
0.94 δ
LB8 LA/BSA 12.3 (3.96) 13.5 (5.67) 15.0 (5.28) 0.16*

107
(mm2/m
2) 0.002∞
0.22δ
LB9 LA/BSA
(mm2/m
2)
10.7 (4.46) 10.4 (4.68) 12.7 (4.83) 0.87*
0.03∞
0.02δ
LB10 LA/BSA
(mm2/m
2)
12.7 (4.40) 12.8 (4.89) 14.1 (4.33) 0.17
Right segmental mean
LA/BSA (mm2/m
2)
10.9 (2.62) 10.8 (3.57) 12.0 (2.62) 0.99*
0.04∞
0.06δ
Left Segmental mean
LA/BSA (mm2/m
2)
11.0 (2.79) 11.4 (3.44) 12.4 (3.52) 0.66*
0.02∞
0.18δ
Data expressed as mean (SD). Intergroup comparison: p value for one-way ANOVA
has been presented unless the ANOVA was significant (p<0.05), in which case the p
value has been presented for Tukey test pairwise comparisons- *asthma versus COPD,
∞asthma versus health, δCOPD versus health.

108
Table 3.1.6 %WA for segmental airways for subjects with
asthma, COPD and healthy controls
Asthma COPD Healthy Significance
P value
RB1 %WA 62.7 (3.97) 64.0 (3.54) 61.3 (3.39) 0.13*
0.03∞
0.001δ
RB2 %WA 61.8 (3.41) 62.3 (3.61) 59.4 (3.65) 0.54*
<0.0001∞
<0.0001 δ
RB3 %WA 60.1 (3.67) 60.4 (3.91) 57.9 (3.98) 0.79
0.001∞
0.001δ
RB4 %WA 63.3 (3.63) 63.7 (3.17) 61.7 (3.23) 0.65*
0.02∞
0.005δ
RB5 %WA 62.8 (3.06) 62.6 (3.33) 60.3 (2.38) 0.93*
<0.0001∞
<0.0001δ
RB6 %WA 61.4 (4.52) 61.4 (4.53) 58.1 (3.95) 1*
<0.0001∞
0.001δ
RB7 %WA 64.6 (3.71) 66.0 (2.72) 63.3 (3.19) 0.02*
0.07∞
<0.0001δ
RB8 %WA 62.8 (3.45) 64.0 (3.16) 60.9 (2.89) 0.04*
0.001∞
<0.0001δ
RB9 %WA 63.6 (3.23) 64.4 (2.93) 62.1 (3.56) 0.28*
0.01∞
0.001δ
RB10 %WA 61.2 (3.30) 61.6 (3.44) 59.3 (3.43) 0.71*
0.002∞
0.001δ
LB1 %WA 63.9 (2.88) 64.3 (2.84) 62.1 (2.68) 0.61*
0.001∞
<0.0001δ
LB2 %WA 64.8 (3.04) 64.6 (2.98) 62.6 (4.12) 0.94*
<0.0001∞
0.004δ
LB3 %WA 60.5 (3.92) 60.9 (4.42) 58.9 (3.35) 0.8*
0.04∞
0.02δ
LB4 %WA 62.4 (3.65) 63.1 (3.47) 61.1 (3.73) 0.53*
0.08∞
0.02δ

109
LB5 %WA 63.6 (3.21) 63.8 (2.97) 62.1 (2.45) 0.87*
0.007∞
0.006δ
LB6 %WA 59.4 (4.56) 59.0 (4.78) 56.1 (3.41) 0.85*
<0.0001∞
0.001δ
LB1+2 %WA 62.1 (4.17) 61.3 (4.54) 59.8 (4.34) 0.42*
0.005∞
0.14 δ
LB8 %WA 62.5 (3.60) 62.1 (4.30) 59.6 (4.08) 0.73*
<0.0001∞
0.003δ
LB9 %WA 63.4 (3.65) 63.3 (3.42) 61.4 (3.84) 0.96*
0.002∞
0.01δ
LB10 %WA 61.1 (3.88) 61.3 (3.70) 58.7 (3.39) 0.87*
<0.0001∞
<0.0001δ
Right
Segmental
mean %WA
62.50 (2.29) 62.9 (2.45) 60.4 (2.24) 0.53*
<0.0001∞
<0.0001δ
Left Segmental
mean %WA
62.42 (2.34) 62.4 (2.36) 60.3 (2.28) 0.98*
<0.0001∞
<0.0001δ
Data expressed as mean (SD). Intergroup comparison: p value for one-way ANOVA
has been presented unless the ANOVA was significant (p<0.05), in which case the p
value has been presented for Tukey test pairwise comparisons- *asthma versus COPD,
∞asthma versus health, δCOPD versus health

110
Table 3.1.7 Correlations between clinical outcomes and QCT parameters
Post-bronchodilator
FEV1 (% predicted)
Asthma
Post-bronchodilator
FEV1 (% predicted)
COPD
Post-bronchodilator
FEV1/FVC (%)
Asthma
Post-bronchodilator
FEV1/FVC (%)
COPD
Mean LA/BSA (mm2/m
2) .324
**
.241*
.218**
.082
Mean TA/BSA (mm2/m
2) .287
**
.238*
.171*
.084
Mean WA/BSA
(mm2/m
2)
.247**
.226*
.126
.083
Mean %WA -.417**
-.248*
-.343**
-.121
MLDE/I -.303**
-.697**
-.402**
-.729**
Perc15 (HU) .178*
.434**
.408**
.554**
LAC-D-950 .190*
.180
.234**
.245*
Pearson’s correlation coefficient, *
p value <0.05, **
p value<0.005.

111
Table 3.1.8 Correlations between clinical outcomes and QCT parameters for asthma (upper
value) and COPD (lower value)
Asthma
COPD
RV/TLC KCO %
predicted
Sputum
eosinophils
(%)#
Sputum
neutrophils
(%)#
Blood
eosinophils
#
Blood
neutrophils
#
AQLQ# ACQ6# SGRQ
total#
Mean LA/BSA
(mm2/m
2)
-.147
-.171
-.163
-.089
.031
.121
-.134
.036
-.019
-.033
-.183*
-.11
.113
n/a
-.152*
n/a
n/a
-.034
Mean TA/BSA
(mm2/m
2)
-.115
-.198
-.153
-.084
.044
.096
-.120
.042
-.011
-.033
-.188*
-.101
.135
n/a
-.164*
n/a
n/a
-.040
Mean WA/BSA
(mm2/m
2)
-.078
-.217
-.153
-.075
.064
.086
-.119
.064
-.003
-.027
-.196*
-.28
.171*
n/a
-.179*
n/a
n/a
-.059
Mean %WA .237**
.130
.201*
.053
-.003
-.236
.094
-.026
.037
-.07
.128
.216
-.049
n/a
.120
n/a
n/a
.010
MLDE/I .481**
.510**
-.146
-.466**
.026
-.170
.119
.185
.081
.033
.053
.135
-.015
n/a
.030
n/a
n/a
.230*
Perc15 (HU) -.196*
-.271*
-.013
.477**
-.239*
.047
.084
.005
-.007
.142
.022
-.018
-.028
n/a
.001
n/a
n/a
.108
LAC-D-950 -.162
-.170
.083
.484**
.272**
.181
-.083
.193
0.156
.025
-.074
-.021
.006
n/a
.024
n/a
n/a
-.061
Pearson’s correlation coefficient for parametric data, otherwise # Spearman’s correlation coefficient for non-parametric data.
*p value <0.05,
** p value<0.005, n/a- not applicable

112
Table 3.1.9 Multiple regression to determine the strongest independent QCT parameters of post-
bronchodilator FEV1% predicted
Dependent variable post-bronchodilator FEV1% predicted
Model R2 B Std. Error Beta Significance
(p value)
Asthma %WA
0.254
-3.771 0.778 -0.344 0.000003
MLDE/I -108.021 28.283 -0.271 0.000194
Perc15 (HU) 0.190 0.074 .0181 0.01
COPD %WA
0.542
-1.447 0.644 -0.185 0.03
MLDE/I -283.191 42.260 -0.607 5 E-9
Perc15 (HU) 0.151 0.079 0.173 0.06

113
Table 3.1.10 Correlations between QCT parameters and clinical outcomes in asthma (upper
panel) and COPD subjects (lower value) with FEV1 % predicted <80%
Pearson’s correlation coefficient for parametric data, otherwise # Spearman’s correlation coefficient for non-parametric data.
*p value <0.05,
** p value<0.005, n/a- not applicable
Asthma n=70
COPD n=77
Post-BD
FEV1 (%
pred)
Post BD
FEV/FVC
(%)
RV/TLC KCO
%
pred
Sputum
eso%#
Sputum
neut#
Blood
eso#
Blood
neut#
AQLQ
#
ACQ6# SGRQ#
Mean LA/BSA
(mm2/m
2)
-.072
.158
-.085
.043
.049
-.106
.001
-.120
.189
.043
.093
.047
.143
-.033
.134
-.096
.085 n/a -.153
n/a
n/a
-.035
Mean TA/BSA
(mm2/m
2)
-.069
.164
-.110
.044
.082
-.145
-.007
-.129
.203
.021
.092
.042
.152
-.045
-.140
-.087
.112
n/a
-.170
n/a
n/a
-.052
Mean WA/BSA
(mm2/m
2)
.070
.164
-.137
.045
.118
-.179
-.007
-.134
.215
.024
.110
.052
.169
-.044
-.160
-.02
.172
n/a
-.208
n/a
n/a
-.079
Mean %WA .020
-.161
-.060
-.094
.057
.046
.064
.043
-.190
-.153
-.053
-.083
-.101
.048
-.103
.186
.068
n/a
.004
n/a
n/a
-.026
MLDE/I -.455**
-.657**
-.558**
-.714**
.611**
.482**
-.254
-.422**
.138
-.135
.030
.244
.066
.040
-.158
.187
.168
n/a
-.183
n/a
n/a
.254*
Perc15 (HU) .233
.458**
.493**
.559**
-.242
-.264*
-.021
.467**
-.042
.031
.057
-.035
.098
.132
-.118
-.025
-.157
n/a
.089
n/a
N/A
.074
Mean fractal -
950
-.007
-.239*
-.149
-.248*
.048
.202
-.019
-.481**
.216
-.258
.038
.289*
.183
.077
-.02
-.002
.326**
n/a
-.340**
n/a
N/A
.133

114
Table 3.1.11 Multiple regression to determine the strongest
independent QCT parameters of FEV1% predicted in those
subjects with FEV1 % predicted <80%
Model
R2
B Std. Error Beta Significance
p value
COPD MLDE/I
.473
-241 41.5 -.567 0.001
Perc15
(HU)
.165 .073 .221 0.03

115
Figure 3.1.1 Visual representation of QCT parameters
Visual representation of QCT parameters with CT inspiratory and expiratory axial
slices (first 2 columns); illustrate qualitative differences of increased inspiratory
volume, emphysema and air trapping in disease versus healthy controls. Column three
shows the airways grown by the post processing software, which are reduced in disease.
The fourth column shows the Low Attenuating Clusters (LAC) below -950 HU in
inspiration, representing areas of emphysema and the final column shows the LAC
below -856 in expiration, representing areas of air trapping.

116
a) The dendrogram to which the number of clusters was determined, k=3, b) and c) two
representation s of the clusters on z-scores of three QCT variables, Mean Lung Density
Expiratory /Inspiratory (MLD E/I), Percentile 15 and Lumen Area (LA) / Body Surface
Area (BSA). Small dots represent individual patients and the large spheres represent the
sample sizes of the clusters centred on their multivariate cluster means.
Figure 3.1.2 Cluster dendrogram

117
Figure 3.1.3 A&B: Percentage Wall Area and Mean Lumen
Area/Body Surface Area
Dot-plots of airway morphometry QCT parameters for all the subjects with asthma,
COPD and healthy controls, these parameters represent changes in proximal airway
structure:
A
B

118
a) mean %WA, this shows a significant difference between the healthy cohort and both
asthma and COPD. But not between asthma and COPD. b) mean LA/BSA, this shows a
significant difference between asthmatics and healthy controls only
Bars and lines represent mean and standard error of the mean.
.

119
Figure 3.1.3 C&D: Mean Lung Density Expiratory to
Inspiratory ratio and Percentile 15
Dot-plots of densitometry QCT parameters for all the subjects with asthma, COPD and
healthy controls, MLDE/I represents air trapping/small airway disease and percentile 15
represents emphysema: c) MLDE/I this shows significant differences between all three
C
D

120
groups. d) densitometry- Percentile 15, shows no difference between asthmatics and
heatlhy controls, but significant differences between COPD and both asthma and
healthy controls.
Bars and lines represent mean and standard error of the mean.

121
Figure 3.1.3 E: Fractal Dimensions of Low Attenuation Areas
below -950
Dot-plots of fractal dimensions of low attenuation areas below -950 HU, this represents
the complexity of the low attenuation areas QCT parameters for all the subjects with
asthma, COPD and healthy controls:
e) fractal index- LAC-D -950
Bars and lines represent mean and standard error of the mean.
E

122
Figure 3.1.4 A&B: Percentage WA and LA/BSA
Scatter plot and linear regression of the subjects with asthma (grey circles) and COPD
(black squares) showing the relationship between FEV1 % predicted and the QCT
morphometry measures: a) mean %WA, b) mean LA/BSA.
A
B

123
Figure 3.1.4 C&D: MLDE/I and Percentile 15
Scatter plot and linear regression of the subjects with asthma (grey circles) and COPD
(black squares) showing the relationship between FEV1 % predicted and the QCT
densitometry measures: c) MLDE/I and d) Percentile 15.
C
D

124
Figure 3.1.5 A&B: Percentage WA and LA/BSA
Scatter plot and linear regression of the subjects with an FEV1 % predicted <80% with
asthma (grey circles) and COPD (black squares) showing the relationship between
FEV1 % predicted and the QCT morphometry and densitometry measures: a) mean
%WA, b) mean LA/BSA.
A
B

125
Figure 3.1.5 C&D: Percentage WA and LA/BSA
Scatter plot and linear regression of the subjects with an FEV1 % predicted <80% with
asthma (grey circles) and COPD (black squares) showing the relationship between
FEV1 % predicted and the QCT morphometry and densitometry measures: c) MLDE/I d)
Percentile 15.
C
D

126
Figure 3.1.6 A&B: Percentage WA and LA/BSA
Dot-plots of airway morphometry and densitometry QCT parameters for subjects with
asthma (FEV1 % predicted <50% black circles, 50-80% grey circles, and >80% open
circles), COPD (FEV1 % predicted <50% black squares, 50-80% grey squares) and
healthy controls (open triangles): a) mean %WA, b) mean LA/BSA.
A
B

127
Figure 3.1.6: C&D: MLDE/I and Percentile 15
Dot-plots of airway morphometry and densitometry QCT parameters for subjects with
asthma (FEV1 % predicted <50% black circles, 50-80% grey circles, and >80% open
circles), COPD (FEV1 % predicted <50% black squares, 50-80% grey squares) and
healthy controls (open triangles): c) MLDE/I d) Percentile 15
D
C

128
Figure 3.1.6 E: LAC-D -950
Dot-plots of airway morphometry and densitometry QCT parameters for subjects with
asthma (FEV1 % predicted <50% black circles, 50-80% grey circles, and >80% open
circles), COPD (FEV1 % predicted <50% black squares, 50-80% grey squares) and
healthy controls (open triangles): e) fractal index- LAC-D -950.
E

129
3.2 STUDY 2:
Associations in asthma between quantitative
computed tomography and bronchial biopsy-
derived airway remodelling
3.2.1 Abstract
3.2.1.1 Background
In asthma the association between quantitative thoracic CT (QCT) and bronchial
biopsy-derived airway remodelling is poorly understood. The aim of this study is to
determine the relationship between QCT morphometry and densitometry with airway
wall structure in bronchial biopsies.
3.2.1.2 Methods
Subjects were recruited from a single centre (n=70) and the bronchial biopsy
remodelling features that were the strongest predictors of lung function impairment and
QCT-derived proximal airway morphometry (luminal area, wall area and % wall area)
and air-trapping (mean lung density expiratory/inspiratory) were determined by step-
wise multiple regression. The best predictor of air-trapping was validated in an
independent replication group of asthmatics (n=24) from a second centre

130
3.2.1.3 Measurements and main results
Airway smooth muscle % was the only independent predictor of post-bronchodilator
FEV1 % predicted (R2=0.22; p=0.001), while both airway smooth muscle % and
vascularity (Chalkley count) were predictors of FEV1/FVC (R2=0.19; p=0.005 and
R2=0.09; p=0.035 respectively). Epithelial thickness and airway smooth muscle % were
predictors of mean segmental bronchial luminal area (R2=0.12; p=0.02 and R
2=0.12;
p=0.015) and wall area (R2=0.10; p=0.033 and R
2=0.10; p=0.032). Whereas epithelial
thickness was the only significant predictor of % wall area (R2=0.13; p=0.018).
Vascularity was the only significant predictor of air-trapping (mean lung density
expiratory/inspiratory) (R2=0.24; p=0.001), which was validated in the replication
group (R2=0.19; p=0.031).
3.2.1.4 Conclusions
In asthma, airway smooth muscle content and vascularity were both associated with
airflow obstruction. Proximal airway morphometry by QCT was most strongly
associated with epithelial thickness and airway smooth muscle content in a bronchial
biopsy, whereas air-trapping was related to vascularity.

131
3.2.2 Introduction
Asthma remains an important health problem with significant morbidity, mortality and
economic burden (7,225). In addition to symptoms, asthma is characterized by variable
airflow obstruction, airway inflammation and remodelling (3,7). Airway remodelling is
a collective term for the structural changes in the airway wall including epithelial
thickness and integrity, airway smooth muscle mass, neoangiogenesis and subepithelial
fibrosis (3,7,226) and is related to persistent airflow limitation and airflow obstruction
(174,226,227). It is a feature even in childhood disease (228) demonstrating that it can
occur early in disease and post-mortem studies of asthma deaths demonstrate airway
remodelling in the large and small airways (229,230).
Airway remodelling can be assessed non-invasively by quantitative computed
tomography (QCT). This has become an established technique to determine airway
morphometry and lung densitometry in asthma (24,25,34,207,208,214,231-234). This
approach allows for quantification of proximal airway remodelling by assessment of
airway geometry and air-trapping as an indirect measure of small airway disease. QCT
in asthma has revealed that the key features of airway remodelling including luminal
narrowing, wall thickening and moreover air-trapping are important determinants of
airflow obstruction. Some studies have begun to explore the associations between
proximal airway geometry and histological features of airway remodelling
(25,207,208). However, asthma is a heterogeneous condition with considerable
variability in the degree of disordered airway physiology, and the relative changes in
airway wall composition and QCT parameters. Thus, these structure-function
relationships in asthma remain poorly understood.
132
Our hypothesis was that airway remodelling determined in bronchial biopsies is
associated with i) lung function impairment (post-bronchodilator FEV1 % predicted)
and ii) QCT morphometry and densitometry measures of proximal airway remodelling
and air-trapping. The co-primary QCT outcome variables were for proximal airway
remodelling: mean airway lumen area / body surface area and wall area % and for air-
trapping: mean lung density expiratory to inspiratory ratio. To test our hypothesis we
undertook a single-center observational study across the spectrum of disease severity to
determine the strongest independent histological features in bronchial biopsies
associated with lung function and QCT parameters of airway remodelling. The best
immunohistological predictor of air-trapping was validated in an independent
replication group of asthmatics from a second center.
133
3.2.3 Methods
3.2.3.1 Subjects
Subjects were recruited into either test (n=70) or replication (n=24) groups at two
independent centres Glenfield Hospital, Leicester, UK and Washington University
School of Medicine, St Louis, MO, USA respectively. All subjects were non-smokers
with <10 pack-years. All included subjects fulfilled the criteria for the diagnosis of
asthma which was defined as: a physician diagnosis of asthma with objective evidence
of variable airflow obstruction as indicated by 1 or more of the following: (1) a positive
methacholine challenge test defined as a concentration of nebulized methacholine
causing a 20% drop in FEV1 of <8 mg/mL, (2) diurnal maximum peak flow variability
of >20% over 2 week time, and (3) improvement of >15% in FEV1 15 minutes after
bronchodilator therapy. Subjects underwent pre- and post-bronchodilator spirometry
(albuterol 400mcg), skin prick tests or allergen specific IgE to assess for atopy and
those in the test group also underwent sputum induction and processing as described in
Methods sections 2.1.1.5 and 2.2.1 respectively.
Persistent airflow limitation was defined as a post-bronchodilator therapy FEV1<80%
predicted. Written informed consent was obtained from all the participants. All the
assessments and tests included in this study were approved by the local research ethics
committee (The Leicestershire, Northamptonshire, and Rutland Research Ethics
Committee and the Washington University School of Medicine Institutional Review
Board).

134
3.2.3.2 Computed tomography
All subjects underwent either limited or full lung CT scans using standardised
acquisition protocols as described in Methods section 2.3.2. Limited only scans
(Methods section 2.3.1.3) were undertaken in 14 asthmatics (34,231). Scans were
analysed using semi-automated software, Apollo® (by VIDA Diagnostics, Inc) in the
test group and Pulmonary Workstation, version 2.0 in the replication group (VIDA
Diagnostics, Iowa).
In the test group all inspiratory scans were analysed for RB1 morphometry while mean
segmental bronchi morphometry was obtained in full lung scans only. 1st-5
th generation
airways were labelled and measured using the analysis software. Morphological QCT
parameters measured included LA/BSA, TA/BSA, WA/BSA and %WA, as described in
Introduction section 1.4.4 and Methods section 2.3.2. Estimates of air-trapping were
determined in the test and replication groups from the mean lung density on the
expiratory/inspiratory scan (MLDE/I) and the percentage of lung voxels with a density
lower than -856 HU on expiratory scans (VI-856 HU). The co-primary QCT outcome
variables were for proximal airway remodelling: mean airway lumen area / body
surface area and wall area % and for air-trapping MLDE/I.
3.2.3.3 Endobronchial biopsies
Endobronchial biopsies were obtained from segmental and subsegmental carina and
either embedded in glycol methacrylate for the test group or paraffin in the replication
group as described previously (19,20,25,174).

135
Two micrometre sections were cut from the glycol methacrylate embedded biopsies and
stained with Haematoxylin & Eosin (H&E). Immunohistochemical staining was done
with the following mAbs: anti–mast cell tryptase clone AA1 (Dako UK, Ely, United
Kingdom), anti-alpha smooth muscle actin clone 1A4 (Dako UK, Ely, United
Kingdom), anti-eosinophil major basic protein clone BMK-13 (Monosan, Uden, The
Netherlands), anti-neutrophil elastase clone NP57 (Dako UK, Ely, United Kingdom),
and anti-endothelium clone EN4 (Monosan, Uden, The Netherlands) or appropriate
isotype controls were used.
The endobronchial biopsies were assessed by a single observer blinded to the clinical
characteristics (ZEN 2012 image analysis software for light microscopy, Carl Zeiss AG,
Jena, Germany) and expressed as the mean of measurements undertaken from a
minimum of two sections either from independent biopsies or as non-contiguous tissue
sections at least 20µm apart from the same biopsy. Epithelial integrity was assessed by
measuring the lengths of intact and denuded epithelium. Lamina reticularis and reticular
basement membrane (RBM) and epithelial thickness were measured as described
previously (172,173). Vascularity was measured using the Chalkley count, a surrogate
of both vessel density and vascular area. As previously described, a Chalkley eyepiece
graticule (NG52 Chalkley Point Array, Pyser-SGI Ltd, Edenbridge, UK) was used at
x200 to measure Chalkley counts in four non-overlapping vascular hotspots (1-
2/section) (174). The mean Chalkley count was calculated from the four measurements.
Airway smooth muscle content was determined as the proportion of the total area.
Inflammatory cells were expressed as the number of nucleated cells per area of lamina
propria.

136
The strongest independent immunohistological feature of airway remodelling associated
with QCT-derived air-trapping identified in the test group was validated in the
replication group. Four micrometre sections were cut from the paraffin embedded
biopsies and stained with appropriate mAb or corresponding isotype control.
3.2.3.4 Statistical analysis
Statistical analysis was performed using GraphPad Prism version 6.00 for Windows
(GraphPad Software, La Jolla, California, USA, www.graphpad.com) and IBM SPSS
Statistics for Windows, Version 22.0 (IBM Corp, Released 2013, Armonk, NY).
Parametric data was expressed as mean (standard deviation, SD) and non-parametric
data as median (interquartile range, IQR). Groups were compared using unpaired
student t-test and Mann-Whitney U test for parametric and non-parametric data
respectively. Proportions were compared using chi-squared test (χ2). Correlations
between variables were expressed using Pearson’s correlation. A step-wise multiple
regression analysis was undertaken to determine the bronchial biopsy features that were
the strongest predictors of post-bronchodilator FEV1, FEV1/FVC, and QCT-derived
mean segmental bronchial morphometry and air-trapping. Regression data are presented
as model-adjusted R2 Pearson correlations alongside the standardized regression
coefficient (β) of the modelled independent variable. A p-value of <0.05 was considered
statistically significant. An a priori decision was made to not test the exploratory
outcomes for multiplicity

137
3.2.4 Results
Baseline demographics and clinical characteristics of subjects with (n=30) and without
persistent airflow limitation (post-bronchodilator FEV1 <80% and ≥80% predicted)
(n=40) are shown in Table 3.2.1. There was no difference between the two groups in
sex, age, duration of asthma, age of disease onset, smoking status, BMI, sputum
eosinophils or sputum neutrophils.
3.2.4.1 Airway inflammation and remodelling univariate
correlation with lung function
Subjects with versus those without persistent airflow limitation had significantly higher
airway smooth muscle % (33.5 [15.6] versus 20.1 [12.6]%; p<0.001) and increased
vascularity (mean Chalkley count) (6.2 [1.6] versus 5.0 [1.9]; p=0.017) as shown in
Table 3.2.1 and Figure 3.2.1. However, there was no difference between the two groups
in the other measured markers of airway remodelling or inflammation. Airway smooth
muscle % was inversely correlated with post-bronchodilator FEV1 % predicted (r=-0.49;
p<0.001) and post-bronchodilator FEV1/FVC (r=-0.44; p<0.001) as shown in Figure
3.2. Vascularity was also inversely correlated, with post-bronchodilator FEV1 %
predicted (r=-0.3; p=0.026) and post-bronchodilator FEV1/FVC (r=-0.35; p=0.008).
There was no significant correlation between airway inflammation or the other airway
remodelling markers in bronchial biopsies and spirometry measurements (Table 3.2.2).
138
3.2.4.2 CT-derived quantitative morphometry and
densitometry univariate correlation with lung function
Subjects with versus those without persistent airflow limitation had significantly
narrower mean segmental bronchial luminal areas (9.7 (2.2) versus 11.0 (2.3) mm2/m
2;
p=0.047) and larger mean segmental bronchial wall area % (63.6 (2.0) versus 62.5 (2.1)
%; p=0.039) (Table 3.2.3). These differences were more marked in the lower versus
upper lobe bronchi (Table 3.2.4). There was significantly more air-trapping in those
with versus without persistent airflow limitation as measured by MLDE/I (0.89 [0.05]
versus 0.83 [0.05]; p<0.001), and VI-856 HU (%) (32.2 [19.8] versus 15.5 [10.1];
p<0.001) (Table 3.2.3).
3.2.4.3 Univariate correlations between bronchial biopsy
airway remodelling and QCT morphometry and air-trapping
Epithelial thickness was significantly correlated with mean segmental bronchial luminal
area (r=-0.35; p=0.02), mean segmental bronchial wall area (r=-0.31; p=0.039) and
mean segmental bronchial wall area % (r=0.35; p=0.018) (Figure 3.3). Similarly,
airway smooth muscle % correlated significantly with mean segmental bronchial
luminal area (r=-0.35; p=0.008), mean segmental bronchial wall area (r=-0.32; p=0.015)
and mean segmental bronchial wall area % (r=0.27; p=0.045). All the other remodelling
and inflammatory markers including vascularity, RBM and submucosal inflammatory
cell counts did not have any significant correlation with morphometry indices (Table
3.2.4).

139
Vascularity was strongly correlated with measures of air-trapping MLDE/I (r=0.49;
p<0.001) and VI-856 HU (r=0.53; p<0.001). Airway smooth muscle % was also
correlated with MLDE/I (r=0.3; p=0.03) and VI-856 HU (r=0.55; p<0.001) (Figure 3.4).
3.2.4.4 Multivariate analysis of the association between
bronchial biopsy immunohistology, lung function and QCT
parameters
All airway remodelling and inflammation variables were included in a step-wise
multiple regression analysis to examine the predictors of persistent airflow limitation,
QCT segmental morphometry and air-trapping. Only airway smooth muscle % was an
independent predictor of post-bronchodilator FEV1 % predicted (R2=0.24, β=-0.49,
p=0.001), while both airway smooth muscle % and vascularity were significant
predictors of post-bronchodilator FEV1/FVC (R2=0.19, β=-0.40, p=0.003 and R
2=0.09,
β=-0.31, p=0.026) respectively). Epithelial thickness and airway smooth muscle % were
predictors of mean segmental bronchial luminal area (R2=0.12, β=-035, p=0.02 and
R2=0.12, β=-0.35, p=0.015), and wall area (R
2=0.10, β=-0.32, p=0.033 and R
2= 0.10,
β=0.31, p=0.032). Epithelial thickness was the only independent predictor of mean
segmental bronchial wall area % (R2=0.13, β=0.35, p=0.018). Vascularity was the only
predictor of MLDE/I (R2=0.24, β=0.49, p=0.001), while airway smooth muscle %,
vascularity and epithelial thickness all significantly contributed to a model predicting
VI-856 HU (R2=0.31, β=0.49, p<0.001; R
2=0.22, β=0.54, p<0.001 and R
2=0.05;
β=0.24, p=0.045 respectively).

140
3.2.4.5 Validation group: replication of the correlation
between vascularity and air-trapping
Vascularity in the bronchial biopsies was the strongest independent predictor of
MLDE/I. Therefore the relationship between vascularity and MLDE/I was measured in an
independent group of asthmatics (n=24). Baseline demographics and clinical
characteristics of subjects in the validation group are described in Table 3.2.5. Similar
to the primary study group, vascularity was positively correlated with MLDE/I (r=0.44;
p=0.031) as well as VI-856 HU (r=0.50; p=0.014) (Figure 3.5).
141
3.2.5 Discussion
We report here the associations in asthma between bronchial biopsy-derived features of
airway inflammation and remodelling with lung function and QCT parameters of
proximal airway morphometry and air-trapping. We found that neither airway
inflammation nor RBM thickening were related to lung function and QCT parameters.
However, airway smooth muscle % and vascularity were both associated with airflow
obstruction. Proximal airway morphometry was most strongly associated with epithelial
thickness and airway smooth muscle % and air-trapping was related to vascularity. This
is the first study to suggest a relationship between airway vascularity and air-trapping.
However, we are confident that this observation is robust as we were able to confirm
this finding in an independent replication group.
Previous studies have explored the relationship between bronchial biopsy features of
remodelling and both FEV1 % predicted and FEV1/FVC (reviewed in (226)). As
reported here airway smooth muscle mass is typically (226,227), but not always (19), a
major determinant of lung function impairment. Increased airway smooth muscle mass
is a feature of severe childhood asthma (228) and is described in both the large and
small airways in studies of asthma deaths (229,230). Indeed increased airway smooth
muscle mass in both the large and small airways is more common than in the large or
small airway alone (230). Increased airway vascularity has also been consistently
reported in endobronchial biopsies from asthmatics compared to healthy controls and in
the small airways from lung resections for lung nodules in subjects with asthma
(174,235-239). However, increased vascularity was not a feature observed in fatal
asthma (240). We and others have reported that increased vascularity is associated with
lung function impairment (174) and confirmed this finding in the current study. The

142
relationship between airway inflammation and lung function impairment is more
contentious with some reports suggesting an association whereas others have not been
able to reveal associations (reviewed in 4). We found that other features of remodelling
namely epithelial thickening, RBM thickening and submucosal airway inflammation
was not associated with lung function.
Proximal airway morphometry assessed by QCT is abnormal in asthma with luminal
narrowing and airway wall thickening (24). These changes are weakly associated with
lung function impairment. We found that epithelial thickening and airway smooth
muscle % were related to QCT airway morphometry features of remodelling as
described previously (25,207,208), but not other bronchial biopsy measures of
remodelling or inflammation. Interestingly, although airway vascularity was associated
with lung function impairment it was not associated with proximal airway
morphometry.
We have extended previous studies of the relationship between endobronchial features
of remodelling and QCT parameters to include measures of air-trapping. We found that
both airway smooth muscle % and vascularity were associated with air-trapping in
univariate analysis, but that vascularity alone was an independent and significant
predictor of MLDE/I in our step wise linear regression. In comparative studies of asthma
and chronic obstructive pulmonary disease we found that QCT measures of air-trapping
are stronger predictors of lung function impairment than changes in proximal airway
morphometry. It is therefore intriguing that increased vascularity measured in the
proximal airway is related to air-trapping a measure of small airway dysfunction.
Previous studies suggest that the degree of vascularity in the proximal airway tracks

143
with findings in the small airway (235,240), but of note we did not directly measure
remodelling from small airway samples. Due to the novelty of our finding we sought to
validate our finding in an independent replication group. In spite of differences in the
processing of the endobronchial biopsies we found a remarkably similar relationship
between airway vascularity and QCT-derived air-trapping in the replication group
compared with our initial analyses.
Taken together these data support an important role for airway smooth muscle mass in
proximal airway remodelling and possibly to a lesser extent in the smaller airway with
both likely to be contributing to lung function impairment. Epithelial thickness plays a
role in proximal airway remodelling, but is not related to airway dysfunction. Airway
vascularity is not associated with proximal airway remodelling, but is associated with
air-trapping and lung function impairment. Whether increased vascularity promotes
small airway closure secondary to oedema or due to direct effects upon airway wall
thickness is unknown. Interestingly, there are no reports of effects of corticosteroids
upon airway smooth muscle mass, whereas in most although not all studies of the
effects of corticosteroids upon airway vasculature demonstrate a decrease in vascularity
with a concomitant improvement in lung function (236-239). In our study subjects were
all receiving inhaled corticosteroid therapy suggesting that the remaining vascularity is
resistant to corticosteroid therapy. Whether improvements in airway vascularity in
response to corticosteroid or other therapies are related to improvements in air-trapping
requires further study.
This study has a number of potential limitations. Although this is the largest study to
date comparing immunohistology with QCT parameters of airway remodelling it
144
remains a relatively small study. It is also cross-sectional and future longitudinal studies
of the natural history of asthma and response to therapies should consider inclusion of
endobronchial biopsy and imaging parameters to further determine the structure-
function relationships. Importantly, we did not standardise the location of the sampling
of the endobronchial biopsies with a corresponding airway identified by QCT and
whether this is important to determine the heterogeneity within an individual will be
important in future studies. However, we did reduce the variability of QCT parameters
within an individual by using the mean airway morphometry derived from multiple
airways. Critically, our comparisons between QCT air-trapping were with proximal
rather than distal airway samples. As discussed above it is likely that these proximal
airway samples reflected similar changes in the smaller airways, but notwithstanding
this likelihood further studies are required to compare QCT parameters of the small
airway with distal sampling such as transbronchial biopsies.

145
3.2.6 Conclusion
In conclusion, we have found important associations between endobronchial biopsy and
QCT measures of airway remodelling with lung function. We found that airway smooth
muscle mass and airway vascularity are related to airflow obstruction with airway
smooth muscle mass likely contributing more to large than small airway remodelling,
whereas increased vascularity appears to be related to air-trapping possibly due to small
airway remodelling.

146
3.2.6 Tables and Figures
Table 3.2.1 Demographics, clinical and laboratory
characteristics
Characteristic All patients
(n = 70)
Post-
bronchodilator
FEV1<80%
(n =30)
Post-
bronchodilator
FEV1≥80%
(n = 40)
p-value
Age (y) 49 (12) 52 (12) 47 (13) 0.095
Male (%) 57 67 50 0.163
Caucasian (%) 93 93 93 0.893
Asthma duration (y) 24 (18) 29 (20) 20 (15) 0.059
BMI (kg/m2) 29.9 (5.6) 30.3 (5.9) 29.6 (5.4) 0.644
Ex-smokers (%) 19 27 13 0.131
Atopy (%) 81 77 81 0.659
GINA
class
GINA 5, n (%) 22 (31) 13 (43.3) 9 (23)
0.084 GINA 4, n (%) 34 (49) 15 (50.0) 19 (48)
GINA 3, n (%) 6 (9) 0 (0.0) 6 (15)
GINA 1&2, n (%) 8 (11) 2 (6.7) 6 (16)
Inhaled BDP equivalent
(µg/24h) 1289 (689) 1444 (658) 1173 (698) 0.104
Pre-Bronchodilator FEV1
(L) 2.46 (0.92) 1.76 (0.65) 2.98 (0.73) <0.001
Pre-Bronchodilator FEV1
(% predicted) 78.8 (24.6) 55.1 (14.3) 96.5 (12.8) <0.001
Pre-Bronchodilator
FEV1/FVC (%) 66.7 (13.3) 55.7 (11.2) 74.9 (7.7) <0.001
Post-Bronchodilator FEV1
(L) 2.63 ( 0.91) 1.98 (0.63) 3.14 (0.77) <0.001
Post-Bronchodilator FEV1
(% predicted) 84.8 (23.3) 62.1 (12.8) 101.8 (12.0) <0.001
Post-Bronchodilator
FEV1/FVC (%) 69.5 (12.5) 59.3 (11.0) 77.1 (6.8) <0.001
Induced sputum
Sputum eosinophils (%)# 4.5 [1.4-18.8] 5.3 [2.0-23.1] 4.2 [0.03-10.0] 0.185
Sputum neutrophils (%)# 46.5 [25.6-63.5]
49.7 [36.8 -
68.4] 44.1 [17.6-63.2] 0.066
Immunohistochemistry
Submucosal eosinophils
(cells/mm2) #
19.6 [8.0-32.7] 19.2 [8.3-35.4] 19.9 [8.0-28.3] 0.947
Submucosal neutrophils
(cells/mm2) #
5.8 [2.2-20.8] 4.3 [2.1-15.5] 9.6 [2.3-24.6] 0.294
Submucosal mast cells
(cells/mm2)
#
15.7 [5.4-33.6] 13.8 [6.2-37.1] 15.7 [5.3-22.9] 0.149

147
RBM thickness (µm) 12.3 (3.9) 12.3 (4.4) 12.3 (3.6) 0.974
Airway smooth muscle % 25.8 (15.4) 33.5 (15.6) 20.1 (12.6) <0.001
Vascularity (mean Chalkley
count) 5.5 (1.8) 6.2 (1.6) 5.0 (1.9) 0.017
Epithelial Thickness (µm) 62.0 (16.8) 65.1 (17.5) 59.7 (16.2) 0.257
Intact epithelium % # 27.8 [12.5-49.7]
36.2 [15.2-
54.2] 22.9 [9.8-45.0] 0.466
Mean (SD) unless stated; # median [IQR]. BDP- Beclomethasone dipropionate

148
Table 3.2.2 Univariate correlations between primary QCT parameters and lung function, airway
inflammation and remodelling
Pearson’s correlation coefficient for parametric data, otherwise # Spearman’s correlation coefficient for non-parametric data.
p value <0.05*, <0.01
** p value<0.001
***
Post-BD
FEV1 (%
pred)
Post BD
FEV/FV
C (%)
Submucos
al
eosinophil
s #
Submucos
al
neutrophi
ls #
Submucos
al mast
cells #
Airway
smooth
muscle
%
RBM
thicknes
s
Submucos
alVascula
rity
Epitheli
al
Thickne
ss
Intact
epithelium
Mean LA/BSA
(mm2/m2)
0.23 0.17 -0.26 0.05 -0.13 -0.35** -0.13
0.06
-0.35*
0.04
Mean WA/BSA
(mm2/m2)
0.16
0.06
-0.27 -0.02 -0.14 -0.32* -0.18 0.04 -0.31*
0.06
Mean %WA -0.28*
-0.29*
0.22 -0.28 0.10 0.27* -0.01 -0.09 0.35*
-0.08
MLDE/I -0.45**
-0.56***
0.03 -0.31 -0.15 0.3* 0.05 0.49*** 0.07
-0.09
VI-856HU -0.51***
-0.70***
-0.06 -0.17 0.00 0.55*** 0.07 0.53*** 0.07
-0.09

149
Table 3.2.3 QCT morphometry and air-trapping parameters
Characteristic All patients
(n = 56)
Post-
bronchodilator
FEV1<80%
(n =29)
Post-
bronchodilator
FEV1≥80%
(n = 25)
p-value
CT-derived quantitative
morphometry
Mean segmental bronchial
lumen area/BSA (mm2/m
2)
10.4 (2.3) 9.7 (2.2) 11.0 (2.3) 0.047
Mean segmental bronchial
wall area/BSA (mm2/m
2)
17.0 (2.6) 16.5 (2.9) 17.5 (2.4) 0.133
Mean segmental bronchi
wall area % 63.0 (2.2) 63.6 (2.0) 62.5 (2.1) 0.039
CT-derived measures of air-
trapping
MLDE/I 0.85 (0.06) 0.89 (0.05) 0.83 (0.05) <0.001
VI-856HU (%) 22.6 (17.0) 32.2 (19.8) 15.5 (10.1) <0.001
Mean (SD), VI-856 HU- % of lung voxels with a density lower than -856 HU on expiratory
scans

150
Table 3.2.4 Quantitative morphometry
Characteristic All
patient
Post-
bronchodilator
FEV1<80%
Post-
bronchodilator
FEV1≥80%
p-
value
RB1 LA/BSA
(mm2/m
2)
10.2 (3.7) 10.3 (3.6) 10.3 (3.5) 0.858
RB1 wall area
percentage 64.0 (4.3) 63.9 (4.2) 64.0 (4.2) 0.718
RB2 LA/BSA
(mm2/m
2)
10.4 (3.0) 10.2 (3.0) 10.6 (3.1) 0.667
RB2 wall area
percentage 62.5 (3.3) 62.9 (3.3) 62.1 (3.3) 0.406
RB3 LA/BSA
(mm2/m
2)
14.7 (6.6) 14.0 (5.4) 15.3 (7.5) 0.496
RB3 wall area
percentage 60.3 (3.7) 60.5 (4.5) 60.2 (3.0) 0.817
RB4 LA/BSA
(mm2/m
2)
8.4 (3.7) 7.7 (3.3) 9.0 (3.9) 0.211
RB4 wall area
percentage 63.1 (4.2) 63.6 (4.3) 62.8 (4.1) 0.474
RB5 LA/BSA
(mm2/m
2)
9.3 (3.3) 8.6 (2.8) 9.8 (3.6) 0.184
RB5 wall area
percentage 62.9 (3.1) 63.6 (2.7) 62.3 (3.3) 0.12
RB6 LA/BSA
(mm2/m
2)
12.8 (5.0) 11.1 (4.1) 14.2 (5.3) 0.024
RB6 wall area
percentage 62.3 (4.3) 63.0 (4.0) 61.3 (4.5) 0.261
RB7 LA/BSA
(mm2/m
2)
8.2 (3.1) 7.6 (2.8) 8.7 (3.4) 0.203
RB7 wall area
percentage 65.1 (3.4) 65.8 (3.5) 64.4 (3.2) 0.165
RB8 LA/BSA
(mm2/m
2)
9.7 (2.9) 8.6 (2.4) 10.5 (3.0) 0.013
RB8 wall area
percentage 63.3 (3.2) 64.5 (2.7) 62.4 (3.4) 0.023
RB9 LA/BSA
(mm2/m
2)
9.0 (4.1) 8.4 (3.7) 9.5 (4.4) 0.303
RB9 wall area
percentage 63.9 (3.8) 64.3 (3.1) 63.5 (4.1) 0.422
RB10 LA/BSA
(mm2/m
2)
11.4 (3.8) 10.1 (3.2) 12.5 (3.9) 0.015

151
RB10 wall area
percentage 61.9 (3.2) 63.2 (3.1) 60.8 (3.1) 0.006
LB1 LA/BSA
(mm2/m
2)
8.6 (2.7) 9.4 (2.9) 8.1 (2.4) 0.097
LB1 wall area
percentage 64.1 (2.9) 63.5 (3.2) 64.6 (2.8) 0.199
LB2 LA/BSA
(mm2/m
2)
6.3 (3.2) 6.5 (3.2) 6.2 (3.2) 0.796
LB2 wall area
percentage 64.7 (3.8) 64.6 (3.6) 64.7 (4.0) 0.96
LB3 LA/BSA
(mm2/m
2)
12.7 (4.9) 13.1 (5.4) 12.4 (4.6) 0.627
LB3 wall area
percentage 61.3 (4.4) 61.9 (5.0) 60.9 (3.9) 0.414
LB4 LA/BSA
(mm2/m
2)
7.9 (3.2) 8.2 (3.6) 7.6 (2.9) 0.498
LB4 wall area
percentage 62.7 (4.2) 62.6 (4.5) 62.8 (4.1) 0.874
LB5 LA/BSA
(mm2/m
2)
7.1 (2.0) 6.6 (1.8) 7.4 (2.2) 0.161
LB5 wall area
percentage 64.2 (2.7) 65.2 (2.5) 63.4 (2.5) 0.015
LB6 LA/BSA
(mm2/m
2)
15.2 (6.4) 12.8 (5.1) 17.2 (6.8) 0.009
LB6 wall area
percentage 61.0 (4.7) 62.2 (4.4) 59.9 (4.7) 0.068
LB1+2 LA/BSA
(mm2/m
2)
13.4 (5.0) 12.4 (4.9) 14.1 (5.0) 0.216
LB1+2 wall area
percentage 62.3 (4.2) 63.1 (4.8) 61.6 (3.7) 0.219
LB8 LA/BSA
(mm2/m
2)
11.5 (4.1) 11.1 (5.0) 11.9 n(3.4) 0.511
LB8 wall area
percentage 63.5 (3.5) 64.7 (3.5) 62.7 (3.4) 0.042
LB9 LA/BSA
(mm2/m
2)
9.4 (3.7) 8.4 (3.5) 10.1 (3.7) 0.107
LB9 wall area
percentage 64.5 (3.1) 65.3 (3.1) 63.9 (3.1) 0.105
LB10 LA/BSA
(mm2/m
2)
11.2 (3.6) 9.7 (2.6) 12.3 (3.9) 0.009
LB10 wall area
percentage 62.0 (3.1) 62.8 (3.0) 61.4 (3.2) 0.103

152
Table 3.2.5 Demographics, clinical and laboratory characteristics
Characteristic Subjects
(n = 24)
Age (y) 33.8 (11.6)
Male (%) 37.5
Caucasian (%) 42.1
Asthma duration (y) 20.1 (11.1)
BMI (kg/m2) 28.9 (5.7)
Age of asthma onset (y) 15.5 (14.3)
Ex-smokers (%) 4.2
Atopy (%) 79.2
GINA class
GINA 5, % 16.7
GINA 4, % 50
GINA 3, % 0
GINA 1&2, % 33.3
Inhaled BDP equivalent (µg/24h) 1506 (938)
Pre-Bronchodilator FEV1 (L) 2.7 (0.9)
Pre-Bronchodilator FEV1 (%
predicted)
83.1 (17.5)
Pre-Bronchodilator FEV1/FVC
(%)
83.8 (10.4)
Post-Bronchodilator FEV1 (L) 3.0 (0.9)
Post-Bronchodilator FEV1 (%
predicted)
92.0 (13.7)
Post-Bronchodilator FEV1/FVC
(%)
88.1 (10.3)
Vascularity (mean Chalkley
count)
4.2 (1.0)
MLD E/I 0.81 (0.05) €VI-856HU 9.1 (12.1)

153
Figure 3.2.1 Comparing airway smooth muscle percentage and
vascularity in those with and without persistent airflow limitation
a) Airway smooth muscle % and b) vascularity (mean Chalkley count) in subjects with and
without persistent airflow limitation (post-bronchodilator [BD] FEV1 <80% and ≥80%
predicted).
P o s t-B D
FEV 1 8 0 % p r e d ic te d
P o s t-B D
FEV 1 < 8 0 % p r e d ic te d
0
2
4
6
8
1 0
1 2
Va
sc
ula
rit
y
p = 0 .0 1 7
b
P o s t-B D
FEV 1 8 0 % p r e d ic te d
P o s t-B D
FEV 1 < 8 0 % p r e d ic te d
0
2 0
4 0
6 0
8 0
Air
wa
y s
mo
oth
mu
sc
le %
p < 0 .0 0 1
a

154
Figure 3.2.2 Scatterplots of correlations, airway smooth muscle
Scatterplots showing correlations of post-bronchodilator [BD] FEV1 and FEV1/FVC with a)
and b) airway smooth muscle % and c) and d) vascularity.
0 2 0 4 0 6 0 8 0
2 0
4 0
6 0
8 0
1 0 0
1 2 0
1 4 0
A irw a y s m o o th m u s c le %
Po
st-
BD
FE
V1
% p
re
dic
ted
r = -0 .4 9 , p < 0 .0 0 1a
0 2 4 6 8 1 0
2 0
4 0
6 0
8 0
1 0 0
1 2 0
1 4 0
V a s c u la rity
Po
st-
BD
FE
V1
% p
re
dic
ted
r = -0 .3 , p = 0 .0 2 6
c
0 2 4 6 8 1 0
4 0
6 0
8 0
1 0 0
V a s c u la rity
Po
st-
BD
FE
V1
/FV
C (
%)
r = -0 .3 5 , p = 0 .0 0 8
d
0 2 0 4 0 6 0 8 0
4 0
6 0
8 0
1 0 0
A irw a y s m o o th m u s c le %
Po
st-
BD
FE
V1
/FV
C (
%)
r = -0 .4 4 , p < 0 .0 0 1
b

155
Figure 3.2.3 Scatterplots of correlations, epithelial thickness
Scatterplots showing correlations of epithelial thickness and airway smooth muscle % with a)
and b) mean segmental bronchial luminal and c) and d) wall area and e) and f) wall area %.
0 2 0 4 0 6 0 8 0 1 0 0 1 2 0
5
1 0
1 5
2 0
E p ith e lia l T h ic k n e s s (µ m )
Me
an
Se
gm
en
tal
lum
ina
l
are
a (
mm
2)/
BS
A
r = -0 .3 5 , p = 0 .0 2 0
a
0 2 0 4 0 6 0 8 0 1 0 0 1 2 0
6 0
6 5
7 0
E p ith e lia l T h ic k n e s s (µ m )
Me
an
Se
gm
en
tal
wa
ll a
re
a %
r = 0 .3 5 , p = 0 .0 1 9
e
0 2 0 4 0 6 0 8 0 1 0 0 1 2 0
5
1 0
1 5
2 0
2 5
E p ith e lia l T h ic k n e s s (µ m )
Me
an
Se
gm
en
tal
wa
ll
are
a (
mm
2)/
BS
A
r = -0 .3 1 , p = 0 .0 3 9
c
0 2 0 4 0 6 0 8 0
5
1 0
1 5
2 0
A irw a y s m o o th m u s c le %
Me
an
Se
gm
en
tal
lum
ina
l
are
a (
mm
2)/
BS
A
r = -0 .3 5 , p < 0 .0 0 1
b
0 2 0 4 0 6 0 8 0
5
1 0
1 5
2 0
2 5
A irw a y s m o o th m u s c le %
Me
an
Se
gm
en
tal
wa
ll
are
a (
mm
2)/
BS
A
r = -0 .3 2 , p = 0 .0 1 5
d
0 2 0 4 0 6 0 8 0
6 0
6 5
7 0
A irw a y s m o o th m u s c le %
Me
an
Se
gm
en
tal
wa
ll a
re
a %
r = 0 .2 7 , p = 0 .0 4 5
f

156
Figure 3.2.4 Scatterplots of correlations, vascularity
Scatterplots showing correlations of vascularity and airway smooth muscle % with a) and b)
MLDE/I and c) and d) VI-856 HU.
0 2 4 6 8 1 0
0 .7
0 .8
0 .9
1 .0
V a s c u la rity
ML
D E
/I
r = 0 .4 9 , p < 0 .0 0 1a
0 2 4 6 8 1 0
0
2 0
4 0
6 0
8 0
V a s c u la rity
VI-
85
6H
U (
%)
r = 0 .5 3 , p < 0 .0 0 1c
0 2 0 4 0 6 0 8 0
0 .7
0 .8
0 .9
1 .0
A irw a y s m o o th m u s c le %M
LD
E/I
r = 0 .3 0 , p = 0 .0 3
b
0 2 0 4 0 6 0 8 0
0
2 0
4 0
6 0
8 0
A irw a y s m o o th m u s c le %
VI-
85
6H
U (
%)
r = 0 .5 5 , p < 0 .0 0 1d

157
Figure 3.2.5 Scatterplots of correlation, vascularity and air
trapping in the replication group
0 2 4 6 8 1 0
0
2 0
4 0
6 0
8 0
V a s c u la rity
VI-
85
6 H
U (
%)
r = 0 .5 0 , p = 0 .0 1 4b
Validation of the association between vascularity and air-trapping in the replication group
showing scatterplots of vascularity with a) MLDE/I and b) VI-856 HU.
0 2 4 6 8 1 0
0 .7
0 .8
0 .9
1 .0
V a s c u la rity
ML
D E
/I
r = 0 .4 5 , p = 0 .0 2 9a

158
3.3 STUDY 3:
Randomised controlled trial of the prostaglandin D2
receptor 2 antagonist fevipiprant in persistent
eosinophilic asthma
3.3.1 Abstract
3.3.1.1 Background
Eosinophilic airway inflammation is often present in asthma and interventions that reduce it
result in improved clinical outcomes. Antagonism of the prostaglandin D2 receptor 2 (DP2)
may reduce eosinophilic airway inflammation.
3.3.1.2 Methods
We performed a single-centre, 12-week, randomized, double-blind, placebo-controlled,
parallel-group clinical trial of the DP2 receptor antagonist fevipiprant (QAW039) 225mg
twice per day orally in 61 subjects with persistent moderate-to-severe asthma and an elevated
sputum eosinophil count. The primary outcome was the change in sputum eosinophil
percentage from baseline to post-treatment. Secondary and exploratory outcomes included
changes in Asthma Control Questionnaire score (ACQ-7), standardised Asthma Quality of
Life Score (AQLQ(S)), forced expiratory volume in one second (FEV1), and bronchial
submucosal inflammation. This trial is registered with ClinicalTrials.gov (NCT01545726).

159
3.3.1.3 Measurements & main results
Sputum eosinophil percentage fell from a geometric mean of 5·4 % at baseline to 1·1 % post-
treatment in the fevipiprant group and from 4·7 % at baseline to 3·9 % post-treatment in the
placebo group (between group difference 3·5 -fold; 95% confidence interval 1·7 to 7·0 ; p =
0·0 014). Bronchial submucosal eosinophils were reduced 2.5-fold in the fevipiprant group
compared to placebo (p = 0.040). ACQ-7 score fell by 0·3 2 points in the fevipiprant group
compared to placebo (p = 0·1 7) and by 0.56 points in the subgroup with poor control (≥1.5
points) at baseline (p = 0.046). In the fevipiprant group compared to placebo AQLQ(S)
improved by 0.59 points (p = 0.0080) and post-bronchodilator FEV1 improved by 0.16 L (p =
0.021). Fevipiprant displayed a favourable safety profile, with no serious adverse events
reported.
3.3.1.4 Conclusions
Fevipiprant reduces eosinophilic airway inflammation in patients with persistent asthma and
raised sputum eosinophil counts despite inhaled corticosteroid treatment. This is associated
with improved lung function and asthma-related quality of life, and a favourable safety
profile.
160
3.3.2 Introduction
Asthma is a chronic inflammatory airway disease that is characterised by heterogeneity with
respect to clinical phenotype and response to therapy (241). Eosinophilic airway
inflammation, mediated by type 2 immunity, is a common feature of asthma (241). Treatment
strategies that specifically target eosinophilic airway inflammation substantially reduce
exacerbations of asthma in those patients with uncontrolled eosinophilic airway
inflammation, and to a lesser extent improve lung function and asthma control
(34,38,43,44,242,243).
There is increasing evidence that prostaglandin D2 (PGD2), acting upon the DP2 receptor,
also known as receptor homologous molecule expressed on T-helper 2 cells (CRTH2), may
play an important role in mediating eosinophilic airway inflammation in asthma. The DP2
receptor mediates the migration of T-helper 2 (TH2) cells, delays their apoptosis and
stimulates them to produce the cytokines IL-4, IL-5 and IL-13 (244-246). DP2 also
influences the migration of and cytokine release from type 2 innate lymphoid cells (247), and
importantly the receptor is expressed by eosinophils, and directly mediates their chemotaxis
and degranulation (248,249). The number of DP2+ cells in the bronchial submucosa
increases with increasing severity of asthma (32). DP2 is also expressed on airway epithelial
cells and directly promotes their migration and differentiation (32). DP2 is therefore a highly
promising novel drug target in the treatment of asthma. Fevipiprant (QAW039) is an orally
administered highly selective and potent antagonist of the DP2 receptor, but not to the more
general homeostatic PGD2 receptor DP1.

161
We tested the hypothesis that, in patients with sputum eosinophilia (≥ 2%) and persistent,
moderate-to-severe asthma, 12-weeks’ treatment with fevipiprant at a dose of 225mg twice
per day, on top of conventional treatment, reduces the levels of eosinophils in induced
sputum compared to placebo. Secondary objectives were to determine the effects of
fevipiprant on asthma symptoms, as measured by the seven-point Asthma Control
Questionnaire (ACQ-7) (168), and to assess safety and tolerability of fevipiprant. Exploratory
objectives included assessment of the effect of fevipiprant on the forced expiratory volume in
one second (FEV1), lung volumes using body plethysmography, health-related quality of life
as measured by the standardised Asthma Quality of Life Questionnaire (AQLQ(S)) (170),
airway inflammation and remodelling in bronchial biopsies and airway morphometry and
lung density assessed by quantitative computed tomography (CT).

162
3.3.3 Methods
3.3.3.1 Subjects
Participants were older than 18 years of age and had a clinical diagnosis of asthma that was
supported by one or more objective criteria.
1. An increase in forced expiratory volume (FEV1) of ≥ 12% and ≥ 200ml from its pre-
bronchodilator value following the inhalation of 400μg salbutamol.
2. A provoked fall in FEV1 of 20% by methacholine at ≤ 16mg/ml while on inhaled
corticosteroids (ICS)
3. A change in FEV1 of > 12% over two non-exacerbation-related measurements during
the previous year.
Participants were recruited from a regional refractory asthma clinic providing tertiary care for
a population of 4 million people. Suitable participants were also identified from secondary
care asthma and general respiratory clinics in the region, and through screening of local
primary care databases.
Inclusion criteria were:
1. current treatment with ICS
2. A sputum eosinophil count of ≥ 2% at screening
3. Either an Asthma Control Questionnaire (ACQ-7) score ≥ 1·5 at randomization or ≥ 1
exacerbations (requiring higher than the patient’s normal dose of systemic
corticosteroids for ≥ 3 days) in the past 12 months.

163
Exclusion criteria were:
1. Serious coexisting illness
2. Pregnancy or lactation
3. The possibility of conception
4. History of malignancy within the previous five years
5. Recent (within 6 weeks of screening) lower respiratory tract infection or exacerbation
of asthma requiring oral prednisolone
6. The use of omalizumab within 6 months before randomization into the study
7. The use of immunosuppressive medication (except low-dose [≤ 10mg prednisolone
per day] oral corticosteroids) within 30 days before randomization
All subjects provided written informed consent. The study protocol was approved by the
National Research Ethics Committee (Leicestershire, Northamptonshire and Rutland,
approval no. 11/EM/0402) and the United Kingdom Medicines and Healthcare Products
Regulatory Agency. The trial was registered with ClinicalTrials.gov (NCT01545726) and
EudraCT (2011-004966-13).
3.3.3.2 Design of the study
The study was a single-centre, randomised, double-blind, placebo-controlled, parallel-group
clinical trial conducted from February 2012 through June 2013. The funding organisation
(Novartis Pharmaceuticals) supplied the study drug and placebo.

164
The study design is illustrated in Figure 3.3.1a. Participants were given the option of
undergoing bronchoscopy at the baseline and post-treatment visits as part of the study.
Patients attended a screening visit (Visit 1, Day -21), at which inclusion/exclusion criteria
were reviewed, an induced sputum sample was collected and cell count was performed, in
order to assess eligibility based upon a sputum eosinophil count, and demographic and
clinical details were collected. Regular treatment was kept constant from this time point until
the end of the study.
One week later, a two-week single-blind placebo run-in period was commenced (Visit 2, Day
-14). Following this, patients attended a baseline visit (Visit 3, Day 0), at which the inclusion
and exclusion criteria were again assessed, taking into account the ACQ-7 score. If patients
fulfilled the criteria, they proceeded to undertake the remainder of the study visit tests,
(outlined in Table 3.3.1) and were then randomized in a 1:1 ratio to receive either fevipiprant
at a dose of 225 mg twice per day, or an identical placebo.
Patients attended a mid-treatment visit (Visit 4, Day 42), and a post-treatment visit (Visit 5,
Day 84). At the post-treatment visit, patients began a six-week single-blind placebo washout
period, and then attended an end-of-study visit (Visit 6, Day 126).
Criteria for withdrawal from the study were defined a priori, and included withdrawal of
informed consent, asthma exacerbation, pregnancy, and adverse events for which continued
exposure to the study drug would be detrimental.
All tests performed at the baseline and post-treatment visits were carried out on the same day,
with the exception of bronchoscopy, which was performed on a separate day not more than
seven days following the other tests, but not on the day immediately following them, due to
the possibility of interaction between the sputum induction procedure and bronchial biopsies.

165
The time interval between the two testing days was kept constant for each patient between the
baseline and post-treatment visits
Safety was assessed at each study visit on the basis of patient-reported adverse events,
physical examination, vital signs, haematology, blood chemistry, urinalysis and an
electrocardiogram.
3.3.3.3 Randomisation and masking
Randomisation was performed by the trial pharmacist using previously generated treatment
allocation cards, and was stratified by whether or not participants were receiving treatment
with regular oral corticosteroids, and whether they were undergoing bronchoscopy. All other
site staff, patients and sponsor personnel remained blinded to treatment allocation until the
study had been completed and the trial database locked. Results of sputum and blood
eosinophil counts subsequent to the baseline visit were not disclosed to the investigators
during the study because of the expected anti-eosinophilic effects of fevipiprant.
3.3.3.4 Statistical analysis
The primary outcome of the study was the change in sputum eosinophil percentage between
the baseline visit and the post-treatment visit. As sputum eosinophil percentage is known to
follow a log-normal distribution, the analysis was based on a log10-transformed scale with
results back-transformed to obtain the within-group ratios of geometric means at the end of
treatment compared to baseline, as well as their ratio. We report the reciprocal of these ratios
as fold-reductions from baseline, and as a measure of how many times greater the reduction
in the fevipiprant group was compared to the reduction in the placebo group, respectively.

166
The secondary outcome was the change from baseline to post-treatment with respect to ACQ-
7 score. Exploratory outcomes included the change from baseline to post-treatment with
respect to ACQ-7 score in the subgroup with baseline score ≥ 1·5 , AQLQ(S) score, FEV1
and submucosal eosinophil count on bronchial biopsy. Statistical analyses were performed
using SAS/STAT software, versions 9·3 and 9·4 of the SAS System for AIX (SAS Institute
Inc., Cary, NC, USA) and Prism 6 (GraphPad, La Jolla, CA, USA). Changes in efficacy
outcomes from the baseline to post-treatment visits were analysed using an analysis of
covariance (ANCOVA) model, with treatment as the fixed effect. Randomisation strata and
baseline values of efficacy variables were entered as factors in the ANCOVA model for
analysis of the primary outcome, secondary outcome and exploratory outcomes. Efficacy
outcomes were analysed by intention to treat and safety outcomes were analysed by treatment
received. One patient was assigned to fevipiprant but incorrectly dispensed placebo at the
mid-treatment visit. One patient was assigned to fevipiprant but incorrectly dispensed placebo
throughout the course of the study. They were included in the fevipiprant group for efficacy
analyses, but the latter patient was included in the placebo group for safety analyses. The
planned sample size of 60 randomised patients was calculated so that at least 24 patients per
arm would complete the post-treatment assessment in order to ensure 80% power at the two-
sided 5% significance, assuming a 50% reduction in sputum eosinophil percentage with
fevipiprant (250).

167
3.3.4 Results
Participants were recruited between Feb 10, 2012 and Jan 30, 2013. A total of 117 patients
attended a screening visit, of which 61 fulfilled the inclusion and exclusion criteria and were
randomised (Figure 3.3.1b). Thirty-one patients were assigned to receive placebo and 30 to
receive fevipiprant. Four patients withdrew in the placebo group and three patients in the
fevipiprant group, in each case due to an exacerbation of asthma. The randomised groups
were well-matched for baseline characteristics, as shown in Table 3.3.2. Efficacy outcomes
are shown in Figures 3.3.2-3.3.4, and in Tables 3.3.3-3.3.5.
The geometric mean sputum eosinophil percentage fell from 5·4 % at baseline to 1·1 % post-
treatment in the fevipiprant group, and from 4·7 % at baseline to 3·9 % post-treatment in the
placebo group. The ratio of geometric means post-treatment to baseline for the sputum
eosinophil percentage was 0·7 8 (1·3 -fold reduction) in the placebo group and 0·2 2 (4·5 -fold
reduction) in the fevipiprant group, with a 3·5 -fold (95% confidence interval [CI] 1·7 to 7·0 -
fold) greater reduction in the fevipiprant group compared to placebo (p = 0·0 014).
The mean ACQ-7 score fell by 0·3 2 points from baseline to post-treatment in the fevipiprant
group compared to the change seen with placebo, but this improvement did not reach
statistical significance (95% CI -0·7 8, 0·1 4; p = 0·1 7). However, among the subset of patients
(n = 40) uncontrolled at baseline (ACQ-7 score ≥ 1·5), the mean ACQ-7 score fell by 0·5 6
points compared to placebo, which was both clinically and statistically significant (95% CI -
1·1 2, -0·0 1; p = 0·0 46). The mean AQLQ(S) score improved by 0·5 9 points in the fevipiprant
group compared to placebo, which was statistically significant (95% CI 0·1 6, 1·0 3; p =

168
0·0 080). The mean post-bronchodilator FEV1 increased by 0·1 6L from baseline to post-
treatment in the fevipiprant group compared to placebo, with a statistically significant
difference between the groups (95% CI 0·0 3, 0·3 0; p = 0·0 21). There were no significant
differences between the groups with respect to changes in pre-bronchodilator FEV1. There
were no significant changes in peripheral blood eosinophil count or exhaled nitric oxide in
either group.
Paired bronchial biopsies (baseline and post-treatment) were obtained in 14 patients in the
fevipiprant group and 12 patients in the placebo group. We observed a 2·5 -fold greater
reduction in bronchial submucosal eosinophil numbers from baseline to post-treatment in the
fevipiprant group compared to the placebo group (p = 0·0 40). There was a 1·7 -fold reduction
in bronchial epithelial eosinophil numbers from baseline in favour of fevipiprant, but the
treatment difference did not reach statistical significance. Subjects treated with fevipiprant
demonstrated a 27·8 percentage point increase in the proportion of intact epithelium (95% CI
2·9 , 52·7 ; p = 0·0 30), and a 26·6 percentage point reduction in the proportion of denuded
epithelium (95% CI -44·9 , -8·3 ; p = 0·0 062), compared to the change seen with placebo.
Changes in epithelial integrity were not significantly correlated with changes in sputum or
bronchial mucosal eosinophilic inflammation, as shown in Figure 3.3.5.
Functional residual capacity (FRC) fell by 0·3 1 L in the fevipiprant group compared to the
change seen with placebo (95% CI -0·6 2, -0·0 01; p = 0·0 49) and expiratory CT lung volume
fell by 216 cm3 in the fevipiprant group compared to the placebo group (95% CI -391, -40; p
= 0·0 17). We observed a significant negative correlation between the change in expiratory
CT lung volume and the change in post-bronchodilator FEV1, taking the fevipiprant and

169
placebo groups together (R = - 0·3 17, p = 0·0 41), and this correlation was more pronounced
with CT-derived lower lobe lung volume (R = - 0·5 23, p = 0.0004) (Figure 3.3.6). Positive
correlations were also observed between changes in expiratory CT lung volume and changes
in both residual volume (RV) and the ratio of RV to total lung capacity (TLC) measured
using body plethysmography, but these correlations only reached statistical significance with
CT-derived lower lobe lung volumes (R = 0·3 74, p = 0·0 14 for RV; R = 0·3 61, p = 0·0 17 for
RV/TLC).
Significant positive correlations were observed between changes in plethysmographic and CT
lung volumes, as shown in Figure 3.3.6.
Outcomes measured following the 6 week washout period returned to baseline without any
significant differences between baseline and post-washout for any outcome. Fevipiprant had
an acceptable side-effect profile throughout the study period. Total adverse events and
adverse events within each organ class were balanced between the two treatment groups.
There were no deaths or serious adverse events reported, and no patient withdrawals
suspected by the investigator to be related to the study drug, as shown in Table 3.3.6.

170
3.3.5 Discussion
We found that fevipiprant significantly reduced eosinophilic inflammation in the sputum and
bronchial submucosa compared to placebo in patients with persistent, moderate-to-severe
asthma and sputum eosinophilia. Fevipiprant significantly improved AQLQ(S) scores, post-
bronchodilator FEV1 and functional residual capacity compared to placebo in all patients, and
ACQ-7 scores in the sub-group of patients who had poor asthma control at baseline (ACQ-7
≥ 1·5 points). Exploratory analyses of bronchial biopsies suggested that fevipiprant led to
improvements in epithelial integrity, but did not affect epithelial goblet cell number or
MUC5A expression.
The magnitude of reduction in eosinophilic inflammation reported here was comparable to
that observed with mepolizumab (34,243). Unlike mepolizumab (34,243), and other anti-
IL5(R) targeted biologics reslizumab and benralizumab, fevipiprant did not have any
significant effect on the blood eosinophil count. This suggests that DP2 receptor blockade
attenuates the migration of eosinophils into the airway tissues, but is unlikely to have a
substantial effect upon release from the bone marrow although it might exert a small indirect
effect through a reduction in circulating IL-5 (246,247). Previous interventional studies have
shown that anti-eosinophilic treatments or strategies exert their major therapeutic effect
through the reduction in asthma exacerbations (34,38,44,242,243), although effects on FEV1
have also been observed, particularly in patients with blood eosinophilia (43,44). The
treatment period in this study was not long enough to observe a significant effect on
exacerbations. Whether fevipiprant reduces the frequency of exacerbations in patients with
eosinophilic asthma is an important question for future studies.

171
We noted a prompt return to baseline values following a six-week placebo wash-out period in
the fevipiprant group with respect to sputum eosinophil percentage, ACQ-7 and AQLQ(S)
scores, and post-bronchodilator FEV1. There were no statistically significant differences
between baseline values and those recorded following the placebo wash-out. This suggests
that the short-term improvements in asthma quality of life and post-bronchodilator FEV1
seen with fevipiprant were driven by reversible processes rather than underlying disease
modification. However, we observed significant improvements in epithelial integrity
following 12 weeks of treatment with fevipiprant compared to placebo. Whether this effect
was a consequence of reduced eosinophilic inflammation which is known to cause epithelial
damage or a direct effect upon epithelial repair and differentiation as observed in vitro (32)
remains uncertain, although the lack of an association between changes in sputum eosinophil
counts and epithelial integrity in response to fevipiprant favours a direct mechanistic effect
upon the epithelium.
Previous clinical trials of DP2 receptor antagonists in asthma have yielded mixed results. The
compound OC000459 was found to improve pre-bronchodilator FEV1 and asthma quality of
life in steroid-free patients (251), with a subsequent study finding that the beneficial effect
was confined to patients with a baseline peripheral blood eosinophil count >250/μl (252).
However, this compound has not yet been tested in patients with moderate-to-severe asthma.
AMG853, a dual DP1 and DP2 antagonist, was not effective in improving asthma symptoms
or either pre- or post-bronchodilator FEV1 in patients with moderate-to-severe asthma (253),
but there is evidence that DP1 and DP2 stimulation may have opposing effects on a number
of inflammatory mechanisms (254). The efficacy of BI671800 was evaluated in two separate
randomised controlled trials, one in steroid-naïve adults with asthma, and one in patients
receiving inhaled fluticasone (255). In both cases, six weeks of treatment resulted in modest

172
but statistically significant improvements in pre-bronchodilator FEV1 compared to placebo.
In these previous studies patient selection was not based upon evidence of eosinophilic
airway inflammation. Previous experience has shown that targeting anti-eosinophilic
therapies to patients with evidence of uncontrolled type 2 inflammation is associated with
more clear evidence of efficacy (34,38,43,44,243), and the positive results obtained in our
study should therefore not be extrapolated to an unselected group of patients with moderate-
to-severe asthma.
One limitation of our study is the relatively small sample size undertaken in a single centre.
However, the effect size in our primary outcome the sputum eosinophil count was large and
other positive clinical outcomes showed both statistically and clinically important differences
between the fevipiprant and placebo groups. Furthermore, our study design allowed a
significant loss of efficacy to be demonstrated when fevipiprant was stopped. In contrast to
many clinical trials the clinical outcomes in the group that received placebo were typically
worse following intervention compared to their baseline, suggesting deterioration in this
group. The lack of a positive placebo effect in this study may be explained by the fact that
many of the participants were drawn from a tertiary refractory asthma clinic, and their
treatment had previously been fully optimised. We also included a two-week single-blind
placebo run-in period prior to the baseline visit specifically in order to minimise the placebo
effect. Finally, our inclusion and exclusion criteria mandated a six-week period of clinical
stability before patients could participate in the study, thus minimising the potential for
changes to occur as a result of regression to the mean. A further limitation of the study was
that two dispensing errors occurred, with one patient randomised to fevipiprant and receiving
placebo throughout, and a second randomised to fevipiprant and receiving placebo in the
second half of the treatment period. Since efficacy outcomes were analysed by intention to

173
treat, this could have increased the chance of a type II error. However, when efficacy
outcomes were analysed by treatment received there were no significant changes in the
results obtained (data not shown).
174
3.3.6 Conclusion
The DP2 receptor antagonist fevipiprant is effective at attenuating eosinophilic airway
inflammation in patients with persistent eosinophilic asthma, and appears to have a
favourable safety profile over a 12-week treatment period. There is evidence that fevipiprant
improves lung function and asthma-related quality of life, as well as expiratory air trapping
and epithelial integrity. Longer-term multi-centre studies are required to confirm these
findings and to investigate the effect of fevipiprant on asthma exacerbations.

175
3.3.7 Tables and Figures
Table 3.3.1: Summary of visit days and tests
Visit (Day) Tests carried out
Visit 1 (-21) Inclusion/exclusion criteria assessed
Induced sputum & sputum analysis
Demographic and clinical details
Visit 2 (-14) Inclusion/exclusion criteria assessed
ACQ & AQLQ
PC20 or reversibility
Skin prick test
Visit 3 (1) Inclusion/exclusion criteria assessed
ACQ & AQLQ
Blood haematology & biochemistry
Spirometry
Induced sputum & sputum analysis
HRCT
Bronchoscopy*
FENO
Visit 4 (42) ACQ & AQLQ
Blood haematology & biochemistry
Spirometry
Induced sputum & sputum analysis
Visit 5 (84) ACQ & AQLQ
Blood haematology & biochemistry
Spirometry
Induced sputum & sputum analysis
HRCT
Bronchoscopy*
FENO
Visit 6 (126) ACQ & AQLQ
Blood haematology & biochemistry

176
Spirometry
Induced sputum & sputum analysis
FENO
*Bronchoscopy timings as outlined in 3.3.3.2 Design of the study

177
Table 3.3.2 Baseline characteristics of randomised population
Characteristic
Fevipiprant (n = 30) Placebo (n = 31)
Sex (no. of subjects)
Male
Female
18
12
13
18
Age (yr)
Mean
Range
50
20 – 80
50
19 – 68
Duration of asthma (yr)
32 ± 16
29 ± 15
Body-mass index (kg/m2)
31·0 ± 5·9 29·6 ± 6·0
Positive atopic status
(% of subjects)
87 84
Number of exacerbations in previous
year
1.8 ± 1.7 2.2 ± 2.8
Number of patients (%) with
rhinosinusitis
12 (40.0) 11 (35.5)
Number of patients (%) with nasal
polyps
5 (16.7)
3 (9.7)
Total IgE (U/ml)
Median
Interquartile range
414
216 – 863
388
181 – 1121
FEV1 before bronchodilator use
(% of predicted value)
72·5 ± 23·8 75·1 ± 27·3
FEV1/FVC before bronchodilator use
(%)
Median
Interquartile range
68·0
46·7 – 73·6
69·2
52·1 – 73·5
Improvement in FEV1 after
bronchodilator use (%)
Median
Interquartile range
9·3
5·5 – 12·6
12·0
6·1 – 29·9
Eosinophil count in sputum (%) ¶
5·3 1 (2·7 7) 4·2 4 (4·0 3)
Eosinophil count in blood (×109/L) ¶
0·2 8 (1·3 1) 0·2 8 (0·7 9)

178
FENO50 (ppb)
30 ± 24 48 ± 43
Score on Asthma Control Questionnaire
1·9 ± 0·8 2·2 ± 0·9
Score on Asthma Quality of Life
Questionnaire
5·4 ± 1·1 5·0 ± 1·0
Inhaled corticosteroid dose
(beclomethasone dipropionate equivalent
[μg])
Median
Interquartile range
1600
800 – 1600
1000
800 – 1600
Use of long-acting beta-agonists
(% of subjects)
90
84
Regular use of oral prednisolone
(% of subjects)
23 23
Global Initiative for Asthma treatment
step (number of patients)
Step 2
Step 3
Step 4
Step 5
1
1
21
7
1
4
19
7
Plus-minus values are means ± standard deviation (SD) unless otherwise stated.
¶ Expressed as geometric mean (coefficient of variation)

179
Table 3.3.3 Outcome Measures at Baseline and Post-Treatment in the Full Analysis Set Population.
(Parameters in italics are ratio change. Non italics are absolute change)
Outcome
Baseline values Post-treatment values Change from baseline to post-treatment
Fevipipra
nt
Placebo
Fevipipra
nt
Placebo
Fevipiprant
(N = 30)
Placebo
(N = 31)
Treatment
difference
(Fevipiprant vs
placebo)
P value
Eosinophil count
in sputum (%) ‡
5·4 2
(28 7·6 5)
4·6 5
(39 1·4 4)
1·1 2
( 0·6 5, 1·9 3
)
3·8 8
( 2·2 6, 6·6 7
)
0·2 2
( 0·1 3, 0·3 9)
0·7 8
( 0·4 5, 1·3 3)
0·2 9
( 0·1 4, 0·5 8)
0·0 014
Eosinophil count
in blood (×109/L)
‡
0·2 9
(9 5·0 3)
0·2 8
(8 0·6 3)
0·2 9
( 0·2 3, 0·3 6
)
0·3 2
( 0·2 5, 0·4 1
)
1·0 1
( 0·7 9, 1·2 8)
1·1 3
( 0·8 9, 1·4 3)
0·8 9
( 0·6 6, 1·2 0) 0·4 4
FENO50 (ppb)
3 7·7 2
( 4·7 5)
4 3·6 7
( 6·9 7)
3 4·8 8
( 3·9 7)
3 8·4 8
( 4·3 2)
- 5·8 2
(-1 3·7 9, 2·1 6)
- 2·2 1
(-1 0·9 0, 6·4 8)
- 3·6 0
(-1 3·9 3, 6·7 2) 0·4 9
ACQ-7 score
1·9 1
( 0·1 5)
2·2 2
( 0·1 6)
1·8 9
( 0·1 8)
2·2 1
( 0·1 8)
- 0·1 8
( 0·1 8)
0·1 4
( 0·1 8)
- 0·3 2
(- 0·7 8, 0·1 4) 0·1 7
ACQ-7 score in
subjects with
baseline ≥ 1·5 †
2·3 7
( 0·1 1)
2·5 7
( 0·1 5)
1·6 9
( 0·2 2)
2·2 5
( 0·2 3)
- 0·3 7
( 0·2 2)
0·2 0
( 0·2 3)
- 0·5 6
(- 1·1 2, - 0·0 1) 0·0 46
ACQ-6 score
1·7 1
( 0·1 8)
2·1 1
( 0·1 7)
1·6 6
( 0·1 9)
2·1 1
( 0·1 9)
- 0·2 6
(- 0·6 5, 0·1 3)
0·1 9
(- 0·2 0, 0·5 9)
- 0·4 5
(- 0·9 6, 0·0 5) 0·0 77
AQLQ score
Total
5·4 3
( 0·2 0)
5·0 2
( 0·1 8)
5·4 8
( 0·1 7)
4·8 9
( 0·1 7)
0·2 7
(- 0·0 7, 0·6 1)
- 0·3 3
(- 0·6 6, 0·0 1)
0·5 9
( 0·1 6, 1·0 3) 0·0 080

180
AQLQ score
Symptoms
5·2 2
( 0·2 1)
4·7 3
( 0·2 0)
5·2 5
( 0·2 2)
4·6 2
( 0·2 1)
0·2 8
(- 0·1 5, 0·7 2)
- 0·3 4
(- 0·7 7, 0·0 9)
0·6 3
( 0·0 7, 1·1 8) 0·0 28
AQLQ score
Activities
5·5 8
( 0·2 0)
5·2 8
( 0·2 0)
5·7 0
( 0·1 5)
5·1 6
( 0·1 5)
0·2 8
(- 0·0 3, 0·5 9)
- 0·2 6
(- 0·5 7, 0·0 5)
0·5 4
( 0·1 4, 0·9 3) 0·0 087
AQLQ score
Emotions
5·4 8
( 0·2 6)
4·9 0
( 0·2 1)
5·5 0
( 0·2 2)
4·6 5
( 0·2 1)
0·3 3
(- 0·1 0, 0·7 6)
- 0·5 3
(- 0·9 5, - 0·1 1)
0·8 6
( 0·3 1, 1·4 0) 0·0 027
AQLQ score
Environmental
5·6 2
( 0·2 7)
5·2 8
( 0·2 3)
5·7 4
( 0·1 9)
5·1 9
( 0·1 8)
0·3 0
(- 0·0 8, 0·6 7)
- 0·2 5
(- 0·6 2, 0·1 2)
0·5 5
( 0·0 7, 1·0 2) 0·0 25
Pre-bronchodilator
FEV1 (L)
2·2 7
( 0·1 7)
2·2 7
( 0·1 8)
2·3 5
( 0·0 7)
2·2 8
( 0·0 7)
0·0 8
(- 0·0 6, 0·2 2)
0·0 04
(- 0·1 4, 0·1 5)
0·0 7
(- 0·1 0, 0·2 5) 0·4 1
Pre-bronchodilator
FEV1/FVC (%)
6 3·6 7
( 2·8 5)
6 4·2 3
( 2·1 7)
6 5·4 9
( 0·8 8)
6 3·6 1
( 0·8 8)
1·5 4
(- 0·2 2, 3·2 9)
- 0·3 4
(- 2·1 2, 1·4 3)
1·8 8
(- 0·3 8, 4·1 4) 0·1 0
Post-
bronchodilator
FEV1 (L)
2·4 9
( 0·1 7)
2·7 1
( 0·1 9)
2·6 6
( 0·0 5)
2·5 0
( 0·0 5)
0·0 6
(- 0·0 5, 0·1 7)
- 0·1 0
(- 0·2 1, 0·0 1)
0·1 6
( 0·0 3, 0·3 0) 0·0 21
Post-
bronchodilator
FEV1/FVC (%)
6 6·9 0
( 2·8 2)
6 9·7 2
( 2·1 4)
7 0·4 2
( 1·0 2)
6 7·3 1
( 1·0 3)
2·1 0
( 0·0 5, 4·1 5)
- 1·0 0
(- 3·0 7, 1·0 6)
3·1 1
( 0·4 6, 5·7 5) 0·0 23
RV (L)
2·7 8
( 0·2 2)
2·8 7
( 0·2 3)
2·6 6
( 0·1 3)
2·7 9
( 0·1 2)
- 0·1 7
(- 0·4 2, 0·0 9)
- 0·0 3
(- 0·2 9, 0·2 2)
- 0·1 4
(- 0·4 6, 0·1 9) 0·4 0
TLC (L)
6·4 9
( 0·2 9)
6·4 1
( 0·2 9)
6·4 0
( 0·1 3)
6·3 7
( 0·1 3)
- 0·0 4
(- 0·3 0, 0·2 1)
- 0·0 8
(- 0·3 3, 0·1 8)
0·0 4
(- 0·2 9, 0·3 6) 0·8 3

181
RV/TLC (%)
4 2·2 8
( 2·3 0)
4 4·2 9
( 2·4 9)
4 0·7 0
( 1·3 0)
4 3·0 8
( 1·3 2)
- 2·6 4
(- 5·2 4, - 0·0 4)
- 0·2 60
(- 2·9 2, 2·4 0)
- 2·3 8
(- 5·6 9, 0·9 3) 0·1 5
FRC (L)
3·9 0
( 0·2 6)
3·7 3
( 0·2 4)
3·5 8
( 0·1 2)
3·8 8
( 0·1 2)
- 0·2 3
(- 0·4 8, 0·0 1)
0·0 8
(- 0·1 7, 0·3 2)
- 0·3 1
(- 0·6 2,- 0·0 01) 0·0 49
KCO
(% predicted)
10 8·9 3
( 4·3 9)
10 4·8 7
( 3·2 8)
10 6·4 7
( 1·7 2)
10 9·0 1
( 1·7 0)
- 0·3 2
(- 3·7 8, 3·1 4)
2·2 2
(- 1·2 0, 5·6 3)
- 2·5 4
(- 6·9 0, 1·8 3) 0·2 5
Baseline and post-treatment values are mean (standard error), change from baseline to post-treatment is mean change (lower limit, upper limit of
95% confidence interval), and treatment difference is mean change in fevipiprant group minus mean change in placebo group (lower limit, upper
limit of 95% confidence interval), unless otherwise stated. Post-treatment and changes from baseline to post-treatment are covariate-
adjusted (least square mean) values.
‡ Baseline values are geometric mean (% coefficient of variation), post-treatment values are geometric mean (lower limit, upper limit of 95%
confidence interval), change from baseline to post-treatment is geometric mean fold-change (lower limit, upper limit of 95% confidence
interval), and treatment difference is ratio of geometric mean fold-change in fevipiprant group to geometric mean fold-change in placebo group
(lower limit, upper limit of 95% confidence interval).
†N = 18 in fevipiprant group and N = 22 in placebo group

182
Table 3.3.4 Bronchial biopsy outcome measures
Outcome
Baseline values Post-treatment values Change from baseline to post-treatment
Fevipipran
t
Placebo
Fevipipran
t
Placebo
Fevipiprant
(N = 14)
Placebo
(N = 12)
Treatment
difference
(Fevipiprant vs
placebo)
P value
Inflammatory cells*
Eosinophils/mm2
lamina propria
1 3·9
(2 3·5 )
9·1
(3 9·4 )
6·7
(2 8·8 )
1 5·8
(3 3·3 )
0·6
( 0·3 , 1·0 )
1·4
( 0·7 , 2·7 )
0·4
( 0·2 , 1·0 )
0·0 40
CD3+ cells/mm2
lamina propria
9·0
(3 7·7 )
1 1·1
(3 1·2 )
1 4·4
(2 9·8 )
1 4·6
(3 1·0 )
1·6
( 0·7 , 3·9 )
1·3
( 0·5 , 3·3 )
1·2
( 0·3 , 4·3 )
0·7 5
Mast cells/mm2
lamina propria
5·5
(3 6·7 )
8·9
(2 6·5 )
4·7
(2 7·4 )
1 1·9
(2 8·5 )
0·9
( 0·5 , 1·5 )
1·3
( 0·8 , 2·3 )
0·6
( 0·3 , 1·4 )
0·2 5
Neutrophils/mm2
lamina propria
1·3
(3 8·5 )
3·1
(3 6·5 )
1·3
(3 1·8 )
3·5
(3 3·1 )
1·0
( 0·4 , 2·4 )
1·1
( 0·4 , 2·8 )
0·9
( 0·2 , 3·2 )
0·8 4
Eosinophils/mm2
epithelium
2·5
(4 5·9 )
2·2
(4 2·8 )
2·4
(5 0·5 )
3·5
(6 7·3 )
1·0
( 0·4 , 2·8 )
1·5
( 0·4 , 5·4 )
0·7
( 0·2 , 2·9 )
0·5 9
CD3+ cells/mm2
epithelium
2·0
(3 8·8 )
3·9
(5 3·8 )
4·1
(4 7·0 )
3·2
(5 6·8 )
1·7
( 0·5 , 5·4 )
0·8
( 0·2 , 3·2 )
2·0
( 0·3 , 1 2·0 )
0·4 2
Mast cells/mm2
epithelium
0·8
(2 1·2 )
1·0
(2 2·7 )
1·7
(3 2·8 )
1·8
(3 9·2 )
1·9
( 1·0 , 3·4 )
1·8
( 0·9 , 3·6 )
1·0
( 0·4 , 2·6 )
0·9 3
Neutrophils/mm2 0·7 2·1 0·8 0·8 1·1 0·4 3·1 0·0 44

183
epithelium
( 8·6 ) (5 3·2 ) (1 8·7 ) (2 2·2 ) ( 0·6 , 2·3 ) ( 0·2 , 0·8 ) ( 1·0 , 9·1 )
Mast cells/mm2
airway smooth muscle
3·4
(4 3·4 )
4·3
(5 1·1 )
2·9
(5 3·8 )
4·8
(5 6·6 )
0·7
( 0·2 , 1·9 )
1·1
( 0·4 , 3·0 )
0·6
( 0·1 , 2·6 )
0·4 8
Tissue remodeling†
MUC5AC cells/mm
intact epithelial length
3 8·3
( 6·7 )
2 4·6
( 7·9 )
5 5·6
( 7·6 )
3 7·1
( 7·9 )
1 2·8
(- 7·3 , 3 2·9 )
1 0·2
(- 7·6 , 2 7·9 )
2·7
(-2 4·1 , 2 9·5 )
0·8 4
MUC5AC cells/mm2
intact epithelial area
73 8·2
(13 4·8 )
46 1·6
(12 8·2 )
83 6·6
(14 0·7 )
66 6·6
(14 6·9 )
3 7·0
(-34 9·0 ,
42 3·4 )
19 2·9
(-148, 53 3·7 )
-156
(-671, 35 9·3 )
0·5 3
Percentage of intact
epithelial area
positive for MUC5AC
5·4
( 2·6 )
4·7
( 1·7 )
1 0·6
( 2·6 )
4·5
( 2·7 )
4·7
(- 1·1 , 1 0·5 )
- 0·2
(- 5·3 , 4·9 )
4·9
(- 2·8 , 1 2·6 )
0·20
Goblet cells/mm
intact epithelial length
1 3·7
( 4·2 )
1 1·6
( 3·3 )
2 2·3
( 4·2 )
2 3·2
( 4·8 )
7·9
(- 0·6 , 1 6·5 )
1 1·6
( 3·6 , 1 9·7 )
- 3·7
(-1 5·5 , 8·0 )
0·5 1
Goblet cells/mm2
intact epithelial area
28 7·8
(8 3·6 )
20 9·7
(4 8·5 )
36 6·9
(9 0·7 )
45 7·0
(10 3·4 )
5 8·9
(-147, 26 5·2 )
24 7·4
(5 1·7 , 44 3·0 )
-188
(-473, 9 5·9 )
0·1 8
Vessel score (mean
Chalkley count)
5·8
( 0·3 )
6·6
( 0·5 )
5·9
( 0·4 )
5·8
( 0·4 )
0·1
(- 0·8 , 1·0 )
- 0·8
(- 1·8 , 0·1 )
0·9
(- 0·4 , 2·2 )
0·1 7
Intact epithelium (%
of total length)
2 8·0
( 6·5 )
4 7·0
( 7·9 )
5 1·7
( 6·9 )
4 2·9
( 7·1 )
2 3·7
( 6·4 , 4 1·0 )
- 4·1
(-2 2·0 , 1 3·8 )
2 7·8
( 2·9 , 5 2·7 )
0·0 30
Partially intact
epithelium
(% of total length)
3 9·0
( 4·3 )
3 9·2
( 6·4 )
3 4·0
( 4·8 )
3 5·3
( 5·0 )
- 5·0
(-1 9·6 , 9·5 )
- 3·9
(-1 8·9 , 1 1·2 )
- 1·2
(-2 2·1 , 1 9·7 )
0·9 1
Denuded epithelium
(% of total length)
3 3·0
( 6·7 )
1 3·8
( 4·1 )
1 4·3
( 5·5 )
2 1·7
( 5·7 )
-1 8·6
(-3 1·4 , - 5·9 )
8·0
(- 5·2 , 2 1·2 )
-2 6·6
(-4 4·9 , - 8·3 )
0·0 062

184
Epithelial thickness
(μm)
5 4·3
( 4·5 )
6 4·0
( 5·8 )
6 7·3
( 4·3 )
5 8·4
( 4·9 )
1 0·3
(- 5·6 , 2 6·2 )
- 5·1
(-2 1·9 , 1 1·7 )
1 5·4
(- 7·7 , 3 8·5 )
0·1 8
RBM thickness (μm)
1 4·9
( 1·2 )
1 0·4
( 1·0 )
1 1·3
( 1·1 )
1 3·4
( 1·2 )
- 1·5
(- 3·8 , 0·7 )
0·6
(- 1·9 , 3·0 )
- 2·1
(- 5·4 , 1·2 )
0·2 0
*Baseline and post-treatment values are geometric mean (% coefficient of variation), change from baseline to post-treatment is geometric mean
fold-change (lower limit, upper limit of 95% confidence interval), and treatment difference is ratio of geometric mean fold-change in fevipiprant
group to geometric mean fold-change in placebo group (lower limit, upper limit of 95% confidence interval).
†Baseline and post-treatment values are mean (standard error), change from baseline to post-treatment is mean change (lower limit, upper limit
of 95% confidence interval), and treatment difference is mean change in fevipiprant group minus mean change in placebo group (lower limit,
upper limit of 95% confidence interval).

185
Table 3.3.5 Quantitative computed tomography and densitometry
Outcome
Baseline values Post-treatment values Change from baseline to post-treatment
Fevipipran
t
Placebo
Fevipiprant
Placebo
Fevipiprant
(N = 23)
Placebo
(N = 26)
Treatment
difference
(Fevipiprant vs
placebo)
P value
RB1 wall area /
BSA (mm2/m
2)
1 9·7 4
( 1·0 9)
1 9·5 9
( 0·9 4)
2 0·8 9
( 1·5 0)
1 8·3 7
( 1·4 1)
1·1 5
(- 0·8 9, 3·1 8)
- 1·2 3
(- 3·1 4, 0·6 8)
2·3 8
(- 0·4 1, 5·1 7)
0·0 93
RB1 luminal area /
BSA (mm2/m
2)
1 2·5 4
( 1·4 5)
1 1·1 1
( 0·7 9)
1 4·2 2
( 2·0 5)
1 1·0 2
( 1·9 2)
1·6 8
(- 1·5 5, 4·9 0)
- 0·0 9
(- 3·1 2, 2·9 3)
1·7 7
(- 2·6 5, 6·1 9)
0·4 2
RB1 percentage wall
area (%)
6 2·7
( 1·3 )
6 4·5
( 0·8 )
6 3·2
( 1·1 )
6 3·1
( 1·1 )
0·4
(- 1·3 , 2·2 )
- 1·4
(- 3·0 , 0·3 )
1·8
(- 0·6 , 4·2 )
0·1 4
Average wall area /
BSA (mm2/m
2)
1 7·3
( 0·5 )
1 7·7
( 0·6 )
1 7·6
( 0·6 )
1 7·8
( 0·6 )
0·3
(- 0·5 , 1·1 )
0·1
(- 0·7 , 0·9 )
0·2
(- 0·9 , 1·3 )
0·7 5
Average lumen area
/ BSA (mm2/m
2)
1 0·6
( 0·5 )
1 0·9
( 0·6 )
1 0·7
( 0·6 )
1 1·5
( 0·6 )
0·2
(- 0·6 , 1·0 )
0·6
(- 0·2 , 1·3 )
- 0·4
(- 1·5 , 0·7 )
0·4 5
Average percentage
wall area (%)
6 3·2
( 0·5 )
6 2·8
( 0·4 )
6 2·9
( 0·3 )
6 2·3
( 0·3 )
- 0·3
(- 1·0 , 0·4 )
- 0·5
(- 1·1 , 0·1 )
0·2
(- 0·7 , 1·1 )
0·6 7
Inspiratory MLD
(HU)
-82 9·1
( 7·7 )
-83 7·2
( 6·9 )
-83 9·7
( 5·4 )
-84 6·5
( 5·1 )
-1 0·6
(-2 0·7 , - 0·6 )
- 9·3
(-1 8·7 , 0·2 )
- 1·4
(-1 5·2 , 1 2·4 )
0·8 4
Expiratory MLD
(HU)
-70 4·8
(1 5·0 )
-71 9·1
(1 0·6 )
-70 6·6
(1 2·7 )
-73 2·7
(1 1·7 )
- 1·0
(-1 1·5 , 9·6 )
-1 3·0
(-2 2·8 , - 3·2 )
1 2·0
(- 2·4 , 2 6·4 )
0·0 99
MLD E/I
0·8 51
( 0·0 16)
0·8 61
( 0·0 13)
0·8 41
( 0·0 14)
0·8 65
( 0·0 13)
- 0·0 10
(-
0·0 26, 0·0 05)
0·0 03
(-
0·0 12, 0·0 17)
- 0·0 13
(- 0·0 34, 0·0 08)
0·2 2
Inspiratory VI <-950 1 3·7 1 4·3 1 5·2 1 4·9 1·5 0·7 0·8 0·4 2

186
HU (cm3) ( 1·4 ) ( 1·2 ) ( 1·2 ) ( 1·2 ) ( 0·0 , 3·1 ) (- 0·8 , 2·1 ) (- 1·2 , 2·9 )
Expiratory VI <-856
HU (cm3)
2 1·4
( 3·7 )
2 2·0
( 2·8 )
2 1·8
( 3·4 )
2 4·1
( 3·1 )
0·4
(- 2·0 , 2·8 )
2·2
(- 0·1 , 4·4 )
- 1·8
(- 5·1 , 1·5 )
0·2 7
CTLV expiratory
(cm3)
3040
(199)
3209
(188)
3004
(225)
3420
(206)
-10
(-138, 118)
205
(86, 325)
-216
(-391, -40)
0·0 17
CTLV inspiratory
(cm3)
5221
(252)
5588
(297)
5419
(266)
5809
(251)
198
(-58, 454)
222
(-19, 462)
-24
(-375, 328)
0·8 9
CT lung volume E/I
0·5 88
( 0·0 26)
0·5 83
( 0·0 30)
0·5 57
( 0·0 26)
0·5 82
( 0·0 24)
- 0·0 30
(-
0·0 66, 0·0 06)
- 0·0 06
(-
0·0 40, 0·0 27)
- 0·0 24
(- 0·0 73, 0·0 26)
0·3 4
P15 (HU)
-93 9·7
( 5·3 )
-94 2·4
( 4·0 )
-94 6·5
( 3·6 )
-94 7·2
( 3·4 )
- 6·9
(-1 3·2 , - 0·5 )
- 4·8
(-1 0·7 , 1·2 )
- 2·1
(-1 0·8 , 6·6 )
0·6 3
Pi10 (mm2)
1 5·6
( 0·4 )
1 4·8
( 0·2 )
1 6·0
( 0·4 )
1 5·0
( 0·4 )
0·3
(- 0·2 , 0·9 )
0·2
(- 0·3 , 0·8 )
0·1
(- 0·7 , 0·9 )
0·7 6
Po20 (%)
5 6·5
( 0·3 )
5 6·5
( 0·4 )
5 7·8
( 0·7 )
5 6·8
( 0·7 )
1·3
( 0·0 , 2·6 )
0·4
(- 0·9 , 1·6 )
0·9
(- 0·9 , 2·7 )
0·3 2
Baseline and post-treatment values are mean (standard error), change from baseline to post-treatment is mean change (lower limit, upper limit of
95% confidence interval), and treatment difference is mean change in fevipiprant group minus mean change in placebo group (lower limit, upper
limit of 95% confidence interval).

187
Table 3.3.6 Summary of Adverse Events
Group Period between
baseline and post-
treatment visits
Period between
baseline and end-of-
study visits
Fevipiprant
(N=29)
n (%)
Placebo
(N=32)
n (%)
Fevipiprant
(N=29)
n (%)
Placebo
(N=32)
n (%)
Patients with at least 1 AE 21 (7 2·4 ) 25 (7 8·1 ) 24 (8 2·8 ) 26 (8 1·3 )
Primary system organ class
Infections and infestations 8 (2 7·6 ) 8 (2 5·0 ) 11 (3 7·9 ) 10 (3 1·3 )
Respiratory, thoracic and
mediastinal disorders
6 (2 0·7 ) 9 (2 8·1 ) 12 (4 1·4 ) 15 (4 6·9 )
Gastrointestinal disorders 3 (1 0·3 ) 6 (1 8·8 ) 5 (1 7·2 ) 8 (2 5·0 )
Nervous system disorders 3 (1 0·3 ) 6 (1 8·8 ) 3 (1 0·3 ) 8 (2 5·0 )
Injury, poisoning and procedural
complications
5 (1 7·2 ) 1 ( 3·1 ) 5 (1 7·2 ) 2 ( 6·3 )
Musculoskeletal and connective
tissue disorders
1 ( 3·4 ) 3 ( 9·4 ) 3 (1 0·3 ) 3 ( 9·4 )
General disorders and
administration site conditions
3 (1 0·3 ) 1 ( 3·1 ) 3 (1 0·3 ) 2 ( 6·3 )
Blood and lymphatic system
disorders
2 ( 6·9 ) 0 2 ( 6·9 ) 0
Eye disorders 0 2 ( 6·3 ) 0 2 ( 6·3 )
Investigations 1 ( 3·4 ) 1 ( 3·1 ) 2 ( 6·9 ) 2 ( 6·3 )
Metabolism and nutrition
disorders
2 ( 6·9 ) 0 2 ( 6·9 ) 0
Cardiac disorders 0 1 ( 3·1 ) 0 1 ( 3·1 )
Renal and urinary disorders 1 ( 3·4 ) 0 2 ( 6·9 ) 0
Reproductive system and breast
disorders
0 1 ( 3·1 ) 0 1 ( 3·1 )
Skin and subcutaneous tissue
disorders
0 1 ( 3·1 ) 1 ( 3·4 ) 1 ( 3·1 )
Immune system disorders 0 0 0 1 ( 3·1 )
Surgical and medical procedures 0 0 0 1 ( 3·1 )
Vascular disorders 0 0 0 1 ( 3·1 )

188
Figure 3.3.1 Summary of study protocol and participant flow
Panel A shows the timings of study visits and treatment allocations. Panel B shows the
number of patients who attended screening, were randomised, and completed each of
the study visits.

189
Figure 3.3.2 Comparison of eosinophilic inflammation
outcomes between the study groups
Panels A and B show fold-reductions in sputum and blood eosinophil counts
respectively at each study visit compared to the baseline visit, in the placebo (blue
square) and fevipiprant (orange circle) groups. P values refer to differences between the
study groups with respect to change from the baseline visit. Panels C and D show
lamina propria and epithelial eosinophil numbers respectively at the baseline and post-
treatment visits, in the placebo (blue square) and fevipiprant (orange circle) groups. Box
and whisker plots show the median, 25th
and 75th
percentiles as a box, and the 10th
and
90th
percentiles as whiskers. P values refer to differences between the study groups with
respect to change from the baseline visit to the post-treatment visit.

190
Figure 3.3.3 Comparison of patient-reported and lung
function outcome measures between the study groups

191
Figure 3.3.3 cont…
Changes compared to the baseline visit are shown in the placebo (blue square) and
fevipiprant (orange circle) groups with respect to Asthma Control Questionnaire score
(ACQ7) in the Full Analysis Set (FAS, Panel A), ACQ7 in the subgroup with a baseline
value ≥ 1·5 (Panel B), standardised Asthma Quality of Life Questionnaire score
(AQLQ(S), Panel C), forced expiratory volume in one second (FEV1) performed before
the administration of a bronchodilator (Panel D), FEV1 performed after the
administration of a bronchodilator (Panel E), and functional residual capacity (FRC,
Panel F). P values refer to differences between the study groups with respect to change
from the baseline visit.
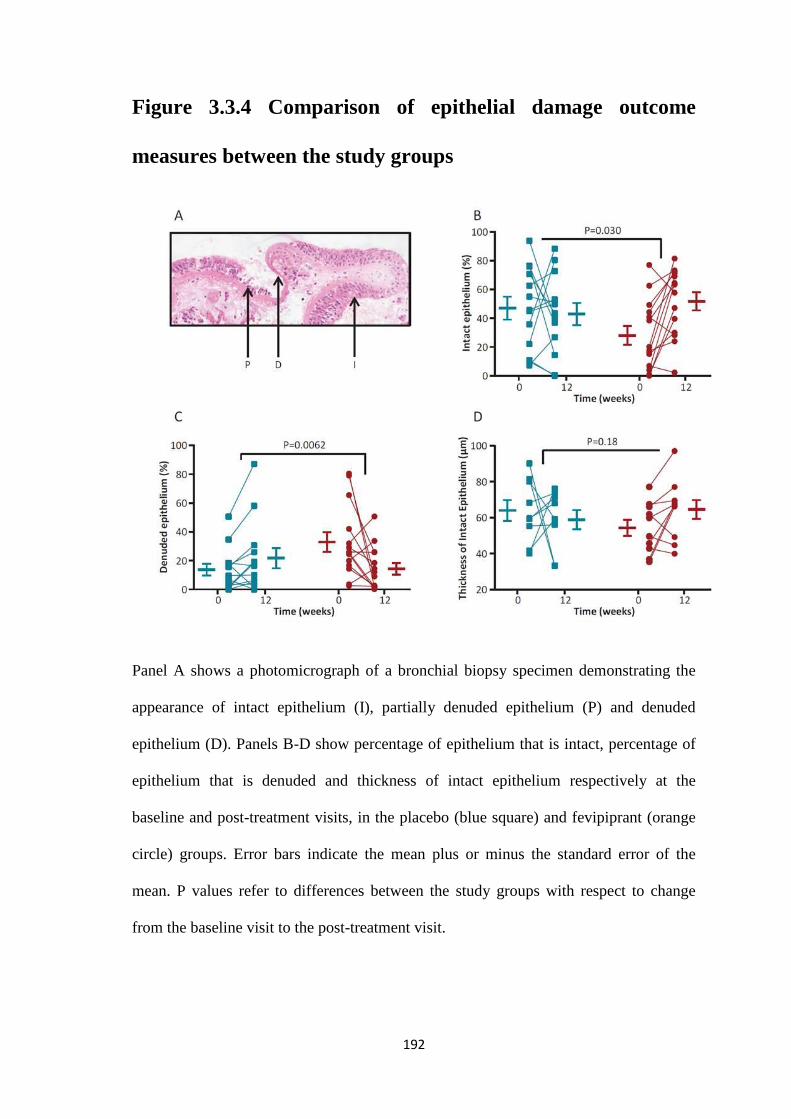
192
Figure 3.3.4 Comparison of epithelial damage outcome
measures between the study groups
Panel A shows a photomicrograph of a bronchial biopsy specimen demonstrating the
appearance of intact epithelium (I), partially denuded epithelium (P) and denuded
epithelium (D). Panels B-D show percentage of epithelium that is intact, percentage of
epithelium that is denuded and thickness of intact epithelium respectively at the
baseline and post-treatment visits, in the placebo (blue square) and fevipiprant (orange
circle) groups. Error bars indicate the mean plus or minus the standard error of the
mean. P values refer to differences between the study groups with respect to change
from the baseline visit to the post-treatment visit.

193
Figure 3.3.5 Correlations between changes in eosinophilic
airway inflammation and changes in epithelial damage
between the baseline and post-treatment visits
Panels A and B show correlations between fold-change in sputum eosinophil count and
change in intact or denuded epithelial percentage respectively. Panels C and D show
correlations between fold-change in submucosal eosinophil count and change in intact
or denuded epithelial percentage respectively. Participants in the placebo and
fevipiprant groups are represented by blue squares and orange circles respectively, and
best-fit linear regression lines are shown for the combined group. Spearman correlation
coefficients (r) and associated P values are shown
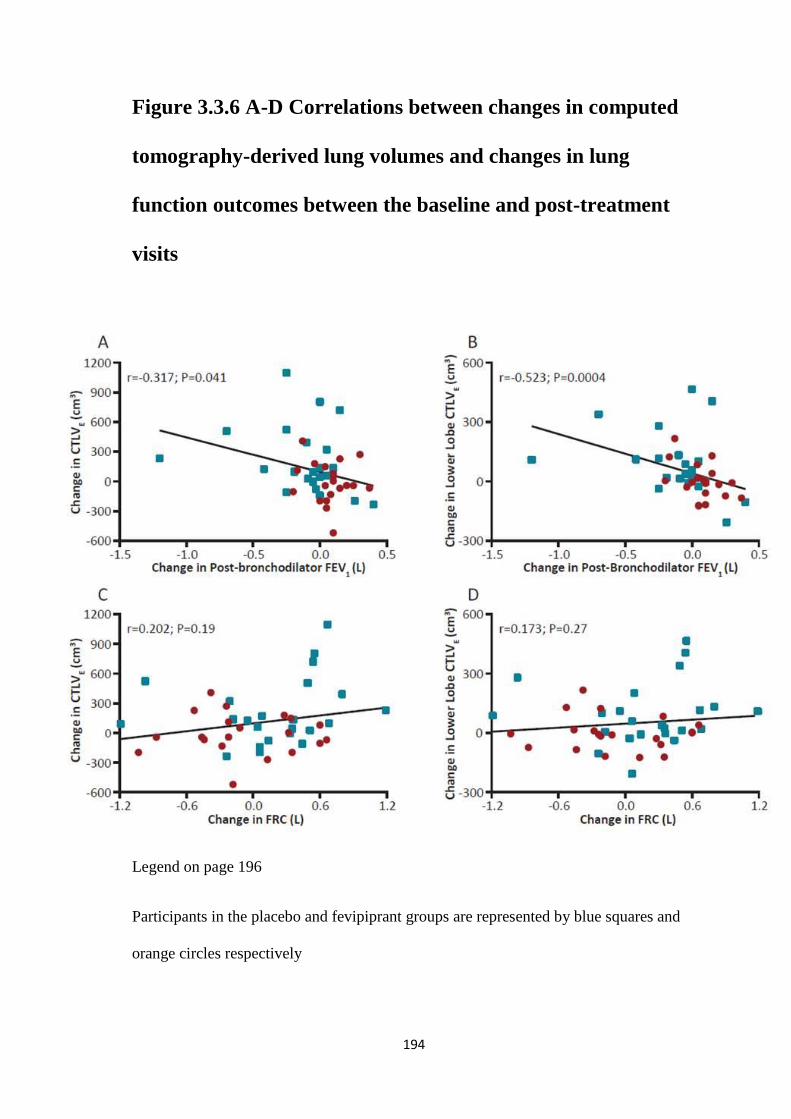
194
Figure 3.3.6 A-D Correlations between changes in computed
tomography-derived lung volumes and changes in lung
function outcomes between the baseline and post-treatment
visits
Legend on page 196
Participants in the placebo and fevipiprant groups are represented by blue squares and
orange circles respectively

195
Figure 3.3.6 E-H Correlations between changes in computed
tomography-derived lung volumes and changes in lung
function outcomes between the baseline and post-treatment
visits
Legend on page 196
Participants in the placebo and fevipiprant groups are represented by blue squares and
orange circles respectively

196
Figure 3.3.6 Correlations between changes in computed
tomography-derived lung volumes and changes in lung
function outcomes between the baseline and post-treatment
visits
Correlations are shown between changes in expiratory computed tomography-derived
lung volumes (CTLVE) in the whole lung or specifically the lower lobes, and changes in
post-bronchodilator forced expiratory volume in one second (FEV1, Panels A and B),
functional residual capacity (FRC, Panels C and D), residual volume (RV, Panels E and
F), and the ratio of residual volume to total lung capacity (RV/TLC, Panels G and H).
Participants in the placebo and fevipiprant groups are represented by blue squares and
orange circles respectively, and best-fit linear regression lines are shown for the
combined group. Spearman correlation coefficients (r) and associated P values are
shown.

197
4 CONCLUSIONS

198
4.1 Final Discussion
Airway wall remodelling, alongside airway inflammation is thought to be an integral
part of disease pathogenesis in both asthma and COPD. It is a coverall term for
histological changes in the airways that is not inflammation. Research into remodelling
and inflammation in asthma and COPD have been ongoing for decades, however the
natural history of remodelling, the potential for reversal and its relationship to
inflammation remain largely unknown.
Gas trapping and emphysema are also features seen in obstructive airway diseases, the
former thought to be related to disease in the small distal airways and the latter a
consequence of long standing small airway disease. Again, thought to relate back to
remodelling and inflammation.
Understanding remodelling is of high importance, and traditionally it has been studied
using ex vivo tissue samples and requires invasive methods to collect samples. There
are numerous difficulties with traditional methods. Firstly tissue collection in living
subjects is invasive. A bronchoscopy is an unpleasant experience. For the most part it is
avoided in research, in those with very severe disease as it is not without risks.
Secondly only relatively small samples can be easily collected. Certainly there is no
scope for large ‘organ level’ studies particularly in asthma. Thirdly histological and
pathological analysis requires the tissue/organ to be ex vivo.
QCT is quick, painless, non-invasive, can be done in large numbers and allows in vivo
analysis at organ level. However an obvious consideration for QCT is radiation
exposure. In this thesis all CTs were acquired using a low dose protocol, and all studies

199
had a limit of 10mSv exposure over three years. This is a very conservative approach
when national regulations set a maximum limit of 20mSv per year for individuals who
work with radiation, such as nuclear power station workers.
This thesis has demonstrated that QCT gives us the ability to quantify and assess the
structure of the lungs without using invasive procedures. It enables in vivo assessment,
and when done responsibility and with careful monitoring, repeated in vivo assessment.
Imaging is therefore a unique opportunity to probe the lungs and QCT in particular is
able to provide a lot of data regarding structure, and how structre relates to function.
I will now summarise the findings of each of the studies included in this thesis, evaluate
how the study has demonstrated the role QCT can play in providing insights into
obstructive airway diseases. I will also discuss key questions, future directions and the
limitations of this thesis.

200
4.2 Study 3.1: Relationship Between Lung Function and Quantitative
Computed Tomography Parameters of Airway Remodelling, Air-
trapping and Emphysema in Asthma and COPD: A Single Center
Study
This study demonstrated a few key points. It confirmed the heterogeneity within each
disease. In all QCT measures there was overlap between all three groups, with some
individuals from both COPD and asthma cohorts falling into the same ranges as the
healthy subjects. In diseases such as asthma and COPD where there is a great deal of
heterogeneity, a tool like QCT, which is able to assess large numbers of subjects, gives
more scope for seeing trends and patterns which might otherwise be missed.
Indeed, despite the heterogeneity seen, it was possible to assess the differences of QCT
derived measures of proximal airways. This study showed that when looking at all
COPD subjects, and all asthmatic subjects, they differed significantly to healthy
controls by having larger percentage wall areas in their segmental bronchi, and smaller
lumen areas, (although the latter only reached statistical significance with asthmatics).
Differences were also made more apparent when stratifying subjects according to
airflow limitation, suggesting that structural changes seen on QCT are linked to
established physiological measures of disease severity.
Another key point is the result of the univariate and multivariate analysis. Interestingly,
when looking at the asthmatic cohort as a whole, (including those with no airflow
limitation), mean percentage wall area is a significant contributor to FEV1 % predicted,
whereas MLDE/I is the only contributing factor in asthmatics with airflow limitation.
This requires further investigation, however knowledge of interplay between airway
structure and lung function, such as this may have a significant impact on directing

201
future therapies such as bronchial thermoplasty, which currently focuses on severe
asthmatics, who will often have established fixed airflow obstruction.
However it was the assessment of QCT derived measures of emphysema and air
trapping where curious variation between asthma and COPD occurred. As expected,
COPD subjects had significantly worse measures of emphysema than healthy controls,
and asthmatics were no different to healthy controls, with the exception of the asthmatic
group who had severe airflow limitation. This latter group was in fact, statistically, no
different to COPD subjects and different to the other asthmatics as well the healthy
controls. Interestingly, the assessment of the structure of these low density areas
suggested that despite similar overall levels of low density, they were structurally
different between the asthmatics with severe airflow limitation and COPD subjects,
hinting at a different underlying cause. This is a novel QCT insight into the phenotypic
differences between asthma and COPD, and the ability of QCT to identify new aspects
of the remodelling process in both diseases. However it does need to be tested in large
numbers, and ideally would need pathological investigation and corroboration.
Nevertheless it does demonstrate how QCT can probe the lungs in vivo and provide
new insights and new routes for investigation.
In both COPD and asthma, the QCT measure of air trapping, MLDE/I, was shown to be
consistently different between the diseases, and when compared to healthy controls, and
very important contributor to FEV1 % predicted in both diseases. Therefore additional
investigation of this parameter and what it represents is of great interest. This study
suggests it is a major player in asthmatics with airflow limitation and raises the

202
question, would targeted local therapies and/or systemic therapies achieve better
control?
Other than investigating QCT parameters in relation to measures of obstructive airflow,
this study identified weak relationships in asthma between proximal airway
morphometry and blood neutrophilia, worse health status and poorer asthma control. In
COPD, MLDE/I was associated with poorer health status. However in both groups, these
relationships were weak and few, if any, conclusions should be drawn from them from
this study alone. However this does provide a prompt to use QCT to probe the structure
of the lungs of inflammatory subgroups e.g. neutrophilic asthmatics.
Key questions have been raised by this study, although a large cross section of subjects
with varying degrees of airflow obstruction has been studied, and the observations that
have been made comparing the groups across the spectrum of airflow limitation are
fascinating, this study cannot comment on the natural history of either disease as there
is no longitudinal element. Understanding the natural history of the disease and how it
appears on QCT is an area of great interest. Does QCT have the potential to improve
the selection of subjects for particular management routes? In particular treatments
focused on remodelling and structure, (as opposed to interventions that influence short
term inflammation), such as bronchial thermoplasty. This thesis has supplied the
evidence that suggests this is an area that shows great potential and deserves further
investigation.

203
Although this study has shown structural changes in the airways and lungs of asthma
and COPD sufferers, it has been unable to shed light on what these changes could be as
there has been no pathological/histological element to it. In COPD there is greater scope
for acquiring lung tissue for histological analysis, so headway is being made at looking
at QCT and pathological findings. However the same cannot be said for asthma and this
remains a key area to investigate.
QCT links with inflammation has been touched upon in this study, but was limited to
sputum and blood counts. Further detailed analysis of this area is needed in future work
with subjects undergoing much more detailed clinical work up of their inflammatory
profile.

204
4.3 Study 3.2: Associations in asthma between quantitative computed
tomography and bronchial biopsy-derived airway remodelling
This study begins to address some key questions that remained from study 3.1. It has
investigated the relationship of QCT to changes seen in bronchial biopsies of asthmatic
subjects. It has also begun to probe the significance of MLDE/I in asthma.
Here we see that QCT parameters of proximal airway morphometry are associated with
epithelial thickness and percentage airway smooth muscle,( with the latter influencing
airflow limitation), but not airway inflammation. Suggesting that what is seen on QCT
is due to disease led remodelling rather than acute inflammatory responses in the
airway, as was indicated by study 3.1.
MLDE/I was associated with vascularity and lung function. Increased vascularity in
asthmatics is well established, but this is the first time a link has been demonstrated
between air trapping and vascularity. Study 3.1 has shown that the measure of air
trapping, as seen with the parameter MLDE/I, plays an important role in airflow
limitation in asthmatics. When that observation is considered alongside the association
with increased vascularity in bronchial biopsies and MLDE/I seen in this study, but no
other histological features, (including inflammatory markers); it suggests that this
aspect of asthmatic airway pathology deserves thorough further investigation, focusing
on comparing vascularity and its effects in asthmatics with and without fixed airflow
obstruction. This again demonstrates how QCT is able to expand on, and provide novel
information to traditional methods of investigating remodelling in asthma.

205
The tissue samples in this study were taken from bronchial biopsies. So although there
is this intriguing association of vascularity with a QCT marker of air-trapping, and thus
we assume small airway disease, the small airways themselves were not sampled.
Further work to look at the histological make up of lung parenchyma in asthmatics and
compare it to QCT is key.
Another area for further study is looking at treatments that target vascularity and assess
their impact on air trapping and lung function. Corticosteroids could be a good initial
starting point as it is thought to decrease vascularity and are commonly used. However
any new drugs in development that are thought to impact vascularity would be wise to
consider assessing air trapping, as measured by MLDE/I.
206
4.4 Study 3.3: Randomised controlled trial of the prostaglandin D2
receptor 2 antagonist fevipiprant in persistent eosinophilic asthma
This study was based on a 12 week, randomized, double-blind, placebo-controlled,
parallel-group clinical trial of a new drug, fevipiprant. DP2 recruits and activates
eosinophils. It was therefore anticipated that fevipiprant would reduce sputum
eosinophilia and improve spirometry.
This trial found that fevipiprant did indeed significantly reduce sputum eosinophilia. It
also significantly improved FEV1, AQLQ(S) scores and FRC when compared to
subjects who had been taking the placebo. QCT measures showed that the expiratory
lung volume decreased significantly in those taking fevipiprant when compared to the
placebo group. Confirming the clinical finding of reduced FRC.
No other QCT parameters showed any significant change. Despite these apparently
negative results, this has still added valuable understanding to the interpretation of QCT
parameters in asthma.
Firstly, the main change seen in the biopsy results was epithelial integrity, and markers
of airway inflammation, which demonstrated no link with QCT parameters in Study
3.2. Of note,, study 3.1 showed that although QCT parameters were significant
contributors in the linear regression model for FEV1, they only accounted for about a
quarter of it in asthmatics. This, taken alongside the reduced sputum eosinophil count,
suggests the effect fevipiprant had on FEV1 worked via factors likely linked directly to
the inflammatory process in the airways. Studies 3.1 and 3.2 have already suggested

207
that short term change in inflammation is not what QCT is best able to measure, again
demonstrating the robustness of QCT as it has maintained the same story.
Secondly, this study was powered to assess sputum eosinophil changes. QCT was an
exploratory outcome, and it is likely the study was under powered for QCT. This too
may have contributed to lack of QCT changes. Nonetheless it is reassuring that despite
probably under powering QCT did not produce random anomalous results.
This drug is still in development and still requires larger and longer studies. This
current trial was not long enough to assess the impact of fevipiprant on exacerbation
rate. Further study of this drug would be an excellent opportunity to assess the effects of
intervention on lung structure both histologically and with QCT. This drug alters the
inflammatory state of the subject. Longer studies of this drug would also provide good
insight not long into longitudinal QCT, but also the effect of long term changes to an
asthmatic’s inflammatory profile, a question this thesis does not address.

208
4.5 Key questions and future directions
From the concluding discussion, the following questions have been posed:
1. Can QCT measure and quantify the natural history of obstructive airway
diseases?
Study 3.1 showed how those with obstructive airway disease have distinct features
depending on degree of airflow obstruction. However we cannot comment on disease
progression. Despite presence of clear subdivisions, there is still a great deal of
heterogeneity within both the asthmatic and COPD cohorts, once again highlighting the
complexity of obstructive airway diseases. We do not know if those who have mild-
moderate airflow obstruction go on to develop severe airflow limitation, or if the QCT
changes seen are permanent or variable. Although study 3.1 nicely demonstrated
different QCT features according to different levels of airflow obstruction, we cannot
assume a QCT finding leads to certain clinical picture; indeed it is not known if any
feature observed on QCT is a precursor to developing airflow obstruction. Longitudinal
studies are needed to begin to answer this question, as this thesis has not touched upon
this aspect.
This study also showed that once airflow limitation set in, percentage wall area no
longer had a significant role in FEV1 % predicted. Currently a new therapy, bronchial
thermoplasty is being trialled to assess its impact on asthmatics, however it is only
being used in those with severe uncontrolled asthma. If QCT could help assess and
predict the natural history of asthma, it could have a dramatic impact in the choice of
subjects for novel therapies, such as bronchial thermoplasty and systemic therapies.

209
2. Does QCT have any role in assessing airway inflammation in obstructive airway
diseases?
Study 3.1 and 3.2 touched on the associations between inflammation and QCT. A weak
correlation was found in asthmatics between QCT morphometry and blood neutrophilia.
However in study 3.1, the inflammatory profile of the subjects was not the focus of the
study, therefore the correlations cannot be interpreted to any great level, but their
presence can be noted and their meaning considered. Interestingly, no correlations were
seen with the inflammatory markers and QCT parameters in COPD. Inflammation in
both asthmatics and COPD sufferers is notoriously volatile, therefore it should be
stressed that a single cross sectional sample may not adequately reflect the normal state
of that person’s airways.
Considering the results this thesis, it would seem unlikely that the QCT parameters
examined in this thesis would have a major role in all subtypes of inflammation, or have
a role in identifying short term inflammatory changes. However it is very possible that
QCT could have a role in helping phenotype sub groups, e.g. neutrophilic asthmatics, or
have a role in identifying changes seen after long term intervention that has been
targeted at a particular inflammatory profile. These scenarios have not been addressed
in this thesis.
Another area to consider are QCT parameters that are currently under development and
are beginning to filter into use, such as bronchial wall attenuation. By assessing the
bronchial wall attenuation, this parameter would be more likely to reflect changes at a
cellular level, than simply assessing wall area. However this feature was unavailable on
210
the Apollo® (by VIDA Diagnostics, Inc), platform at the time the scans were analysed
for this thesis.
3. How do the images and measurements seen on QCT represent changes in
histology?
There is definitely a lot more work to be done with comparing QCT and histology in
asthma. Study 3.2 was one of the biggest and most comprehensive study to date looking
at this in asthma. It certainly cannot be considered a comprehensive investigation of the
relationship of QCT and histology in asthma, but it very clearly demonstrates that QCT
does reflect histological changes. This study suggests further and more thorough
investigation of QCT and histology would yield exciting and more novel insights into
the remodelling process in asthma.
However there were limitations and areas where it could be improved. For example
there was no standardisation of site of biopsy sample. An obvious, easy, improvement
to this study would be to collect biopsies from standard locations, and compare these
directly to the relevant airway on QCT, (although this would still not be a direct
comparison as biopsies are taken from the carina whereas QCT assesses the middle
40% of the airway). However better localisation would also allow comparison with the
relevant lobe densitometry. Another factor to consider is that this study only collected
proximal airway tissue samples. Transbronchial biopsies would allow the distal airways
to be studied directly. However they do carry a much higher risk of complications such
as bleeding and pneumothorax.
Another area of interest, which has not been addressed in this thesis, but is very relevant
to the assessment of the relationship between QCT and histology, is micro CT.

211
Micro CT however, needs much larger tissue samples than biopsies and is only ex vivo,
any study looking at this is likely to be much smaller and more complex. On the other
hand radiation exposure of the tissue samples would not be of any concern.
Currently the interpretation of low density areas on QCT are based on work done with
COPD histology. Using these parameters in asthma enables us to compare both asthma
and COPD, which is very valuable, but leaves us unsure of exactly how interpret
unexpected findings such as the presence of “emphysema” in asthmatics. The QCT
parameter of LAC-D-950, suggested that this low density area in asthmatics is
structurally more like low density areas seen in healthy subjects rather than COPD
subjects. But without histological assessment these remain educated assumptions and
best guesses.
Studies looking at ex vivo lungs/lung tissue in asthma and comparing histological
findings to QCT and micro CT findings would be of great interest, and would provide
huge insight into this area.
However it is a testament to the work already done in managing and treating asthma
that such samples are very hard to come by.

212
4.6 Limitations
Some limitations of this thesis have been addressed whilst looking at the key questions
and future directions, by considering how the studies could be improved, what
questions have arisen that have not been answered. However there are further, more
general limitations that should be acknowledged.
In this thesis, I have only used one QCT analysis platform. On the one hand this fact
provides continuity and comparability throughout, and is an important and necessary
feature to ensure coherency of this thesis.
However, this also means any systematic errors the platform may have remain
unidentified and uncorrected. In study 3.1, where cross sectional comparisons are made
across clinically defined groups, this is less of an issue as computational errors are
generally standard. If for example, Apollo® (by VIDA Diagnostics, Inc), over estimates
wall area, all groups would have had wall area overestimated.
This limitation needs to be considered mainly in regards to study 3.2 where QCT was
directly compared to histological features. If there were any systematic errors, would
this have changed findings? As the association between vascularity and air trapping was
a novel finding, this was assessed by a test group, who were able to repeat the findings.
The test group used PulmoWorkstation (by VIDA Diagnostics, Inc), the predecessor to
Apollo® (by VIDA Diagnostics, Inc). Although technically a different platform, similar
algorithms would have been used by both. Therefore the possibility of undetected
technical errors still remains possible, and this limitation should be taken into account

213
Another limitation to consider is user error in analysing and labelling the airways.
Airway and lung segmentation are automatic with Apollo® (by VIDA Diagnostics,
Inc). However in very diseased airways, where lumens are narrowed, and mucus plugs
are present, segmentation becomes difficult, judgement is required when deciding when
to pursue the analysis of an airway and when to stop. Another area where user
judgement was required was where anatomy was not standard. This was rarely a
problem with upper lobes, but lower lobes would often have slight variations.
Throughout this thesis, I analysed all the scans, with the exception of a small selection
which was only used for inter user comparisons, not for any of the study results. I
ensured that I followed the same steps and tried to apply the same rules to branch
labelling for all scans. However there will be a degree of error introduced due to all
these factors. To a certain degree, these errors are unavoidable and are present in all
research based on biological systems as there will always be natural variation.
Nonetheless it should be acknowledged and its impact considered.
This thesis has looked at different aspects of using QCT to provide insight into the
heterogeneity of obstructive airway diseases. However, in order to do this, different
studies, with different study protocols have been used. For example, the very process of
comparing COPD and asthma produces some important distinctions between the groups
simply due to the way the diseases are defined and diagnosed. For example, in this
thesis, all COPD subjects were smokers, whereas most asthmatics were not. There was
also a significant difference in age, however this issue was addressed in study 3.1 and
was not found to have a statistically significant influence. Using subjects with clear
clinical diagnoses is on the one hand necessary; however it may also introduce subtle

214
bias and confounding factors despite careful attempts to assess such factors and correct
for them where necessary.

215
4.7 Concluding remarks
QCT in its current form cannot replace traditional methods of investigating remodelling
in asthma and COPD. However they complement each other. Histological investigation
addresses what is happening on a cellular level, and is often limited to smaller study
numbers. QCT on the other hand addresses what is happening on the organ level and
can used in very large numbers to observe patterns in large and varied populations,
bringing with it new and insightful observations that would otherwise have been
missed. Questions that have arisen from this thesis have the ability to direct further
research. Again these would have been missed if traditional methods alone were
employed.
This thesis has looked at the use of QCT in comparing and interrogating the lungs of
those with obstructive airway diseases as well as healthy controls and has demonstrated
the robustness of QCT measures when examined alongside histology and when used in
intervention. This thesis has demonstrated that QCT is able to provide valuable insight
into the phenotypic heterogeneity of asthma and COPD.

216
5 REFERENCES
(1) Sakula A. Henry Hyde Salter (1823-71): a biographical sketch. Thorax 1985
Dec;40(12):887-888.
(2) Holgate ST. A brief history of asthma and its mechanisms to modern concepts of
disease pathogenesis. Allergy Asthma Immunol Res 2010 Jul;2(3):165-171.
(3) Global Strategy for Asthma Management and Prevention, Global Initiative for
Asthma (GINA). 2006; Available at:
http://www.who.int/respiratory/asthma/GINA_WR_2006_copyright%5B1%5D.pdf,
2016.
(4) Masoli M, Fabian D, Holt S, Beasley R, Global Initiative for Asthma (GINA)
Program. The global burden of asthma: executive summary of the GINA Dissemination
Committee report. Allergy 2004 May;59(5):469-478.
(5) Royal College of Physicians. Why Asthma Still Kills. 2014; Available at:
https://www.rcplondon.ac.uk/projects/outputs/why-asthma-still-kills, 2015.
(6) Bousquet J, Mantzouranis E, Cruz AA, Ait-Khaled N, Baena-Cagnani CE, Bleecker
ER, et al. Uniform definition of asthma severity, control, and exacerbations: document
presented for the World Health Organization Consultation on Severe Asthma. J Allergy
Clin Immunol 2010 Nov;126(5):926-938.

217
(7) Chung KF, Wenzel SE, Brozek JL, Bush A, Castro M, Sterk PJ, et al. International
ERS/ATS guidelines on definition, evaluation and treatment of severe asthma. Eur
Respir J 2014 Feb;43(2):343-373.
(8) Denham S, Koppelman GH, Blakey J, Wjst M, Ferreira MA, Hall IP, et al. Meta-
analysis of genome-wide linkage studies of asthma and related traits. Respir Res 2008
Apr 28;9:38-9921-9-38.
(9) Moffatt MF, Gut IG, Demenais F, Strachan DP, Bouzigon E, Heath S, et al. A large-
scale, consortium-based genomewide association study of asthma. N Engl J Med 2010
Sep 23;363(13):1211-1221.
(10) Soler Artigas M, Loth DW, Wain LV, Gharib SA, Obeidat M, Tang W, et al.
Genome-wide association and large-scale follow up identifies 16 new loci influencing
lung function. Nat Genet 2011 Sep 25;43(11):1082-1090.
(11) Wenzel SE, Balzar S, Ampleford E, Hawkins GA, Busse WW, Calhoun WJ, et al.
IL4R alpha mutations are associated with asthma exacerbations and mast cell/IgE
expression. Am J Respir Crit Care Med 2007 Mar 15;175(6):570-576.
(12) Brightling CE, Gupta S, Hollins F, Sutcliffe A, Amrani Y. Immunopathogenesis of
severe asthma. Curr Pharm Des 2011;17(7):667-673.
(13) Doe C, Bafadhel M, Siddiqui S, Desai D, Mistry V, Rugman P, et al. Expression of
the T helper 17-associated cytokines IL-17A and IL-17F in asthma and COPD. Chest
2010 Nov;138(5):1140-1147.
(14) Hilty M, Burke C, Pedro H, Cardenas P, Bush A, Bossley C, et al. Disordered
microbial communities in asthmatic airways. PLoS One 2010 Jan 5;5(1):e8578.

218
(15) Fairs A, Agbetile J, Hargadon B, Bourne M, Monteiro WR, Brightling CE, et al.
IgE sensitization to Aspergillus fumigatus is associated with reduced lung function in
asthma. Am J Respir Crit Care Med 2010 Dec 1;182(11):1362-1368.
(16) Thomas B, Rutman A, Hirst RA, Haldar P, Wardlaw AJ, Bankart J, et al. Ciliary
dysfunction and ultrastructural abnormalities are features of severe asthma. J Allergy
Clin Immunol 2010 Oct;126(4):722-729.e2.
(17) Eickelberg O, Kohler E, Reichenberger F, Bertschin S, Woodtli T, Erne P, et al.
Extracellular matrix deposition by primary human lung fibroblasts in response to TGF-
beta1 and TGF-beta3. Am J Physiol 1999 May;276(5 Pt 1):L814-24.
(18) Saunders R, Siddiqui S, Kaur D, Doe C, Sutcliffe A, Hollins F, et al. Fibrocyte
localization to the airway smooth muscle is a feature of asthma. J Allergy Clin Immunol
2009 Feb;123(2):376-384.
(19) Brightling CE, Bradding P, Symon FA, Holgate ST, Wardlaw AJ, Pavord ID.
Mast-cell infiltration of airway smooth muscle in asthma. N Engl J Med 2002 May
30;346(22):1699-1705.
(20) Siddiqui S, Mistry V, Doe C, Roach K, Morgan A, Wardlaw A, et al. Airway
hyperresponsiveness is dissociated from airway wall structural remodeling. J Allergy
Clin Immunol 2008 Aug;122(2):335-41, 341.e1-3.
(21) Carroll NG, Mutavdzic S, James AL. Increased mast cells and neutrophils in
submucosal mucous glands and mucus plugging in patients with asthma. Thorax 2002
Aug;57(8):677-682.

219
(22) Contoli M, Message SD, Laza-Stanca V, Edwards MR, Wark PA, Bartlett NW, et
al. Role of deficient type III interferon-lambda production in asthma exacerbations. Nat
Med 2006 Sep;12(9):1023-1026.
(23) Kraft M. The distal airways: are they important in asthma? Eur Respir J 1999
Dec;14(6):1403-1417.
(24) Gupta S, Hartley R, Khan UT, Singapuri A, Hargadon B, Monteiro W, et al.
Quantitative computed tomography-derived clusters: redefining airway remodeling in
asthmatic patients. J Allergy Clin Immunol 2014 Mar;133(3):729-38.e18.
(25) Aysola RS, Hoffman EA, Gierada D, Wenzel S, Cook-Granroth J, Tarsi J, et al.
Airway remodeling measured by multidetector CT is increased in severe asthma and
correlates with pathology. Chest 2008 Dec;134(6):1183-1191.
(26) Green RH, Brightling CE, Woltmann G, Parker D, Wardlaw AJ, Pavord ID.
Analysis of induced sputum in adults with asthma: identification of subgroup with
isolated sputum neutrophilia and poor response to inhaled corticosteroids. Thorax 2002
Oct;57(10):875-879.
(27) Petsky HL, Cates CJ, Lasserson TJ, Li AM, Turner C, Kynaston JA, et al. A
systematic review and meta-analysis: tailoring asthma treatment on eosinophilic
markers (exhaled nitric oxide or sputum eosinophils). Thorax 2012 Mar;67(3):199-208.
(28) Hallstrand TS, Henderson WR,Jr. Role of leukotrienes in exercise-induced
bronchoconstriction. Curr Allergy Asthma Rep 2009 Jan;9(1):18-25.

220
(29) Rodrigo GJ, Neffen H, Castro-Rodriguez JA. Efficacy and safety of subcutaneous
omalizumab vs placebo as add-on therapy to corticosteroids for children and adults with
asthma: a systematic review. Chest 2011 Jan;139(1):28-35.
(30) Mutalithas K, Guillen C, Day C, Brightling CE, Pavord ID, Wardlaw AJ. CRTH2
expression on T cells in asthma. Clin Exp Immunol 2010 Jul 1;161(1):34-40.
(31) Fulkerson PC, Rothenberg ME. Targeting eosinophils in allergy, inflammation and
beyond. Nat Rev Drug Discov 2013 Feb;12(2):117-129.
(32) Stinson SE, Amrani Y, Brightling CE. D prostanoid receptor 2 (chemoattractant
receptor-homologous molecule expressed on TH2 cells) protein expression in asthmatic
patients and its effects on bronchial epithelial cells. J Allergy Clin Immunol 2015
Feb;135(2):395-406.
(33) Davies DE. The role of the epithelium in airway remodeling in asthma. Proc Am
Thorac Soc 2009 Dec;6(8):678-682.
(34) Haldar P, Brightling CE, Hargadon B, Gupta S, Monteiro W, Sousa A, et al.
Mepolizumab and exacerbations of refractory eosinophilic asthma. N Engl J Med 2009
Mar 5;360(10):973-984.
(35) Nair P, Pizzichini MM, Kjarsgaard M, Inman MD, Efthimiadis A, Pizzichini E, et
al. Mepolizumab for prednisone-dependent asthma with sputum eosinophilia. N Engl J
Med 2009 Mar 5;360(10):985-993.
(36) Castro M, Zangrilli J, Wechsler ME, Bateman ED, Brusselle GG, Bardin P, et al.
Reslizumab for inadequately controlled asthma with elevated blood eosinophil counts:

221
results from two multicentre, parallel, double-blind, randomised, placebo-controlled,
phase 3 trials. Lancet Respir Med 2015 May;3(5):355-366.
(37) Laviolette M, Gossage DL, Gauvreau G, Leigh R, Olivenstein R, Katial R, et al.
Effects of benralizumab on airway eosinophils in asthmatic patients with sputum
eosinophilia. J Allergy Clin Immunol 2013 Nov;132(5):1086-1096.e5.
(38) Castro M, Wenzel SE, Bleecker ER, Pizzichini E, Kuna P, Busse WW, et al.
Benralizumab, an anti-interleukin 5 receptor alpha monoclonal antibody, versus placebo
for uncontrolled eosinophilic asthma: a phase 2b randomised dose-ranging study.
Lancet Respir Med 2014 Nov;2(11):879-890.
(39) Nowak RM, Parker JM, Silverman RA, Rowe BH, Smithline H, Khan F, et al. A
randomized trial of benralizumab, an antiinterleukin 5 receptor alpha monoclonal
antibody, after acute asthma. Am J Emerg Med 2015 Jan;33(1):14-20.
(40) Registry of clinical trials. Available at: https://clinicaltrials.gov/, 2016.
(41) Antohe I, Croitoru R, Antoniu S. Tralokinumab for uncontrolled asthma. Expert
Opin Biol Ther 2013 Feb;13(2):323-326.
(42) Brightling CE, She D, Ranade K, Piper E. Efficacy And Safety Of Tralokinumab,
An Anti-IL-13 Monoclonal Antibody, In A Phase 2b Study Of Uncontrolled Severe
Asthma. ATS 2014 2014;Poster Board # 406(Publication Number: A6670).
(43) Corren J, Lemanske RF, Hanania NA, Korenblat PE, Parsey MV, Arron JR, et al.
Lebrikizumab treatment in adults with asthma. N Engl J Med 2011 Sep
22;365(12):1088-1098.

222
(44) Wenzel S, Ford L, Pearlman D, Spector S, Sher L, Skobieranda F, et al. Dupilumab
in persistent asthma with elevated eosinophil levels. N Engl J Med 2013 Jun
27;368(26):2455-2466.
(45) Hall IP, Blakey JD, Al Balushi KA, Wheatley A, Sayers I, Pembrey ME, et al.
Beta2-adrenoceptor polymorphisms and asthma from childhood to middle age in the
British 1958 birth cohort: a genetic association study. Lancet 2006 Aug
26;368(9537):771-779.
(46) Rabe KF, Magnussen H, Dent G. Theophylline and selective PDE inhibitors as
bronchodilators and smooth muscle relaxants. Eur Respir J 1995 Apr;8(4):637-642.
(47) Barnes PJ. Histone deacetylase-2 and airway disease. Ther Adv Respir Dis 2009
Oct;3(5):235-243.
(48) Peters SP, Kunselman SJ, Icitovic N, Moore WC, Pascual R, Ameredes BT, et al.
Tiotropium bromide step-up therapy for adults with uncontrolled asthma. N Engl J Med
2010 Oct 28;363(18):1715-1726.
(49) Iwamoto H, Yokoyama A, Shiota N, Shoda H, Haruta Y, Hattori N, et al.
Tiotropium bromide is effective for severe asthma with noneosinophilic phenotype. Eur
Respir J 2008 Jun;31(6):1379-1380.
(50) Anderson DE, Kew KM, Boyter AC. Long-acting muscarinic antagonists (LAMA)
added to inhaled corticosteroids (ICS) versus the same dose of ICS alone for adults with
asthma. Cochrane Database Syst Rev 2015 Aug 24;8:CD011397.

223
(51) Grainge CL, Lau LC, Ward JA, Dulay V, Lahiff G, Wilson S, et al. Effect of
bronchoconstriction on airway remodeling in asthma. N Engl J Med 2011 May
26;364(21):2006-2015.
(52) Thomas M, McKinley RK, Mellor S, Watkin G, Holloway E, Scullion J, et al.
Breathing exercises for asthma: a randomised controlled trial. Thorax 2009
Jan;64(1):55-61.
(53) Danek CJ, Lombard CM, Dungworth DL, Cox PG, Miller JD, Biggs MJ, et al.
Reduction in airway hyperresponsiveness to methacholine by the application of RF
energy in dogs. J Appl Physiol (1985) 2004 Nov;97(5):1946-1953.
(54) Miller JD, Cox G, Vincic L, Lombard CM, Loomas BE, Danek CJ. A prospective
feasibility study of bronchial thermoplasty in the human airway. Chest 2005
Jun;127(6):1999-2006.
(55) Cox G, Thomson NC, Rubin AS, Niven RM, Corris PA, Siersted HC, et al.
Asthma control during the year after bronchial thermoplasty. N Engl J Med 2007 Mar
29;356(13):1327-1337.
(56) Pavord ID, Cox G, Thomson NC, Rubin AS, Corris PA, Niven RM, et al. Safety
and efficacy of bronchial thermoplasty in symptomatic, severe asthma. Am J Respir
Crit Care Med 2007 Dec 15;176(12):1185-1191.
(57) Castro M, Rubin AS, Laviolette M, Fiterman J, De Andrade Lima M, Shah PL, et
al. Effectiveness and safety of bronchial thermoplasty in the treatment of severe asthma:
a multicenter, randomized, double-blind, sham-controlled clinical trial. Am J Respir
Crit Care Med 2010 Jan 15;181(2):116-124.
224
(58) Petty TL. The history of COPD. Int J Chron Obstruct Pulmon Dis 2006;1(1):3-14.
(59) Global Initiative for Chronic Obstructive Lung Disease (2011) Global Strategy for
the Diagnosis, Management and Prevention of COPD, Global Initiative for Chronic
Obstructive Lung Disease (World Health Organization, Geneva/National Heart, Lung,
and Blood Institute, Bethesda). Available at:
http://www.who.int/respiratory/copd/GOLD_WR_06.pdf, 2016.
(60) World Health Organization (2008) The Global Burden of Disease: 2004
update (World Health Organization,Geneva). 2008; Available at:
http://www.who.int/healthinfo/global_burden_disease/GBD_report_2004update_full.pd
f, 2013.
(61) British Thoracic Society (2006) The Burden of Lung Disease: a Statistical Report
from the British Thoracic Society (the British Thoracic Society, London). Available at:
https://www.brit-thoracic.org.uk/delivery-of-respiratory-care/burden-of-lung-disease/,
2016.
(62) Santos S, Marin A, Serra-Batlles J, de la Rosa D, Solanes I, Pomares X, et al.
Treatment of patients with COPD and recurrent exacerbations: the role of infection and
inflammation. Int J Chron Obstruct Pulmon Dis 2016 Mar 11;11:515-525.
(63) Donaldson GC, Law M, Kowlessar B, Singh R, Brill SE, Allinson JP, et al. Impact
of Prolonged Exacerbation Recovery in Chronic Obstructive Pulmonary Disease. Am J
Respir Crit Care Med 2015 Oct 15;192(8):943-950.

225
(64) Hurst JR, Vestbo J, Anzueto A, Locantore N, Mullerova H, Tal-Singer R, et al.
Susceptibility to exacerbation in chronic obstructive pulmonary disease. N Engl J Med
2010 Sep 16;363(12):1128-1138.
(65) Patel BD, Coxson HO, Pillai SG, Agusti AG, Calverley PM, Donner CF, et al.
Airway wall thickening and emphysema show independent familial aggregation in
chronic obstructive pulmonary disease. Am J Respir Crit Care Med 2008 Sep
1;178(5):500-505.
(66) Lapperre TS, Willems LN, Timens W, Rabe KF, Hiemstra PS, Postma DS, et al.
Small airways dysfunction and neutrophilic inflammation in bronchial biopsies and
BAL in COPD. Chest 2007 Jan;131(1):53-59.
(67) Thurlbeck WM, Muller NL. Emphysema: definition, imaging, and quantification.
AJR Am J Roentgenol 1994 Nov;163(5):1017-1025.
(68) Brusselle GG, Joos GF, Bracke KR. New insights into the immunology of chronic
obstructive pulmonary disease. Lancet 2011 Sep 10;378(9795):1015-1026.
(69) Barnes PJ. Small airways in COPD. N Engl J Med 2004 Jun 24;350(26):2635-
2637.
(70) Wise RA. The value of forced expiratory volume in 1 second decline in the
assessment of chronic obstructive pulmonary disease progression. Am J Med 2006
Oct;119(10 Suppl 1):4-11.
(71) Lee SH, Goswami S, Grudo A, Song LZ, Bandi V, Goodnight-White S, et al.
Antielastin autoimmunity in tobacco smoking-induced emphysema. Nat Med 2007
May;13(5):567-569.

226
(72) Saetta M, Turato G, Baraldo S, Zanin A, Braccioni F, Mapp CE, et al. Goblet cell
hyperplasia and epithelial inflammation in peripheral airways of smokers with both
symptoms of chronic bronchitis and chronic airflow limitation. Am J Respir Crit Care
Med 2000 Mar;161(3 Pt 1):1016-1021.
(73) Niewoehner DE, Kleinerman J, Rice DB. Pathologic changes in the peripheral
airways of young cigarette smokers. N Engl J Med 1974 Oct 10;291(15):755-758.
(74) Matsuba K, Thurlbeck WM. The number and dimensions of small airways in
emphysematous lungs. Am J Pathol 1972 May;67(2):265-275.
(75) Cosio M, Ghezzo H, Hogg JC, Corbin R, Loveland M, Dosman J, et al. The
relations between structural changes in small airways and pulmonary-function tests. N
Engl J Med 1978 Jun 8;298(23):1277-1281.
(76) Retamales I, Elliott WM, Meshi B, Coxson HO, Pare PD, Sciurba FC, et al.
Amplification of inflammation in emphysema and its association with latent adenoviral
infection. Am J Respir Crit Care Med 2001 Aug 1;164(3):469-473.
(77) Maestrelli P, Saetta M, Di Stefano A, Calcagni PG, Turato G, Ruggieri MP, et al.
Comparison of leukocyte counts in sputum, bronchial biopsies, and bronchoalveolar
lavage. Am J Respir Crit Care Med 1995 Dec;152(6 Pt 1):1926-1931.
(78) Thompson AB, Daughton D, Robbins RA, Ghafouri MA, Oehlerking M, Rennard
SI. Intraluminal airway inflammation in chronic bronchitis. Characterization and
correlation with clinical parameters. Am Rev Respir Dis 1989 Dec;140(6):1527-1537.

227
(79) Hunninghake GW, Crystal RG. Cigarette smoking and lung destruction.
Accumulation of neutrophils in the lungs of cigarette smokers. Am Rev Respir Dis
1983 Nov;128(5):833-838.
(80) Baraldo S, Saetta M. To reg or not to reg: that is the question in COPD. Eur Respir
J 2008 Mar;31(3):486-488.
(81) Cosio MG, Saetta M, Agusti A. Immunologic aspects of chronic obstructive
pulmonary disease. N Engl J Med 2009 Jun 4;360(23):2445-2454.
(82) Simani AS, Inoue S, Hogg JC. Penetration of the respiratory epithelium of guinea
pigs following exposure to cigarette smoke. Lab Invest 1974 Jul;31(1):75-81.
(83) Hulbert WC, Walker DC, Jackson A, Hogg JC. Airway permeability to horseradish
peroxidase in guinea pigs: the repair phase after injury by cigarette smoke. Am Rev
Respir Dis 1981 Mar;123(3):320-326.
(84) Jones JG, Minty BD, Lawler P, Hulands G, Crawley JC, Veall N. Increased
alveolar epithelial permeability in cigarette smokers. Lancet 1980 Jan 12;1(8159):66-
68.
(85) Sethi S, Murphy TF. Bacterial infection in chronic obstructive pulmonary disease
in 2000: a state-of-the-art review. Clin Microbiol Rev 2001 Apr;14(2):336-363.
(86) Hassett DJ, Borchers MT, Panos RJ. Chronic obstructive pulmonary disease
(COPD): Evaluation from clinical, immunological and bacterial pathogenesis
perspectives. J Microbiol 2014 Mar;52(3):211-226.

228
(87) Borchers MT, Wesselkamper SC, Curull V, Ramirez-Sarmiento A, Sanchez-Font
A, Garcia-Aymerich J, et al. Sustained CTL activation by murine pulmonary epithelial
cells promotes the development of COPD-like disease. J Clin Invest 2009
Mar;119(3):636-649.
(88) Bourdin A, Burgel PR, Chanez P, Garcia G, Perez T, Roche N. Recent advances in
COPD: pathophysiology, respiratory physiology and clinical aspects, including
comorbidities. Eur Respir Rev 2009 Dec;18(114):198-212.
(89) Chung KF, Adcock IM. Multifaceted mechanisms in COPD: inflammation,
immunity, and tissue repair and destruction. Eur Respir J 2008 Jun;31(6):1334-1356.
(90) Rovina N, Koutsoukou A, Koulouris NG. Inflammation and immune response in
COPD: where do we stand? Mediators Inflamm 2013;2013:413735.
(91) Saetta M, Di Stefano A, Maestrelli P, Turato G, Mapp CE, Pieno M, et al. Airway
eosinophilia and expression of interleukin-5 protein in asthma and in exacerbations of
chronic bronchitis. Clin Exp Allergy 1996 Jul;26(7):766-774.
(92) Rosell A, Monso E, Soler N, Torres F, Angrill J, Riise G, et al. Microbiologic
determinants of exacerbation in chronic obstructive pulmonary disease. Arch Intern
Med 2005 Apr 25;165(8):891-897.
(93) Bafadhel M, Haldar K, Barker B, Patel H, Mistry V, Barer MR, et al. Airway
bacteria measured by quantitative polymerase chain reaction and culture in patients
with stable COPD: relationship with neutrophilic airway inflammation, exacerbation
frequency, and lung function. Int J Chron Obstruct Pulmon Dis 2015 Jun 9;10:1075-
1083.

229
(94) Mallia P, Message SD, Gielen V, Contoli M, Gray K, Kebadze T, et al.
Experimental rhinovirus infection as a human model of chronic obstructive pulmonary
disease exacerbation. Am J Respir Crit Care Med 2011 Mar 15;183(6):734-742.
(95) Gunawardana N, Finney L, Johnston SL, Mallia P. Experimental rhinovirus
infection in COPD: implications for antiviral therapies. Antiviral Res 2014 Feb;102:95-
105.
(96) Bafadhel M, Umar I, Gupta S, Raj JV, Vara DD, Entwisle JJ, et al. The role of CT
scanning in multidimensional phenotyping of COPD. Chest 2011 Sep;140(3):634-642.
(97) Hogg JC. Pathophysiology of airflow limitation in chronic obstructive pulmonary
disease. Lancet 2004 Aug 21-27;364(9435):709-721.
(98) Parr DG, Stoel BC, Stolk J, Stockley RA. Pattern of emphysema distribution in
alpha1-antitrypsin deficiency influences lung function impairment. Am J Respir Crit
Care Med 2004 Dec 1;170(11):1172-1178.
(99) Cerveri I, Dore R, Corsico A, Zoia MC, Pellegrino R, Brusasco V, et al.
Assessment of emphysema in COPD: a functional and radiologic study. Chest 2004
May;125(5):1714-1718.
(100) Nakano Y, Muro S, Sakai H, Hirai T, Chin K, Tsukino M, et al. Computed
tomographic measurements of airway dimensions and emphysema in smokers.
Correlation with lung function. Am J Respir Crit Care Med 2000 Sep;162(3 Pt 1):1102-
1108.

230
(101) Timmins SC, Diba C, Farrow CE, Schoeffel RE, Berend N, Salome CM, et al.
The relationship between airflow obstruction, emphysema extent, and small airways
function in COPD. Chest 2012 Aug;142(2):312-319.
(102) Han MK, Kazerooni EA, Lynch DA, Liu LX, Murray S, Curtis JL, et al. Chronic
obstructive pulmonary disease exacerbations in the COPDGene study: associated
radiologic phenotypes. Radiology 2011 Oct;261(1):274-282.
(103) Martinez CH, Chen YH, Westgate PM, Liu LX, Murray S, Curtis JL, et al.
Relationship between quantitative CT metrics and health status and BODE in chronic
obstructive pulmonary disease. Thorax 2012 May;67(5):399-406.
(104) Barker BL, Brightling CE. Phenotyping the heterogeneity of chronic obstructive
pulmonary disease. Clin Sci (Lond) 2013 Mar;124(6):371-387.
(105) Milne S, King GG. Advanced imaging in COPD: insights into pulmonary
pathophysiology. J Thorac Dis 2014 Nov;6(11):1570-1585.
(106) Orlandi I, Moroni C, Camiciottoli G, Bartolucci M, Pistolesi M, Villari N, et al.
Chronic obstructive pulmonary disease: thin-section CT measurement of airway wall
thickness and lung attenuation. Radiology 2005 Feb;234(2):604-610.
(107) Mair G, Maclay J, Miller JJ, McAllister D, Connell M, Murchison JT, et al.
Airway dimensions in COPD: relationships with clinical variables. Respir Med 2010
Nov;104(11):1683-1690.
(108) Hogg JC, Macklem PT, Thurlbeck WM. Site and nature of airway obstruction in
chronic obstructive lung disease. N Engl J Med 1968 Jun 20;278(25):1355-1360.

231
(109) McDonough JE, Yuan R, Suzuki M, Seyednejad N, Elliott WM, Sanchez PG, et
al. Small-airway obstruction and emphysema in chronic obstructive pulmonary disease.
N Engl J Med 2011 Oct 27;365(17):1567-1575.
(110) Hogg JC. A brief review of chronic obstructive pulmonary disease. Can Respir J
2012 Nov-Dec;19(6):381-384.
(111) Senhorini A, Ferreira DS, Shiang C, Silva LF, Dolhnikoff M, Gelb AF, et al.
Airway Dimensions in Fatal Asthma and Fatal COPD: Overlap in Older Patients.
COPD 2013 Mar 28.
(112) Kraft M. Asthma and chronic obstructive pulmonary disease exhibit common
origins in any country! Am J Respir Crit Care Med 2006 Aug 1;174(3):238-40;
discussion 243-4.
(113) Barnes PJ. Against the Dutch hypothesis: asthma and chronic obstructive
pulmonary disease are distinct diseases. Am J Respir Crit Care Med 2006 Aug
1;174(3):240-3; discussion 243-4.
(114) Zeki AA, Schivo M, Chan A, Albertson TE, Louie S. The Asthma-COPD
Overlap Syndrome: A Common Clinical Problem in the Elderly. J Allergy (Cairo)
2011;2011:861926.
(115) Dournes G, Laurent F. Airway Remodelling in Asthma and COPD: Findings,
Similarities, and Differences Using Quantitative CT. Pulm Med 2012;2012:670414.
(116) Postma DS, Reddel HK, Ten Hacken NH, van den Berge M. Asthma and Chronic
Obstructive Pulmonary Disease: Similarities and Differences. Clin Chest Med 2014
Mar;35(1):143-156.

232
(117) Murtagh E, Heaney L, Gingles J, Shepherd R, Kee F, Patterson C, et al.
Prevalence of obstructive lung disease in a general population sample: the NICECOPD
study. Eur J Epidemiol 2005;20(5):443-453.
(118) National Clinical Guideline Centre (UK). 2010 Jun.
(119) Gibson PG, Simpson JL. The overlap syndrome of asthma and COPD: what are
its features and how important is it? Thorax 2009 Aug;64(8):728-735.
(120) Pauwels RA, Rabe KF. Burden and clinical features of chronic obstructive
pulmonary disease (COPD). Lancet 2004 Aug 14-20;364(9434):613-620.
(121) Diaz-Guzman E, Mannino DM. Airway obstructive diseases in older adults: from
detection to treatment. J Allergy Clin Immunol 2010 Oct;126(4):702-709.
(122) Vonk JM, Jongepier H, Panhuysen CI, Schouten JP, Bleecker ER, Postma DS.
Risk factors associated with the presence of irreversible airflow limitation and reduced
transfer coefficient in patients with asthma after 26 years of follow up. Thorax 2003
Apr;58(4):322-327.
(123) Vestbo J, Edwards LD, Scanlon PD, Yates JC, Agusti A, Bakke P, et al. Changes
in forced expiratory volume in 1 second over time in COPD. N Engl J Med 2011 Sep
29;365(13):1184-1192.
(124) Lange P, Parner J, Vestbo J, Schnohr P, Jensen G. A 15-year follow-up study of
ventilatory function in adults with asthma. N Engl J Med 1998 Oct 22;339(17):1194-
1200.

233
(125) COPDGene CT Workshop Group, Barr RG, Berkowitz EA, Bigazzi F, Bode F,
Bon J, et al. A combined pulmonary-radiology workshop for visual evaluation of
COPD: study design, chest CT findings and concordance with quantitative evaluation.
COPD 2012 Apr;9(2):151-159.
(126) Riesz PB. The life of Wilhelm Conrad Roentgen. AJR Am J Roentgenol 1995
Dec;165(6):1533-1537.
(127) UNDERWOOD EA. Wilhelm Conrad Rontgen (1845-1923) and the early
development of radiology. Can Med Assoc J 1946 Jan;54:61-67.
(128) Ledley RS, Di Chiro G, Luessenhop AJ, Twigg HL. Computerized transaxial x-
ray tomography of the human body. Science 1974 Oct 18;186(4160):207-212.
(129) Beckmann EC. CT scanning the early days. Br J Radiol 2006 Jan;79(937):5-8.
(130) Bergin C, Muller N, Nichols DM, Lillington G, Hogg JC, Mullen B, et al. The
diagnosis of emphysema. A computed tomographic-pathologic correlation. Am Rev
Respir Dis 1986 Apr;133(4):541-546.
(131) Foster WL,Jr, Pratt PC, Roggli VL, Godwin JD, Halvorsen RA,Jr, Putman CE.
Centrilobular emphysema: CT-pathologic correlation. Radiology 1986 Apr;159(1):27-
32.
(132) Hayhurst MD, MacNee W, Flenley DC, Wright D, McLean A, Lamb D, et al.
Diagnosis of pulmonary emphysema by computerised tomography. Lancet 1984 Aug
11;2(8398):320-322.

234
(133) Muller NL, Staples CA, Miller RR, Abboud RT. "Density mask". An objective
method to quantitate emphysema using computed tomography. Chest 1988
Oct;94(4):782-787.
(134) Kinsella M, Muller NL, Abboud RT, Morrison NJ, DyBuncio A. Quantitation of
emphysema by computed tomography using a "density mask" program and correlation
with pulmonary function tests. Chest 1990 Feb;97(2):315-321.
(135) Gevenois PA, de Maertelaer V, De Vuyst P, Zanen J, Yernault JC. Comparison of
computed density and macroscopic morphometry in pulmonary emphysema. Am J
Respir Crit Care Med 1995 Aug;152(2):653-657.
(136) Madani A, Van Muylem A, Gevenois PA. Pulmonary emphysema: effect of lung
volume on objective quantification at thin-section CT. Radiology 2010 Oct;257(1):260-
268.
(137) Parr DG, Stoel BC, Stolk J, Nightingale PG, Stockley RA. Influence of
calibration on densitometric studies of emphysema progression using computed
tomography. Am J Respir Crit Care Med 2004 Oct 15;170(8):883-890.
(138) Newell JD,Jr, Hogg JC, Snider GL. Report of a workshop: quantitative computed
tomography scanning in longitudinal studies of emphysema. Eur Respir J 2004
May;23(5):769-775.
(139) Parr DG, Stoel BC, Stolk J, Stockley RA. Validation of computed tomographic
lung densitometry for monitoring emphysema in alpha1-antitrypsin deficiency. Thorax
2006 Jun;61(6):485-490.

235
(140) Shaker SB, Dirksen A, Laursen LC, Skovgaard LT, Holstein-Rathlou NH.
Volume adjustment of lung density by computed tomography scans in patients with
emphysema. Acta Radiol 2004 Jul;45(4):417-423.
(141) Stoel BC, Putter H, Bakker ME, Dirksen A, Stockley RA, Piitulainen E, et al.
Volume correction in computed tomography densitometry for follow-up studies on
pulmonary emphysema. Proc Am Thorac Soc 2008 Dec 15;5(9):919-924.
(142) Stolk J, Ng WH, Bakker ME, Reiber JH, Rabe KF, Putter H, et al. Correlation
between annual change in health status and computer tomography derived lung density
in subjects with alpha1-antitrypsin deficiency. Thorax 2003 Dec;58(12):1027-1030.
(143) Mets OM, van Hulst RA, Jacobs C, van Ginneken B, de Jong PA. Normal Range
of Emphysema and Air Trapping on CT in Young Men. AJR Am J Roentgenol 2012
Aug;199(2):336-340.
(144) Newman KB, Lynch DA, Newman LS, Ellegood D, Newell JD,Jr. Quantitative
computed tomography detects air trapping due to asthma. Chest 1994 Jul;106(1):105-
109.
(145) Eda S, Kubo K, Fujimoto K, Matsuzawa Y, Sekiguchi M, Sakai F. The relations
between expiratory chest CT using helical CT and pulmonary function tests in
emphysema. Am J Respir Crit Care Med 1997 Apr;155(4):1290-1294.
(146) Kubo K, Eda S, Yamamoto H, Fujimoto K, Matsuzawa Y, Maruyama Y, et al.
Expiratory and inspiratory chest computed tomography and pulmonary function tests in
cigarette smokers. Eur Respir J 1999 Feb;13(2):252-256.

236
(147) Hersh CP, Washko GR, Estepar RS, Lutz S, Friedman PJ, Han MK, et al. Paired
inspiratory-expiratory chest CT scans to assess for small airways disease in COPD.
Respir Res 2013 Apr 8;14:42-9921-14-42.
(148) Matsuoka S, Kurihara Y, Yagihashi K, Hoshino M, Watanabe N, Nakajima Y.
Quantitative assessment of air trapping in chronic obstructive pulmonary disease using
inspiratory and expiratory volumetric MDCT. AJR Am J Roentgenol 2008
Mar;190(3):762-769.
(149) Mets OM, Isgum I, Mol CP, Gietema HA, Zanen P, Prokop M, et al. Variation in
quantitative CT air trapping in heavy smokers on repeat CT examinations. Eur Radiol
2012 Dec;22(12):2710-2717.
(150) Kuwano K, Bosken CH, Pare PD, Bai TR, Wiggs BR, Hogg JC. Small airways
dimensions in asthma and in chronic obstructive pulmonary disease. Am Rev Respir
Dis 1993 Nov;148(5):1220-1225.
(151) James AL, Pare PD, Hogg JC. The mechanics of airway narrowing in asthma. Am
Rev Respir Dis 1989 Jan;139(1):242-246.
(152) Roche WR, Beasley R, Williams JH, Holgate ST. Subepithelial fibrosis in the
bronchi of asthmatics. Lancet 1989 Mar 11;1(8637):520-524.
(153) Vignola AM, Chanez P, Chiappara G, Merendino A, Pace E, Rizzo A, et al.
Transforming growth factor-beta expression in mucosal biopsies in asthma and chronic
bronchitis. Am J Respir Crit Care Med 1997 Aug;156(2 Pt 1):591-599.
(154) Redington AE, Howarth PH. Airway wall remodelling in asthma. Thorax 1997
Apr;52(4):310-312.

237
(155) Lynch DA, Newell JD, Tschomper BA, Cink TM, Newman LS, Bethel R.
Uncomplicated asthma in adults: comparison of CT appearance of the lungs in
asthmatic and healthy subjects. Radiology 1993 Sep;188(3):829-833.
(156) Boulet L, Belanger M, Carrier G. Airway responsiveness and bronchial-wall
thickness in asthma with or without fixed airflow obstruction. Am J Respir Crit Care
Med 1995 Sep;152(3):865-871.
(157) Okazawa M, Muller N, McNamara AE, Child S, Verburgt L, Pare PD. Human
airway narrowing measured using high resolution computed tomography. Am J Respir
Crit Care Med 1996 Nov;154(5):1557-1562.
(158) Awadh N, Muller NL, Park CS, Abboud RT, FitzGerald JM. Airway wall
thickness in patients with near fatal asthma and control groups: assessment with high
resolution computed tomographic scanning. Thorax 1998 Apr;53(4):248-253.
(159) Amirav I, Kramer SS, Grunstein MM, Hoffman EA. Assessment of
methacholine-induced airway constriction by ultrafast high-resolution computed
tomography. J Appl Physiol 1993 Nov;75(5):2239-2250.
(160) Wood SA, Zerhouni EA, Hoford JD, Hoffman EA, Mitzner W. Measurement of
three-dimensional lung tree structures by using computed tomography. J Appl Physiol
(1985) 1995 Nov;79(5):1687-1697.
(161) Reinhardt JM, D'Souza ND, Hoffman EA. Accurate measurement of intrathoracic
airways. IEEE Trans Med Imaging 1997 Dec;16(6):820-827.
(162) Miller MR, Hankinson J, Brusasco V, Burgos F, Casaburi R, Coates A, et al.
Standardisation of spirometry. Eur Respir J 2005 Aug;26(2):319-338.

238
(163) Wanger J, Clausen JL, Coates A, Pedersen OF, Brusasco V, Burgos F, et al.
Standardisation of the measurement of lung volumes. Eur Respir J 2005 Sep;26(3):511-
522.
(164) Macintyre N, Crapo RO, Viegi G, Johnson DC, van der Grinten CP, Brusasco V,
et al. Standardisation of the single-breath determination of carbon monoxide uptake in
the lung. Eur Respir J 2005 Oct;26(4):720-735.
(165) Gift AG. Visual analogue scales: measurement of subjective phenomena. Nurs
Res 1989 Sep-Oct;38(5):286-288.
(166) Du Rand IA, Blaikley J, Booton R, Chaudhuri N, Gupta V, Khalid S, et al. British
Thoracic Society guideline for diagnostic flexible bronchoscopy in adults: accredited by
NICE. Thorax 2013 Aug;68 Suppl 1:i1-i44.
(167) Kharitonov S, Alving K, Barnes PJ. Exhaled and nasal nitric oxide
measurements: recommendations. The European Respiratory Society Task Force. Eur
Respir J 1997 Jul;10(7):1683-1693.
(168) Juniper EF, O'Byrne PM, Guyatt GH, Ferrie PJ, King DR. Development and
validation of a questionnaire to measure asthma control. Eur Respir J 1999
Oct;14(4):902-907.
(169) Juniper EF, Svensson K, Mork AC, Stahl E. Measurement properties and
interpretation of three shortened versions of the asthma control questionnaire. Respir
Med 2005 May;99(5):553-558.

239
(170) Juniper EF, Buist AS, Cox FM, Ferrie PJ, King DR. Validation of a standardized
version of the Asthma Quality of Life Questionnaire. Chest 1999 May;115(5):1265-
1270.
(171) Pavord ID, Pizzichini MM, Pizzichini E, Hargreave FE. The use of induced
sputum to investigate airway inflammation. Thorax 1997 Jun;52(6):498-501.
(172) Sullivan P, Stephens D, Ansari T, Costello J, Jeffery P. Variation in the
measurements of basement membrane thickness and inflammatory cell number in
bronchial biopsies. Eur Respir J 1998 Oct;12(4):811-815.
(173) Cohen L, E X, Tarsi J, Ramkumar T, Horiuchi TK, Cochran R, et al. Epithelial
cell proliferation contributes to airway remodeling in severe asthma. Am J Respir Crit
Care Med 2007 Jul 15;176(2):138-145.
(174) Siddiqui S, Sutcliffe A, Shikotra A, Woodman L, Doe C, McKenna S, et al.
Vascular remodeling is a feature of asthma and nonasthmatic eosinophilic bronchitis. J
Allergy Clin Immunol 2007 Oct;120(4):813-819.
(175) Tschirren J, Hoffman EA, McLennan G, Sonka M. Intrathoracic airway trees:
segmentation and airway morphology analysis from low-dose CT scans. IEEE Trans
Med Imaging 2005 Dec;24(12):1529-1539.
(176) Tschirren J, Hoffman EA, McLennan G, Sonka M. Segmentation and quantitative
analysis of intrathoracic airway trees from computed tomography images. Proc Am
Thorac Soc 2005;2(6):484-7, 503-4.

240
(177) Pu J, Gu S, Liu S, Zhu S, Wilson D, Siegfried JM, et al. CT based computerized
identification and analysis of human airways: a review. Med Phys 2012
May;39(5):2603-2616.
(178) Pare PD, Nagano T, Coxson HO. Airway imaging in disease: gimmick or useful
tool? J Appl Physiol (1985) 2012 Aug 15;113(4):636-646.
(179) King GG, Muller NL, Whittall KP, Xiang QS, Pare PD. An analysis algorithm for
measuring airway lumen and wall areas from high-resolution computed tomographic
data. Am J Respir Crit Care Med 2000 Feb;161(2 Pt 1):574-580.
(180) Udupa JK, Wei L, Samarasekera S, Miki Y, van Buchem MA, Grossman RI.
Multiple sclerosis lesion quantification using fuzzy-connectedness principles. IEEE
Trans Med Imaging 1997 Oct;16(5):598-609.
(181) Ciesielski KC, Udupa JK, Saha PK, Zhuge Y. Iterative Relative Fuzzy
Connectedness for Multiple Objects with Multiple Seeds. Comput Vis Image Underst
2007 Sep;107(3):160-182.
(182) Ukil S, Reinhardt JM. Anatomy-guided lung lobe segmentation in X-ray CT
images. IEEE Trans Med Imaging 2009 Feb;28(2):202-214.
(183) Zhang L, Hoffman EA, Reinhardt JM. Atlas-driven lung lobe segmentation in
volumetric X-ray CT images. IEEE Trans Med Imaging 2006 Jan;25(1):1-16.
(184) Wang J, Betke M, Ko JP. Pulmonary fissure segmentation on CT. Med Image
Anal 2006 Aug;10(4):530-547.

241
(185) van Rikxoort EM, van Ginneken B, Klik M, Prokop M. Supervised enhancement
filters: application to fissure detection in chest CT scans. IEEE Trans Med Imaging
2008 Jan;27(1):1-10.
(186) Henne E, Anderson JC, Lowe N, Kesten S. Comparison of human lung tissue
mass measurements from Ex Vivo lungs and high resolution CT software analysis.
BMC Pulm Med 2012 May 14;12:18-2466-12-18.
(187) McNamee JE. Fractal perspectives in pulmonary physiology. J Appl Physiol
(1985) 1991 Jul;71(1):1-8.
(188) Mishima M, Hirai T, Itoh H, Nakano Y, Sakai H, Muro S, et al. Complexity of
terminal airspace geometry assessed by lung computed tomography in normal subjects
and patients with chronic obstructive pulmonary disease. Proc Natl Acad Sci U S A
1999 Aug 3;96(16):8829-8834.
(189) Nakano Y, Wong JC, de Jong PA, Buzatu L, Nagao T, Coxson HO, et al. The
prediction of small airway dimensions using computed tomography. Am J Respir Crit
Care Med 2005 Jan 15;171(2):142-146.
(190) Grydeland TB, Thorsen E, Dirksen A, Jensen R, Coxson HO, Pillai SG, et al.
Quantitative CT measures of emphysema and airway wall thickness are related to
D(L)CO. Respir Med 2011 Mar;105(3):343-351.
(191) Stoel BC, Vrooman HA, Stolk J, Reiber JH. Sources of error in lung densitometry
with CT. Invest Radiol 1999 Apr;34(4):303-309.

242
(192) Bakker ME, Stolk J, Putter H, Shaker SB, Parr DG, Piitulainen E, et al.
Variability in densitometric assessment of pulmonary emphysema with computed
tomography. Invest Radiol 2005 Dec;40(12):777-783.
(193) Dirksen A, Dijkman JH, Madsen F, Stoel B, Hutchison DC, Ulrik CS, et al. A
randomized clinical trial of alpha(1)-antitrypsin augmentation therapy. Am J Respir Crit
Care Med 1999 Nov;160(5 Pt 1):1468-1472.
(194) King GG, Muller NL, Pare PD. Evaluation of airways in obstructive pulmonary
disease using high-resolution computed tomography. Am J Respir Crit Care Med 1999
Mar;159(3):992-1004.
(195) Mosteller RD. Simplified calculation of body-surface area. N Engl J Med 1987
Oct 22;317(17):1098.
(196) Mayo JR, Webb WR, Gould R, Stein MG, Bass I, Gamsu G, et al. High-
resolution CT of the lungs: an optimal approach. Radiology 1987 May;163(2):507-510.
(197) McNamara AE, Muller NL, Okazawa M, Arntorp J, Wiggs BR, Pare PD. Airway
narrowing in excised canine lungs measured by high-resolution computed tomography.
J Appl Physiol 1992 Jul;73(1):307-316.
(198) Webb WR, Gamsu G, Wall SD, Cann CE, Proctor E. CT of a bronchial phantom.
Factors affecting appearance and size measurements. Invest Radiol 1984 Sep-
Oct;19(5):394-398.
(199) Seneterre E, Paganin F, Bruel JM, Michel FB, Bousquet J. Measurement of the
internal size of bronchi using high resolution computed tomography (HRCT). Eur
Respir J 1994 Mar;7(3):596-600.

243
(200) National Collaborating Centre for Chronic Conditions. Chronic obstructive
pulmonary disease. National clinical guideline on management of chronic obstructive
pulmonary disease in adults in primary and secondary care. Thorax 2004 Feb;59 Suppl
1:1-232.
(201) Braman SS. The global burden of asthma. Chest 2006 Jul;130(1 Suppl):4S-12S.
(202) Barnes PJ. Immunology of asthma and chronic obstructive pulmonary disease.
Nat Rev Immunol 2008 Mar;8(3):183-192.
(203) Kim V, Davey A, Comellas AP, Han MK, Washko G, Martinez CH, et al.
Clinical and computed tomographic predictors of chronic bronchitis in COPD: a cross
sectional analysis of the COPDGene study. Respir Res 2014 Apr 27;15:52-9921-15-52.
(204) Xie X, de Jong PA, Oudkerk M, Wang Y, Ten Hacken NH, Miao J, et al.
Morphological measurements in computed tomography correlate with airflow
obstruction in chronic obstructive pulmonary disease: systematic review and meta-
analysis. Eur Radiol 2012 Oct;22(10):2085-2093.
(205) Choromanska A, Macura KJ. Role of computed tomography in quantitative
assessment of emphysema. Pol J Radiol 2012 Jan;77(1):28-36.
(206) Johannessen A, Skorge TD, Bottai M, Grydeland TB, Nilsen RM, Coxson H, et
al. Mortality by Level of Emphysema and Airway Wall Thickness. Am J Respir Crit
Care Med 2013 Jan 17.
(207) Kasahara K, Shiba K, Ozawa T, Okuda K, Adachi M. Correlation between the
bronchial subepithelial layer and whole airway wall thickness in patients with asthma.
Thorax 2002 Mar;57(3):242-246.

244
(208) Montaudon M, Lederlin M, Reich S, Begueret H, Tunon-de-Lara JM, Marthan R,
et al. Bronchial measurements in patients with asthma: comparison of quantitative thin-
section CT findings with those in healthy subjects and correlation with pathologic
findings. Radiology 2009 Dec;253(3):844-853.
(209) Hartley R, Barker B, Pakkal M, Newby C, Siddiqui S, Gupta S, et al. Quantitative
Computed Tomography (QCT) analysis of lung morphometry and densitometry in
asthma and COPD in patients with and without Fixed Airflow Obstruction (FAO). Eur
Respir J 2014.
(210) Hartley R, Barker B, Pakkal M, Siddiqui S, Bafadhel M, Gupta S, et al.
Comparing airway morphometry and lung density in asthma, COPD and healthy
controls using quantitative CT (QCT). European Respiratory Journal 2013 September
01;42(Suppl 57).
(211) Bateman ED, Hurd SS, Barnes PJ, Bousquet J, Drazen JM, FitzGerald M, et al.
Global strategy for asthma management and prevention: GINA executive summary. Eur
Respir J 2008 Jan;31(1):143-178.
(212) Vestbo J, Hurd SS, Agusti AG, Jones PW, Vogelmeier C, Anzueto A, et al.
Global strategy for the diagnosis, management, and prevention of chronic obstructive
pulmonary disease: GOLD executive summary. Am J Respir Crit Care Med 2013 Feb
15;187(4):347-365.
(213) Achenbach T, Weinheimer O, Biedermann A, Schmitt S, Freudenstein D,
Goutham E, et al. MDCT assessment of airway wall thickness in COPD patients using a
new method: correlations with pulmonary function tests. Eur Radiol 2008
Dec;18(12):2731-2738.

245
(214) Gupta S, Siddiqui S, Haldar P, Entwisle JJ, Mawby D, Wardlaw AJ, et al.
Quantitative analysis of high-resolution computed tomography scans in severe asthma
subphenotypes. Thorax 2010 Sep;65(9):775-781.
(215) Diaz AA, Morales A, Diaz JC, Ramos C, Klaassen J, Saldias F, et al. CT and
physiologic determinants of dyspnea and exercise capacity during the six-minute walk
test in mild COPD. Respir Med 2013 Apr;107(4):570-579.
(216) Gorska K, Krenke R, Kosciuch J, Korczynski P, Zukowska M, Domagala-
Kulawik J, et al. Relationship between airway inflammation and remodeling in patients
with asthma and chronic obstructive pulmonary disease. Eur J Med Res 2009 Dec 7;14
Suppl 4:90-96.
(217) Kosciuch J, Krenke R, Gorska K, Zukowska M, Maskey-Warzechowska M,
Chazan R. Airway dimensions in asthma and COPD in high resolution computed
tomography: can we see the difference? Respir Care 2013 Jan 9.
(218) Shimizu K, Hasegawa M, Makita H, Nasuhara Y, Konno S, Nishimura M.
Comparison of airway remodelling assessed by computed tomography in asthma and
COPD. Respir Med 2011 Sep;105(9):1275-1283.
(219) Schroeder JD, McKenzie AS, Zach JA, Wilson CG, Curran-Everett D, Stinson
DS, et al. Relationships between airflow obstruction and quantitative CT measurements
of emphysema, air trapping, and airways in subjects with and without chronic
obstructive pulmonary disease. AJR Am J Roentgenol 2013 Sep;201(3):W460-70.

246
(220) Busacker A, Newell JD,Jr, Keefe T, Hoffman EA, Granroth JC, Castro M, et al.
A multivariate analysis of risk factors for the air-trapping asthmatic phenotype as
measured by quantitative CT analysis. Chest 2009 Jan;135(1):48-56.
(221) Hong KY, Lee JH, Park SW, Joo JH, Kim DJ, Moon SH, et al. Evaluation of
emphysema in patients with asthma using high-resolution CT. Korean J Intern Med
2002 Mar;17(1):24-30.
(222) Biernacki W, Redpath AT, Best JJ, MacNee W. Measurement of CT lung density
in patients with chronic asthma. Eur Respir J 1997 Nov;10(11):2455-2459.
(223) Mitsunobu F, Ashida K, Hosaki Y, Tsugeno H, Okamoto M, Nishida K, et al.
Complexity of terminal airspace geometry assessed by computed tomography in
asthma. Am J Respir Crit Care Med 2003 Feb 1;167(3):411-417.
(224) Paganin F, Jaffuel D, Bousquet J. Significance of emphysema observed on
computed tomography scan in asthma. Eur Respir J 1997 Nov;10(11):2446-2448.
(225) World Health Organization. Global surveillance, prevention and control of
chronic respiratory diseases: A comprehensive approach. Available at:
http://www.who.int/gard/publications/GARD%20Book%202007.pdf, 2016.
(226) Berair R, Brightling CE. Asthma therapy and its effect on airway remodelling.
Drugs 2014 Aug;74(12):1345-1369.
(227) Benayoun L, Druilhe A, Dombret MC, Aubier M, Pretolani M. Airway structural
alterations selectively associated with severe asthma. Am J Respir Crit Care Med 2003
May 15;167(10):1360-1368.

247
(228) O'Reilly R, Ullmann N, Irving S, Bossley CJ, Sonnappa S, Zhu J, et al. Increased
airway smooth muscle in preschool wheezers who have asthma at school age. J Allergy
Clin Immunol 2013 Apr;131(4):1024-32, 1032.e1-16.
(229) James AL, Elliot JG, Jones RL, Carroll ML, Mauad T, Bai TR, et al. Airway
smooth muscle hypertrophy and hyperplasia in asthma. Am J Respir Crit Care Med
2012 May 15;185(10):1058-1064.
(230) Elliot JG, Jones RL, Abramson MJ, Green FH, Mauad T, McKay KO, et al.
Distribution of airway smooth muscle remodelling in asthma: relation to airway
inflammation. Respirology 2015 Jan;20(1):66-72.
(231) Siddiqui S, Gupta S, Cruse G, Haldar P, Entwisle J, Mcdonald S, et al. Airway
wall geometry in asthma and nonasthmatic eosinophilic bronchitis. Allergy 2009
Jun;64(6):951-958.
(232) Gupta S, Hartley R, Singapuri A, Hargadon B, Monteiro W, Pavord ID, et al.
Temporal assessment of airway remodeling in severe asthma using quantitative
computed tomography. Am J Respir Crit Care Med 2015 Jan 1;191(1):107-110.
(233) Haldar P, Brightling CE, Singapuri A, Hargadon B, Gupta S, Monteiro W, et al.
Outcomes after cessation of mepolizumab therapy in severe eosinophilic asthma: A 12-
month follow-up analysis. J Allergy Clin Immunol 2014 Jan 10.
(234) Hartley RA, Barker BL, Newby C, Pakkal M, Baldi S, Kajekar R, et al.
Relationship between lung function and quantitative computed tomographic parameters
of airway remodeling, air trapping, and emphysema in patients with asthma and chronic

248
obstructive pulmonary disease: A single-center study. J Allergy Clin Immunol 2016
Mar 19.
(235) Hashimoto M, Tanaka H, Abe S. Quantitative analysis of bronchial wall
vascularity in the medium and small airways of patients with asthma and COPD. Chest
2005 Mar;127(3):965-972.
(236) Chetta A, Zanini A, Foresi A, Del Donno M, Castagnaro A, D'Ippolito R, et al.
Vascular component of airway remodeling in asthma is reduced by high dose of
fluticasone. Am J Respir Crit Care Med 2003 Mar 1;167(5):751-757.
(237) Hoshino M, Takahashi M, Takai Y, Sim J, Aoike N. Inhaled corticosteroids
decrease vascularity of the bronchial mucosa in patients with asthma. Clin Exp Allergy
2001 May;31(5):722-730.
(238) Orsida BE, Li X, Hickey B, Thien F, Wilson JW, Walters EH. Vascularity in
asthmatic airways: relation to inhaled steroid dose. Thorax 1999 Apr;54(4):289-295.
(239) Orsida BE, Ward C, Li X, Bish R, Wilson JW, Thien F, et al. Effect of a long-
acting beta2-agonist over three months on airway wall vascular remodeling in asthma.
Am J Respir Crit Care Med 2001 Jul 1;164(1):117-121.
(240) Carroll NG, Cooke C, James AL. Bronchial blood vessel dimensions in asthma.
Am J Respir Crit Care Med 1997 Feb;155(2):689-695.
(241) Wenzel SE. Asthma phenotypes: the evolution from clinical to molecular
approaches. Nat Med 2012 May 4;18(5):716-725.
249
(242) Green RH, Brightling CE, McKenna S, Hargadon B, Parker D, Bradding P, et al.
Asthma exacerbations and sputum eosinophil counts: a randomised controlled trial.
Lancet 2002 Nov 30;360(9347):1715-1721.
(243) Pavord ID, Korn S, Howarth P, Bleecker ER, Buhl R, Keene ON, et al.
Mepolizumab for severe eosinophilic asthma (DREAM): a multicentre, double-blind,
placebo-controlled trial. Lancet 2012 Aug 18;380(9842):651-659.
(244) Hirai H, Tanaka K, Yoshie O, Ogawa K, Kenmotsu K, Takamori Y, et al.
Prostaglandin D2 selectively induces chemotaxis in T helper type 2 cells, eosinophils,
and basophils via seven-transmembrane receptor CRTH2. J Exp Med 2001 Jan
15;193(2):255-261.
(245) Xue L, Barrow A, Pettipher R. Novel function of CRTH2 in preventing apoptosis
of human Th2 cells through activation of the phosphatidylinositol 3-kinase pathway. J
Immunol 2009 Jun 15;182(12):7580-7586.
(246) Xue L, Gyles SL, Wettey FR, Gazi L, Townsend E, Hunter MG, et al.
Prostaglandin D2 causes preferential induction of proinflammatory Th2 cytokine
production through an action on chemoattractant receptor-like molecule expressed on
Th2 cells. J Immunol 2005 Nov 15;175(10):6531-6536.
(247) Xue L, Salimi M, Panse I, Mjosberg JM, McKenzie AN, Spits H, et al.
Prostaglandin D2 activates group 2 innate lymphoid cells through chemoattractant
receptor-homologous molecule expressed on TH2 cells. J Allergy Clin Immunol 2014
Apr;133(4):1184-1194.

250
(248) Gervais FG, Cruz RP, Chateauneuf A, Gale S, Sawyer N, Nantel F, et al.
Selective modulation of chemokinesis, degranulation, and apoptosis in eosinophils
through the PGD2 receptors CRTH2 and DP. J Allergy Clin Immunol 2001
Dec;108(6):982-988.
(249) Monneret G, Gravel S, Diamond M, Rokach J, Powell WS. Prostaglandin D2 is a
potent chemoattractant for human eosinophils that acts via a novel DP receptor. Blood
2001 Sep 15;98(6):1942-1948.
(250) Kips JC, Inman MD, Jayaram L, Bel EH, Parameswaran K, Pizzichini MM, et al.
The use of induced sputum in clinical trials. Eur Respir J Suppl 2002 Sep;37:47s-50s.
(251) Barnes N, Pavord I, Chuchalin A, Bell J, Hunter M, Lewis T, et al. A randomized,
double-blind, placebo-controlled study of the CRTH2 antagonist OC000459 in
moderate persistent asthma. Clin Exp Allergy 2012 Jan;42(1):38-48.
(252) Pettipher R, Hunter MG, Perkins CM, Collins LP, Lewis T, Baillet M, et al.
Heightened response of eosinophilic asthmatic patients to the CRTH2 antagonist
OC000459. Allergy 2014 Sep;69(9):1223-1232.
(253) Busse WW, Wenzel SE, Meltzer EO, Kerwin EM, Liu MC, Zhang N, et al. Safety
and efficacy of the prostaglandin D2 receptor antagonist AMG 853 in asthmatic
patients. J Allergy Clin Immunol 2013 Feb;131(2):339-345.
(254) Kostenis E, Ulven T. Emerging roles of DP and CRTH2 in allergic inflammation.
Trends Mol Med 2006 Apr;12(4):148-158.
(255) Hall IP, Fowler AV, Gupta A, Tetzlaff K, Nivens MC, Sarno M, et al. Efficacy of
BI 671800, an oral CRTH2 antagonist, in poorly controlled asthma as sole controller

251
and in the presence of inhaled corticosteroid treatment. Pulm Pharmacol Ther 2015
Jun;32:37-44.