Embed Size (px)
Citation preview
INSIGHTS 2019Traditional TV, online
video & streaming
US
UK
Germany
Denmark
Sweden
Norway
Finland

AudienceProject Insights 20192
05 Editorial
07 Traditional TV
21 Online video
35 Streaming
55 About the study
CONTENTS
AudienceProject Insights 2019 3

AudienceProject Insights 20194
EDITORIAL
Netflix increases its
domination of the
streaming market
Netflix increases the lead on the streaming
market and is now the top streaming service in
(almost) all countries
Netflix keeps strengthening its position as the go-to platform when people want to catch up with the latest series and movies. In all coun-tries surveyed, the number of people watching Netflix has increased since last year and it is now the number one streaming service in all countries - except Finland where Yle Areena takes the lead.
Besides Yle Areena, the streaming services provided by the national public service broadcasters are generally doing well. Despite a slight decrease compared to last year, BBC iPlayer in the UK, DR TV in Den-mark, SVT Play in Sweden and NRK TV in Norway are the second most used streaming services. In the US and Germany, Amazon Prime Video takes the position as the runner up.
Netflix could, however, risk losing its leading position if they were to add commercials into its streaming service - as the company tested last summer. Up to two-thirds of the respondents claim that they would cancel their subscription if commercials were introduced. This clearly shows how both broadcasters and advertisers alike need to work hard to ensure that campaigns are relevant, once again highlighting the growing importance of targeting in advertising.
Rune Werliin
VP, Marketing & Professional Services @ AudienceProject
AudienceProject Insights 2019 5

AudienceProject Insights 20196
Traditional TV is still going strong – but mostly among the older
generations. The number of people watching traditional TV is
going down, with a third claiming to watch less TV compared
to last year. When they do, it is primarily at home in the evening
and often while using a second screen device.
TRADITIONAL TV
AudienceProject Insights 2019 7
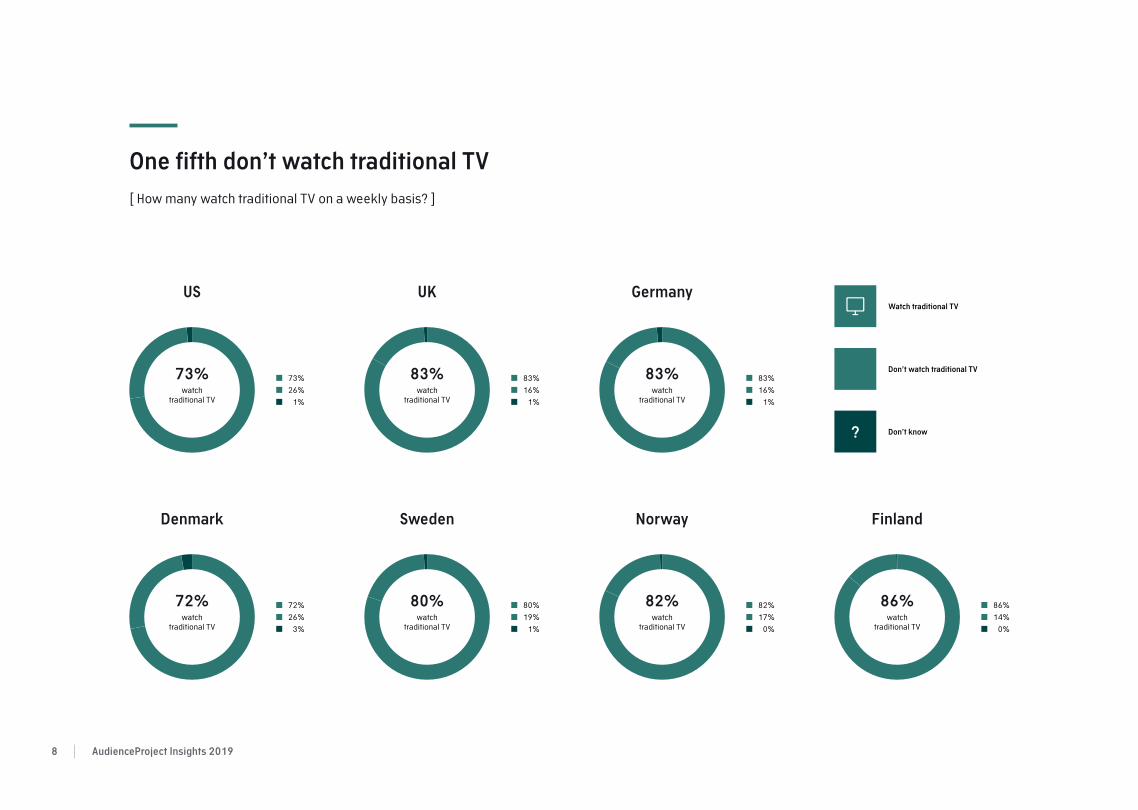
One fifth don’t watch traditional TV
[ How many watch traditional TV on a weekly basis? ]
Denmark
GermanyUKUS
Sweden Norway Finland
73%
26%
1%
73%watch
traditional TV
83%
16%
1%
83%
16%
1%
80%
19%
1%
82%
17%
0%
86%
14%
0%
83%watch
traditional TV
83%watch
traditional TV
watchtraditional TV
80%watch
traditional TV
82%watch
traditional TV
86%watch
traditional TV
Watch traditional TV
Don’t know?
Don’t watch traditional TV
72% 72%
26%
3%
AudienceProject Insights 20198
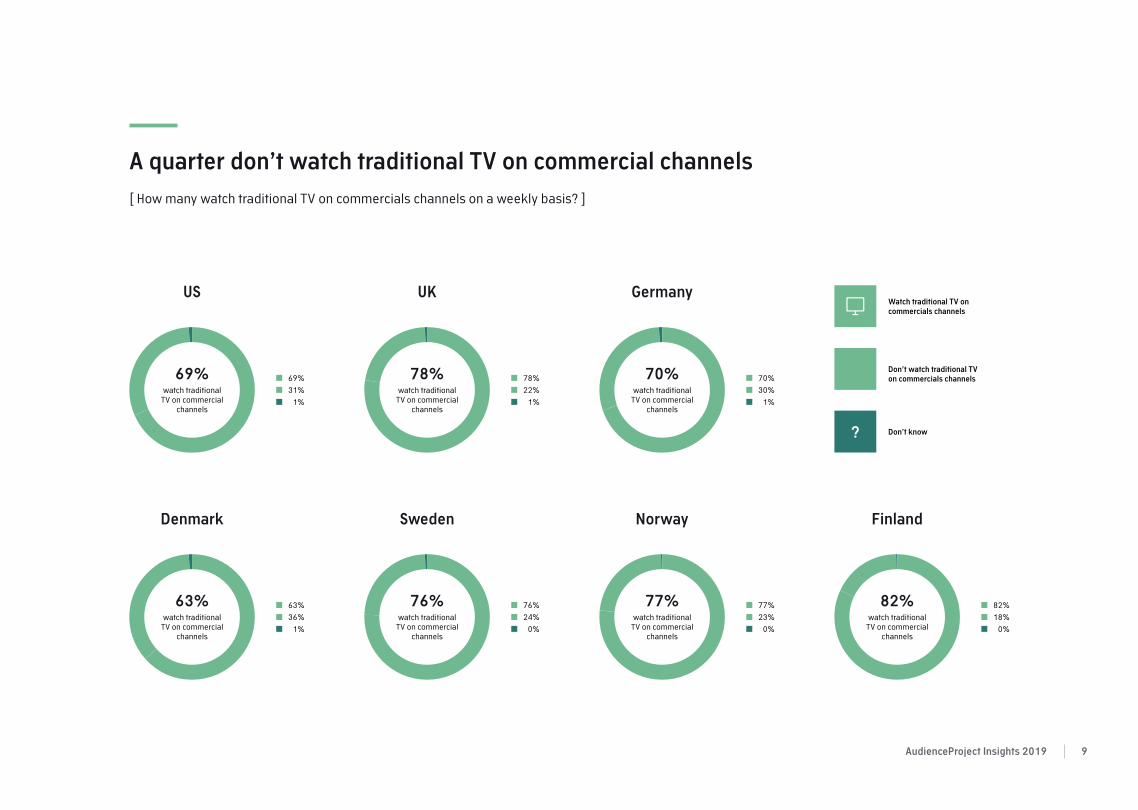
A quarter don’t watch traditional TV on commercial channels
[ How many watch traditional TV on commercials channels on a weekly basis? ]
Denmark
GermanyUKUS
Sweden Norway Finland
69%
31%
1%
69% 78%
22%
1%
70%
30%
1%
76%
24%
0%
77%
23%
0%
82%
18%
0%
78% 70%
76% 77% 82%watch traditional
TV on commercial channels
Watch traditional TV on
commercials channels
Don’t know?
Don’t watch traditional TV
on commercials channels
watch traditional TV on commercial
channels
watch traditional TV on commercial
channels
watch traditional TV on commercial
channels
watch traditional TV on commercial
channels
watch traditional TV on commercial
channels
watch traditional TV on commercial
channels
63% 63%
36%
1%
AudienceProject Insights 2019 9

Older people most likely to watch traditional TV
[ How many watch traditional TV on a weekly basis? ]
46-5515-25 26-35 36-45 56+
US
UK
Germany
Denmark
Sweden
93%
82%
95%95%92%
96%92%
84%80%
92%89%
83%
89%
81%
70%
87%81%
71%69%
85%
72%
66%
76%
67%64%
72%
65%65%
76%72%
56%60%
Norway
Finland
39%
50%
88%
AudienceProject Insights 201910
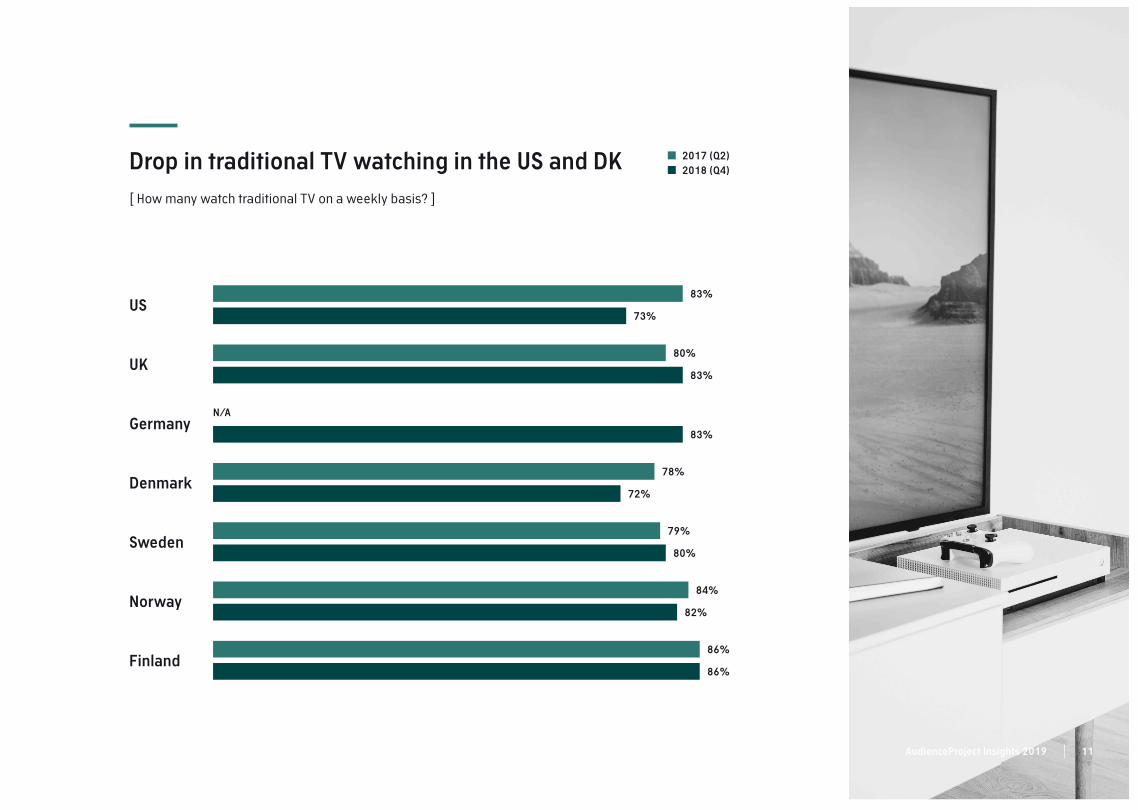
Drop in traditional TV watching in the US and DK
[ How many watch traditional TV on a weekly basis? ]
Denmark
Sweden
Norway
Finland
Germany
UK
US
86%
86%
82%
84%
80%
79%
78%
83%
80%
73%
83%
83%
N/A
2017 (Q2)
2018 (Q4)
72%
AudienceProject Insights 2019 11

AudienceProject Insights 201912

One third watch less traditional TV compared to last year
[ How much traditional TV do people watch compared to last year? ]
Denmark
Sweden
Norway
Finland
Germany
UK
US
38%
Watch less traditional
TV compared to last year
Watch the same amount of
traditional TV compared to last year
Watch more traditional
TV compared to last year
46% 15%
43% 49% 8%
33% 57% 10%
30% 65% 5%
31% 62% 6%
37% 58% 6%
37% 56% 7%
AudienceProject Insights 2019 13

People primarily watch TV in the evening
[ When do people watch TV? ]
In the night
12 midnight - 6 am
US
UK
Germany
Denmark
Sweden
Norway
Finland
96%95%95%94%94%93%
88%
21%20%
25%26%
15%
31%
36%
25%
29%
22%
33%
25%
32%
44%
14%13%10%
12%14%15%
26%
In the evening
6 pm - 12 midnight
In the afternoon
12 noon - 6 pm
In the morning
6 am - 12 noon
AudienceProject Insights 201914
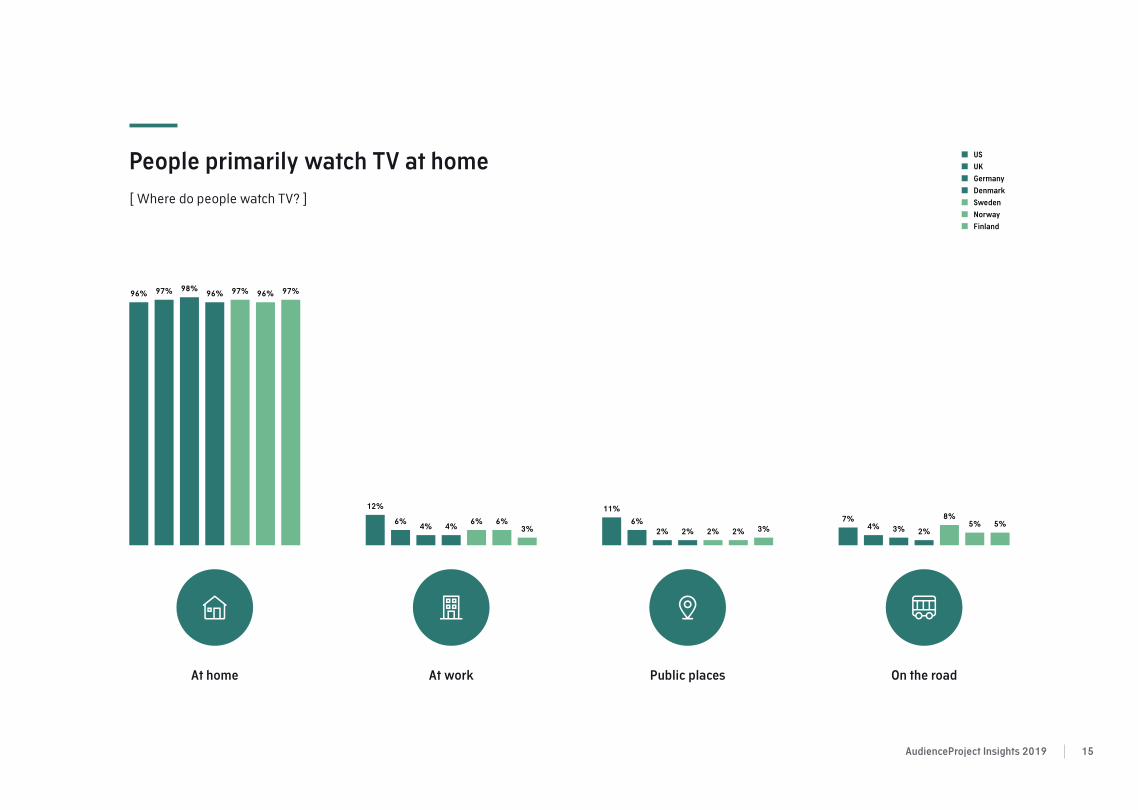
People primarily watch TV at home
[ Where do people watch TV? ]
US
UK
Germany
Denmark
Sweden
Norway
Finland
On the roadAt home At work Public places
97%96%97%96%98%97%96%
3%6%6%
4%4%6%
12%
3%2%2%2%2%
6%
11%
5%5%8%
2%3%4%7%
AudienceProject Insights 2019 15

AudienceProject Insights 201916
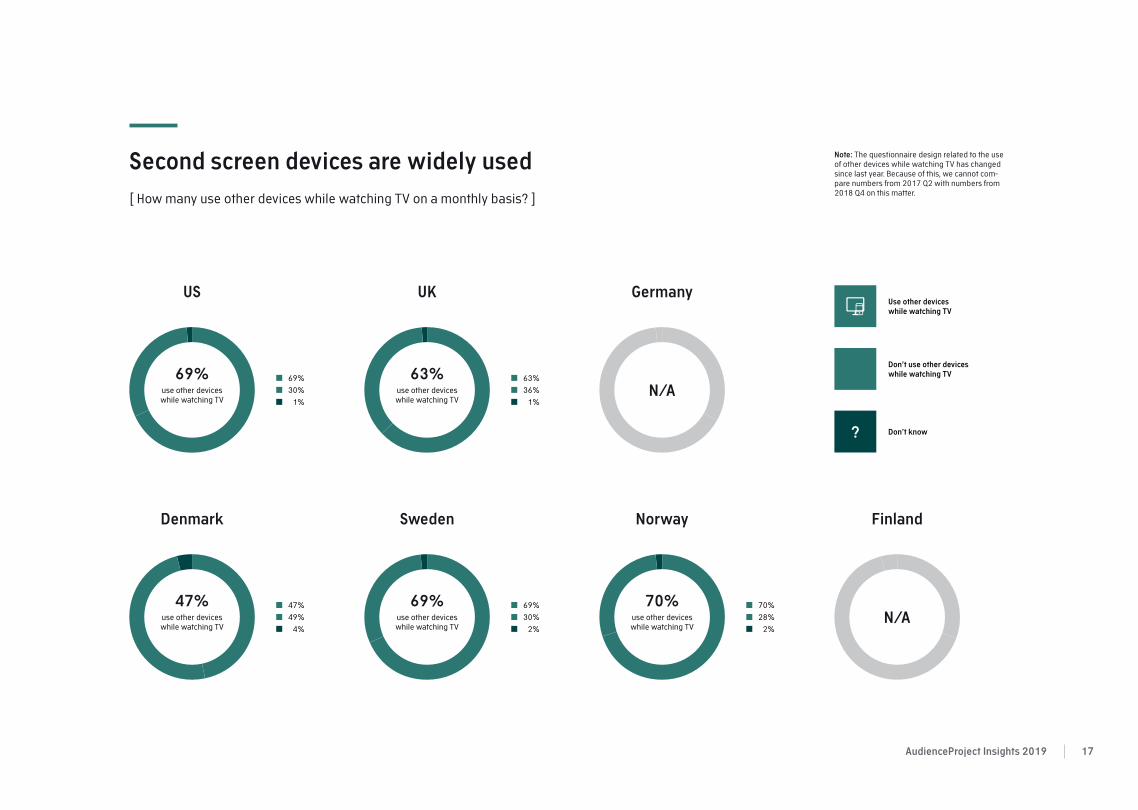
Second screen devices are widely used
[ How many use other devices while watching TV on a monthly basis? ]
Denmark
GermanyUKUS
Sweden Norway Finland
69%
30%
1%
69%use other devices while watching TV
63%
36%
1%
47%
49%
4%
69%
30%
2%
70%
28%
2%
63%use other devices while watching TV
N/A
47%use other devices while watching TV
69%use other devices while watching TV
70%use other devices while watching TV
N/A
Use other devices
while watching TV
Don’t know?
Don’t use other devices
while watching TV
Note: The questionnaire design related to the use of other devices while watching TV has changed since last year. Because of this, we cannot com-pare numbers from 2017 Q2 with numbers from 2018 Q4 on this matter.
AudienceProject Insights 2019 17
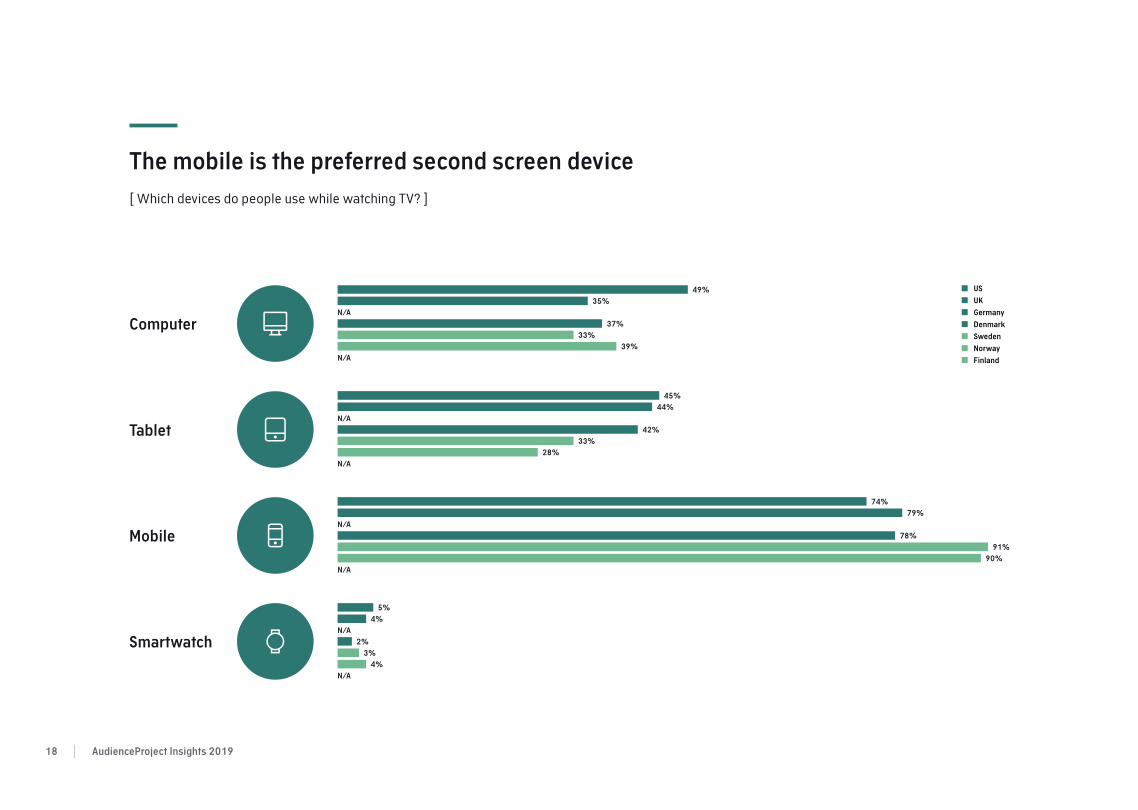
The mobile is the preferred second screen device
[ Which devices do people use while watching TV? ]
Computer
Tablet
Mobile
Smartwatch
90%
91%
N/A
78%
N/A
79%
74%
4%
3%
N/A
2%
N/A
4%
5%
28%
33%
N/A
42%
N/A
44%
45%
39%
33%
N/A
37%
N/A
35%
49% US
UK
Germany
Denmark
Sweden
Norway
Finland
AudienceProject Insights 201918
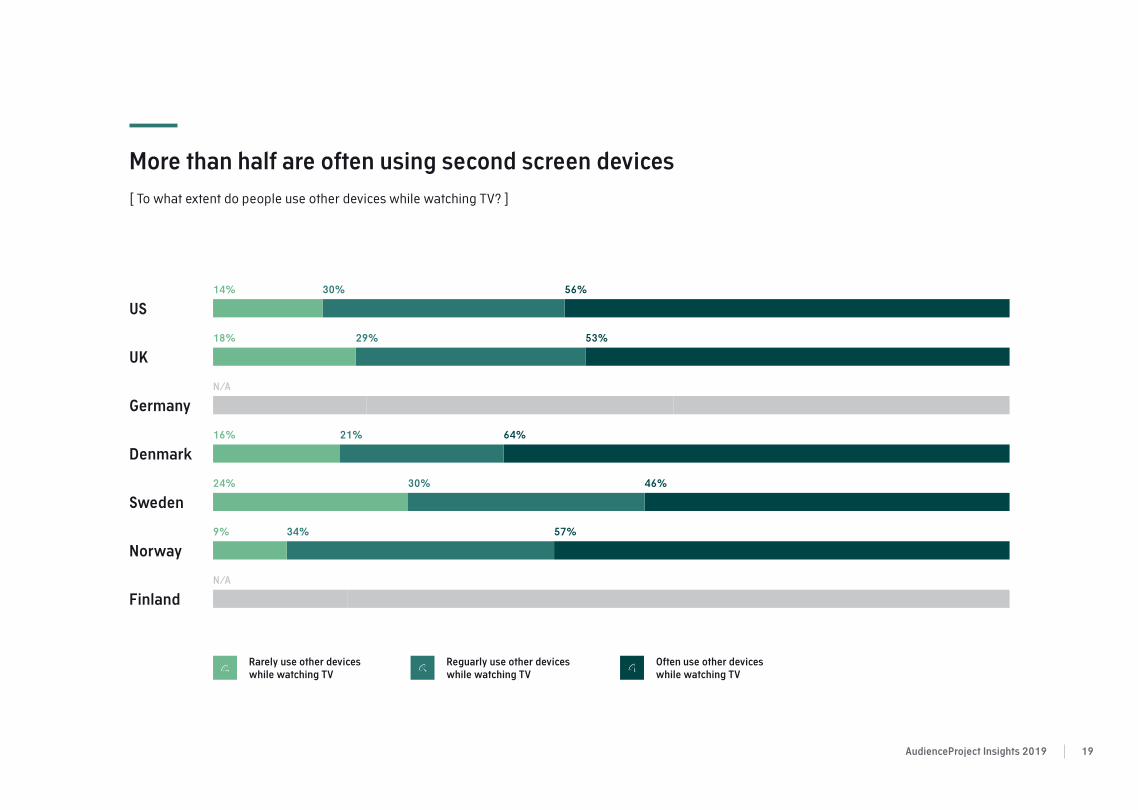
More than half are often using second screen devices
[ To what extent do people use other devices while watching TV? ]
Denmark
Sweden
Norway
Finland
Germany
UK
US
14%
Rarely use other devices
while watching TV
Reguarly use other devices
while watching TV
Often use other devices
while watching TV
30% 56%
18% 29% 53%
N/A
16% 21% 64%
24% 30% 46%
9% 34% 57%
N/A
AudienceProject Insights 2019 19

AudienceProject Insights 201920
Watching online videos is now almost as common as watching
traditional TV – and even more widespread among the younger
generations. Not surprisingly, the go-to platforms are YouTube
and Facebook, but the major local news sites are also widely
used.
ONLINE VIDEO
AudienceProject Insights 2019 21

Three quarters watch online video
[ How many watch online video on a weekly basis? ]
Denmark
GermanyUKUS
Sweden Norway Finland
85%
14%
1%
85%watch
online video
69%
30%
1%
65%
32%
3%
53%
43%
4%
64%
34%
1%
88%
12%
1%
77%
23%
1%
69%watch
online video
65%watch
online video
53%watch
online video
64%watch
online video
88%watch
online video
77%watch
online video
Watch online video
Don’t know?
Don’t watch online video
AudienceProject Insights 201922

Younger people most likely to watch online video
[ How many watch online video on a weekly basis? ]
46-5515-25 26-35 36-45 56+
US
UK
Germany
Denmark
Sweden
50%
76%
57%
77%
49%
39%
50%
68%
83%
71%
87%
65%
55%60%
76%
90%
82%
91%
73%
56%
73%
85%88%
91%93%
84%
62%
79%
94%90%
96%98%
89%
62%
83%
Norway
Finland
AudienceProject Insights 2019 23
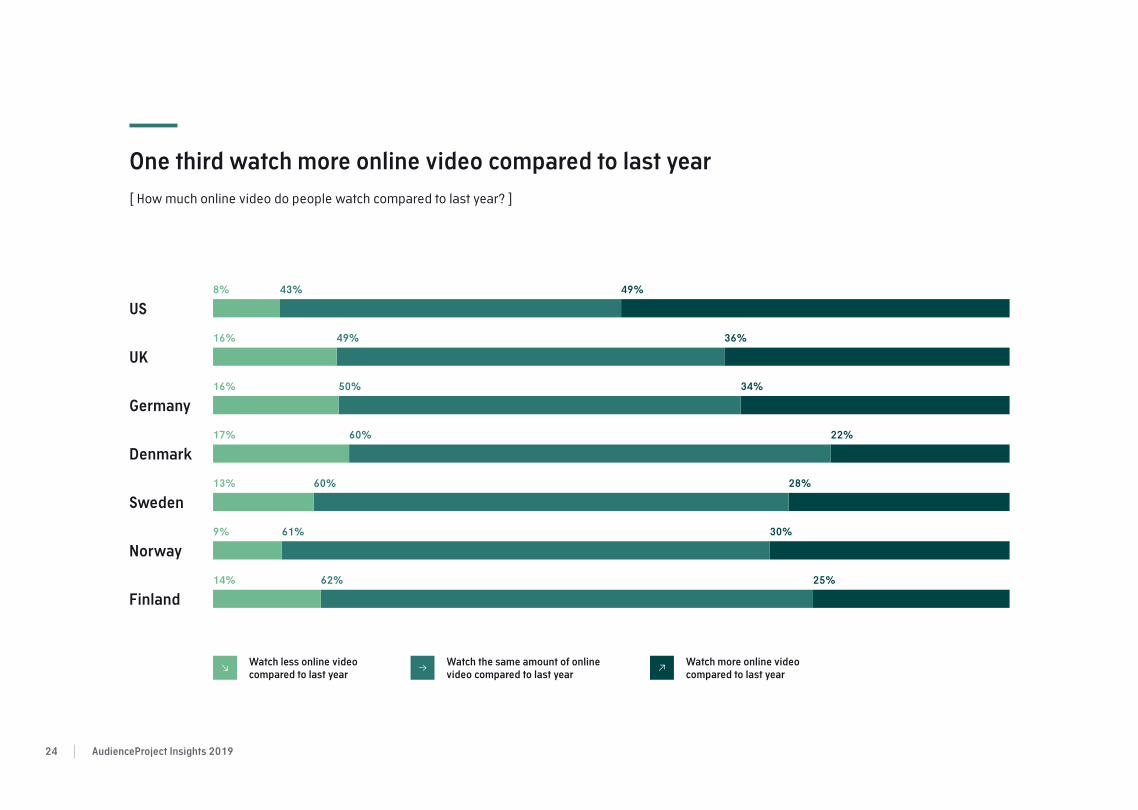
One third watch more online video compared to last year
[ How much online video do people watch compared to last year? ]
Denmark
Sweden
Norway
Finland
Germany
UK
US
8%
Watch less online video
compared to last year
Watch the same amount of online
video compared to last year
Watch more online video
compared to last year
43% 49%
16% 49% 36%
16% 50% 34%
17% 60% 22%
13% 60% 28%
9% 61% 30%
14% 62% 25%
AudienceProject Insights 201924
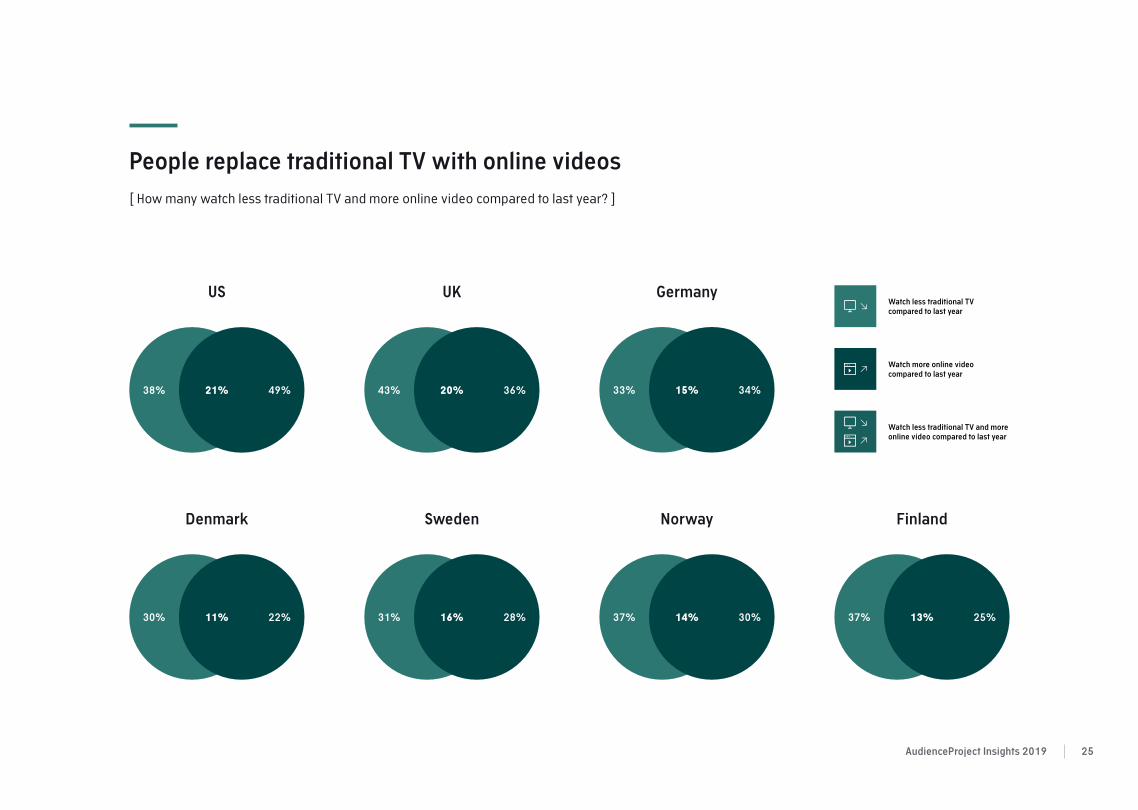
People replace traditional TV with online videos
[ How many watch less traditional TV and more online video compared to last year? ]
Denmark
GermanyUKUS
Sweden Norway Finland
Watch less traditional TV
compared to last year
Watch less traditional TV and more
online video compared to last year
Watch more online video
compared to last year
49%38% 21% 36%43% 20% 34%33% 15%
22%30% 11% 28%31% 16% 30%37% 14% 25%37% 13%
AudienceProject Insights 2019 25
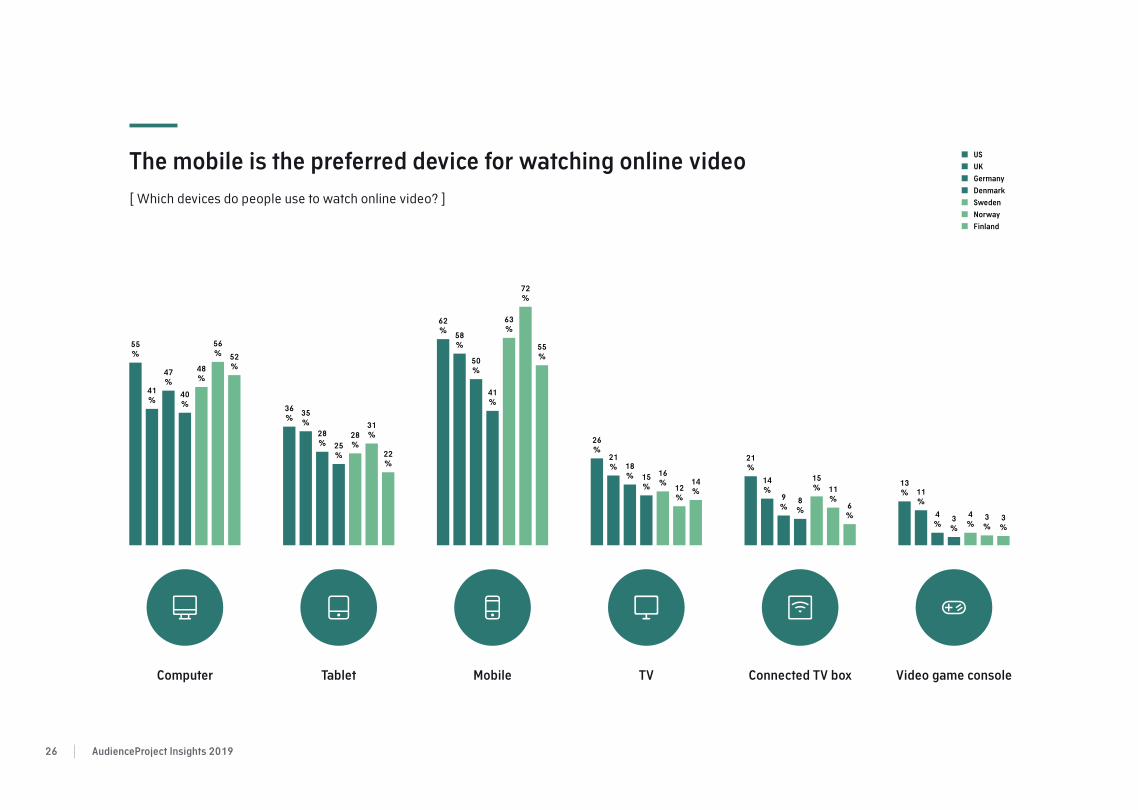
The mobile is the preferred device for watching online video
[ Which devices do people use to watch online video? ]
TVComputer Tablet Mobile Video game console
US
UK
Germany
Denmark
Sweden
72
%
Norway
Finland
55
%
63
%
41
%
50
%
58
%
62
%
31
%
22
%
28
%25
%
28
%
35
%
36
%
56
% 52
%48
%
40
%
47
%41
%
55
%
12
%
14
%
16
%15
%
18
%
21
%
26
%
11
%6
%
15
%
8
%
9
%
14
%
21
%
3
%3
%
4
%3
%
4
%
11
%
13
%
Connected TV box
AudienceProject Insights 201926

Top online video platforms in the US
[ Which platforms do Americans use to watch online video? ]
YouTube 90%
Snapchat
CNN
Fox News
BBC
MSNBC
Vimeo
The New York Times
Twitch
Dailymotion
Other news sites
Other social media
60%
35%
21%
18%
17%
16%
12%
10%
9%
8%
8%
6%
6%
5%...
...
Note: The figures represent the platforms that are used by the ones who have watched online video within the last week
AudienceProject Insights 2019 27
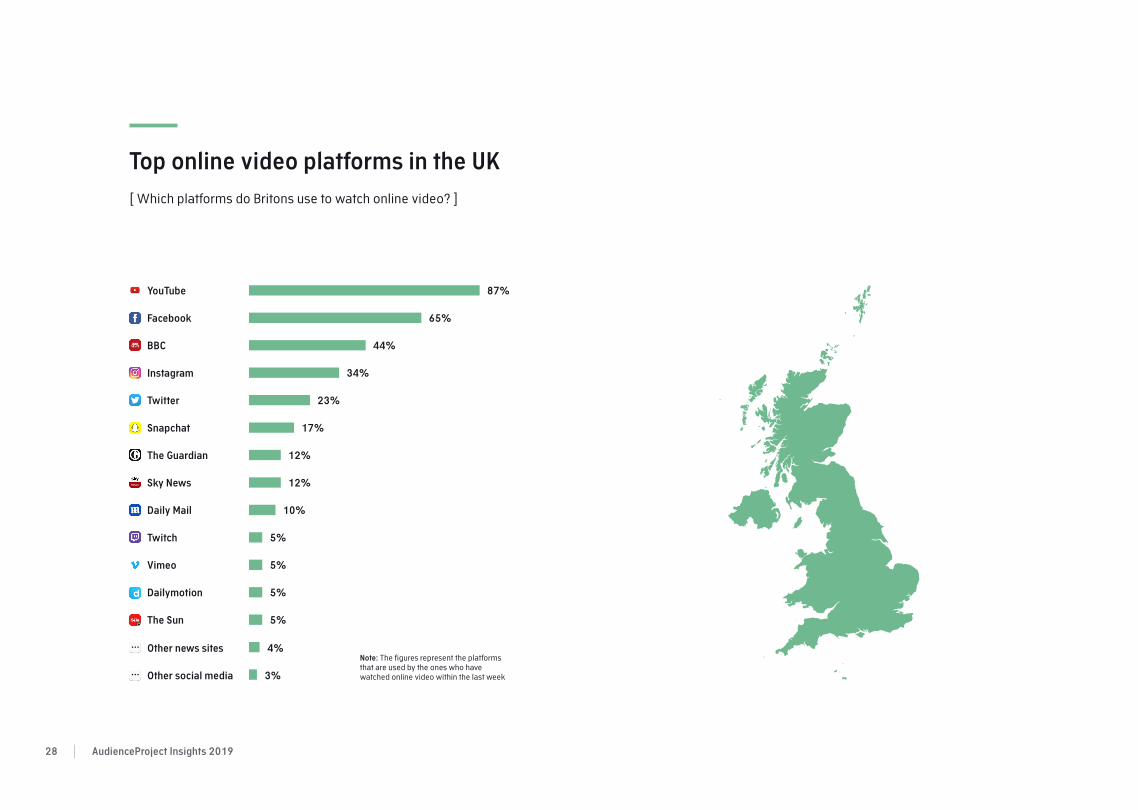
Top online video platforms in the UK
[ Which platforms do Britons use to watch online video? ]
YouTube 87%
BBC
Snapchat
The Guardian
Sky News
Daily Mail
Twitch
Vimeo
Dailymotion
The Sun
Other news sites
Other social media
65%
44%
34%
23%
17%
12%
12%
10%
5%
5%
5%
5%
4%
3%...
...
Note: The figures represent the platforms that are used by the ones who have watched online video within the last week
AudienceProject Insights 201928
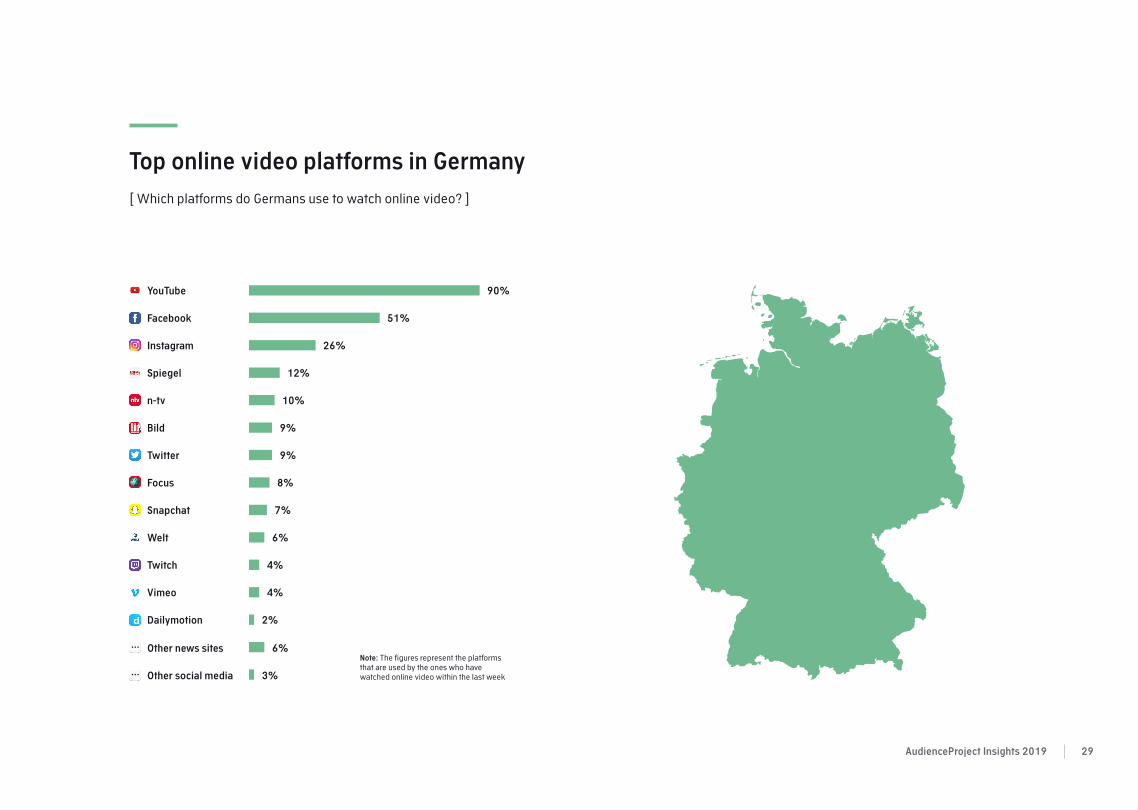
Top online video platforms in Germany
[ Which platforms do Germans use to watch online video? ]
YouTube 90%
Spiegel
n-tv
Bild
Focus
Snapchat
Welt
Twitch
Vimeo
Dailymotion
Other news sites
Other social media
51%
26%
12%
10%
9%
9%
8%
7%
6%
4%
4%
2%
6%
3%...
...
Note: The figures represent the platforms that are used by the ones who have watched online video within the last week
AudienceProject Insights 2019 29
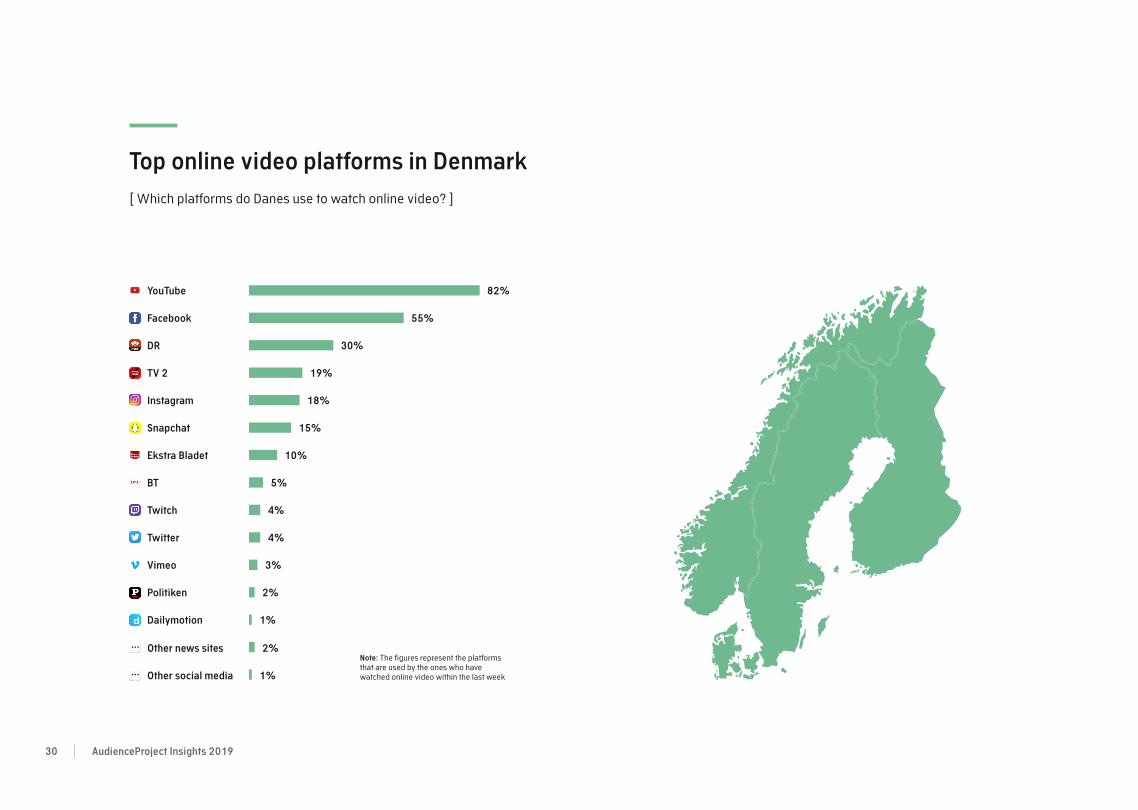
Top online video platforms in Denmark
[ Which platforms do Danes use to watch online video? ]
YouTube 82%
DR
TV 2
Snapchat
Ekstra Bladet
BT
Twitch
Vimeo
Politiken
Dailymotion
Other news sites
Other social media
55%
30%
19%
18%
15%
10%
5%
4%
4%
3%
2%
1%
2%
1%...
...
Note: The figures represent the platforms that are used by the ones who have watched online video within the last week
AudienceProject Insights 201930

Top online video platforms in Sweden
[ Which platforms do Swedes use to watch online video? ]
YouTube 84%
SVT
Aftonbladet
Snapchat
Expressen
Twitch
Dagens Nyheter
Vimeo
Svenska Dagbladet
Dailymotion
Other news sites
Other social media
58%
41%
39%
29%
19%
16%
8%
5%
5%
4%
3%
2%
5%
3%...
...
Note: The figures represent the platforms that are used by the ones who have watched online video within the last week
AudienceProject Insights 2019 31

Top online video platforms in Norway
[ Which platforms do Norwegians use to watch online video? ]
YouTube 79%
VG
Snapchat
NRK
TV 2
Dagbladet
Aftenposten
Vimeo
Twitch
Dailymotion
Other news sites
Other social media
71%
44%
41%
37%
36%
29%
18%
7%
7%
4%
3%
1%
4%
2%...
...
Note: The figures represent the platforms that are used by the ones who have watched online video within the last week
AudienceProject Insights 201932

Top online video platforms in Finland
[ Which platforms do Finns use to watch online video? ]
YouTube 86%
Yle
Ilta-Sanomat
Iltalehti
MTV
Snapchat
Helsingin Sanomat
Vimeo
Twitch
Dailymotion
Other news sites
Other social media
54%
34%
33%
30%
28%
18%
14%
10%
8%
3%
3%
2%
3%
3%...
...
Note: The figures represent the platforms that are used by the ones who have watched online video within the last week
AudienceProject Insights 2019 33

AudienceProject Insights 201934
Streaming becomes a bigger and bigger challenge for the traditional TV
industry. Half of people are streaming and, among the young in some
countries, streaming is more common than watching traditional TV. Netflix
keeps increasing its dominance and is now the number one streaming
service in all countries - except for Finland where Yle Areena takes the lead.
STREAMING
AudienceProject Insights 2019 35
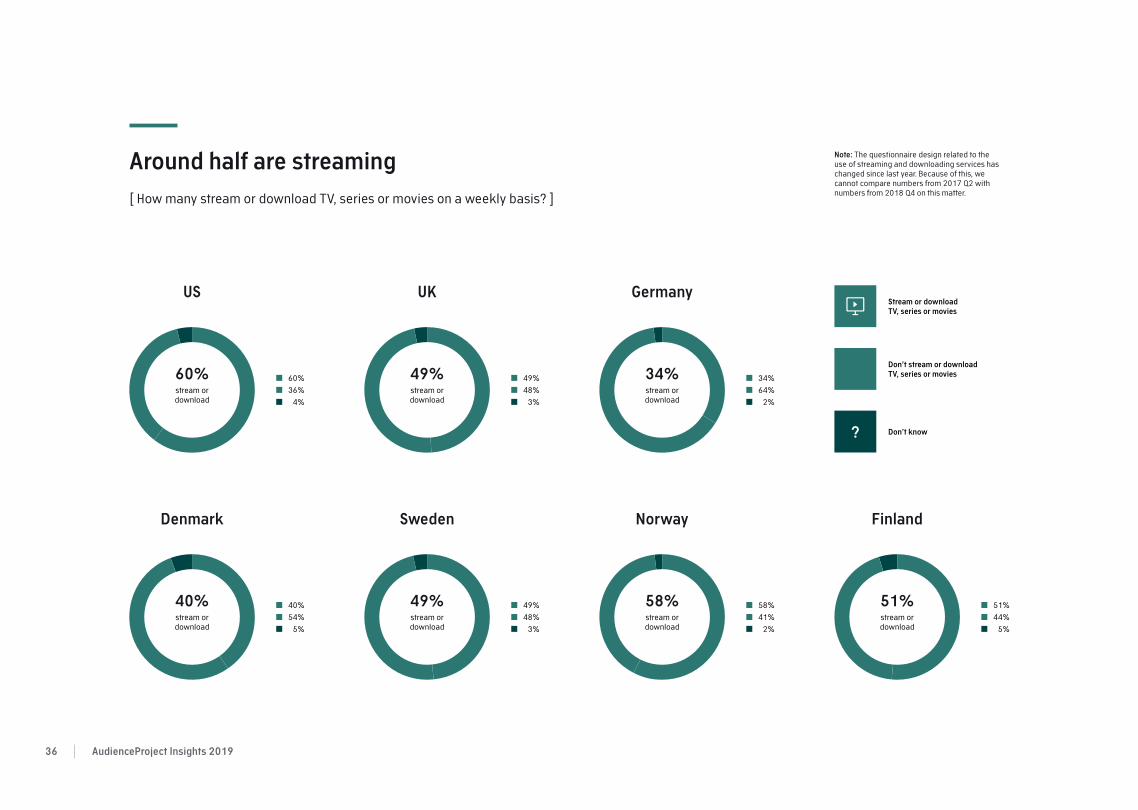
Around half are streaming
[ How many stream or download TV, series or movies on a weekly basis? ]
Denmark
GermanyUKUS
Sweden Norway Finland
60%
36%
4%
60%stream or download
49%
48%
3%
34%
64%
2%
40%
54%
5%
49%
48%
3%
58%
41%
2%
51%
44%
5%
49%stream or download
34%stream or download
40%stream or download
49%stream or download
58%stream or download
51%stream or download
Stream or download
TV, series or movies
Don’t know?
Don’t stream or download
TV, series or movies
Note: The questionnaire design related to the use of streaming and downloading services has changed since last year. Because of this, we cannot compare numbers from 2017 Q2 with numbers from 2018 Q4 on this matter.
AudienceProject Insights 201936

Younger people more likely to stream
[ How many stream or download TV, series or movies on a weekly basis? ]
46-5515-25 26-35 36-45 56+
US
UK
Germany
Denmark
Sweden
34%
51%
33%29%
32%
21%19%
49%
63%
42%
52%50%
42%
30%
54%
69%
59%
65%62%
50%
45%
63%65% 66%
76%
68%
53%
46%
63%60%
68%
82%
62%
53%52%
Norway
Finland
AudienceProject Insights 2019 37
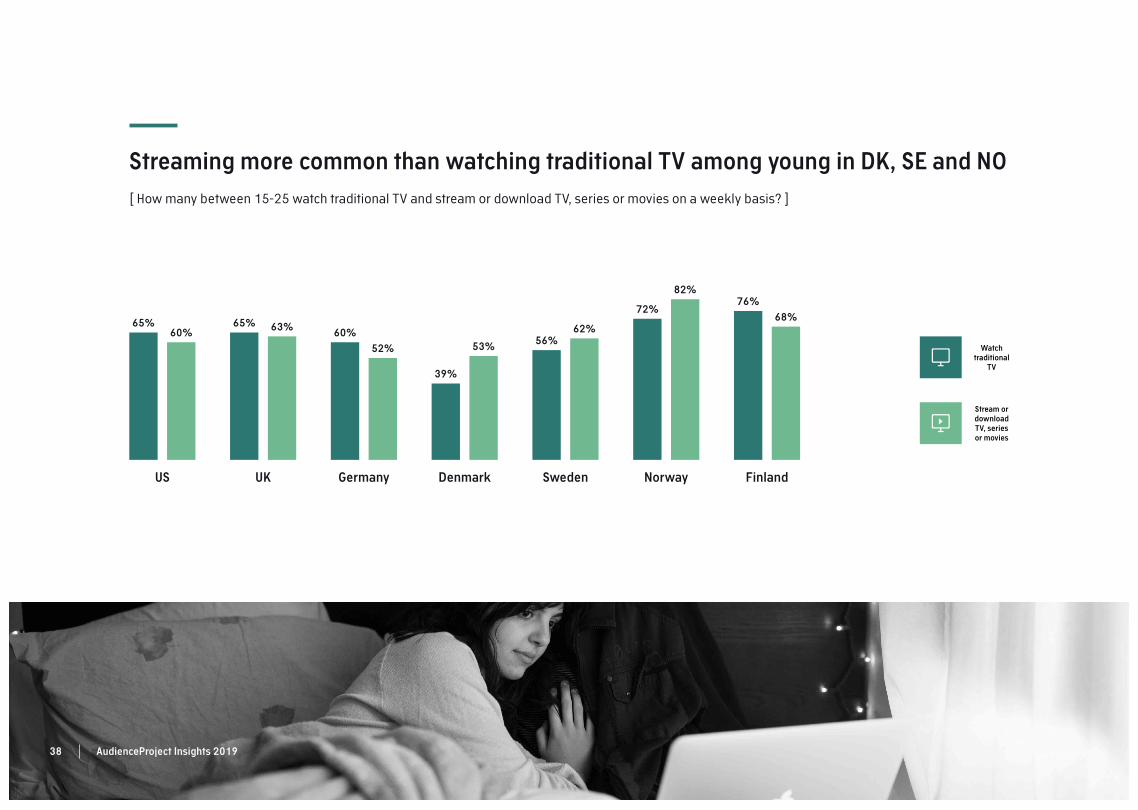
Streaming more common than watching traditional TV among young in DK, SE and NO
[ How many between 15-25 watch traditional TV and stream or download TV, series or movies on a weekly basis? ]
US UK Germany Denmark Sweden Norway Finland
Watch
traditional
TV
Stream or
download
TV, series
or movies
82%
72%68%
76%
62%56%
53%
39%
52%
60%63%65%
60%65%
AudienceProject Insights 201938
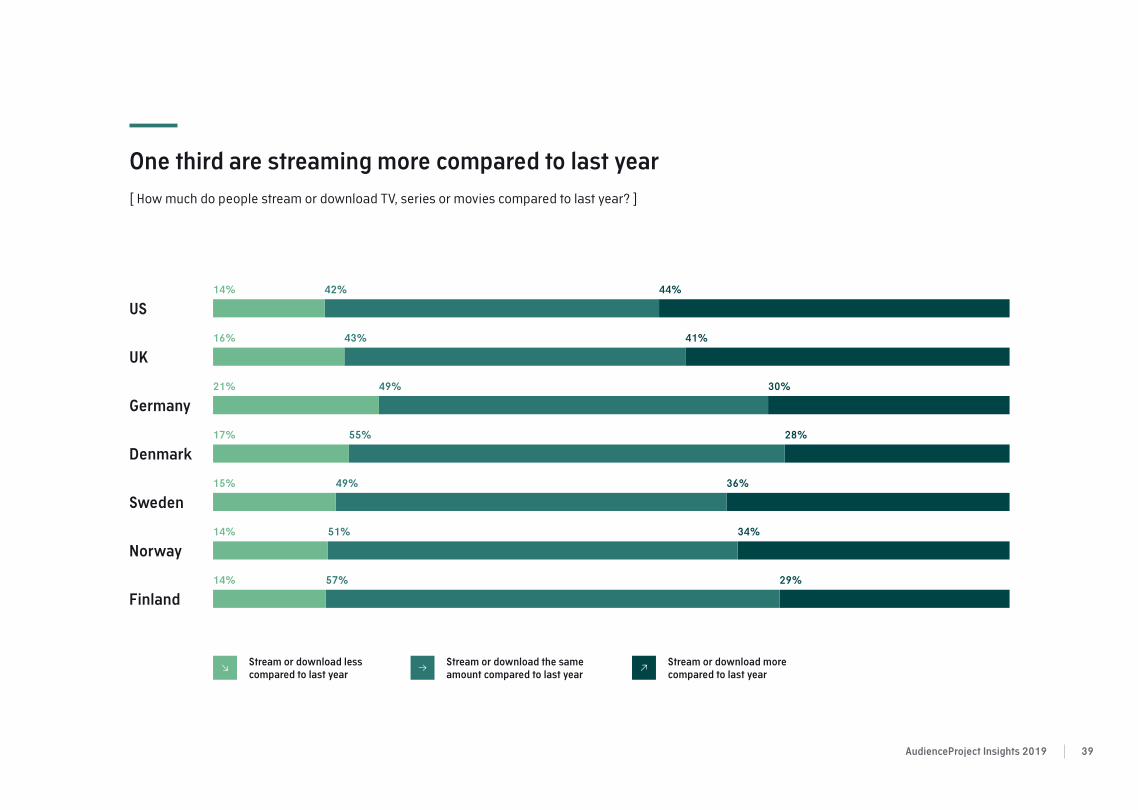
One third are streaming more compared to last year
[ How much do people stream or download TV, series or movies compared to last year? ]
Denmark
Sweden
Norway
Finland
Germany
UK
US
14%
Stream or download less
compared to last year
Stream or download the same
amount compared to last year
Stream or download more
compared to last year
42% 44%
16% 43% 41%
21% 49% 30%
17% 55% 28%
15% 49% 36%
14% 51% 34%
14% 57% 29%
AudienceProject Insights 2019 39
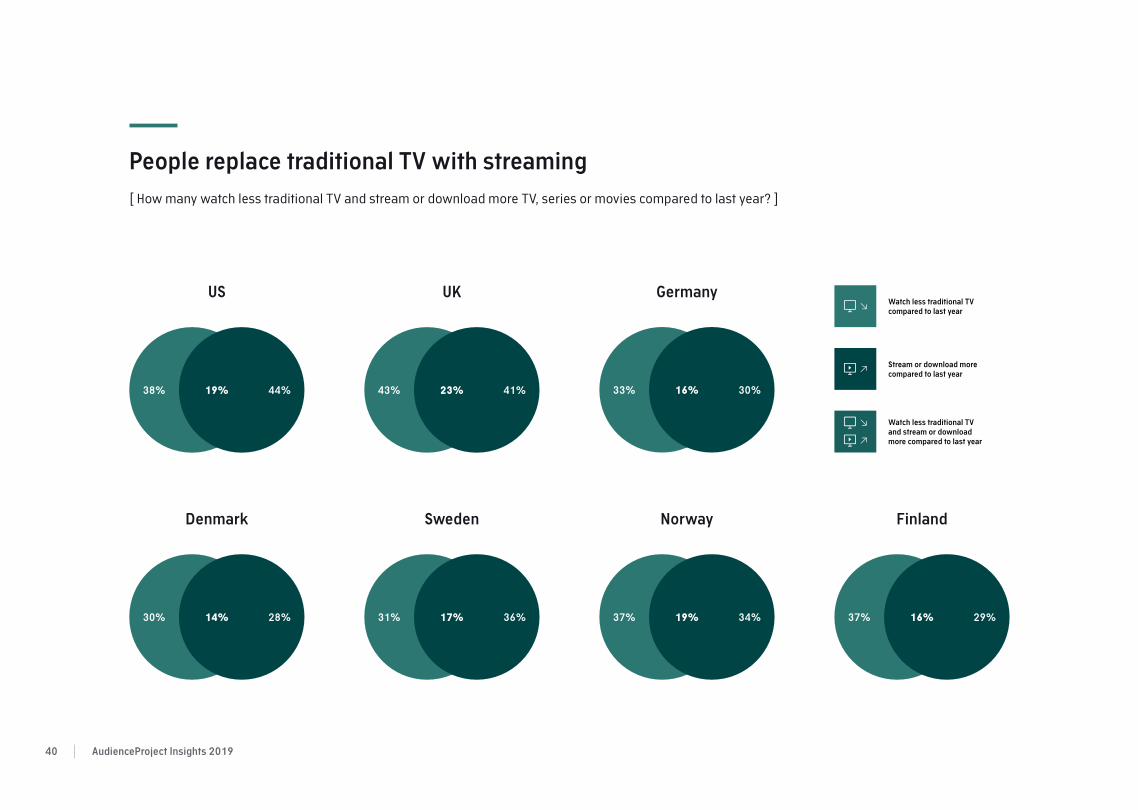
People replace traditional TV with streaming
[ How many watch less traditional TV and stream or download more TV, series or movies compared to last year? ]
Denmark
GermanyUKUS
Sweden Norway Finland
Watch less traditional TV
compared to last year
Watch less traditional TV
and stream or download
more compared to last year
Stream or download more
compared to last year
44%38% 19% 41%43% 23% 30%33% 16%
28%30% 14% 36%31% 17% 34%37% 19% 29%37% 16%
AudienceProject Insights 201940
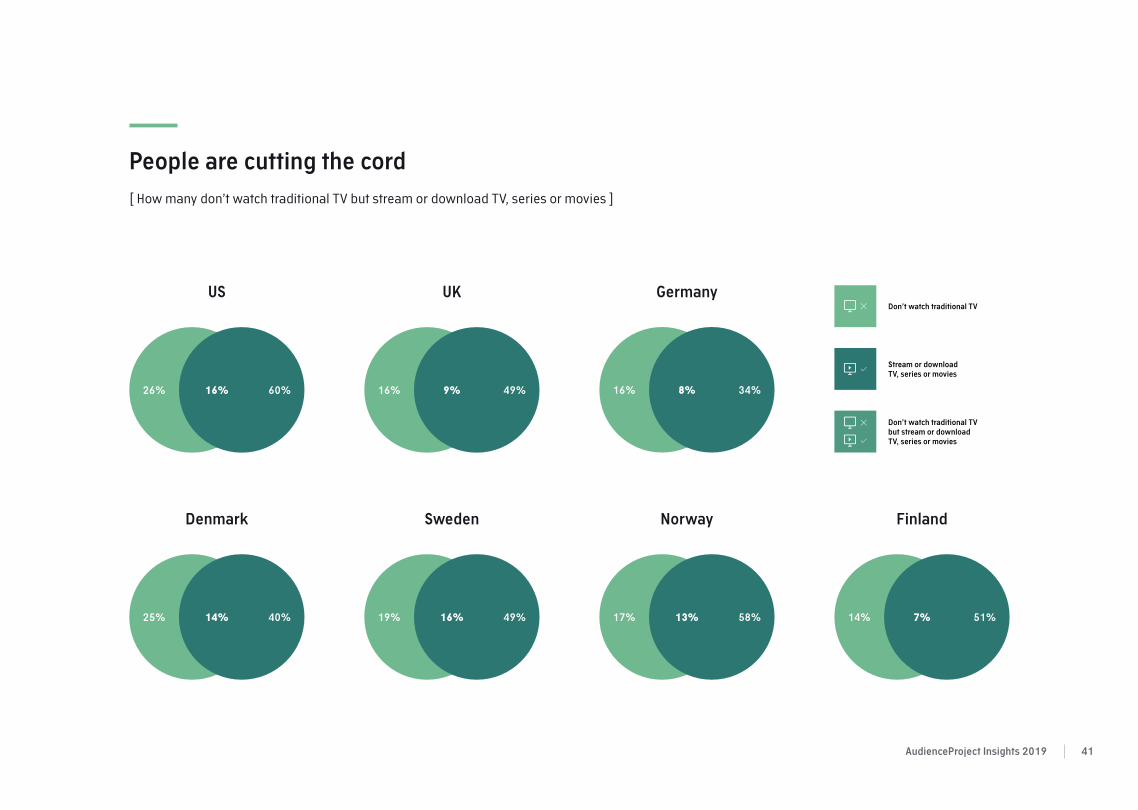
People are cutting the cord
[ How many don’t watch traditional TV but stream or download TV, series or movies ]
Denmark
GermanyUKUS
Sweden Norway Finland
Don’t watch traditional TV
Don’t watch traditional TV
but stream or download
TV, series or movies
Stream or download
TV, series or movies
60%26% 16% 49%16% 9% 34%16% 8%
40%25% 14% 49%19% 16% 58%17% 13% 51%14% 7%
AudienceProject Insights 2019 41
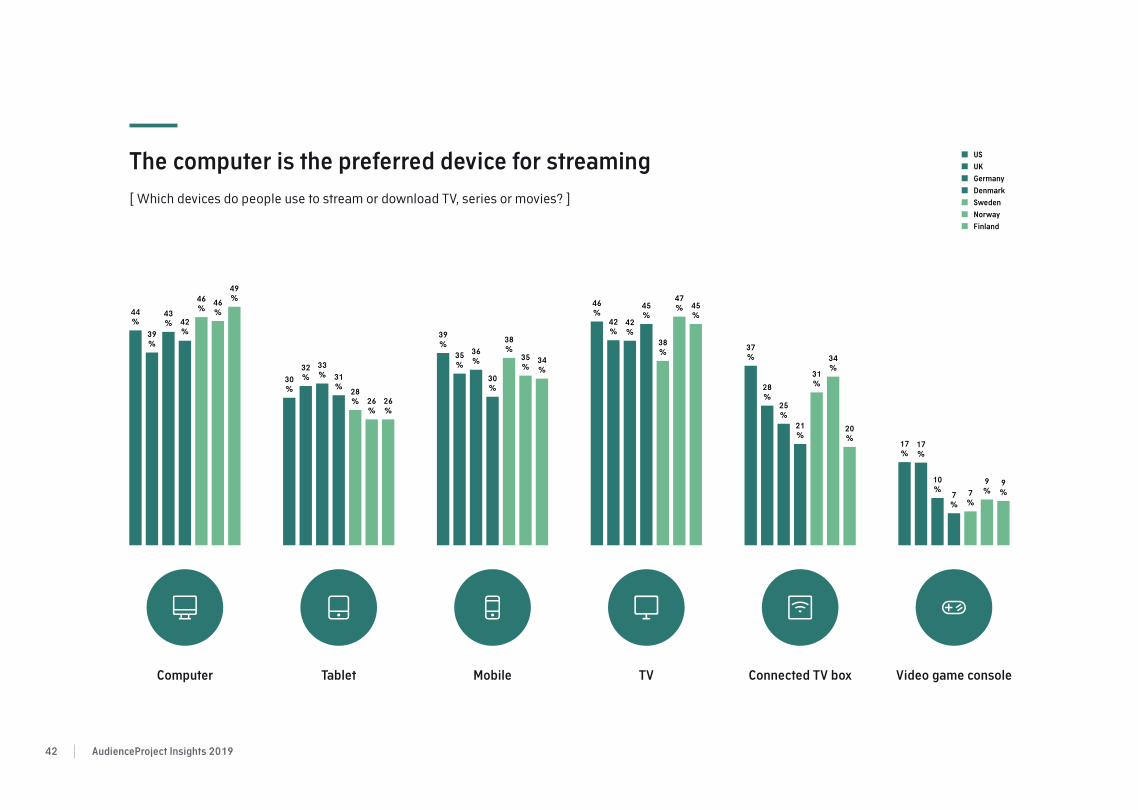
The computer is the preferred device for streaming
[ Which devices do people use to stream or download TV, series or movies? ]
US
UK
Germany
Denmark
Sweden
Norway
Finland
TVComputer Tablet Mobile Video game console
35
%34
%
38
%
30
%
36
%35
%
39
%
26
%
26
%
28
%
31
%
33
%32
%30
%
46
%
49
%46
%
42
%
43
%
39
%
44
%
47
% 45
%
38
%
45
%42
%
42
%
46
%
34
%
20
%
31
%
21
%
25
%
28
%
37
%
9
%9
%7
%7
%
10
%
17
%
17
%
Connected TV box
AudienceProject Insights 201942

Top streaming and downloading services in the US
[ Which streaming and downloading services do Americans use to watch TV, series or movies? ]
Note: The figures represent the streaming and downloading services that are used by the ones who have used a streaming or downloading service to watch TV, series or movies within the last week
Netflix
79% 2017 (Q2)
2018 (Q4)
78%
55%
42%
53%
56%
40%
31%
13%15%
11%
14%
10%
14%
10%10%9%
N/A
6%5%
4%6%
11%11%
Amazon
Prime
Video
YouTube Hulu HBO Go HBO Now Google
Play
iTunes Facebook
Watch
Sling TV Play-
Station
Vue
Other
...
AudienceProject Insights 2019 43
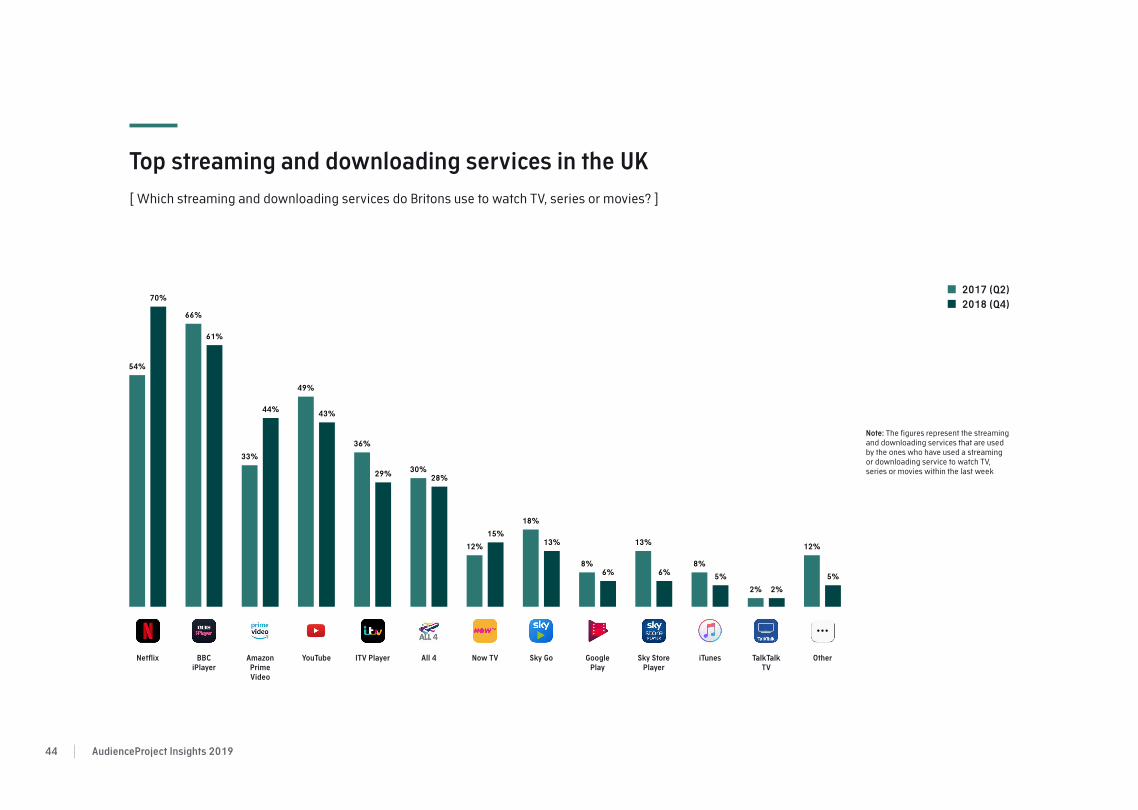
Top streaming and downloading services in the UK
[ Which streaming and downloading services do Britons use to watch TV, series or movies? ]
Note: The figures represent the streaming and downloading services that are used by the ones who have used a streaming or downloading service to watch TV, series or movies within the last week
Netflix
70%
54%
61%
66%
44%
33%
43%
49%
29%
36%
28%30%
15%
12%13%
18%
6%8%
6%
13%
5%
8%
2%2%
5%
12%
BBC
iPlayer
Amazon
Prime
Video
YouTube ITV Player All 4 Now TV Sky Go Google
Play
Sky Store
Player
iTunes TalkTalk
TV
Other
2017 (Q2)
2018 (Q4)
...
AudienceProject Insights 201944
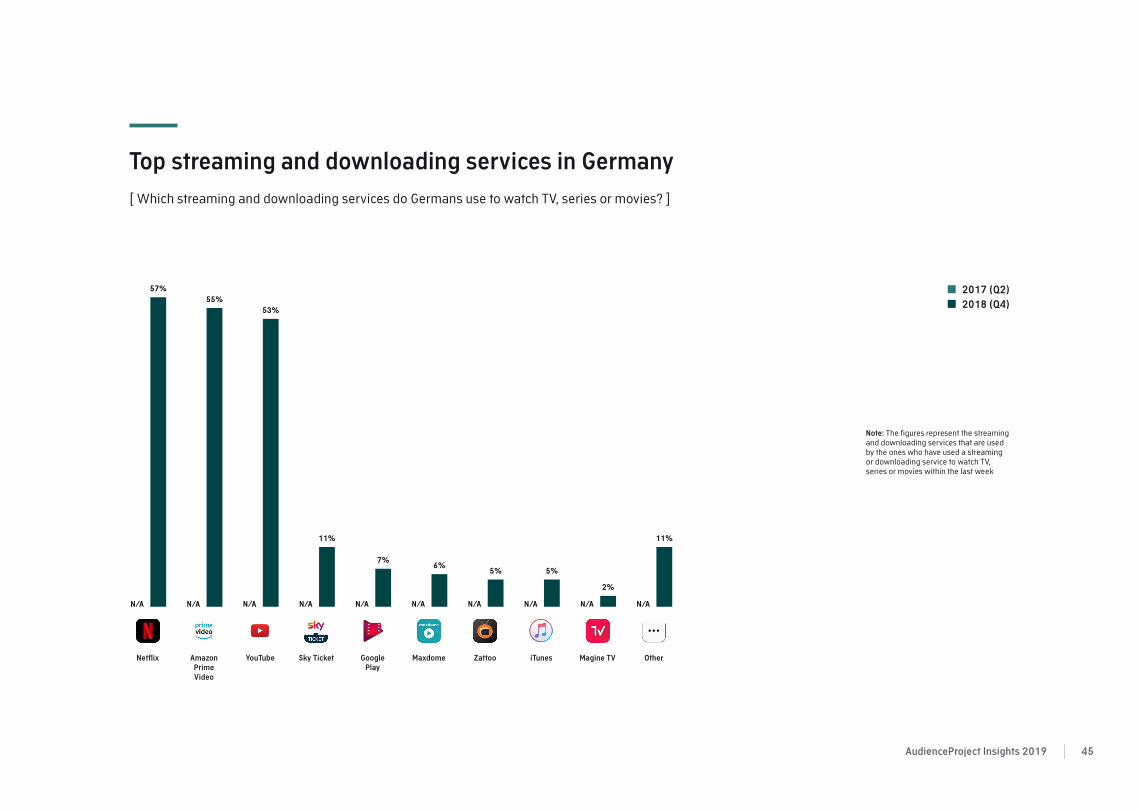
Top streaming and downloading services in Germany
[ Which streaming and downloading services do Germans use to watch TV, series or movies? ]
Note: The figures represent the streaming and downloading services that are used by the ones who have used a streaming or downloading service to watch TV, series or movies within the last week
Netflix
57%
N/A
55%
N/A
53%
N/A
11%
N/A
7%
N/A
6%
N/A
5%
N/A
5%
N/A
2%
N/A
11%
N/A
Amazon
Prime
Video
YouTube Sky Ticket Google
Play
Maxdome Zattoo iTunes Magine TV Other
2017 (Q2)
2018 (Q4)
...
AudienceProject Insights 2019 45

Top streaming and downloading services in Denmark
[ Which streaming and downloading services do Danes use to watch TV, series or movies? ]
Note: The figures represent the streaming and downloading services that are used by the ones who have used a streaming or downloading service to watch TV, series or movies within the last week
Netflix
67%
64%
44%
53%
37%
21%
30%
41%
28%
21%19%
20%
9%
5%6%
2%
6%4%
3%5%
3%3% 3%1%
3%1% 1%
3%
6%
12%
DR TV Viaplay YouTube TV 2 Play HBO
Nordic
C More Dplay Viafree iTunes Film-
striben
Amazon
Prime
Video
Play
Block-
buster
Other
2017 (Q2)
2018 (Q4)
...
AudienceProject Insights 201946
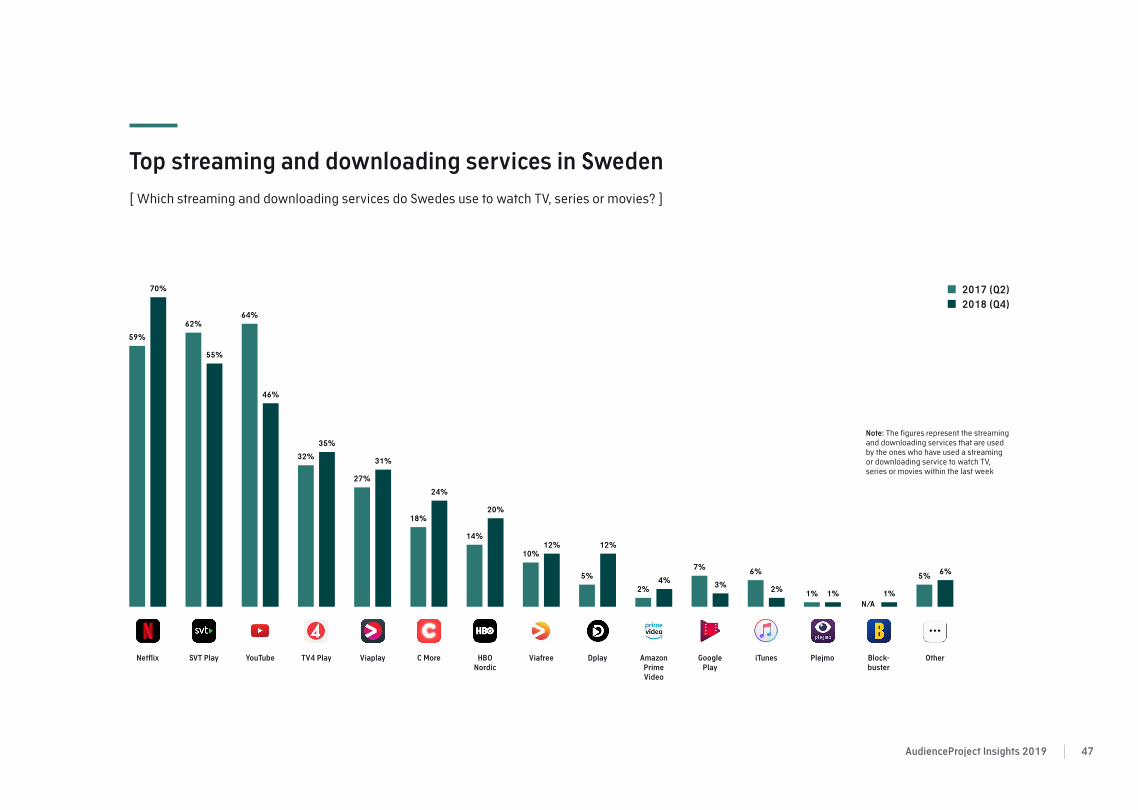
Top streaming and downloading services in Sweden
[ Which streaming and downloading services do Swedes use to watch TV, series or movies? ]
Note: The figures represent the streaming and downloading services that are used by the ones who have used a streaming or downloading service to watch TV, series or movies within the last week
Netflix
70%
59%
55%
62%
46%
64%
35%
32%31%
27%
24%
18%20%
14%12%
10%12%
5%4%
2%3%
7%
2%
6%
1%1%
SVT Play YouTube TV4 Play Viaplay C More HBO
Nordic
Viafree Dplay Amazon
Prime
Video
Play
iTunes Plejmo
2017 (Q2)
2018 (Q4)
Block-
buster
Other
6%5%
1%
N/A
...
AudienceProject Insights 2019 47
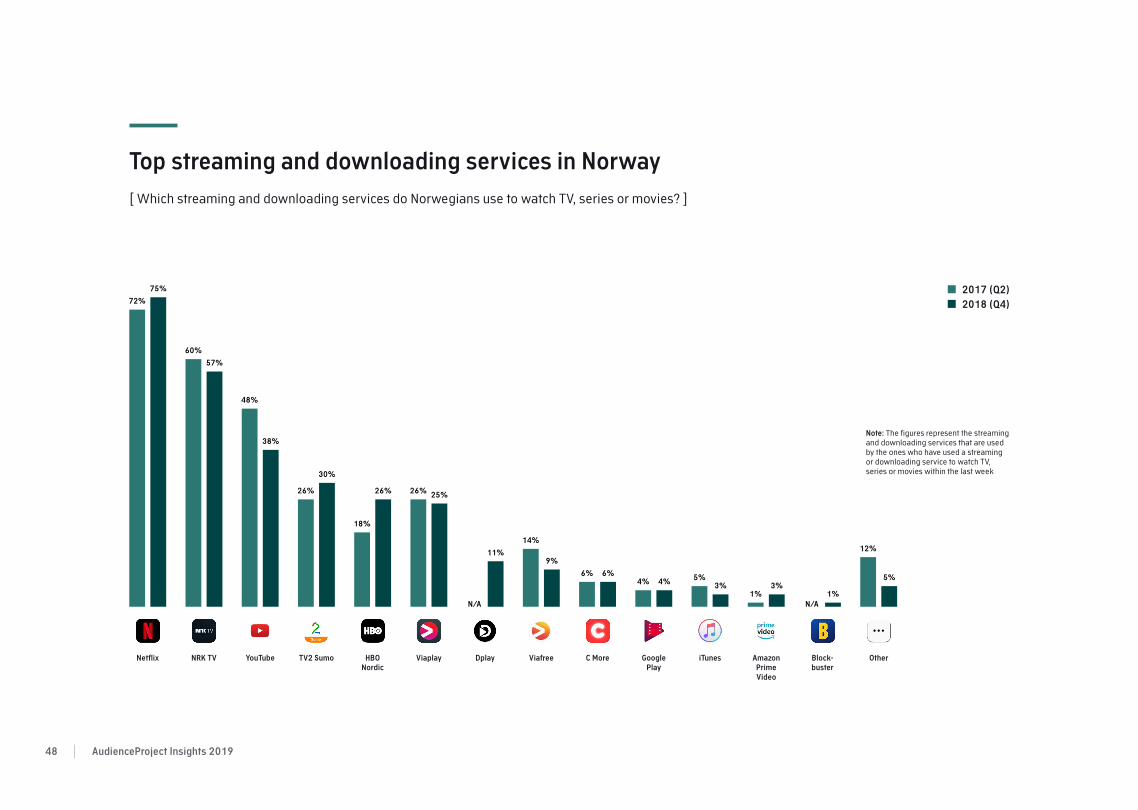
Top streaming and downloading services in Norway
[ Which streaming and downloading services do Norwegians use to watch TV, series or movies? ]
Note: The figures represent the streaming and downloading services that are used by the ones who have used a streaming or downloading service to watch TV, series or movies within the last week
Netflix
75%
72%
57%
60%
38%
48%
30%
26% 26%
18%
25%26%
11%
N/A
9%
14%
6%6%4%4%
3%5%
3%1% 1%
N/A
NRK TV YouTube TV2 Sumo HBO
Nordic
Viaplay Dplay Viafree C More Google
Play
iTunes Amazon
Prime
Video
Block-
buster
2017 (Q2)
2018 (Q4)
Other
5%
12%
...
AudienceProject Insights 201948

Top streaming and downloading services in Finland
[ Which streaming and downloading services do Finns use to watch TV, series or movies? ]
Note: The figures represent the streaming and downloading services that are used by the ones who have used a streaming or downloading service to watch TV, series or movies within the last week
Yle Areena
65%
56% 56%
53%
42%
47%
36%
27%
36%
32%
16%
9%
15%
11%
15%14%
4%4%
2%1% 1%
2%
6%7%
Netflix YouTube Ruutu MTV
Katsomo
C More HBO
Nordic
Viaplay Google
Play
Amazon
Prime
Video
iTunes Other
2017 (Q2)
2018 (Q4)
...
AudienceProject Insights 2019 49
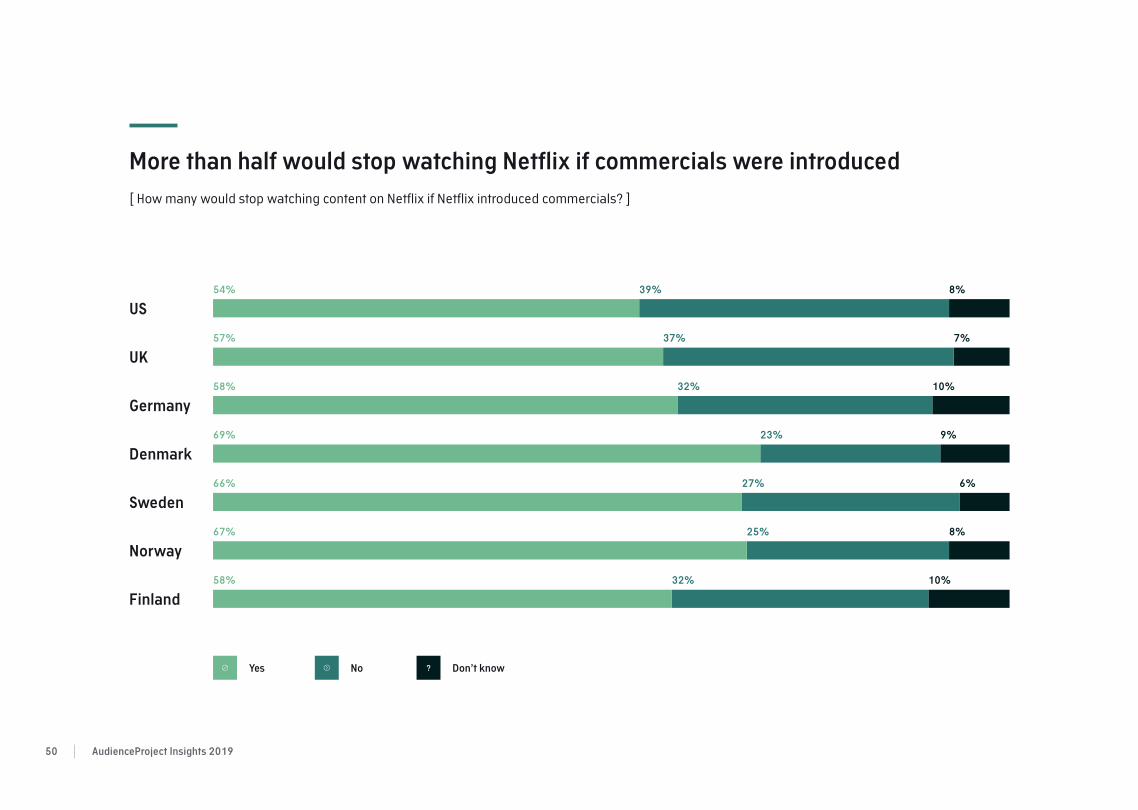
More than half would stop watching Netflix if commercials were introduced
[ How many would stop watching content on Netflix if Netflix introduced commercials? ]
Denmark
Sweden
Norway
Finland
Germany
UK
US
54%
Yes No Don’t know
39% 8%
57% 37% 7%
58% 32% 10%
69% 23% 9%
66% 27% 6%
67% 25% 8%
58% 32% 10%
?
AudienceProject Insights 201950
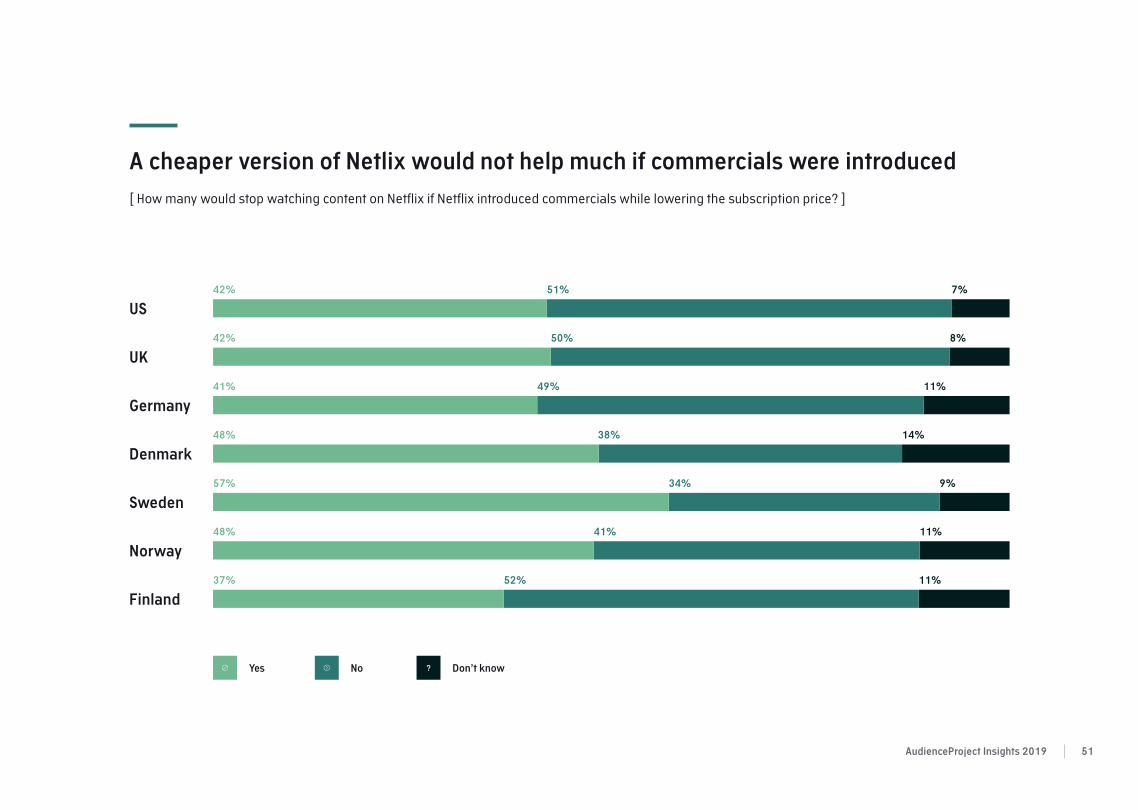
A cheaper version of Netlix would not help much if commercials were introduced
[ How many would stop watching content on Netflix if Netflix introduced commercials while lowering the subscription price? ]
Denmark
Sweden
Norway
Finland
Germany
UK
US
42% 51% 7%
42% 50% 8%
41% 49% 11%
48% 38% 14%
57% 34% 9%
48% 41% 11%
37% 52% 11%
Yes No Don’t know?
AudienceProject Insights 2019 51
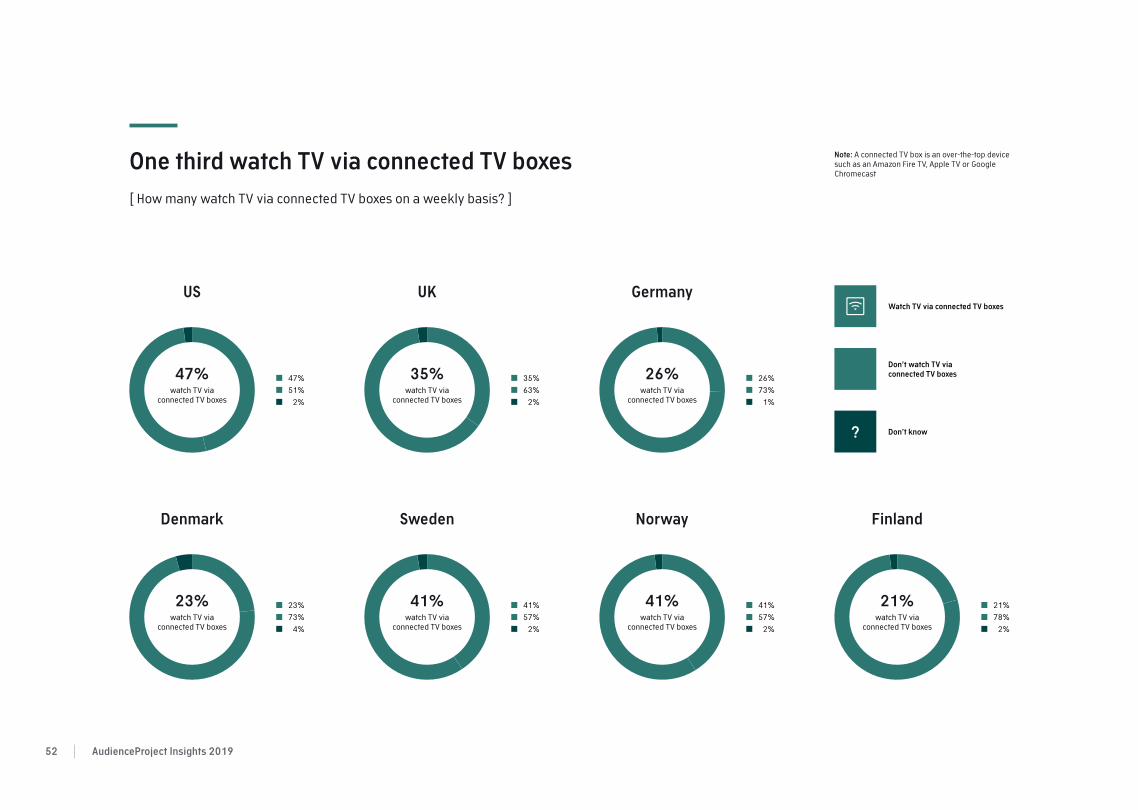
One third watch TV via connected TV boxes
[ How many watch TV via connected TV boxes on a weekly basis? ]
Denmark
GermanyUKUS
Sweden Norway Finland
47%
51%
2%
47%watch TV via
connected TV boxes
35%
63%
2%
26%
73%
1%
23%
73%
4%
41%
57%
2%
41%
57%
2%
21%
78%
2%
35%watch TV via
connected TV boxes
26%watch TV via
connected TV boxes
23%watch TV via
connected TV boxes
41%watch TV via
connected TV boxes
41%watch TV via
connected TV boxes
21%watch TV via
connected TV boxes
Watch TV via connected TV boxes
Don’t know?
Don’t watch TV via
connected TV boxes
Note: A connected TV box is an over-the-top device such as an Amazon Fire TV, Apple TV or Google Chromecast
AudienceProject Insights 201952

A quarter watch more TV via connected TV boxes compared to last year
[ How much TV via connected TV boxes do people watch compared to last year? ]
Denmark
Sweden
Norway
Finland
Germany
UK
US
22%
Watch less TV via connected
TV boxes compared to last year
Watch the same amount of TV via connected
TV boxes compared to last year
Watch more TV via connected
TV boxes compared to last year
46% 32%
23% 52% 25%
19% 52% 28%
23% 60% 17%
19% 55% 27%
16% 54% 30%
19% 58% 23%
AudienceProject Insights 2019 53

AudienceProject Insights 201954
ABOUT THE STUDY
Methodology
The study is a part of AudienceProject Insights 2019. Data is collected through
online surveys done in Q4 2018. The respondents have been selected from our
Nordic, German, UK and US panels consisting of more than 1.5 million panelists
and weighed to achieve representativity on the more than 16.000 respondents
who completed the survey.
Editor & Data
Rune Werliin
+45 60 17 77 76
Text & Design
Martin Kokholm
+45 25 61 32 19
Contact
Website
www.audienceproject.com
@Audience_P
#apinsights2019
About AudienceProject
AudienceProject is a marketing tech-
nology company founded in Denmark
and operational worldwide. Based on
its proprietary tech stack and more than
1.5 million panelists worldwide, Audi-
enceProject helps brands, agencies and
publishers identify, target and validate
audiences.
AudienceProject Insights 2019 55