Embed Size (px)
Citation preview
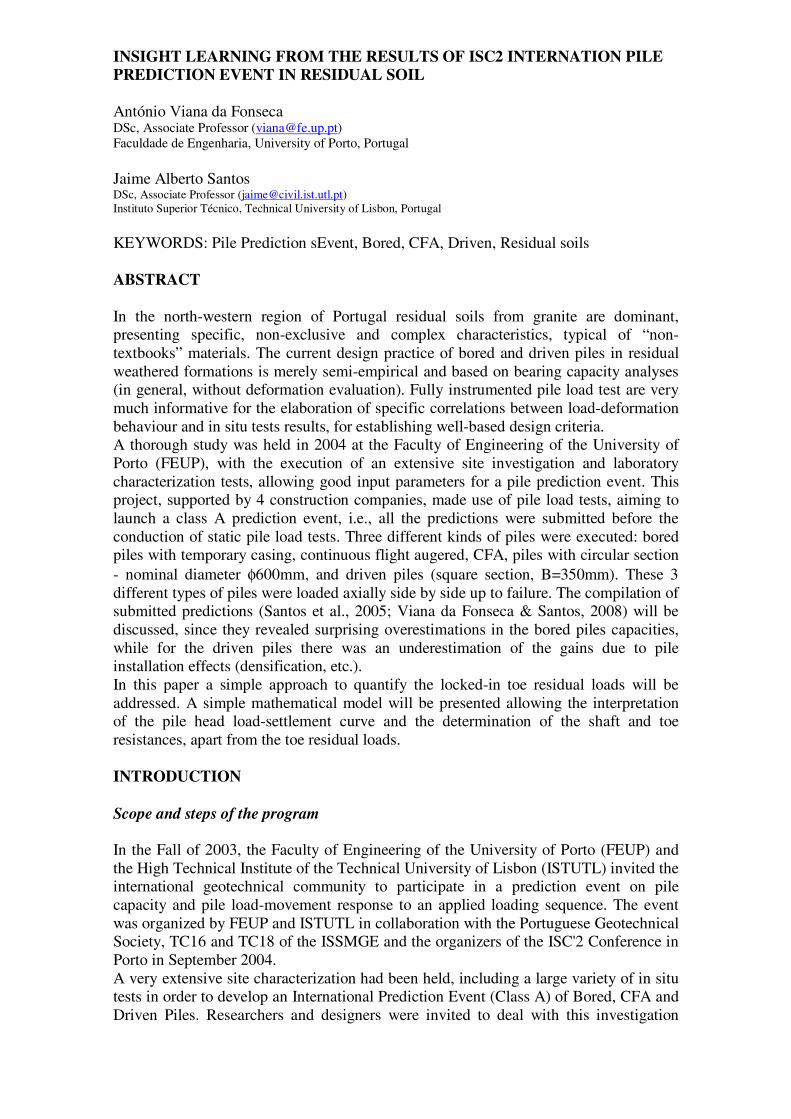
INSIGHT LEARNING FROM THE RESULTS OF ISC2 INTERNATION PILE PREDICTION EVENT IN RESIDUAL SOIL António Viana da Fonseca DSc, Associate Professor ([email protected]) Faculdade de Engenharia, University of Porto, Portugal Jaime Alberto Santos DSc, Associate Professor ([email protected]) Instituto Superior Técnico, Technical University of Lisbon, Portugal
KEYWORDS: Pile Prediction sEvent, Bored, CFA, Driven, Residual soils ABSTRACT In the north-western region of Portugal residual soils from granite are dominant, presenting specific, non-exclusive and complex characteristics, typical of “non-textbooks” materials. The current design practice of bored and driven piles in residual weathered formations is merely semi-empirical and based on bearing capacity analyses (in general, without deformation evaluation). Fully instrumented pile load test are very much informative for the elaboration of specific correlations between load-deformation behaviour and in situ tests results, for establishing well-based design criteria. A thorough study was held in 2004 at the Faculty of Engineering of the University of Porto (FEUP), with the execution of an extensive site investigation and laboratory characterization tests, allowing good input parameters for a pile prediction event. This project, supported by 4 construction companies, made use of pile load tests, aiming to launch a class A prediction event, i.e., all the predictions were submitted before the conduction of static pile load tests. Three different kinds of piles were executed: bored piles with temporary casing, continuous flight augered, CFA, piles with circular section - nominal diameter φ600mm, and driven piles (square section, B=350mm). These 3 different types of piles were loaded axially side by side up to failure. The compilation of submitted predictions (Santos et al., 2005; Viana da Fonseca & Santos, 2008) will be discussed, since they revealed surprising overestimations in the bored piles capacities, while for the driven piles there was an underestimation of the gains due to pile installation effects (densification, etc.). In this paper a simple approach to quantify the locked-in toe residual loads will be addressed. A simple mathematical model will be presented allowing the interpretation of the pile head load-settlement curve and the determination of the shaft and toe resistances, apart from the toe residual loads. INTRODUCTION Scope and steps of the program
In the Fall of 2003, the Faculty of Engineering of the University of Porto (FEUP) and the High Technical Institute of the Technical University of Lisbon (ISTUTL) invited the international geotechnical community to participate in a prediction event on pile capacity and pile load-movement response to an applied loading sequence. The event was organized by FEUP and ISTUTL in collaboration with the Portuguese Geotechnical Society, TC16 and TC18 of the ISSMGE and the organizers of the ISC'2 Conference in Porto in September 2004. A very extensive site characterization had been held, including a large variety of in situ tests in order to develop an International Prediction Event (Class A) of Bored, CFA and Driven Piles. Researchers and designers were invited to deal with this investigation
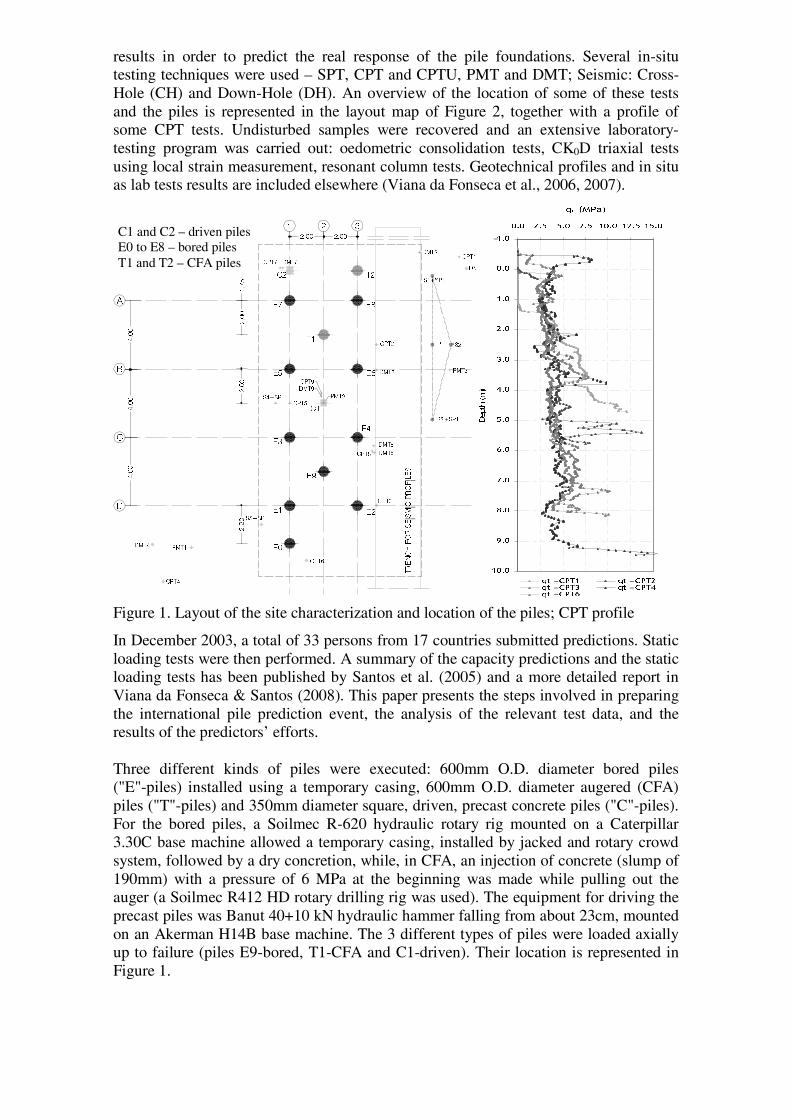
results in order to predict the real response of the pile foundations. Several in-situ testing techniques were used – SPT, CPT and CPTU, PMT and DMT; Seismic: Cross-Hole (CH) and Down-Hole (DH). An overview of the location of some of these tests and the piles is represented in the layout map of Figure 2, together with a profile of some CPT tests. Undisturbed samples were recovered and an extensive laboratory-testing program was carried out: oedometric consolidation tests, CK0D triaxial tests using local strain measurement, resonant column tests. Geotechnical profiles and in situ as lab tests results are included elsewhere (Viana da Fonseca et al., 2006, 2007).
PMT2S4+SPT
PMT1DMT4
CPT4
D
E0
CPT6
S5+SPT
E1
C
E9
E3
CPT5
C1
TRENCH FOR SEISMIC PROFILES
CPT3
E2
S3+SPT
DMT8
CPT8
E4
2
E7A
BE5
CPT9
DMT9
T1
C2
DMT7CPT7
1
E8
S2
PMT3DMT3E6
CPT2 P
DMT2
T2S1+SPT
3
CPT1
DMT1
2.00
2.20
2.00
1.75
2.00
2.00
4.00
4.00
4.00
DMT6
Figure 1. Layout of the site characterization and location of the piles; CPT profile
In December 2003, a total of 33 persons from 17 countries submitted predictions. Static loading tests were then performed. A summary of the capacity predictions and the static loading tests has been published by Santos et al. (2005) and a more detailed report in Viana da Fonseca & Santos (2008). This paper presents the steps involved in preparing the international pile prediction event, the analysis of the relevant test data, and the results of the predictors’ efforts. Three different kinds of piles were executed: 600mm O.D. diameter bored piles ("E"-piles) installed using a temporary casing, 600mm O.D. diameter augered (CFA) piles ("T"-piles) and 350mm diameter square, driven, precast concrete piles ("C"-piles). For the bored piles, a Soilmec R-620 hydraulic rotary rig mounted on a Caterpillar 3.30C base machine allowed a temporary casing, installed by jacked and rotary crowd system, followed by a dry concretion, while, in CFA, an injection of concrete (slump of 190mm) with a pressure of 6 MPa at the beginning was made while pulling out the auger (a Soilmec R412 HD rotary drilling rig was used). The equipment for driving the precast piles was Banut 40+10 kN hydraulic hammer falling from about 23cm, mounted on an Akerman H14B base machine. The 3 different types of piles were loaded axially up to failure (piles E9-bored, T1-CFA and C1-driven). Their location is represented in Figure 1.
-1.0
0.0
1.0
2.0
3.0
4.0
5.0
6.0
7.0
8.0
9.0
10.0
0.0 2.5 5.0 7.5 10.0 12.5 15.0
qc (MPa)
Depth (m)
qt - CPT1 qt - CPT2qt - CPT3 qt - CPT4qt - CPT6
C1 and C2 – driven piles E0 to E8 – bored piles T1 and T2 – CFA piles

The C-piles, namely the one denoted by C1, were driven on September 17, 2003 with a 40 kN drop hammer. The E-piles, namely the E9, were constructed in August 2003 by first using a rotary drilling rig to install a temporary casing that was cleaned out using a 500 mm cleaning bucket. The external diameter of the cutting teeth at bottom of the temporary casing was 620 mm. The concrete was placed by using a drop chute in the water-filled casing. Concrete slump was 180 mm and concrete "over-consumption" was below 10 %. The casing was withdrawn on completion of the concreting. The T-piles, namely the T1, were constructed in August 2003 using a rotary drilling rig and a 600 mm continuous flight auger with a 125 mm I.D. stem. The maximum torque of the rotary head was 120 kNm and the pull-down force was 45 kN. The auger penetration rate was approximately 25 mm/s. The concrete grout was ejected with a 6 MPa pressure at the beginning of the grout line and a steady concrete flow of 700 L/min. Concrete slump was 190 mm and concrete "over-consumption" was 6 %. Illustrations of these piles execution are included in Figure 2. More details of the process may be found in Viana da Fonseca and Santos (2008).
a)
b)
c)
Figure 2. Execution of piles: a) precast concrete driven (“C”); b) bored with temporary casing (“E”); c) CFA (“T”) In January 2004, Piles C1, E9 an T1 were subjected to a static loading test. The piles location and the layout of the testing area is disposed in Figure 3, together with photos of the testing assembling. PILE PREDICTION EVENT The participants were provided information on pile geometry, soil profile, equipment and high strain dynamic tests results. They were challenged to predict the static load bearing behaviour of piles including: (i) a table giving load vs. settlement at the pile head; (ii) parameters and models used; (iii) calculation methodology; (iv) pile base resistance and shaft resistance, separately if applied; (v) ultimate compressive resistance and indication of criteria used to determine the compressive resistance; (vi) allowable bearing capacity and factor of safety, if applied, used to determine such capacity; (vii) explanation of the method used to reach all the previous items.
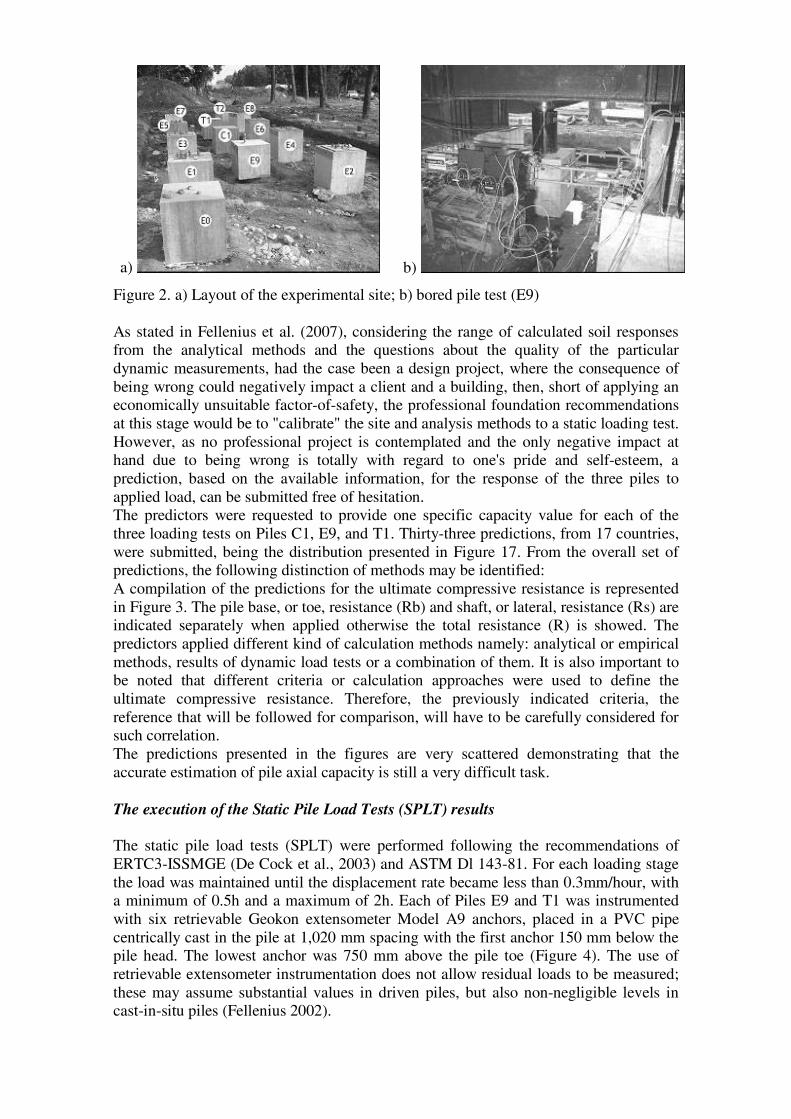
a) b)
Figure 2. a) Layout of the experimental site; b) bored pile test (E9) As stated in Fellenius et al. (2007), considering the range of calculated soil responses from the analytical methods and the questions about the quality of the particular dynamic measurements, had the case been a design project, where the consequence of being wrong could negatively impact a client and a building, then, short of applying an economically unsuitable factor-of-safety, the professional foundation recommendations at this stage would be to "calibrate" the site and analysis methods to a static loading test. However, as no professional project is contemplated and the only negative impact at hand due to being wrong is totally with regard to one's pride and self-esteem, a prediction, based on the available information, for the response of the three piles to applied load, can be submitted free of hesitation. The predictors were requested to provide one specific capacity value for each of the three loading tests on Piles C1, E9, and T1. Thirty-three predictions, from 17 countries, were submitted, being the distribution presented in Figure 17. From the overall set of predictions, the following distinction of methods may be identified: A compilation of the predictions for the ultimate compressive resistance is represented in Figure 3. The pile base, or toe, resistance (Rb) and shaft, or lateral, resistance (Rs) are indicated separately when applied otherwise the total resistance (R) is showed. The predictors applied different kind of calculation methods namely: analytical or empirical methods, results of dynamic load tests or a combination of them. It is also important to be noted that different criteria or calculation approaches were used to define the ultimate compressive resistance. Therefore, the previously indicated criteria, the reference that will be followed for comparison, will have to be carefully considered for such correlation. The predictions presented in the figures are very scattered demonstrating that the accurate estimation of pile axial capacity is still a very difficult task. The execution of the Static Pile Load Tests (SPLT) results The static pile load tests (SPLT) were performed following the recommendations of ERTC3-ISSMGE (De Cock et al., 2003) and ASTM Dl 143-81. For each loading stage the load was maintained until the displacement rate became less than 0.3mm/hour, with a minimum of 0.5h and a maximum of 2h. Each of Piles E9 and T1 was instrumented with six retrievable Geokon extensometer Model A9 anchors, placed in a PVC pipe centrically cast in the pile at 1,020 mm spacing with the first anchor 150 mm below the pile head. The lowest anchor was 750 mm above the pile toe (Figure 4). The use of retrievable extensometer instrumentation does not allow residual loads to be measured; these may assume substantial values in driven piles, but also non-negligible levels in cast-in-situ piles (Fellenius 2002).
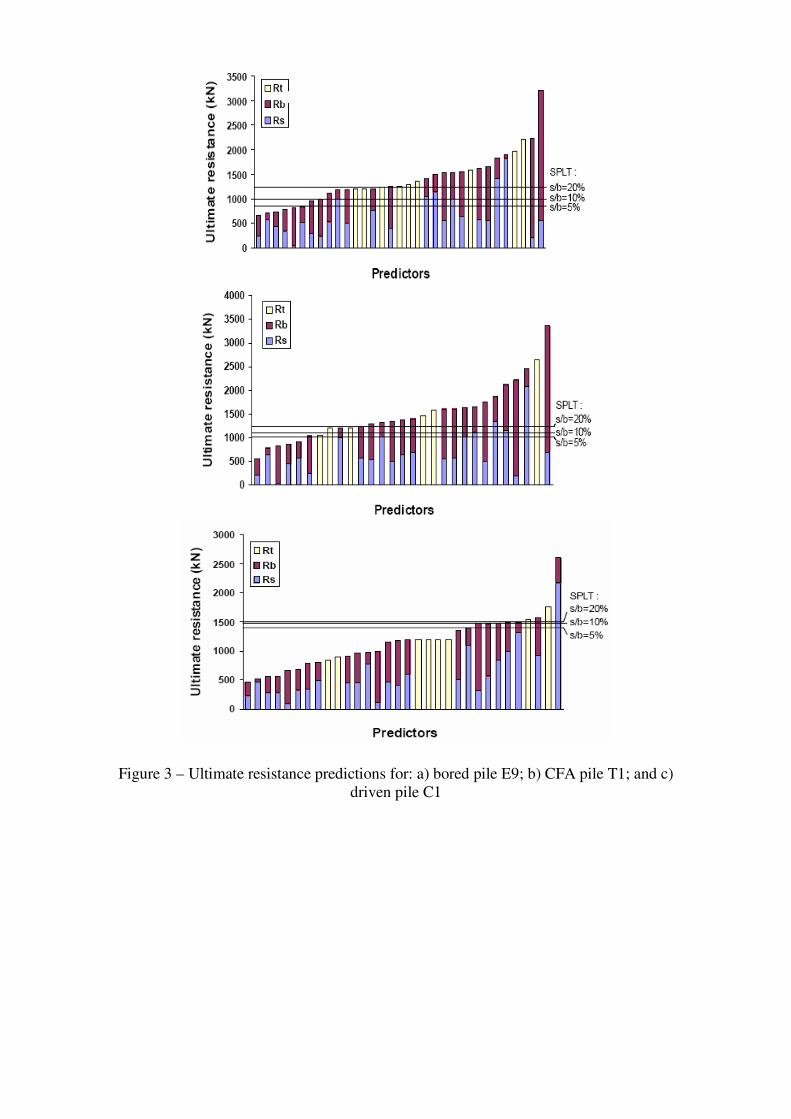
Figure 3 – Ultimate resistance predictions for: a) bored pile E9; b) CFA pile T1; and c) driven pile C1
0.00
1.20 Ground level
2.37
3.39
4.41
5.43
ANCHOR
Nº 5
Nº 4
Nº 3
Nº 2
Nº 1
6.45
1.35
1.02m
6.00
m1.
00m
Flat-jack Load Cellat Toe of Pile P9
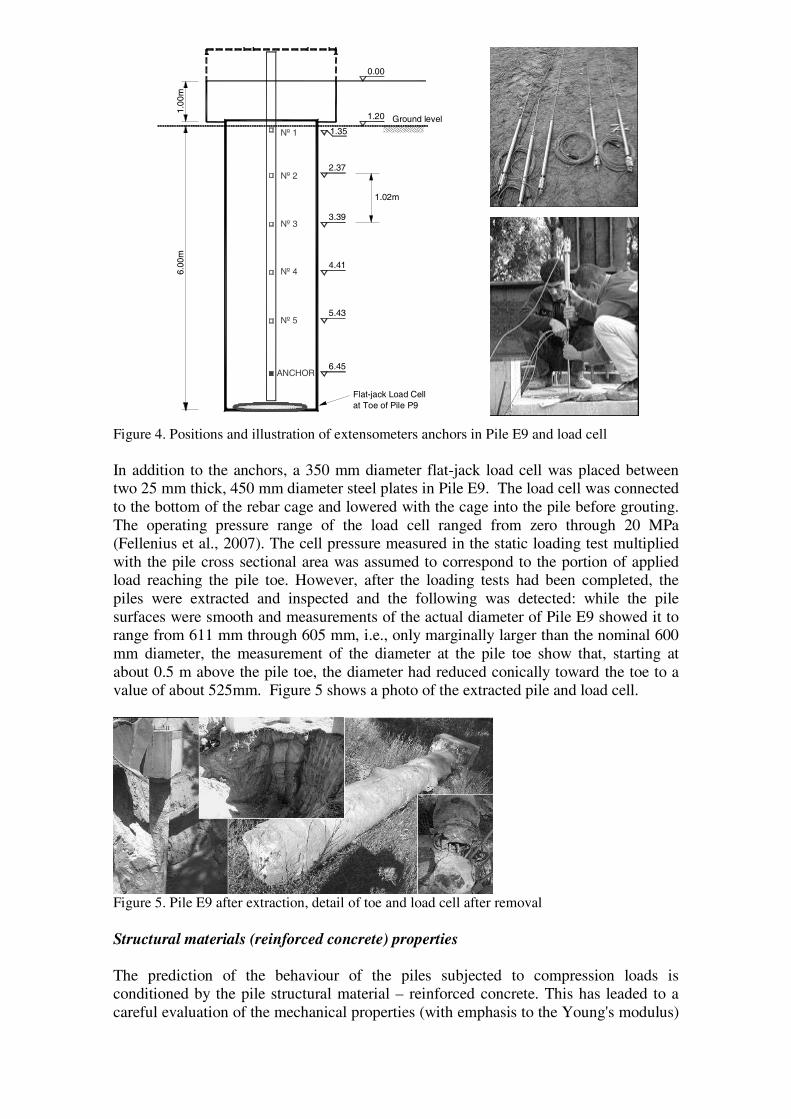
Figure 4. Positions and illustration of extensometers anchors in Pile E9 and load cell In addition to the anchors, a 350 mm diameter flat-jack load cell was placed between two 25 mm thick, 450 mm diameter steel plates in Pile E9. The load cell was connected to the bottom of the rebar cage and lowered with the cage into the pile before grouting. The operating pressure range of the load cell ranged from zero through 20 MPa (Fellenius et al., 2007). The cell pressure measured in the static loading test multiplied with the pile cross sectional area was assumed to correspond to the portion of applied load reaching the pile toe. However, after the loading tests had been completed, the piles were extracted and inspected and the following was detected: while the pile surfaces were smooth and measurements of the actual diameter of Pile E9 showed it to range from 611 mm through 605 mm, i.e., only marginally larger than the nominal 600 mm diameter, the measurement of the diameter at the pile toe show that, starting at about 0.5 m above the pile toe, the diameter had reduced conically toward the toe to a value of about 525mm. Figure 5 shows a photo of the extracted pile and load cell.
Figure 5. Pile E9 after extraction, detail of toe and load cell after removal Structural materials (reinforced concrete) properties The prediction of the behaviour of the piles subjected to compression loads is conditioned by the pile structural material – reinforced concrete. This has leaded to a careful evaluation of the mechanical properties (with emphasis to the Young's modulus)

of the reinforced concrete, differently manufactured and disposed in the three classes of piles (Fellenius et al., 2007, Viana da Fonseca et al. 2007) . Different values were attained, especially for the bored and augered piles: 20.0GPa and 39.2GPa, respectively. Although it may seem surprising, it should be denoted that there is a singular pattern of the stress-strain response, which reveals a lower stiffness in the low levels of induced stress that is attributed to the poorer quality of the “concrete was placed by using a drop chute in the water-filled casing”, in the “E-piles”. This is not observed in the “grout concrete that was ejected with high pressure” in the “T-Piles”. The less controlled concrete and the eventual air-inducting deposition method on the bored piles, has created a softer material, which may be also more sensible to the less effective curing conditions in the most superficial layers, in a warm climate. Weaker concretes are also more sensible to the time factors (creep) than the high quality ones. Being the static pile test loading steps sustained for a relevant period (between ½ to 2 hours), they are very different of the transient condition of the coring specimens tested in laboratory, tested in very rapid cycles (proved in creeping tests over different classes of concretes). The five extensometers measuring shortenings over the 1,020 mm distance allowed the determination of the pile stiffness (Fellenius et al., 2007), being in close agreement with the results obtained in the tests over the concrete samples, as described above. Results of the Static Pile Load Tests (SPLT) Piles were loaded in increments and the loading sequence was in cycles to specific load levels followed by unloading, and loaded to maximum loads. There is a clear indication that the installation effects play a crucial role in pile behaviour. For instance, in the case of the driven pile, the process may have induced a significant increase of the horizontal stresses in the surrounding soil, as well as some densification. For piles E9 and T1, the ultimate resistance cannot be clearly defined, while the driven pile C1, although having a smaller cross-section (43.3% of the others) has shown a stiffer response – Figure 6.
0
20
40
60
80
100
120
140
160
180
0 200 400 600 800 1000 1200 1400 1600 1800
top settlement (mm)
Pile E9
Pile T1
Pile C1
Figure 6– Load-settlement curves from static load test. The ultimate pile capacity for the driven pile C1 was reached for a relative settlement of about 10%. This value seems to be in good agreement with recent studies in centrifuge tests with displacement piles in sands (Fioravante et al., 1995). On the other hand, for the “non-displacement” piles E9 and T1, even for a relative settlement of about 25%, the ultimate resistance was not reached.
Vertical Load (kN)
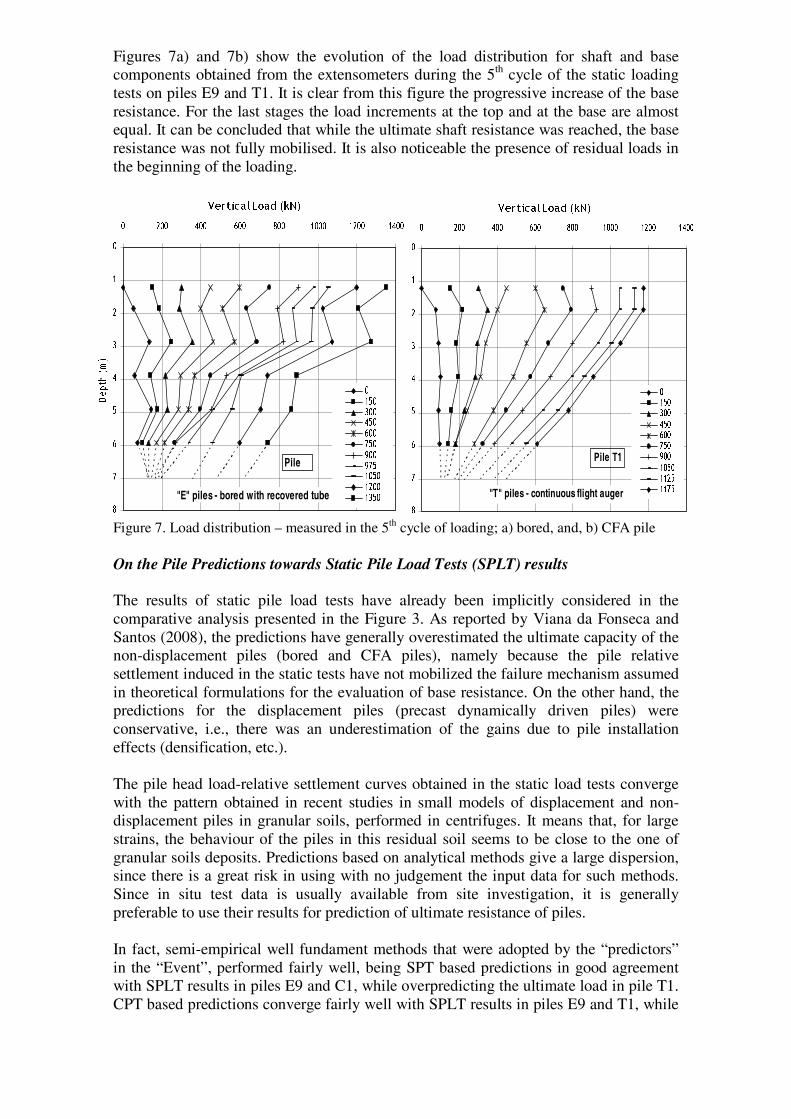
Figures 7a) and 7b) show the evolution of the load distribution for shaft and base components obtained from the extensometers during the 5th cycle of the static loading tests on piles E9 and T1. It is clear from this figure the progressive increase of the base resistance. For the last stages the load increments at the top and at the base are almost equal. It can be concluded that while the ultimate shaft resistance was reached, the base resistance was not fully mobilised. It is also noticeable the presence of residual loads in the beginning of the loading.
0
1
2
3
4
5
6
7
8
0 200 400 600 800 1000 1200 1400
Vertical Load (kN)
Depth (m
)
0150300450600750900975105012001350
Pile
"E" piles - bored with recovered tube
0
1
2
3
4
5
6
7
8
0 200 400 600 800 1000 1200 1400
Vertical Load (kN)
p
(
)
0150300450600750900105011251175
Pile T1
"T" piles - continuous flight auger
Figure 7. Load distribution – measured in the 5th cycle of loading; a) bored, and, b) CFA pile On the Pile Predictions towards Static Pile Load Tests (SPLT) results The results of static pile load tests have already been implicitly considered in the comparative analysis presented in the Figure 3. As reported by Viana da Fonseca and Santos (2008), the predictions have generally overestimated the ultimate capacity of the non-displacement piles (bored and CFA piles), namely because the pile relative settlement induced in the static tests have not mobilized the failure mechanism assumed in theoretical formulations for the evaluation of base resistance. On the other hand, the predictions for the displacement piles (precast dynamically driven piles) were conservative, i.e., there was an underestimation of the gains due to pile installation effects (densification, etc.). The pile head load-relative settlement curves obtained in the static load tests converge with the pattern obtained in recent studies in small models of displacement and non-displacement piles in granular soils, performed in centrifuges. It means that, for large strains, the behaviour of the piles in this residual soil seems to be close to the one of granular soils deposits. Predictions based on analytical methods give a large dispersion, since there is a great risk in using with no judgement the input data for such methods. Since in situ test data is usually available from site investigation, it is generally preferable to use their results for prediction of ultimate resistance of piles. In fact, semi-empirical well fundament methods that were adopted by the “predictors” in the “Event”, performed fairly well, being SPT based predictions in good agreement with SPLT results in piles E9 and C1, while overpredicting the ultimate load in pile T1. CPT based predictions converge fairly well with SPLT results in piles E9 and T1, while
Vertical Load (kN) Vertical Load (kN)

for the driven pile C1, the predicted ultimate load values are very small when compared with SPLT results. PMT based predictions do not agree very well with the QSPLT(s/b=10%) but are better than the previous ones, especially for pile E9 and pile C1. For pile T1, the predictions are quite good. It may be stated, preliminary and tentatively, that methods based on SPT data used for prediction of ultimate resistance in non displacement piles, or those based on CPT data in displacement piles did not performed well. The compilation of submitted predictions indicates that most predictors overestimated the bored pile capacities, mostly due to an overestimation of the toe resistances, which is also expressed in the presence of residual (locked-in) loads. Viana da Fonseca et al. (2007) have made a re-analysis of the results of the Static Pile Load Tests (SPLT) with the purpose of having a more fundament evaluation of the residual loads and, consequently, the load distribution in ultimate shaft resistance (Alr) and tip resistance (Qpr), namely for 100mm top settlement. This was possible by applying a mathematical model (Massad, 1995), which allows a back analysis of the top load-settlement curve. The solutions are analytical, in closed form, and were derived using load transfer functions based on Cambefort's Laws, accounting for the current knowledge of the shaft and tip displacements, needed to mobilize the full resistances. They may be applied to bored, jacked or driven piles subjected to a preliminary monotonic loading and/or subsequent loading-unloading cycles. The soil is supposed to be homogeneous with depth, along the entire pile shaft. A thorough description of the model is done in Viana da Fonseca et al. (2007). The application to the Static Loading Tests (SPLT) started with the bored pile (E9), simpler in its interpretation, followed by the analysis of the CFA pile (T1) and, finally, Pile C1, more complex. For Piles E9 and T1 a comparison was possible between the results of these analyses and of the available extensometer measurements installed along the piles. With these results, it was possible to evaluate the load distribution for ultimate shaft resistance (Alr) and tip (toe) resistance (Qp) levels, for a reference 100mm top settlement, as shown in Table 1.
Table 1 – Load Distribution for 100mm pile head settlement
Pile Alr (kN) Qp (kN) Total Load (kN)
E9 (Bored) 696 481 1177
T1 (CFA) 703 499 1202
C1 (Precast)) 511 to 1021 1004 to 494 1515
Derived values are in close agreement with the ones of previous analysis (Fellenius et al., 2007), being the differences due to the estimation of the residual loads. While in this paper, values derived for the bored (E9) and CFA (T1) piles were around 150kN, Fellenius et al. (2007) estimated them in 300kN. The value of 150kN for the toe residual load is very much consistent with the measured ones indicated in Figures 14 and 14, for E9 and T1 piles, respectively. Besides that, as far as C1 driven pile is concerned, the model that was described in this paper defined an upper bound value for residual load of 500kN. Assuming the validity of the hypotheses mentioned before, the ultimate unit shaft resistance for bored (E9) and CFA (T1) piles will be of 60kPa. For the driven (C1) pile, this value may be assumed as a lower limit. These analysis will conduct to the following values of empirical correlations:
For SPT N values the correlations with the unit shaft and base resistances are expressed:

fs = Ks⋅N; qb = Kb⋅N
resulting, in this case, in Ks value of around 3,75, while Kb⋅will reach values of 70. Values of shaft coefficient of 3.75 is higher than the range reported by Toh et al. (1989) - 2.5–2.7 -, Phienwej et al.(1994) - 2.3 -, Tan et al. (1998) and Chang and Broms (1991) – suggesting design values of Ks = 2, or evem in the recent publication of Chen & Hiew (2006), who pointed out values of Ks = 3 for bored pile constructed with the dry method and Ks = 2 for bored pile constructed with the wet method In what respects to the values of Kb, these are also much higher (70 or more), that those suggested by Toh et al. (1989) - between 27 and 60 -, or Chang and Broms (1991) - Kb
of 30–45 -, or Chen & Hiew (2006), who admitting that the base resistance for a bored pile is difficult to estimate, because the resistance is very much dependent on the workmanship, proposed a value of 10 for Kb in the preliminary design. A higher Kb
value of 30 could be adopted if cleaning of the pile base before concreting could be carried out effectively.
For CPT values the correlations with the unit shaft and base resistances may be expressed, following the same pattern as the French/LCPC method (Bustamante and Frank, 1999), as following:
qs = min [qc/β; qsmax]; qb = Kc⋅ qce
where qc is the average CPT static cone resistance in each assumed particular layer (or an averaged integer) and qce is the cone resistance around the base (toe) – measured at depth between half a diameter above the base and one and a half below); Kc is the point bearing factor, which is a function of the type of soils and the type of pile and method of execution (values are available for no-displacement piles, ND, and displacement piles, D); β is a correlation factor that depends on the type of pile and the soils – really those that are suitable for penetration by CPT (the others should be designed by an alternative method, based on pressuremeter test results – PMT), being this unit shaft resistance limited by qsmax, which is a value that depends on the type of soil and the method of pile construction.
In the specific case of this analysis of piles tests in the residual soil of Porto granite:
β ≅ 55; Kc ≅ 0.35 (Kc ≅ 0.75, if the shaft drops to values of β ≅ 120, in the driven pile)
which may be compared to some reference values (Bustamante and Frank, 1999): - being the grain size distribution of this soil very much sandy or silty sand, the
suggested values would be: - for base resistance:
Kc = 0.15, for non displacement (ND) piles; Kc = 0.50, for displacement (D) piles Being these values very well in the middle of the range for the ND to D piles in the bored and CFA tested piles, while for the driven pile we may expect the upper limit value (Kc ≅ 0.50);
- as for shaft resistance: the patterns for β and qsmax proposed in the LCPC method (Bustamante and Frank, 1999, considering the three classes closer to the three types of piles used in the experimental site) confirmed that (considering that typical values of CPT stand in the “B” type of soil):
- for bored and CFA piles (non displacement piles), the shaft coefficient (β≅ 55) is very much in agreement with the behaviour of silty soils;
- for driven piles (displacement piles), the shaft coefficient (β≅ 120) is> much more in agreement with the behaviour of sandy soils;
A final remark should be made for the sake of safety: all the appointed values were obtained for one sole representative static pile load test (SPLT), even considering the extensive in situ tests, for what the values of the design coefficients should be reduced, as suggested by French Standards (Bustamante and Frank, 1999), as well as in Eurocode 7 (EN 1997-1, 2004). Values won’t be discussed here, but at least a reduction of 30% should be considered. Acknowledgements
The authors are grateful to the Sponsors: Mota-Engil, SA, Sopecate, SA; Tecnasol-FGE, SA, and Teixeira Duarte, SA. This work was developed under the research activities of CEC from the FEUP and ICIST of IST, supported by funding from FCT (Portuguese Science and Technology Foundation). References Chang, M. F. and Broms, B. B. (1991). Design of bored piles in residual soils based on field-performance data. Canadian Geotechnical Journal, Vol. 28, No. 2, pp. 200–209. Bustamante, M. and Frank. R. (1999). Current French design practice for axially loaded piles. Ground Engineering, March, pp. 38-44. De Cock, F., Legrand C. and Huybrechts N. (2003) Overview of design methods of axially loaded piles in Europe – Report of ERTC3 – Piles, ISSMGE Subcommittee. Fellenius, B.H., (2002). Basics of foundation design. Electronic Edition. [www.Geoforum.com], 250 p. Fellenius, B. H., Santos, J. A. and Viana da Fonseca, A. (2007). Analysis of piles in a residual soil – The ISC’2 prediction. Submitted to Canadian Geotechnical Journal. Accepted for publication in Vol.1 (January).
Fioravante, V., Ghionna, V. N., Jamiolkowski, M. and Pedroni, S. (1995) “Load carrying capacity of large diameter bored piles in sand and gravel”. Tenth Asian Regional Conference on Soil Mechanics and Foundation Conference, Beijing. Santos, J.A., Duarte, R.J.L, Viana da Fonseca, A., and Costa Esteves, E. (2005). “ISC'2 experimental site – Prediction and performance of instrumented axially loaded piles”. Proceedings of the 14th ICSMGE, Osaka, September 21 - 25, Vol. 2, pp. 2171 - 2174. Viana da Fonseca, A. & Santos, J. (2006). International Prediction Event on the Behaviour of Bored, CFA and Driven Piles in Residula Soil. ISC’2 experimental site – 2008. Ed. FEUP & IST, Porto (www.fe.up.pt/sgwww/labgeo/IPPE-ISC2.pdf). Viana da Fonseca, A., Carvalho, J., Ferreira, C., Santos, J. A., Almeida, F., Pereira, E., Feliciano, J., Grade, J. and Oliveira, A., (2006). Characterization of a profile of residual soil from granite combining geological, geophysical, and mechanical testing techniques. Int. J. Geotechnical and Geological Engineering. Vol. 24, Nº 5, pp. 1307-1348, Oct. 2006. Springer, Netherlands. Viana da Fonseca, A., Santos, J. A., Massad, F. and Costa Esteves, E. (2007). “Analysis of piles in residual soil from granite considering residual loads” Accepted for publication in Int. Journal “SOIL AND ROCKS”. ABMS, SPG. São Paulo, Brasil.