Embed Size (px)
Citation preview

Insight into the Use, Perception, and Value Surrounding Domestic Water in Peru:
Envisioning Demand Management in an Intermittent, Small-City, Service Context
by
Merril Augusta Putnam
A thesis submitted in partial fulfillment of the requirements for the degree of
Master of Science in Environmental Engineering Department of Civil and Environmental Engineering
College of Engineering University of South Florida
Co-Major Professor: James Mihelcic, Ph.D. Co-Major Professor: Amy Stuart, Ph.D.
Mark Rains, Ph.D.
Date of Approval: May 17, 2013
Keywords: Water Resource Management, Developing Country, Water Scarcity, Unmetered, Household
Copyright © 2013, Merril Augusta Putnam
ACKNOWLEDGMENTS This material is based upon work supported by the National Science Foundation, under
grant number 0965743. Any opinions, findings, conclusions or recommendations expressed in
this material are those of the author(s) and do not necessarily reflect the views of the National
Science Foundation.
El autor de este tesis le gustaría agradecer a la Municipalidad de Chao por todo su
apoyo durante el desarrollo de este estudio. Específicamente: la doctora Frecia Gonzales, la
oficina de SADISCHAO, su jefe respectivo Jaime Terrones Chavez; la oficina de Desarrollo
Social, y sus equipos de encuestas.
The author would also like to thank her advisory committee, particularly Dr. James
Mihelcic and Dr. Amy Stuart for their support and guidance during her Peace Corps service and
through the course of writing this thesis.
i
!
TABLE OF CONTENTS
LIST OF TABLES ................................................................................................................. iii
LIST OF FIGURES ............................................................................................................... vi
ABSTRACT ........................................................................................................................ viii
CHAPTER 1: INTRODUCTION .............................................................................................. 1 1.1 Study Motivation ................................................................................................ 1 1.2 Objectives .......................................................................................................... 9 1.3 Preview ........................................................................................................... 10
CHAPTER 2: LITERATURE REVIEW .................................................................................... 11 2.1 Demand for Water ............................................................................................ 11 2.2 Demand Management ....................................................................................... 13 2.3 Demand Management In Theory ....................................................................... 14 2.4 Demand Management in Practice ....................................................................... 16 2.5 Demand Management in Developing Countries ................................................... 17 2.6 Intermittent Water Services ............................................................................... 19 2.7 Household Water Use in Intermittent Water Service Context ................................ 23 2.8 Unmonitored Water Waste ................................................................................ 26 2.9 Adaptive Capacity and Small Cities ..................................................................... 28 2.10 Conclusion ..................................................................................................... 29
CHAPTER 3: METHODOLOGY ............................................................................................ 33 3.1 Study Location and Characteristics ..................................................................... 33
3.1.1 Background - Water in Peru ................................................................. 33 3.1.2 Study Site: Chao, Viru, La Libertad ....................................................... 35
3.1.2.1 Pre-Existing Water Service in Chao ........................................... 38 3.1.2.2 Existing* Water Service in Nuevo Chao .................................... 39 3.1.2.3 New Water and Sanitation Service – As Proposed ...................... 40 3.1.2.4 New Water and Sanitation Service - In Reality .......................... 43
3.2 Data Collection ................................................................................................. 47 3.2.1 Survey Development and Design .......................................................... 47 3.2.2 Surveying Methodology ....................................................................... 52
3.2.2.1 Calculation of Sample Size ....................................................... 53 3.2.2.2 Survey Execution and Endorsements ........................................ 55
ii
3.3 Data Analysis ................................................................................................... 57
CHAPTER 4: RESULTS ...................................................................................................... 59 4.1 Socio-Economic Characteristics of the Population ................................................ 59 4.2 Demand and Quantity ....................................................................................... 62 4.2.1 Existing Availability ........................................................................................ 62
4.2.2 Existing Quantity ................................................................................. 70 4.3 Demand and Quality ......................................................................................... 79 4.4 Water Behaviors and Conservation ..................................................................... 87
4.4.1 High-Water Use Activities .................................................................... 88 4.4.2 Water Conserving Behaviors ................................................................ 95
4.5 Total Water Use .............................................................................................. 103 4.6 Demand and Value .......................................................................................... 110 4.7 Summary ........................................................................................................ 122
CHAPTER 5: DISCUSSION ................................................................................................ 130 5.1 The Case for Chao ........................................................................................... 132 5.2 Technical Strategies ......................................................................................... 140 5.3 Economic Strategies ........................................................................................ 143 5.4 Social Strategies .............................................................................................. 147 5.5 Overview ........................................................................................................ 158
CHAPTER 6: CONCLUSION ............................................................................................... 162
REFERENCES CITED ......................................................................................................... 168
APPENDICES ................................................................................................................... 177 Appendix A IRB Letter of Approval .......................................................................... 178 Appendix B Municipality of Chao Letter of Participation ............................................ 180 Appendix C Informal Consent for Household Surveys ............................................... 181
C.1 English ................................................................................................ 181 C.2 Spanish ................................................................................................ 181
Appendix D Round I - Household Surveys ............................................................... 183 D.1 English ................................................................................................ 183 D.2 Spanish ............................................................................................... 187
Appendix E Round II – Household Surveys .............................................................. 191 E.1 English ................................................................................................. 191 E.2 Spanish ................................................................................................ 195
Appendix F Primary Changes – Survey One to Survey Two ....................................... 199 Appendix G Round I - SPSS Codes .......................................................................... 201 Appendix H Round II – SPSS Codes ........................................................................ 209 Appendix I Sample Size of Results .......................................................................... 219

iii
LIST OF TABLES Table 3.1: Breakdown of three user groups ........................................................................ 38 Table 3.2: Proposed changes to SADISCHAO water and sanitation service ............................ 41 Table 3.3: The willingness to pay (WTP) series offered to households during Round I ............ 51 Table 3.4: The willingness to pay (WTP) series offered to households during Round II .......... 52 Table 3.5: Calculation of study’s sample size ....................................................................... 55 Table 3.6: Actual sample size obtained, by sector ................................................................ 55 Table 3.7: Number of surveys entered into SPSS per user group .......................................... 58 Table 4.1: Summarized socio-economic characteristics of respondents and their
respective households ....................................................................................... 62 Table 4.2: Reported arrival time (i.e. schedule) of water services ......................................... 64 Table 4.3: How arrival time (i.e. schedule) of water affects respondents’ daily routines .......... 65 Table 4.4: Respondents’ reported experience with water scarcity ......................................... 66 Table 4.5: Household use of alternative water sources ........................................................ 69 Table 4.6: Reported frequency with which respondents (households) use alternative
sources ............................................................................................................ 70 Table 4.7: Reported problems with water pressure .............................................................. 71 Table 4.8: Frequency of reported pressure problems, as varies by season ............................. 72 Table 4.9: Reported pressure problems, overall perspective ................................................. 72 Table 4.10: Descriptive statistics of amount of water households’ regularly store on a
daily (Chao and Well users) or every other day (Nuevo Chao) basis (liters) ........... 73 Table 4.11: Volume of additional water storage respondents would like to have (liters) ........... 77 Table 4.12: Respondents’ opinions of their water quality ....................................................... 81

iv
Table 4.13: Reasons for respondents’ confidence (or lack of) in their drinking water’s safety .............................................................................................................. 82
Table 4.14: Reported household treatment of drinking water ............................................... 83 Table 4.15: Respondents’ understanding of term ‘potable water’ .......................................... 86 Table 4.16: Respondents’ understanding of service providers’ water treatment ...................... 87 Table 4.17: Respondents’ opinions on most important aspect of a quality water service ......... 87 Table 4.18: Aspect of current water service respondents would most like to change .............. 88 Table 4.19: Liters used per-capita, per-week, for laundry ..................................................... 95 Table 4.20: Greywater reuse for flushing toilets .................................................................. 97 Table 4.21: Where respondents learned about water conservation ....................................... 98 Table 4.22: Examples of water conservation as reported by respondents .............................. 99 Table 4.23: Reported reasons why respondents practice water conservation ....................... 100 Table 4.24: Respondents’ perception of local water scarcity ............................................... 102 Table 4.25: Respondents’ attitudes toward metered water service and why ........................ 103 Table 4.26: Household water-related infrastructure ........................................................... 104 Table 4.27: Estimated seasonal volume of water consumed per capita and per
household per day (liters) ............................................................................... 106 Table 4.28: Reported practice of miscellaneous water-related activities ............................... 106 Table 4.29: Respondents’ estimations of daily household water use, divided by
household size to reflect estimate as daily liters per capita ................................ 109 Table 4.30: Difference in liters per capita per day between respondents’ estimated
water use and calculated water use based on respondents’ activity specific water estimates .............................................................................................. 111
Table 4.31: Respondents’ willingness to pay for improved (hypothetical) service, Round
I .................................................................................................................... 113 Table 4.32: Respondents’ willingness to pay for improved (hypothetical) service, Round
II .................................................................................................................. 114

v
Table 4.33: Respondents’ willingness to pay for improved continuity (24/7), quality, and sewage – Round I (units of S/.) ....................................................................... 115
Table 4.34: Respondents’ willingness to pay for improved continuity (12 hours) and
quality (with sewage included in all scenarios) – Round II (units of S/.) ............. 115 Table 4.35: Respondents’ willing to pay for improved (hypothetical) service, Round II,
where ‘maybe’ is considered to imply a ’yes’ ..................................................... 118 Table 4.36: Most important municipal-provided, public, service in eyes of respondents ........ 119 Table 4.37: Respondents trust their water service providers and why (Yes or No) ................ 121 Table 4.38: What type of information respondents would like from their water provider
to increase level of trust .................................................................................. 122 Table 4.39: Respondents’ confidence in ability of service provider to implement
proposed WTP scenarios, as rated on scale of one to ten (where ten is absolute confidence) ....................................................................................... 122
Table 4.40: Existing and potential water tariffs as they compare to each user group’s
mean household income ................................................................................. 123 Table 4.41: Mean monthly cost of other common household services (S/.) .......................... 123 Table 4.42: Twelve demand management strategies for developing countries excerpt
from Sharma and Vairavamoorthy (2009) ......................................................... 132 Table 4.43: Twelve demand management strategies suggested for the Municipality of
Chao ............................................................................................................. 162 Table A.1: Primary differences between Round I and Round II surveys ............................... 200 Table A.2: Codes used to enter Round I data into SPSS ..................................................... 202 Table A.3: Codes used to enter Round II data into SPSS .................................................... 210 Table A.4: Sample size used to create each table and figure presented in Chapter Four ....... 220

vi
LIST OF FIGURES Figure 3.1: Map of Peru ..................................................................................................... 37 Figure 3.2: Illustration of ongoing construction in Nuevo Chao (left) and Chao (right) ........... 38 Figure 3.3: Aerial map of study area ................................................................................... 42 Figure 3.4: Santa River watershed and location of mines contributing to inferior water
quality ............................................................................................................ 43 Figure 3.5: Photographs of Chao’s new water treatment plant from site visit on July 19th
2012 .............................................................................................................. 44 Figure 3.6: Photograph of development of Nuevo Chao II (invaded land) as of July, 2012 ....... 45 Figure 4.1: Reported continuity (hours) of water services – summer versus winter ................. 63 Figure 4.2: Reported length of time (years) that households have had a domestic water
connection ...................................................................................................... 66 Figure 4.3: Reported experience with water scarcity ............................................................. 67 Figure 4.4: Reported use of alternative water sources during periods of water scarcity ........... 68 Figure 4.5: Reported amount of water households regularly store on a daily (Chao and
Well users) or every other day (Nuevo Chao) basis (liters) ................................. 73 Figure 4.6: Examples of household water storage situations .................................................. 74 Figure 4.7: Respondents’ plans, and reasoning, for increasing water storage capabilities ......... 75 Figure 4.8: Respondents reporting enough water (quantity) for their daily needs (Yes or
No) ................................................................................................................ 78 Figure 4.9: Respondents who would use more water if their water service were more
continuous (Yes or No). ................................................................................... 79 Figure 4.10: Respondents intended water use if water service were more continuous ............. 79 Figure 4.11: Respondents’ opinion of most important water quality characteristic ................... 85 Figure 4.12: Photograph of street watering in Chao .............................................................. 89

vii
Figure 4.13: Photographs of street watering in Nuevo Chao and Chao ................................... 90 Figure 4.14: Percentage of households reporting to water the street ..................................... 90 Figure 4.15: Reported type of water used to water the street ................................................ 91 Figure 4.16: Photograph of street watering along the Pan American highway in Chao ............. 91 Figure 4.17: Photographs of households in Nuevo Chao with maintained vegetated
spaces ............................................................................................................ 93 Figure 4.18: Respondents’ personal hygiene behavior ........................................................... 94 Figure 4.19: Liters per capita per day for bathing in summer (left) and winter (right) .............. 94 Figure 4.20: Percent of respondents reporting to practice water conservation ........................ 99 Figure 4.21: Per capita water use, summer and winter, as it relates to the basic water
requirement of 50 Lpcd ................................................................................. 107 Figure 4.22: Average reported water use per activity, per household per day - summer ........ 108 Figure 4.23: Average reported water use per activity, per household per day - winter ........... 108 Figure 4.24: Respondents’ perceptions of the cost to provide existing water services ............ 120

viii
ABSTRACT
It is increasingly recognized that in order to manage scarce water resources for the
domestic sector demand management is requisite. In developing countries, demand
management can help to expand service, improve water quality, and ensure the ultimate
sustainability of water services. In order to manage demand, it must be measured and
understood. Intermittent water services are globally common, but unmetered domestic water
use under such conditions has not been carefully studied. This study conducted 1,149
household surveys in a small, growing, coastal city (population est. 35,645) in La Libertad,
Peru. The objectives were to 1) characterize current household water use behaviors,
perceptions and values as they vary among three distinct user groups (two different
intermittent water services and well users) and reveal the existing water use and potential
household demand for water, and 2) propose demand management tactics applicable to
conditions of the study site. Survey results show daily per capita water use in the range of 35 to
90 L with more water being used by the group that receives water for a longer duration of time.
The distribution of water was inequitable and, on average, households received water for less
time than the service providers’ reported duration. Demand is likely to grow due to increasing
water-related infrastructure, established water behaviors, and a lack of understanding regarding
regional scarcity and water conservation. Households are not satisfied with existing service
conditions, particularly water quality, but due to an apparent distrust in their water providers
are unwilling to pay for improvements. For domestic service to remain sustainable under the
pressures of increasing water scarcity, demand management strategies, particularly education
and awareness building, which have been shown to be achievable should be adopted.

1
CHAPTER 1: INTRODUCTION 1.1 Study Motivation
“When you added a couple of lanes to a freeway or built a new bridge, cars came out of nowhere to fill them. It was the same with water: the more you developed, the more growth occurred, and the faster demand grew” (Reisner, 1993, p. 348).
Water is an essential element for life. Existing in a continuous cycle, the same amount of
water that existed 4.54 billion years ago continues to evaporate, precipitate and flow in many
forms across the planet. Not only a requisite for basic survival, water is necessary for growing
and preparing food, adequate sanitation and hygiene, and the overall economic and social
prosperity of a population and its constituents. As such, it is no surprise that water resources
play a direct and/or indirect role in the achievement of all eight Millennium Development Goals
(MDGs) adopted by the United Nations in 2000.
While humans utilize water in its many states, freshwater is perhaps the most useful and
scarce. Globally, freshwater makes up less than 2.5% of the total hydrologic picture. Of this
2.5% only 30.5% is not bound up in ice, organisms, or soil (USGS, 2012).
Even so, if all the freshwater on the planet were divided up evenly, every person would
have approximately 3,000 to 4,000 cubic meters per year in excess of what is required, directly
(household water use) and indirectly (diet, consumerism, etc.), for an American lifestyle1 (UN-
Water, 2007; Fischetti, 2012). While this may sound reassuring, water remains scarce for many
1 The United States which has the highest per capita water footprint of 2,842 m3 per year
(Fischetti, 2012) Thus, the 5,000-6000 m3 available to everyone, every year, as reported by the United Nations would be roughly 3,000 to 4,000 m3 in access of even the United States high standard of living. Comparitively, less than 1,700 m3 per capita per year is the threshold at which a country would be considered to be experiencing water scarcity; resulting in a decline in economic development and the health and well being of their population.

2
humans. One reason for water scarcity is society grows accustomed to water being available in
a certain place but then it is no longer available due to changes beyond human control. The
problem with this is that shipping/transporting a large amount of water for human use is neither
easy nor financially or physically sustainable; sustainable implying that the behavior could be
carried out indefinitely without detriment to the resources upon which it relies (although, at the
cost of $30 million, Barcelona, Spain, was scheduled to do just that for several weeks one
summer before a period of drenching rain saved them (Fishman, 2011)).
In addition to being unpredictable in place and time, the polarity of each water molecule
makes H2O a great solvent. In other words, the structure of the water molecule creates the
perfect binding surface for both beneficial minerals as well as harmful contaminants. As an
example, in the United States, water suppliers have gone from monitoring and treating 22
contaminants in the 1980s to 90 in 2012 (Theiler, 2012).
To this matter, in their 2010 MDGs Report, the United Nations noted that while the
world is on target to meet or exceed its goal to halve the proportion of people without access to
safe drinking water by 2015, there is increasing degradation of the quality of freshwater
resources available (United Nations, 2010). Thus, while it is laudable that by 2015 more than
86% of the developing world population will have gained access to an improved water source,
the next step will be to examine the quality, quantity, continuity and reliability of the expanded
water supply.
It has been “widely acknowledged that water is a major limiting factor in the socio-
economic development of a world with a rapidly expanding population” (Vairavamoorthy et al.,
2008). The world’s population is projected to grow to 9.3 billion by 2050 (United Nations,
2012). In order to achieve the global eradication of poverty by then, impoverished areas will
need to secure water resources for uses far beyond the basic requisite of thirst.
3
In line with historical development and water resources management, those fortunate
enough to gain a water supply of both adequate quality and quantity will likely adopt a higher
per-capita consumption of water, both in terms of direct and indirect use. Not surprisingly,
according to the World Resources Institute, “water use has been growing at more than twice
the rate of population increase in the last century,” foreshadowing a 50% growth in demand
expected to occur between 2007 and 2025 in developing countries (Zarbarenko, 2011).
Not only is the demand for water growing, it is happening in increasingly concentrated
spaces. Over the next four decades, cities will absorb an additional 2.6 billion people, rising
from 3.6 billion people in 2011 to 6.3 billion people in 2050 (United Nations, 2010). Paul Reiter,
executive director of the International Water Association (IWA), broke it down at World Water
Week 2011 closing ceremony; “We’re adding 1 million people every week times 52 weeks times
40 years. Who’s going to respond to this challenge?” (Ganter & Nadya, 2011).
Populations’ will be further challenged in the coming decades due to a climate that is
changing across the globe. It is predicted that historical patterns in the hydrological cycle will
disappear. Micro-climates will play a large role in the availability of water at local levels but the
overwhelming trend will be less water in already dry areas, more water in already wet areas,
and, overall, a global increase in extreme water events (Camarsa et al., 2010; UNDP, 2006).
Taken as a whole - an increasing population, that has growing aspirations, and
increasing urbanization, compounded by climate change - it is not surprising that water scarcity
is said to be among the main problems to be faced by the world in the twenty-first century (UN-
Water, 2007). Water scarcity has been defined in many ways, none of which completely capture
the issue’s complexity. One of the most popular gauges of water scarcity is the ‘Water Stress
Index.’ Although it fails to take into account important factors such as regional differences and
desalination, the Water Stress Index considers a country’s population to be experiencing

4
physical scarcity when the amount of renewable freshwater available per capita per year drops
below 1,000 m3 (White, 2012). As it stands, 1.2 billion people currently face issues of physical
water scarcity, and that number is predicted to reach 1.7 billion people by 2025 (UN-Water,
2007).
In addition to scarcity arising as a direct result of water’s physical absence, water
scarcity can also occur as the result of mismanagement, inadequate infrastructure, and
contamination (Totsuka et al., 2004). Ultimately the appropriate scale for understanding access
to water is not global or even national but at the regional, local, and increasingly urban, level.
Perhaps the most comprehensive measure of water scarcity, ‘The Water Poverty Index,’
considers not only total renewable freshwater, but the accessibility, quantity, quality, and
variability of all available water. Furthermore, it takes into account the area’s unique
management, demand, and environmental circumstance. Under such scrutiny, even seemingly
water abundant countries can have areas threatened by water scarcity. As noted in the 2007
United Nations Report, Coping with Water Scarcity: Challenge of the 21st century, “Water
scarcity is a relative concept and can occur at any level of supply or demand.” That is, while
water resources are ultimately finite, “the same cannot be said of water demand” (Sullivan,
2002). Thus, in its broadest sense, water scarcity can also be defined as the point at which the
supply and/or quality of all available resources does not meet demand; where, in a technical
sense, demand is defined as “the quantity of water that users are expected to consume,” and,
in a nontechnical sense, is defined as the level of service users desire “as measured by the
contribution (they) are willing and able to make to receive and sustain it” (Deverill, 2001).
In general, national water policies tend to give priority to the domestic sector above all
else, regardless of the scarcity or plentitude of water resources (Vairavamoorthy et al., 2008).
But, on a global level, agriculture accounts for 70% of total water usage; 82% average in
5
developing countries, 30% average in developed (WBCSD, 2005). As such, when faced with
water scarcity, the first place countries seek to minimize their water use is within the
agricultural sector.
The domestic sector makes up 8% of the global demand for water resources (WWAP,
2012). This is a proportionally small piece of the total water use picture, but managing
household demand has shown to be both complicated and crucial to effectively, and
sustainably, managing water resources. For many developed countries, household taps and
their reliable flow made water essentially invisible as a potentially scarce resource. Essentially,
the more the public consumed, the more water was supplied. Even water providers in regions
that face regular or perpetual droughts fostered a false sense of security among household
consumers.
Only in the past two decades has water provision for the domestic sector shifted from a
historically reactive approach toward a proactive demand management program. Demand
management, which will be further discussed in Chapter Two, has been defined as:
“the adaptation and implementation of a strategy (policies and initiatives) by a water institution to influence the water demand and usage of water in order to meet any of the following objectives: economic efficiency, social development, social equity, environmental protection, sustainability of water supply and services, and political acceptability.” (DWAF, 1999a as cited in Vairavamoorthy and Mansoor, 2007, pg 184).
In Peru, a country that has more renewable freshwater per capita than any other
country in Latin America (Meade et al., 2010), people recognize that agua es vida (water is life).
Despite an ample supply of freshwater, the country is not immune from problems of water
scarcity. Due to water’s heterogeneous availability in space and time, both in terms of quality
and quantity, and poor governance, seven million people, or 24% of the population, are without
a continuous source of clean water (Alegría, 2006).
Peru is a vast country (1,279,996 km2 or twice the size of Texas) (CIA, 2013). The

6
author of this thesis was not able to comprehend the country’s size until serving as a Peace
Corps volunteer from September 2010 to November 2012 as part of the University of South
Florida Master’s International Program in Civil and Environmental Engineering. Along with 65%
of the population and 1.8% of the country’s freshwater resources (Alegría, 2006), the author
lived on the Pacific coast (covering ~10% of the country’s total area) in the town of Chao.
Located north of Lima in the department of La Libertad, Chao began to rapidly develop in the
1960s due to massive investments in construction of an extensive agriculturally focused
irrigation system. So, an average of 195 mm of annual rain for this desert climate was no
longer a hindrance to agricultural development. The transformed agricultural oasis was
expected to boast a $1,400 million a year economy in the immediate future (Chanduvi, 2006).
With seemingly endless jobs available, migrants from the country’s sierra and jungle regions
continue to migrate to sea level in search of a better life.
This continual influx of people has resulted in rapid, and consequently chaotic, urban
development. In some cases, families are settling onto undeveloped privately owned lands, a
practice appropriately coined in Spanish as invasiónes (invasions). This illegal and haphazard
growth places a large strain on municipalities as they struggle to provide basic infrastructure.
Fortunately for the estimated 30,645 residents of Chao and Nuevo Chao, in September 2010 the
Municipality of Chao proposed to develop a new water treatment plant and a series of oxidation
ponds to treat wastewater.
Once complete, the project will raise both household availability of potable water,
currently at 34%, and sanitation at 19%, to 97% (6,750, projected, households). Also, in
contrast to the current variable chlorine treatment regimen, the proposed service features a
modern, four-step, water treatment plant (coagulation, sedimentation, filtration and
chlorination), that will provide better quality of water twenty-four hours a day. At the time of

7
this study’s design households were either receiving hard groundwater every day for an average
of three hours; spring water every other day for an average of one hour, or relying solely on
water from unimproved household wells. Accordingly, the proposed project would appear to be
an improvement compared to existing water service conditions.
The source of water for the new treatment plant is the CHAVIMOCHIC. Currently in its
third and final stage of development, CHAVIMOCHIC is the acronym given to the canal that
carries water from the Santa River 83.4 km up the coast of La Libertad, transforming 66,075
hectares of sandy soils with no structure into sprawling fields of green (Chanduvi, 2006; FAO
Corporate Document Repository, 2004). Unfortunately, the Santa River’s ultimate source is
Andean, low-altitude, glaciers; glaciers that "will probably completely disappear within the
coming decades," according to Antoine Rabatel, the leading author on a recently published
multi-century perspective on glacier evolution and climate change in the Andean Glaciers (BBC
News, 2013).
Furthermore, the Santa River’s glacial melt freshwater does not stay clean for long. Due
to heavy mining in the river’s watershed, by the time the Santa River meets up with
CHAVIMOCHIC, the water quality is “alarming” (Ministry of Agriculture, 2008). The district’s only
other water sources include a myriad of unmonitored and ever deepening wells. The National
Water Authority (ANA) estimates coastal groundwater in Peru to be between 35 and 40 km3,
but Chao’s specific data is not available. Overall, given the current intermittent service and the
unknown future service, the water in Chao is arguably scarce.
To efficiently and equitably distribute scarce resources both supply and demand
management strategies are essential (Deverill, 2001). This means that water services “must be
planned and designed to ensure that water losses are minimized, that users understand the
true value of water, operation and maintenance costs are minimized and that adequate

8
revenues are raised” (Mwendera et al., 2003). In the developed world, demand management
was introduced as an afterthought to curb household consumption, after years of supply-
orientated service had conditioned the public to use water as if it was an endless resource. In
the developing world, water management is still driven by a supply side focus because large
portions of the population are still without water and there is a bias for ‘ribbon cutting’ projects
(Mwendera et al., 2003). However, demand management does not imply reducing level of
service. Instead, it “focuses on measures that make better and more efficient use of existing,
perhaps limited, supplies” (Vairvamoorty & Mansoor, 2007). In this regard, demand
management can help to expand service, improve water quality, and ensure the ultimate
sustainability of water services. In order to manage demand, however, it must be measured
and understood.
Intermittent water services are globally common. So, how water is used, perceived and
valued at the household level under such conditions is important. Surprisingly, this issue has not
been carefully studied, especially for services that are characterized by an absence of water
meters. It might be presumed that under intermittent conditions household demand, as it
relates to quantity, is not being met, but personal experience gained by the author of this thesis
while living in Chao suggests that whether households conserve or waste water is not
necessarily a matter of having enough. Furthermore, from experience the author knew that
limited quantity is only one of many aspects of intermittent services that are troublesome.
Accordingly, this study examines how demand management could be applied to a small,
developing, city that recently invested in a large supply-side endeavor amidst unresolved social,
financial, and technical issues. The study was designed to capture how residents of Chao and
Nuevo Chao used, perceived and valued water before and after the transition to the new
service. A first phase of the survey proposed to monitor water use via household surveys and
9
self-reported household diaries prior to the transition, and a second phase by household
surveys and readings after the installation of new water meters.
Round I of surveys was completed in January of 2012. But, the new water and
sanitation service did not begin as planned. Furthermore, the Municipality decided that when
the transition did happen it would no longer be to a continuous, metered, schedule where
households would pay according to their consumption; rather, the Municipality would continue
to provide water intermittently at a flat rate per month. As a result of this change, it was no
longer possible to obtain a ‘before’ and ‘after’ picture. So, the second round of surveys were
used to expand and confirm Round I data and capture seasonal differences in water use.
1.2 Objectives
1. One: Characterize current household water use behaviors, perceptions and values as
they vary among the area’s three distinct user groups (i.e. 1) those who receive water
every other day for ~ one hour; 2) those who receive water daily for ~ three hours; 3)
those who rely on un-improved wells) and reveal the existing and potential household
demand for water.
This objective will be achieved through the analysis of 1,131 surveys that contain data
ranging from households’ socio-economic situations, reported water use practices,
perceptions, opinions and complaints regarding the current service and willingness to pay
for various improved service scenarios.
2. Two: Demonstrate importance of demand management to the conditions of the study
site (i.e., small city in a water-scarce region with intermittent, un-metered, water
service) and propose applicable strategies.
This objective will be achieved through reviewing existing demand management strategies
proposed in the literature for developing countries as they pertain to the conditions of the

10
study site. Further support to meet this objective is obtained from discussing the results of
objective one.
1.3 Preview
Chapter Two of this thesis provides a specific review of the scholarly literature on
demand management. It will review the state of knowledge surrounding the issue of water in
the 21st century and the approaches cities around the world are taking in order to manage the
demand within the domestic sector. Specifically, the review will examine what is known, and
what needs to be further studied, with regard to household demand for water under an
intermittent supply, un-metered, small city, context. Chapter Three provides background to the
study, describes how the unique datasets were collected and outlines the statistical methods
utilized to analyze the data. Chapter Four will present the results of the study as they pertain to
the first objective. Chapter Five will discuss these results as they reveal the importance of
demand management and what specific strategies should be applied in Chao. Chapter Six
concludes the thesis and emphasizes the main findings.

11
CHAPTER 2: LITERATURE REVIEW
“While global water resources may be finite, the same cannot be said of water demand” (Sullivan, 2002).
2.1 Demand for Water
Water is essential for human life and wellbeing. Due to an increasing population and
urbanization, The Water Resource Group estimates that global demand for water by 2030 will
be 40% higher than it is today (UNEP, 2012) and up to 55% higher by 2050 (OECD, 2012).
Meanwhile, global temperatures are predicted to continue rising and while a few degrees is
seemingly small it can “seriously disrupt the natural balance of the world’s climate; and thus
results in changes of the water cycle” (Vairavamoorthy et al., 2008; Hadley Centre, 2013).
Whether as the result of physical absence, poor governance and/or lack of capital to
clean and transport available water, the reality of water scarcity will occur in developed and
developing nations alike. For example, Lebanon, unlike most Middle Eastern countries, is
actually considered to be rich in water resources. Meanwhile, its capital Beirut is feeling the
strain of inadequate supply (Tokajian & Hashwa, 2003). As Dr. Sheila Olmstead (2010) points
out, “the barriers to efficient water use and allocation are, in large part, socially constructed.”
To that point, corruption and mismanagement are likely the number one reason that 1.6 billion
of the world’s population already face chronic water shortages (UN-Water, 2007).
Equitable distribution of water goes far beyond households’ needs. Water is required for
the production of food, industry, energy, and ecological balance. Agriculture accounts for an
impressive 70% of total water usage (UNESCO - WWAP, 2012). As such, improving the
efficiency of irrigation and the processing and distribution of food is critical. In fact, a report on

12
world water supply and demand from 1990 to 2025 offered a striking conclusion that around
50% of the increase in demand for water by 2025 can be met by increasing the effectiveness of
irrigation (Seckler et al., 1998).
Accordingly, in Israel, a country that has been consuming water at or beyond renewable
rates since the 1970s, attention began with focus on agricultural reform. Under the strain of
scarce water resources, the agricultural sector adopted progressive production strategies such
as the reuse of treated sewage effluent, micro-drip irrigation, and salt tolerant crops (Rosenthal
& Katz, 2010). As a result, in 2002 the average requirement of water per unit of land area had
fallen to 63% of what it was in 1975 (Israel Ministry of Foreign Affairs - The State of Israel,
2002).
Unfortunately, all of the freshwater freed up in Israel by technological innovation was
diverted to meet the domestic sector’s growing demand. As a result, water levels in Israel’s
rivers and lakes continue to decline (Camarsa et al., 2010). Although advances in desalination
are expected to increase Israel’s supply of freshwater 60% over the next 30 years, unless
conservation measures are set in place for the domestic sector, demand is predicted to remain
neck and neck with supply (Rosenthal & Katz, 2010).
Israel is not alone. Australia, Spain, and the United States, and many other countries,
are feeling the pressure that growing, densely populated areas with high water use place on
scarce, unpredictable, and/or increasingly contaminated, water resources (Fishman, 2011).
Even if the agricultural and industrial sectors continue to significantly reduce their water
consumption, without proper attention to the domestic sector, society will continue its struggle
to find adequate water. In short, developed countries around the world are beginning to realize
that technology alone will not resolve issues of water scarcity.

13
2.2 Demand Management
In order to properly meet the needs and aspirations of all sectors, countries agree that
the management of water resources has to be viewed holistically. For example, in 2004 the
European Commission formally presented this opinion in their European Declaration for a New
Water Culture. Among many points, the declaration noted that in order to achieve sustainable
management of our water resources one “must assume a holistic approach and recognize the
multiple dimensions of ethical, environmental, social, economic, political and emotional values”
embodied in the provision of water (European Commission, 2004). In this regard, another
approach is to categorize water by function: “water for life, water for general interest purposes,
and water for economic growth” (Laureano et al., 2008).
Holistic water management has been flushed out in many forms including the idea of
Integrated Water Resources Management (IWRM). In 2002, at the Johannesburg World Summit
on Sustainable Development, the Technical Advisory Committee of the Global Water Partnership
defined IWRM as “a process, which promotes the coordinated development and management of
water, land and related resources in order to maximize the resultant economic and social
welfare in an equitable manner without compromising the sustainability of vital ecosystems”
(Rahaman & Olli, 2005). Similar concepts include Integrated Resource Planning (IRP) and
Integrated Urban Water Management (IUWM) (White & Retamal, 2011; Kayaga & Smout, 2009;
van der Steen & Howe, 2009)
These systems-analysis-type approaches are in striking contrast to the way water has
been managed in the domestic sector over the past few centuries. As early as the 1500’s,
governments dealt with the distribution of water from a supply-driven perspective. For many
countries with the economy to do so, this meant that water systems, “constructed not only for
their usefulness, but also for their honor,” were so successful they became invisible (Sapiano et

14
al., 2008). Under such circumstances, it was not long before people took water for granted. In
Australia, a country facing water scarcity early on, a 1987 household survey revealed that
people were not actually aware of how they used water or how to save it (Thomas & Syme,
1988). In Zaragoza, Spain, a city that once faced a four-year drought, it was found that
regardless of their level of education, consumers had little knowledge of the water cycle
(Barberán Ortí & Salvador Figueras, 2010). The same has been shown in Israel (Rosenthal &
Katz, 2010). As Charles Fishman, author of The Big Thirst states “our very success with water
has allowed us to become water illiterate” (2011, p. 9). The public simply does not know the
actual cost of capital investments, operation and maintenance, opportunity costs, and economic
and environmental externalities associated with their water service.
Demand management does away with the blind provision of water and is one of the key
tools of IWRM (Sharma & Vairavamoorthy, 2009). Rather than solely invest in the development
of new sources and their subsequent infrastructure, the historically supply-side focus of water
management has begun to shift (White & Retamal, 2011). With the understanding that reliable
reductions in consumer demand can be considered as equivalent to increases in supply, water
providers utilizing demand management strategies are now the norm rather than the exception.
2.3 Demand Management In Theory
In its most basic sense, demand management centers around two concepts: 1) doing
more with what you have, and 2) doing better things with what you have” (Turton, 1999).
Demand management is not an objective, but rather a strategy to meet a number of objectives
including: “economic efficiency, social development, social equity, environmental protection,
sustainability of water supply and services, and political acceptability” (DWAF, 1999a as cited in
Vairavamoorthy and Mansoor, 2007, pg. 184). With such objectives in mind, the effectiveness
of a wide variety of demand management approaches began to be studied including: water
15
pricing, information and education, water conservation measures (water reuse, efficiency
technologies, etc.), and legal measures (Babel et al., 2007).
Studies of existing data have been performed to see which interventions might be most
effective in minimizing demand. A study in Egypt comparing demand to supply-driven
management strategies found that, considering pricing, regulatory, engineering, and
educational approaches, the three most cost-effective options were to minimize losses from the
network, maximize end-use efficiency at the household level, and increase the water tariff
(White & Retamal, 2011). With regard to tariff reform, a separate analysis of the relative merits
of both coercive and market-based approaches concluded that using price to manage demand
is more cost-effective than implementing non-price water conservation strategies (Olmstead &
Stavins, 2009). Similarly, through using data on household occupancy, income, consumption,
and billing from Kampala, Uganda, a model was created to simulate changes in consumption
relative to price. The model was able to demonstrate that the introduction of an income-
sensitive, increasing-block tariff, could potentially reduce demand by 15% and increase revenue
by 8% above the existing situation (Motoma, 2007). That said, in part because it is highly
political, most studies on tariff reform conclude that while price is an important demand
management tool, in order to achieve sustainable behavior change, information and education
must also be disseminated (Magnusson, 2004; Olmstead & Stavins, 2009; Zhong & Mol, 2010).
When data is available, examining the effectiveness of demand management strategies
is useful to understand how past, present, and predicted demand varies within the population.
A city’s appetite for water is determined among heterogeneous consumers and thus it is
important to explore how factors such as certain socio-demographic variables, climate, and
existing policies affect demand patterns. The most commonly examined variables are
population, number of households, household size, income (or other factors representing the

16
standards of living, price of water, educational level), and climatic factors such as temperature
and rainfall (Babel et al., 2007). Some other factors that have been examined include the type
of housing and land use (Shandas & Parandvash, 2010; Holloway & Troy, 2004), neighborhood
density (Chang et al., 2010), landscape features (Domene & Sauri, 2006), cultural origin (Darr
et al., 1975), and attitude towards conservation practices (Domene & Sauri, 2006). For
example, a study using data from Kathmandu, Nepal, demonstrated through multivariate
econometric modeling that the number of connections, water pricing, public education level,
and average annual rainfall are all significant variables affecting household water demand
(Babel et al., 2007).
2.4 Demand Management in Practice
In addition to theoretical studies, demand management interventions have also been
applied in practice. Zaragoza (Spain, population ~700,000) is a city that was plagued by a four-
year drought between 1991-95. Consequently, in 1997 the government began to experiment
with demand management strategies of tariff reform and education. By 2008, despite a 12%
increase in population, the city was able to cut demand by 27%. This reduction was achieved
“primarily through a change in water use behavior among businesses and citizens as well as, to
a lesser extent, the uptake of water efficient technology” (Philip, 2011). The behavior change
was a result of both the switch to a price that better reflected the true cost of the water service
as well as an educational campaign among stakeholders (Philip, 2011). Israel had similar
success in 2009, when a change in water tariffs coupled with an educational campaign brought
down consumption 20% (Rosenthal & Katz, 2010). In either case, the educational component
seemed to be the key in raising awareness and, then, achieving public support and action. In
fact, of the 400 households surveyed for Zaragoza study, the importance of water conservation
education was clear. Regardless of formal schooling and income level, the group that most

17
significantly reduced water use post-study was the group that specifically learned about water
saving behaviors and their importance (Barberán Ortí & Salvador Figueras, 2010).
Another city affected by the early 1990s drought was Windhoek (Namibia, population
~322,500). In 1994 the government turned toward demand management with the overall
objective to remove water use for general interests and reduce the pressure on their primary
water sources. The comprehensive strategy combined volumetric pricing and block tariffs with
information campaigns, legislation, and technical measures. The results showed a visible
reduction by 1996; specifically with demand falling from 201 liters per capita per day to 130
liters per capita per day in just seven years (Magnusson, 2004). A further examination of the
effectiveness of the campaign’s price and information messages on squatters, low-, middle- and
high-income groups revealed unique differences among the groups both in terms of affect on
consumption as well as awareness and perception regarding water scarcity. In particular, as the
high-income groups had more ability to pay and greater access to water, they were less willing
to respond to demand management. Overall, it was determined that “instead of relying on
short-term effects generated by block tariffs and occasional information, it is vital for long term
success of demand management to mobilize a permanent platform of individual water
responsibility, especially when living under water stressed conditions” (Magnusson, 2004).
2.5 Demand Management in Developing Countries
The success of demand management in Windhoek, Namibia is one example of how
developing countries are beginning to take on proactive demand management strategies
(Vairavamoorthy & Mansoor, 2006). However, demand management in developing countries is
inherently different from demand management strategies in developed countries. A primary
difference is water providers in developing countries are simultaneously trying to manage
demand and extend services so that everyone has access to water and sanitation. This issue

18
was identified in a study that reviewed demand management efforts in Malawi, Namibia, South
Africa, Swaziland, Zambia, and Zimbabwe. The authors concluded, “despite the potential
savings that would accrue from the implementation of water demand management, the water
sector across the southern African region continues to focus on supply augmentation”
(Mwendera et al., 2003; Sharma & Vairavamoorthy, 2009).
Unfortunately, back in 2000 it was precisely “the dominance of wasteful and expensive
supply-side solutions” that the United Nations Environmental Program (UNEP) recognized as a
major obstacle in supplying water to the urban poor (Vairavamoorthy et al., 2008). Mwendera
et al. (2003) describe this as a reinforcing spiral; following construction supply is temporarily
abundant, but
“consumption quickly gets out of hand because of poor scheme design, unauthorized connections, poor credit control, a lack of maintenance and politicians insisting on low charges. As the artificial demand rises, it quickly exceeds the capacity of the pipelines, pumping plant, etc., and the net assured yield of the storage dams. There after the vested interests ensure that a new cycle of supply augmentation begins….(meanwhile)… poor service is causing customers to mistrust and have no respect for their water service providers,…feeling no obligation to pay anything of water services or even to take any responsibility for controlling excessive water usage” (p. 770)
Such a scenario highlights why even as developing countries strive to expand coverage
they must integrate demand management. In fact, a separate analysis of successful demand
management strategies in eight developing cities across southern Africa found a correlation
between cities using demand management techniques and higher coverage rates (Gumbo,
2004). That said Gumbo goes on to note that water providers and households continue to view
demand management as being “obscure, elusive, difficult to decide on the many options
available and having little impact as compared to supply-side options” (2004). This is not
surprising given that in addition to struggling to expand coverage, water service providers in
developing countries are often dealing with poor water quality, failing infrastructure, low cost

19
recovery, and an unsupportive institutional framework (Sharma & Vairavamoorthy, 2009).
These circumstances emphasize there is still much to be understood when it comes to
introducing demand management strategies in developing areas. In a report titled “Urban
Water Demand Management: Prospect and Challenges for the Developing Countries,” Sharma
and Vairavamoorthy (2009) specifically call for “different tools, techniques and measures….
adapted to suit the local conditions and requirements of the developing countries.” They
suggest that given the wide-range of demand management strategies possible, a demand
management program should begin with the least-cost technique, implement the measure in a
piecemeal approach, and take care to engage with all the stakeholders along the way. They go
on to list twelve activities that should be considered covering: 1) technical measures such as
assessing the condition of existing infrastructure and improving the reliability of supply; 2)
economical measures such as increasing block tariffs and rebates; and 3) social measures such
as public education and awareness of water conservation, and the promotion of water reuse
and recycling. In particular, the authors call for “development of new techniques that are
specifically tailored for water starved/intermittent supply systems” (Sharma & Vairavamoorthy,
2009). Intermittent water services are by far one of the most prevalent conditions unique to
developing countries.
2.6 Intermittent Water Services
Intermittent services often arise from the perception that the available water resource is
not robust enough to provide continuous water (Christodoulou & Agathokleous, 2012;
Vairavamoorthy, Gorantiwar, & Mohan, 2007). By physically cutting off water for most to all of
the day, households are restricted in their ability to utilize water. In this regard, intermittent
water service is sometimes regarded as a demand management technique in and of itself
(Iskandarani 2002; Joshi et al., 2002; Vairavamoorthy et al., 2008). However, there is no

20
empirical evidence to strongly support such reasoning. In fact, studies suggest otherwise.
A meta-analysis of 20 years of household water studies in developing countries
concluded that although household water use increases with increased connection time, the
magnitude of the effect is quite small (Whittington & Nauges, 2010). Similarly, Iskandarani
(2002) found that even when piped water is households’ primary water source, a high degree of
interruption in supply does not significantly affect total household water consumption. In a
controlled study of four Indian residential areas that measured and compared household water
consumption in going from intermittent to continuous service, Andey and Kelkar (2007) found
increases in consumption ranging from 10.6% to 27.5%. However, they concluded that these
increases were very dependent on the duration and timing of water supply under intermittent
conditions; that so long as demand is satisfied under intermittent service (quantity), water
consumption does not change appreciably under continuous conditions. Accordingly, they also
concluded that in order to arrive at a general conclusion for how intermittent and continuous
water service affects households’ consumption there need to be further studies on domestic
water use, particularly for slum areas and smaller cities. Nonetheless, the results of these
studies are interesting in that they challenge the notion that intermittent service is an effective
way to limit consumption.
Whether or not intermittent services limit household water consumption, they have also
been seen as a way to reduce system leakage and provide time for repairs and maintenance
(McIntosh, 2003; Klingel, 2012). To that point, Andey and Kelkar’s (2009) study comparing
intermittent to continuous services found that under continuous service there was a significant
increase in gross (system-level) consumption (i.e. greater leakage). However this was
hypothesized to be the result of unmetered and unauthorized supply connections and leakages
in the distribution system and suggests that the performance of water systems subjected to

21
both continuous and intermittent supply modes is in part dependent on the state of the
infrastructure. Accordingly, a study by Christodoulous and Agathokleous (2012) found a
significant 30 to 70% increase in pipe-burst incidents under intermittent conditions, concluding
that such side effects could actually cause increased water loss. Other researchers are in
agreement that, at the systems level, as a result of pressure surges and fluctuations,
intermittent conditions leak more water than they save (Batish, 2003; Klingel, 2012; McIntosh,
2003).
Intermittent services are prone to pressure problems because they arise out of
perceived necessity rather than design. That is, for continuous service, pipes are sized with the
understanding that although there will be two diurnal spikes in water use (peaking factors
typically 2 to 3), overall demand will be spread over a period of twenty-four hours (Andey &
Kelkar, 2009). Under intermittent conditions, however, demand is uniform until the service
essentially dries out and peaking factors can range from 1.7 to 6.4 depending on the duration
of supply (Batish, 2003; Andey & Kelkar, 2009). Consequently, when systems intended to run
continuously revert to intermittent conditions, severe pressure losses occur at the system level
(Vairavamoorthy et al., 2008).
Unfortunately, the subsequent loss of pressure is distributed very unevenly and while
some households can barely fill their tanks, others receive too much water. Furthermore,
because pipes in intermittent conditions do not retain water in non-supply hours, air often
enters to occupy the free space. When supply is restored, at the moment the returning water
slams into these air pockets, the water’s rapid deceleration causes a pressure surge that results
in a severe reduction of the carrying capacity of the pipes. In some cases, the pipes become
choked, and, unless an air release valve is available, are rendered useless until the supply
period returns (Batish, 2003).

22
The occasional day without water is not the only cost to the consumer under
intermittent service conditions. Never knowing when and if water will arrive again creates
anxiety (Totsuka et al., 2004). Further, households often have to rearrange their schedules
according to when the water is expected to arrive. In some cases, this means that the individual
staying around to properly store arriving water misses work, school, or has to get up in the
middle of the night (Totsuka et al., 2004; Madanat & Humplick, 1993).
Another downside to intermittent service is that when supply pipes are left empty for
long periods of time, contaminants seeking low-pressure areas are prone to enter the system
(Klingel, 2012). Accordingly, intermittent services are also associated with decreased water
quality in the form of turbidity and bacteria regrowth. To combat this, providers may add higher
doses of chlorine but, due to pressure differences in the network, water arriving to households
has been shown to have non-uniform chlorine residuals (Tokajian & Hashwa, 2003).
As a result, if time and money permit, households usually provide point-of-use treatment
before drinking their water and/or purchase alternative sources such as bottled water (Totsuka
et al., 2004). In addition to investing in water treatment, households under intermittent services
devote time and money to pumping and storing their water (Vairavamoorthy et al., 2008).
Unfortunately, the latter can further decrease the water’s quality (Klingel, 2012). In fact, a
controlled study in Lebanon found a positive correlation between the heterotrophic plate count
bacteria/ml and pH, temperature, and storage time (Tokajian & Hashwa, 2003). Overall,
indirect health-related costs aside, a study of Kathmandu, Nepal, found that households
receiving intermittent service can spend almost twice as much as their monthly water bills on
coping behaviors (Pattanayak et al., 2005). Providers also incur additional costs in the form of
additional manpower to open and close network valves and in increased replacement of valves
and tubes due to elevated wear and tear on the system (Klingel, 2012).

23
Despite all the disadvantages of intermittent water services for providers and their
customers, their prevalence is astounding: ~30% in Africa, ~50% in Asia, 90% in Southeast
Asia, 60% in Latin America, and 100% in India (Klingel, 2012). Unfortunately, given projected
scenarios of population growth and urbanization, “it is highly likely that the intermittent water
supply which is already status-quo in many mega cities in the developing world is going to be
more widespread” (Rosenberg et al., 2008). With that in mind, studies have begun to look at
how systems can be designed for intermittency, from the onset, thus avoiding the
aforementioned problems that result when systems designed for continuous operation are run
intermittently (Vairavamoorthy et al., 2008; Totsuka et al., 2004; Batish, 2003).
2.7 Household Water Use in Intermittent Water Service Context
While proactively designing for intermittent supply will be a great step toward improving
water quality and equity under such conditions, in the interim there is a need to understand
how demand management can better address the many issues of existing intermittent services.
Specifically, when it comes to successful Integrated Water Resource Management, and thus
demand management, “The identification and characterization of household behaviors is
regarded as a key first step” (Rosenberg et al., 2007).
A study of households in Ghaziabad and Jaipur, India, evaluated households’
convenience and satisfaction under intermittent and continuous services and, in doing so,
revealed many of the common behaviors that result from receiving piped water sporadically
(Joshi et al., 2002). That is, under intermittent service, the timing of supply and service
interruptions meant that 100% of households surveyed had elevated water storage devices.
Households also reported to draw water from distribution pipes through motorized pumps. With
respect to water quality, all households reported to be satisfied but 35% still provided additional
treatment to their drinking water and 58% discarded stored, unused, drinking water every time

24
supply resumed. Interestingly, despite these seeming inconveniences, so long as there was
adequate pressure, households reported to be satisfied with three to ten-hours of service.
Nonetheless, households favored continuous supply and were willing to pay more for it. While
these findings are interesting, there was a lack of discussion regarding why, despite being
satisfied with intermittent service, households wanted continuous supply.
Domestic water use under intermittent conditions was further explored by Rosenberg et
al. (2008) in a report that examined the theoretical behaviors that households in Jordan coping
with intermittent water services could adopt, in both the short- and long- term, to increase their
supply as well as manage their demand. Numerous examples included: installing roof or ground
tanks, installing in-home treatment, installing bags or bottles in toilets, finding and fixing leaks,
reducing landscape irrigation, turning off faucets while washing, partially opening faucets,
reducing shower length, reducing laundry frequency, sweeping rather than washing floors,
collecting rainwater, using a grey-water collection system, drilling wells, borrowing water, and
buying water in bottle and tank form, etc. Using interview and survey data, the cost of each
behavior, as well as the possible uses for the volume and quality of water gained, were
detailed. However, because it was recognized that cost, effectiveness, and subsequent adoption
of each behavior would ultimately vary depending on the characteristics of each individual
household, the study was not designed to draw conclusions so much as to act as a precursor to
a larger systems analysis. In particular a more detailed systems analysis would help “resolve
interdependencies among actions…” as well as “integrate physical and institutional constraints
affecting user decisions and help study the effects on user decisions of increased network water
availability such as continuous piped supply” (Rosenberg et al., 2008).
In line with this recommendation, Rosenberg et al. (2007) developed a regression model
that would estimate water demand with consideration to the aforementioned unique water-use

25
behaviors that result from intermittent services. The model, which used a cost-minimizing
decision criterion, was tested using, again, data from Amman, Jordan. By parametrically
changing base case parameters it was shown “how availability, pricing and conservation
campaigns may influence water use” (2007). Interestingly, the affect of water quality on water
use was not considered. One of the most interesting results suggests “that an education and
awareness campaign to encourage cost-conscious decisions regarding household conservation
actions may, on average, reduce municipal water consumption in Amman by about 33%..
.reduce tank truck water use by more than 60%...(and) decrease customers’ overall water-
related expenditures by 35%” (2007). Furthermore, the model predicted that although only a
small fraction of customers adopted long-term conservation measures such as retrofitted
showerheads, their water savings would greatly contribute to the populations’ decreased
demand. This finding suggests “a targeted conservation campaign can achieve significant water
savings with concentrated effort” (2007). However, while the model is useful for beginning to
explore the complex nature of household water use behavior under intermittent service
conditions, because of several assumptions it makes, the authors voiced the need to empirically
confirm the models’ conservation predictions. In particular they cite the need for more data on
‘utility’ factors such as time, hassle and social desirability, which may affect the water use
behaviors their model predicted (Rosenberg et al., 2007).
While the above studies suggest that intermittent services can promote water
conservation behaviors among households, it is not clear whether these are born out of
necessity or conscious choice. More attention also needs to be paid to understanding the
motivation behind the negative behaviors that result from intermittent conditions. Batish (2003)
alludes to this in his report on how to design water systems to efficiently run with intermittent
service. He writes:

26
“a consumer is likely to keep the water taps open even after supply period. This may result in wastage of water once the supply is restored. Also the consumers are more likely to dispose of excess water stored earlier to fetch fresh water intake for use or storage…. The rate of water supply is highly subsidized and water metering is not very effective. Thus there is added reason to use as much water as available for consumption without costing much to the consumers….Hence on the one hand the water supply departments are designing the system based on minimum demand to cut the costs; on the other hand consumers who have easy access to more supply use it lavishly” (p. 2).
McIntosh (2003) touches on water loss by noting practices such as throwing out old
water to make way for storing fresh water. He suggests that because households without
access to 24-hour supply never know when they will next receive water they tend to use more
than others. As noted in the study by Joshi et al. (2002), 58% of Indian households studied
discarded unused drinking water when the service resumed. Whether because they cannot be
home at the established arrival time, there is no predictable schedule, or simply because they
see it as a non-issue, households receiving intermittent service may also develop the habit of
leaving taps open, causing storage devices to overflow (Totsuka et al., 2004; Batish, 2003).
Such behaviors suggest that, beyond improving the continuity of water, consistent, reliable,
services could “go a long way in reducing wastage that occurs due to unnecessary hoarding and
storage” (Sharma & Vairavamoorthy, 2009). On that note, perhaps households’ perceptions of
water quality might also affect the degree of water wasted under intermittent services.
Interestingly, such a relationship has not been critically examined or discussed in the literature.
In order to understand how household demand can be managed under intermittent services
there needs to be a greater understanding of what motivates existing water behaviors,
particularly to the effects of duration, reliability and quality on water use.
2.8 Unmonitored Water Waste
The motivations behind coping behaviors that result from intermittent service conditions
become of particular interest in areas with un-metered service. Interestingly, it appears studies

27
of water use under intermittent services have only been done in cities where household water
meters exist to varying degrees. Although pressure and air surges common to intermittent
service conditions make water meters readings generally unreliable (McIntosh, 2003), their
existence is often noted as a critical component of any demand management campaign
(Gumbo, 2004). To that note, a paper on the status of demand management in Malawi found
that:
“the application of water conservation measures at household level is not an outcome of WDM (water demand management) awareness, but rather a means of reducing water bills” and that ”where the provision of water has no monetary attachment, especially in the rural communities, the promotion of WDM has been minimal… Consequently, boreholes, protected and unprotected shallow wells, and gravity-fed water taps are either overused or abused”…the rural ”communities still feel that water is a free commodity and this attitude leads to water wastage practices” (Mulwafu, Chipeta, Chavula, Ferguson, Nkhoma, & Chilima, 2003, p. 795).
That is, water meters send price signals to consumers, which seem to reduce households’ piped
water use.
Without meters it is not only impossible to use price signals to encourage conservation,
but it also becomes difficult to estimate non-revenue flow (McKenzie & Ray, 2009). Under
demand management identifying non-revenue flow helps detect illegal connections and
leakages within the distribution system, the latter of which can range anywhere from 20 to 70
percent in developing countries (Sharma & Vairavamoorthy, 2009).
However, the lack of accountability for water after it leaves its initial distribution point
should not rule out the adoption of demand management techniques. In fact, a study that
surveyed 200, rural and urban, households in Jordan found that non-price factors have a large
influence on demand (Iskandarani, 2002). As previously stated, demand management must be
seen in a holistic context. Although structural measures such as leakage reduction and control
should eventually be incorporated into any demand management program, nonstructural

28
measures such as household education and awareness programs have been shown to be both
effective and essential (Sharma & Vairavamoorthy, 2009; Alegría, 2006). In order for demand
management efforts to be successful, households must not only understand and accept them,
they need to become active and contributing participants in the program (Magnusson, 2004).
2.9 Adaptive Capacity and Small Cities
With respect to the importance of households understanding and accepting demand
management efforts, Turton (1999) describes water demand management as a temple in which
the ‘adaptive capacity’ of the society is the base. Adaptive capacity can be defined as the social
resources of a given society (embodied within institutions made up of many stakeholders and
rules), which ultimately determine how people will respond to natural resource depletion (in this
case, water scarcity). Turton goes on to explain that the ‘willingness and ability of the people’ is
the right hand pillar of the demand management temple. Using a community in Namibia where
pre-paid meters were smashed as an example, he reiterates the importance of understanding
households’ perceptions in building effective demand management strategies. He stresses that
without the social component of adaptive capacity, even the most well thought out and heavily
financed structural measures will fail. Turton concludes that:
“economic development on its own is a necessary, but not a sufficient condition for the transition in water management to be made….the social dynamics at work, is likely to increasingly become of strategic significance to the governments of developing countries” (pp. 29-30).
Social dynamics and the adaptive capacity of a population become of particular interest
when looking at small cities. The aforementioned demand management in developing world
studies pertained to large cities and/or their peri-urban areas, but over half of the future’s 6.3
billion urban dwellers will reside in cities of less than 500,000 inhabitants (United Nations,
2012). On that note, Deverill (2001) wrote a report that specifically focused on alternative
strategies for demand management in small city contexts (defined as 5,000-50,000). After

29
summarizing the advantages and constraints of demand management in such situations,
Deverill (2001) suggests four demand management strategies, the first two of which are to
‘adopt social marketing techniques’ and ‘establish effective partnerships.’ He then goes on to
detail five practical measures that may be useful to small cities including: 1) ‘the adoption of a
demand responsive approach to provision,’ 2) ‘improving the service provided by communal
stand pipes,’ 3) ‘the reduction of revenue losses,’ 4) ‘the reduction of physical losses,’ and 5)
‘raising public awareness of the need to conserve water’ (2001). However his discussion is
based on several conditions including that the majority of households are still not receiving
piped water, that illegal connections are prevalent, and that water meters are in place for those
few households and institutions with a legal, piped, supply. Ultimately he concludes that,
despite the opportunities to build demand management strategies into small cities, there is little
being done. He urges that further studies are needed to understand how water is actually used
in such contexts, keeping in mind not just issues of quantity but quality as well (Deverill, 2001).
2.10 Conclusion
The United Nations has projected that by 2050, roughly 70% of the world’s population
will live in urban areas. The literature has shown that many urban areas in the developing world
have strained freshwater supplies due to rapidly increasing populations, their aspiring needs,
decreasing water quality, and climate change. Not surprisingly, water scarcity is identified as
one of the main problems of the twenty-first century (UN-Water, 2007).
When it comes to providing water to the domestic sector, the literature reveals that
countries around the world are shifting their focus to demand management strategies. In doing
so, developed countries have found that years of supply-focused service have left households
water illiterate. Both theoretical and implemented studies of the effectiveness of demand
management strategies have pointed to leakage management, end-use efficiency, and price as

30
effective management tools. However, the literature simultaneously highlights the importance
of education and awareness, or the social side of demand management.
For developing countries, the literature has shown that demand management is harder
to promote. This is because water service providers in developing countries are also dealing
with poor water quality, failing infrastructure, low cost recovery, and an unsupportive
institutional framework. In addition, because cities in developing countries are still striving to
provide all residents with potable water, governments continue to focus on politically appealing
supply-side solutions. While the focus remains for all households to have access to a potable
water and sanitation service, the literature highlights that further expansions of water services
must be paired with demand management strategies which are key to ensuring that supply is
reliable and equitable.
Unfortunately, when faced with strained freshwater or financial resources, the literature
notes that one of the most common ways service providers in developing countries manage
demand is by running water systems designed for continuous operation intermittently.
Ironically, however, the literature suggests whether households receive intermittent or
continuous service does not significantly affect water consumption. That is, so long as the time
and duration of intermittent service is satisfactory, households may not actually use significantly
more water when it is provided continuously. However, for better understanding of how service
mode affects household demand the literature points to a need for further studies on domestic
water consumption patterns for slum areas and smaller cities.
Water providers also see intermittent systems as a way to reduce system leakage and
provide time for repairs and maintenance. However, the literature has shown that intermittent
services can waste more water than they save as a result of deteriorating infrastructure. Other
downsides to intermittent services as noted by the literature are poor pressure, inequitable
31
distribution, decreased water quality, and higher operational costs. Poor service conditions are
reinforced when intermittent services are managed from a supply and not a demand
perspective.
Unfortunately, the literature indicates that, despite all of these disadvantages,
intermittent systems will not be disappearing anytime soon. However, the literature has
suggested that the equity and sufficiency of intermittent systems can be improved by
incorporating demand management strategies. In order for demand to be managed it must be
understood and, consequently, the literature highlights the importance of identifying household
water behaviors as a key first step.
As households adapt to the unreliable and inadequate service of intermittent conditions
they develop various coping mechanisms. The literature discusses how coping mechanisms take
form in both conserving and wasteful water behaviors, although the latter receives less
attention. However, there is a general lack of discussion as to what motivates these behaviors.
That is, there is an apparent lack of focus as to what underlying perceptions and opinions may
influence households’ water use beyond availability.
Overall, the literature reveals there is still much to be understood with how intermittent
water services shape households’ water consumption and demand. In particular, there is an
absence of information regarding household water use from intermittent water services that
lack both network and household water meters. In fact, there appear to be no studies
comparing household water use under varying degrees of intermittent, un-metered, service
conditions.
Traditional demand management strategies such as leakage management and tariff
reform rely on meters. In un-metered conditions, other strategies are needed. The literature
has suggested that household education and awareness programs hold an important place in

32
demand management. The public’s role in demand management is referred to as adaptive
capacity, or the social resources of a society. Adaptive capacity may be of particular use to
small cities, although there are no known case studies to demonstrate its importance and
effectiveness in managing demand.
Over the next two decades 95% of the world’s urban growth will occur in developing
countries and half these future urban dwellers will reside in cities of less than 500,000
inhabitants (Kayaga & Smout, 2009; United Nations, 2012). Although Chao’s (population
~30,645) location and culture make it unique, its situation is not uncommon. Small, but rapidly
growing, cities where households rely on an unpredictable water service characterized by a lack
of meters, flat or low tariffs, and management that is strained by low human and financial
capital are unfortunately prevalent. The literature mentions strategies for applying demand
management in developing contexts but there are no case studies of how demand management
can be specifically applied to cities such as Chao. In such areas demand management is
thought to be critical to ensuring 1) the entire population receives an adequate, reliable,
equitable and quality supply of water and 2) that this supply remains as such into the future.
Accordingly, the following study of Chao, Peru was designed to better understand water
use and demand of households subjected to varying degrees of, un-metered, intermittency.
This information will then be used to highlight the importance of demand management and
identify and suggest specific strategies the Municipality of Chao can incorporate in order to
maximize the benefits of their transition to an improved water and sanitation service.

33
CHAPTER 3: METHODOLOGY 3.1 Study Location and Characteristics
3.1.1 Background - Water in Peru
Peru has the most available freshwater per capita than any country in South America;
and is number seventeen worldwide (Alegría, 2006; Lynch, 2010; Meade et al., 2010). This
abundance of water has been sustaining the country’s population since 3,000 BC. In early time
periods up through the Inca Empire (1,100-1532 AD), water was sacred and treated with
respect (Alegría, 2006). But, water was also utilized. The Inca Empire is known for its extensive
hydraulic infrastructure. Through carefully planned channels, aqueducts, and terraces, the
Incans were able to irrigate an estimated 700,000 hectares (i.e., roughly the equivalent of
three-quarters of Peru’s current irrigated area (Alegría, 2006)). Such a level of productivity is
prodigious considering that the same lands are cultivated today with the aid of millions of
dollars in infrastructure, soil amendments and pesticides.
Unfortunately, perhaps due to colonization, sustainable uses of the country’s rich
resources were carelessly exploited. As a result, despite Peru’s abundance of water resources
(71,000 cubic meters per person per year)2, it is currently among the top 30 countries that
suffer from water scarcity (Alegría, 2006; LivingInPeru.com, 2011). As previously detailed in
Chapter One, water scarcity does not necessarily imply a lack of physical resources.
Peru is a growing economy with 75% of its 27 million inhabitants now living in urban
areas. Unfortunately, these urban areas primarily sprawl down the coast, the majority of which
is a semi-arid desert that contains only 1.8% of the country’s freshwater resources
2 Water stress occurs when the availability of water per person per year drops below 1,700 m3
(UN-Water, 2007).

34
(LivingInPeru.com, 2011). While massive infrastructure has been constructed to bring water
from the Sierra down to the coastal populations, effects of climate change are already making
previously abundant water resources less reliable. For example, high temperatures and reduced
rainfall have left the Amazon River in Peru at its lowest level in 40 years (Circle of Blue, 2010).
Water management in Peru has gone through a tumultuous past, which has resulted in
its being regulated by five separate regulatory bodies (ANA, MINSA, MINAM, SUNASS, MVCYS3).
These five institutions have overlapping responsibilities and conflicting goals that constrain
effective water resources management in Peru (Lynch, 2010). For example, according to the
national water law, the domestic sector is the first priority when it comes to allocation of water
resources. Unfortunately, because the National Water Authority (ANA) is still technically under
the wing of the Ministry of Agriculture (MINAG), law does not dictate practice (Alegría, 2006).
Consequently, millions of dollars have been invested into developing Peru’s export agriculture
economy as incentivized by the 2009 U.S.-Peru Free Trade Agreement (TLC) (Lynch, 2010).
Meanwhile, in 2009, approximately seven million Peruvians, or 27% of the country’s population,
still lacked access to an improved water supply (INEI, 2011).
Such sectoral bias is a prime example of how water management in Peru is fragmented
and inefficient. The 2009 water law tried to resolve some of this and called for gradual
devolution of water governance to regions and to focus on the watershed level. However, the
responsibilities of these new regional offices were not supported with resources for data
gathering and enforcement (Lynch, 2010). Nonetheless, over a six-year period (2010-2016),
according to the state news agency Andina, $5.2 billion will be invested to expand coverage of
potable water to peri-urban and rural areas (Hackley, 2012). This will be coupled with another
$521 million to improve the subsequent treatment of wastewater (Hackley, 2012). In a report
3 ANA (National Authority of Water); MINSA (Ministry of Health); MINAM (Ministry of Environment); SUNASS (Sanitation Services National Superintendent); MVCYS (Ministry of Housing, Construction and Sanitation).

35
by Lima’s Chamber of Commerce (CCL) that detailed the aforementioned investments, a new
water policy with two principal goals was described; “first, for tariffs to reach a level that covers
costs; and secondly, sustainability, so utilities can increase coverage, availability and quality”
(Andina, 2012). Given the 2005 World Bank’s Water and Sanitation Program reporting that no
more than 5% of water providers in Peru had the financial capacity to carry out their functions,
the question remains how and if local governments will have the resources and legal means
necessary to attain such goals (Reuda et al., 2005).
This thesis offers insight into how one Municipality (Chao, Viru, la Libertad) can improve
its water management at the local level. Effective local management is of particular interest
since the Municipality of Chao recently constructed a new and improved water and sanitation
service with financial support from the aforementioned national funds4. Financial independence
and improved coverage, availability, and quality of potable water for the domestic and
commercial sector are not just a matter of infrastructural capacity. By working together with the
water office of SADISCHAO, household surveys were designed to gain insight on the social
aspect of effective and sustainable water management as will be further discussed in Section
3.2.
3.1.2 Study Site: Chao, Viru, La Libertad
The district of Chao, Viru, La Libertad, Peru is located at 504 km along the North Pan
American Highway, 08° 34’ 54.25” S, as indicated by the red arrow in Figure 3.1 below. The
climate is temperate with no strong distinction between seasons; temperature fluctuating
between 11°C (night) and 30 °C (day). Temperature swings are dampened by proximity to the
Pacific Ocean and a strong sea breeze. Days and nights are usually clear. Apart from El Niño
periods, the area is very dry with on average only 195mm falling (primarily in the eastern,
4 The total project cost was roughly $9 million (S/. 23,330,401) financed by the Ministry of
Housing through the Water for All (Agua para Todos) program.

36
mountainous, unpopulated region of the district) during the summer months (November to
March).
Note: Red arrow below coastal city of Trujillo indicates Chao’s location in the department of La Libertad (CIA, 2012).
Figure 3.1: Map of Peru.
According to the National Institute of Statistics and Information (INEI), in 2011 there
were approximately 30,454 residents between Chao and Nuevo Chao living amongst 6,750
homes (~ density of 4.5 inhabitants per household) (District Municipality of Chao, 2010). The
population is young, with the majority falling within the range of 18 to 40 years of age. An
estimated 60% of the population owns their own homes. Homes are primarily adobe, straw or

37
plywood (73%). However, as money becomes available, families are reconstructing homes and
the area is rampant with ongoing construction (Figure 3.2). The average household’s monthly
income is S/. 520 (US $196)5 (District Municipality of Chao, 2010).
Figure 3.2: Illustration of ongoing construction in Nuevo Chao (left) and Chao (right).
With respect to water, the study area is composed of three primary groups: 1) residents in
Chao with household water service provided by SADISCHAO (Servicio de Agua Potable y
Alcantarillado, i.e. Water and Sanitation Service for Chao); 2) residents of Chao that rely on
unimproved wells; and 3) residents of Nuevo Chao with household water service provided by
the Nuevo Chao’s JASS (Junta Administrativa de Agua, i.e. Water Administration Board).
Table 3.1: Breakdown of three user groups.
Group Location Primary
Source Provider Monthly
Cost (S/.) Continuity Treatment S/. $U.S.
Chao Chao Groundwater via Household
Tap SADISCHAO 15.3 5.69 ~ 3 hours
daily Irregular
Chlorination
Well Chao Groundwater - 0.00 0.00 24/7 Variable
Nuevo Chao
Nuevo Chao
Spring water via Household
Tap JASS 3.20 1.19
~ 1 hour every other
day
Irregular Chlorination
Note: In Chao the water service also includes sanitation. In Nuevo Chao there is currently no sewage collection and households rely on pit or pour-flush latrines.
5 This estimate is significantly lower than that found during the two household survey periods –
See Table 4.1.

38
3.1.2.1 Pre-Existing6 Water Service in Chao
From 1996 to 2012 the source for Chao’s household water service was groundwater.
This source was accessed via a 75-m deep well and yielded 48 liters per second (lps). The
water was obtained using an electric pump that, when the power frequently went out, would
result in outages to the water service. Although there is no available information regarding the
pathogenic quality of the water, it has a hardness of 1,100 mg/L as CaCO3. According to the
World Health Organization (WHO), such water is not fit for human consumption. Nonetheless,
twice a day (from 11 p.m. to 5 a.m., and then again from 9 a.m. to 4 p.m.), the Municipality
would run an electronic pump in order to partially fill an 800-m3 reservoir. The reservoir would
empty about 540-m3 for households on the west side of the Pan American highway between 5
a.m. to 9 a.m., and then again, between 4 p.m. to 7 p.m., another 540-m3 of water would be
distributed to the houses located on the east side (refer to Figure 3.3). In the summer months,
roughly November to March, the pump would sometimes run for an extra hour in order to
satisfy a perceived increase in demand. Residents received (and still receive) their bills under
their doors and were given three weeks to pay at the Municipality.
The Municipality is centrally located and open Monday through Friday from 8 a.m. to 5
p.m. For households with water and sewage connections, the user fee was a flat S/. 15.30
(~$5.70 at the time of study) per month; S/. 12 (~$4.46) if the house had only one service or
the other. This fee increased from S/. 9.57 in 2009, prior to which there were only 800 metered
connections and users paid according to consumption (1996 to 2009). A few households still
have meters installed and believe them to be functioning, but they are misinformed. Most of the
original meters have either been stolen, lost, or fallen into disrepair.
6 *Pre-Existing refers to the state in which study was designed. As of February 7th, 2013, the new
service is providing water to the neighborhoods of San Luis, La Victoria, Las Delicias and Juan Velasco in Chao (1880 connections). In Nuevo Chao, however, the residents are still relying on their former water service run by their independent JASS – see 3.1.2.2.
39
SADISCHAO records all users electronically and if households do not regularly make
their payments, connections are cut. While historically lax in enforcement, in the past two years
SADISCHAO has become stricter at enacting this user pays policy. If a household’s connection is
cut, the cost to reconnect to the service is a relatively expensive, S/. 20 ($7.43) for water and
S/. 35 ($13.0) for sewage.
Within Chao, a few of the relatively newer developments are not covered by the
Municipal water and/or sanitation service. Consequently, households in these areas rely
primarily on groundwater, be it via a household or neighbor’s well. There is no available data on
the biological and physical water quality of the water in these wells, but, given the majority of
these wells are unprotected and water is obtained via rope and bucket, it is suspected that
water quality is poor. A few wealthier families have covered their wells and use electric pumps
to store water in elevated tanks. There are also households who live in neighborhoods covered
by the Municipal water and sanitation service that choose not to receive water. Instead, they
rely on household, or neighboring, wells. Wells are not registered and the Municipality does not
have any information regarding the number in the area.
3.1.2.2 Existing*7 Water Service in Nuevo Chao
Nuevo Chao is an isolated sector that will be included in the new water service (outlined
by pink block in Figure 3.3, ~2.5 km N of Chao). In contrast to Chao, the water source is a
natural spring located 8.5 km away in the nearby sector of Buena Vista (located in northeast
corner of Figure 3.3). Water travels directly from the spring to households via gravity. Nuevo
Chao is divided into several sectors and opening and closing networks valves distributes water
among them. Households are provided water for a period of approximately one hour every
7 At the time of writing, May 2013, the new water service is still not reaching households in
Nuevo Chao. At some point, existing will become pre-existing.

40
other day. The water is administered by the town’s JASS8. The monthly tariff in Nuevo Chao is
almost one-fifth that of Chao at only S/. 3.20 per month. Users pay at central office located
near Nuevo Chao’s Plaza de Armas (i.e. Main Square).
3.1.2.3 New Water and Sanitation Service – As Proposed
Table 3.2: Proposed changes to SADISCHAO water and sanitation service
Source Treatment Serves Coverage Price (S/.) Continuity
Old Groundwater Chlorination Chao 52% 15.3 ~ 3 hours daily
New Surface Water (canal via river)
Sedimentation, Coagulation,
Filtration, Chlorination
Chao & Nuevo Chao
97% TBD w/ meters 24/7
Note: the original plan for the new service was to provide water 24/7 and to meter household water use. However, both of these features are no longer considered feasible for at least the next ten years. As such, the price of the new service is still to be determined (TBD).
The 2010 project proposal commissioned by the Municipality of Chao, as based on their
pre-project study SNIP No. 50360, aimed to bring together these three unique user groups
beneath a unified, treated, continuous, water and sanitation service resulting in 97% coverage
of existing Chao and Nuevo Chao households (District Municipality of Chao, 2010). To estimate
the necessary capacity of the new system the Municipality used an annual growth rate of
5.94% (as drawn from 2005 and 2007 census data) and projected the area’s population to
reach 97,176 people by the year 2027 (District Municipality of Chao, 2010). Also considered in
the calculation of future demand was domestic water use of roughly 150 liters per capita per
day (with 4.54 people per household), growth in the business and industrial sectors, as well an
anticipated loss of 25% of the total volume of water produced (non-revenue water, NRW).
8 JASS is the name given to local water and sanitation authorities that are legally recognized by
the National Water Authority (ANA).

41
Note: The oldest area of Chao is in yellow. The various colored blocks to the east arose as invasions and although the once barren land is now full of houses, disputes with landowners are ongoing and at the time of writing not legally resolved. The pink block ~2.5 km north of Chao is Nuevo Chao. The “invasion” that began in March of 2011 lies directly west of Nuevo Chao, sprawling along the eastern side of the Pan American highway. (@ 2011 Google).
Figure 3.3: Aerial map of study area.

42
The new source of water is the CHAVIMOCHIC9 canal whose ultimate source is the
Santa River. The mouth of the Santa River divides the south-bordering department of Ancash
with La Libertad (Figure 3.4).
Figure 3.4: Santa River watershed and location of mines contributing to inferior water quality (Brooks, Kent, & Willett, 2004).
The Santa River is one of the few perennial rivers in Peru as well as one of the seven
rivers determined to have an alarming quality of water; specifically, high levels of fecal coliform,
lead, cyanide, copper and nitrates. Accordingly, Huaraz’s Ministry of Agriculture has said the
Santa River to be ‘lost to contamination’ (McKinney, Anderson, & Byers, 2011). Fortunately,
9 CHAVIMOCHIC is an acronym that stands for the four valleys of Chao, Viru, Moche and Chicama
that are irrigated by a major irrigation project that was financed by the National Government of Peru and inaugurated in 1994.
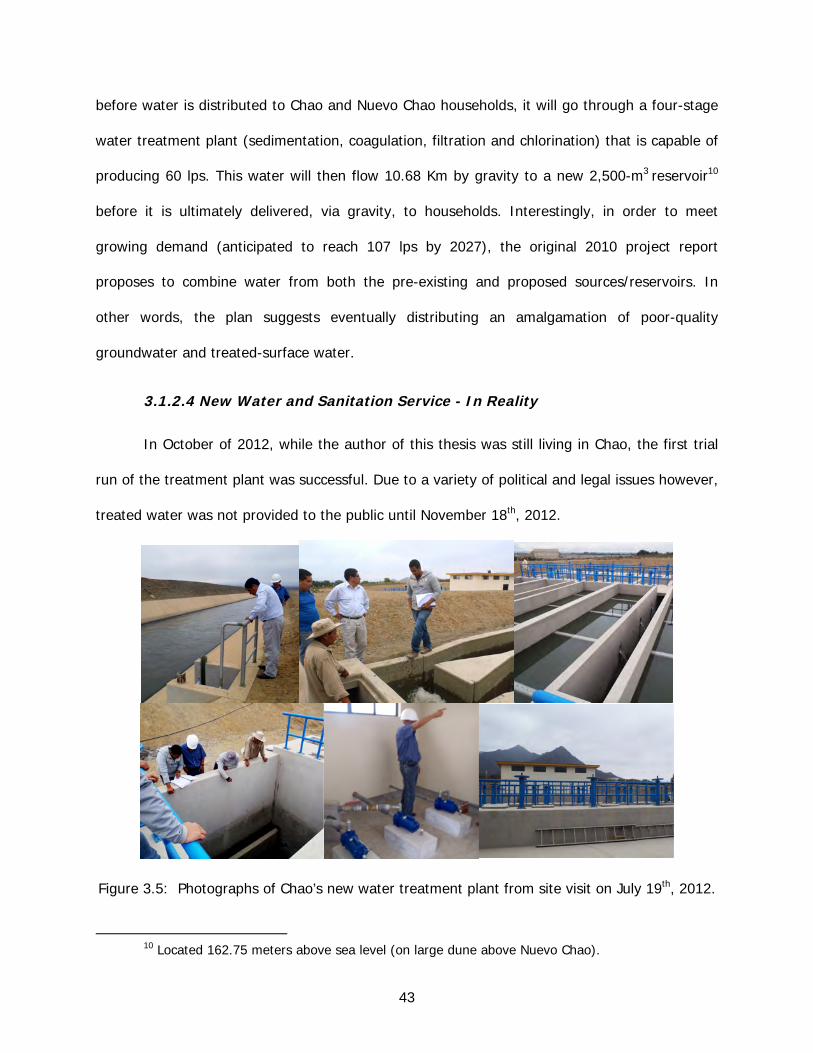
43
before water is distributed to Chao and Nuevo Chao households, it will go through a four-stage
water treatment plant (sedimentation, coagulation, filtration and chlorination) that is capable of
producing 60 lps. This water will then flow 10.68 Km by gravity to a new 2,500-m3 reservoir10
before it is ultimately delivered, via gravity, to households. Interestingly, in order to meet
growing demand (anticipated to reach 107 lps by 2027), the original 2010 project report
proposes to combine water from both the pre-existing and proposed sources/reservoirs. In
other words, the plan suggests eventually distributing an amalgamation of poor-quality
groundwater and treated-surface water.
3.1.2.4 New Water and Sanitation Service - In Reality
In October of 2012, while the author of this thesis was still living in Chao, the first trial
run of the treatment plant was successful. Due to a variety of political and legal issues however,
treated water was not provided to the public until November 18th, 2012.
Figure 3.5: Photographs of Chao’s new water treatment plant from site visit on July 19th, 2012.
10 Located 162.75 meters above sea level (on large dune above Nuevo Chao).

44
As it stands at the time of writing, the new treatment plant is providing water for 1,880
Chao households. While connections are in place to service Nuevo Chao, households are still
receiving their pre-existing water service. Interestingly, the invasión (invasion) in which a few
households began to occupy vacant land at the end of March 2010, has grown to approximately
2,230 houses (as estimated by SADISCHAO in February of 2013). This area is now being
referred to as Nuevo Chao II and, as this land was not developed at the time of the study’s
design, was not included in the household surveys.
Figure 3.6: Photograph of development of Nuevo Chao II (invaded land) as of July, 2012. In addition to being without electricity for the first year and a half of their existence,
Nuevo Chao II households were also without water. After noticing that large amounts of water
were being carted into the area on a daily basis (at the Municipality’s expense of lost tariffs), in
February 2013 the Municipality installed a 6” tube into the settlement and households can
connect at their own expense (i.e. purchase and install piping to household). In February of
2013 SADISCHAO estimated that 1,200, or 54%, of the households have connected to the main
line and are currently receiving water at no monthly cost. However, households will eventually
be charged. As of March 2013 the Municipality was planning to install household water meters
(as well as a district meter for the area) and charge residents $0.93 (S/. 2.50) per cubic meter
consumed.

45
During the first month of service from the new treatment plant (December 2012),
SADISCHAO reported that there were five to eight pipe bursts per day in the distribution
network. This is not surprising given that the older pipes had not been replaced and/or modified
to accommodate the anticipated increase in pressure. Although the new water treatment plant
can run at 60 liters per second (lps), it is currently running at half capacity (30 to 40 lps). On
days that the turbidity in the CHAVIMOCHIC canal is normal or low, the population is provided
water solely from the new water treatment plant. However, there are days that there is so
much sediment in the canal that the treatment plant can only produce 10-15 lps. On such days
the Municipality distributes water from both the new and old reservoirs and households receive
a mix of untreated groundwater with treated water from the plant. In January 2013
SADISCHAO estimates this combined service scenario occurred ten times. Unfortunately, the
quality of water from the old source continues to degrade. That is, due to the increase in staff
required to run the treatment plant, the groundwater is no longer chlorinated. Furthermore, at
the end of November 2012 the well collapsed in on itself, which has increased the turbidity of
the groundwater and, at the time of collapse, resulted in a drought for households that lasted
for several days.
With regard to the availability of water, according to the 2010 Project Plan, the new
water service was designed to run continuously (District Municipality of Chao, 2010). However,
according to SADISCHAO, such a service will not be possible due to the existing, inadequately
sized, distribution matrix, and, equally important, lack of meters. The absence of water meters
calls attention to one of the most uncertain aspects of the new service, the price. In Peru, when
the local government is in charge of running the water and sanitation service (as is the case in
Chao) this is known as an Empresa Prestadora de Servicios (EPS). According to the World
Bank’s Water and Sanitation Program, in 2005 only 5% of the Peru’s EPSs had the financial

46
capacity to comply with their duties (Reuda, Campos, Bretas, Brester, & Pérez de Castillo,
2005).
The financial reality in Chao is an example, not an exception. In February of 2013
SADISCHAO reportedly spent $30,800 (S/. 80,000) operating the new water and wastewater
treatment plants, which included the salaries of nine employees, energy, and chemical inputs.
Meanwhile, their income that month from household fees remained at $7,700 (S/. 20,000). Not
only is the current service-related spending unsustainable, it is not even meeting the minimum
operation requirements recommended by the engineering group who constructed the system
(fifteen employees for the treatment plant and at least four people for the wastewater
treatment lagoons). Currently, the difference between expenses and income is being subsidized
from the Municipality of Chao’s annual budget. This practice cannot continue indefinitely so
clearly tariffs will need to increase. However, an already contentious issue is further complicated
by the instability of the local government. In July of 2012, the former Mayor ousted for reasons
of fraud and embezzlement and since that moment the public has not been receptive to the
interim government.
Unfortunately, political instability is only one of many obstacles that have resulted in the
absence of a clear management plan for the new water and sanitation service. Legal disputes
with landowners, design flaws, and financial problems all highlight the absence of regular
communication between all involved stakeholders (i.e. the Municipality, the national
government, the regional water authority, CHAVIMOCHIC project, the design company, the
construction company, and the public).
At the time of writing, the new service is serving Chao and Nuevo Chao II households.
The water quality provided is inconsistent and the continuity of the water is still for three hours
47
per day11. The revenue is insufficient to pay for effective operation of the treatment plant and
oxidation ponds, not to mention for the systems short- and long-term maintenance
requirements. Meanwhile, the oxidation ponds (i.e. wastewater treatment plant) are on the
verge of overflow due to the absence of an agreed upon point of discharge. Because of the
aforementioned problems, informing and educating the public about the new and improved
water and sanitation service has become a non issue; a task that can be done later should time
and money become available.
3.2 Data Collection
In order to address the objectives of this study, information was collected by several
means including: an extensive literature review; semi-structured interviews; field visits/site
inspections; informal focus groups; key informant interviews, and households surveys. The key
informant interviews were conducted with the former and current Mayors of Chao, the head
chief of SADISCHAO, the principal engineers involved in the construction of the water and
wastewater treatment plants, as well as an engineer from the regional (La Libertad) water
authority (Autoridad Nacional de Agua - ANA).
Additional data provided by the Municipality of Chao includes SADISCHAO’s income and
expense reports and a digital CD that includes the original project proposal, design plans, and
operation and maintenance manuals.
3.2.1 Survey Development and Design
The principal source of information for this study was data collected from two periods of
household surveys. In order to gain a better understanding of households’ existing water use
behaviors, perceptions, and values, as they reveal the existing and potential household demand
11 However, while three hours is the time it takes the reservoir to empty, as this study will reveal
in Chapter Four, distribution of water is not equitable and some households in Chao receive less than a half hour of water daily.
48
for water, surveys gathered both qualitative and quantitative information. Questions solicited
households’ socio-economic characteristics, water sources, perceived usage, water-related
knowledge, their opinions and preferences regarding their current (and hypothetical future)
water service, and their willingness to pay for a variety of hypothetical improvements to their
existing (non-existing) water (and sanitation) services (Appendices D and E). The questions of
the first and second survey instruments both amounted to roughly four standard, A-4, sized
pages, printed in double-sided fashion such that each survey was two-pages in length.
As previously mentioned in Chapter One, the original intention of the study was to
capture a ‘before’ and ‘after’ picture of how the transition to an improved water and sanitation
service would affect household water demand (stated versus revealed preferences). After
conducting the first round of surveys it became clear that such a transition would not occur
before the author of this thesis ended her two-year Peace Corps service in Chao. As such, the
second round of surveys was seen as an opportunity to capture seasonal differences and
enhance data collected during the first round. The original survey instrument (Appendix D) was
modified and field-tested before beginning the second round of surveys (Appendix E). One
principal difference to the second round of surveying was the use of visual aids for some of the
more complex questions. For specific details regarding questions that were either eliminated
from or added to the second survey tool refer to Appendix F.
Overall, the household surveys were designed with coastal Peruvian cultural norms of
surveying and communication in mind. Specifically, throughout their development, the surveys
were regularly reviewed with the head of SADISCHAO and his respective employees. In
addition, the survey and consent form were reviewed with those who have significant
experience conducting household surveys, SISFOH (Sistema de Focalización de Hogares), the
equivalent of the U.S. Census Bureau. The surveys were then field tested amongst residents of

49
both Chao and Nuevo Chao. All changes that were recommended by and/or resulted from the
test surveys were made prior to beginning data collection. Finally, before beginning the first
data collection period, the study’s protocol, survey instruments, and waiver of consent were
approved by the Institutional Review Board at the University of South Florida (Appendix A).
As seen in Appendices D and E, the questions of the survey were designed to better
understand the existing level of water use as well as to begin to identify whether certain
behaviors were born out of circumstance and/or were the expression of underlying water-
related beliefs and opinions. Perhaps the most complex portion of the survey was the
willingness to pay (WTP) section. Also known as contingent valuation, WTP was utilized in both
surveys as a way to measure household demand for service upgrades in the form of increased
continuity, improved water quality, sewage, and all aspects coupled together. This stated
preference approach was selected after a thorough review of the literature that addressed both
the pros and cons of the method (Akram & Olmstead, 2011) (Whittington, 2010) (Whittington &
Nauges, 2010) (Whittington, 2002). The questions and their presentation were then carefully
formulated accordingly. Specifically, a close-ended, dichotomous (Yes/No), format was used
where price increased according to the degree of improvement the scenario offered.
Enumerators were trained to read the various improvement scenarios verbatim. Prior to
beginning the WTP section it was made clear to the respondent that the proposed tariffs were a
hypothetical consideration to assess the preferences of the population, and would not result in
a new, government-enforced, tariff. Then, respondents were asked (as translated to English),
‘Now I will ask you if you are willing to pay a specified amount to improve some aspects of your
water service. Please respond Yes or No according to your desire for, but also to your ability to
pay for, a service such as I am about to describe.’ While the introductory piece described above
was consistent between the Round I survey instrument and the Round II survey instrument, the
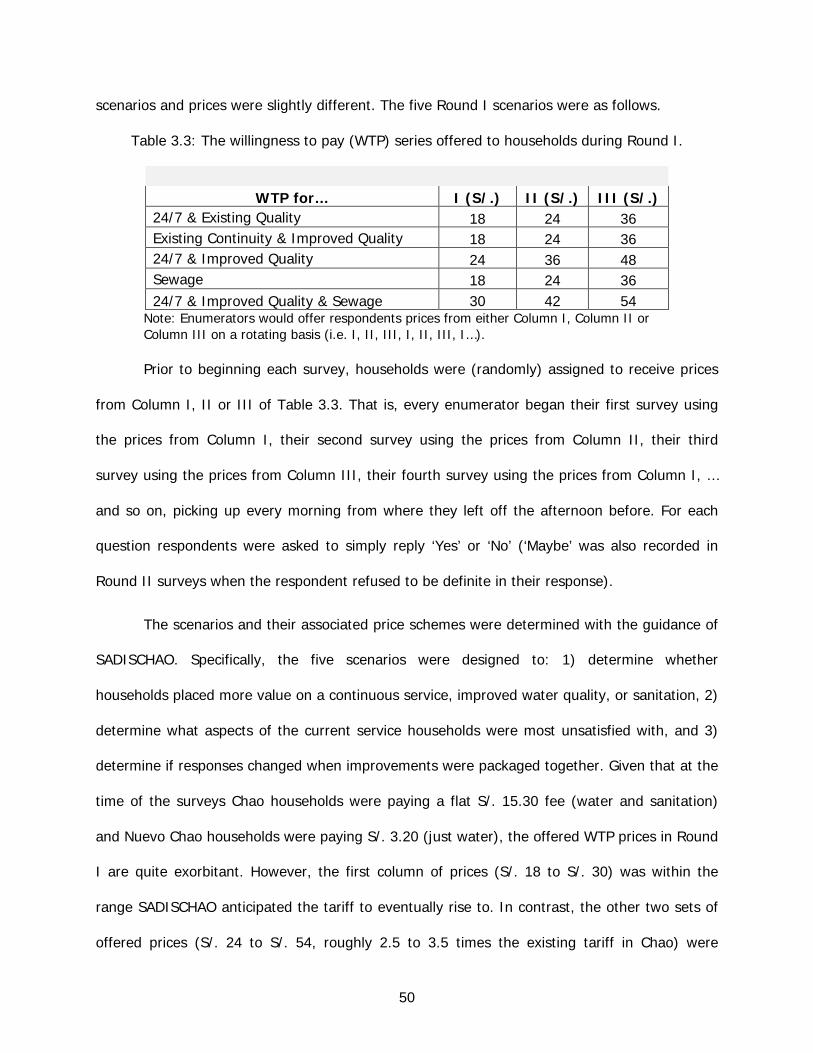
50
scenarios and prices were slightly different. The five Round I scenarios were as follows.
Table 3.3: The willingness to pay (WTP) series offered to households during Round I.
WTP for… I (S/.) II (S/.) III (S/.)
24/7 & Existing Quality 18 24 36 Existing Continuity & Improved Quality 18 24 36 24/7 & Improved Quality 24 36 48 Sewage 18 24 36 24/7 & Improved Quality & Sewage 30 42 54
Note: Enumerators would offer respondents prices from either Column I, Column II or Column III on a rotating basis (i.e. I, II, III, I, II, III, I…). Prior to beginning each survey, households were (randomly) assigned to receive prices
from Column I, II or III of Table 3.3. That is, every enumerator began their first survey using
the prices from Column I, their second survey using the prices from Column II, their third
survey using the prices from Column III, their fourth survey using the prices from Column I, …
and so on, picking up every morning from where they left off the afternoon before. For each
question respondents were asked to simply reply ‘Yes’ or ‘No’ (‘Maybe’ was also recorded in
Round II surveys when the respondent refused to be definite in their response).
The scenarios and their associated price schemes were determined with the guidance of
SADISCHAO. Specifically, the five scenarios were designed to: 1) determine whether
households placed more value on a continuous service, improved water quality, or sanitation, 2)
determine what aspects of the current service households were most unsatisfied with, and 3)
determine if responses changed when improvements were packaged together. Given that at the
time of the surveys Chao households were paying a flat S/. 15.30 fee (water and sanitation)
and Nuevo Chao households were paying S/. 3.20 (just water), the offered WTP prices in Round
I are quite exorbitant. However, the first column of prices (S/. 18 to S/. 30) was within the
range SADISCHAO anticipated the tariff to eventually rise to. In contrast, the other two sets of
offered prices (S/. 24 to S/. 54, roughly 2.5 to 3.5 times the existing tariff in Chao) were

51
developed with the understanding that some of the middle to high-income households were
paying upwards of S/. 200 per month on their cellphone and/or electricity bills. While such
expensive water tariffs are highly unlikely to occur, they were intended to act as a gauge to 1)
households’ underlying perceptions of what a “fair” price for water is, 2) whether households
were taking the WTP exercise seriously. In Section 4.6 the data collected from Round I will be
compared with the data collected from Round II, which altered the scenarios and prices of the
first round as follows.
Table 3.4: The willingness to pay (WTP) series offered to households during Round II.
WTP for… I (S/.) II (S/.) III (S/.)
6 hours & Existing Quality 18 24 30 12 hours & Existing Quality 20 26 32 24/7 & Existing Quality 22 28 34 Existing Continuity & Improved Quality 18 24 30 12 hours & Improved Quality 24 30 36
Note: Enumerators would offer respondents prices from either Column I, Column II or Column III on a rotating basis (i.e. I, II, III, I, II, III, I…). In contrary to Round I, all scenarios include sewage and this was clearly indicated by an accompanying visual.
With regard to the variation in scenarios, this was done because it became clearer as
time went on that the new water service would not be 24/7 as the Mayor had previously
suggested. Instead, it would continue to be intermittent. As such, the three continuity scenarios
(six hours, twelve hours, and twenty-four hours) were used to gauge the value residents placed
on continuity, and to what degree. Similar to the first round, continuity was then directly
compared to water quality, and lastly, a package scenario was offered. Sewage was not
separated as it was in Round I as to not confuse Chao households who assume its inclusion to
be a given. With regard to prices, as shown in Table 3.4, the tariffs offered in Round II were
significantly lower than those offered in Round I. With guidance from SADISCHAO Round II
prices were designed to stay within the potential minimum and maximum tariff. This is not to

52
suggest that SADISCHAO will be using the WTP results to establish their new water tariff,
simply that Round II prices were more relevant to existing norms in Peru. Consequently, the
first price in each column of Table 3.4 was 1.2 (Column I), 1.6 (Column II), or 2 (Column III)
times Chao’s existing tariff (S/. 15.30). Another difference was the addition of a visual aid to
help guide respondents along. The aforementioned changes aside, the assignment of
households to receive prices from Column I, II or III and the verbatim delivery of the questions
remained the same as Round I.
Before closing discussion of the WTP section, it is important to note that although Nuevo
Chao households were experiencing a very different water and sanitation scenario (paying
almost one-fifth (S/. 3.20) the monthly fee paid by Chao households and with no sanitation),
SADISCHAO and the author of this thesis decided to offer households, regardless of their
location, a uniform price scheme in the surveys. This was done because SADISCHAO anticipated
that shortly after the transition to the new service, the Municipality of Chao, with oversight by
the national regulatory authority SUNASS, would have to establish a universal tariff.
3.2.2 Surveying Methodology
Data collection was carried out in two periods, Round I and Round II. During each
survey period, the Principal Investigator (i.e. the author of this thesis) led the survey team.
During Round I the team consisted of nine individuals (the Principal Investigator, seven
employees from the Municipality of Chao, and a water and sanitation Peace Corps volunteer).
During the two-week survey period, on average, three of the eight trained enumerators
accompanied the Principal Investigator on a daily basis. This variable enumerator participation
was the result of unanticipated Municipal obligations. While the unpredictability of day-to-day
fieldwork was not ideal, it was expected based on the author’s prior experience. Regardless,
surveys were successfully collected despite the less than ideal conditions. Round II employed

53
seven individuals (the Principal Investigator, two employees from the Municipality of Chao, and
four residents of Chao/Nuevo Chao who had formal experience in conducting household
interviews). In contrast to Round I, all enumerators accompanied the Principal Investigator on a
daily basis until the calculated sample size had been collected.
Prior to beginning each data collection period, the enumerators went through a
thorough training process that included a comprehensive introduction to the study’s objectives,
the verbal consent process, and explicit instructions regarding how to administer and record
each question. For example, enumerators were told when and how to address the occasional
blank stare or perhaps a respondent whose most frequent response is no sabe (don’t know)12.
Finally, prior to collecting actual data, enumerators practiced administering the surveys with one
another as well as in the field with supervision and guidance from the Principal Investigator.
During each phase of data collection, the total population was divided into two separate
cohorts, Chao and Nuevo Chao, for which sample sizes were determined independently.
3.2.2.1 Calculation of Sample Size
The number of households to be surveyed was determined using data from the
Municipality of Chao’s water office SADISCHAO together with the MaCorr Research Solutions
online sample size calculator. The online calculator calculates sample size based on the
following equation (MaCorr Research, 2013).
ss = Z! ∗ ! ∗ (1 − !)C!
12 Some questions were meant to specifically capture what a respondent knew; in these cases
“don’t know” is a valid, and valuable, response. In other cases, however, don’t know was simply coded as a 990 (missing). For example, for the estimation of household water storage capabilities enumerators were encouraged to help respondents make their estimate. This meant using observation to know when respondents were not thinking to include all of their buckets, tanks, etc. and reminding respondents that the commonly owned balde de aciete (repurposed vegetable oil bucket) held 18 Liters.

54
In this equation ss= Sample Size, Z = 1.95 (Confidence Level), P = 0.5 (% picking a
choice, where picking choice is the standard deviation for a normally distributed variable), C =
Confidence Interval, and Pop = Population. Using a 95% confidence level, and a +/- 5%
confidence interval, Table 3.5 below summarizes the calculated sample sizes as determined with
the MaCorr Research Solutions online sample size calculator.
Table 3.5: Calculation of study’s sample size.
Location Population No. Households
Calculated Sample Size
5% CI
Calculated Sample Size
6% CI Chao 12,090 2,219 328 238
Nuevo Chao 18,555 981 276 210 Note: This summary of population sizes, number of residences, and calculated sample size for each community was determined from information given by the Municipality of Chao in December of 2010. An appropriate sample size was not calculated for the Well user group as the Municipality had no definitive idea of exactly how many households at the time were actually relying on wells.
The number of enumerators sought and the time frame during which the surveys were
administered were determined according to the sample size calculated for a 95% confidence
level and +/- 5% confidence interval. However, unanticipated events in Round I surveys
resulted in a slightly smaller sample size than Round II (Table 3.6). That said, the sample size
collected in the Round I was still robust exceeding the number necessary for a 95% confidence
level, 6% confidence interval (Table 3.5). Data collection was as follows:
Table 3.6: Actual sample size obtained, by sector.
Survey Period Duration Households Visited
Chao Nuevo Chao TOTAL
I January 23rd-February 3rd 276 224 500
II September 17th-28th 347 302 649 TOTAL - 623 526 1149
Note: Round I occurred over Peru’s summer while Round II could be considered winter.

55
Within Chao there are houses with a water service, and houses that still use household
or local, primarily un-improved, wells. Those of the latter group either reside within sectors in
Chao that are still not connected to the distribution matrix or simply choose to forego the
service for financial, quality and/or convenience reasons. Due to an unknown number of
households in such a situation, Chao and Well users were treated as one cohort. However,
when of interest, all households that still depend on wells (not including households that have
both a water tap and well) will be analyzed separately. Sudman (1976) suggests that a
minimum of 100 elements is needed for each major group in a sample and 20 to 50 elements is
necessary for each subgroup. Given that during Round I 62 Well users were surveyed, and
another 50 during Round II, the sample size is sufficient.
3.2.2.2 Survey Execution and Endorsements
Surveys were conducted over the course of two weeks (twelve days) between 8 a.m.
and 6 p.m. No surveys were conducted after 6 p.m. for reasons of safety. It was found that
interviewing between 11:30 a.m. to 2 p.m. was also difficult as this was the time period during
which households prepared and ate their largest meal of the day. During each survey period all
neighborhoods of both Chao and Nuevo Chao were covered. Blocks were selected on a random
basis and, when possible, households were selected in an every-other pattern. Due to the large
portion of homes left vacant during various parts of the workday, on average every six to ten
households per randomly selected block were interviewed. As the majority of the population
works in the fields and their days of rest are variable, the portion of the population that was
captured was random. In other words, stay-at-home mothers were not the only socio group
surveyed. Each surveyed household’s street and house number were noted but no other
identifying data such as the name of the respondent or their DNI (national identification
number) were recorded.

56
From the very beginning of the study, the Mayor of the District Municipality of Chao
acknowledged his support. In November of 2011, his verbal endorsement was solidified in a
formal written agreement (Appendix B). In addition to providing personnel for the survey
process, the Municipality also offered paper, access to a printer and photocopy machine,
transportation, and overall guidance during the survey’s development process.
To participate in the survey, a respondent had to be an adult13 living in either Chao or
Nuevo Chao. The survey was administered on a purely volunteer basis to ensure that the
respondent was willing to take, on average, twenty-five minutes to thoughtfully respond to all
questions. In conduct with cultural norms, surveys were conducted in the respondents’
doorways unless, as often happened, the respondent invited the enumerator to come inside and
sit down.
The Institutional Review Board of the University of South Florida approved a waiver of
signed consent (Appendix C). That said, prior to beginning all surveys, care was taken to
explain the research motivation and goals of the study in a manner that was understandable to
all participants. In addition, the confidentiality of the survey was always explained to each
participant before questions began. Following this explanation, time was allowed for the
participant to ask, and the enumerator to answer, any potential questions and uncertainties.
Finally, after informing potential participants that taking part in the survey was voluntary,
participants were asked to give verbal consent. If at any time during the course of the survey
the participant changed their mind, they were free to stop answering any further questions.
Overall, data from such instances only made up a small 1.6% of the surveys conducted and was
not used.
13 As determined by the local culture, adult was defined to be ≥16 years old.
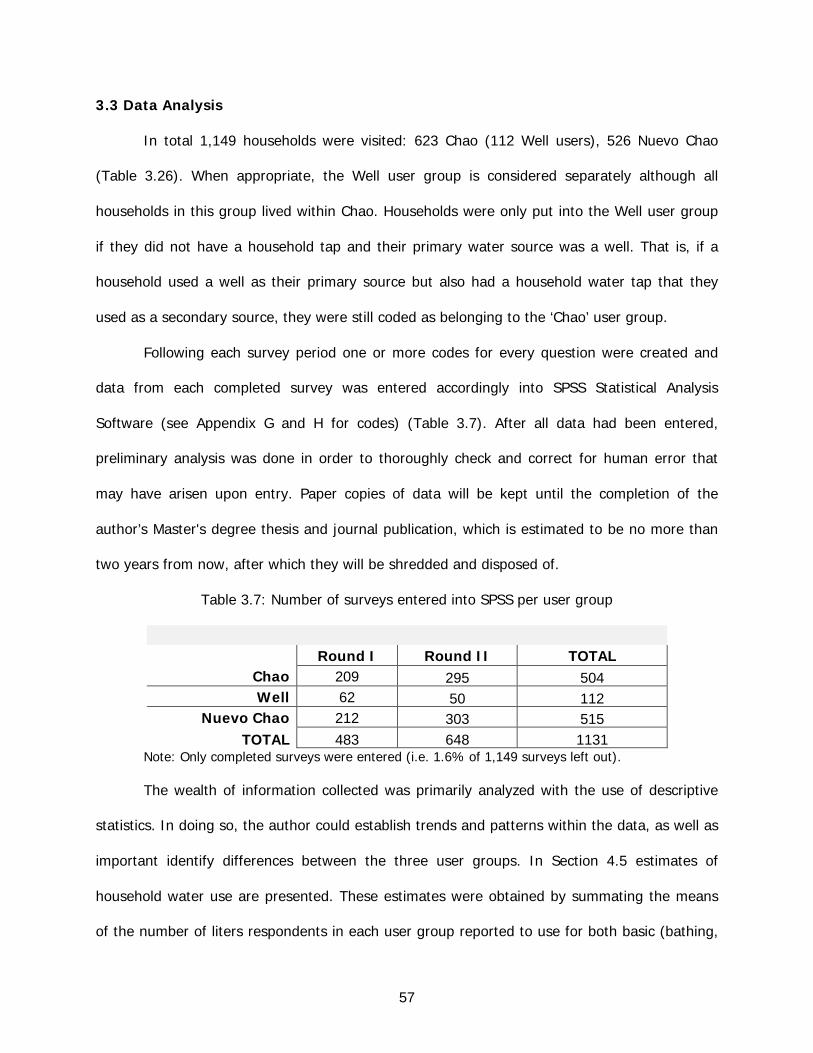
57
3.3 Data Analysis
In total 1,149 households were visited: 623 Chao (112 Well users), 526 Nuevo Chao
(Table 3.26). When appropriate, the Well user group is considered separately although all
households in this group lived within Chao. Households were only put into the Well user group
if they did not have a household tap and their primary water source was a well. That is, if a
household used a well as their primary source but also had a household water tap that they
used as a secondary source, they were still coded as belonging to the ‘Chao’ user group.
Following each survey period one or more codes for every question were created and
data from each completed survey was entered accordingly into SPSS Statistical Analysis
Software (see Appendix G and H for codes) (Table 3.7). After all data had been entered,
preliminary analysis was done in order to thoroughly check and correct for human error that
may have arisen upon entry. Paper copies of data will be kept until the completion of the
author’s Master's degree thesis and journal publication, which is estimated to be no more than
two years from now, after which they will be shredded and disposed of.
Table 3.7: Number of surveys entered into SPSS per user group
Round I Round II TOTAL Chao 209 295 504 Well 62 50 112
Nuevo Chao 212 303 515 TOTAL 483 648 1131
Note: Only completed surveys were entered (i.e. 1.6% of 1,149 surveys left out).
The wealth of information collected was primarily analyzed with the use of descriptive
statistics. In doing so, the author could establish trends and patterns within the data, as well as
important identify differences between the three user groups. In Section 4.5 estimates of
household water use are presented. These estimates were obtained by summating the means
of the number of liters respondents in each user group reported to use for both basic (bathing,
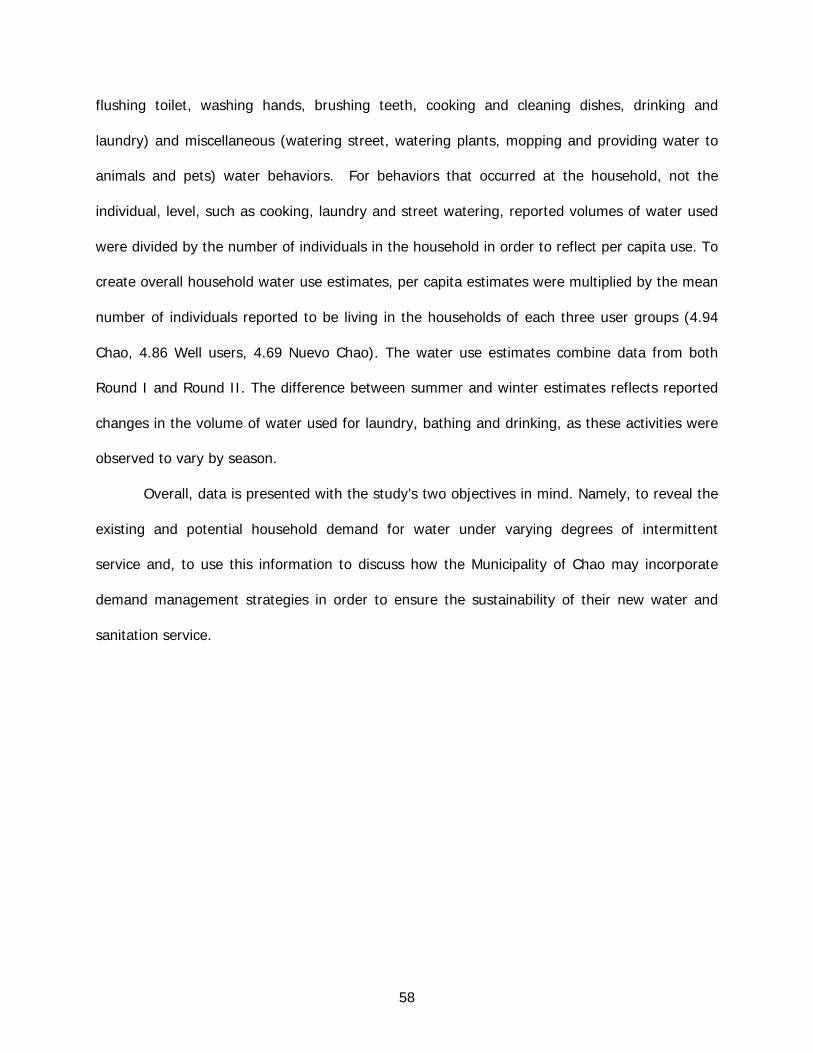
58
flushing toilet, washing hands, brushing teeth, cooking and cleaning dishes, drinking and
laundry) and miscellaneous (watering street, watering plants, mopping and providing water to
animals and pets) water behaviors. For behaviors that occurred at the household, not the
individual, level, such as cooking, laundry and street watering, reported volumes of water used
were divided by the number of individuals in the household in order to reflect per capita use. To
create overall household water use estimates, per capita estimates were multiplied by the mean
number of individuals reported to be living in the households of each three user groups (4.94
Chao, 4.86 Well users, 4.69 Nuevo Chao). The water use estimates combine data from both
Round I and Round II. The difference between summer and winter estimates reflects reported
changes in the volume of water used for laundry, bathing and drinking, as these activities were
observed to vary by season.
Overall, data is presented with the study’s two objectives in mind. Namely, to reveal the
existing and potential household demand for water under varying degrees of intermittent
service and, to use this information to discuss how the Municipality of Chao may incorporate
demand management strategies in order to ensure the sustainability of their new water and
sanitation service.

59
CHAPTER 4: RESULTS
The results of the household surveys14 as they pertain to the first objective of this study
will be presented and discussed in the following sections. Section 4.1 presents the socio-
economic characteristics of the population. The first objective evaluates how the intermittent
water services have conditioned the use and demand for water among the three user groups as
it relates to Quantity (Section 4.2), Quality (Section 4.3), and as it is revealed through existing
household water behaviors, both conserving and wasteful (Section 4.4), and overall household
water use (Section 4.5). Then, latent demand as expressed by willingness to pay for service
improvements will be examined (Section 4.6).
4.1 Socio-Economic Characteristics of the Population
The main objectives of this study are addressed through the examination of three
distinct populations and differences in their use, perceptions, and value of water. The three
groups are 1) Chao households receiving a three-hour, every day, service; 2) Chao households
solely relying on household wells, by choice and by circumstance; and 3) Nuevo Chao
households receiving a one-hour, every-other-day, service. Socio-economic characteristics of
the respondents interviewed in each subgroup, are summarized in Table 4.1. Additional details
are available in the data but are not presented here. These include: family structure (adults,
youth, children), occupation, the reported monthly cost of other services, amenities (television,
camera, computer, blender, refrigerator, and washing machine), reported plans to purchase
amenities in the coming years, and for variables where means were reported (age, family size,
14 For a complete understanding of the sample size used to calculate the information presented in
the following tables, figures and discussion please refer to Appendix I.

60
income, etc.), a more detailed breakdown by categories.
As Table 4.1 shows, across all three subgroups, the majority of survey participants (74%
Chao, 70% Well Users, 82% Nuevo Chao) were women. Although both men and women work,
primarily in agriculture (71% average), the majority of women are also still responsible for
cooking and childcare and thus are more frequently found at home on their days off. With
respect to economic standing, considering the mean reported household incomes (S/. 1060
Chao, S/. 871 Nuevo Chao), housing materials (~30% brick Chao, 15% brick Nuevo Chao), and
additional services, it is clear that the majority of households in Chao are more well off than
households in Nuevo Chao (although home ownership is slightly higher in Nuevo Chao at
94.3%). With respect to the population as a whole, very few families have landlines (1.5%),
Internet (2.8%), or a mode of personal transportation (6.8%). Aside from households that
solely rely on wells, on average households in Chao have lived in the urban area of the district
of Chao five years longer than households in Nuevo Chao. Roughly 54% of the population
interviewed has lived the majority, or entire, of their life on the coast with the remainder hailing
primarily from the mountains (~40%), with a small portion (~6%) emigrating from the jungle.
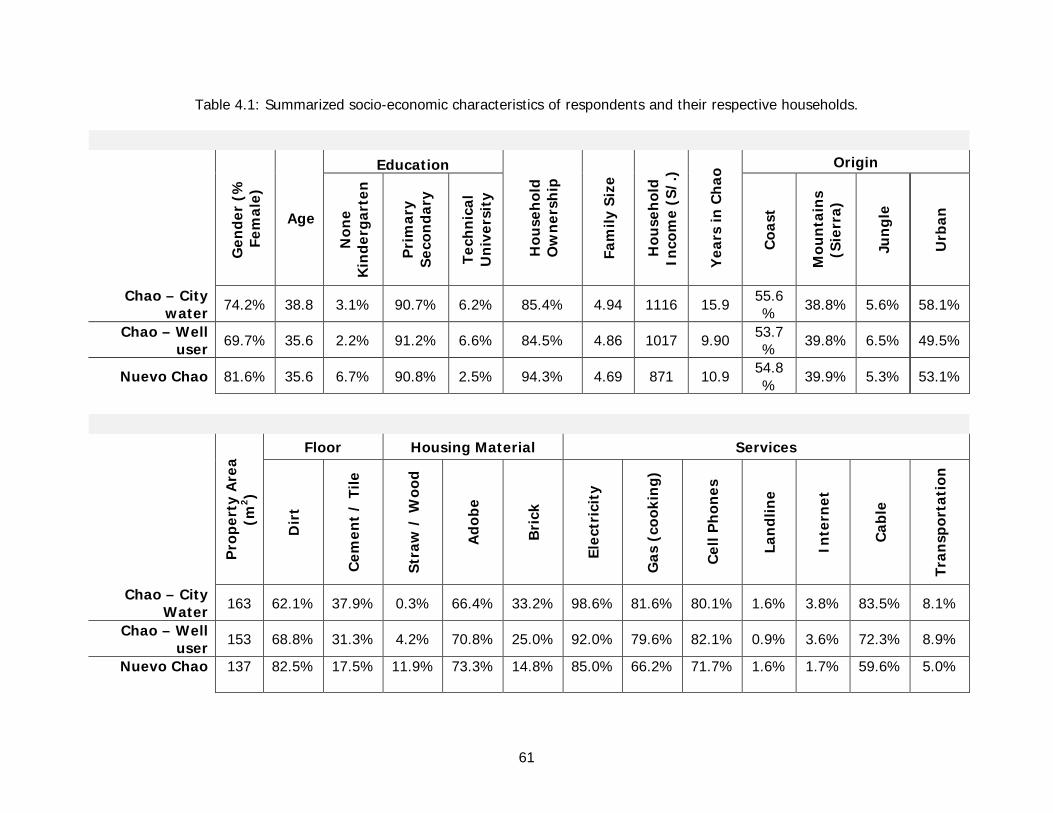
61
Table 4.1: Summarized socio-economic characteristics of respondents and their respective households.
Gen
der
(%
Fe
mal
e)
Age
Education
Hou
seh
old
O
wn
ersh
ip
Fam
ily S
ize
Hou
seh
old
In
com
e (S
/.)
Yea
rs in
Ch
ao Origin
Non
e K
ind
erg
arte
n
Pri
mar
y S
econ
dar
y
Tech
nic
al
Un
iver
sity
Coa
st
Mou
nta
ins
(Sie
rra)
Jun
gle
Urb
an
Chao – City water 74.2% 38.8 3.1% 90.7% 6.2% 85.4% 4.94 1116 15.9 55.6
% 38.8% 5.6% 58.1%
Chao – Well user 69.7% 35.6 2.2% 91.2% 6.6% 84.5% 4.86 1017 9.90 53.7
% 39.8% 6.5% 49.5%
Nuevo Chao 81.6% 35.6 6.7% 90.8% 2.5% 94.3% 4.69 871 10.9 54.8% 39.9% 5.3% 53.1%
Pro
per
ty A
rea
(m2 )
Floor Housing Material Services
Dir
t
Cem
ent
/ Ti
le
Str
aw /
Woo
d
Ad
obe
Bri
ck
Elec
tric
ity
Gas
(co
okin
g)
Cel
l Ph
ones
Lan
dlin
e
Inte
rnet
Cab
le
Tran
spor
tati
on
Chao – City Water 163 62.1% 37.9% 0.3% 66.4% 33.2% 98.6% 81.6% 80.1% 1.6% 3.8% 83.5% 8.1%
Chao – Well user 153 68.8% 31.3% 4.2% 70.8% 25.0% 92.0% 79.6% 82.1% 0.9% 3.6% 72.3% 8.9%
Nuevo Chao 137 82.5% 17.5% 11.9% 73.3% 14.8% 85.0% 66.2% 71.7% 1.6% 1.7% 59.6% 5.0%

62
4.2 Demand and Quantity
4.2.1 Existing Availability
In the absence of water meters, it is critical to determine how the water produced is
actually being distributed. As seen in Figure 4.1, the distribution of available water does not
reflect the previous stated service. In fact, when availability is averaged out between summer
and winter months, only 29.4% of Chao’s population is falling within the specified service
range, as compared to 70.9% in Nuevo Chao.
Note: For Nuevo Chao reported service continuity is every other day as opposed to daily in Chao.
Figure 4.1: Reported continuity of water services – summer versus winter.
Households not within the stated service range fall either above or below it. In Chao
households reported to have as little as 30 minutes of water and as much as 12 hours of water.
In Nuevo Chao, the service, while shorter, appears to be more equitable. That is, reported
duration of service only ranged from 30 minutes to three hours. However, it is concerning that
during both the summer (19.7%) and winter (16.8%) nearly a fifth of the population in Nuevo
Chao is receiving water for less than 30 minutes every other day. Overall, households in Chao
0%
20%
40%
60%
80%
≤ 3
0 m
in
30 <
x ≤
1
1 <
x ≤
2
2 <
x ≤
3
3 <
x ≤
6
>6
Chao-summer
Nuevo Chao-summer
Chao-winter
Nuevo Chao-winter

63
receive, on average, four times the access to potable running water as households in Nuevo
Chao (assuming averages of two hours daily compared to one hour every other day).
In addition to the services duration, the hour at which water arrives may affect
households’ consumption. Table 4.2 outlines the hour that households’ reported they begin to
receive water.
Table 4.2: Reported arrival time (i.e. schedule) of water services.
Morning (5am-11am)
Mid-day (11am-3pm)
Late Afternoon
(3pm-6pm)
Evening (6pm-9pm)
Sleeping (9pm-5am)
Chao 42.8% 0.4% 50.7% 3.2% 2.9% Nuevo Chao 29.5% 12.9% 14.4% 18.0% 25.2%
Note: Hours of ‘sleeping’ were determined according to two years of observing cultural norms of the study areas.
Although the duration of water provided to Nuevo Chao households is fairly equitable
(Figure 4.1), as Table 4.2 shows, the time of day at which it arrives it not. That is, in Chao
households primarily receive water in the morning or late afternoon. In Nuevo Chao the
schedule is more variable with 25.2% of the population receiving water in the middle of the
night. Affected respondents would often comment how they would sometimes not want to or
forget to wake up to fill their storage devices. In addition, respondents receiving water in the
evening (3.2% Chao and Nuevo Chao 18%) are less apt to take advantage of arriving water
beyond storing water for the next day(s) (i.e. if they are able to fill their storage devices and
there is still time remaining, they do not take advantage of the running water for laundry, a
long shower, or watering the street, etc.).
With respect to these comments and observations, households were explicitly asked
whether the schedules of their water service affected their daily schedule; 12.1% of Chao
households, and 24.0% of Nuevo Chao households, reported that ‘Yes,’ the arrival time did
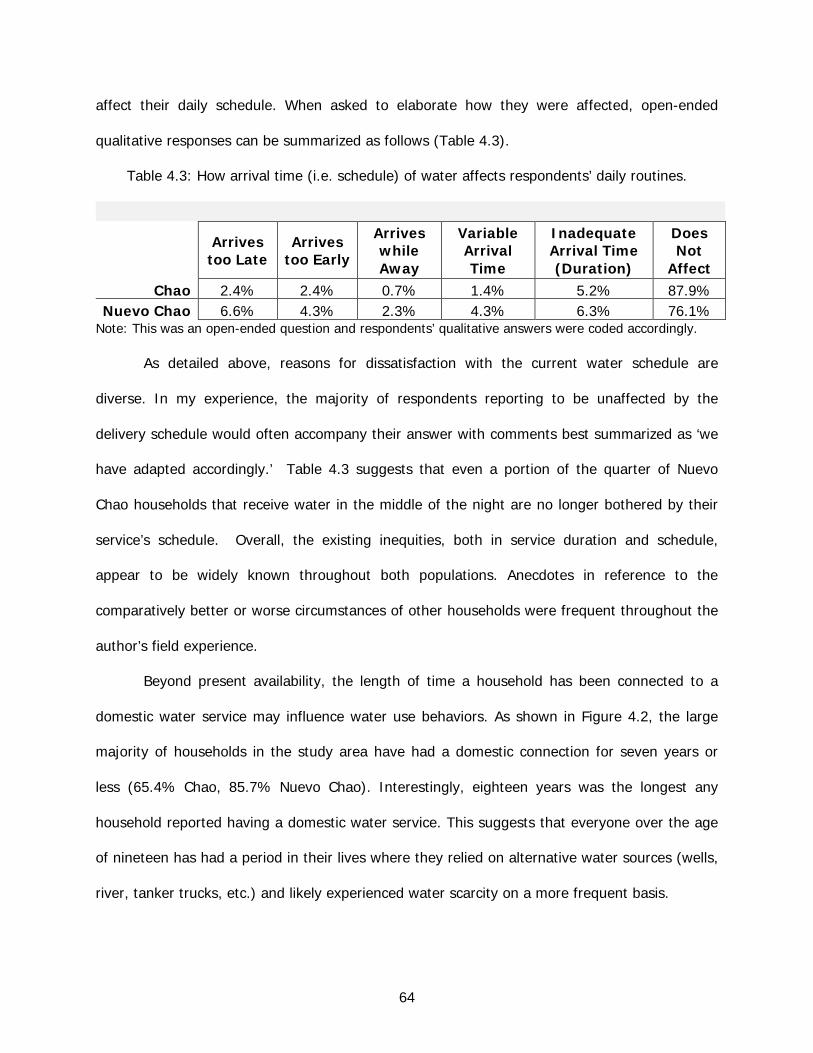
64
affect their daily schedule. When asked to elaborate how they were affected, open-ended
qualitative responses can be summarized as follows (Table 4.3).
Table 4.3: How arrival time (i.e. schedule) of water affects respondents’ daily routines.
Arrives
too Late Arrives
too Early
Arrives while Away
Variable Arrival Time
Inadequate Arrival Time (Duration)
Does Not
Affect Chao 2.4% 2.4% 0.7% 1.4% 5.2% 87.9%
Nuevo Chao 6.6% 4.3% 2.3% 4.3% 6.3% 76.1% Note: This was an open-ended question and respondents’ qualitative answers were coded accordingly.
As detailed above, reasons for dissatisfaction with the current water schedule are
diverse. In my experience, the majority of respondents reporting to be unaffected by the
delivery schedule would often accompany their answer with comments best summarized as ‘we
have adapted accordingly.’ Table 4.3 suggests that even a portion of the quarter of Nuevo
Chao households that receive water in the middle of the night are no longer bothered by their
service’s schedule. Overall, the existing inequities, both in service duration and schedule,
appear to be widely known throughout both populations. Anecdotes in reference to the
comparatively better or worse circumstances of other households were frequent throughout the
author’s field experience.
Beyond present availability, the length of time a household has been connected to a
domestic water service may influence water use behaviors. As shown in Figure 4.2, the large
majority of households in the study area have had a domestic connection for seven years or
less (65.4% Chao, 85.7% Nuevo Chao). Interestingly, eighteen years was the longest any
household reported having a domestic water service. This suggests that everyone over the age
of nineteen has had a period in their lives where they relied on alternative water sources (wells,
river, tanker trucks, etc.) and likely experienced water scarcity on a more frequent basis.
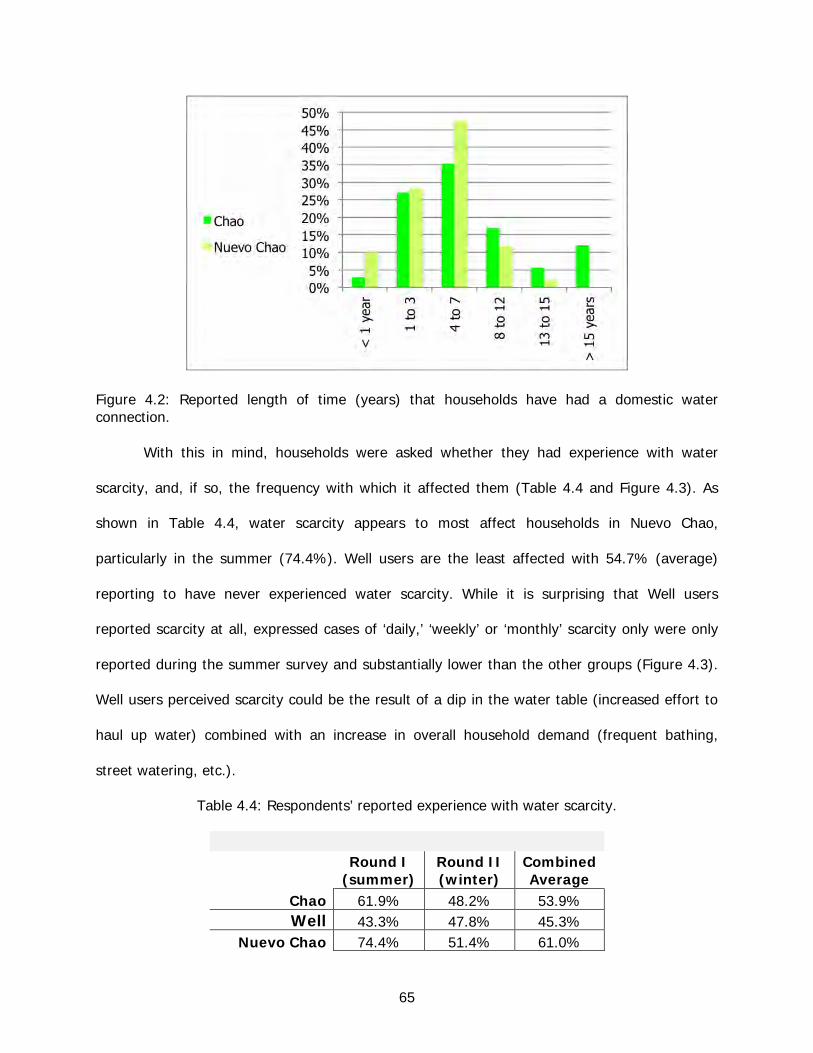
65
Figure 4.2: Reported length of time (years) that households have had a domestic water connection.
With this in mind, households were asked whether they had experience with water
scarcity, and, if so, the frequency with which it affected them (Table 4.4 and Figure 4.3). As
shown in Table 4.4, water scarcity appears to most affect households in Nuevo Chao,
particularly in the summer (74.4%). Well users are the least affected with 54.7% (average)
reporting to have never experienced water scarcity. While it is surprising that Well users
reported scarcity at all, expressed cases of ‘daily,’ ‘weekly’ or ‘monthly’ scarcity only were only
reported during the summer survey and substantially lower than the other groups (Figure 4.3).
Well users perceived scarcity could be the result of a dip in the water table (increased effort to
haul up water) combined with an increase in overall household demand (frequent bathing,
street watering, etc.).
Table 4.4: Respondents’ reported experience with water scarcity.
Round I (summer)
Round II (winter)
Combined Average
Chao 61.9% 48.2% 53.9% Well 43.3% 47.8% 45.3%
Nuevo Chao 74.4% 51.4% 61.0%

66
Note: (S) stands for data from Round I (i.e. summer) and (W) stands for data from Round II (i.e. winter).
Figure 4.3: Reported experience with water scarcity.
As shown in Figure 4.3, the substantial drop in reported ‘daily’ scarcity15 from Round I
(summer) to Round II (winter) (and substantial increase in reported ‘summer’ scarcity in Round
II) demonstrates that nearly 50% of respondents appear to perceive a seasonal difference in
water scarcity. To this point, it seems that households are so conditioned to poor water services
that having limited running water, and consequently having to make stored water last, does not
equate to suffering from water scarcity, but, having a comparatively shorter service time does
(recall Figure 4.1). From a developed world perspective, the intermittent service of either Chao
and Nuevo Chao’s water supply alone would constitute as scarcity on a daily basis.
Regardless of how water scarcity is perceived, the fact is that service cuts in Chao and
15 Specifically, in the summer months 17.6% of households in Chao expressed daily scarcity as
compared to 1.8% in the winter months. The same goes for Nuevo Chao where reported daily scarcity fell from 20.1% to 3.5%.

67
Nuevo Chao occur one or more times per month. Sometimes the cuts are intentional (cleaning
and maintenance), but most of the time they are the result of 1) an inability to utilize pump due
to loss of power or 2) a burst pipe. To better understand how households react to service cuts,
the second round of surveys had a follow-up question asking respondents exactly what water
sources they rely on when their stored water is exhausted.
Note: ‘Store & Conserve’ means that the household becomes more cautious of how much water they are using so as to make it last longer, and ‘Neighbor’ refers to asking neighbors for their extra tap water. If households went to their neighbors’ home because their neighbors had a well this was coded as ‘Well.’
Figure 4.4: Reported use of alternative water sources during periods of water scarcity.
As shown in Figure 4.4, the majority of families in Chao (73.4%) turn to wells during
periods of water scarcity. Sometimes this is a household well, but more often it is a neighbor’s
well or Chao’s community well. In Nuevo Chao, the situation is quite different with only 20.3%
of families reporting to use well water (9.3% from a community well and 11% pay to transport
water from wells in Chao or nearby small farms). The majority of households (62.9%) rely on
their neighbors even though the neighbors are in the same situation.
Overall, alternative water sources are significantly easier to access in Chao than in
Nuevo Chao (77.2% compared to 24.1%). Thus, while cuts to the water service are
inconvenient in Chao, absolute water scarcity is not as great of a threat as it is in Nuevo Chao.
This is reflected by 2.8% of Chao respondents reporting to be extra conscious of their water

68
during periods of scarcity as compared to 13.1% of Nuevo Chao respondents.
With respect to alternative sources, in comparison to other developing, water-scarce,
regions of the world, residents in Chao, and particularly Nuevo Chao, do not have many options
(Table 4.5). Specifically: there is infrequent rain (no opportunity for rain water catchment);
there are no established water vendors (tanker trucks); only a few households can afford
rooftop or underground cisterns (increased storage); and the two sources of surface water16 are
inconveniently located and suspected to be highly contaminated. For Chao this leaves the
options of wells and bottled water, and, for Nuevo Chao, essentially nothing (i.e. in Nuevo Chao
there are no wells and, for the majority, no money to purchase bottled water).
Table 4.5: Household use of alternative water sources.
Tap Well River / Canal Bottled N/A
PRIMARY Chao 96.3% 3.7% - - - Well - 100.0% - - -
Nuevo Chao 100.0% - - - - SECONDARY
Chao 3.7% 58.0% 3.4% 13.2% 21.7% Well 2.0% - 4.0% 6.0% 88.0%
Nuevo Chao - 10.9% 6.9% 2.6% 79.5% TERTIARY
Chao - 9.2% 2.7% 2.0% 86.1% Well - - - - 100.0%
Nuevo Chao - 0.3% 0.7% - 99.0% Note: The 3.7% of Chao households using a well as their primary source are not reported in the Well user group because they also have a household tap (i.e. for various reasons their preferred source was well water so tap water was noted as secondary source). N/A indicates the portion of households that did not report to use a secondary and/or tertiary source.
As Table 4.5 shows, and in line with Figure 4.4, far more Chao households (73.3%) use
a secondary source than in Nuevo Chao (20.5%). Well users hardly use alternative sources
16 A concrete agricultural canal, approximately two feet in width, runs down the southern edge of
Chao and the Chao River winds down the Chao’s northern edge.

69
(only 12% reported using a secondary source and no one reported using a tertiary source).
This is not surprising given that Well users have unlimited access to the most popular
alternative source, groundwater. However, despite the high number of Chao households
reporting to use wells, the majority does so infrequently (Table 4.6).
Table 4.6: Reported frequency with which respondents (households) use alternative sources.
No. Daily Weekly Monthly Seasonal
Only Use When Primary Water Source Unavailable
WELL Chao 146 7.5% 6.8% 1.4% - 84.2%
Nuevo Chao 40 2.5% 2.5% - - 95.0% BOTTLED WATER
Chao 40 67.5% 27.5% 2.5% - 2.5% Nuevo Chao 7 57.1% 42.9% - - -
RIVER Chao 19 5.3% 42.1% 26.3% 5.3% 21.1%
Nuevo Chao 21 14.3% 38.1% 14.3% 4.8% 28.6%
Respectively, of the 70.8% of Chao households reporting well use, only 14%17 of them
do so on daily or weekly basis (Table 4.6); of the 11.2% of Nuevo Chao households reporting
well use, only 5% do so on a daily or weekly basis (Table 4.6). After groundwater, the second
most popular alternative source in Chao was bottled water (13.2%), and in Nuevo Chao the
Chao River (6.9%) (Table 4.5). The majority of those who can afford to buy bottled water do
so frequently solely for the purpose of drinking (Table 4.6). This insinuates an unmet demand
when it comes to the quality of the tap water. Dissatisfaction with water quality is further
suggested by the fact that 64.3% of Chao households (excluding the Well user group) that
retrieve well water do so for the purposes of drinking and/or cooking. With respect to the latter,
17 Frequency data was only available for 146 (70.8%) of the 209 Chao households that reported
to use a well.
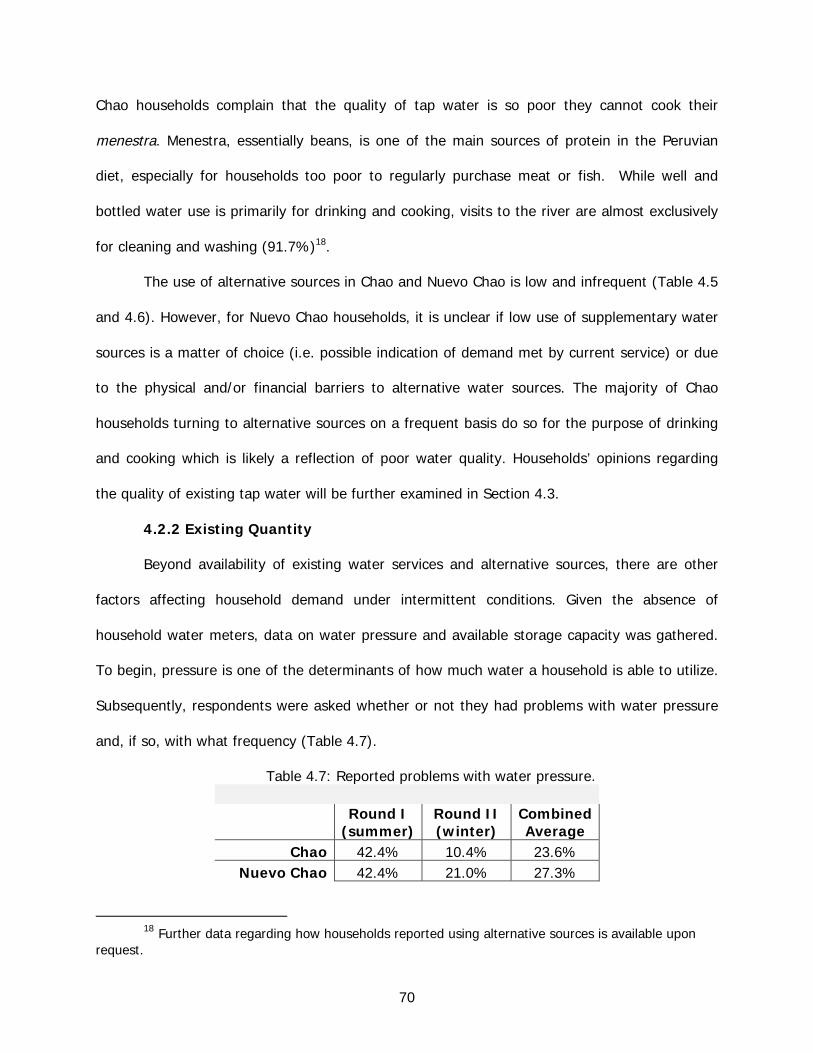
70
Chao households complain that the quality of tap water is so poor they cannot cook their
menestra. Menestra, essentially beans, is one of the main sources of protein in the Peruvian
diet, especially for households too poor to regularly purchase meat or fish. While well and
bottled water use is primarily for drinking and cooking, visits to the river are almost exclusively
for cleaning and washing (91.7%)18.
The use of alternative sources in Chao and Nuevo Chao is low and infrequent (Table 4.5
and 4.6). However, for Nuevo Chao households, it is unclear if low use of supplementary water
sources is a matter of choice (i.e. possible indication of demand met by current service) or due
to the physical and/or financial barriers to alternative water sources. The majority of Chao
households turning to alternative sources on a frequent basis do so for the purpose of drinking
and cooking which is likely a reflection of poor water quality. Households’ opinions regarding
the quality of existing tap water will be further examined in Section 4.3.
4.2.2 Existing Quantity
Beyond availability of existing water services and alternative sources, there are other
factors affecting household demand under intermittent conditions. Given the absence of
household water meters, data on water pressure and available storage capacity was gathered.
To begin, pressure is one of the determinants of how much water a household is able to utilize.
Subsequently, respondents were asked whether or not they had problems with water pressure
and, if so, with what frequency (Table 4.7).
Table 4.7: Reported problems with water pressure.
Round I (summer)
Round II (winter)
Combined Average
Chao 42.4% 10.4% 23.6% Nuevo Chao 42.4% 21.0% 27.3%
18 Further data regarding how households reported using alternative sources is available upon
request.

71
As seen in Table 4.7, nearly half of Chao (42.4%) and Nuevo Chao (42.4%) households
reported dissatisfaction with their water pressure during Round I. The drop in reported pressure
problems in Round II is not surprising given a decreased demand for water in the winter
months. When seasonal data are combined, roughly 25% of the population in both Chao and
Nuevo Chao appear to be bothered by pressure problems year-round. For affected households,
a lack of pressure often implies occupants are unable to fill their storage device(s) to capacity.
In addition, for households with a shower, regular pressure problems prohibit them from using
it for hygiene. That said, the frequency with which households report to be bothered by water
pressure is variable (Tables 4.8 and 4.9).
Table 4.8: Frequency of reported pressure problems, as varies by season.
Rarely Daily Weekly Monthly In Past
Round I (summer) Chao 33.3% 48.0% 13.7% 4.9% 0.0%
Nuevo Chao 56.2% 32.9% 8.2% 0.0% 2.7% Round II (winter)
Chao 16.7% 46.7% 10.0% 13.3% 13.3% Nuevo Chao 36.6% 31.0% 9.9% 4.2% 18.3%
Table 4.9: Reported pressure problems, overall perspective.
Never Rarely Daily Weekly Monthly In Past
Chao 72.6% 8.1% 13.1% 3.5% 1.9% 0.8% Nuevo Chao 64.9% 15.8% 10.8% 3.1% 1.9% 3.5%
Note: Table presents combination of data from Round I and Round II; where ‘Never’ reflects the portion of households not reporting any pressure problems.
Interestingly, Table 4.8 suggests that the proportion of pressure problems that are daily
does not vary by season (48.0%(S) vs. 46.7%(W) in Chao and 32.9%(S) vs. 31.0%(W) in
Nuevo Chao). When seasonal data are combined and expressed in relation to the total
(respondents’ who did and did not report pressure problems), it appears that 13.1% of Chao
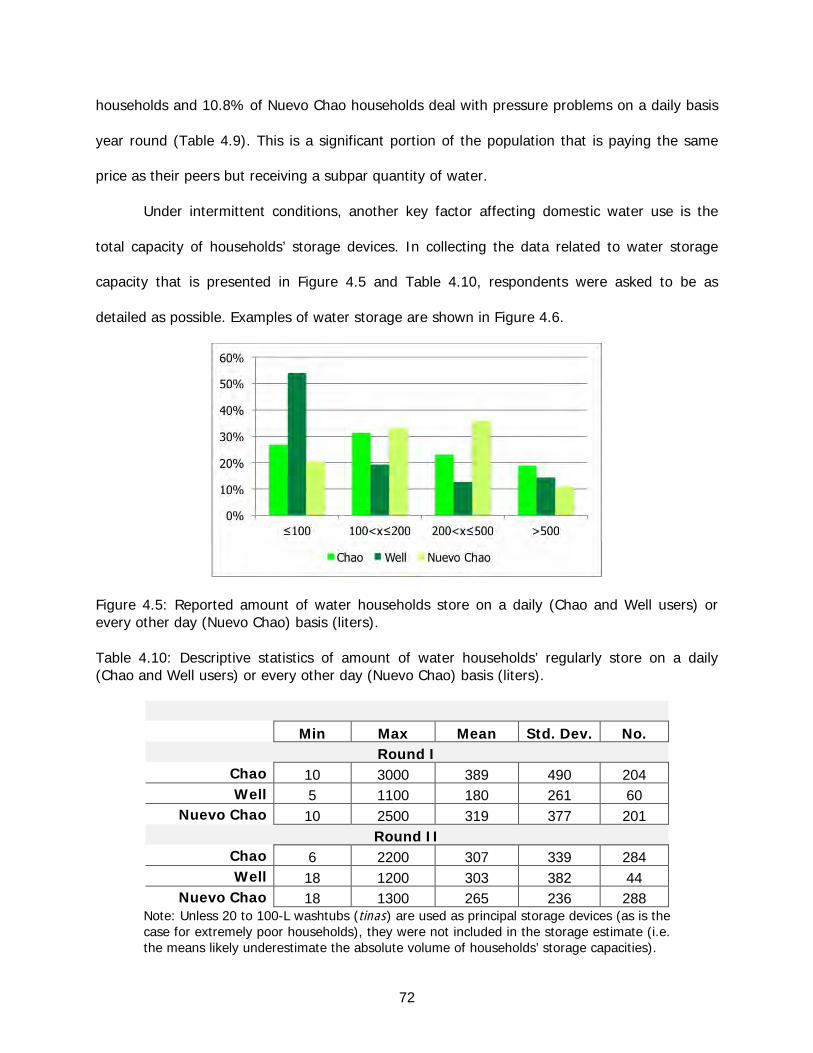
72
households and 10.8% of Nuevo Chao households deal with pressure problems on a daily basis
year round (Table 4.9). This is a significant portion of the population that is paying the same
price as their peers but receiving a subpar quantity of water.
Under intermittent conditions, another key factor affecting domestic water use is the
total capacity of households’ storage devices. In collecting the data related to water storage
capacity that is presented in Figure 4.5 and Table 4.10, respondents were asked to be as
detailed as possible. Examples of water storage are shown in Figure 4.6.
Figure 4.5: Reported amount of water households store on a daily (Chao and Well users) or every other day (Nuevo Chao) basis (liters). Table 4.10: Descriptive statistics of amount of water households’ regularly store on a daily (Chao and Well users) or every other day (Nuevo Chao) basis (liters).
Min Max Mean Std. Dev. No.
Round I Chao 10 3000 389 490 204 Well 5 1100 180 261 60
Nuevo Chao 10 2500 319 377 201 Round II
Chao 6 2200 307 339 284 Well 18 1200 303 382 44
Nuevo Chao 18 1300 265 236 288 Note: Unless 20 to 100-L washtubs (tinas) are used as principal storage devices (as is the case for extremely poor households), they were not included in the storage estimate (i.e. the means likely underestimate the absolute volume of households’ storage capacities).
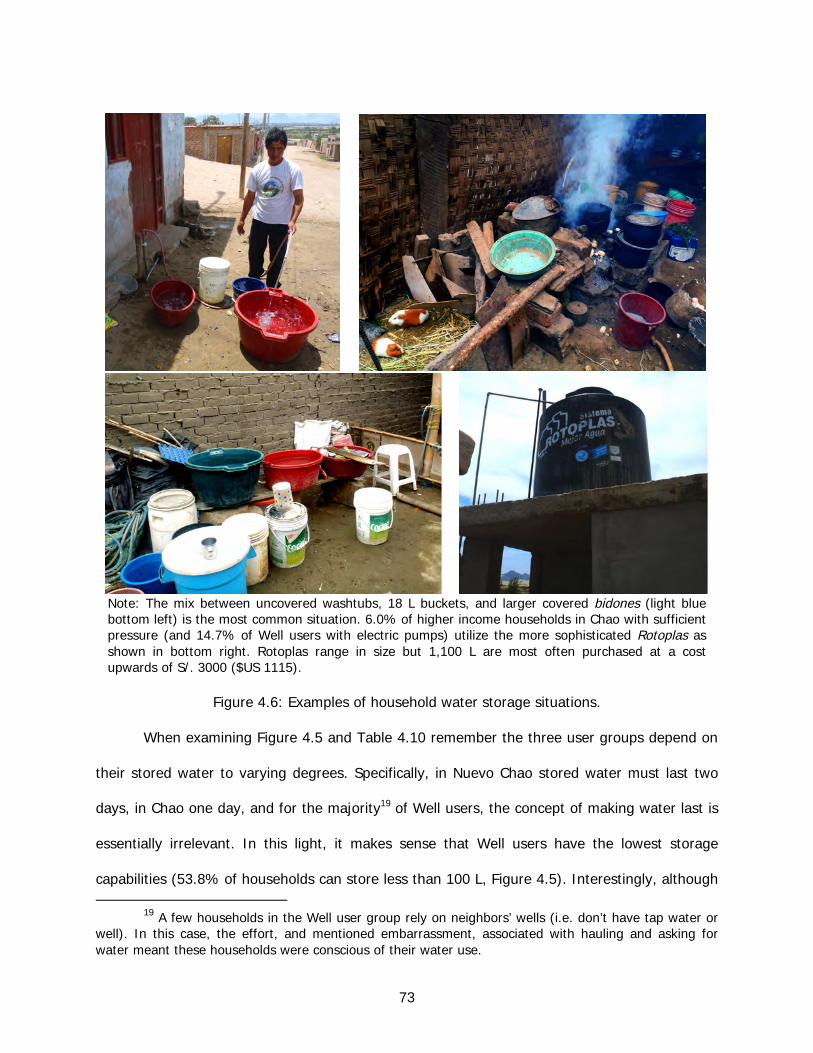
73
Note: The mix between uncovered washtubs, 18 L buckets, and larger covered bidones (light blue bottom left) is the most common situation. 6.0% of higher income households in Chao with sufficient pressure (and 14.7% of Well users with electric pumps) utilize the more sophisticated Rotoplas as shown in bottom right. Rotoplas range in size but 1,100 L are most often purchased at a cost upwards of S/. 3000 ($US 1115).
Figure 4.6: Examples of household water storage situations.
When examining Figure 4.5 and Table 4.10 remember the three user groups depend on
their stored water to varying degrees. Specifically, in Nuevo Chao stored water must last two
days, in Chao one day, and for the majority19 of Well users, the concept of making water last is
essentially irrelevant. In this light, it makes sense that Well users have the lowest storage
capabilities (53.8% of households can store less than 100 L, Figure 4.5). Interestingly, although
19 A few households in the Well user group rely on neighbors’ wells (i.e. don’t have tap water or well). In this case, the effort, and mentioned embarrassment, associated with hauling and asking for water meant these households were conscious of their water use.

74
Nuevo Chao households have to make stored water last twice as long, their reported storage
capabilities are similar to those of Chao households (Figure 4.5). However, in comparing Chao’s
mean storage to Nuevo Chao’s, depending on season, Chao households store 175 to 230 L
more per day than Nuevo Chao households (derived from Table 4.10). This is possibly the
result of two factors: 1) Nuevo Chao households are limited in the amount they can store given
the service’s short duration, and 2) regardless of need, Chao households have relatively higher
incomes (Table 4.1) and thus can purchase more storage20.
Consequently, in order to better understand the degree to which households depend
upon their storage capabilities, in the second round of surveys, respondents were asked
whether they were planning to buy more storage devices (Figure 4.7), why (Figure 4.7), and
how much more water they would like to store.
Note: Shades of blue and purple reflect respondents intending to buy more storage, while shades of green and orange reflect respondents not planning to buy more storage.
Figure 4.7: Respondents’ plans, and reasoning, for increasing water storage capabilities.
Given water availability for each user group, it is not surprising that the number of
households planning to buy more storage was greatest in Nuevo Chao (34.1% as compared to
22.8% Chao, 21.3% Well users). That said, the split between households that do and do not
plan to buy more storage (blue/purple vs. green/orange) in each user group is visually similar
20 Of the 26.8% of Chao households reporting to own less than 100 L of storage, this likely reflects a single person, couple, or, perhaps, a household that also has a well.

75
(Figure 4.7). It is apparent that of those in each user group who want more storage, the
majority desire increased water ‘security’ (75.8% Chao, 66.7% Well users, 71% Nuevo Chao).
Increased water security could be interpreted as security from contamination as well as security
from physical scarcity.
With respect to security from contamination, households reported covering nearly all of
their existing storage devices (mean percentage of devices protected of 84.3% Chao, 77.6%
Well users, 82.2% Nuevo Chao). Nonetheless, larger, ideally elevated, storage tanks such as
Rotoplas are better protected from children, insects, and animals. As one respondent
commented ‘(Rotoplas) are more hygienic and the water lasts longer.’ However, such an
assumption overlooks the possibility of increased microbial contamination in larger storage units
such as Rotoplas due to infrequent cleaning, prolonged storage, and the hot climate (Schafer &
Mihelcic, 2012).
With respect to security from physical scarcity, service cuts are more common in Chao
than Nuevo Chao due to a reliance on power to access the water source (i.e. pump
groundwater). Interruptions are generally forecasted, with the majority of households learning
of cuts to the water services in advance by the local radio (89.5% Chao, 22.7% Nuevo Chao)
and by megaphone (64.4% Nuevo Chao). Only 6.8% of Chao households and 1.8% of Nuevo
Chao households reported to not receive notice prior to service cuts. That said, the occasional
unannounced cuts do occur and it is possible these episodes are enough to stimulate
households’ to store water beyond needs in precaution. For Well users, buying more storage
for ‘security’ from physical scarcity is possibly a reflection of a desire to spend less time hauling
water.
Interestingly, when respondents were asked how much more storage they would like
(Table 4.11), Well users wanted the largest capacity (approximately 831 liters) followed by

76
Chao households (approximately 650 liters). Comparatively, Nuevo Chao households desired 73
to 254 liters less than their counterparts (Table 4.11). Although the sample sizes may affect the
means, such findings are contrary to what would be expected. That is, given existing water
availability for each user group, it would seem Nuevo Chao households would want to store the
most water. Findings to the contrary may suggest that much of the water stored by Well users
and Chao households would ultimately be discarded before being used (i.e. they would store
water beyond their needs which will likely result in wasted potable water). This reasoning is
further supported by the fact that the additional volume of storage Chao households and Well
users desire is roughly 230 to 550 liters above their daily household water use21.
Table 4.11: Desired volume of additional water storage capacity (liters).
Min Max Mean Std. Dev. No. Missing
Chao 50 1500 650 416 57 10 Well 50 1500 831 453 8 2
Nuevo Chao 6 1100 577 391 93 10
The other motivation for purchasing more water storage devices was an explicit lack of
water (16.7% Chao, 33.3% Well users, 18.3% Nuevo Chao – which is only 4.6%, 8.8%, and
6.0% of each respective user group when those who do not plan to purchase more storage are
considered). Again, Well users who ‘lack water’ are likely referring to the inconvenience of
having to haul water.
While households’ reasons behind intended storage purchases were similar among all
user groups, the reasons among households not planning to buy more storage were dissimilar
(Figure 4.7). The overwhelming majority of Well users (95.5%) who did not plan to purchase
more storage stated it was because they already had sufficient water (as compared to 58.3% of
21 As compared to high-end water use estimates that will be discussed in Section 4.5.

77
Chao households and 41.8% of Nuevo Chao households). In contrast, the principal reason Chao
and Nuevo Chao households gave was they had ‘no money’ (35.1% Chao, 54.4% Nuevo Chao).
If ‘no money’ is considered to essentially imply an underlying ‘Yes’ (had the households more
discretionary money available), the overall percentage of households who may want more
storage is as follows: 54.8% Chao, 38.1% Well users, and 71.4% Nuevo Chao.
The notion that households receiving intermittent water supply must be struggling is
challenged by their responses to whether or not they had enough water to meet all of their
needs (Figure 4.8). It is notable that an overwhelming majority, replied ‘Yes, they had enough
water’ (92.4% Chao, 94.0% Well users, 84.6% Nuevo Chao). When examined from a storage
capability context, Nuevo Chao households are using, on average, 175 to 230 L less per day
than Chao households (Table 4.10), yet only 7.9% more households are reporting insufficient
water for their daily needs. However, when households were asked if they would use more
water if their service were more continuous (Figure 4.9), their responses seem to contradict the
high level of reported satisfaction with respect to their existing quantities of water (Figure 4.8).
Figure 4.8: Respondents reporting enough water (quantity) for their daily needs (Yes or No).

78
Figure 4.9: Respondents who would use more water if their water service were more continuous (Yes or No).
Specifically, 35.7% of Chao households and 61.5% of Nuevo Chao households reported
that, ‘Yes, they would use more water if it were more continuous.’ That is ~25% of Chao
households and ~45% of Nuevo Chao households were indirectly implying they would increase
water use regardless of need. Such contradictory responses suggest that, regardless of
necessity, the greater the availability of water in an intermittent context, the greater the
quantity of water households will use.
To better understand latent demand for more water, households were asked how they
would use additional water. Respondents gave open-ended, qualitative, responses, which were
coded accordingly into the categories displayed in Figure 4.10.
Note: This was an open-ended question and respondents’ qualitative answers were coded accordingly.
Figure 4.10: Respondents intended water use if water service were more continuous.

79
Aside from households reporting no intended increased usage, the most frequent
responses were laundry (60.2% Chao, 39.3% Nuevo Chao), watering the street (9.2% Chao,
11.4% Nuevo Chao) and storing more water (13.3% Chao, 13.6% Nuevo Chao). This is
interesting given that all three of the aforementioned activities either are, or have the potential
to be, water-wasting behaviors as will be discussed in Section 4.4.
4.3 Demand and Quality
As seen in Section 4.2, availability of water is only one determinant of demand. Demand
is also influenced in large part by the quality of available water. Accordingly this section will
examine households’ perceptions, practices, and preferences regarding water quality.
To begin, throughout the course of the surveys participants were asked to make several
statements regarding their existing water quality including: to describe the quality of their water
(Table 4.12), to rate the quality of their water on a scale of one to ten, and to state whether
they trusted that their water was safe to drink and why (Table 4.13).
As seen in Table 4.12, Chao households used the fewest positive descriptors to describe
their water (30.0%) as compared to Nuevo Chao (60.6%) and Well users (74.3%).
Correspondingly, when households were asked to rate water quality on a scale of one to ten
(where ten is high quality and one low quality) Chao had the lowest mean (6.06), followed by
Nuevo Chao (7.15) and Well users (8.02). Consequently, it is not surprising that Chao
households had the least trust in their drinking water (28.7%) followed by Nuevo Chao
households (63.5%) and Well users (76.1%) (Table 4.13).

80
Table 4.12: Respondents’ opinions of their water quality.
POSITIVE SO-SO NEGATIVE
Clean / Potable
Sweet / Rica Natural Regular Variable Not Clean Salty /
Gross Too
Chlorinated
Chao 30.0% 27.9% 42.1%
25.7% 4.1% 0.2% 27.5% 0.4% 9.9% 14.4% 17.9%
Well 74.3% 16.2% 9.5%
54.3% 18.1% 1.9% 15.2% 1.0% 8.6% 1.0% 0.0%
Nuevo Chao 60.6% 26.3% 13.1%
50.9% 8.5% 1.2% 24.4% 2.0% 4.6% 1.4% 7.1% Note: This was an open-ended question and respondents’ qualitative answers were coded accordingly. For ‘Chao’ reported water quality refers to tap water (from system’s well), for Well users reported water quality refers to water from each households’ personal well, and for ‘Nuevo Chao’ reported water quality refers to tap water (from spring).

81
Table 4.13: Reasons for respondents’ confidence (or lack of) in their drinking water’s safety.
YES NO
Cle
an /
D
elic
iou
s
Dis
infe
cted
M
ain
tain
ed
Ch
lori
nat
ed
Goo
d
Sou
rce
Goo
d
Ser
vice
Hor
rib
le
Pol
lute
d
Wor
ms
Mic
rob
es
Too
Mu
ch
Ch
lori
ne
Not
En
oug
h
Ch
lori
ne
Lack
of
Info
rmat
ion
/ Tr
ust
Chao 28.7% 71.3%
8.3% 5.8% 8.0% 0.0% 1.1% 20.7% 9.1% 25.4% 0.0% 21.7% 35.9% 25.0% 34.4% 0.0% 4.7% 26.9% 11.8% 33.0% 0.0% 28.3%
Well 76.1% 23.9%
32.6% 6.5% 13.0% 19.6% 0.0% 10.9% 6.5% 0.0% 0.0% 10.9% 45.5% 9.1% 18.2% 27.3% 0.0% 38.5% 23.1% 0.0% 0.0% 38.5%
Nuevo Chao 63.5% 36.5%
18.7% 22.3% 14.1% 2.1% 4.2% 5.7% 8.5% 4.2% 1.4% 18.4% 30.5% 36.2% 23.0% 3.4% 3.4% 14.7% 22.0% 11.0% 3.7% 48.6%
Note: This was an open-ended question and respondents’ qualitative answers were coded accordingly. The first row of percentages corresponds to whether respondents are confident in the safety of drinking the water, yes or no. The second row of percentages reflects respondents’ reasoning why they said yes or no, and the third row presents the same data but percentages are calculated to distinguish the reasoning of the ‘Yes’ group from that of the ‘No’ group.

82
Interestingly, although data presented in Table 4.13 suggests that 76.1% of Well users
and 63.5% of Nuevo Chao households would feel no need to treat their water, the majority of
households across all user groups (62.6% Chao, 61.8% Well users, 50.9% Nuevo Chao)
reported that they regularly boil their water for drinking. That is, whether or not households
had confidence in their drinking water, the majority provided point-of-use treatment and/or
bought bottled water (Table 4.14).
Table 4.14: Reported household treatment of drinking water.
No Treatment Boiled Crude &
Boiled Chlorinate & Boiled
Bottled Water
Chao 17.4% 62.6% 15.0% 2.0% 3.0% Well 16.7% 61.8% 16.7% 2.9% 2.0%
Nuevo Chao 27.4% 50.9% 17.4% 3.7% 0.6% Note: This was an open-ended question and respondents’ qualitative answers were coded accordingly. The small percentage of households reporting to both chlorinate and boil their water was likely referring to either 1) the chlorine the tap water comes with, or 2) their periodic addition of a few drops of chlorine to their well.
As a whole, 82.6% of Chao households, 83.3% of Well users, and 72.6% of Nuevo Chao
households invest time and/or money improving the quality of their drinking water (Table 4.14).
With respect to time and money, assuming that, for the average family, 1) a valon lasts one
month (mode from data), 2) approximately 10 to 20% of daily gas allowance is for boiling
water, and 3) the price of a valon of gas was S/. 38 in November 2012, at most the cost of
treatment for households using gas stoves is around $2.82 per month (S/. 7.6). For those
households who rely on open fires to boil their water, a large sack of wood costs roughly S/. 2
and lasts the average family four days, which implies a cost of roughly $1.11 per month (S/. 3).
If households dedicate time to finding free wood, the value of time (outside the scope of this
study), would need to be considered. A small portion of the population who thought the quality
of the tap water was abysmal and had a disposable income reported only consuming bottled
water (3.0% Chao, 2.0% Well users, 0.6% Nuevo Chao). Bottled water was often purchased in

83
the form of a 20 L reusable bidon (similar to a Culligan bottle) at a reported average cost of S/.
38.65 per month22. Overall, households’ financial investment in point-of-use treatment relative
to the existing monthly service fees is noteworthy; particularly for Nuevo Chao households (S/.
3.20 tariff compared to S/. 3 to 7.6 spent on treatment).
While the quality of drinking water is evidently important to households, due to a lack of
time and/or money, households’ treatment efforts are not consistent. For example, with respect
to drinking water both crude and boiled, roughly 20 to 30% more households reported to do so
during Round I (summer) as compared to Round II (winter)23. Similarly, the percentage of
respondents who reported to only drink crude water was greater during Round I as well. Both
these seasonal differences are likely reflecting increased thirst during summer months where
households’ supply of treated water is not able to keep pace with demand. The inconsistency of
boiling water greatly diminishes the benefits that household water treatment may otherwise
provide. Nonetheless, reported problems of diarrhea were low (6.5% Chao, 0.0% Well users,
6.3% Nuevo Chao).
Boiling water does more than kill harmful microbes. Many households commented that
boiling their water got rid of the strong chlorine odor. In fact, in both Chao and Nuevo Chao,
chlorine was both a reason for why water was considered safe to drink as well as a reason why
it was not drunk without boiling, or, in some cases, at all. Such counter-intuitive reasoning was
more common in Chao (25.4%, 17.9%) than in Nuevo Chao (4.2%, 7.1%) (Tables 4.12 and
4.13). Other respondents reported boiling their water to cause the excessive sarro (hard
minerals) to settle out although whether this was motivated by taste or a deeper understanding
of physical quality was unclear.
22 Interestingly, 61.7% reported the price of bottled water to be ‘fair’ (29.8% ‘Expensive,’ 8.5%
‘Cheap’). 23 Similar to other figures and tables, seasonal data is not included but is available upon request.

84
To try to understand households’ reasoning behind reported water treatment (or lack
thereof), respondents were asked which of the following factors (appearance, taste, odor,
physical security, or biological security) was the most important to them (Figure 4.11). The
majority of households in Chao (34.1% Chao, 47.9% Well users) reported biological security as
the most important aspect of water quality. Concern with physical quality of water (27.7%
Chao, 27.9% Well users) closely followed. Comparatively, in Nuevo Chao the majority (59.1%)
referred to taste and odor as the most important determinants of water quality.
Figure 4.11: Respondents’ opinion of most important water quality characteristic.
Correspondingly, many Nuevo Chao households commented that the taste of their dulce
(sweet) spring water was far superior to Chao’s agua salada (salty water). Obviously the taste
of water is affected by its physical/chemical make-up and all of the above aspects of water
quality are, to varying degrees, interrelated. It could be that while households in Nuevo Chao
know the importance of biological and physical security (as demonstrated by their investment in
household treatment), because they cannot determine it (i.e. lacking equipment to perform
qualitative/quantitative tests), they depend on their senses. However, given that, despite the

85
perceived high quality of their water upon arrival, the majority of Nuevo Chao households still
perform additional treatment for drinking water suggests that they ultimately recognize the
importance of water’s physical and biological safety.
Households’ interpretations of the term ‘potable water’ (Table 4.15) and what their
water providers were doing to make their water potable (Table 4.16) provides further insight
into what may motivate regular treatment of drinking water (Table 4.14).
Table 4.15: Respondents’ understanding of term ‘potable water.’
Vit
al f
or a
ll Li
fe
For
Hu
man
/
Dom
esti
c C
onsu
mp
tion
Cle
an P
ure
H
ealt
hy
Trea
ted
M
ain
tain
ed
Ch
lori
nat
ed
Com
es v
ia
Tub
es F
or
Ever
yon
e D
aily
/
Con
tin
uou
s /
Don
't L
ack
Oth
er
Don
't K
now
Chao 12.0% 14.7% 19.2% 35.3% 4.1% 1.0% 1.4% 12.3% Well 18.0% 12.0% 18.0% 22.0% 10.0% 0.0% 4.0% 16.0%
Nuevo Chao 8.0% 10.7% 19.4% 30.1% 8.0% 2.7% 3.3% 17.7% Note: This was an open-ended question and respondents’ qualitative answers were coded accordingly.
With respect to what potable water signified, responses ranged from, ‘it does not exist’
and is ‘gross,’ to ‘it arrives to everyone’ and is ‘daily.’ However, as a collective group, the most
common responses were that potable implies the water is: ‘treated, maintained and/or
chlorinated’ (31.8%), ‘clean, pure, or healthy’ (19.2%), and ‘for human consumption’ (12.6%).
Accordingly, although it appears that the majority of households in all three-user groups
(69.2% Chao, 52.0% Well users, 60.2% Nuevo Chao) are aware that potable implies water that
is of higher quality (treated), there is a relatively large portion of each user group that reported
not knowing what the word potable meant (12.3% Chao, 16.0% Well users, 17.7% Nuevo
Chao). Uncertainty surrounding potable water increased when households were asked to
specify what procedure(s) their service provider performed in order to make their water potable

86
(Table 4.16). Specifically, 56.1% of Chao and 56.4% Nuevo Chao households reported to not
know what their provider does to make their water potable.
Table 4.16: Respondents’ understanding of service provider’s water treatment.
Don't Know
Clean / Disinfect
Chlorinate / Add
Chemicals
Provide Maintenance
Chlorinate AND Provide Maintenance
Nothing
Chao 56.1% 13.8% 26.0% 1.0% 2.1% 1.0% Nuevo Chao 56.4% 7.1% 27.9% 3.5% 3.9% 1.1%
Note: This was an open-ended question and respondents’ qualitative answers were coded accordingly.
The fact that the majority of the population does not know how, and perhaps if, their
water is being treated may help to explain why so many households regularly boil their water
before drinking it. For the other 43.2% (average) of respondents who attempted to explain the
providers’ treatment process, 31.2% mentioned the addition of chlorine (chemicals) and/or
maintenance and 11% were slightly more vague noting water is cleaned or disinfected. Only
1% of the households reported that their service providers were doing nothing.
To understand just how important water quality is to households, households were
asked what they thought was the most important aspect of a water service (Table 4.17). As
Table 4.17 shows, the quality of water provided is very important for households.
Table 4.17: Respondents’ opinions on most important aspect of a quality water service.
Wat
er Q
ual
ity
Con
tin
uit
y
Sch
edu
le
Mai
nte
nan
ce
Pri
ce
Pre
ssu
re
Tran
spar
ency
Chao 73.9% 6.2% 1.7% 9.3% 5.5% 2.4% 1.0% Well 69.6% 10.9% 0.0% 17.4% 0.0% 0.0% 2.2%
Nuevo Chao 66.7% 4.9% 5.9% 10.8% 5.9% 3.5% 2.4% Note: Categories were chosen in accord with the most common complaints SADISCHAO received; where ‘mantenimiento’ (maintenance) and ‘transparencia’ (transparency) were catchphrases that households would use in order to express their general dissatisfaction with how the service was being run.

87
Specifically, 73.9% of Chao households, 69.6% of Well users, and 66.7% of Nuevo
Chao households reported water quality as the most important determinant of a quality water
service. Maintenance was the second most mentioned but far behind water quality (9.3% Chao,
17.4% Well users, 10.8% Nuevo Chao). Price, pressure and transparency appeared to be of the
least concern. With this in mind, Chao and Nuevo Chao households were asked what they
would most like to change about their current water service (Table 4.18).
Table 4.18: Aspect of current water service respondents would most like to change.
Wat
er
Qu
alit
y
Con
tin
uit
y
Sch
edu
le
Mai
nte
nan
ce
Pri
ce
Pre
ssu
re
Tran
spar
ency
Ch
ang
e N
oth
ing
Chao 67.5% 4.7% 10.1% 8.7% 3.6% 4.0% 0.7% 0.7% Nuevo Chao 20.4% 8.8% 31.6% 22.8% 2.1% 9.5% 3.9% 1.1%
Interestingly, although Nuevo Chao households believe that water quality is the most
important aspect of a water service (66.7% - Table 4.17), only 20.4% of them want most to
change the water quality of their existing service. This suggests that the other 80% of
households in Nuevo Chao are pleased with the quality of their water in comparison to the
service’s unsatisfactory schedule (31.6%) and maintenance (22.8%). This is in striking contrast
to Chao where nearly 70% of households would like to see an improvement in water quality
(Table 4.18). Overall, despite the discontinuous availability of the water services as detailed in
Section 4.2, it appears that, in the opinion of Chao and Nuevo Chao households, improving
water quality, service schedule, and maintenance are more important than continuity.
4.4 Water Behaviors and Conservation
The previous sections examined existing household water demand as it relates to
availability and quality. This section will break down demand as it is revealed through existing

88
water use behaviors. Whether or not per capita use will change under an improved service
scenario is a complex issue. While all water use activities have the potential to increase under
an improved service scenario, of particular interest are the high-water use activities such as
street watering, bathing, and laundry (Section 4.4.1). This will be followed by an examination of
existing patterns of water reuse and perceptions regarding water conservation in general
(Section 4.4.2).
4.4.1 High-Water Use Activities
The discussion will begin with street watering (Figures 4.12 - 4.14). Unlike the United
States and other developed countries where residents are expending vast quantities of water
outside their homes to maintain lawns and gardens, the main purpose of watering in Chao is
por el polvo (for the dust)24.
Note: The top photograph was taken from afar because in addition to capturing the man (in the blue shirt) actively watering the street, it also shows the damp ground outside of the four neighboring households.
Figure 4.12: Photograph of street watering in Chao.
24 Respondents were asked why they water the street but the response of ‘for the dust’ was so
overwhelming the qualitative variable was entered into SPSS but not coded.

89
Figure 4.13: Photographs of residents and businesses watering street in Nuevo Chao (left) and Chao (right).
Figure 4.14: Percentage of households reporting to water the street.
At first glance of Figure 4.14 it would seem that on average Nuevo Chao households
(79.3%) allocate the most water to street watering (although Well users are not far behind,
75.7%). However, there are two important factors to consider. First, roughly 70% of Chao
households are located on paved roads compared to 0.0% of Nuevo Chao households, thus
making dust more problematic for the latter. This may be why, after ‘Water,’ the most
important public service to Nuevo Chao households is ‘Paved roads’ (as will be discussed in
Table 4.36 of Section 4.6). Also, at the time of surveying, Nuevo Chao households did not have
a sanitation service. Thus, aside from the 18.1% of Nuevo Chao households reporting to have a
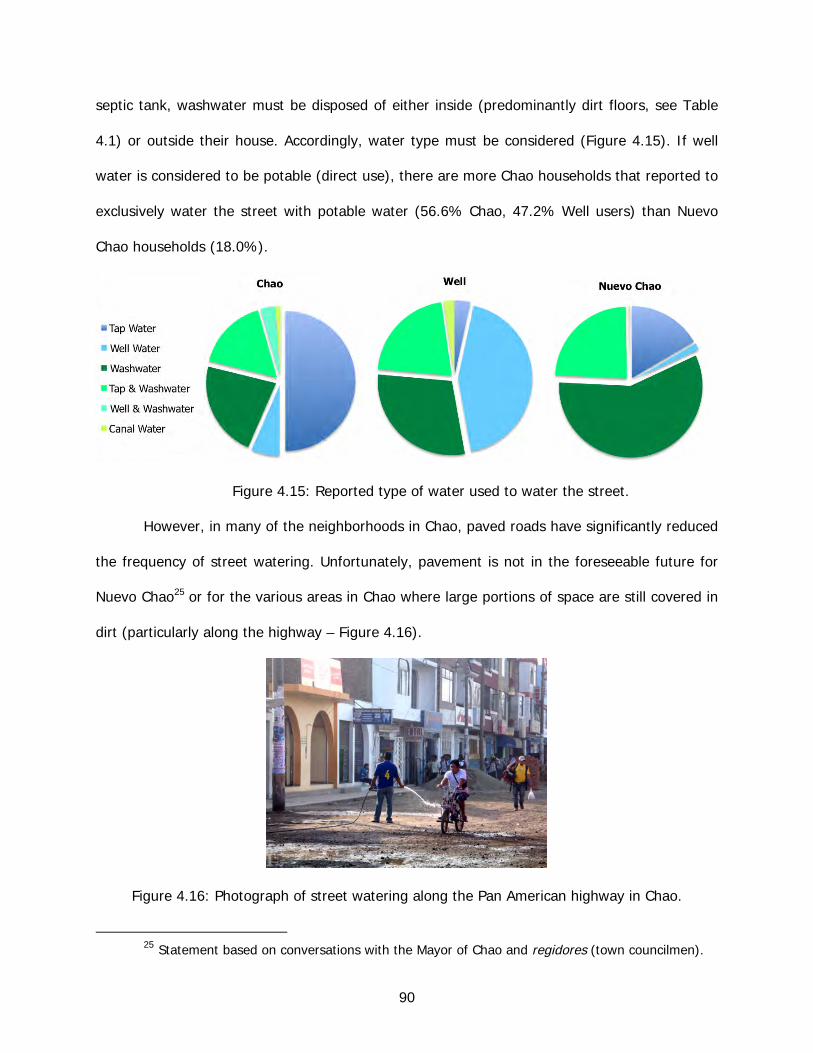
90
septic tank, washwater must be disposed of either inside (predominantly dirt floors, see Table
4.1) or outside their house. Accordingly, water type must be considered (Figure 4.15). If well
water is considered to be potable (direct use), there are more Chao households that reported to
exclusively water the street with potable water (56.6% Chao, 47.2% Well users) than Nuevo
Chao households (18.0%).
Figure 4.15: Reported type of water used to water the street.
However, in many of the neighborhoods in Chao, paved roads have significantly reduced
the frequency of street watering. Unfortunately, pavement is not in the foreseeable future for
Nuevo Chao25 or for the various areas in Chao where large portions of space are still covered in
dirt (particularly along the highway – Figure 4.16).
Figure 4.16: Photograph of street watering along the Pan American highway in Chao.
25 Statement based on conversations with the Mayor of Chao and regidores (town councilmen).

91
Meanwhile, recall that 62.1% of Chao households, 68.8% of Well users, and 82.5% of
Nuevo Chao households have solely dirt floors. For others reporting piso falso (cement) and/or
tile, only a small fraction of those houses have 100% coverage (i.e. a large portion of their
house is still dirt). Consequently, when considering the behavior of watering it is essential to
understand that a large proportion of households reported to also water the inside of their
house (62.2% Chao, 56.3% Well users, 64.5% Nuevo Chao). In some respect, water currently
used to tidy up dirt within households is the equivalent of water used to wash cement and tile
floors. However, a large portion of indoor watering is for the corral (indoor yard), which is
exposed to sunlight and thus, like the street.
Watering the street may seem nonsensical but given the high amount of dust in the
area it is understandable why the practice exists. To residents it the seemingly easiest and most
effective way to get the sandy dirt to temporarily stay put. This means less dust in the house
and less dust in the eyes and lungs. Unfortunately, unless streets are watered as the sun is
setting the desired affect is short-lived (i.e. the dry climate causes water to rapidly evaporate,
especially during the summer).
That said, an outsider observing residents watering outside and inside their homes
might ask where are the plants? Vegetation would require some water but it would serve more
than one purpose: keeping dust down (covering it), cleaning air, providing habitat, reducing
ambient heat, etc. Roughly 40% of the population (34.6% Chao, 33.4% Well users, 45.1%
Nuevo Chao) reported to water plants. However, only a few households maintained vegetated
spaces or gardens (Figure 4.17). Although not explicitly studied, conversation with households
maintaining groundcover indicated that species grown were endemic and did not require large
amounts of water. In order to better understand what was preventing, as well as encouraging,
landscaping, households were asked why they did or did not maintain plants.

92
Figure 4.17: Photographs of households in Nuevo Chao with maintained vegetated spaces.
Interestingly, the most common reason households cited for having plants was for
adornment (51.0%). This was followed by: for the environment (17.5%), shade (12.9%),
health (10.8%), and food (4.1%). Not one household mentioned plants as a good way of
reducing dust. In contrast, the most common reasons for not having plants were: no space
(59.1%), no water (12.9%), and no time (5.3%). With regard to space, households in Nuevo
Chao are understandably hesitant to plant outside their homes lest pavement be laid down. In
Chao, however, households on paved streets have, at least, one square meter of space that is
often left bare. With respect to backyards, although these areas are often home to clotheslines,
animal pens, latrines, etc., the author regularly observed ample room for plants.
Moving on, personal hygiene is an area that utilizes a large portion of households’ water
and is an activity in which wasteful behaviors easily arise. However, in contrast to street
watering, water for hygiene directly meets a basic human health need (Figures 4.18 and 4.19).
Currently, the majority of Well users (78.2%) and nearly all Nuevo Chao households (92.4%)
take bucket baths (Figure 4.18). In contrast, 70.3% of Chao households have installed
showers; although only 32.1% are able to use their shower all of the time – a benefit of having
elevated water storage tanks.

93
Note: ‘River’ only captures respondents who reported to bathe in the river on a regular basis.
Figure 4.18: Respondents’ personal hygiene behavior.
With respect to how much water respondents use for bathing, the majority reported to
use half or a full bucket26 every time they bathed (10-20 Liters). However, Chao households,
followed by Well users, reported to bathe more frequently and thus had higher total water use
(Figure 4.19).
Note: This was an open-ended question and respondents’ quantitative answers were coded accordingly.
Figure 4.19: Liters per capita per day for bathing in summer (left) and winter (right).
For households that only used showers, due to large variations in pressure, it is difficult
to determine how much water they were using. In the author’s experience, some households
reported to close the faucet while soaping while others said they left the shower running for 20
(Nuevo Chao) to 80 (Chao) minutes at a time. That said, assuming roughly 7.5 L flows from a
26 The standard bucket size for bathing is the 18-L aciete (vegetable oil) buckets. Through
surveying it was apparent that nearly every household, regardless of user group, had at least one.

94
faucet per minute, and an average nine minute shower27, households with showers are likely
using ~68 L per capita per day in the winter and up to 204 L per capita per day in the
summer28. If the continuity of the water service were to increase, the number of households
able to use showers on a regular basis would likely increase, perhaps causing an increase in
demand.
Laundry is another aspect of personal hygiene. Laundry is primarily washed by hand
using washtubs. Interestingly, despite significantly variable access to water, the frequency
clothes are washed (ranging from one to seven days a week in each user group) as well as the
liters used per load seem to be predominantly determined by households’ personal preferences.
That is, the range of water use in each user group is relatively the same (Table 4.19)
Table 4.19: Liters used per-capita, per-week, for laundry.
Round I (summer) ≤20 20<x≤60 60<x≤100 >100
Chao 41.4% 39.0% 14.7% 4.9% Well 38.3% 36.2% 10.7% 14.9%
Nuevo Chao 32.8% 45.8% 13.7% 7.6% Round II (winter)
≤20 20<x≤60 60<x≤100 >100
Chao 25.8% 52.3% 14.4% 7.6% Well 22.4% 47.0% 26.5% 4.1%
Nuevo Chao 25.6% 48.2% 16.4% 9.9% Note: This was an open-ended question. In order to reflect per-capita water use respondents’ quantitative answers for loads per week and liters per load were multiplied and then divided by the number of individuals in their family.
However, as a whole, Well users reported to use the most water. It is possible that
Nuevo Chao households use less water than Chao households but were simply more accurate at
estimating their usage given their limited water supply (i.e. Chao households may have been
27Means number of minutes per shower period ranged from 5.33 minutes in Nuevo Chao (8.95
minutes Chao) to 12.8 minutes for Well users.
28 Comparatively, a typical shower in the U.S. uses roughly 44 liters (Vickers, 2001).

95
underreporting the amount of water used for laundry). In support of this inference, many Chao
households often mentioned that they approvechar (take advantage of) the hour the water
arrives to wash clothes so they can empty and fill up as many washtubs as need be.
Interestingly, in contrast to bathing, there is an apparent shift to increased water use for
laundry during the winter that could perhaps be explained by more available water. Recall from
Figure 4.10 that laundry was the principal activity that households stated they would do more of
if their water service were to be more continuous (60.2% Chao, 39.3% Nuevo Chao). Water
spent on laundry may also increase with the introduction of washing machines. At the time of
surveying only 34 families (7.8% Chao, 4.0% Well users, 3.0% Nuevo Chao) had machines but
when households were asked what appliances/devices they were planning to buy in the coming
year, 13.4% of Chao households, 12.5% of Well users, and 6.3% of Nuevo Chao households
reported they would like to buy one. Given that washing machines can free up roughly two to
three hours per large load, it will remain to be seen how their added convenience affects
households’ water consumption. That said, households washing laundry by hand used 30 to 80
liter tubs, upwards of two times. Considering a typical top-loading washing machine uses
approximately 150 liters per load, in some cases washing in tubs may be more wasteful.
4.4.2 Water Conserving Behaviors
Throughout the survey process care was taken to distinguish the degree to which water
was reused. As was shown in Figure 4.15, more respondents in Nuevo Chao than Chao reported
to use washwater for street watering. This difference also held true for reported mopping
(2.4% Chao, 16.7% Nuevo Chao) and plant watering (2.8% Chao, 11.2% Nuevo Chao). When
it comes to sanitation, unless households have overhead tanks, when water is not arriving
households with toilets must manually flush them using buckets full of either potable water or
greywater (Table 4.20).

96
Table 4.20: Greywater reuse for flushing toilets.
Never Sometimes Always No. w/ no toilet
Chao 26.0% 58.5% 15.5% 11 Well 27.8% 44.4% 27.8% 27
Nuevo Chao 38.5% 23.1% 38.5% 261 Note: Keep in mind the small proportion of households in Nuevo Chao that have toilets (i.e. percentages only reflect responses of 26 households, or 6.3% of the total number of Nuevo Chao households surveyed).
When households reporting to ‘sometimes’ use washwater to flush toilet are combined
with those who ‘always’ do, Chao households are most conserving (74%), followed by Well
users (72.2%), and Nuevo Chao households (61.6%). With the onset of a more continuous
service, this water conserving behavior may disappear. That is, if toilet tanks were always full
from incoming water it would seem less likely that households would continue to haul
washwater into their bathrooms. However, for households using potable water to bucket flush
their toilets, depending on the size of the average toilet tank (reported means of 4 (Well users)
to 9 liters (Chao)) as compared to the average number of liters used/required for a bucket flush
(reported means of 6 (Well users) to 11 liters (Nuevo Chao)), a more continuous water service
could save water when it comes to sanitation.
With respect to water conservation awareness, respondents were asked 1) if they had
ever heard of water conservation, 2) the source (Table 4.21) c) if they practice water
conservation (Figure 4.20), d) to give an example (Table 4.22), e) if applicable, why they
practice water conservation (Table 4.23), f) perceptions of local water scarcity and, g) how they
feel about water meters (Table 4.25). Households’ responses offer insight as to whether an
improved water service would result in an increase in the use of potable water for street
watering, personal hygiene, and laundry, and, correspondingly, a decrease in water reuse.
To begin, the majority of households reported to have never heard or received any
information regarding water conservation (65.5% Chao, 75.7% Well users, 61.6% Nuevo
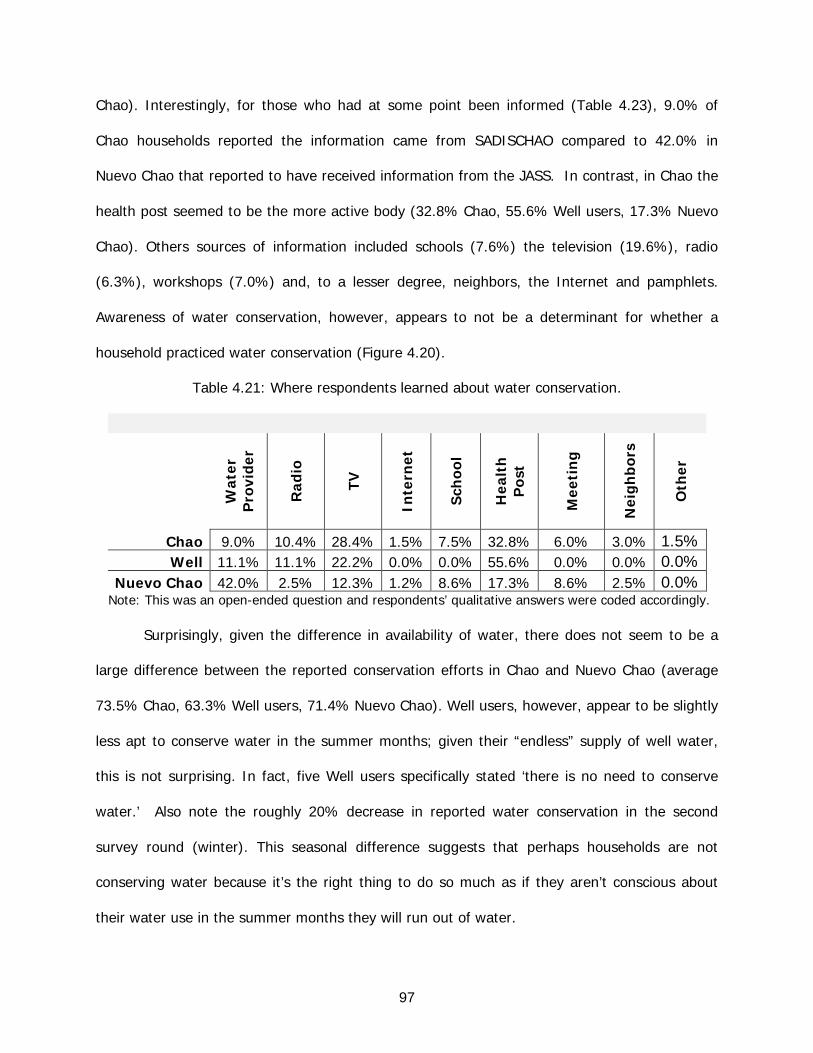
97
Chao). Interestingly, for those who had at some point been informed (Table 4.23), 9.0% of
Chao households reported the information came from SADISCHAO compared to 42.0% in
Nuevo Chao that reported to have received information from the JASS. In contrast, in Chao the
health post seemed to be the more active body (32.8% Chao, 55.6% Well users, 17.3% Nuevo
Chao). Others sources of information included schools (7.6%) the television (19.6%), radio
(6.3%), workshops (7.0%) and, to a lesser degree, neighbors, the Internet and pamphlets.
Awareness of water conservation, however, appears to not be a determinant for whether a
household practiced water conservation (Figure 4.20).
Table 4.21: Where respondents learned about water conservation.
Wat
er
Pro
vid
er
Rad
io
TV
Inte
rnet
Sch
ool
Hea
lth
P
ost
Mee
tin
g
Nei
gh
bor
s
Oth
er
Chao 9.0% 10.4% 28.4% 1.5% 7.5% 32.8% 6.0% 3.0% 1.5% Well 11.1% 11.1% 22.2% 0.0% 0.0% 55.6% 0.0% 0.0% 0.0%
Nuevo Chao 42.0% 2.5% 12.3% 1.2% 8.6% 17.3% 8.6% 2.5% 0.0% Note: This was an open-ended question and respondents’ qualitative answers were coded accordingly.
Surprisingly, given the difference in availability of water, there does not seem to be a
large difference between the reported conservation efforts in Chao and Nuevo Chao (average
73.5% Chao, 63.3% Well users, 71.4% Nuevo Chao). Well users, however, appear to be slightly
less apt to conserve water in the summer months; given their “endless” supply of well water,
this is not surprising. In fact, five Well users specifically stated ‘there is no need to conserve
water.’ Also note the roughly 20% decrease in reported water conservation in the second
survey round (winter). This seasonal difference suggests that perhaps households are not
conserving water because it’s the right thing to do so much as if they aren’t conscious about
their water use in the summer months they will run out of water.

98
Figure 4.20: Percent of respondents reporting to practice water conservation.
To more closely examine this theory, it is perhaps important to take a step back and
look at how respondents interpret the phrase ‘water conservation.’ Respondents were asked to
give an example of how they conserve water in their house (Table 4.22).
Table 4.22: Examples of water conservation as reported by respondents.
Use
M
inim
um
/
Con
serv
e
Boi
l Wat
er
Cov
er W
ater
Don
't W
ater
S
tree
t
Reu
se W
ater
Clo
se
Fau
cets
Inst
all W
ater
C
onse
rvin
g
Dev
ices
Rep
air
Leak
s
Chao 41.7% 1.5% 11.2% 10.7% 14.1% 10.2% 0.5% 5.8% Well 40.0% 4.4% 26.7% 4.4% 20.0% 2.2% 0.0% 2.2%
Nuevo Chao 43.5% 2.6% 21.4% 7.9% 7.8% 0.5% 0.1% 1.0% Note: This was an open-ended question and respondents’ qualitative answers were coded accordingly. The table reflects the first response mentioned by respondents even if they would voluntarily list several examples instead of one.
Table 4.22 suggests that Chao households (including Well users) have the most
sophisticated understanding of water conservation. That is, compared to Nuevo Chao
households, they more frequently mentioned what would traditionally be regarded as water
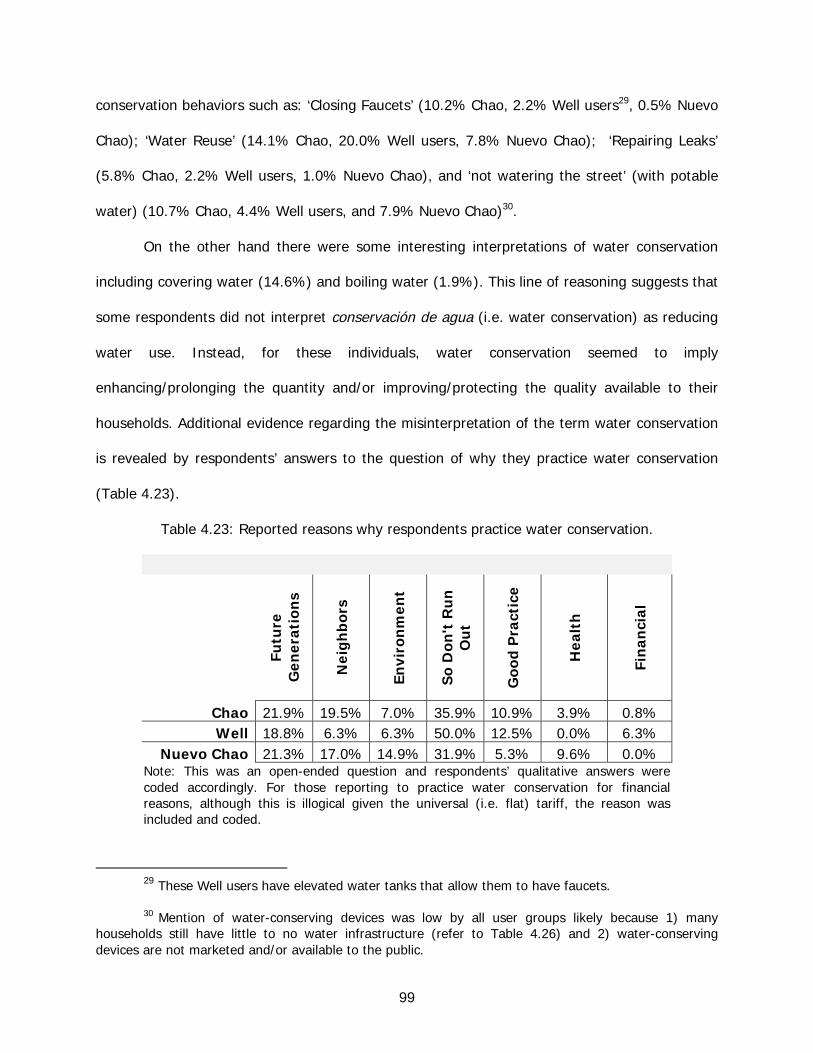
99
conservation behaviors such as: ‘Closing Faucets’ (10.2% Chao, 2.2% Well users29, 0.5% Nuevo
Chao); ‘Water Reuse’ (14.1% Chao, 20.0% Well users, 7.8% Nuevo Chao); ‘Repairing Leaks’
(5.8% Chao, 2.2% Well users, 1.0% Nuevo Chao), and ‘not watering the street’ (with potable
water) (10.7% Chao, 4.4% Well users, and 7.9% Nuevo Chao)30.
On the other hand there were some interesting interpretations of water conservation
including covering water (14.6%) and boiling water (1.9%). This line of reasoning suggests that
some respondents did not interpret conservación de agua (i.e. water conservation) as reducing
water use. Instead, for these individuals, water conservation seemed to imply
enhancing/prolonging the quantity and/or improving/protecting the quality available to their
households. Additional evidence regarding the misinterpretation of the term water conservation
is revealed by respondents’ answers to the question of why they practice water conservation
(Table 4.23).
Table 4.23: Reported reasons why respondents practice water conservation.
Futu
re
Gen
erat
ion
s
Nei
gh
bor
s
Envi
ron
men
t
So
Don
't R
un
O
ut
Goo
d P
ract
ice
Hea
lth
Fin
anci
al
Chao 21.9% 19.5% 7.0% 35.9% 10.9% 3.9% 0.8% Well 18.8% 6.3% 6.3% 50.0% 12.5% 0.0% 6.3%
Nuevo Chao 21.3% 17.0% 14.9% 31.9% 5.3% 9.6% 0.0% Note: This was an open-ended question and respondents’ qualitative answers were coded accordingly. For those reporting to practice water conservation for financial reasons, although this is illogical given the universal (i.e. flat) tariff, the reason was included and coded.
29 These Well users have elevated water tanks that allow them to have faucets. 30 Mention of water-conserving devices was low by all user groups likely because 1) many
households still have little to no water infrastructure (refer to Table 4.26) and 2) water-conserving devices are not marketed and/or available to the public.
100
As Table 4.23 suggests, 3.9% of Chao households and 9.6% of Nuevo Chao households
and said they practice water conservation for personal health reasons. Confusion on the
concept of water conservation is further exemplified by the fact that 7.5% of Chao households
and 24.7% of Nuevo Chao households reported to not conserve water because they simply did
not have enough to begin with (i.e. although they did not know it, these households were likely
conserving water to make the little they had last, through reuse, minimal use, etc.). Confusion
is further exemplified by comments such as ‘I don’t conserve water because I use all the water
I have every day and there is nothing left to store.’ Such reasoning indicates how respondents
may have interpreted conservation as preservation (i.e. storing water) rather than using less
water overall.
Interestingly, 35.9% of Chao households, 50% of Well users, and 31.9% of Nuevo Chao
households that said they practiced water conservation so they (personally) did not run out of
water. While not necessarily a misinterpretation of the term, this would suggest that the
largest reported conservation behavior of ‘Using the minimum amount of water’ (41.7% Chao,
40.0% Well users, 43.5% Nuevo Chao) may not be motivated for reasons beyond ensuring
adequate water at the household level.
On the other hand, Table 4.23 also reveals some deeper motivations for conservation
behaviors, which suggests that at least some respondents understand the concept of water
conservation (as the term is used in the developed world). For example, households practiced
water conservation: ‘for future generations’ (average 21.4%), ‘for neighboring places’ (average
17.6%), ‘for the environment’ (average 10.1%), and ‘because it’s the right thing to do/good
practice’ (average 8.8%)31.
31 One of the author’s most memorable conversations with a respondent regarding water scarcity
was a middle-aged woman in Nuevo Chao who told me that she had heard on the radio that ‘in twenty years all women were going to have to shave their heads because there would not be enough water to wash our hair.’

101
When respondents’ were asked to categorize the amount of water in the District of Chao
as ‘abundant,’ ‘regular’ or ‘scarce,’ only 17.9% of Chao households, 16.0% of Well users and
13.4% of Nuevo Chao households recognized the area’s actual scarcity (Table 4.24). Although
not explicitly asked, many of the households the author interviewed reasoned that water was
not scarce because of the number of wells or the size of the distribution pipes (i.e. referring to
general access to water but not considering a declining water table or where the water in pipes
was coming from). Interestingly, this suggests that households may view their service’s existing
intermittencies as ineptitude on behalf of the provider rather than possible indication of the
region’s scarcity. Overall, the data presented in Table 4.24 suggest that water conservation in
recognition of a general, regional, scarcity, may only be practiced by a small percent of the
population.
Table 4.24: Respondents’ perception of local water scarcity.
!Abundant Regular Scarce
Chao 17.9% 57.5% 24.6% Well 16.0% 62.0% 22.0%
Nuevo Chao 13.4% 57.5% 29.1%
As a further possible gauge of the motivation behind households’ existing water
conservation efforts, or lack thereof, respondents were asked to give their opinion on whether
or not they would like their service to be metered (Table 4.25). Chao households and Well users
seemed to be split down the middle whether they would like a metered water service (43.6% in
favor, 56.4% not in favor – Chao, 46.7% in favor, 53.3% not in favor - Well users). In Nuevo
Chao, however, a clear majority (71.8%) was not in favor of water meters. Why respondents’
said ‘Yes’ or ‘No,’ is once again more telling than the dichotomous data reveal.

102
Table 4.25: Respondents’ attitudes toward metered water service and why.
FOR AGAINST
Pri
ce A
ccor
din
g
Con
sum
pti
on /
Fa
ir
Mor
e R
elia
ble
, S
ecu
re, S
ervi
ce
Min
imiz
e,
Con
trol
, Wat
er
Use
Pu
t W
aste
rs
Into
Con
trol
Pri
ce A
ccor
din
g
to C
onsu
mp
tion
Mor
e Ex
pen
sive
Un
relia
ble
Not
Nec
essa
ry
or F
easi
ble
Chao 43.6% 56.4%
13.0% 13.0% 16.1% 2.3% 6.9% 36.4% 6.1% 6.1%
Well 46.7% 53.3%
25.0% 10.0% 17.5% 0.0% 5.0% 37.5% 5.0% 0.0% Nuevo
Chao 28.2% 71.8%
6.1% 11.9% 10.1% 1.8% 12.6% 46.0% 5.0% 6.5% Note: First row of percentages refers to whether respondents were for or against meters. The second row of percentages reflects the reasons why respondents’ wanted meters (an open-ended question where respondents’ qualitative answers were coded accordingly).
The most common reason why households were opposed to meters was they suspected
the devices would make their water bills more expensive (36.4% Chao, 37.5% Well users,
46.0% Nuevo Chao). Opposition to water meters as reasoned by not wanting more expensive
water bills could stem from distrust in the devices accuracy and/or misunderstanding of how
they work. On the other hand, a portion of those who had qualms about more expensive bills
may fall in line with the 6.9% of Chao households and 12.6% of Nuevo Chao households who
transparently stated they did not want meters because water bills would reflect consumption
(i.e. implying an underlying desire to use water freely). Interestingly, the fact that water bills
would reflect consumption was also a reason given by those in favor of water meters (13.0%
Chao, 25.0% Well users, 6.1% Nuevo Chao). It was likely these pro-meter respondents thought
that: 1) they would be charged less than the existing tariff given their conservative water
behaviors, and/or 2) that other households were using more than their fair (and necessary)
share. To this point, 2.3% of Chao households and 1.8% of Nuevo Chao households specifically
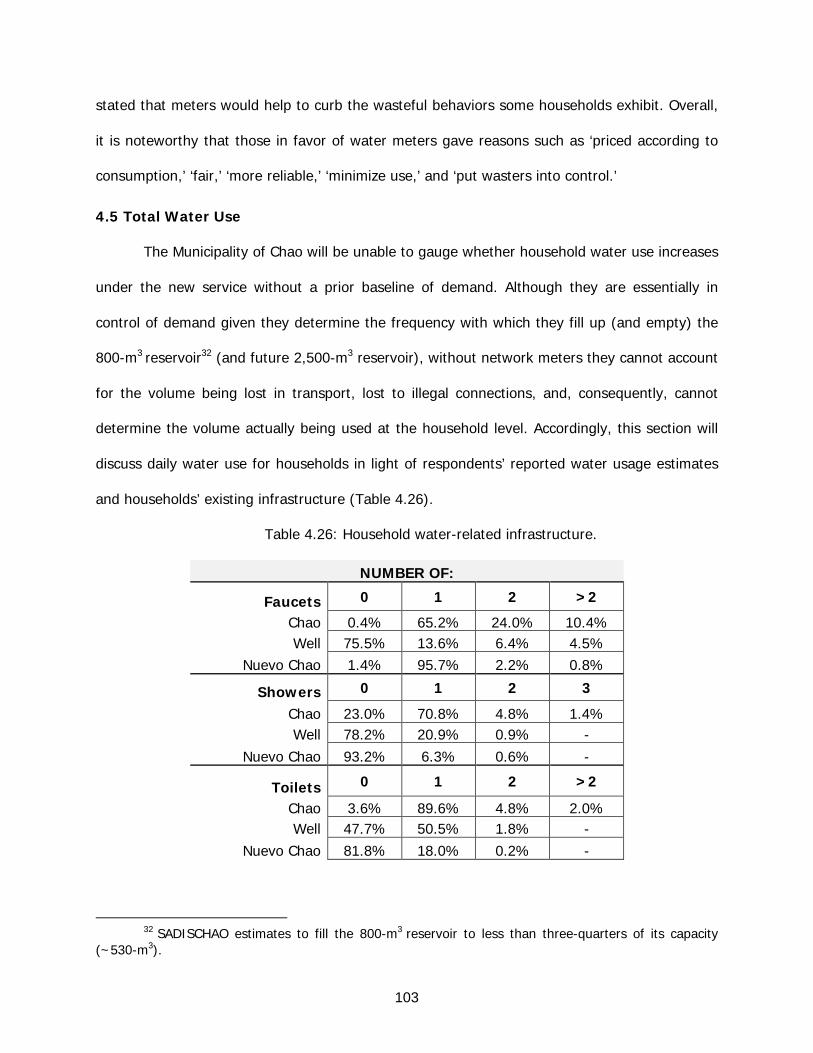
103
stated that meters would help to curb the wasteful behaviors some households exhibit. Overall,
it is noteworthy that those in favor of water meters gave reasons such as ‘priced according to
consumption,’ ‘fair,’ ‘more reliable,’ ‘minimize use,’ and ‘put wasters into control.’
4.5 Total Water Use
The Municipality of Chao will be unable to gauge whether household water use increases
under the new service without a prior baseline of demand. Although they are essentially in
control of demand given they determine the frequency with which they fill up (and empty) the
800-m3 reservoir32 (and future 2,500-m3 reservoir), without network meters they cannot account
for the volume being lost in transport, lost to illegal connections, and, consequently, cannot
determine the volume actually being used at the household level. Accordingly, this section will
discuss daily water use for households in light of respondents’ reported water usage estimates
and households’ existing infrastructure (Table 4.26).
Table 4.26: Household water-related infrastructure.
NUMBER OF:
Faucets 0 1 2 >2
Chao 0.4% 65.2% 24.0% 10.4% Well 75.5% 13.6% 6.4% 4.5%
Nuevo Chao 1.4% 95.7% 2.2% 0.8%
Showers 0 1 2 3
Chao 23.0% 70.8% 4.8% 1.4% Well 78.2% 20.9% 0.9% -
Nuevo Chao 93.2% 6.3% 0.6% -
Toilets 0 1 2 >2
Chao 3.6% 89.6% 4.8% 2.0% Well 47.7% 50.5% 1.8% -
Nuevo Chao 81.8% 18.0% 0.2% -
32 SADISCHAO estimates to fill the 800-m3 reservoir to less than three-quarters of its capacity
(~530-m3).
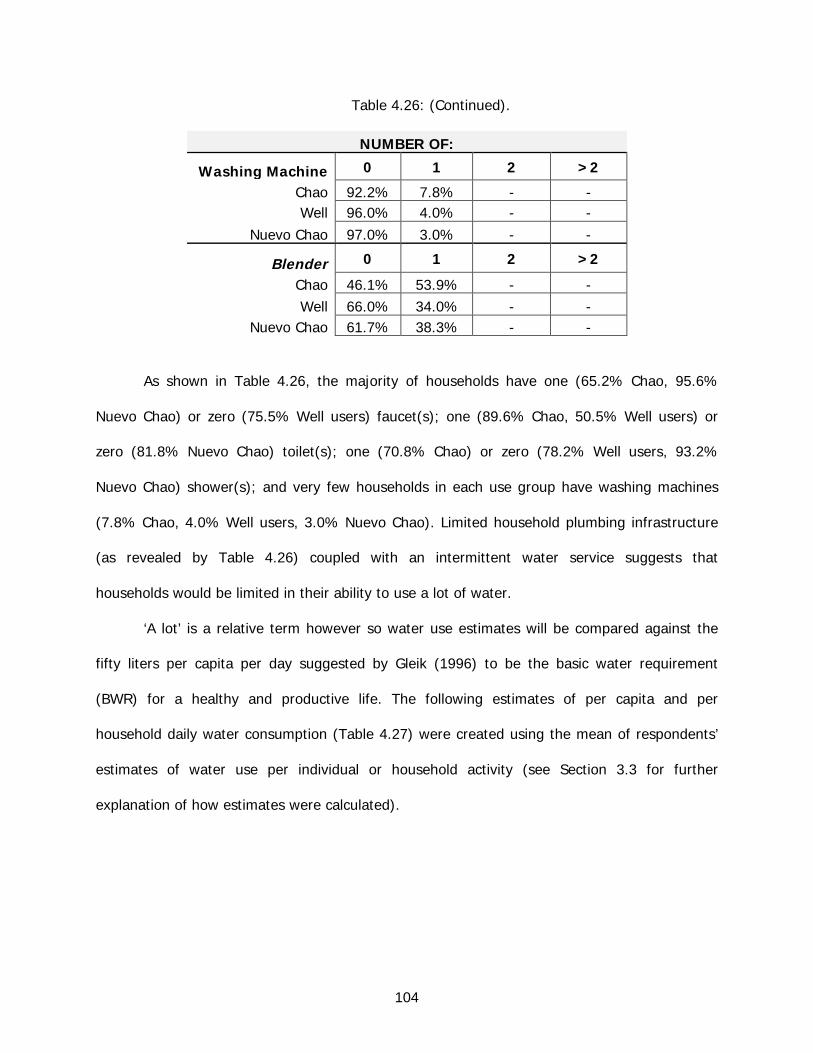
104
Table 4.26: (Continued).
NUMBER OF:
Washing Machine 0 1 2 >2
Chao 92.2% 7.8% - - Well 96.0% 4.0% - -
Nuevo Chao 97.0% 3.0% - -
Blender 0 1 2 >2
Chao 46.1% 53.9% - - Well 66.0% 34.0% - -
Nuevo Chao 61.7% 38.3% - -
As shown in Table 4.26, the majority of households have one (65.2% Chao, 95.6%
Nuevo Chao) or zero (75.5% Well users) faucet(s); one (89.6% Chao, 50.5% Well users) or
zero (81.8% Nuevo Chao) toilet(s); one (70.8% Chao) or zero (78.2% Well users, 93.2%
Nuevo Chao) shower(s); and very few households in each use group have washing machines
(7.8% Chao, 4.0% Well users, 3.0% Nuevo Chao). Limited household plumbing infrastructure
(as revealed by Table 4.26) coupled with an intermittent water service suggests that
households would be limited in their ability to use a lot of water.
‘A lot’ is a relative term however so water use estimates will be compared against the
fifty liters per capita per day suggested by Gleik (1996) to be the basic water requirement
(BWR) for a healthy and productive life. The following estimates of per capita and per
household daily water consumption (Table 4.27) were created using the mean of respondents’
estimates of water use per individual or household activity (see Section 3.3 for further
explanation of how estimates were calculated).

105
Table 4.27: Estimated seasonal volume of water consumed per capita and per household33 per day (liters).
LITERS PER CAPITA
Summer Winter
Basic Inclusive Basic Inclusive
Chao 83.3 89.9 60.6 67.2 Well 65.2 72.4 50.9 58.1
Nuevo Chao 52.2 58.8 35.1 41.8 LITERS PER HOUSEHOLD
Summer winter
Basic Inclusive Basic Inclusive
Chao 406.3 438.9 299.6 332.2 Well 316.8 351.7 247.5 282.4
Nuevo Chao 244.7 276.0 155.3 186.6 Note: Basic estimate does not include the following water use behaviors: street watering, watering plants, mopping, and maintaining pets and animals. These behaviors were separated due to their variance within the population as seen in Table 4.28 (i.e. the relevance of the inclusive estimate varies according to the percentage of the population that engages in the aforementioned additional water-related behaviors). Also, because only 6.8% of Nuevo Chao households have toilets or pour-flush latrines, this significant34 water-related activity was not included in their water use estimate. Finally, it is important to note the exclusion from both basic and inclusive estimates of 1) reused water and 2) water that was stored, not used, and, consequently, tossed out to make way for fresh water (i.e. essentially consuming potable water although not for any purpose).
Table 4.28: Reported practice of miscellaneous water-related activities.
Water Street
(w/potable water)
Water Plants
Mop Floors
Water for Animals
Water for Pets
Chao 46.8% 26.0% 34.0% 36.3% 36.1% Well 71.4% 14.0% 28.0% 23.7% 26.3%
Nuevo Chao 35.5% 29.2% 13.0% 46.4% 31.7%
In considering the inclusive water use estimates for each user group, it important to
keep in mind the following points: 1) in some cases, water is being reused to water the street,
wash toilets, and mop floors, and 2) stored (potable) water that happens to be thrown out
33 Per-capita water use multiplied by mean household size as determined by Round II surveys (4.94 people Chao, 4.86 people Well users, 4.69 people Nuevo Chao).
34 In United States, flushing toilets is the largest use of indoor water per capita per day at 18.5
Lpcd (Raucher & al., 2005).
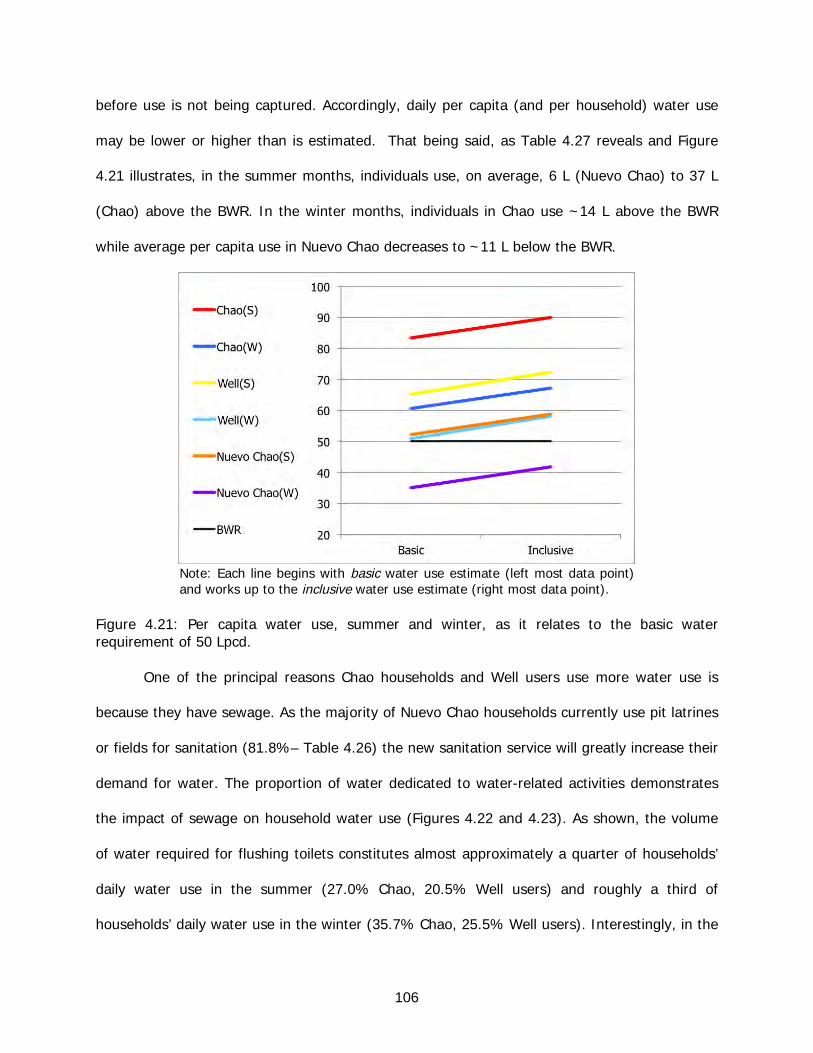
106
before use is not being captured. Accordingly, daily per capita (and per household) water use
may be lower or higher than is estimated. That being said, as Table 4.27 reveals and Figure
4.21 illustrates, in the summer months, individuals use, on average, 6 L (Nuevo Chao) to 37 L
(Chao) above the BWR. In the winter months, individuals in Chao use ~14 L above the BWR
while average per capita use in Nuevo Chao decreases to ~11 L below the BWR.
Note: Each line begins with basic water use estimate (left most data point) and works up to the inclusive water use estimate (right most data point).
Figure 4.21: Per capita water use, summer and winter, as it relates to the basic water requirement of 50 Lpcd.
One of the principal reasons Chao households and Well users use more water use is
because they have sewage. As the majority of Nuevo Chao households currently use pit latrines
or fields for sanitation (81.8%– Table 4.26) the new sanitation service will greatly increase their
demand for water. The proportion of water dedicated to water-related activities demonstrates
the impact of sewage on household water use (Figures 4.22 and 4.23). As shown, the volume
of water required for flushing toilets constitutes almost approximately a quarter of households’
daily water use in the summer (27.0% Chao, 20.5% Well users) and roughly a third of
households’ daily water use in the winter (35.7% Chao, 25.5% Well users). Interestingly, in the

107
summer months, not considering water for sanitation, per capita water use in Chao is still seven
liters more than per capita water use in Nuevo Chao (while in contrast Well users use
approximately two liters less than individuals in Nuevo Chao).
Figure 4.22: Average reported water use per activity, per household per day – summer.
Figure 4.23: Average reported water use per activity, per household per day – winter.
Beyond water availability as determined by service duration and pressure, there is water
availability as it relates to storage volume and water-related infrastructure. Households in all
user groups are gradually increasing the availability of water within their homes (i.e. more
(elevated) storage devices – Figure 4.7, and faucets, toilets and showers – Table 4.26). This is
particularly true in Chao where households are installing not one, but two, three faucets, etc. If
households aspire to keep up with the Jones and the convenience of water is a determinant of
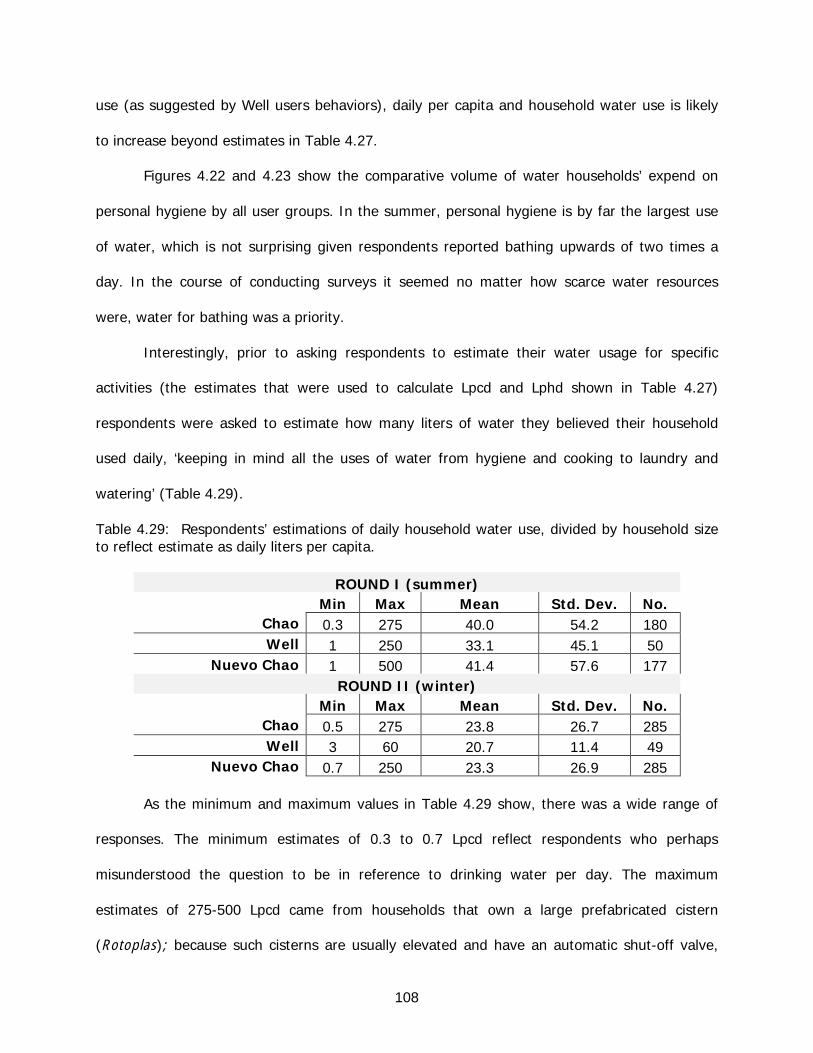
108
use (as suggested by Well users behaviors), daily per capita and household water use is likely
to increase beyond estimates in Table 4.27.
Figures 4.22 and 4.23 show the comparative volume of water households’ expend on
personal hygiene by all user groups. In the summer, personal hygiene is by far the largest use
of water, which is not surprising given respondents reported bathing upwards of two times a
day. In the course of conducting surveys it seemed no matter how scarce water resources
were, water for bathing was a priority.
Interestingly, prior to asking respondents to estimate their water usage for specific
activities (the estimates that were used to calculate Lpcd and Lphd shown in Table 4.27)
respondents were asked to estimate how many liters of water they believed their household
used daily, ‘keeping in mind all the uses of water from hygiene and cooking to laundry and
watering’ (Table 4.29).
Table 4.29: Respondents’ estimations of daily household water use, divided by household size to reflect estimate as daily liters per capita.
ROUND I (summer)
Min Max Mean Std. Dev. No.
Chao 0.3 275 40.0 54.2 180 Well 1 250 33.1 45.1 50
Nuevo Chao 1 500 41.4 57.6 177 ROUND II (winter)
Min Max Mean Std. Dev. No. Chao 0.5 275 23.8 26.7 285 Well 3 60 20.7 11.4 49
Nuevo Chao 0.7 250 23.3 26.9 285
As the minimum and maximum values in Table 4.29 show, there was a wide range of
responses. The minimum estimates of 0.3 to 0.7 Lpcd reflect respondents who perhaps
misunderstood the question to be in reference to drinking water per day. The maximum
estimates of 275-500 Lpcd came from households that own a large prefabricated cistern
(Rotoplas); because such cisterns are usually elevated and have an automatic shut-off valve,

109
respondents did not usually have an accurate idea of how often these devices fully emptied and
filled. Also, because households with Rotoplas essentially have running water all day long, it
appears occupants quickly become desensitized to the quantity of water they use. In contrast,
respondents who relied primarily on water from buckets were more capable, quick, and perhaps
accurate in estimating their household’s daily water use. This was particularly true for highly
water-stressed households. In the cases where families were barely getting by, all water-related
activities appeared to be allotted calculated amounts so as to make water last. As one women
said ‘measuring, measuring, always measuring.’
However, in all circumstances where water arrived long enough for households to fill
their available storage devices and then some, there seemed to be a common omission (from
the daily water use estimate) of water used directly from the faucet. That is, during her two
years of residency in Chao and through conducting surveys the author witnessed many families
take advantage of the temporary service to wash laundry (filling and emptying tubs of water),
water down the street (often with hoses), or take an extra long shower; all activities that use
high volumes of water. Yet, when making their water use estimates the majority of respondents
seemed only to consider the water they stored and then used. This may be due to respondents’
inability to estimate the volume of water that flows from their faucet per minute. Specifically,
when respondents were asked to estimate the number of liters that flowed from their faucets
per minute, the majority reported to have no idea (60.3% Chao, 71.0% Nuevo Chao). It may
also be that respondents don’t even consider the volume of water used directly from the tap as
it seems nominal compared to the volume they are storing.
As it stands, without consideration to water ‘lost’ upon arrival, respondents’ upfront
estimation of daily per capita water use ranges from 11 to 50 L lower than what summation of
their later water use estimates per specific activity suggest (Table 4.30). This means for a

110
family of four the average respondent underestimated their households’ water use anywhere
from 44 to 200 Liters.
Table 4.30: Difference in liters per capita per day between respondents’ estimated water use and calculated water use based on respondents’ activity specific water estimates.
Summer Winter
Basic Inclusive Basic Inclusive
Chao 43.3 49.9 36.9 43.5 Well 32.1 39.3 30.2 37.4
Nuevo Chao 10.7 17.4 11.8 18.5
Interestingly, Nuevo Chao households appear to be better at estimating water use
followed by Well users (Table 4.30). Concerning accuracy in water use estimations, in Round II
respondents were asked to rate their confidence in their estimate on a scale of one to ten;
where one indicated that they had no idea how much water they used and ten meant they were
absolutely certain. Reported confidence ranged all the way from one to ten but the means
averaged out at: 6.73 Chao, 7.52 Well users and 7.29 Nuevo Chao. Accordingly, it seems Chao
households were aware of their inability to estimate daily water consumption. That said, the
fact that Chao respondents’ reported water use estimates were, on average, 16 L lower per
capita per day in the winter suggests that they were at least making a conscious effort to report
daily water use as accurately as possible.
4.6 Demand and Value
In Section 4.4 households’ existing water-related behaviors were examined as to arrive
at an estimate for daily household water use in each user group. As was discussed in Sections
4.2 and 4.3 however, households’ demand for water is more complex than what existing water
use estimates reveal.
Accordingly, as discussed in Chapter Three, another way to evaluate households’

111
demand for water is through stated preference for service improvements, or households’
willingness to pay (WTP). In other words, the value of improved quality and more continuous
water can be assessed from the financial contribution households are willing and able to pay to
receive such service improvements (Tables 4.31 and 4.32).
Looking at the data from Table 4.31 where respondents were first asked if they would
be willing to pay S/. X for improved continuity (with the existing quality), and then immediately
thereafter, whether they would pay the same amount for improved quality (with the existing
continuity), Chao and Nuevo Chao households valued quality over continuity, while Well users
(for the most part) valued continuity over water quality. WTP for sewage collection as a
separate service was greatest for Well users and in Nuevo Chao but low compared to WTP for
water service improvements. With respect to the ‘package’ scenario (improved continuity,
quality, and sewage) the overwhelming response across all user groups and price ranges was
‘No.’ Overall, aside from the first scenarios offered with Row I35 prices, the general trend of
Table 4.31 is ‘No.’ This may be a reflection of households’ inability to pay rather than
unwillingness to pay and/or disinterest.
In some ways the high frequency of ‘No’s is indication that households were taking the
exercise seriously. In comparing the frequency of Y/N responses for the same scenarios with
different prices (i.e. top to bottom in Table 4.31), the fact that household WTP for the most
part declines as price increases, suggests that starting-point bias was minimal. In other words,
it seems households had a predetermined, underlying, threshold after which they were not
afraid to say ‘No.’
35 For the purpose of presenting results various price scenarios will be referred to as Row I, II
and III (in accord with Tables 4.31 and 4.32) although, in the surveys, prices varied by Column – see Appendix D and E.

112
Table 4.31: Respondents’ willingness to pay for improved (hypothetical) service, Round I.
I
Improved Continuity
(S/. 18)
Improved Quality (S/. 18)
Improved Continuity & Quality (S/. 24)
Sewage (S/. 18)
Improved Continuity, Quality
& Sewage (S/. 30)
Yes No Yes No Yes No Yes No Yes No Chao 61.6% 38.4% 65.8% 34.2% 37.5% 62.5% 17.8% 82.2% 26.0% 74.0% Well 66.7% 33.3% 55.6% 44.4% 22.2% 77.8% 35.3% 64.7% 23.5% 76.5%
Nuevo Chao 51.9% 48.1% 52.5% 47.5% 27.5% 72.5% 34.6% 65.4% 32.9% 67.1%
II
Improved Continuity
(S/. 24)
Improved Quality (S/. 24)
Improved Continuity & Quality (S/. 36)
Sewage (S/. 24)
Improved Continuity, Quality
& Sewage (S/. 42)
Yes No Yes No Yes No Yes No Yes No Chao 40.6% 59.4% 43.5% 56.5% 8.7% 91.3% 13.0% 87.0% 13.2% 86.8% Well 43.5% 56.5% 43.5% 56.5% 26.1% 73.9% 21.7% 78.3% 26.1% 73.9%
Nuevo Chao 26.1% 73.9% 30.4% 69.6% 5.8% 94.2% 14.5% 85.5% 10.1% 89.9%
III
Improved Continuity
(S/. 36)
Improved Quality (S/. 36)
Improved Continuity & Quality (S/. 48)
Sewage (S/. 36)
Improved Continuity, Quality
& Sewage (S/. 54)
Yes No Yes No Yes No Yes No Yes No Chao 25.8% 74.2% 40.3% 59.7% 17.7% 82.3% 8.1% 91.9% 11.3% 88.7% Well 15.8% 84.2% 5.3% 94.7% 10.5% 89.5% 0.0% 100.0% 10.5% 89.5%
Nuevo Chao 15.0% 85.0% 20.0% 80.0% 10.0% 90.0% 18.3% 81.7% 11.3% 88.7% Note: Refer to Chapter Three, Section 3.2.1, for an explanation of survey administration. While all respondents were offered the same five scenarios, the set of prices they were offered (row I, II or III) was determined by the order of the enumerators’ visits (i.e. enumerators issues house 1, prices from row I, house 2, prices from row II, house 3, prices from row III, house 4, prices from row I, and the process continued to repeat.). At time of survey one $1.00 was, on average, equal to S/. 2.69 (Yahoo Finance, 2013).

113
Table 4.32: Respondents’ willingness to pay for improved (hypothetical) service, Round II.
I SIX hours (S/. 18) TWELVE hours (S/. 20)
TWENTY-FOUR hours (S/. 22) QUALITY (S/. 18)
TWELVE hours & QUALITY (S/.
24) Yes No M Yes No M Yes No M Yes No M Yes No
Chao 31.4% 56.9% 11.8% 13.6% 16.4% 4.4% 42.2% 51.0% 6.9% 28.4% 62.7% 8.8% 21.6% 78.4%
Well 21.4% 64.3% 14.3% 7.1% 85.7% 7.1% 28.6% 57.1% 14.3% 0.0% 69.2% 30.8% 7.7% 92.3%
Nuevo Chao
22.9% 75.2% 1.9% 17.1% 80.0% 2.9% 20.0% 73.3% 6.7% 15.4% 80.8% 3.8% 19.2% 80.8%
II SIX hours (S/. 24) TWELVE hours (S/.
26) TWENTY-FOUR hours
(S/. 28) QUALITY (S/. 24) TWELVE hours
& QUALITY (S/. 30)
Yes No M Yes No M Yes No M Yes No M Yes No Chao 9.2% 83.7% 7.1% 16.3% 74.5% 9.2% 20.4% 67.3% 12.2% 20.4% 64.3% 15.3% 17.5% 82.5%
Well 6.3% 87.5% 6.3% 12.5% 81.3% 6.3% 25.0% 62.5% 12.5% 12.5% 68.8% 18.8% 18.8% 81.3%
Nuevo Chao
7.8% 89.2% 2.9% 12.7% 86.3% 1.0% 6.9% 88.2% 4.9% 10.8% 85.3% 3.9% 7.8% 92.2%
III SIX hours (S/. 30) TWELVE hours (S/. 32)
TWENTY-FOUR hours (S/. 34) QUALITY (S/. 30)
TWELVE hours & QUALITY (S/.
36) Yes No M Yes No M Yes No M Yes No M Yes No
Chao 9.7% 83.9% 6.5% 17.2% 82.8% 0.0% 17.2% 77.4% 5.4% 12.9% 80.6% 6.5% 17.2% 82.8%
Well 21.1% 73.7% 5.3% 21.1% 78.9% 0.0% 10.5% 84.2% 5.3% 10.5% 89.5% 0.0% 10.5% 89.5%
Nuevo Chao
6.3% 91.6% 2.1% 10.5% 88.4% 1.1% 12.6% 85.3% 2.1% 10.5% 81.1% 8.4% 7.4% 92.6%
Note: M indicates respondents’ reporting ‘maybe.’ Refer to Section 3.2.1, for an explanation of survey administration. While all respondents were offered the same five scenarios, the set of prices they were offered (row I, II or III) was determined by the order of the enumerators’ visits (i.e. enumerators issues house 1, prices from row I, house 2, prices from row II, house 3, prices from row III, house 4, prices from row I, and the process continued to repeat.). At time of survey one $1.00 was, on average, equal to S/. 2.60 (Yahoo Finance, 2013).

114
However, respondents’ open-ended responses regarding the price they would pay for
the last scenario36 (improved continuity, quality and sewage) do seem to be affected by the
aforementioned prices (Tables 4.33). As seen by how the mean offered price increases from
Row I to Row II, households were likely using the prices previously offered to them as a gauge
for formulating their open-ended numerical response. The influence of how previously offered
prices may condition households’ ultimate WTP becomes more evident in view of the open-
ended responses households gave for Round II’s last WTP scenario (12-hour service with
improved water quality) (Table 4.34). As in Table 4.33, households’ mean (open-ended) WTP
for the last improved service scenario increases from Row I up to Row III.
Table 4.33: Respondents’ willingness to pay for improved continuity (24/7), quality, and sewage – Round I (units of S/.).
!!
Chao Well Nuevo Chao
Min. Max. Mean Min. Max. Mean Min. Max. Mean
I 10 24 17.0 10 20 17.5 5 25 15.0 II 10 35 21.9 15 35 22.2 8 40 19.4
III 15 46 27.2 10 36 22.1 6 36 18.7 Note: The data only reflect the open-ended WTP of respondents that said ‘No’ to the final offered WTP scenario, where I, II and III indicate the minimums, maximums and means as they correspond to households that were offered prices from either row I, II, or III as shown in Tables 4.31.
Table 4.34: Respondents’ willingness to pay for improved continuity (12 hours) and quality (with sewage included in all scenarios) – Round II (units of S/.).
!!
Chao Well Nuevo Chao
Min. Max. Mean Min. Max. Mean Min. Max. Mean
I 5 20 14.7 5 22 13.18 2 32 8.82 II 5 28 15.2 5 30 13.0 1 30 9.21
III 8 50 17.0 10 30 16.6 3 40 10.8 Note: The data only reflect the open-ended WTP of respondents that said ‘No’ to the final offered WTP scenario, where I, II and III indicate the minimums, maximums and means as they correspond to households that were offered prices from either row I, II, or III as shown in Tables 4.32.
36 When households replied ‘No’ to the last WTP scenario enumerators were instructed to ask
respondents what price they would be willing to pay (open-ended).

115
Recall that enumerator offered prices in Round II were, on average, S/. 5 less than
prices offered in Round I (difference ranging from S/. 0 up to S/. 18). Accordingly, respondents’
open-ended WTP for the last scenario in Round II is, on average, S/. 7 lower than WTP during
Round I (difference ranging from S/. 2.3 to S/. 10 lower). In other words, the difference
between respondents’ open-ended WTP from Round I to Round II suggests that through
engaging in the WTP ‘game,’ respondents were conditioned as to what an appropriate price for
an improved water service should be. Then again, it is important to keep in mind that the last
scenario of Round I was different than Round II. Namely, in Round I the last scenario proposed
24/7 continuity of water as opposed to 12-hour continuity proposed in Round II. Thus,
respondents’ open-ended WTP in Round II may have been lower simply because the final
improved service scenario being offered to them was less ideal than the final scenario proposed
to respondents during Round I. Overall, in both Rounds I and II, when given the chance to
suggest what price they would be WTP for the final offered scenario, Nuevo Chao households
are less WTP than Chao households (including Well users) (Tables 4.31 and 4.32).
Results from Round II (Table 4.32) are felt to bean improvement upon Round I in both
its design (scenarios and prices – refer to Section 3.2.1) and implementation (use of visual aid).
Similar to Round I, across all three user groups, respondents who received prices in Row II and
III (for the most part) were less WTP than those who received prices in Row I. This was
especially true for Nuevo Chao households, which, again, may sometimes be indication of
inability to pay rather than unwillingness.
Given the discussion in Section 4.2, one would expect Chao households to place greater
value on increasing the quality of provided water above the continuity of their service.
Nonetheless, the WTP data from Round II does not appear to reveal any such patterns. That is,
Chao households appear to be just as, and in some cases more, WTP for improvements to
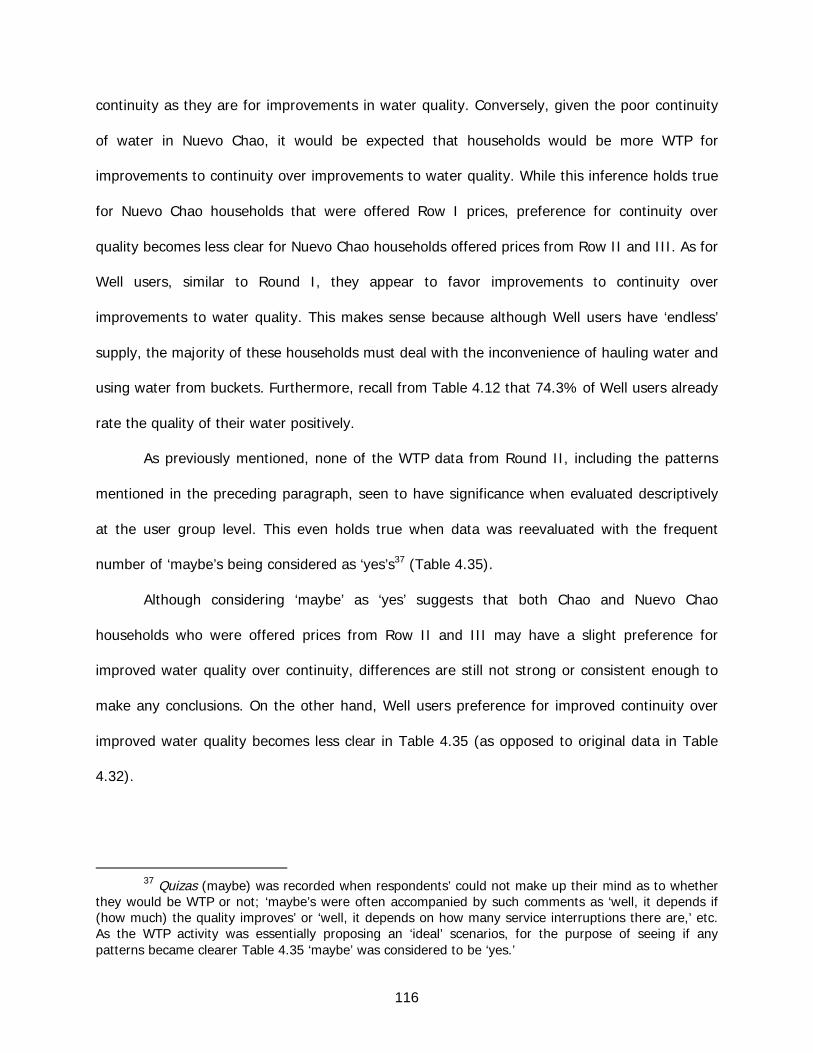
116
continuity as they are for improvements in water quality. Conversely, given the poor continuity
of water in Nuevo Chao, it would be expected that households would be more WTP for
improvements to continuity over improvements to water quality. While this inference holds true
for Nuevo Chao households that were offered Row I prices, preference for continuity over
quality becomes less clear for Nuevo Chao households offered prices from Row II and III. As for
Well users, similar to Round I, they appear to favor improvements to continuity over
improvements to water quality. This makes sense because although Well users have ‘endless’
supply, the majority of these households must deal with the inconvenience of hauling water and
using water from buckets. Furthermore, recall from Table 4.12 that 74.3% of Well users already
rate the quality of their water positively.
As previously mentioned, none of the WTP data from Round II, including the patterns
mentioned in the preceding paragraph, seen to have significance when evaluated descriptively
at the user group level. This even holds true when data was reevaluated with the frequent
number of ‘maybe’s being considered as ‘yes’s37 (Table 4.35).
Although considering ‘maybe’ as ‘yes’ suggests that both Chao and Nuevo Chao
households who were offered prices from Row II and III may have a slight preference for
improved water quality over continuity, differences are still not strong or consistent enough to
make any conclusions. On the other hand, Well users preference for improved continuity over
improved water quality becomes less clear in Table 4.35 (as opposed to original data in Table
4.32).
37 Quizas (maybe) was recorded when respondents’ could not make up their mind as to whether they would be WTP or not; ‘maybe’s were often accompanied by such comments as ‘well, it depends if (how much) the quality improves’ or ‘well, it depends on how many service interruptions there are,’ etc. As the WTP activity was essentially proposing an ‘ideal’ scenarios, for the purpose of seeing if any patterns became clearer Table 4.35 ‘maybe’ was considered to be ‘yes.’

117
Table 4.35: Respondents’ willing to pay for improved (hypothetical) service, Round II, where ‘maybe’ is considered to imply a ’yes.’
CHAO
Improved Continuity (hours) Improved Water
Quality
6 12 24 I 43.2% 18.0% 49.1% 37.2% II 16.3% 25.5% 32.6% 35.7% III 16.2% 17.2% 22.6% 19.4%
WELL
Improved Continuity (hours) Improved Water
Quality
6 12 24 I 35.7% 14.2% 42.9% 30.8% II 12.6% 18.8% 37.5% 31.3% III 26.4% 21.1% 15.8% 10.5%
NUEVO CHAO
Improved Continuity (hours) Improved Water
Quality
6 12 24 I 24.8% 20.0% 26.7% 19.2% II 10.7% 13.7% 11.8% 14.7% III 8.4% 11.6% 14.7% 18.9%
On that note, the only strong trend that Round II WTP data reveals is that, in light of
the offered prices, households in Chao are more WTP than households in Nuevo Chao; true for
both improved quality (range of 12.9% to 28.4% WTP in Chao vs. range of 10.5% to 15.4%
WTP in Nuevo Chao) and improved continuity (range of 9.2% to 42.2% WTP in Chao vs. range
of 6.3% to 22.9% WTP in Nuevo Chao). This trend is inconsequential when compared to the
overwhelming majority, in all groups, that said ‘No, they were not WTP’ for improved water
continuity, quality, or both. In fact, despite the more reasonable prices offered in Round II,
households seem to be less WTP than they were in Round I.
After examining twenty years of stated preference research, Whittington (2010) found
that, overall, households’ WTP for a variety of goods and services is low. Whittington adds to
his observation that researchers “have often failed to see their empirical results for what they
are, that is, an indication that the hypothetical good or service was simply not a priority for

118
many of respondents interviewed” (2010). With this in mind, given eight public services,
respondents were asked to select the service that mattered most to them (Table 4.36).
Table 4.36: Most important municipal-provided, public, service in eyes of respondents.
Wat
er
Pav
emen
t /
Roa
ds
Sew
age
Edu
cati
on
Elec
tric
ity
Mai
n S
qu
are
Hea
lth
Tran
spor
tati
on
Chao 37.5% 15.7% 1.4% 10.6% 1.4% 7.5% 25.9% 0.0% Well 68.0% 10.0% 8.0% 6.0% 0.0% 2.0% 6.0% 0.0%
Nuevo Chao 51.5% 21.7% 6.8% 9.8% 0.7% 2.0% 7.1% 0.3% TOTAL 46.4% 18.0% 4.4% 9.9% 0.9% 4.5% 15.7% 0.2%
Note: ‘Main Square’ refers to the town’s Plaza de Armas. Plaza de Armas are common across Latin America and essentially are popular places for public gathering.
As shown in Table 4.36, the majority of households in each user group ranked water as
the most important public service. Given respondents just finished participating in a survey
completely about water, there may have been a bias. However, as was revealed in Section 4.2,
households are quite dissatisfied with their current water service, particularly with respect to
quality (Chao) and availability (Nuevo Chao).
So, if households view water as the most important service the Municipality of Chao can
provide, and they have an unmet demand when it comes to water quality and continuity, what
makes their WTP so low? It may be that a lifetime of low water tariffs has certain price
expectations among households. With this in mind, the low WTP of respondents detailed in
Tables 4.31 through 4.35 is further examined through consideration of how households view
the existing cost of their water services (Figure 4.24).
As Figure 4.24 reveals, far more Nuevo Chao households view their existing water tariff
as cheap compared to Chao (55.1% vs. 12.3%). This makes sense given that Nuevo Chao

119
households pay nearly one-fifth per month of what Chao households pay. However, Nuevo
Chao households also receive a considerably less continuous service, not to mention earn, on
average, S/. 245 less per month than Chao households.
Note: Currently Chao households pay S/. 15.3 and in Nuevo Chao households pay S/. 3.20.
Figure 4.24: Respondents’ perceptions of the cost to provide existing water services.
Regardless of existing service conditions (and income) however, attitudes toward the
price of the water services can be telling. For respondents in both groups, whether they
perceived their (respective) tariff as cheap or expensive, their answer was often accompanied
by comments such as ‘for what it is.’ As such, it could be roughly 70% of Chao households and
nearly all Nuevo Chao households (those who replied ‘fair’ or ‘cheap’) understand that service
improvements should come with a higher price tag. Yet, even the lowest range of prices offered
to households in the WTP exercise (Table 4.32, Row I, S/. 18 to S/. 24) garnered at most
42.2% of respondents’ support in Chao (WTP for 24 hours) and 22.9% of respondents’ support
in Nuevo Chao (WTP for 6 hours). Instead of revealing disinterest in the service improvements,
or even inability to pay, it may be that, to some extent, low WTP for service improvements
could also be a reflection the public’s attitude toward the water service providers.

120
To this point, Table 4.37 suggests that only half of the Chao households (51.8%) and
roughly two-thirds of Nuevo Chao households (67.0%) trust their water service provider.
Similarly, when asked to rate providers’ performance on a scale of one to ten (where ten is
perfect), the mean in Chao was 6.37 and 6.81 in Nuevo Chao.
Table 4.37: Respondents trust their water service providers and why (Yes or No).
YES NO
Tru
st
Com
mu
nic
atio
n
Goo
d Q
ual
ity
Ad
equ
ate
Qu
anti
ty
No
Tru
st
No
Com
mu
nic
atio
n
Poo
r Q
ual
ity
Insu
ffic
ien
t Q
uan
tity
Chao 51.8% 48.2%
11.4% 10.6% 10.6% 11.4% 5.3% 28.0% 7.6% 12.1%
Nuevo Chao 67.0% 33.0%
21.0% 19.6% 12.3% 5.1% 12.3% 21.0% 3.6% 5.1%
Interestingly, when households were asked what information could be provided to
increase their trust in their providers (Table 4.38), many households referred to their desire for
service improvements rather than increased communication and knowledge 38 . Specifically,
demand for an improved water quality (45.0% Chao, 7.8% Nuevo Chao) and improved
availability (12.9% Chao, 24.8% Nuevo Chao) was once again revealed.
Lack of trust in water providers, as it explains why respondents were unwilling to pay for
the service improvements they desire, is further evidenced by their low confidence that the
38 Some respondents did answer the question directly and desired information about: the origin
and quality of the water (27.5% Chao, 11.5% Nuevo Chao); the maintenance process (2.8% Chao, 3.2% Nuevo Chao); the financial situation (0.9% Chao, 9.6% Nuevo Chao); and 5.5% of Chao households and 22.5% of Nuevo Chao households cited a desire for more communication in general, possibly through meetings and/or workshops (3.2% Chao, 10.6% Nuevo Chao). Interestingly, another 9.2% of households in Nuevo Chao also said they would like the provider to be more friendly and respectful.
121
providers are even capable of providing the services described in the WTP scenarios (Table
4.39).
Table 4.38: What type of information respondents would like from their water provider to increase level of trust.
No
Info
rmat
ion
Wat
er Q
ual
ity
/ Tr
eatm
ent
/ O
rig
in
Mai
nte
nan
ce
Pro
cess
Fin
anci
al S
itu
atio
n
Fore
war
n S
ervi
ce
Inte
rru
pti
ons
Incr
ease
d
Com
mu
nic
atio
n
Be
mor
e Fr
ien
dly
/
Res
pec
tfu
l
Giv
e m
eeti
ng
s /
Hol
d W
orks
hop
s
Impr
ove
Wat
er
Qua
lity
Impr
ove
Con
tinu
ity
Impr
ove
Sche
dule
Chao 2.3%
27.5%
2.8%
0.9%
1.8%
2.3%
0.0%
3.2%
45.0%
12.4%
0.5%
Nuevo Chao 8.7%
11.5%
3.2%
9.6%
0.5%
11.9%
9.2%
10.6%
7.8%
21.6%
3.2%
Note: Categories listed in italics indicate answers that did not directly address the question but revealed respondents’ desire for specific service improvements.
Table 4.39: Respondents’ confidence in ability of service provider to implement proposed WTP scenarios, as rated on scale of one to ten (where ten is absolute confidence).
Min Max Mean Std. Dev.
Chao 1 10 6.96 1.908 Well 5 10 6.71 1.237
Nuevo Chao 1 10 7.15 1.816 Note: In the case of Well users they were referring to their perception of SADISCHAO’s competence to implement the proposed service improvements.
Interestingly, when it comes to water tariffs in the developing world, the World Bank
considers a good benchmark for affordable around 4% of average household incomes (Akram &
Olmstead, 2011). In this light, the Municipality could theoretically raise tariffs by S/. 19.5 (i.e.
up to S/. 34.8) without threatening the households’ right to potable drinking water (Table 4.40).

122
Table 4.40: Existing and potential water tariffs as they compare to each user group’s mean household income.
Household
Income (S/.) Existing
Tariff:Income ratio Affordable Tariff (S/.)
Chao 1,116 1.4% 44.7 Well 1,017 - 40.7
Nuevo Chao 870.6 0.4% 34.8
A S/. 34.8 tariff seems reasonable considering the indirect expenditures households
make to obtain a satisfactory quality and quantity of water with their existing water services. In
Chao and Nuevo Chao the most common additional expenditures households make, monetarily
and in way of opportunity cost of time are: fetching or transporting groundwater, going to the
river, boiling water (revealed to cost around S/. 3 to 8 per month – Section 4.3), investment in
storage devices, and purchasing bottled water. Furthermore, when compared to what
households are (willingly) paying for other services (Table 4.41) S/. 34.8 is not substantial. That
said, ability to pay is only one factor of determining a suitable water tariff and will be further
discussed in Chapter Five.
Table 4.41: Mean monthly cost of other common household services (S/.).
Electricity Cable Cell Phone
Gas (cooking fuel)
Chao 43.6 11.8 34.3 38.4 Well 33.9 9.84 19.2 34.3
Nuevo Chao 28.8 15.0 27.8 33.8
4.7 Summary
Chao and Nuevo Chao water services are not being provided for as many hours per
(every other) day as providers stated. Furthermore, the continuity of service is not equitable,
particularly in Chao. However, arrival times in Chao are relatively convenient (morning or
afternoon) as compared to Nuevo Chao where water is provided throughout the day with a

123
quarter of the population receiving water while they are sleeping. Not surprisingly, twice as
many Nuevo Chao households reported the hour of arrival affects their daily schedule, although
the majority of houses appeared to have adapted accordingly (87.9% Chao, 76.0% Nuevo
Chao). Overall, Chao households have roughly four times the access to water as Nuevo Chao
households.
Domestic water service is a relatively new concept for the large majority of households
with most having had a water service for only seven years or less (65.4% Chao, 85.7% Nuevo
Chao). Perhaps this explains why some households do not identify their existing intermittent
services with water scarcity. Households reporting experience with water scarcity was higher in
Round I (summer) and suggests that households perceive scarcity as a relative drop in the
availability of what has become a normal service. During periods of scarcity (i.e. service cuts
and the summer months) alternative water sources are far more accessible in Chao. There,
households have convenient access to wells (personal or neighboring) and thus appear to be
incentivized to conserve their water. Nuevo Chao households, however, must be extra
conscious with their water use. With respect to alternative sources, households that use wells
(70.8% Chao, 11.2% Nuevo Chao) do so on an infrequent basis. Aside from visits to the river,
use of alternative sources (wells and bottled water) is primarily for drinking and cooking, which
suggests an unmet demand in water quality. However, in both Chao and Nuevo Chao tap water
is the most accessible water source and households tolerate the service despite its deficiencies.
Pressure problems are another form of service deficiency which half of Chao and Nuevo
Chao households reported during Round I (summer), and roughly 13.1% of Chao households
and 10.8% of Nuevo Chao households deal with on a daily basis year round. Chao households
store 175 to 230 liters more per day than Nuevo Chao households. However, Nuevo Chao
households reported the greatest interest in purchasing additional storage devices (34.1% as

124
compared to 22.8% Chao, 21.3% Well users; if lacking sufficient funds can be interpreted as an
underlying ‘Yes,’ 71.4% Nuevo Chao as compared to 54.8% Chao, 38.1% Well users).
Despite the services’ short duration, poor quality and pressure, the large majority of
households (92.4% Chao, 94% Well users, 84.6% Nuevo Chao) reported to have their basic
water needs satisfied. Nonetheless, 35.7% of Chao households and 61.5% of Nuevo Chao
households reported that they would use more water if it were more continuous. In particular,
households reported a desire to do more laundry (60.2% Chao, 39.3% Nuevo Chao), water the
street (9.2% Chao, 11.4% Nuevo Chao), and store more water (13.3% Chao, 13.6% Nuevo
Chao). This suggests that, regardless of necessity, the greater the availability of water in an
intermittent context, the greater the quantity of water households will use.
Chao households had the least trust in their drinking water (28.7%) followed by Nuevo
Chao households (63.5%) and Well users (76.1%). The majority of households in all three-user
groups (69.2% Chao, 52.0% Well users, 60.2% Nuevo Chao) are aware that the term ‘potable’
implies water that is of higher quality (treated). However, the majority of the population does
not know how, and perhaps if, their water is being treated. This may help to explain why so
many households perform additional treatment. Specifically 82.6% of Chao households, 83.3%
Well users, and 72.6% of Nuevo Chao invest time and/or money improving the quality of their
drinking water. Treatment is done primarily by boiling water using gas or wood. Point-of-use
treatment appears to be performed for both reasons of taste and health. However, due to a
lack of time and/or money, households’ treatment efforts are not consistent.
Overall, households’ financial investment in point-of-use treatment relative to the
existing monthly service fees is noteworthy; particularly for Nuevo Chao households (S/. 3.20
monthly tariff compared to estimated S/. 3 to 7.6 spent per month on boiling water). This
investment highlights the importance of water quality to households. In fact, in the opinion of

125
Chao and Nuevo Chao households, improving water quality, the service schedule, and
maintenance are more important than service continuity. It appears perceived water quality
could be improved through education given 12.3% of Chao households, 16.0% Well users,
17.7% Nuevo Chao do not know what the term potable water implies and the majority of
households (56.1% Chao, 56.4% Nuevo Chao) are unaware of what their providers are doing to
make their water potable.
Street watering is a common behavior in the study area with the principal objective of
reducing ambient dust (38.8% Chao, 75.7% Well users, 79.3% Nuevo Chao). Due to the
region’s climate and high rate of evaporation, street watering is an inefficient use of the region’s
scarce resources, especially when done with clean water (56.6% Chao, 47.2% Well users,
18.0% Nuevo Chao). Vegetation seems to be a more viable solution to managing dirt and dust.
However, only 40% of the population (34.6% Chao, 33.4% Well users, 45.1% Nuevo Chao)
reported to water plants, and very few households (observation) maintained substantial (≥ 1
m2) gardens/groundcover. Interestingly, the most common reason households cited for having
plants was for adornment (51.0%). No households explicitly mentioned plants as a good way of
reducing dust.
Another area of high water use is hygiene. The majority of households bathe with
buckets most, or all, of the time (67.7% Chao, 80.9% Well users, 95.9% Nuevo Chao).
However, households are beginning to acquire showers (70.8% Chao, 20.9% Well users, 6.3%
Nuevo Chao) and if water service continuity increases, the number of households able to utilize
them on a regular basis will likely increase. This could cause an increase in demand depending
on how households transition to running water. As it stands, assuming roughly 7.5 L flows from
a faucet per minute, and a nine minute shower (reported average), households with showers
are likely using ~68 L per capita per day in the winter and up to 204 L per capita per day in the
126
summer (as compared to 20 to 60 L per capita per day for bucket bathing). Laundry is another
area where water use may change in the coming years with the introduction of washing
machines. Washing machines can free up time (perhaps increasing frequency of loads), but
liters used per load could decrease if high-efficiency models were purchased.
Each user group practices water reuse. A primary example is households using
washwater to bucket flush their toilets. This practice may disappear with the convenience of a
more continuous service. However, for households currently using potable water to bucket flush
their toilets, depending on the size of the average toilet tank (reported means of 4 (Well users)
to 9 liters (Chao)) as compared to the average number of liters used/required for a bucket flush
(reported means of 6 (Well users) to 11 liters (Nuevo Chao)), a more continuous water service
could save water when it comes to sanitation.
With respect to water conservation, the majority of households reported to have never
heard or received any information regarding the subject (65.5% Chao, 75.7% Well users,
61.6% Nuevo Chao). However, this did not deter households from reporting that they practiced
water conservation (average 73.5% Chao, 63.3% Well users, 71.4% Nuevo Chao). Respondent
provided examples of water conservation and the associated motivations behind expressed
behaviors reveal that many households conserve water to enhance the quantity and/or
improve/protect the quality available to them personally. Interestingly, when respondents’ were
asked to categorize the amount of water in the District of Chao as ‘abundant,’ ‘regular’ or
‘scarce,’ only a quarter of the population recognized the area’s actual scarcity (24.6% Chao,
22.0% Well users, 29.1% Nuevo Chao). This may suggest that only a small percent of the
population practice water conservation in recognition of a general, regional, scarcity.
Attitudes toward water meters may indiciate how inclined households are to conserve
water. The population is relatively divided in Chao (43.6% in favor, 56.4% not in favor – Chao,

127
46.7% in favor, 53.3% not in favor - Well users) and a clear majority (71.8%) not in favor in
Nuevo Chao. However, respondents’ reasoning suggests that opposition to water meters is not
a direct indication that households would like to use water at their own will. That is, only a
small percentage of households explicitly stated they did not want meters because their bill
would reflect consumption (6.9% Chao, 5.0% Well users, 12.6% Nuevo Chao). In turn,
households in opposition because they believed meters would make their bills more expensive
(36.4% Chao, 37.5% Well users, 46.0% Nuevo Chao) may simply fear they will be unable to
pay or believe the technology is unreliable. That said, it is noteworthy that those in favor of
water meters gave reasons such as ‘priced according to consumption,’ ‘fair,’ ‘more reliable,’
‘minimize use,’ and ‘put wasters into control.’
Gleick (1996) considers 50 liters per capita per day as the basic water requirement
(BWR) for a healthy and productive life. Comparatively, in the summer months, individuals in
the study area use, on average, 6 L (Nuevo Chao) to 37 L (Chao) above the BWR. In the winter
months, individuals in Chao use ~14 L above the BWR while average per capita use in Nuevo
Chao decreases to ~11 L below the BWR. Interestingly, in the summer months, not considering
water for sanitation, per capita water use in Chao is still seven liters more than per capita water
use in Nuevo Chao (while in contrast Well users use approximately two liters less than
individuals in Nuevo Chao). Household possession of water-related infrastructure as defined by
faucets, toilets showers and washing machines is low but gradually increasing. If the
convenience of water is a determinant of use (as suggested by Well users behaviors), daily per
capita and household water use may increase.
Respondents had trouble estimating upfront how much water they used in a day.
However, when upfront estimates are compared to calculated estimates, Nuevo Chao
households seem to be more conscious of their water use than Chao households and Well

128
users. That said, both Chao and Nuevo Chao households had trouble estimating the number of
liters that flowed from their faucets per minute (60.3% Chao, 71.0% Nuevo Chao). As it stands,
without consideration to water ‘lost’ upon arrival, respondents’ upfront estimation of daily per
capita water use ranges from 11 to 50 L lower than what summation of their later water use
estimates per specific activity suggest. This means, for a family of four, the average respondent
underestimated their household’s water use anywhere from 44 to 200 Liters per day.
Household willingness to pay may have been influenced by the prices offered in the
various WTP scenarios. During both Round I and Round II Nuevo Chao households were less
WTP than Chao households (including Well users), which could reflect an inability to pay.
Despite the more reasonable prices offered in Round II, households seemed to be less WTP
than they were in Round I. Overall WTP by all three user groups in both Round I and II is low
and does not present any significant trends. Despite this unwillingness to pay, the majority of
households in each user group ranked water as the most important public service.
Interestingly, 65.8% of Chao households and 95.1% of Nuevo Chao households view
the existing service fees as ‘fair’ or ‘cheap,’ which suggests they should be WTP more for
improved services. Perhaps WTP is low because only half of Chao households and two-thirds of
Nuevo Chao households trust their water service provider. When asked to rate providers’
performance on a scale of one to ten (where ten is perfect), the mean in Chao was 6.37 and
6.81 in Nuevo Chao. When households were asked what information providers should share to
gain their trust, a large portion of respondents listed service improvements (57.9% Chao,
32.6% Nuevo Chao) rather than address the question through responses such as information
about the water’s quality, origin or treatment process (27.5% Chao, 11.5% Nuevo Chao).
Ultimately, in order to be efficiently and effectively run, water services require money.
Ideally, this money should come from monthly tariffs. The World Bank considers tariffs that are

129
four percent of average household monthly income to be ‘affordable.’ Accordingly, the
Municipality could theoretically raise tariffs by S/. 19.5 (i.e. up to S/. 34.8) without threatening
the households’ right to potable drinking water. Interestingly, a S/. 35 monthly water tariff
would still be less than what households pay for electricity per month and around what they
spend on cooking (fuel). Furthermore, if the service were improved (quality and/or continuous)
households could save in way of coping costs.

130
CHAPTER 5: DISCUSSION
Historically, domestic water demand was viewed as a need and water managers would
develop whatever infrastructure was necessary to meet it. While supply-driven projects must
still be implemented, they are no longer considered the only solution to meeting water demand.
Over the past several decades, demand-driven water management, wherein water demand is
viewed as a modifiable want, has received increasing attention. As climate change, urbanization
and environmental degradation put increasing strain on freshwater resources, there is
“considerable pressure from the general public, regulatory agencies, and some governments to
minimize the impacts of new supply projects” (Butler & Memon, 2006). With that said,
minimizing demand is the cheapest form of readily available water (Sharma and
Vairavamoorthy, 2009). In contrast to supply-driven management, which relies heavily on
engineering solutions, demand-driven management examines the bigger picture and draws on
strategies from technical, financial and socio-political fields.
Demand management as it pertains to domestic water resources has been very
successful in developed countries around the world including Singapore, the United Kingdom,
Canada, Australia, France, the United States, (Sharma and Vairavamoorthy, 2009), Spain
(Kayaga & Smout, 2009), and Egypt (White & Retamal, 2011). However, nowhere is the need
for demand management so great as in developing countries where populations are growing,
urbanizing, and, in turn, desiring a higher quality of life (Vairavamoorthy et al., 2008).
Accordingly, developing countries have begun to utilize demand management strategies as well.
Unfortunately, their success has been not as pronounced. In a report titled “Urban Water
Demand Management: Prospect and Challenges for the Developing Countries,” Sharma and

131
Vairavamoorthy (2009) list some of the reasons demand management strategies implemented
in developing countries have been less rewarding. Namely:
“water resource scarcity, poor quality, complex and aged infrastructure, high rate of growth of population and water demand, high water losses in the distribution system, low cost recovery and high subsidy, poor management and institutional framework” (p. 214).
As such, the authors recognize that demand management strategies that are successful
in developed countries cannot be directly translated to the rapidly expanding, evolving, and
constrained environments found in developing countries. Subsequently, Sharma and
Vairavamoorthy (2009) go on to suggest twelve demand management activities as they relate
to the unique conditions of urban water systems in developing countries (Table 4.42).
Table 4.42: Twelve demand management strategies for developing countries excerpt from Sharma and Vairavamoorthy (2009).
TECHNICAL
i Proper assessment of the state of the water supply infrastructure and water loss level using appropriate indicators.
ii Application of spatial analysis techniques that help decouple highly chaotic and interconnected networks that allow the development of LCZs (leakage control zones) and DMAs (district metered areas).
v Setting up proper database systems for assets, water balance and maintenance records.
vii Use of modern tools and software for distribution system management.
FINANCIAL viii Full cost water pricing, use of increasing block tariff and water metering.
ix Use of other economic instruments like rebates, incentives, subsidies, taxes or fines supported by rules and regulations promoting water conservation and water reuse.
SOCIAL
vi Promotion of water-saving devices and consumer education and awareness building on water conservation at all levels
xi Promotion of 1) water recycling and reuse and 2) rainwater harvesting in order to reduce the demand on urban water supply systems
Note: Strategies are presented out of their original order (roman numerals) in order to group them according to whether they are primarily technical, financial, social, (or general). That said, all of the above strategies are in some way legal, administrative and institutional as well.

132
Table 4.42 (Continued).
GENERAL
iii Development of new techniques that are specifically tailored for water starved/intermittent supply systems that recognize the low pressure and short duration of supply that is common in these systems.
iv Development of appropriate levels of service and techniques to operationalize these levels of service so that a more reliable and regular supply is provided.
x Step-wise approaches to reduce water demand
xii
Great appreciation of stepwise/phased strategies for UWDM (urban water demand management) that recognize there is no 'quick fix' and that benefits may be slow but long term. Such a strategy should be based on technical measures coupled with institutional restructuring and capacity building and educational programs for the local communities affected.
5.1 The Case for Chao
In November 2012 the Municipality of Chao finished the construction of a costly supply-
side endeavor that, when eventually running as designed, will provide coverage to 97% of the
population living between Chao and Nuevo Chao. The project was designed for a lifetime of
twenty years and to meet a demand of 150 liters per capita per day (lpcd)39. The service’s new
primary source is the CHAVICMOHIC canal, or, indirectly, the Santa River. Unfortunately,
accelerated melting of the lower Andean glaciers may result in increasingly strained water
resources in Peru (BBC News, 2013), and, specifically, the Santa River Valley (Lynch, 2010). So,
if supply-enhancing solutions continue to be the sole focus of management, the Municipality
may need to locate and develop a new water source in less than twenty years. Alternatively,
the Municipality could begin to adopt demand management strategies and not only extend the
life of the water service by maintaining household water use near or below present levels, but
resolve ongoing issues of inequity and poor water quality as well.
39 In comparison, water use in United Kingdom is 150 liters per capita per day and 300 to 600 liters per capita per day in the United States (Butler & Memon, 2006; UN-Water, 2007). Interestingly, in a 2006 report the United Nations Development Project (UNDP) estimated water consumption in Peru to be 173 liters per capita. While per capita consumption in Chao appears to be far below the national average it does not need to grow with the economy.

133
With respect to prolonging (or minimizing) existing water use, this study revealed
existing per capita water use in the range of 35 to 90 lpcd (Table 4.27). While household water
use is presently far below anticipated demand, it appears likely to increase. First, although the
majority of households reported the existing water volume available to them was enough to
meet their basic needs (92.4% Chao, 94.0% Well Users, 84.6% Nuevo Chao – Figure 4.8), they
were planning to buy more storage devices (22.8% Chao, 21.3% Well users, 34.1% Nuevo
Chao – Figure 4.7). If a lack of money is considered to suppress an underlying desire then the
numbers may be closer to 54.8% Chao, 38.1% Well users, 71.4% Nuevo Chao. Additionally,
respondents said they would use more water if it were continuous (35.7% Chao, 61.5% Nuevo
Chao – Figure 4.9) primarily for the activities of laundry (60.2% Chao, 39.3% Nuevo Chao),
street watering (9.2% Chao, 11.4% Nuevo Chao) and storing more water (13.3% Chao, 13.6%
Nuevo Chao) (Figure 4.10). While the first activity is requisite for basic hygiene, the latter two
are not and might be modifiable.
Evidence that water use in the area could increase under improved service conditions is
also suggested through comparison of Chao to Nuevo Chao households which suggests that
increased duration (i.e. hours per day) does lead to greater use; use that is, perhaps, beyond
necessity. Specifically, Chao households have, on average, four times the access to potable
water, report to store ~175 to 230 liters more per day, use ~60% more water per capita per
day, and are more likely to use potable water for street watering (56.6% Chao, 18.0% Nuevo
Chao – Figure 4.15). While Nuevo Chao households voiced the biggest desire to purchase
additional storage devices, Chao households and Well users contemplating future purchases
wanted the most additional capacity (means of 650 L Chao / 831 L Well users compared to 289
L Nuevo Chao – Table 4.11). It appears that although Well users have an ‘endless’ water
supply, having to access it via rope and bucket means they still use less water than Chao

134
households. In other words, convenience appears to be a factor in water use.
Overall, it appears the amount of running water available to Chao households has
conditioned them to use and store more water, the latter of which may end up being discarded
before use. Findings of previous studies have suggested that household water use does not
appreciably increase with (more) continuous service (Andey & Kelkar, 2007; Whittington &
Nauges, 2010). However, this study suggests that household water use will increase with
increased availability so long as behaviors associated with intermittent service, such as storing
water, continue. Consequently, as Nuevo Chao households transition from an every other day
intermittent to a daily intermittent water service, increased availability will likely lead to
increased water use. This will be particularly true if Nuevo Chao households are able to fulfill
their desire for increased water storage capabilities. In fact, in a study of domestic water use in
India Iskandarani (2002) found that storage capacity was a larger determinant of demand than
rationing.
With respect to infrastructure, water use is sure to increase in Nuevo Chao with the
introduction of sewage. For Chao households and Well users, flushing toilets constitute ~25%
of households’ daily per capita use (Figures 4.22/4.23). Beyond toilets however, both Chao and
Nuevo Chao households are gradually acquiring water-related infrastructure that provides
sanitation and hygiene [shower(s), additional faucets, washing machines, etc.]. Whether such
infrastructure equates with increased water use is a matter of its inherent efficiency and of how
the new infrastructure is employed. For example, households with showers are currently using
~68 L per capita per day in the winter and up to ~204 L per capita per day in the summer (as
compared to ~20 to 60 L per capita per day for bucket bathing).
Currently only 25% of the population views the area’s water resources as scarce (24.6%
Chao, 22.0% Well users, 28.9% Nuevo Chao - Table 4.24). Consequently, while the majority of

135
households reported to practice water conservation (seasonal averages of 73.4% Chao, 63.3%
Well users, 71.4% Nuevo Chao) existing behaviors are likely motivated more by a fear of and/or
actual lack of water than by concern for the greater environmental good. In fact, respondents
explicitly said they practiced water conservation so their households did not run out of water
(35.9% Chao, 50.0% Well users, 31.9% Nuevo Chao – Table 4.23). Reported examples of
water conservation such as covering water (14.6%) and boiling water (1.9%) further suggest
the term may be interpreted as enhancing/prolonging the quantity and/or improving/protecting
the quality available. This likely explains why, in the winter months when water is not as scarce,
there was almost a 20% dip in reported conservation efforts (Figure 4.20). Not surprisingly,
Well users, who theoretically have an endless supply of water, were the least likely to conserve
(Figure 4.20).
As a whole, the concept of water conservation as it is known in the developed world is
not well understood by respondents. The study’s results show that the majority of households
do not view water as a potentially scarce resource and, consequently, it is possible existing
conservation behaviors will disappear when households gain increased access to tap water
and/or alternative sources. This is evidenced by how households respond to service cuts. In
Chao, where there are private household wells on nearly every block, only 2.8% of households
report to be extra conscious of their stored water, while the majority of households (73.4%)
reported to turn to groundwater when they ran out. In contrast, in Nuevo Chao where there is
an absence of accessible groundwater, 13.0% of households reported to be extra conscious of
their water (or, if they ran out, their neighbor’s extra tap water 62.9%).
Beyond making sure water is used efficiently and wisely, demand management can be
effective at resolving existing issues of inequity, which, in Chao currently exist in terms of
duration, schedule, and pressure of the services. To begin, households in Chao all pay the

136
same price but water can arrive anywhere from less than 1 hour (12.4%) to more than six
hours (2.9% - Figure 4.1). Alternatively the majority of Nuevo Chao households receive water
from 30 minutes to one hour (70.9%), but the time of arrival is variable, with 25% of the
population having to wake up to store water (Table 4.2). Although not explicitly studied, from
observation it was evident that the hour that households receive their water can significantly
affect how efficiently and/or inefficiently they use it. While people appear to have adapted to
different duration and schedules (87.9% Chao, 76.0% Nuevo Chao not affected by schedule–
Table 4.3), poor pressure is another issue. This study found that pressure problems are
pronounced in the summer (42.4% Chao, 42.4% Nuevo Chao) but exist in the winter as well
(10.4% Chao, 21.0% Nuevo Chao) (Table 4.7). For some 13.1% of Chao and 10.8% of Nuevo
Chao households pressure issues occur year round on a daily basis (Table 4.9). Fortunately,
households plagued with insufficient pressure have not installed pumps (so as preferentially
divert water in the distribution system). Such behavior is apparently common in other
developing countries, such as India, and could create a domino effect, exacerbating the
services’ existing inequities (McKenzie & Ray, 2009). Unfortunately, with respect to the new
service, piping was not sized with intermittent distribution in mind, so it is unlikely that inequity
problems will be resolved with the onset of the new discontinuous service. In fact, due to a
more extensive and sprawling network, they may become worse.
Demand management can also mitigate issues of poor water quality. Both Chao and
Nuevo Chao households cited water quality as the most important aspect of a quality water
service (73.9% Chao, 69.6% Well users, 66.7% Nuevo Chao) (Table 4.17). Quality appears to
be defined not only by physical and biological security but also by taste and odor (Figure 4.12).
It is not surprising given the extreme hardness of Chao’s former water supply that Chao
households had the lowest opinion of their water’s quality (described poorly by 30.0% of the
137
population as compared to 74.3% Well users and 60.6% Nuevo Chao - Table 4.12; and seen as
not safe to drink by 28.7% as compared to 76.1% Well users and 63.5% Nuevo Chao – Table
4.13). While Nuevo Chao households and Well users appear to be satisfied with the quality of
their water, the majority of households in all three user groups reported to regularly boil their
water (62.6% Chao, 61.8% Well users, and 50.9% Nuevo Chao) (Table 4.14). Overall, 82.6%
of Chao households, 83.3% of Well users and 72.6% of Nuevo Chao households invest time
and/or money improving the quality of their drinking water. This could suggest that while
Nuevo Chao households and Well users appreciate good tasting water, they still want to make
sure it is biologically and physically safe to drink as well. In fact, when it comes to determining
the most important aspect of water quality, all three user groups seem to be split in varying
degrees between biological safety, physical safety and taste/odor (Figure 4.11). This is not
surprising given all three are interrelated. In addition to household treatment, Chao households
also cope with the poor quality of their water by supplementing their tap water with well water.
Interestingly, 64.3% of households that use wells as alternative sources do so exclusively for
the purposes of drinking and cooking. With respect to the latter, Chao households frequently
complained that the tap water’s hardness prevented them from being able to prepare their
menestra (beans). Overall, it appears that how households’ judge water quality from the new
treatment plant could have varying effects on water use. For example, perhaps if households
perceived the quality of the water to increase, they might not be as inclined to toss it onto the
dirt before using it.
Knowledge of the existing service realities and households related behaviors and
opinions is extremely important. To meet growing demand the Municipality’s written proposal

138
projected an eventual amalgamation of treated river water and nonrenewable40 groundwater
(from the old source), before ultimately needing to develop new water sources. However,
although the new service has only been running for a few months, days of particularly high
turbidity have limited the water treatment plant’s production. At these times, the two sources
have been combined. This is of particular concern because water quality, not the services’
continuity, appears to most concern households. However, if the treatment plant’s inability to
process highly turbid water is resolved and the Municipality can maintain household water use
at or below existing levels, the unadvisable step of combining waters of different quality can be
avoided. If such a change were able to attract more Well users to partake in the new service,
the rate of nonrenewable water depletion could also be reduced.
To provide high quality water the Municipality will need to adequately operate and
maintain the new water treatment plant. This will require sufficient revenue as collected
through the households’ monthly water bills. With respect to operation and maintenance
(O&M), recall from Chapter Three that in the month of February (2013), SADISCHAO paid
$30,800 (S/. 80,000) to operate the new water treatment plant but only took in $7,700 (S/.
20,000). Accordingly, water tariffs may need to be appreciably raised, at least for households in
Nuevo Chao.
Unfortunately, it appears the Municipality may face an uphill battle with respect to price
increases as the public has been conditioned to pay practically nothing for water and considers
the existing tariffs (which are 1.4% of average monthly income in Chao and 0.4% of average
income in Nuevo Chao) to already be ‘fair’ or, worse, ‘expensive’ (87.7% Chao, 44.9% Nuevo
Chao). For Nuevo Chao households in particular, a new tariff will be a drastic increase and may
cause unrest, especially if the population was never willing to pay for improvements in the first
40 Groundwater is generally considered to be nonrenewable. In many cases the period of time
needed for replenishment is on the order of 100 to 1000s of years (Foster et al., 2005).

139
place. That is, despite the poor quality and poor availability of Chao’s and Nuevo Chao’s,
respectively, preexisting services, very few households were willing to pay for improved service
scenarios (Tables 4.31 - 4.35). Nonetheless, of eight public works projects the Municipality
provides, the majority of households rated water as the most important (37.5% Chao, 68.0%
Well users, 51.5% Nuevo Chao). Unwillingness to pay is perhaps not a reflection of low interest
for improved services, or even inability to pay. Instead, it may be indication of household’s’
distrust in their service providers (48.2% Chao, 33.0% Nuevo Chao distrust their water
provider; and, a mean of 6.37 Chao and 6.81 Nuevo Chao are the providers’ rated performance
on a scale of one to ten).
Combine threatened water supply with increasing demand, existing issues of inequity,
poor water quality, and households’ unwillingness to pay, and demand management, which
addresses not just issues of efficiency but also water quality and equity, is all the more
pertinent for Chao. Employing demand management could greatly extend the success and
lifetime of the new service. Subsequently, the following discussion will examine twelve effective
demand management strategies (as suggested by Sharma and Vairavamoorthy, 2009) as they
pertain specifically to Chao’s existing circumstances, and more generally, to small developing
cities that rely on intermittent, un-metered, water (and sanitation) services.
The prevalence of such services is exemplified by Shamra and Vairavamoorthy’s demand
management strategy that advocates for, “development of new techniques that are specifically
tailored for water starved/intermittent supply systems that recognize the low pressure and short
duration of supply that is common in these systems” (2009)41. With this in mind, their other
41 To this point, studies have looked at the redesign of intermittent systems (Vairvamoorthy et
al., 2008; Batish 2003). Rather than have to overcome issues that arise when a system designed to be run continuously is run intermittently (such as will be the case for Chao), water systems should be planned in accord with how they will actually be operated. Proactive design for intermittent systems means recognizing that supply (pressure at outlet), not demand, is the system driver. Using mathematical
140
eleven suggested activities will be examined. The strategies will be grouped and discussed
according to whether they are primarily technical (Section 5.2), financial (Section 5.3), or social
(Section 5.4) in nature (as summarized in Table 4.42).
5.2 Technical Strategies
Beginning with technical demand management strategies, the authors suggest the
“proper assessment of the state of the water supply infrastructure and water loss level using
appropriate indicators” (Sharma & Vairavamoorthy, 2009). Water losses (i.e. the volume of
water lost between production and authorized consumption) result from a combination of poor
infrastructure, leaking pipes, and illegal connections. In developing countries, such losses are
poorly documented but are estimated to fall in the range of 40 to 60% of produced water
(Arlosoroff, 1999). Even in low pressure networks large leaks have been found (Rogers, 2005).
Ideally, water providers would like to be able to pinpoint how much water is being lost,
and the location(s) and reason(s) why. With respect to how much and where, this is
traditionally estimated by using district and/or household meters to identify unusually high-
volumes of night flow. In contrast, in intermittent systems where pressure is not constant,
leakage assessment is a more time-consuming process and can involve up to two weeks of
preparatory work in the zone where the test will be carried out (a typical test area is 500 m of
pipe). The actual test involves measuring non-supply flow for ~ eight hours as tanker trucks
continuously pump water into the selected closed-boundary zone (Vairavamoorthy & Mansoor,
2006).
Given the water service in Chao is meterless, such a calculated assessment of the
service’s efficiency cannot be made without a significant investment of both time and money.
However, because Chao’s distribution network is still rather small and the piping relatively
modeling and optimization tools, piping and storage units can be optimally located to provide for the most equitable service possible at the least cost.
141
new 42 , the SADISCHAO office believes non-revenue water due to leaking pipes to be
insignificant. Thus, for the time being, perhaps appropriate infrastructure monitoring could take
the form of: 1) measuring the rate at which water empties from the reservoir per zone43, 2)
periodically visiting and visually and audibly assessing mains, 3) consistently recording the
frequency and duration of pipe bursts, and 4) household visits to evaluate possible leaks,
pressure issues, and observe household water storage and use.
The second suggested activity, the ‘application of spatial analysis techniques that help
decouple highly chaotic and interconnected networks that allow the development of leakage
control zones and district metered areas’ is related to the aforementioned strategy and,
consequently, limited by Chao’s lack of meters. However, all of the possible indicators
discussed above (pipe burst frequencies, complaints of low and high pressure, etc.) could be
recorded with GPS software so that SADISCHAO can begin to identify the system’s most
problematic zones.
This goes hand in hand with Sharma and Vairavamoorthy’s other suggestion to develop
“appropriate levels of service (which recognize the true situation on the ground) and techniques
to operationalize these levels of service so that a more reliable and regular supply is provided.”
Given that 25% of Chao and Nuevo Chao households reported year round pressure issues
(13.1% Chao and 10.8% Nuevo Chao on a daily basis – Tables 4.8 and 4.9), identifying where
and why those issues are occurring is of great importance. Correspondingly, when SADISCHAO
is ready to install district and/or household water meters, they could gradually phase them in,
starting with these ‘trouble zones.’
42 The oldest pipes in Chao’s network date back to 1996 but a large portion of Chao’s water
system was recently laid and/or replaced in 2011/2012. Compare to the U.S. where 40% of drinking water pipes are greater than 40 years old (EPA, 2012).
43 How fast water is used up (considering the number of connections and length of pipes) on the
East side vs. the West side of Pan American highway vs. new distribution zones for Nuevo Chao I and II.

142
With respect to phasing in meters, careful planning that covers both the technical and
social aspects of water meters must occur prior to implementation. Aspects such as where the
meters should be installed, how (frequently) they will be read and maintained, and consumer
perceptions all need be considered (Vairavamoorthy & Mansoor, 2006). For example, while
households in Chao appear to be split on whether they favor the introduction of water meters
(43.6% in favor, 56.4% not in favor), Nuevo Chao households are more strongly opposed
(71.8%) (Table 4.25). Opponents seemed to have a strong preconception that meters would
inherently make their bills more expensive (66.3%) and not work properly (8.9%). These
beliefs are not completely unwarranted. In fact, under intermittent conditions frequent
fluctuations in pressure have caused water meters to prematurely break and/or give false
readings (Vairavamoorthy & Mansoor, 2006). Accordingly, it is crucial that much effort be put
into garnering public support, as well as working out technical details, prior to a transition to
metered service.
If successfully implemented, meters could help households better understand their
water consumption. As it stands, the average respondent underestimated household water use
(as compared to calculated, conservative, estimates presented in Table 4.27) by 40 to 200 L per
day (Table 4.30). Respondents’ accuracy in estimation appeared to decrease in accord with the
overall availability of their service (i.e. Nuevo Chao households were most accurate followed by
Well users, followed by Chao households). This suggests that unless actively/visually engaged in
their water use (i.e. depending on allocated amounts from storage devices), households quickly
become desensitized to how much water they are consuming. This theory is supported by the
general water illiteracy that exists in developed countries (Fishman, 2011) and highlights an
opportunity to couple the introduction of meters with education to enhance households’ existing
awareness.

143
Overall, “leak management is data hungry, and so investment in software systems and
staff resources to manage the data can be significant” (Trow & Farley, 2006). This ties into
Sharma and Vairavamoorthy’s next suggestion, the “use of modern tools and softwares for
distribution system management” (2009). Such modern tools and software are likely a long way
off for Chao. This is not only due to a lack of network meters but also because the number of
computer-trained staff in SADISCHAO’s office fluctuates between one and two individuals (and
one or two computers)44. Given that the new water and wastewater treatment plants currently
do not have the optimal number of technically trained engineers and operators (currently
employing nine of the recommended nineteen employees), increasing the number of personnel
(and equipment) in the Municipal water office should not be the main priority.
Even so, SADISCHAO’s office has done a good job of making do with what they have.
Specifically, they have begun to set up a “proper database systems for assets, water balance,
and maintenance records” (a mentioned Demand Management activity) (Sharma &
Vairavamoorthy, 2009). That is, SADISCHAO currently has an electronic, organized, ExcelTM
database where they keep detailed records of registered users, their payments, and monthly
income and expenditures. For this reason, SADISCHAO is now able to enforce payment, cutting
households’ connections when they fail to pay for their service three months in a row. In fact, in
the last four years, SADISCHAO’s increased enforcement has resulted in a 17.33% reduction in
morosidad (late payments).
5.3 Economic Strategies
For financial measures, Sharma and Vairavamoorthy suggest “full cost water pricing, use
of increasing block tariff and water metering” (2009). Price is considered a demand
management tool in that a well-designed tariff should promote rational water consumption
44 As observed during the author’s two years in Chao.

144
among users. In fact, compared to non-price strategies, price-based tools have been shown to
be more cost effective and easier to monitor and enforce (Olmstead & Stavins, 2009). Although
the concept of water as an ‘economic good’ has grown in acceptance since first being
introduced as the basis for human life and well-being (ICWE, 1992), water is, and always will
be, inherently different than other goods. As such, water price is a very delicate issue and is not
simply a matter of how much households could pay. Accordingly, in using price as a demand
management tool, it is important that tariffs follow the ‘CAFES’ principles; namely that they are
‘conserving, adequate, fair, enforceable and simple’ (Sansom et al., 2002). Tariffs should also
be designed with consideration to the cost of operation and maintenance, opportunity costs,
economic externalities, and environmental externalities (Motoma, 2007).
The most popular tariff structure in developing countries is the increasing block format
(Vairavamoorthy & Mansoor, 2006). Increasing block tariffs (IBT)s (as Sharma and
Vairavamoorthy 2009 suggest) are a rate design that can encourage conservation while
simultaneously increasing revenue (Motoma, 2007). In addition IBT structures work best when
the income profile varies greatly as it does in Chao and Nuevo Chao45. The design of IBTs
charges a low marginal price for water consumption up to a certain threshold after which the
unit rate of water drastically increases with increasing usage. This design is thought to reward
conserving behaviors with low rates while penalizing high water users (EPA, 2009).
However, increasing block tariffs have also been argued as disadvantageous for the
poor, thus violating the ‘fair’ in the CAFES principles (Butler & Memon, 2006). In a paper titled
“The Political Economy of Increasing Block Tariffs in Developing Countries” Boland and
Whittington (2000) address five problems and limitations of IBTs and ultimately conclude that
they introduce “inefficiency, inequity, complexity, lack of transparency, instability, and
45 Reported incomes ranging from S/. 50 to 11,300 per month in Chao and S/. 50 to 4000 in
Nuevo Chao.
145
forecasting difficulties.” Since the paper was published attempts to address the common
oversights of IBTs have been made. For example, Baberán and Arbués (2009) recognized the
problem IBTs could create for large households (that are often poor) and proposed adopting a
per capita IBT. However, as they recognized this would incur high administrative costs, they
suggested the utility offer both options and only households that unfairly fall into the highest
block of the general (household) tariff could opt to give the utility further information so as to
be charged based on per capita consumption.
Ultimately, whether IBTs are advantageous or not, so long as the Municipality of Chao
continues to operate the new water service without meters, the opportunity to manage demand
through creative tariff designs (such as described above) is not an option. Essentially, the only
tariff structure available in meterless water systems is a flat rate structure in which all
households, regardless of size and water use, pay the same amount. SADISCHAO is currently
operating at a loss of S/. 60,000 a month. Accordingly, the Municipality is faced with the difficult
task of bridging the existing gap in income vs. expenditures, while also planning for future
operation and maintenance46. Moreover, the new flat rate tariff needs to consider that the
average monthly income in Nuevo Chao is 78% of average monthly income in Chao (S/. 245
less) and Nuevo Chao households were previously paying S/. 3.20 a month for water.
The only way to improve the equity of a flat rate, as well as encourage conservation, is
through other financial measures suggested by Sharma and Vairavamoorthy “like rebates,
incentives, subsidies, taxes or fines supported by rules and regulations promoting water
conservation and reuse” (2009). Interestingly, in conclusion to the limitations of increasing
block tariffs, Boland and Whittington (2000) propose a simple two-part tariff where every
household would receive 1) a single volumetric charge equal to the marginal cost of water
46 Recall that capital costs of the new water and wastewater treatment plants were covered by
the National government.
146
coupled with 2) either a fixed monthly credit or rebate. Again however, rebates, incentives and
taxes, are measures that would be difficult to design and implement without household meters.
As for subsidies and fines, while politically and administratively difficult, they could be done.
Because Chao’s water service is still relatively small, households receive bills under their door
and must go to the Municipality once a month to pay their bill in person. This process creates
two opportunities in which the provider and customer have an opportunity to engage.
Consequently, the Municipality could establish a fairly good idea of what households/families
are deserving of a subsidy. Nonetheless, users would have to apply in order to qualify (large
household size and/or low income) and this would require extra data processing and
complications for SADISCHAO.
With regard to fines, a few respondents suggested that at one point there had been an
ordinance issued against street watering. In contradiction, SADISCHAO confirmed that no such
law was in place. However, respondents’ misinformation revealed a demand management
opportunity; namely, fining residents for watering their streets. With respect to implementation
feasibility, 1) the wasteful water behavior is relatively easy to catch as street watering with
potable water is very predictable (occurring with the arrival of water), 2) the area served is not
unmanageably large, and 3) there really is nowhere to hide for abusers. An issue, however,
would be the cost of hiring an employee to monitor and fine households for street watering.
How long such an ordinance would need to be enforced to create lasting and sustainable
behavior change is another consideration. If the answer is indefinitely, an ordinance is likely not
the best use of the Municipality’s time and money. Alternatively, the Municipality could offer
incentives for households to adopt vegetation as a different way to manage dust. Such a
practice would require education and awareness building which is the focus of Sharma and
Vairavamoorthy’s (2009) remaining demand management strategies.
147
5.4 Social Strategies
The final types of strategies for demand management can be classified as behavioral or
social. The first social-oriented strategy Sharma and Vairavamoorthy suggest is the “promotion
of water-saving devices and consumer education and awareness building on water conservation
at all levels” (2009). With respect to water-saving devices (which are also technical), so long as
Chao’s water service is only provided for a few hours a day, the water saved from such devices
would be small (i.e. households would still have to turn to water storage, use of buckets for
flushing toilets and bathing, etc. when water is not arriving). That said, given the majority of
Chao and Nuevo Chao households are gradually purchasing, for the first time, fixtures such as
toilets and showers, ideally they would be the most water-efficient models available.
Low-flow showers would be of particular importance given that respondents in both
Chao and Nuevo Chao reported to bathe two or more times per day during the summer months
(means of 2.55 times per day Chao, 2.54 Well users, 2.42 Nuevo Chao). For toilets, the ideal for
water scarce regions is waterless, composting, toilets47. Unfortunately, a prefabricated version
of this technology is a long way from reaching Peruvian markets and, while constructing such
toilets from scratch is a possibility, it is an expensive endeavor (up to S/.100048 compared to S/.
49 to 198 for a ~10-L flush-toilet49). All in all, assuming water-saving technology tends to be
more expensive than traditional fixtures, if higher efficiency models were made available to
residents, subsidies or interest free loans would need to be offered. In issuing subsidies and/or
loans, Sharma and Vairavamoorthy (2009) highlight the need to educate the public on why, and
47 Although, with composting toilets, thought would need to be made with respect to how an
absence of feces, and reduced water volume, would affect the oxidation ponds’ effectiveness at treating other wastewater.
48 According to the material list from designs implemented in rural communities of Peru during
the author’s two year service. 49According to SODIMAC’s website, http://www.sodimac.com.pe/buscar/productos/ filtro/inodoro,
a leading home supply retailer located in major cities throughout Peru.

148
how, the additional upfront cost would save them (and the environment) in the next five to ten
years. As many households live paycheck to paycheck 50 , such information could be
accompanied with additional resources on long-term financial planning and savings.
That being said, misunderstanding/misuse of high-efficiency infrastructure has been
coined the ‘rebound effect;’ when people with low-flow technology increase overall use because
they think their efficient fixtures will make it okay (Olmstead & Stavins, 2009). Households that
acquire showers and toilets may abuse the convenience of running water if they cannot
conceptualize its volume. To this point, when households were asked to estimate the number of
liters that flowed from their faucets per minute, the majority reported to have no idea (60.3%
Chao, 71.0% Nuevo Chao) and, consequently, did not tend to consider and/or include direct
use of water at the time of arrival into their daily water use estimates. On the other hand, given
the rest of households’ water use was fairly calculated from various sized storage devices,
residents may be more inclined to learn the volume of water each toilet flush or minute in the
shower uses. Moreover, if meters are eventually introduced, the monetary value of each minute
of running water should be made clear to residents.
Time and patience are two critical pieces to development of an effective education and
awareness building campaign, which is the other piece of Sharma and Vairavamoorthy’s (2009)
aforementioned recommendation. In a report titled The Challenges of Water Resources
Management in Peru, Alegria (2006) urges that water resource management goals will only be
achieved by “shifting to a new paradigm for sustainable water resources development, which
will be pursued through education and awareness.” For Peru, this new water culture would
include 1) ‘a common vision for national identity,’ 2) shared values and attitudes and 3) ‘agreed
core goals’ of equity, efficiency and environmental conservation (Alegria, 2006).
50 A large majority of residents work for the large agricultural export companies which pay employees twice a month. Accordingly, on these days long, two-to three-hour lines would form as residents patiently waited to get money from one of Chao’s two ATMs.

149
In developing a public education campaign it is important to keep in mind that the
households are not students but stakeholders. In fact, although the term education has
traditionally been used to describe socially-orientated water management strategies, the
collaborative nature of the process is better captured by terms such as ‘dialogue’ and
‘communication’ (Jeffrey & Gearey, 2006). To this point, Alegria (2006) highlights the
importance of open discussion and public debates.
The effectiveness of dialogue to encourage behavioral change is based on the
continually researched assumption that “beliefs determine values, values determine attitudes,
and attitudes determine behavior” (Jeffrey & Gearey, 2006). With respect to value, in a report
titled “Communicating the Value of Water,” Means et al. (2008) state “before a utility can
communicate value it has to be seen in the eyes of the public as socially responsible, fiscally
prudent and environmentally sensitive.” Unfortunately, many Chao and Nuevo Chao households
currently distrust their providers (48.2% Chao, 33.0% Nuevo Chao) and, on a scale of one to
ten (where ten is excellent), households do not seem to be impressed with the service they are
receiving (means of 6.37 Chao, 6.81 Nuevo Chao). Fortunately, given the amount of time and
money the Municipality recently spent to improve the quality and (potential) quantity of water
available to households, they have a unique opportunity to rebrand themselves.
Accordingly, prior to an ‘awareness building campaign,’ the Municipality should build
trust within Chao and Nuevo Chao by demonstrating its “knowledge and expertise, honesty and
openness, and concern and care” (Means et al. 2009). This means opening the lines for sincere
communication and not just responding to the water-related concerns of households in a
reactive manner. This study has revealed specific attitudes and concerns of households
regarding their water service, which the Municipality can use in order to present meaningful
information regarding the new water and wastewater treatment plants. A starting point for

150
public dialogue could be addressing knowledge gaps such as: who is the service provider
(misidentified by 11.1% of Chao households, 17.4% of Nuevo Chao), where water is coming
from (misidentified by 40.5% of Chao households, 29.5% of Nuevo Chao), and how the water
(and wastewater) is being treated51. Specifically, while a moderate majority of households know
that potable water is of a higher quality (69.2% Chao, 52.0% Well users, 60.2% Nuevo Chao –
Table 4.15), the majority also reported they don’t know what the service providers do to make
their water potable (56.1% Chao, 54.6% Nuevo Chao –Table 4.16). This information could be
assembled into fact sheets that have data on basic operations, income and expenses, and the
results of water quality tests (McKenzie & Ray, 2009).
With regard to the water quality, given the new source of water is the contaminated
CHAVIMOCHIC canal, the Municipality of Chao could use the four-step treatment process to
demonstrate its openness, concern and care. It has been shown that customer satisfaction can
be increased specifically through education about water quality (Means et al., 2009). The
results of this study suggest that how households assess the quality of their water is
complicated, integrating both taste and odor with physical and biological safety (Figure 4.12).
There should be attention brought to why chlorine is important as households perceived
it as a reason why water was not safe to drink (Chao 25.4%, Nuevo Chao 4.2% - Table 4.12
and Chao 17.9% and Nuevo Chao 7.1% - Table 4.13). Similarly, research in the United States
has shown that “consumers generally have a negative opinion of chlorine tastes and odors in
drinking water, causing lower satisfaction with tap water flavor, healthiness and safety” (Means
et al., 2009). Recall that Nuevo Chao households were not as dissatisfied with the taste of their
former water as Chao households. If the new water service is to provide chlorinated river water,
51 When respondents were asked how to build their trust of their service providers, roughly 27.5% of households in Chao and 11.5% of households in Nuevo Chao specifically voiced their desire for information regarding the origin, treatment and quality of their water. Others mentioned they would like to know about the service providers’ financial information, for the provider to hold workshops, and for the provider to be more friendly and respectful.

151
as opposed to fresh spring water, it is particularly important to convince Nuevo Chao
households of the water’s improved quality. If not explicitly educated, the taste of the new
water may otherwise suggest poor quality to these users. Ultimately, residents “should come
away thinking that the utility is the source of water quality, not where the water came from”
(Means et al., 2009). Overall, engaging residents in dialogue about the quality52 and quantity of
water they are receiving will help to build trust as well as greater appreciation for the water
service provider.
Trust can also be built by continuing to give the public advanced notice of when there
will be service cuts. Even one to two unadvised interruptions and the public may continue the
habit of storing water beyond what they need just in case (recall 23.0% of Chao households,
23.5% Well users, 26.3% Nuevo Chao would like to purchase more storage devices for
increased security – Figure 4.7).
When it comes time to engage the public regarding water conservation, recall that in
contrast to developed countries where the majority of residents have had a lifetime of
continuous water supply, households in developing areas, especially those serviced by an
intermittent supply, inherently develop water-conserving behaviors. Interestingly however, this
study has shown that many conserving behaviors seem to be motivated by coping, not by a
conscientious concern for the environment (Section 4.4.2). This is not surprising given the
majority of households have never received formal information/education on the concept of
water conservation (68.2% Chao, 75.7% Well users, 61.6% Nuevo Chao – Table 4.21). Thus,
beyond instilling trust in the service provider and value for water received, the Municipality
should aim to create mindfulness around households’ existing conserving behaviors.
52 In particular it appears households need to be educated on the practice of chlorination as
residents see it as both a reason for why water quality is good and bad. Overall, the new water may not taste ‘spring fresh’ so it will be critical that SADISCHAO educate households to see the value of water that is biologically and physically safer for them to drink.
152
The Municipality should simultaneously identify and discourage wasteful behaviors.
Before bad habits further develop the Municipality should leverage households’ relatively short
experience with running water. Perhaps a water conserving culture may be easier to form in
small, growing, cities like Chao and Nuevo Chao where domestic water services are still a new
concept (i.e. less likely to be taken for granted). Also, households’ memories of life before a
domestic water connection might be a valuable tool when it comes to managing demand.
Individuals who have experienced water scarcity (53.9% Chao, 45.3% Well users, 61.0%
Nuevo Chao – Figure 4.3 & Table 4.4) and are familiar with the difficulty of transporting water
might have greater appreciation for service providers’ efforts. Households’ mutual experiences,
past or present, with water scarcity could also act as common denominator in the development
of a more water conscious culture. With that in mind, a good place for the Municipality to begin
would be raising awareness of regional freshwater scarcity extending to the changing glacial
source with the goal of making households aware of “the urgency to conserve water now to
avert a crisis situation in the future” (Vairavamoorthy & Mansoor, 2007).
Ultimately, the goal of a water conservation campaign in Chao would be to prevent
increased access to water (be it via more storage devices or improved continuity) from
translating to thoughtless increased water use. Whether Chao will be able to achieve such an
end will largely depend on how successful it is in communicating its messages. The new water
and sanitation service is bringing together three user groups with unique perceptions and
practices. Interestingly, in a study demand management effectiveness in Windhoek, Namibia it
was found that households were less willing to respond to demand management the more
money and access to water they had (Magnusson, 2004). Thus, it would be wise for the
Municipality to consider Chao households, Well users and Nuevo Chao households separately
when formulating its information campaign. For example, Chao households are more concerned
153
with water’s physical (34.1%/47.9%) and biological (27.7%/27.9%) safety, and Nuevo Chao
households are more concerned with the taste and odor of their water (59.1%) (Figure 4.12).
And, while the majority of Chao households would most like to see the quality of their water
improve (67.5%), Nuevo Chao households are most preoccupied with the water’s schedule
(31.6%) and maintenance (22.8%) (Table 4.18). With that said, the best messages for each
user group will be those that are simple, short, focused, frequent and repetitive (Means et al.
2009). Messages should be developed with respect to citizens’ core expectations and delivered
regularly through multiple media channels.
Chao has a variety of media options. There are two local radio stations which have
regular audiences53 and already collaborate with the Municipality in terms of announcing when
there will be cuts to the water service. Also, although Chao does not have its own television
station, in line with the national Cultura del Agua en el Perú (Water Culture in Peru) initiative
that was begun 200754, the Municipality of Chao could collaborate with the national government
and accordingly advise residents of scheduled public information concerning water
conservation55. As for the internet and social media, while these modern media sources still
seem beyond the majority of Chao and Nuevo Chao’s older population,56 the internet cafes
spread throughout the neighborhoods are filled by many of the youth (≤ 16 years old) all hours
of they day. Accordingly, the Municipality could develop a FacebookTM page where it reaches
53 People listen to the radio all hours of the day. At home, at work, and even while biking,
walking, or laboring in the fields (small battery powered radios are prevalent). 54 A joint effort between The Water and Sanitation World Bank program in conjunction with the
Ministry of Housing, Construction and Sanitation of Peru. 55 Recall from Table 4.21 that 28.4% of Chao households, 22.2% of Well users, and 12.3% of
Nuevo Chao reported to have already learned about water conservation through watching television. 56 Only 9.1% of the population owns a computer and, according to first round of surveys, only
4.3% (of those interviewed) belonged to either Facebook or Hi5 (a less popular Latin American social network).

154
out to youth and regularly posts information regarding community events, concerts, and
environmental, water-related, facts. Another opportunity for the Municipality to communicate
with customers is on the small paper bills that SADISCHAO distributes monthly. In fact, given
the information the bill communicates is constant, adding in short and simple water
conservation facts would improve the efficiency of the ink and paper dedicated to monthly tariff
collection. Interestingly, a study of consumer outreach in the U.S. found that water bills and
water bill inserts were by far households preferred method to receive water-related information
(Tatham et al., 2004). A more ambitious effort could invest in the development and distribution
of visual prompts and written pledges to reduce water which have been shown to be successful
in developed countries (Pleasance, 2004; Graymore et al., 2010; Kayaga & Smout, 2009). Such
items could be exchanged and explained when users come to the Municipality to pay their
water bills. Overall however, given the Municipality’s constrained resources and the difficulty of
hiring personnel to run such an involved campaign, perhaps the most useful form of ‘media’ the
Municipality has available is through collaboration with the health post, the areas’ eight
schools 57 , and the regular meetings of clubes de madres (mothers clubs). Finally, the
Municipality could use the common media of chisme (i.e. gossip). Unfortunately, right now
existing water-related gossip focuses on the services inequities and likely builds distrust and
animosity towards the water provider.
As far as gossip goes, in a paper titled Environment, Scarcity and Conflict: A Study of
Malthusian Concerns, Turton (1999) concluded that knowledge of the social dynamics
surrounding scarce resources is a key piece when it comes to their management in developing
countries, and a piece that is not yet fully understood. In a literature review titled “Consumer
Reaction to Water Policy Instruments,” Jeffrey and Gearey (2006) conclude that:
57 This study identified schools and health posts as places where residents were already learning about water conservation (Table 4.21).

155
“people adapt and change at a faster rate than policies, technologies and infrastructures. The challenge is to understand this potential as it impacts on water supply, and exploit it as a beneficial tool for adaptive response.” (pg. 326).
To this point, it has been shown that within small cities where social cohesion is strong,
non-tariff-based strategies could successfully impact water use (Tsegaye & Vairavamoorthy,
2009). Recall that during periods of water scarcity (i.e. interruptions to service), the majority of
Chao households (~90%) and Nuevo Chao households (~80%) turn to one another for help
(Figure 4.4). Furthermore, when households were asked if they got along with their neighbors,
only three households in Chao (1.5%) and one household in Nuevo Chao (0.5%) said they did
not. This cordial cooperation has an intrinsic value that is often referred to as social capital. In
a report that specifically addresses the unique advantages (as well as constraints) for demand
management in small city contexts, Deverill (2001) writes, “opportunities exist to develop
demand responsive services by making better use of social capital.”
Unfortunately, despite its small size and high level of direct neighbor-to-neighbor
cooperation, the strength of social capital in Chao and Nuevo Chao is questionable. That is,
when respondents were asked to rank the level of trust they had in their community on a scale
of one to ten, the majority of households in all three user groups rated their community
cohesion in the 3 to 6 range (53.8% Chao, 62.9% Well users, and 52.5% Nuevo Chao).
Correspondingly, when respondents’ were asked how well they felt supported by their
community the majority reported ‘alright’ or ‘bad’ (71.4% Chao, 66.1% Well users, 59.2%
Nuevo Chao). This is not surprising given the area has grown as a migrant community and the
continual and rapid influx of new people has come with high levels of gang activity and gun
violence.
Nonetheless, in comparison to large cities and sprawling suburbs, daily, positive,
collaboration between Chao and Nuevo Chao residents appears to be strong at the block level.
156
Thus, whether it is related to existing deficits of basic public infrastructure58, or because only
3.5% of households own any form of transportation (motorcycle and motor-taxis included) and
people are often out crossing paths on foot or in bus, the Municipality should not ignore or
underestimate the power of boca a boca (word of mouth) when developing an information
campaign.
That being said, in line with education and awareness building, further reduction in the
demand for water can come through “the promotion of water recycling and rainwater
harvesting” (Sharma and Vairavamoorthy, 2009). The idea that clean, potable, water should be
provided to households for all their needs developed when supplies seemed endless and
perhaps public health was less well understood. Such a one-size fits all solution is no longer
reasonable. While water for consumption, and to a lesser degree hygiene, should continue to be
held up to the highest standards of quality, there is no argument that water for flushing toilets
and outside watering (vegetation or streets) needs to be potable. Recognizing nearly a century
of oversight, water providers and consumers in developed countries are beginning to rethink
the use and possible treatment of rainwater and greywater in and outside the home. Due to a
lack of precipitation, rainwater harvesting is irrelevant in Chao but, as discussed in Section
4.4.2, water reuse is already a part of the area’s water culture.
With the idea that different sources can be matched with different water uses, recall
that a continuous water service is at least ten-years in the future for Chao59. In the absence of
running water, households reuse washwater to flush their toilets some or all of the time (74.0%
58 This is particularly true in Nuevo Chao where 91.5% of households surveyed that reported
regular meetings with their neighborhoods in order to move political promises into action (for sewage, roads, electricity, and a vegetated Plaza de Armas). In contrast, in Chao where basic public infrastructure is more prevalent, only 15.5% (16.3% Well user) reported the existence of regular meetings. Furthermore, in Nuevo Chao reported attendance of community meetings was nearly 100% (91.1%) as opposed to a small 28.3% of households in Chao.
59 According to regular conversation with SADISCHAO and the town councilmen.

157
Chao, 72.2% Well users, 61.6% Nuevo Chao – Table 4.20). So long as residents continue to
use the majority of their water from storage devices and buckets, rather than dumping utilized
water down the drain (as is common in Chao and soon to be an option for Nuevo Chao),
residents could be encouraged to begin (or continue) to use water from washing food, plates,
bathing, and laundry to flush toilets and water plants. Water reuse promotion should be
coupled with information on human health so that households safely practice water reuse.
The particular opportunity is to reuse water from food preparation to promote
landscaping and reduce barren street surface areas. Given Chao’s arid climate, its imperative to
educate households on how to achieve the same end goal with different tools. Vegetation in the
form of groundcover and street trees could save water while simultaneously improving air
quality, lowering the heat index, and providing habitat for native birds and other local fauna.
Residents could receive horticultural information on endemic species, their benefits, and
perhaps even seeds or seedlings. To supplement information, demonstration projects could be
done at the Municipality and along the Pan American highway. These projects could be coupled
with Chao’s recently developed waste management, environmental, initiative and branded; for
example ‘Chao limpia, nuestro orgullo, nuestro responsabilidad’ (‘clean Chao, our pride, our
responsibility’). In the end, in the absence of enforced penalties or education, street watering is
a practice not likely to disappear. The barriers to using vegetation and plants as alternative
groundcover need to be removed and the benefits emphasized.
Information campaigns are mostly seen as a second order demand management
instrument because it is more difficult to measure their impacts (Magnusson 2004).
Nonetheless, because all of the aforementioned demand management strategies directly or
indirectly impact the public, education and awareness building are crucial to the success of any
demand management program (Vairavamoorthy & Mansoor, 2006). Thus, it is recommended

158
that the Municipality of Chao develop Specific, Measurable, Achievable, Realistic, Time Bound
(SMART) indicators to measure the success of any social-orientated demand management
activities they develop (Deverill, 2001). In fact, indicators should be developed for all demand
management strategies. For example, the Municipality of Chao is already accounting for the
tariffs collected per month and the frequency of leaks and pipe bursts. This data could be used
to report monthly indicators such as: percentage of payments received (on time), percentage of
population served, number of leaks/bursts per km of pipes per month, number of complaints
per number of connections (with particular attention to reduced complaints of pressure,
implying improved equity), and the ratio of monthly operating costs to revenue (Gumbo, 2004).
5.5 Overview
The last suggestions Sharma and Vairavamoorthy make are not so much activities as
they are overarching suggestions for demand management in developing countries; namely
“step-wise approaches to reduce water demand (short- and long-term performance
improvement plans)” and “greater appreciation of stepwise/phased strategies…that recognize
there is no ‘quick fix’ and that benefits may be slow but long term” (2009).
Recognition that there are no quick fixes is perhaps the key point to managing demand
under intermittent systems. Intermittent systems can 1) waste more water than they save; 2)
lead to higher costs for both providers (increases in pipe bursts, excess pumping, etc.) and
consumers (household water treatment, purchase of storage units, alternative water sources);
3) decrease water quality; 4) result in variable pressures and inequitable distribution; and 5)
lead to low consumer expectation. However, despite these limitations, intermittent systems are
commonly adopted across developing countries and switching over to continuous service is not
simple. Fortunately, this study has shown that even under meterless, intermittent, service
conditions, there are opportunities for demand management. In fact, demand management

159
must play a role if small cities struggling with scarce freshwater resources want to be ready and
able to eventually transition to continuous service operations.
With that in mind, current water use in Chao and Nuevo Chao is in the range of 35 to 90
lpcd (Table 4.26). The new service was designed to provide 150 lpcd for both populations,
growing at 5.94%, until the year 2027. At some point in the course of the system’s lifetime, the
Municipality of Chao plans to combine water from both the new water treatment plant and the
old 60-m tube well60. Given that 1) Chao households are upset with the quality of the latter and
2) both Chao and Nuevo Chao households value quality over availability, this is unadvisable.
Instead, the Municipality of Chao should incorporate demand management strategies into its
approach to water management. Through the practice of demand management the Municipality
can extend the lifetime of the new service, improve water quality, as well as gradually resolve
existing inequities while bolstering public support and value for the service.
Ideally, a demand management program in Chao would be developed within a strong,
transparent, institutional platform and incorporate the technical, financial and social measures
previously discussed into a collaborative, enforceable plan. SADISCHAO is not a private, but
government-run, water provider. This has both advantages and disadvantages. On the plus
side, SADISCHAO has access to financial and human resources outside its own entity. However,
while collaboration with economists, social scientists, biologists, and politicians (i.e. not solely
engineers) should be accessed for the development of a demand management campaign, there
need to be transparent plans, priorities, and goals laid out for SADISCHAO that are not subject
to variables arising from other Municipal offices. The operation and maintenance of the new
water and wastewater treatment plants should be financially independent of the Municipality’s
60 Recall from Chapter Three that on days when the turbidity of water from the CHAVIMOCHIC
canal is high, the water treatment plant cannot run efficiently. This occurred ten times in the month of January (2013) and accordingly the Municipality has already begun to provide households an amalgamation of treated canal water and untreated, poor quality, groundwater.

160
overarching budget. Overall, in the development of a demand management campaign there
needs to be a strong framework in place. This means that all Municipal offices are clear of their
roles and responsibilities. It does not mean though that every office works in complete
independence of the others. There must be regular communication to make sure efforts are
mutually reinforcing and not repetitive or contradictory.
To begin, Chao appears to be a good candidate for a public education and awareness
campaign. This is particularly true given 1) the public’s low regard for their (pre)existing
services 2) SADISCHAO’s budgetary constraints and the expense of developing, operating and
maintaining the new water and wastewater treatment plants 3) the lack of meters and
technology and 4) the small city environment where households regularly interact with one
another and share former experiences with scarcity. 61 . After garnering public trust and
awareness, the economical and technical strategies of demand management, such as raising
tariffs and introducing meters, will have greater success.
All of the strategies discussed in sections 5.2 through 5.4 are summarized in Table 4.43
as they pertain specifically to Chao (and small city services in similar situations). The
Municipality should critically assess all options in light of their institutional capacity and available
resources. Demand management cannot be treated as an afterthought but must be budgeted
for like other Municipal expenditures (Gumbo, 2004). Consequently, a long-term cost benefit
analysis is suggested. In outlining a strategic approach the Municipality should keep in mind
that all demand management tools are mutually reinforcing and can be implemented in phases.
61Education and awareness building will also be crucial if the Municipality decides to go forward with their plan to implement meters in Nuevo Chao II. It is highly advised that the Municipality consider that the public’s opinion on metering is divided (Table 4.25). Households will need to be educated on the benefits of meters, their maintenance, and, in doing so, resolve any uncertainties regarding their use. If not, it is likely that history would repeat itself as Chao’s former metered era (1996 to 2009) ended in meters being damaged, destroyed, and stolen.

161
Table 4.43: Twelve demand management strategies suggested for the Municipality of Chao.
TECHNICAL
i Use GPS technology, or physical map, to identify problem areas by documenting the location of pipe burst frequencies, customer complaints of low and high pressure, water use rate (per number of connections), etc.
ii Continue effort of enforcing timely payments and cutting off water and sanitation service from noncompliant households.
iii Begin introduction of district meters with Nuevo Chao II. Incrementally increase metered areas beginning with the West and East sides of the Pan American highway in Chao and then move on to Nuevo Chao.
iv Couple transitions to metered service with continuous service to ensure optimal performance of meters and public acceptance.
FINANCIAL
v Apply CAFES principles in designing the new water and sanitation tariff with consideration of the increasing block format for metered areas.
vi Offer subsidies for water-conserving showers and toilets and increase the availability of such infrastructure in the many hardware stores throughout Chao.
vii Establish and enforce fines on street watering wherein prominent violators such as the Junta de Usuarios and police station must comply and set an example for the public.
SOCIAL
viii Rebrand the image of SADISCHAO by promoting the new water and sanitation service. In particular, educate the public on the services four-step treatment process and, correspondingly, the water's improved quality.
ix
Collaborate with public and private institutions and organizations to develop an awareness building water conservation campaign. Communicated messages should be simple, short, focused, frequent, and repetitive. They should be tailored to each unique user group (i.e. Chao households, Well users and Nuevo Chao households). Emphasis should be placed on existing conservation behaviors such as water reuse and messages should be communicated across multiple forms of media including the monthly water bill.
x Hold workshops and trainings on the use of native vegetation as a sustainable alternative to street watering, installing demonstration projects along the Pan American highway and other community focal points.
xi Continually create opportunities for public engagement whereby households’ perceptions and water use practices can be periodically reevaluated.
GENERAL
xii Develop a timeline and SMART indicators and monitoring plan for each demand management strategy chosen.
Note: Strategies are not presented in any particular order of importance. Rather, they are presented in groups according to whether they are primarily technical, financial, social or (general) in nature.

162
CHAPTER 6: CONCLUSION
The urban area of the district of Chao is characterized by three distinct water user
groups: 1) those in Chao who receive water daily for one to three hours; 2) those in Chao who
rely on un-improved wells; and 3) those in Nuevo Chao who receive water every other day for
thirty minutes to an hour. Over the course of 2010 to 2012 the Municipality of Chao invested
~$9 million into the construction of new water and wastewater treatment plants with the goal
to bring all three user groups under one continuous, metered, water and sanitation service. The
service was designed to serve 97% of the population twenty years into the future with an
assumed demand of 150 liters per capita per day and 25% of produced water being lost (non-
revenue water).
Demand management was not mentioned in the project plans, which is not uncommon
in developing countries where political preference is for high visibility and supply-oriented
projects (Sharma & Vairvamoorthy, 2009). This is unfortunate as the literature has suggested
that in developing countries, particularly in water scarce areas such as Chao, incorporating
demand management strategies is key to ensuring that 1) the entire population receives a
reliable, equitable, adequate, supply of quality water and 2) that this supply remains as such
into the future. Accordingly, this study surveyed households’ behaviors and beliefs surrounding
the existing water situations (intermittent, un-metered, services), and investigated how demand
management could be applied to small, developing, cities such as Chao.
The first objective was to understand how households, with varying degrees of
intermittent service, used, perceived, and valued water and their water services, in order to
inform knowledge of existing and potential domestic water use and demand. The second

163
objective was to use this information to demonstrate the importance of demand management
and propose strategies applicable to conditions in Chao. Also, it is probable that these findings
and recommendations are applicable to other small cities in water-scarce regions with
intermittent, un-metered, water services.
In order to address these objectives data was collected via: an extensive literature
review, semi-structured interviews, field visits/site inspections, informal focus groups, key
informant interviews, and household surveys. Household surveys were conducted with the help
of local, trained, enumerators over two twelve-day periods in the months of January and
September 2012. A total of 1,149 households were interviewed about their water behaviors and
underlying factors that shape them.
Survey results showed the distribution of water was inequitable and that, on average,
households received water for less time than had been presumed by the service providers.
However, despite the short duration of supply (not including Well users), the majority of
households in each user group reported to have enough water for their needs. Estimated per
capita water use ranged between 35 to 90 lpcd (seasonal average of 75 lpcd in Chao compared
to 61 lpcd for Well users and 47 lpcd in Nuevo Chao). On average, in comparison to Nuevo
Chao, households in Chao have four times the access to potable water, report to store ~200
liters more per day, and use ~60% more water per capita per day. This suggests that when
intermittent service is available for a sufficient time (and pressure), storage devices allow
households to store and use water beyond their basic needs. The fact that Well users utilize a
similar volume of water as Nuevo Chao households despite their continual supply suggests that
convenience is also a factor of water use.
Reported water conservation efforts were high (73% Chao, 63% Well Users, 71% Nuevo
Chao). It is interesting that despite greater access to water in Chao, reported conservation
164
efforts in Chao and Nuevo Chao were relatively the same. It is possible that reported
conservation efforts were the lowest for Well users as they knew their water supply, although
not convenient, was essentially unlimited. In fact, seasonal differences in the data (summer to
winter differences of 19% Chao, 6.0% Well users, 17% Nuevo Chao) suggest that for Chao and
Nuevo Chao households water conservation is in part motivated by availability rather than for
the greater good and/or the environment. Overall, reported water conservation efforts must be
taken with reservation as the data shows that there was a lack of understanding concerning the
term water conservation. A lack of understanding is grounded by the finding that the majority
of households have never learned or heard about water conservation (68.2% Chao, 75.7% Well
users, 61.6% Nuevo Chao).
The practice of street watering with potable water (46.2% Chao, 58.1% Well users,
35.2% Nuevo Chao) suggests a disregard for water resources. Roughly only a quarter of the
population recognizes the region’s water scarcity (24.6% Chao, 22.0% Well users, 28.9%
Nuevo Chao), citing the number of wells in the area or the size of the services distribution tubes
as evidence there is plenty of water. It appears households believe periods of temporary
perceived scarcity (such as during the summer or service interruptions) are the result of inept
service providers, not indicative of the region’s scarce freshwater resources.
Household water treatment was prevalent among all user groups. Although 63.5% of
Nuevo Chao households and 76.1% of Well users trusted the quality of their drinking water
(compared to 28.7% in Chao), a large majority in each user group reported household water
treatment (79.6% Chao, 72.0% Nuevo Chao, 81.4% Well users). This is likely a reflection of
several things. First, the majority (73.9% Chao, 69.6% Well users, 66.7% Nuevo Chao) of
households reported water quality as the most important aspect of a water service (as
compared to schedule, continuity, maintenance, etc.). Second, data showed that water quality
165
is judged by taste and odor as well as in terms of physical and biological safety. So, although
the taste of the water in Nuevo Chao and for Well users may have been preferable to Chao’s,
water treatment was common all around. Perhaps because the majority of Chao and Nuevo
Chao households did not know what their providers were doing to make their water potable
(56.1% Chao, 56.4% Nuevo Chao), they still provided additional treatment before drinking.
Despite the unmet need of quality water in Chao, and availability of service in Nuevo
Chao, households have low willingness to pay for service improvements, both in the form of
availability and quality. As the majority of households rated water as the most important public
service project (of eight choices) (37.5% Chao, 68.0% Well users, 51.5% Nuevo Chao),
unwillingness to pay may stem from low trust in the service providers with respect to
(pre)existing services and a belief that a water service should be a certain price.
Unfortunately, the transition to the new service has been haphazard. What could have
been an opportunity to highlight the Municipality’s dedication to improving the quality and
equity of the water and sanitation service has instead been characterized by service
interruptions and inconsistent water quality. As it stands, the new water and sanitation service
is not continuous, nor metered, and is costing four times its monthly revenue to operate.
Although demand management strategies may seem difficult to implement under such
circumstances, they are all the more pertinent.
Many of the existing demand management studies in developing countries were
conducted in large cities. This study suggests that demand management is applicable to smaller
urban areas as well. Whereas in large sprawling water networks focus may be placed on
leakage management, in smaller cities where networks are still relatively small and new and
where providers are limited both technically and financially, the nonstructural aspects of
demand management are a good place to begin.
166
Specifically, Chao is a good candidate for a public education and awareness campaign.
This is particularly true given 1) the public’s low regard for their (pre)existing services 2)
SADISCHAO’s budgetary constraints and the expense in developing, operating and maintaining
the new water and wastewater treatment plants 3) the lack of meters and technology and 4)
the small city environment where households regularly interact with one another and have
experience with water scarcity. After garnering public trust and awareness, the economical and
technical strategies of demand management, such as raising tariffs and introducing meters, will
have greater success.
As the result of this study, the Municipality of Chao now has information about unique
user groups and their respective behaviors and opinions regarding water. This information can
be used to develop targeted communication campaigns. The Municipality must make customers
aware of their recent investment in the new and improved water and sanitation in order to
shore up community trust. Public support and their willingness to pay are critical to the financial
sustainability of the new system. Given Chao’s small size, the opportunity to directly engage all
households is realistic. Partnerships with public and private institutions should also be formed.
The latter can help to shoulder the cost of such a campaign.
This study has shown that overall awareness of water scarcity and understanding of
water conservation is low. For long term success, the Municipality must make consumers aware
of the region’s physical water scarcity and build household support toward a water conversing
culture. The Municipality’s combination of the new system’s treated water with poor quality
groundwater is a significant problem. Based on consumer preferences for high quality over high
volume, this practice should be reconsidered. To begin, concentrating on achieving a reduction
of potable water used for watering the dusty streets is a better goal than trying to provide a
delivery of compromised water beyond per capita need.

167
As public support and awareness of the service provider / Municipality increases, other
demand management strategies should incrementally be incorporated. These include subsidies
for efficient water-related infrastructure, household metering, and creative tariff design. With
respect to high-efficiency infrastructure and households meters, the Municipality would see the
greatest benefit if these strategies were coupled with continuous service. Continuous service
should not imply greater household water use so long as education and awareness building
have been effective. Overall, by incorporating water demand management strategies, the
Municipality of Chao can ensure that the public understands the true value of water and their
provided service, that wasteful water behaviors and network leakages are kept at a minimum,
and that adequate revenues are raised for necessary operation and maintenance. In conclusion,
demand management strategies will not only address SADISCHAO’S social, financial, and
technical issues, but ensure the sustainability of Chao’s domestic water supply and the
subsequent health and prosperity of the public now and into the future.
168
REFERENCES CITED Akhmouch, A. (2012, April). Water Governance in Latin America and the Carribean: A Multi-
Level Approach. OECD Regional Development Working Papers . Akram, A. A., & Olmstead, S. M. (2011). The Value of HouseholdWater Service Quality in
Lahore, Pakistan. Environmental Resources Economics , 49, 173-198. Alegría, J. F. (2006). The Challenges of Water Resources Management in Peru. Sao Paulo,
Brazil. Andey, S. P., & Kelkar, P. S. (2009). Influence of Intermittent and Continuous Modes of Water
Supply on Domestic Water Consumption. Water Resources Management , 23, 2555-2566.
Andey, S., & Kelkar, P. (2007). Performance of Water Distribution Systems during Intermittent
versus Continuous Water Supply. American Water Works Association , 99 (8), 99-106. Andina. (2012, March 16). Water, green tech need US$5bln investments in next 10 years.
Retrieved February 5, 2013, from ANDINA Agencia Peruana de Noticias: http://www.andina.com.pe/english/noticia-water-green-tech-need-5bln-investments-in-next-10-years-404317.aspx
Arlosoroff, S. (1999). Water Demand Management. International Symposium on Efficient Water
Use in Urban Areas. Kobe, Japan: IECT-WHO. Babel, M., Das Gupta, A., & Pradhan, P. (2007). A multivariate econometric approach for
domestic water demand modeling: An application to Kathmandu, Nepal. Water Resources Management , 21, 573–589.
Baberán, R., & Arbués, F. (2009). Equity in Domestic Water Rates Design. Water Resources
Management , 23, 2101-2118. Barberán Ortí, R., & Salvador Figueras, M. J. (2010). Water Use in Zaragosa's Households.
Zaragosa: Environmental and Sustainability Agency of Zaragosa. Batish, R. (2003). A New Approach to the Design of Intermittent Water Supply Networks. World
Water and Environmental Resources Congress, (pp. 1-11). BBC News. (2013, January 23). BBC News Science & Environment. Retrieved January 24, 2013,
from BBC News: http://www.bbc.co.uk/news/science-environment-21163386

169
Boland, J., & Whittington, D. (2000). The Politicial Economy of Increasing Water Block Tariffs in Developing Countries. Oxford University Press .
Brooks, W. E., Kent, J. D., & Willett, J. C. (2004). Mineral, Energy, and Fertilizer Resources of
the North Coast of Perú: Perspective from the Santa Rita B Archaeological Site. Denver: U.S. Geological Survey (USGS).
Butler, D., & Memon, F. A. (2006). Water Demand Management. London: International Water
Association (IWA). Camarsa, G., Toland, J., Gardner, S., Jones, W., Eldridge, J., & Thévignot, C. (2010). Water for
life - LIFE for water: Protecting Europe’s water resources. The Financial Instrument for the Environment (LIFE). Luxembourg: European Union.
Chanduvi, F. (2006, February). Changing Deserts into Agricultural Lands. (C. Garcés-Restrepo,
G. Bonanno di Linguaglossa, & E. Mahabir, Eds.) Grid - IPTRID Network Magazine (24), pp. 6-8.
Chang, H., Parandvash, G., & Shandas, H. V. (2010). Spatial variations of single family
residential water use in Portland, Oregon. Urban Geography , 31 (7), 953-972. Christodoulou, S., & Agathokleous, A. (2012). A Study on the Effects of Intermittent Water
Supply on the Vulnerability of Urban Water Distribution Networks. Water Science & Technology: Water Supply , 12 (4), 523-530.
CIA. (2012, November 14). CIA Maps: Peru Administrative Map (2006). Retrieved March 6,
2013, from Central Intelligence Agency: The Work of a Nation, The Center of Intelligence: https://www.cia.gov/library/publications/cia-maps-publications/Peru.html
CIA. (2013, March 26). The World Factbook. Retrieved April 6, 2013, from Central Intelligence
Agency. The Work of a Nation. The Center of Intelligence.: https://www.cia.gov/library/ publications/the-world-factbook/geos/pe.html
Circle of Blue. (2010, October 29). Export Agriculture Drains Latin America’s Water Supplies .
Retrieved July 13, 2011, from Circle of Blue: http://www.circleofblue.org/waternews/ 2010/science-tech/climate/export-agriculture-drains-latin-americas-water-supplies/
C-SPAN. (2010, October 27). The Future of Freshwater. The Future of Freshwater . Washington
D.C., United States: C-SPAN. Darr, P., Feldman, S. L., & Kamen, C. S. (1975). Socioeconomic Factors Affecting Domestic
Water Demand in Israel. Water Resources Research , 11 (6), 805-809. Deverill, P. A. (2001). Sharing It Out: Introducing Water Demand Management Strategies for
Small Towns. Loughborough University, Water, Engineering and Development Centre. Leicestershire: LSHTM/WEDC.

170
District Municipality of Chao. (2010). Memoria Descriptiva del Proyecto. Chao: Municipalidad Distrital de Chao.
Domene, E., & Sauri, D. (2006). Urbanisation and water consumption: Influencing factors in the
metropolitan region of Barcelona. Urban Studies , 43 (9), 1605–1623. EPA. (2009). 2006 Community Water System Survey. Office of Water, Environmental Protection
Agency (EPA). EPA. (2012, September 14). Frequently Asked Questions: Water Infrastructure and
Sustainability. Retrieved March 19th, 2013, from United States Environmental Protection Agency: http://water.epa.gov/infrastructure/sustain/si_faqs.cfm
Fischetti, M. (2012, May 21). How Much Water Do Nations Consume? Retrieved February 22,
2013, from Scientific American: http://www.scientificamerican.com/article.cfm?id= graphic-science-how-much-water-nations-consume
Fishman, C. (2011). The Big Thirst. New York, NY: Free Press. Foster, S., Nanni, M., Kemper, K., Garduño, H., & Tuinhof, A. (2005). Utilization of Non-
Renewable Groundwater: A Socially Sustainable Approach to Research Management. The World Bank, GW-MATE Core Group. Washington DC: The World Bank.
Ganter, C., & Nadya, I. (2011, August 26). Stockholm World Water Week 2011; Megacities,
Human, Rights, Sanitation, Tech Tools, Energy and Food . Stockholm, Sweden: Circle of Blue.
Gleik, P. H. (1996). Basic Water Requirements for human activities: meeting basic needs. Water
International , 21, 83-92. Guerrero Salazar, P. (2009, February 17-20). Public-Private Partnership in Peru and Water
Rights. Washington D.C. Gumbo, B. (2004). The status of water demand management in selected cities of southern
Africa. Physics and Chemistry of the Earth , 29, 1225–1231. Hackley, R. (2012, October 31). Peru may invest about 5.2 billion in water, wastewater project.
Retrieved February 5, 2013, from PeruThisWeek.com: http://www.peruthisweek.com/ news-3057-peru-may-invest-about-52-billion-in-water-wastewater-projects/
Hadley Centre. (2013, January 10). Decadal Forecasting - What It Is and What Does It Tell Us?
Retrieved January 20, 2013, from Met Office Hadley Centre: http://www.metoffice.gov. uk/climate-change/resources/hadley
Holloway, D., & Troy, P. (2004). The use of residential water consumption as an urban planning
tool: a pilot study in Adelaide. Journal of Environmental Planning and Management , 47, 97-114.

171
ICWE. (1992). Dublin Statement on Water and Sustainable Development. Water , 19 (2), 181. INEI. (2011). Compendio Estadístico, 2010-2011. Instituto Nacional de Estadistica e
Informatica. Trujillo: Oficina Departamental de Estadística e Informatica (ODEI). Iskandarani, M. (2002). Economics of Household Water Security in Jordan (Vol. 25). (F.
Heidhues, & J. von Braun, Eds.) Frankfurt, Germany: Peter Lang, Development Economics and Policy.
Israel Ministry of Foreign Affairs - The State of Israel. (2002, August 10). Israel's Chronic Water
Problem. Retrieved 1 17, 2013, from Israel Ministry of Foreign Affairs: http://www.mfa. gov.il/MFA/Facts%20About%20Israel/Land/Israel-s%20Chronic%20Water%20Problem
Jeffrey, P., & Gearey, M. (2006). Consumer Reactions to Water Conservation Policy
Instruments. In D. Butler, & F. A. Memon, Water Demand Management (pp. 305-330). London, UK.
Joshi, M., Talkhande, A., Andey, S., & Kelkar, P. (2002). Urban Community Perception Towards
Intermittent Water Supply System. Indian Journal of Environmental Health , 44 (2), 118-123.
Kayaga, S., & Smout, I. (2009, October 5). Using tariff structures as demand management
instruments: Case Studies from Zaragoza & Kampala. Loughborough, United Kingdom: WEDC, Loughborough University, UK.
Khatri, K., & Vairavamoorthy, K. (2007, June 13). Challenges for Urban Water Supply and
Sanitation in the Developing Countries. Delft, The Netherlands: UNESCO-IHE. Klingel, P. (2012). Technical causes and impacts of intermittent water distribution. Water
Science and Technology , 12 (4), 504-512. Laureano, P., Ouessar, M., Moyano, E., Dudeen, B., Gad, A., Martinez, J., et al. (2008).
Conceptual Frame on Water Culture and Its Use to Raise Public Awareness on Sustainable Water Management in the Mediterranean Basin. Bari: Centre International de Hautes Etudes Agronomiques Méditerranéennes (CIHEAM).
LivingInPeru.com. (2011, February 17). Peru's water authority to begin $43 mil project to
improve water availability. Retrieved March 30, 2012, from Living in Peru: http://archive.peruthisweek.com/news-14151-peru-s-water-authority-to-begin-43-mil-project-to-improve-water-availability/
Lynch, B. (2010). Equity, vulnerability and water governance: responding to climate change in
the Peruvian Andes. ICARUS Workshop: Climate Vulnerability and Adaptation: Theory and Case. Beckman Institute, University of Illinois, Urbana Champaign.
MaCorr Research. (2013). Sample Size Calculator. Retrieved October 15, 2011, from MaCorr
Research Solutions Online: http://www.macorr.com/sample-size-calculator.htm

172
Madanat, S., & Humplick, F. (1993). A Model of Household Choice of Water Supply Systems in Developing Countries. Water Resources Research , 29 (5), 1353-1358.
Magnusson, T. S. (2004). Household responsiveness to water demand management incentives
in Windhoek, Namibia. Water Policy , 6, 453-471. McIntosh, A. C. (2003). Asian Water Supplies: Reaching the Urban Poor. London: Asian
Development Bank / IWA Publishing, Alliance House. McKenzie, D., & Ray, I. (2009). Urban Water Supply in India: Status, Reform Options and
Possible Lessons. Water Policy (11), 442-460. McKinney, D. C., Anderson, G., & Byers, A. (2011). Adaption to Climate Change: Case Study -
Glacial Retreat and Adaptation Options in Peru's Rio Santa Basin. University of Texas, Austin; International Resources Group (IRG); The Mountain Institute. Washington, D.C.: USAID.
Meade, B., Baldwin, K., & Calvin, L. (2010). Peru: An Emerging Exporter of Fruits and
Vegetables. United States Department of Agriculture (USDA), Economic Research Service.
Means, E., Chowdhury, Z., Westerhoff, G., Passantino, L., & Ruettan, J. (2008). Communicating
the Value of Water: An Introductory Guide for Water Utilities. Denver: AWWA Research Foundation.
Motoma, R. I. (2007). Modelling a Water Conserving Tariff for Kampala, Uganda . Thesis,
Loughborough University, Water, Engineering and Development Centre, Department of Civil and Building Engineering, Loughborough.
Mulwafu, W., Chipeta, C., Chavula, G., Ferguson, A., Nkhoma, B., & Chilima, G. (2003). Water
Demand Management in Malawi: Problems and Prospects for Its Promotion. Physics and Chemistry of the Earth , 28, 787-796.
Mwendera, E., Hazelton, D., Nkhuwa, D., Robinson, P., Tjijenda, K., & Chavula, G. (2003).
Overcoming Constraints to the Implementation of Water Demand Management in Southern Africa. Physics and Chemistry of the Earth , 28, 761-778.
OECD. (2012). OECD Work on Water. Organization for Economic Cooperation and Development
(OECD). Secretary-General of OECD. Olmstead, S. M. (2010). The Economics of Managing Scarce Resources. Review of
Environmental Economics and Policy , 4 (2), 179-198. Olmstead, S. M., & Stavins, R. N. (2009). Comparing price and nonprice approaches to urban
water conservation. Water Resources Research , 45. Pattanayak, S., Yang, J.-C., Whittington, D., & Kumar, K. B. (2005). Coping with Unreliable
Public Water Supplies: Averting Expenditures by Households in Kathmandu, Nepal.

173
Water Resources Research , 41. Philip, R. (2011). Reducing water demand and establishing a water saving culture in the City of
Zaragoza . Freiburg: ICLEI European Secretariat. Rahaman, M. M., & Olli, V. (2005). Integrated water resources management: evolution,
prospects and future challenges. Sustainability: Science, Practice, & Policy , 1 (1), 15-21. Raucher, R. S., & al., e. (2005). The Value of Water: Concepts, Estimates, and Applications for
Water Managers. Denver: Awwa Research Foundation. Reisner, M. (1993). Cadillac Desert. New York, NY: Penguin Books. Reuda, E., Campos, S., Bretas, F. B., Brester, A., & Pérez de Castillo, A. (2005). Desarrollo del
Marco Tarifario de los Servicios de Agua Potable y Saneamiento Básico del Perú. Banco Interamericano de Desarrollo.
Rogers, D (2005). Reducing Leakage in Jakarta, Indonesia. Leakage 2005 Conference
Proceedings. Colombella, Italy. Rosenberg, D. E., Talozi, S., & Lund, J. R. (2008). Intermittent Water Supplies: Challenges and
Opportunities for Residential Water Users in Jordan. Water International , 33 (4), 488-504.
Rosenberg, D. E., Tarawneh, T., Abdel-Khaleq, R., & Lund, J. R. (2007). Modeling Integrated
Water User Decisions in Intermittent Supply Systems. Water Resources Research , 43, W07425.
Rosenthal, G., & Katz, D. D. (2010). An Economic Analysis of Policy Options for Water
Conservation in Israel. Amman, Bethlehem, Tel Aviv: EcoPeace / Friends of the Earth Middle East.
Sansom, K., Franceys, R., Njiru, C., Kayaga, S., Coates, S., & Chary, S. (2002). Serving All
Urban Consumers - A Marketing Approach to Water Services in Low- and Middle- Income Countries (Vol. 2). Loughborough University, UK: Water, Engineering and Development Centre (WEDC) Publishing.
Sapiano, M., Micallef, P., Attard, G., & Zammit, M. (2008). The evolution of water culture in
Malta: An analysis of the changing perceptions towards water throughout the ages. Centre International de Hautes Etudes Agronomiques Méditerranéennes (CIHEAM).
Schafer, C., & Mihelcic, J. (2012). Impact of Storage Tank Material and Maintenance on
Household Water Quality". Journal American Water Works Association , 104 (9), E521-E529.
Seckler, D., Amarasinghe, U., Molden, D., de Silva, R., & Barker, R. (1998). World Water
Demand and Supply, 1990 to 2025: Scenarios and Issues. Colombo: International Water Management Institute (IWMI).

174
Shandas, V., & Parandvash, G. H. (2010). Integrating urban form and demographics in water-demand management: an empirical case study of Portland, Oregon. Environment and Planning , 37 (1), 112 - 128.
Sharma, S. K., & Vairavamoorthy, K. (2009). Urban Water Demand Management: Prospects and
Challenges for the Developing Countries. Water and Environment Journal , 23, 210-218. Sudman, S. (1976). Applied Sampling. Elsevier Science & Technology Books. Sullivan, C. (2002). Calculating a Water Poverty Index. Water Development , 30 (7), 1195-1210. Tatham, E., C. Tatham, J. Mobley, 2004, Customer Attitudes, Behavior, and the Impact of
Communications Efforts, AwwaRF. Denver CO.
Theiler, M. (2012, October 22). Water, lifeblood of the state, gets even costlier. Capitol Weekly. Thomas, F., & Syme, G. (1988). Estimating Residential price Elasticity of Demand for water; A
Contingent Valuation Approach. Water Resource Research , 24 (2), 1847-1857. Tokajian, S., & Hashwa, F. (2003). Water Quality Problems Associated with Intermittent Water
Supply. Water Science and Technology , 47 (3), 229-234. Totsuka, N., Trifunovic, N., & Vairavamoorthy, K. (2004). Intermittent Urban Water Supply
Under Water Starving Conditions. 30th WEDC International Conference, (pp. 505-512). Vientiane.
Trow, S., & Farley, M. (2006). Developing a Strategy for Managing Losses in Water Distribution
Networks. In D. Butler, & F. A. Memon, Water Demand Management (pp. 141-179). London, UK: IWA Publishing.
Turton, A. (1999). Water Scarcity and Social Adaptive Capacity: Towards an Understanding of
the Social Dynamics of Water Demand Management in Developing Countries. School of Oriental and African Studies (SOAS), London.
UNDP. (2006). Human Development Report 2006. New York: United Nations Development
Programme. UNEP. (2012). Measuring Water Use in a Green Economy, A Report of the Working Group on
Water Efficiency to the International Resource Panel. McGlade, J., Werner, B., Young, M., Matlock, M., Jefferies, D., Sonnemann, G., Aldaya, M., Pfister, S., Berger, M., Farell, C., Hyde, K., Wackernagel, M., Hoekstra, A., Mathews, R., Liu, J., Ercin, E., Weber, J.L., Alfieri, A., Martinez-Lagunes, R., Edens, B., Schulte, P., von Wirén-Lehr, S., Gee, D.
UNESCO - WWAP. (2012). Facts and Figures from the United Nations World Water Development
Report 4. UNESCO - WWAP. United Nations. (2010). The Millenium Development Goals Report 2010. New York.

175
United Nations. (2012). World Urbanization Prospects - 2011 Revision. Department of Economic and Social Affairs. New York: United Nations.
UN-Water. (2007). Coping With Water: Challenge of the Twenty-First Century. UN-Water. USGS. (2012, December 18). Water Science Photo Gallery. Retrieved January 25, 2013, from
USGS Water Science School: Ga.water.usgs.gov/edu/2010/gallery/global-water-volume.html accessed
Vásquez, W. F. (2009). Willingness to Pay for Safe Drinking Water: Evidence from Parral,
Mexico. Journal of Environmental Management , 90, 3391-3400. Vairavamoorthy, K., & Mansoor, M. (2006). Demand Management in Developing Countries. In
D. Butler, & F. A. Memon, Water Demand Management (pp. 180-211). Londong, UK: IWA Publishing.
Vairavamoorthy, K., Gorantiwar, S. D., & Mohan, S. (2007). Intermittent Water Supply under
Water Scarcity Situations. Water International , 32 (1), 121-132. Vairavamoorthy, K., Gorantiwar, S. D., & Pathirana, A. (2008). Managing Urban Water Supplies
in Developing Countries - Climate Change and Water Scaricty Scenarios. Physics and Chemistry of the Earth , 33, 330-339.
van der Steen, P., & Howe, C. (2009). Managing water in the city of the future; strategic
planning and science. Review of Environmental Science Biotechnology (8), 115-120. Vega Carreazo, R., Rodriguez, G. V., & Nesanovich, O. E. (2006). Planes Nacionales de Vivienda
y Saneamiento 2006-2011. Lima: Ministry of Housing, Construction and Sanitation. Vickers, A. (2001). Handbook of Water use and Conservation. . Denver: American Water Works
Association. WBCSD. (2005, August). Facts and Trends: Water. Geneva, Switzerland: World Business Council
for Sustainable Development (WBCSD). White, C. (2012, Mau 7). Understanding Water Scarcity: Definition and Measurements.
Australia: Global Water Forum. White, S., & Retamal, M. (2011). Integrated Supply-Demand Planning for Alexandria, Egypt:
water efficiency study & business case analysis for water demand management. Prepared for CEDARE by the Institute for Sustainable Futures, University of Technology, Sydney .
Whittington, D. (2002). Improving the Performance of Contingent Valuation Studies in
Developing Countries. Environmental and Resource Economics , 22, 323–367. Whittington, D. (2010). What Have We Learned from 20 Years of Stated Preference Research in
Less-Developed Countries? Annual Review of Resource Economics , 2, 209-236.

176
Whittington, D., & Nauges, C. (2010). Estimation of Water Demand in Developing Countries: An Overview. World Bank Res Obs , 25 (2), 263-294.
WWAP. (2012). World Water Assessment Programme. Retrieved January 15, 2013, from United
Nations Educational, Scientific, and Cultural Organization: http://www.unesco.org/new/en/natural-sciences/environment/water/wwap/
Yahoo Finance. (2013). United States dollar (USD) and Peruvian nuevo sol (PEN) Year 2012
Exchange Rate History - Yahoo Finance. Retrieved 3 16, 2013, from FreeCurrencyRates.com: http://www.freecurrencyrates.com/exchange-rate-history/USD-PEN/2012
Zarbarenko, D. (2011, October 25). Water Use Rising Faster than World Population. Zhong, L., & Mol, A. P. (2010). Water Price Reforms in China: Policy-Making and
Implementation. Water Resource Management , 24, 377-396.

177
APPENDICES

178
Appendix A IRB Letter of Approval

179
Appendix A (Continued)

180
Appendix B Municipality of Chao Letter of Participation

181
Appendix C Informal Consent for Household Surveys
C.1 English
Principal Investigator: “Greetings, my name is Merril Putnam and I am a university student working toward my masters degree in environmental engineering. I am interested in people’s understanding of water and usage practices in the district of Chao and to this end am conducting a small survey. Just so that you are aware, I am not affiliated with the District Municipality of Chao, but they are supporting my study by providing me with a team of eight individuals to help me conduct the surveys. However, to reiterate, I am not affiliated with the government or any government agency; my interest is purely academic. This short interview will take up about 25 minutes of your time. Then, in a couple months there will be a follow-up interview similar to the one you are about to take. Your personal information will not be asked and your answers will remain confidential. At the end of my study, I will be sharing my findings with the District Municipality of Chao and other interested institutions. Would you like to go ahead with this interview?” If the answer is “yes,” I would go ahead with the interview. “Thank you for taking time out of your day to participate. I will first ask you a few questions regarding your household, then, I will proceed to ask you a bit about your current water usage practices, your understanding of water, and the value it holds in your life.” Survey Team: “Greetings, my name is ________. I am supporting a survey by a student from the University of South Florida who is working towards her masters degree in environmental engineering. She is interested in people’s understanding of water and usage practices in the district of Chao and to this end she is conducting a small survey. The student has no affiliation with the District Municipality of Chao, but they are supporting her study by providing her with a team of eight people to help her conduct the surveys; I am one of these people. However, to reiterate, the student is not affiliated with the government or any government agency. This short interview will take up about 25 minutes of your time. Then, in a few months, a member of the interview team will return to conduct a follow-up interview similar to the one you are about to take. Your personal information will not be asked and your answers will remain completely confidential. At the end of my study, the student will be sharing her findings with the District Municipality of Chao and other interested institutions. Would you like to go ahead with this interview?” If the answer is “yes,” the enumerator would go ahead with the interview. “Thank you for taking time out of your day to participate. I will first ask you a few questions regarding your household, then, I will proceed to ask you a bit about your current water usage practices, your understanding of water, and the value it holds in your life.”
C.2 Spanish
Investigador Principal: “Buenas días, mi nombre es Merril Putnam. Soy estudiante, quiero obtener mi maestría en ingeniero ambiental. Estoy interesada en el conocimiento y uso del agua de la gente en el distrito de Chao y, por eso, estoy llevando a cabo esta pequeña

182
Appendix C (Continued) encuesta. No tengo ningún vínculo laboral con la Municipalidad Distrital de Chao, pero ellos están apoyando mi estudio con la provisión de un equipo de ocho personas quienes van a ayudarme hacer las encuestas. Sin embargo, para clarificar una vez más, no trabajo para el gobierno local, ni para ninguna otra agencia del gobierno. Llenar esta pequeña encuesta nos tomará aproximadamente 25 minutos. Luego regreso dentro de unos meses para llenar una encuesta similar a la de ahora. No anotaremos ningún dato personal, y sus respuestas serán completamente confidenciales. Al finalizar el estudio, estaré presentando un informe final a la Municipalidad Distrital de Chao y otras instituciones interesadas en el tema. ¿Gustaría ayudarme con su participación en este estudio? Si la respuesta es “si,” continuaré con la encuesta. “Gracias por permitirme quitarle el tiempo con su participación. Primero, le hare algunas preguntas con respecto a su vivienda, y después continuaré con preguntas sobre el uso de agua, sus conocimientos de agua, y el valor que tiene en su vida.” Equipo de encuestas: “Buenas días, mi nombre es _______. Estoy apoyando a la realización de una encuesta de una estudiante de la Universidad de Florida del Sur (EE.UU), que quiere obtener su maestría de ingeniero ambiental. Ella está interesada en el conocimiento y uso del agua de la gente en el distrito de Chao y, por eso, Ella está llevando a cabo esta pequeña encuesta. No tiene ningún vínculo laboral con la Municipalidad Distrital de Chao, pero ellos lo están apoyando en su estudio con la provisión de un equipo de ocho personas quienes van a ayudarle hacer las encuestas, uno de ellos soy yo. Sin embargo, para clarificar una vez más, Ella no trabaja para el gobierno local, ni para ninguna otra agencia del gobierno. Llenar esta pequeña encuesta nos tomará aproximadamente 25 minutos. Luego un miembro del equipo regresara dentro de unos meses para llenar una encuesta similar a la de ahora. No anotaremos ningún dato personal, y sus respuestas serán completamente confidenciales. Al finalizar el estudio, La señorita estará presentando un informe final a la Municipalidad Distrital de Chao y otras instituciones interesadas en el tema. ¿Gustaría ayudarla con su participación en este estudio? Si la respuesta es “si,” continuaré con la encuesta. “Gracias por permitirme quitarle el tiempo con su participación. Primero, le hare algunas preguntas con respecto a su vivienda, y después continuaré con preguntas sobre el uso de agua, sus conocimientos de agua, y el valor que tiene en su vida.”
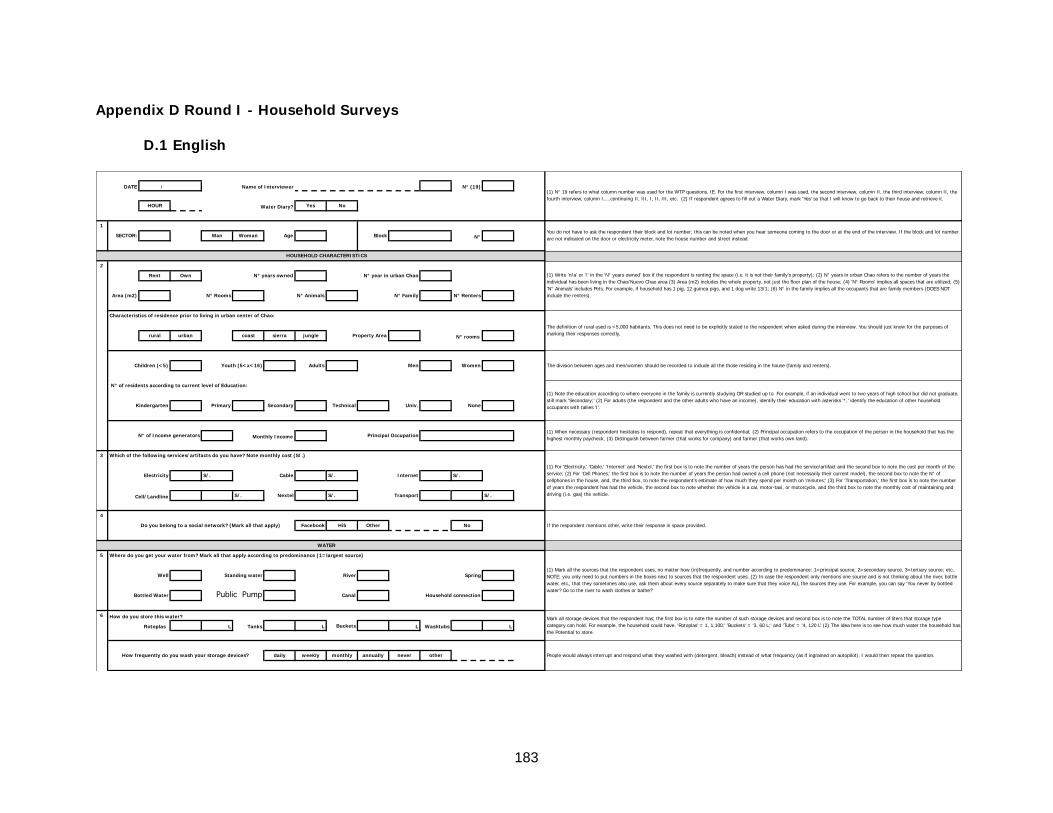
183
Appendix D Round I - Household Surveys
D.1 English
DATE / N° (19)
HOUR Yes No
1
SECTOR: Man Woman Age Block N°
2
Rent Own
Area (m2) N° Renters
rural urban coast sierra jungle
Children (<5) Adults Men Women
Primary Secondary Technical Univ. None
3
Electricity S/. Cable S/. Internet S/.
S/. Nextel S/. Transport S/.
4
Do you belong to a social network? (Mark all that apply) Facebook Hi5 Other No
5
River Spring
Canal Household connection
6 How do you store this water?
Rotoplas L Tanks L Buckets L Washtubs L
daily weekly monthly annually never other
Public Pump
Mark all storage devices that the respondent has; the first box is to note the number of such storage devices and second box is to note the TOTAL number of liters that storage type category can hold, For example, the household could have, 'Rotoplas' = 1, 1,100,' 'Buckets' = '3, 60 L;' and 'Tubs' = '4, 120 L' (2) The idea here is to see how much water the household has the Potential to store.
People would always interrupt and respond what they washed with (detergent, bleach) instead of what frequency (as if ingrained on autopilot). I would then repeat the question.How frequently do you wash your storage devices?
Which of the following services/artifacts do you have? Note monthly cost (S/.)
(1) For 'Electricity,' 'Cable,' 'Internet' and 'Nextel,' the first box is to note the number of years the person has had the service/artifact and the second box to note the cost per month of the service; (2) For 'Cell Phones,' the first box is to note the number of years the person had owned a cell phone (not necessarily their current model), the second box to note the N° of cellphones in the house, and, the third box, to note the respondent's estimate of how much they spend per month on 'minutes;' (3) For 'Transportation,' the first box is to note the number of years the respondent has had the vehicle, the second box to note whether the vehicle is a car, motor-taxi, or motorcycle, and the third box to note the monthly cost of maintaining and driving (i.e. gas) the vehicle.Cell/Landline
If the respondent mentions other, write their response in space provided.
WATER
Where do you get your water from? Mark all that apply according to predominance (1=largest source)
(1) Mark all the sources that the respondent uses, no matter how (in)frequently, and number according to predominance: 1=principal source; 2=secondary source, 3=tertiary source; etc.. NOTE: you only need to put numbers in the boxes next to sources that the respondent uses; (2) In case the respondent only mentions one source and is not thinking about the river, bottle water, etc., that they sometimes also use, ask them about every source separately to make sure that they voice ALL the sources they use. For example, you can say 'You never by bottled water? Go to the river to wash clothes or bathe?'
Well Standing water
Bottled Water
N° of residents according to current level of Education:
(1) Note the education according to where everyone in the family is currently studying OR studied up to. For example, if an individual went to two years of high school but did not graduate, still mark 'Secondary;' (2) For adults (the respondent and the other adults who have an income), identify their education with asterisks '*,' identify the education of other household occupants with tallies 'I'.Kindergarten
(1) When necessary (respondent hesitates to respond), repeat that everything is confidential; (2) Principal occupation refers to the occupation of the person in the household that has the highest monthly paycheck; (3) Distinguish between farmer (that works for company) and farmer (that works own land).
N° of Income generators Monthly Income Principal Occupation
N° Family
Characteristics of residence prior to living in urban center of Chao:
The definition of rural used is <5,000 habitants. This does not need to be explicitly stated to the respondent when asked during the interview. You should just know for the purposes of marking their responses correctly,Property Area N° rooms
The division between ages and men/women should be recorded to include all the those residing in the house (family and renters). Youth (5<x<16)
(1) N° 19 refers to what column number was used for the WTP questions. IE. For the first interview, column I was used, the second interview, column II, the third interview, column II, the fourth interview, column I,….continuing II, III, I, II, III, etc. (2) If respondent agrees to fill out a Water Diary, mark 'Yes' so that I will know to go back to their house and retrieve it.
Name of Interviewer
Water Diary?
You do not have to ask the respondent their block and lot number; this can be noted when you hear someone coming to the door or at the end of the interview. If the block and lot number are not indicated on the door or electricity meter, note the house number and street instead.
HOUSEHOLD CHARACTERISTICS
(1) Write 'n/a' or '/' in the 'N° years owned' box if the respondent is renting the space (i.e. it is not their family's property); (2) N° years in urban Chao refers to the number of years the individual has been living in the Chao/Nuevo Chao area (3) Area (m2) includes the whole property, not just the floor plan of the house; (4) 'N° Rooms' implies all spaces that are utilized; (5) 'N° Animals' includes Pets. For example, if household has 1 pig, 12 guinea pigs, and 1 dog write 13/1; (6) N° in the family implies all the occupants that are family members (DOES NOT include the renters).
N° years owned N° year in urban Chao
N° Rooms N° Animals

184
Appendix D (Continued)
7 (1) Use answers from question #5 to determine which source is the Principal Source, Source 2,' and Source '3;' (2) NOTE If the respondent did not mention using three separate sources of water, you don't need to fill out every column in question #7
8
other
9 How many times a day do you drink water? How many times a day do you drink water in another form (tea, etc.)?
0 1 2 to 3 4 to 5 >6 0 1 2 to 3 4 to 5 >6
How many liters of water DO you store daily?
In total, how many liters of water do you believe your FAMILY consumes daily?
In total, how many liters of water do you believe your RENTERS consume daily?
Read the respondent the two options. What is your opinion of the taste of chlorinated water? agreeable disagreeable
(1) It is not necessary to read the categories, only mark the box to which the respondent's answer corresponds; (2) NOTE: this question only refers to the liters per day the respondent drinks, not their entire family
biological safety
With respect to your water service, what is the most important:
Read the respondent the three options, and only mark the one that is most important to them (i.e. if they mention more than one characteristic, mark the one they mention first)quality continuity price
Read the respondent the two optionsWhat is more important for you: Quality of water Quality of service
With respect to the quality of your water, what is the most important:
(1) Read out loud to the respondent the five options, and only mark the one that is most important to them (i.e. if they mention more than one characteristic, mark the one they mention first); (2) If the respondent mentions something different mark 'other' and note their responses word for word taste appearance physical safety
Do you treat this water before using it and, if so, how much does this cost you per month? (0 -crude; 1 - boiled; 2 - filtered; 3 -chlorinate; 4-coagunlant; 5-other (specify))
DO NOT FORGET to ask the respondent to estimate the cost per month of their reported treatment. For example, if the respondent boils their water, they could estimate it costs S/. 10 per month
How much does the water cost you per month?
How do you perceive the price? (1 - doesn't apply; 2 - cheap; 3 - fair; 4 - too much; 5 - other (specify)) If the respondent gives a word other than 'cheap,' 'regular' or 'expensive' write the response word for word
How do you use water from this source? (1 - Drinking water; 2 - Bathing; 3 - Washing; 4 - Cooking; 5 - Sanitation; 6 - Watering street; 7 - Irrigation) Note all uses that apply.
Again, this question only applies to households that use more than one source. NOTE: You can note more than one number. For example, perhaps the respondent uses water from their faucet for 'bathing, cleaning, and washing clothes,' (# 2 and 3) while they use water from a well for 'drinking and cooking' (#1 y 4)
Where does the water go once used? (1 - sewage; 2 - latrine; 3 - water street; 4 - water plants; 5- septic tank; 6 - other (specify)) NOTE: You can write down more than one number per water source. For example, water from faucet goes to 'sewage and street' (#1 and 3)
How would you describe the quality of water from this source? Write down word for word how the respondent describes the quality of their water source(s)
This question applies to households that use more than one source. For example, '200 L' from the faucet, another '50 L' from a well, and '20 L' of bottled water.
With what frequency do you use this source? Again, this question only applies to households that use more than one source. For example, 'daily' from faucet, 'only when faucet water not available' from well and 'weekly' (drink) bottled water
IF
domestic connection exists, how many hours a day does water arrive If the household had a faucet, the first column is to mark the number of hours they receive water per day. If the household used other water sources as well, in columns 2 (and 3), note the effort that is required to access this water. For example, perhaps it could be '10 minutes with a bucket' or '5 minutes with an electric pump' for a well, 'one hour walking' for water from the river, and 'no effort' for the purchase of bottled water no domestic connection, note the effort (time) required to obtain water
If the respondent uses more than three sources, select the top three for the following section Principal Source Alternative #1 Alternative #2
Of your total daily water use, estimate how many liters come from this source?
(1) NOTE, now you are asking the respondent how many liters they actually store on a daily basis (i.e. not potential to store) (where in Nuevo Chao storage will be on an every other day basis); (2) if the house dot not have renters mark 'N/A' or '/'

185
Appendix D (Continued)
≤0.5 0.5< x ≤1 1< x ≤2 2< x ≤3 >3 ≤0.5 0.5< x ≤1 1< x ≤2 2< x ≤3 >3
10
N/A <1 1 to 3 4 to 7 >7
spring river well canal don't know other
Yes No rarely daily weekly monthly
Yes No Why?
11
Electricity Yes No Cable Yes No Internet Yes No
Cell phone Yes No Nextel Yes No Car / Motorcycle Yes No
12
Environ. Domestic
13
Number of: Faucets Showers Toilets? flushes per day
4L 6L 13L don't know other
Yes No
14
Canal River Don't know other
15
pit latrine field other
street canal river other
16
shower bucket
Summer Winter
<8am 8am-5pm > 5pm tubs machine
wash clothes and how many times a WEEK
L
<20 20-40 40-80 80-120 >120 don't know
How many times a day (1) In the first box note the number of times per day the activity is done, in the second box note the number of liters used each time the activity is done; (2) NOTE: washing hands and brushing teeth only refers to the practices of the respondent, not the entire household
does household wash dishes? do you wash hands? do you brush teeth?
How often do you:(1) It is NOT necessary to put a number in every box next to 'water street per DAY.' For example, if the respondent waters twice a day, once at 6 in the morning and once at 4 in the afternoon, mark '1' in the box under <8am and '1' in the box under 8am-5pm; (2) water type refers to whether the respondent uses water from the faucet, washwater, well water, etc., if the respondent uses more than one water type, mark all that apply; (3) In the 'L' box put the respondents' estimate of how many liters of water they use a day for watering. For example, if they throw out a bucket (oil sized, 18L) in the morning and another bucket in the afternoon, it would be ~'36 L;' (4) If the respondent uses washtubs for washing clothes mark the number of times they do laundry per week in the box under 'tubs,' if they use a washing machine, mark the number of times they do laundry per week in the box under 'machine,' (i.e. you will not write a number in both boxes unless they do laundry both ways); (5) If the respondent has difficulty estimating how many liters they use every time they do laundry, you can help them make an estimate with questions like "How many tubes do you use?, How many liters does each tub hold?, and How many times do you fill and empty each tub?," etc.
water street per DAY
with what type of water?
Can you estimate how much water you use every time you wash? (L)
Where does the water you use for washing, cleaning, and bathing go?
Straightforward, this question only applied to respondents who did not have sewage. Often the respondent's greywater went to more than source. In the future I would probably just explicitly ask, where does your bathing water go? washing water? dish water? etc.
septic tank
(1) If the respondent bathes in the shower, note the number of minutes they reported to stay in the shower (with water running); If the respondent bathes with a bucket, note the number of liters they estimate to use each time they bathe; (2) NOTE: this question corresponds to the respondent's personal hygiene, not the entire family's
How do you bathe? How many minutes/liters? Times per day
Do NOT read the options. Where does the sewage go? Oxidation Ponds
Where do you do your necessities? pour flush latrine
You only need to ask about flushes per day if the household has a toilet or pour-flush latrine, where flushes per day refers to the respondent's personal use of their households' toilet.
Known leaks?
How many liters in your toilets tank?
If the respondent replies 'Yes' go to question #14, if the respondent replies 'No' go to question #15 Does the house have sewage? Go to #14 Go to #15
Do you have confidence in your water provider?
Would you be willing to pay more for your water service than what you are paying for your __________ service?
NOTE: You only need to ask about the services the respondent mentioned (to have) in question #3.
When it comes to prioritizing the distribution of water, rank the following five categories from most (1) to least important (5)
Read the five categories so that the respondent can put them in order. You may need to read the categories more than once in order to help the respondent respond correctly, remember to emphasize that 1 is for the sector that (in their opinion) has priority Agriculture Commercial Industrial
How many years have you had a domestic water connection? (If the respondent does not have, mark 'N/A' and go to question #11)
Do not read the categories, only mark the box to which the respondent's answer corresponds; (2) If the household does not have a domestic connection, mark N/A and move on to question #11
(1) do NOT read the categories, this is an open-ended question; (2) If the respondent says 'reservoir,' make a note and then ask the respondent again if they know what the Source of the water is. If they give a different answer (well, CHAVIMOCHIC, etc.) note it accordingly
Where does the water from your connection come from?
Do you have problems with water pressure? With what frequency?
How many liters of pure water do you drink a day? How many liters of water do you drink a day in another form (juice, tea, etc.)?
(1) It is not necessary to read the categories, only mark the box to which the respondent's answer applies; (2) NOTE: this question only refers to the liters per day the respondent drinks, not their entire family
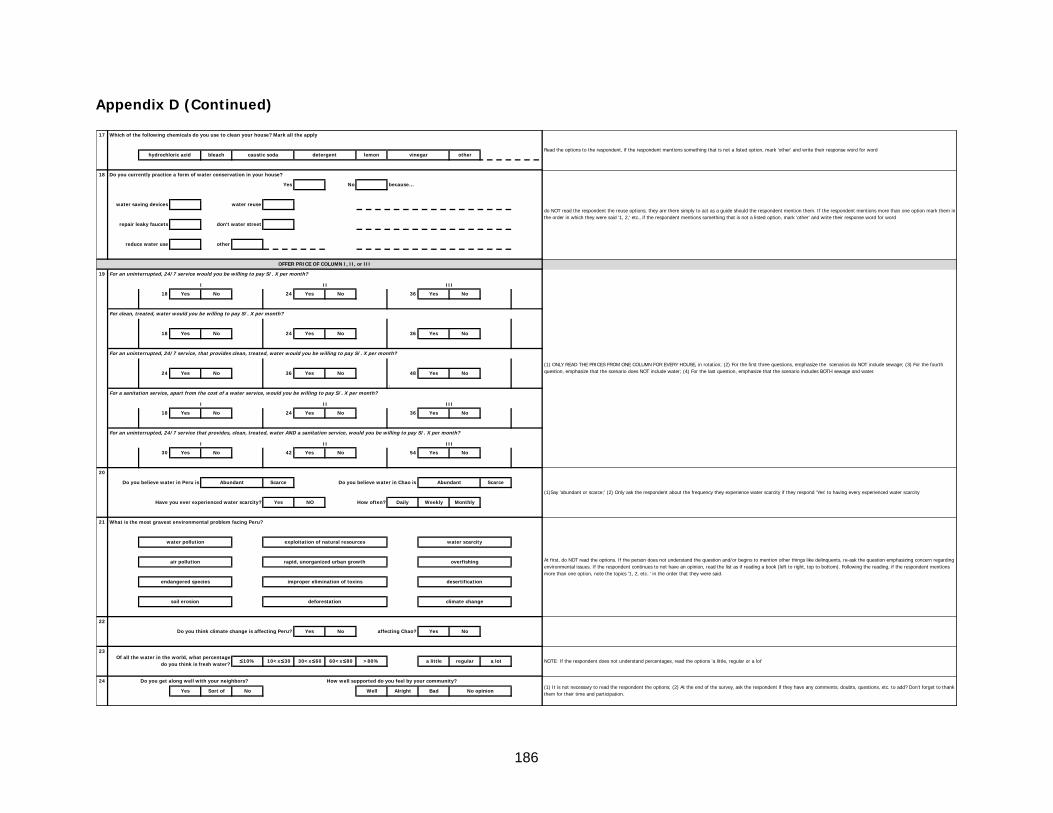
186
Appendix D (Continued)
17
bleach lemon other
18 Do you currently practice a form of water conservation in your house?
Yes No because…
other
19
18 Yes No 24 Yes No 36 Yes No
18 Yes No 24 Yes No 36 Yes No
24 Yes No 36 Yes No 48 Yes No
,
18 Yes No 24 Yes No 36 Yes No
30 Yes No 42 Yes No 54 Yes No
20
Scarce Scarce
Yes NO Daily Weekly Monthly
21
22
Yes No Yes No
23
≤10% 10<x≤30 30<x≤60 60<x≤80 >80% a little regular a lot
24
Yes Sort of No Well Alright Bad
Of all the water in the world, what percentage do you think is fresh water? NOTE: If the respondent does not understand percentages, read the options 'a little, regular or a lot'
Do you get along well with your neighbors? How well supported do you feel by your community?(1) It is not necessary to read the respondent the options; (2) At the end of the survey, ask the respondent if they have any comments, doubts, questions, etc. to add? Don't forget to thank them for their time and participation.
No opinion
desertification
soil erosion deforestation climate change
Do you think climate change is affecting Peru? affecting Chao?
What is the most gravest environmental problem facing Peru?
At first, do NOT read the options. If the person does not understand the question and/or begins to mention other things like delinquents, re-ask the question emphasizing concern regarding environmental issues. If the respondent continues to not have an opinion, read the list as if reading a book (left to right, top to bottom). Following the reading, if the respondent mentions more than one option, note the topics '1, 2, etc..' in the order that they were said.
water pollution exploitation of natural resources water scarcity
air pollution rapid, unorganized urban growth overfishing
endangered species improper elimination of toxins
(1)Say 'abundant or scarce;' (2) Only ask the respondent about the frequency they experience water scarcity if they respond 'Yes' to having every experienced water scarcity
Do you believe water in Peru is Abundant Do you believe water in Chao is Abundant
Have you ever experienced water scarcity? How often?
II III
For an uninterrupted, 24/7 service that provides, clean, treated, water AND a sanitation service, would you be willing to pay S/. X per month?
I II III
OFFER PRICE OF COLUMN I, II, or III
For an uninterrupted, 24/7 service would you be willing to pay S/. X per month?
(1) ONLY READ THE PRICES FROM ONE COLUMN FOR EVERY HOUSE, in rotation; (2) For the first three questions, emphasize the scenarios do NOT include sewage; (3) For the fourth question, emphasize that the scenario does NOT include water; (4) For the last question, emphasize that the scenario includes BOTH sewage and water.
I II III
For clean, treated, water would you be willing to pay S/. X per month?
For an uninterrupted, 24/7 service, that provides clean, treated, water would you be willing to pay S/. X per month?
For a sanitation service, apart from the cost of a water service, would you be willing to pay S/. X per month?
I
do NOT read the respondent the reuse options; they are there simply to act as a guide should the respondent mention them. If the respondent mentions more than one option mark them in the order in which they were said '1, 2,' etc., if the respondent mentions something that is not a listed option, mark 'other' and write their response word for word
water saving devices water reuse
repair leaky faucets don't water street
reduce water use
Which of the following chemicals do you use to clean your house? Mark all the apply
Read the options to the respondent, if the respondent mentions something that is not a listed option, mark 'other' and write their response word for wordhydrochloric acid caustic soda detergent vinegar

187
Appendix D (Continued)
D.2 Spanish
FECHA / N° (19)
HORA Si No
1
SECTOR: Manzana Lote N° Hombre Mujer Edad
2
Alquila Dueño
Área (m2) Inquilinos
rural urbano costa sierra selva
Niños ≤5 Adultos ≥18 Hombres Mujeres
jardín primaría técnico Univers. ningún
3
Electricidad S/. Cable S/. Internet S/.
Celular S/. Nextel S/. Tipo de Movilidad S/.
4
Facebook Hi5 Otro No
5
Río Puquio
Acequia Conexión domiciliara
6
Rotoplas Tanque Baldes Tinas
diario semanal mensual anual nunca otro
7(1) Utiliza las respuestas del respondiente de pregunta #5 para determinar que es el Fuente 'Principal,' Fuente '2,' y Fuente '3;' (2) OJO: Si el respondiente no mencionó la utilización de tres fuentes de agua, no tiene que llenar cada columna de pregunta #7.
En total, ¿Cuántos litros de agua cree que consume su FAMILIA diariamente? (L)
En total, ¿Cuántos litros de agua cree que consume LOS INQUILINOS diariamente? (L)
¿Con qué frecuencia usa este fuente? Este pregunta sólo aplica a las viviendas (respondientes) que utilizan más de un fuente. Por ejemplo, 'diario' del caño, 'solo cuando no hay agua del caño' por el pozo, y 'semanal' de agua envasada
Si la vivienda abastece de más de 3 fuentes, coloca las tres MAS usadas en la siguiente sección. Por ejemplo, Columna 1, "Fuente Principal," pertenecería para el caño, "Fuente 2" pertenecería al
pozo, y "Fuente 3" pertenecería al agua envasadaFuente Principal Fuente "2" Fuente "3"
¿Del total de agua que consume, cuántos litros se abastece de cada fuente? Este pregunta es sólo aplica a las viviendas (respondientes) que utilizan más de un fuente. Por ejemplo '200 L' del caño, otro '50 L' del pozo y '20 L' de agua envasada
Pileta Pública
¿Cómo deposita su agua? Y nota litros en caja Marca todos tipos de almacenamiento que el respondiente tiene; la primera caja es para apuntar cuántos de cada tipo tiene y la segunda para apuntar el TOTAL número de litros puede abastecer con este tipo, por ejemplo, puede ser, 'Rotoplas' = 1, 1,100 L y 'Baldes' = '3, 60 L' y 'Tinas' = '4, 120 L;' (2) La idea es para entender qué volumen de agua la vivienda podría abastecer si fuera necesario.
¿Con que frecuencia lava sus depósitos?
(1) OJO, ahora está preguntando el respondiente cuantos litros actualmente almacena diariamente (o cada otro día en Nuevo Chao); (2) Apunta 'N/A' o '/' si la vivienda no tiene inquilinos
¿EN TOTAL, cuántos litros de agua almacena diariamente? (L)
¿De los siguientes servicios y artefactos, qué tiene?(1) Para 'Electricidad,' 'Cable,' "Internet,' y 'Nextel' la primera caja es para apuntar el número de años que el respondiente ha tenido el artefacto y/o servicio Y la segunda caja para apuntar el costo mensual del servicio; (2) Con respecto a 'Celular,' la primera caja es para apuntar cuantos años el respondiente ha tenido un celular (no necesariamente el modelo actual), la segunda caja para apuntar cuantos celulares hay en la familia, y la tercera caja para apuntar cuánto el respondiente gasta en 'recargas' por mes; (3) Con respecto a 'Tipo de Movilidad,' la primera caja es para apuntar cuántos años el respondiente ha tenido su vehículo, la segunda caja para apuntar que tipo de vehículo (carro, moto-taxi, motocicleta, combi, etc.), y la tercera caja para apuntar el costo mensual según el mantenimiento de vehículo y combustible
SI es "otro," apunta la respuesta del respondiente.¿Pertenece a un red social? (Apunta todos que aplican)
AGUA
¿De dónde se abastece su agua? Marca todos que aplican según predominio (1=más usado)
(1) Marca todos los fuentes que aplican según predominio (1=fuente principal; 2=siguiente más usado, etc....) OJO sólo tiene que poner un número en las cajas de los fuentes que el respondiente utiliza; (2) Por si acaso el respondiente sólo menciona un fuente y no está pensando en el río, agua envasada, etc.. que a veces utiliza, pregunta de cada mencionada fuente para estar seguro antes de seguir adelante. Por ejemplo, puede preguntar al respondiente 'Nunca compra botellas de agua? Va al río a lavar o bañar?'
Pozo Agua Estancada
Agua Envasada
Educación - N° de integrantes según el grado de instrucción:
(1) Marca las categorías dónde todo la familia en la casa pertenece ahora mismo O dónde ha dejado de estudiar. Por ejemplo, si una persona fue a dos años de secundaria pero no se cumple con todo, todavía marca 'Secundaria;' (2) Por los que son mayores (el/la respondiente más los otros adultos que perciben ingresos), identifica con asteriscos '*' Y para los otros ocupantes de la casa identifica su educación con palitos ' I '.
secundaria
(1) Si es necesario (el/la respondiente vacila), repita que todo es confidencial; (2) Ocupación principal refiere a la ocupación de la persona en la familia que gana lo más cada mes; (3) Distingue entre obrero (trabaja para empresa) y agricultor (propio terreno).
N° que perciben ingresos Ingreso Mensual ocupación principal
N° Integrantes
Características de su vivienda antes de venir a Chao Urbano:
Rural implica <5,000 gente aunque no tiene que mencionar esto al respondiente durante la encuesta. Sólo tiene esto en mente cuando está apuntando la respuesta.Área (m2) N° Habitaciones
Marca edades y división entre mujer y hombre por TODOS en la casa, integrantes (familia) y inquilinosJuventud 5<x<18
(1) N° 19 refiere a que columna va a usar para pregunta #19. Recuerde que la primera encuesta que hace va a usar columna "I," la segunda encuesta, columna "II," la tercera encuesta, columna "III," la cuatro encuesta, columna "I,"….sigue II, III, I, II, III, etc.; (2) Si el/la respondiente acordó llenar el diario de agua, marca 'Si' para que sepa que tengo que regresar a colectarlo.
Nombre Encuestador
Diario de Agua?
No tiene que preguntar por la manzana y lote, si puede, nótalo cuando está esperando o al fin de la encuesta. Si no está indicado en la puerta o caja de luz, marca la dirección de la casa.
CARACTERÍSTICA DE LA VIVIENDA
(1) Pone 'n/a' o '/' en la caja de N° años propiedad, si el respondiente NO es el dueño de la casa; (2) N° años Chao urbano aplica a todos los años que la persona ha vivido en Chao o Nuevo Chao (áreas urbanos); (3) área de propiedad incluye todo el terreno, no sólo la casa; (4) Habitaciones implica todos los espacios que son separados y utilizados; (5) 'N° Animales' incluye Mascotas. Por ejemplo, si la domiciliara tiene 1 chancho, 12 cuyes, y un perro, apunta '13/1;' (6) Integrantes implica todos los ocupantes que son familiares (NO incluye los inquilinos)
N° años propiedad N° años Chao urbano
N° Habitaciones N° Animales/Mascotas

188
Appendix D (Continued)
8
otro
¿Qué opina del sabor del agua clorada?
9 ¿Cuántas veces al día tomas agua pura? ¿Cuántas veces al día tomas agua en otra forma? (jugo, té, ..)
0 1 2 o 3 4 o 5 >6 0 1 2 o 3 4 o 5 >6
≤0.5 0.5< x ≤1 1< x ≤2 2< x ≤3 >3 ≤0.5 0.5< x ≤1 1< x ≤2 2< x ≤3 >3
10
N/A <1 1 a 3 4 a 7 >7
N/A ≤1 1<x≤5 5<x≤10 10<x≤20 >20 no sabe
puquio río pozo acequia no sabe otro
Si No raro diario semanal mensual
Si No ¿Por Qué?
(1) NO lea las opciones; (2) Si el respondiente dice 'reservorio' apuntalo al lado y pregúntale al respondiente otra vez si sabe de dónde viene el agua que está almacenada en el reservorio (el fuente definitivo). Si le da otra respuesta como 'pozo' o 'CHAVIMOCHIC' apuntalo.
¿De dónde viene el agua que está almacenada en el reservorio?
¿Tiene problemas con presión? ¿Con qué frecuencia?
¿Tiene confianza en su proveedor de agua?
¿Cuántos litros de agua pura toma al día? ¿Cuántos litros de agua en otra forma de bebida toma al día?
(1) NO es necesario leer las categorías, sólo apunta la caja dónde la respuesta del respondiente pertenece; (2) OJO: Este pregunta sólo refiere a los litros por día que el respondiente consume, no la familia entera
¿Cuántos años ha tenido conexión domiciliara? (Si no tiene, apunta 'N/A' y va al pregunta #11)
NO lea las categorías, sólo apunta dónde la respuesta del respondiente pertenece, apunta N/A si la vivienda no tiene conexión domiciliaria
NO lea las categorías, sólo marca dónde la respuesta del respondiente pertenece. ¿Cuántos litros por minuto crees que cae del caño de agua?
Lea las opciones Y sólo marca unoagradable desagradable
(1) NO es necesario leer las categorías, sólo apunta la caja dónde la respuesta del respondiente pertenece; (2) OJO: Este pregunta sólo refiere a los litros por día que el respondiente consume, no la familia entera
seguridad biológica
¿Con respecto a un servicio de agua, qué es lo más importante?
Lea las tres opciones al respondiente, Y sólo marca uno (i.e. si el respondiente menciona más de una característica, apunta la característica que menciona primero)calidad continuidad precio
Lea al respondiente las dos opciones ¿Qué es más importante para usted? Calidad de agua Calidad de servicio
¿Con respecto a la calidad de su agua, qué es lo más importante?
(1) Lea al respondiente las cinco opciones, Y sólo marca uno (i.e si el respondiente menciona más de una característica, apunta la característica que menciona primero); (2) Si el respondiente menciona algo diferente, marca 'otro' y apunta la respuesta palabra por palabrasabor apariencia seguridad física
¿Cómo toma el agua Y, SI TRATA, estima costo por mes por el tratamiento? (0 - crudo; 1 -hervirlo; 2 - filtrada; 3 -clorada; 4-coagulante; 5-otro (especifica)) NO OLVIDA de preguntar costo por mes del tratamiento. Por ejemplo, si el respondiente hierve su agua, puede estimar que cuesta S/. 10 mensual.
¿Cuánto cuesta el agua de este fuente por mes? (1 - no aplica)
¿Que le parece el precio de agua? (1 - no aplica; 2 - barato; 3 - regular; 4 - caro; 5 - otro (especifica)) Si el respondiente le da una palabra diferente de 'barato,' 'cómodo/regular' o 'caro,' escribe la respuesta palabra por palabra
¿Cómo usa el agua que obtiene de esta fuente? (1 - Tomar; 2 - Bañar; 3 - Lavar/Limpiar; 4 -Cocinar; 5 - Desagüe; 6 - Regar la calle; 7 - Regadío de Plantas; 8 - Otro (especifica)) OJO: Puedenotar más de un número
Pregunta sólo si el respondiente usa más de un fuente. OJO Puede apuntar más de un número. Por ejemplo, quizás el respondiente utiliza agua del caño para 'bañar, limpiar, y lavar ropa' (#2 y 3) y agua del pozo para 'tomar y cocinar' (# 1 y 4)
¿A dónde va el agua que usa? (1 - desagüe; 2 - letrina; 3 - regar la calle; 4 - regar plantas ; 5 -pozo séptico; 6 - no aplica; 7 - otro (especifica)) OJO: Puede apuntar más de un número por fuente. Por ejemplo, agua del caño va al 'desagüe y la calle' (# 1 y 3)
¿Cómo describe la calidad del agua? Apunta exactamente la palabra(s) que el respondiente utiliza para describir su fuente(s) de agua
SI
ES conexión domiciliara, ¿Cuántas horas por día del servicio? Si la vivienda tiene un caño, en la primera columna marca el número de horas que la casa recibe servicio por día. Si la vivienda utiliza otros fuentes de agua, en columna 2 (y 3), apunta la esfuerza requerido para abastecerse el agua. Por ejemplo, quizás sería: '10 minutos con balde' o '5 minutos con bomba' por un pozo, 'una hora caminando' por el río, y 'nada' por comprar agua envasadaNO ES conexión domiciliara, ¿Cuánto esfuerzo (tiempo) requerido para abastecerse de
agua?
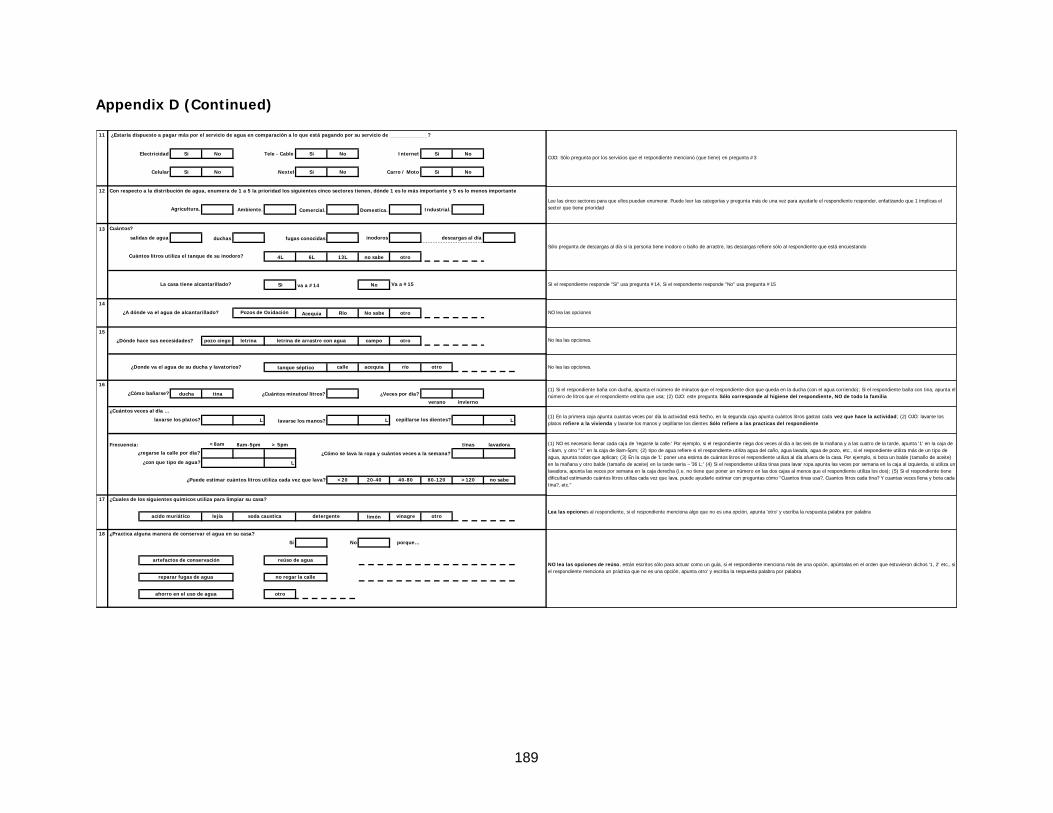
189
Appendix D (Continued)
11
Electricidad Si No Tele - Cable Si No Internet Si No
Celular Si No Nextel Si No Carro / Moto Si No
12
Ambiente. Comercial. Domestica. Industrial.
13 Cuántos?
salidas de agua duchas inodoros descargas al día
4L 6L 13L no sabe otro
Si No
14
Acequia Río No sabe otro
15
pozo ciego letrina campo otro
calle acequia río otro
16
ducha tina
verano invierno
L L L
Frecuencia: <8am 8am-5pm > 5pm tinas lavadora
¿Cómo se lava la ropa y cuántos veces a la semana?
L
<20 20-40 40-80 80-120 >120 no sabe
17
lejía limón vinagre otro
18 ¿Practica alguna manera de conservar el agua en su casa?
Si No porque…
otro
NO lea las opciones de reúso, están escritos sólo para actuar como un guía, si el respondiente menciona más de una opción, apúntalas en el orden que estuvieron dichos '1, 2' etc., si el respondiente menciona un práctica que no es una opción, apunta otro' y escriba la respuesta palabra por palabra
artefactos de conservación reúso de agua
reparar fugas de agua no regar la calle
ahorro en el uso de agua
(1) NO es necesario llenar cada caja de 'regarse la calle.' Por ejemplo, si el respondiente riega dos veces al día a las seis de la mañana y a las cuatro de la tarde, apunta '1' en la caja de <8am, y otro "1" en la caja de 8am-5pm; (2) tipo de agua refiere si el respondiente utiliza agua del caño, agua lavada, agua de pozo, etc., si el respondiente utiliza más de un tipo de agua, apunta todos que aplican; (3) En la caja de 'L' poner una estima de cuántos litros el respondiente utiliza al día afuera de la casa. Por ejemplo, si bota un balde (tamaño de aceite) en la mañana y otro balde (tamaño de aceite) en la tarde sería ~'36 L;' (4) Si el respondiente utiliza tinas para lavar ropa apunta las veces por semana en la caja al izquierda, si utiliza un lavadora, apunta las veces por semana en la caja derecha (i.e. no tiene que poner un número en las dos cajas al menos que el respondiente utiliza los dos); (5) Si el respondiente tiene dificultad estimando cuántos litros utiliza cada vez que lava, puede ayudarle estimar con preguntas cómo "Cuantos tinas usa?, Cuantos litros cada tina? Y cuantas veces llena y bota cada tina?, etc."
¿regarse la calle por día?
¿con que tipo de agua?
¿Puede estimar cuántos litros utiliza cada vez que lava?
¿Cuales de los siguientes químicos utiliza para limpiar su casa?
Lea las opciones al respondiente, si el respondiente menciona algo que no es una opción, apunta 'otro' y escriba la respuesta palabra por palabraacido muriático soda caustica detergente
(1) Si el respondiente baña con ducha, apunta el número de minutos que el respondiente dice que queda en la ducha (con el agua corriendo); Si el respondiente baña con tina, apunta el número de litros que el respondiente estima que usa; (2) OJO: este pregunta Sólo corresponde al higiene del respondiente, NO de todo la familia¿Cómo bañarse? ¿Cuántos minutos/litros? ¿Veces por día?
¿Cuántos veces al día …(1) En la primera caja apunta cuantas veces por día la actividad está hecho, en la segunda caja apunta cuántos litros gastan cada vez que hace la actividad; (2) OJO: lavarse los platos refiere a la vivienda y lavarse los manos y cepillarse los dientes Sólo refiere a las practicas del respondiente
lavarse los platos? lavarse los manos? cepillarse los dientes?
No lea las opciones. ¿Dónde hace sus necesidades? letrina de arrastre con agua
No lea las opciones.¿Donde va el agua de su ducha y lavatorios? tanque séptico
SI el respondiente responde "Si" usa pregunta #14, Si el respondiente responde "No" usa pregunta #15La casa tiene alcantarillado? va a #14 Va a #15
NO lea las opciones¿A dónde va el agua de alcantarillado? Pozos de Oxidación
¿Estaría dispuesto a pagar más por el servicio de agua en comparación a lo que está pagando por su servicio de ____________?
OJO: Sólo pregunta por los servicios que el respondiente mencionó (que tiene) en pregunta #3
Con respecto a la distribución de agua, enumera de 1 a 5 la prioridad los siguientes cinco sectores tienen, dónde 1 es lo más importante y 5 es lo menos importante
Lee las cinco sectores para que ellos puedan enumerar. Puede leer las categorías y pregunta más de una vez para ayudarle el respondiente responder, enfatizando que 1 implicas el sector que tiene prioridadAgricultura.
Sólo pregunta de descargas al día si la persona tiene inodoro o baño de arrastre, las descargas refiere sólo al respondiente que está encuestando
fugas conocidas
Cuántos litros utiliza el tanque de su inodoro?
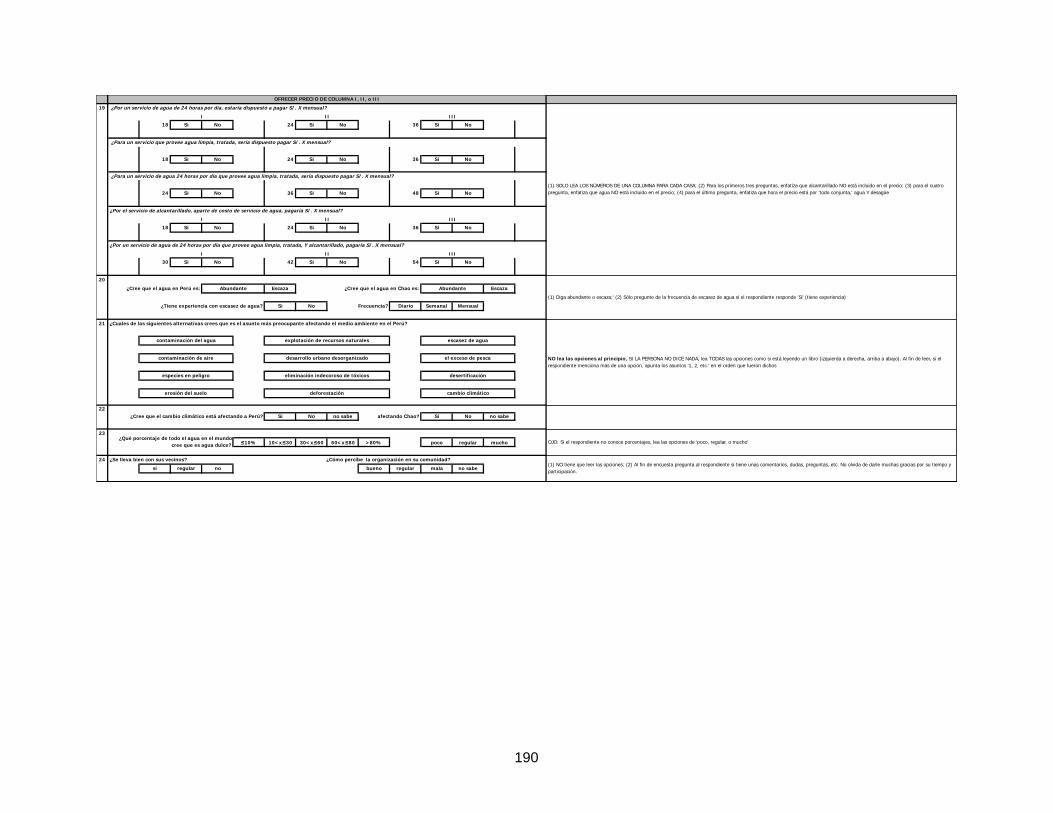
190
19
18 Si No 24 Si No 36 Si No
18 Si No 24 Si No 36 Si No
24 Si No 36 Si No 48 Si No
18 Si No 24 Si No 36 Si No
30 Si No 42 Si No 54 Si No
20
Escaza Escaza
Si No Diario Semanal Mensual
21
22Si No no sabe Si No no sabe
23
≤10% 10<x≤30 30<x≤60 60<x≤80 >80% poco regular mucho
24
si regular no bueno regular mala no sabe
¿Qué porcentaje de todo el agua en el mundo cree que es agua dulce? OJO: Si el respondiente no conoce porcentajes, lea las opciones de 'poco, regular, o mucho'
¿Se lleva bien con sus vecinos? ¿Cómo percibe la organización en su comunidad?(1) NO tiene que leer las opciones; (2) Al fin de encuesta pregunta al respondiente si tiene unas comentarios, dudas, preguntas, etc. No olvida de darle muchas gracias por su tiempo y participación.
desertificación
erosión del suelo deforestación cambio climático
¿Cree que el cambio climático está afectando a Perú? afectando Chao?
¿Cuales de las siguientes alternativas crees que es el asunto más preocupante afectando el medio ambiente en el Perú?
NO lea las opciones al principio, SI LA PERSONA NO DICE NADA, lea TODAS las opciones como si está leyendo un libro (izquierda a derecha, arriba a abajo). Al fin de leer, si el respondiente menciona más de una opción, apunta los asuntos '1, 2, etc.' en el orden que fueron dichos
contaminación del agua explotación de recursos naturales escasez de agua
contaminación de aire desarrollo urbano desorganizado el exceso de pesca
especies en peligro eliminación indecoroso de tóxicos
(1) Diga abundante o escaza;' (2) Sólo pregunte de la frecuencia de escasez de agua si el respondiente responde 'Si' (tiene experiencia)
¿Cree que el agua en Perú es: Abundante ¿Cree que el agua en Chao es: Abundante
¿Tiene experiencia con escasez de agua? Frecuencia?
II III
¿Por un servicio de agua de 24 horas por día que provee agua limpia, tratada, Y alcantarillado, pagaría S/. X mensual?
I II III
OFRECER PRECIO DE COLUMNA I, II, o III
¿Por un servicio de agua de 24 horas por día, estaría dispuesto a pagar S/. X mensual?
(1) SOLO LEA LOS NÚMEROS DE UNA COLUMNA PARA CADA CASA; (2) Para los primeros tres preguntas, enfatiza que alcantarillado NO está incluido en el precio; (3) para el cuatro pregunta, enfatiza que agua NO está incluido en el precio; (4) para el último pregunta, enfatiza que hora el precio está por 'todo conjunta,' agua Y desagüe
I II III
¿Para un servicio que provee agua limpia, tratada, sería dispuesto pagar S/. X mensual?
¿Para un servicio de agua 24 horas por día que provee agua limpia, tratada, sería dispuesto pagar S/. X mensual?
¿Por el servicio de alcantarillado, aparte de costo de servicio de agua, pagaría S/. X mensual?
I

191
Appendix E Round II – Household Surveys
E.1 English
DATE / N° (17)
1
SECTOR: Block Lot N° Man Woman Age
2
Rent Own S/.
rural urban
coast mountain jungle
dirt cement adobe straw brick
Renters
Kids ≤5 Adults ≥18 Men Women
3
Electricity S/. Cable S/. Gas S/. Internet S/.
Cells S/. S/. Vehicle: S/.
Television Camera Refri. Blender
4
Kadena 100
La Exitosa Canal 7 Canal Vision (9)
Canal America
(4)La verdad La
industriaEl Satelite Trome Internet
5
Domestic connection Canal
6
yes no L
Why?
weekly monthly every 3 months annually never other The box below annually is to note a number in case the respondent says something like 'twice a year,' 'four times a year,' etc.If have Rotoplas, ¿How frequently do you wash it?
How do you store your water?
(1) Be the most detailed you can here, note how many storage tanks the respondent has and the number of liters each one holds . For example " Tanks - (1, 100 L) (1, 50 L); Tubs (2, 40 L) - 0 elevated - 2 covered"
N° storage devices
N° elevated N° Covered
Are you planning to buy more storage devices like a cistern or a Rotoplas? N° liters more?
What media source do you most use to obtain information/news?
If the respondent uses more than one media source to receive information, only mark the one they use the MOST. If they mention a source of information that is not listed, mark it in the blank box on the right. If the respondent mentions they most frequently receive information via the 'Internet' please mark the website they most frequently use in the blank box.
AGUA
What water sources do you utilize? (1) Mark all the sources that the respondent uses, no matter how (in)frequently, and number according to predominance: 1=principal source; 2=secondary source, 3=tertiary source; etc.. NOTE: you only need to put numbers in the boxes next to sources that the respondent uses; (2) In case the respondent only mentions one source and is not thinking about the river, bottle water, etc., that they sometimes also use, ask them about every source separately to make sure that they voice ALL the sources they use. For example, you can say 'You never by bottled water? Go to the river to wash clothes or bathe?' Own Well
Neighbor's well
Bottled water
River /Spring
Of the following services and appliances: (note what have, for how many years, and what the monthly cost is)
(1) Next to every service (except for cellphones and transportation) the first box is to write the # of years the respondent has had the service and the second box is to note how much the respondent pays per month for the service; (2) if the respondent does not have the service mentioned, you do not need to mark anything; (3) For cellphone the first box is to note how many cellphones in the family and the second box is to note how many years ago they bought there first cellphone (i.e. not necessarily the model they have now) the last box is to note how many "minutes" they buy a month (or if they prepay, the cost of the service per month); (4) Because only a small percentage of the population have a Nextel or a landline, these two services share a space. Consequently, if the respondent has one, or both, of them, circle accordingly so I know how to enter; (5) the dotted line is to note what type of transportation they have (car, motorcycle, etc.), the second box for how long they have had it, and the third box for how much they spend monthly on gas and maintenance; (6) if the family has a refrigerator but they only leave it plugged in once in a while, mark "1/2"
Nextel / Landline
Washing machineComputer
What appliances are you thinking about buying in the coming year?
(1) CODES --- Nothing = N; Kindergarten = J; Elementary = P; Incomplete Elementary = PI; High school = S; Incomplete High school Secondary = SI; Technical = T; University = U….. (2) The first box is where you note the education of the person you are interviewing; (3) The second box is where you note the education of the principal wage earner; and (4) The third box is where you note the highest education in the house. For example, if the highest education in the house is one of the kids who was the first to complete High school, mark 'S.'
Education of respondent Education of wage earner Highest education in house
Occupation(s) - Monthly Income (S/.) # Beneficiaries Other incomes # Beneficiaries
(1) If the respondent hesitates in responding, repeat that their answer is confidential (2) Distinguish between agricultural worker and an agriculturalist that owns and works his own land; (3) Other incomes refers to support from family that live in other places but send money regularly; government support, income from renting rooms, etc. (4) If one of the noted incomes is not shared with everyone in the house, note the # of beneficiaries....this column is in italics because it is not necessary to put a number if the income is shared between everyone in the house
Area (m2)
N° Rooms N° People in Family N° that are in the house during the day
Mark how many people fit into each category, the totals of Kids + Youth + Adults and Men + Women should equal the Total # in the Family. If there are renters, you do not need to include them. Youth 5<x<18
N° 17 refers to the # of the column you will utilize for Question #17; At the first house you survey you will use column I. Then for the second house, column II, then column III....continuing I, II, III, I, II, etc....In other words for each house you will only offer the prices from one of the columns, where Column # I = S/.18, 20, 22, 18, up to S/. 24; Column # II = S/. 24, 26, 28, 24, up to S/. 30; y Column # III is the sequence S/.30, 32, 34, 30, up to S/. 36.
Name of Interviewer
Please note the block and lot number while you are waiting for someone to come to the door. If the lot number is not indicated on the door, ask the respondent and/or write down the house number.
SOCIO-ECONOMIC
(1) You only have to note monthly rent if the respondent does not own their house. Don't forget to note if the price includes water, electricity, etc. (2) N° years in urban Chao applies to all those who have lived in Chao or Nuevo Chao for less than 20 years years; (3) If the person has lived in Chao for more than 20 years, it is not necessary to ask them about the characteristics of their house before coming to Chao BUT *For those that have lived in Chao/Nuevo Chao for less than 20 years, please note whether they previously lived in 1) an urban or rural area and 2) on the coast, mountains or jungle; (4) N° years in house implies how long the respondent has lived in the house in which you are interviewing them; (5) N° rooms implies All of the rooms, or separated spaces, within the house; (6) property area includes the yard, not just the house; (7) If the respondent has dirt and cement and/or tile floor in their house (not the yard), put a circle around the material that predominates, the same goes for housing material (adobe, straw, brick); (8) N° in family implies number in family (in English there is no need to clarify); (9) N° that are in house during day implies you should note the number of people that are generally in the house the whole day. For example, if the dad, oldest son and renters leave to work during the day, don't count them.
If rent, Cost per month and what includes?
N° years in Chao Characteristics of house before living in urban: 1)
(where do you come from) 2)
N° years in house

192
Appendix E (Continued)
7
don't know don't know
8(1) Use answers from question #5 to determine which source is the Principal Source, Source '2,' and Source '3;' (2) NOTE If the respondent did not mention using three separate sources of water, you don't need to fill out every column in question #8
9
smell taste
10
JASS Sedapal Sedalip Neighbor Don't know Other
<1 1 a 3 4 a 7 8 a 12 13 a 15 > 15 Don't Know
spring river well canal reservoir don't know
yes no rarely daily weekly monthly in past
yes no Why?
Thinking about the water service you have right now, What aspect are you most dissatisfied with?
Here you can read the categories once again showing the respondent Visual 2 and Visual 6. With respect to what information the respondent would like regarding their current service, please take care to note, word for word, what they say.
quality continuity schedule maintenance price pressure transparency
On a scale of 1 to 10, where 1 is horrible and 10 is fantastic, What level of trust do you have in your water provider?
What information would you like from your water provider to increase your confidence in the water service?
DO NOT read the categories, only mark the answer the respondent gives.How many years have you had a domestic connection?
Where does the water come from?
DO NOT read the categories, only mark what the respondent says; (2) If the respondent does NOT have water pressure problems, you do NOT have to ask 'with what frequency;' (3) If the respondent does not have any problem with the service's schedule, you only need to mark the box 'Doesn't affect.'
CHAVIMOHIC
Problems with water pressure? With what frequency?
How does the schedule, hours in which the water arrives, affect your day? doesn't affect
Do you like the way in which you pay your water bill?
ONLY FOR THOSE WHO HAVE A DOMESTIC CONNECTION
Who provides your water and sanitation service?
DO NOT read the categories, only mark the answer the respondent gives.
Municipality of Chao SADISCHAO
With respect to a water service in general, ¿Of the following 7 options, What aspect is most important to you? Second most? Third? (NUMBER 1, 2, 3)This question is similar to the one above. I want to obtain the preference of the respondent with respect to characteristics of their water service (i.e. 1) the most important 2) the second most important, and 3) and the third most important). SO, first read all 7 options and show them Visual 2. Mark '1' beneath the first characteristic they mention. Then, ask them 'Now, of the 6 characteristics (read) that remain what is the most important to you?' Note '2' beneath the characteristic that pertains to their response and repeat once more for the 5 remaining characteristics.
quality continuity schedule maintenance price pressure transparency
With respect to the quality of your water, Of the following 5 aspects, What is the most important to you? The second most? Third? (NUMBER 1, 2, 3) (1) Read all 5 categories to the respondent and show them Visual 1. Mark '1' beneath the characteristic the respondent thinks is the MOST important of all those mentioned; (2) Continue the question by reading the 4 remaining options and note '2' beneath the second characteristic they mention; (3) Finally, read the three remaining options and ask one last time 'Of the three characteristics that remain, which is the most important to you when it comes to the quality of your water?' and note 3' beneath the characteristic they mention; (4) In the case of the respondent mentioning a characteristic different than those provided, note what they say in the blank space to the right of 'biological security.' (3) NOTE: If the respondent asks, for example, 'What does physical security mean?' you can describe to them what it signifies. However, if the respondent does not ask, it is not necessary to educate them on what physical and/or biological security mean.
appearance physical security biological security
How much does the water from X source cost per month? (1 - doesn't apply) NOTE: If there is no cost associated with the source of water (for example well water or water from the river) mark '1'
What do you feel about this price? (1 - doesn't apply; 2 - cheap; 3 - regular/it's fine; 4 - expensive; 5 - other (specify)) NOTE: If there is no cost associated with the source of water (for example well water or water from the river) mark '1'
What does the term potable water signify?
Please write the respondent's complete response, word for word.Do you know what your/a provider of water does to make water potable ?
How do you use the water you obtain from X source? (1 - EVERYTHING; 2-Drinking; 3-Cooking; 4-Bathing; 5-Washing/Cleaning; 6-Watering (street); 7-Watering plants; 8 -Other (specify)) NOTE:You can note more than one #
(1) If the respondent uses only water from the faucet, you would mark '1' to indicate they use faucet water for EVERYTHING; (2) In cases where the respondent uses more than one source and every source for different activities, note what they use each source for. For example, for the neighbor's well, you could mark '2 and 3,' which would indicate that they only utilize well water for drinking and cooking.
How would you describe the quality of water from X source? Note how the respondent values the quality of the water from each source they use, writing down the specific word they use to describe it. For example 'gross,' 'chlorinated,' 'it's fine,' etc.
How do you drink your water? AND, if boil, How many liters per day do you boil? and/or If chlorinate, How many drops of Clorox per Liter are added? (0 - crude)
(1) If the respondent does not treat their water before drinking, you would note '0' to indicate they drink their water crude; (2) If the respondent boils their water or uses chlorine, DON'T FORGET to ask them how many liters they boil per day and/or how many drops of chlorine they use per liter.
IF
they have a domestic connection, Between what hours does the water arrive to yourhouse? (1) If the respondent has a household connection, in the first column mark the number of hours the house receives the service per day and between what hours they receive it; (2) With respect to 'effort,' if
one of the columns corresponds to river, mark the distance to the river, walking, if the question corresponds to a well, note how they get the water, for example "10 minutes, rope" or "5 minutes, pump" they don't have a domestic connection, How much time/effort is required to obtainwater from X source?
If the house uses more than 3 sources of water, note the answers to the three the use the MOST Principal Source Source "2" Source "3"
How frequently do you use X source and how many liters do you use/take each time?NOTE: Ask only if the respondent uses more than one source. For example , if the respondent utilizes a household connection, bottled water, and a neighbor's well, in the first column you may note 'daily,' in the second column ';2L - once a week' and in the third column, '20 L - every other day'
How many liters of water do you believe your family consumes daily? thinking about all the uses of water from cooking and bathing to watering street.
(1) If the respondent has renters, clarify that the first water use estimate is only for their FAMILY; (2) if the respondent insists that they have no idea, please ask them to try and respond and that it is only an estimate. Furthermore, tell them that in the next question they can clarify that they only have '1 or 2' in terms of certainty with the number of liters they reported; (3) When the respondent is making their estimate, remind them to think to include ALL the water they use, not just the water for drinking, cooking (i.e. they should think about how much they use for washing clothes, bathing, cleaning, watering, etc. too). (4) For rating on a scale of 1 to 10, show the respondent Visual 6 to help them better understand what a 1 means as opposed to a 10. If they have trouble understanding the scale, take the time to fully explain how to use it and give them examples. It is important the respondent understands the scale as it will be used several more times in the survey.
the Renters?
On a scale of 1 to 10 where 10 implies absolute certainty, What level of confidence do you have with your estimate of daily water use?

193
Appendix E (Continued)
11
yes no
yes no How?
yes no Why?
yes no Why
yes no yes no
12
yes no
canal river down there don't know other
fields river dry well other
13 How many…..
faucets? showers? toilets? never sometimes always
handle L bucket L
yes no
14
bucket shower river L winter? L
yes no yes no With what? hose bucket
L o M Why do you water? n/a
potable well canal wash other
L don't know
cooking? mop? L
L
L per day N° Pets L per day
≤0.5 0.5< x ≤1 1< x ≤2 2< x ≤3 >3 ≤0.5 0.5< x ≤1 1< x ≤2 2< x ≤3 >3
Cooking Drinking Hygiene Cleaning Laundry Watering
15
sewage yard street canal river plants otherWhere does the water from your
shower/sinks go? Do not read the options. Put circles around ALL of the greywater destinations the respondent mentions. septic tank
Why do you have or not have plants?
N° Animals
How many liters of water do you drink per day? How many liters of water in a different form (juice, coffee, lemonade, etc.) per day?
This number of Liters of water per day only refers to what the respondent drinks (i.e. NOT the their entire family).
Of the following six categories, number 1 to 6 according to how much water each activity requires - where 1 indicates it uses the most
Show the respondent Visual 3 . The respondent should then rate the categories/activities 1 to 6, where 1 would designate the activity that uses the most water and 6 indicates the category that uses the least water.
(1) Ask the respondent to please estimate how many liters of water they use every time they wash their clothes. If they say 'I don't know,' please help them estimate by asking 'How many tubs do you fill? What size are they?,' until they can make an estimate. If they still have no idea, only then should you mark the "Don't Know" box; (2) NOTE: for frequency of mopping and watering plants per week you can use the following codes - D (daily), S (once a week), 2S (2 times a week)3S (3 times a week), etc.; (3) For the question on 'Water Type' use the following codes - DC (potable water), P (well water), R (water from washing, bathing, etc.), and A (water from canal); (4) For the animal and pets section, the first box is to note how many animals and/or pets they have and the second box is to note how many liters they give the animals/pets per day.
How many times a week do you do laundry? Estimate how much water do you use each time.
How many times a month do you do laundry at the river?
How many liters for: frequency? type of water
N° people water plants?
N° in past?
(1) For the fact that many people only can use their showers during the time the water is arriving, put a circle around ALL of the ways in which the respondent bathes; 2) If the person cannot estimate how many liters they use every time they bathe in the shower, have them estimate how many minutes the shower flows (faucet open) and mark an M to signify that the number refers to minutes; (3) If the person always, and only, bathes in the river, its not necessary to note liters or minutes.
How do you bathe? N° per day in summer?
(1) Similar to the other sections, if the respondent uses a bucket, a hose, or both, to water, put a circle around each option; (2) The most important piece of this question is to note, more or less, how much water the respondent utilizes every time they water, what type(s) of water, and with what frequency. For example, '2 times a week, 10 minutes, tap water' or 'every day, 20 L, wash water only.' Please distinguish between water used outside the house (i.e. the street) and water used inside the house (i.e. for the yard).
Water street? Water inside the house?
How much water do you use every time you water?
Frequency?
type of water
(1) Do NOT read the options. IF they respondent says something else, mark 'Other' and note their response; (2) Show the respondent Visual 6 so that they can rate their desire for sewage.
B - Where do you go to the bathroom? pour-flush latrine
On a scale of 1 to 10 where 1 indicates its not important and 10 indicates I want it right now, What level of interest do you have for getting sewage?
Do you reuse wash water to flush your toilet?
(1) Only ask the respondent how they flush their toilet and how many times a day if the person has a toilet or a pour-flush latrine; (2) flushes per day only refers to the respondent, NOT to the entire family; (3) for the fact that many people can only flush their toilet during the short period in which water is arriving, do not forget to note not only how many L they use every time they flush, but also how many L the bucket is they use when there is no water in their toilet's tank.
How do you flush toilet N° flushes/day?
Do you have problems with water leaks? N° current
Dengue?
If the respondent says 'Yes,' go to question A (i.e. skip question B). If the respondent says 'No,' go to question B (i.e. skip question A).Do you have sewage in your house? Use question A Use question B
Do NOT read the options. IF they respondent says something else, mark 'Other' and note their response. A - Where does the sewage go? oxidation ponds
FOR EVERYONE - USES OF WATER
Please, write the most detailed you can the respondent's answer with respect to how they would use water if the service was more continuous AND why they do or do not want water meters.
Do you have sufficient water for all your needs?
Would you use more water if the service was more continuous?
Do you want the water service to utilize water meters?
Do you trust/have confidence that your water is safe to drink?
(1) Please write, as detailed as possible, the respondent's answer as to why they do or don't trust that their water is safe to drink; (2) Show the respondent Visual 6 so that they can rate the quality of their water (3) IF the respondent does not drink their tap water and only drinks bottled and/or well water, please make a note so that it is clear to me what water they are referring to and rating; (4) If the respondent has commentary about diarrhea or dengue, please write it on the sideOn a scale of 1 to 10, where 1 indicates its gross and 10 indicates its fantastic/tasty, How would you rate the quality of your water?
In general, Do you have problems with diarrhea in your house?
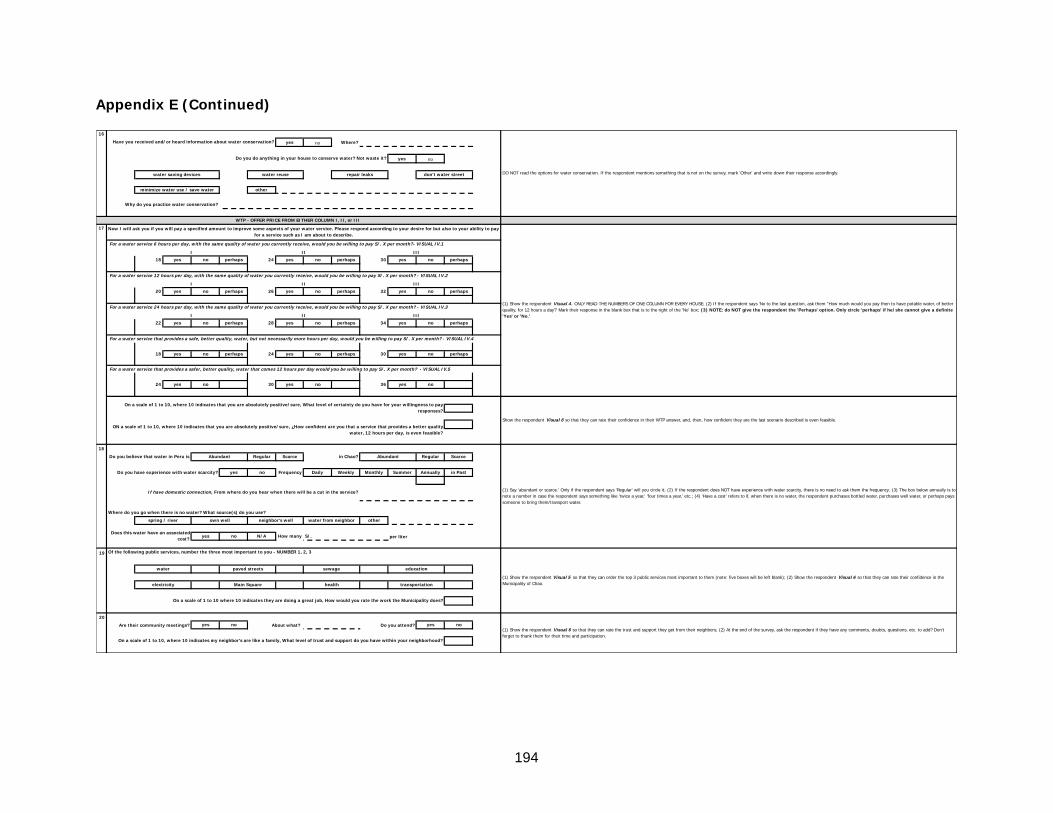
194
Appendix E (Continued)
16
yes no Where?
yes no
other
17
18 yes no perhaps 24 yes no perhaps 30 yes no perhaps
20 yes no perhaps 26 yes no perhaps 32 yes no perhaps
22 yes no perhaps 28 yes no perhaps 34 yes no perhaps
For a water service that provides a safe, better quality, water, but not necessarily more hours per day, would you be willing to pay S/. X per month? - VISUAL IV.4
18 yes no perhaps 24 yes no perhaps 30 yes no perhaps
For a water service that provides a safer, better quality, water that comes 12 hours per day would you be willing to pay S/. X per month? - VISUAL IV.5
24 yes no 30 yes no 36 yes no
18
Regular Scarce in Chao? Regular Scarce
yes no Frequency Daily Weekly Monthly Summer Annually in Past
other
yes no N/A How many S/. per liter
19
20
yes no yes no
health transportation
On a scale of 1 to 10 where 10 indicates they are doing a great job, How would you rate the work the Municipality does?
(1) Show the respondent Visual 6 so that they can rate the trust and support they get from their neighbors; (2) At the end of the survey, ask the respondent if they have any comments, doubts, questions, etc. to add? Don't forget to thank them for their time and participation.
Are their community meetings? About what? Do you attend?
On a scale of 1 to 10, where 10 indicates my neighbor's are like a family, What level of trust and support do you have within your neighborhood?
water from neighbor
Does this water have an associated cost?
Of the following public services, number the three most important to you - NUMBER 1, 2, 3
(1) Show the respondent Visual 5 so that they can order the top 3 public services most important to them (note: five boxes will be left blank); (2) Show the respondent Visual 6 so that they can rate their confidence in the Municipality of Chao.
water paved streets sewage education
electricity Main Square
(1) Say 'abundant or scarce.' Only if the respondent says 'Regular' will you circle it; (2) If the respondent does NOT have experience with water scarcity, there is no need to ask them the frequency; (3) The box below annually is to note a number in case the respondent says something like 'twice a year,' 'four times a year,' etc.; (4) 'Have a cost' refers to if, when there is no water, the respondent purchases bottled water, purchases well water, or perhaps pays someone to bring them/transport water.
Do you believe that water in Peru is Abundant Abundant
Do you have experience with water scarcity?
If have domestic connection, From where do you hear when there will be a cut in the service?
Where do you go when there is no water? What source(s) do you use?
spring / river own well neighbor's well
For a water service 24 hours per day, with the same quality of water you currently receive, would you be willing to pay S/. X per month? - VISUAL IV.3
I II III
On a scale of 1 to 10, where 10 indicates that you are absolutely positive/sure, What level of certainty do you have for your willingness to pay responses?
Show the respondent Visual 6 so that they can rate their confidence in their WTP answer, and, then, how confident they are the last scenario described is even feasible.ON a scale of 1 to 10, where 10 indicates that you are absolutely positive/sure, ¿How confident are you that a service that provides a better quality
water, 12 hours per day, is even feasible?
Now I will ask you if you will pay a specified amount to improve some aspects of your water service. Please respond according to your desire for but also to your ability to pay for a service such as I am about to describe.
(1) Show the respondent Visual 4. ONLY READ THE NUMBERS OF ONE COLUMN FOR EVERY HOUSE. (2) If the respondent says 'No to the last question, ask them "How much would you pay then to have potable water, of better quality, for 12 hours a day?' Mark their response in the blank box that is to the right of the 'No' box; (3) NOTE: do NOT give the respondent the 'Perhaps' option. Only circle 'perhaps' if he/she cannot give a definite 'Yes' or 'No.'
For a water service 6 hours per day, with the same quality of water you currently receive, would you be willing to pay S/. X per month?- VISUAL IV.1
I II III
For a water service 12 hours per day, with the same quality of water you currently receive, would you be willing to pay S/. X per month? - VISUAL IV.2
I II III
minimize water use / save water
Why do you practice water conservation?
WTP - OFFER PRICE FROM EITHER COLUMN I, II, or III
Have you received and/or heard information about water conservation?
DO NOT read the options for water conservation. If the respondent mentions something that is not on the survey, mark 'Other' and write down their response accordingly.
Do you do anything in your house to conserve water? Not waste it?
water saving devices water reuse repair leaks don't water street

195
Appendix E (Continued)
E.2 Spanish
FECHA / N° (17)
1
SECTOR: Manzana Lote N° Hombre Mujer Edad
2
Alquila Dueño S/.
rural urbano
costa sierra selva
tierra piso adobe estera ladrillo
Inquilinos
Niños ≤5 Adultos ≥18 Hombres Mujeres
3
Electricidad S/. Cable S/. Gas S/. Internet S/.
Celular S/. S/. Movilidad: S/.
Televisión Lavadora Cámara Refri. Licuadora
4
Kadena 100
La Exitosa Canal 7 Canal Visión (9)
Canal América
(4)La verdad La
industriaEl Satélite Trome Internet
5
Conexión domiciliara Rio/Puquio Acequia
6
Si No L
Por qué?
semanal mensual cada 3 mes anual nunca otro
7
no sabe no sabe
La caja bajo de 'anual' es para notar un número por si acaso el/la respondiente dice algo cómo "dos veces al año, cuatro veces al año" etc. Si tiene Rotoplas , ¿Con que frecuencia lávalo?
¿Cuántos litros de agua cree que consume su FAMILIA diariamente, PENSANDO en TODO los usos de higiene y cocinando hasta lavando la ropa y regando?
(1) Si tiene inquilinos, clarifica que la primera estima es sólo una estima de cuánto consume la FAMILIA; (2) Si el respondiente insiste que no tiene ningún idea, pídele por favor intenta a responder, sólo es una estima…en el siguiente pregunta el(la) puede decir que sólo tiene "2" de la certeza de la respuesta que le ha dado (3) Cuando el respondiente está haciendo su estima, recordarle que este total incluye TODO, no sólo agua para tomar, cocinar...debe pensar en cuánto utiliza para las actividades de lavar, higiene, limpiar, regar, etc. también. (4) Por el pregunta de escala, muéstrale al respondiente Visual 6 para ayudarle entender que implica un '1' en lugar de un '10.' Si el/la respondiente tiene dificultada comprendiendo la escala, toma el tiempo para explicarla otra vez y dale ejemplos. Es muy importante que él/ella entiende la escala porque aparecerá varias veces más durante la encuesta.
¿Los Inquilinos?
En una escala de 1 a 10, con 10 indicando que estás absolutamente cierto, ¿Qué nivel de certeza tiene por sus respuestas?
¿Cómo almacena su agua?
(1) Anota lo más detallado que puede, cuántos depósitos el/la respondiente tiene y el número de litros que abastece cada uno. Por ejemplo Tanque(s) - (1, 100 L) (1, 50 L); Tinas (2, 40 L) - 0 elevados - 2 tapados
Total N° de depósitos
¿cuántos elevados? ¿cuántos tapados?
¿Está planificando invertir en más depósitos como Rotoplas o cisterna? De cuántos litros?
¿Qué medio de información es el que MAS utiliza?
Si el respondiente menciona más de un medio de información, pregúntale otro vez, cual es el que MAS utiliza, SOLO MARCA UNA OPCIÓN. Por si acaso menciona algo que no está indicado, apúntalo en la última caja que es blanca; (2) Si el medio que más utiliza es 'Internet,' por favor en la caja blanca a la derecha, apuntar que sitio de red más frecuente visita.
AGUA
¿Qué fuentes de agua utiliza para abastecerse de agua? (1) Marca todos los fuentes que aplican según predominio (1=fuente principal; 2=siguiente más usado, etc....); (2) OJO sólo tiene que apuntar un número en las cajas de los fuentes que el respondiente utiliza; (3) Por si acaso el respondiente sólo menciona un fuente y no está pensando en el río, agua envasada, etc.. que a veces utiliza, pregunta de cada mencionada fuente para estar seguro antes de seguir adelante. Por ejemplo, puede preguntar al respondiente 'Nunca compra botellas de agua? Va al río a lavar o bañar?'
Pozo Propio
Pozo Vecino
Agua Envasada
¿De los siguientes servicios y artefactos, qué tiene?
(1) al lado de cada servicio, la primara caja es para escribir el número de años que el respondiente ha tenido el servicio, y la segunda caja es para apuntar cuánto el respondiente paga mensual para tenerlo el servicio; (2) si el respondiente no tiene el servicio mencionado, no tiene que marcar nada; (3) para "celular" la primera caja es para notar cuántos celulares en la familia, la segunda caja es para notar hace cuántos años el respondiente compró su primera celular (OJO, quiero saber cuánto tiempo en general el/la respondiente ha tenido este tecnología, no refiere necesariamente al modelo actual que el/la respondiente tiene), la última caja es para apuntar mas o menos cuánto el respondiente gasta para comprar saldo cada mes; (4) Por lo hecho que muy poca gente tiene Nextels y líneas fijas, los dos comparte una caja. Entonces, si el respondiente tiene uno de estos servicios, pone un círculo alrededor de lo que tiene para que sabré cómo entrar la información (5) la línea puntada al lado de "movilidad" es para notar que tipo de movilidad (carro, mototaxi, etc.) el respondiente tiene, en la segunda caja apunta cuántos años el/la respondiente ha tenido, y en la tercera caja, apunta cuánto gasta para mantener y comprar combustible por mes (6) si la familia tiene refrigerador, por lo hecho que muchas familias tienen pero no utilizan, pregunta al respondiente si su refri está enchufado todo el tiempo. Si el/la respondiente no utiliza todo el tiempo, apunta '1/2.'
Nextel / Fijo
Computadora
¿Qué artefactos esta pensando comprar en el próximo año?
(1) CÓDIGOS --- Ningún = N; Jardín = J; Primaria = P; Primaria Incompleta = PI; Secundaria = S; Secundaria Incompleta = SI; Técnico = T; Universitario (superior) = U….. (2) La primera caja es dónde apunta la educación de la persona que está encuestando; (3) La segunda caja corresponde a la educación de la persona que gana lo más por la casa (puede ser esposo, hijo mayor, etc....) (4) La tercera caja es la educación más superior en la casa. Por ejemplo, si la educación mayor en la casa es de una juventud que ha completado colegio, marca 'S.'
Educación de respondiente Educación del ganador principal Educación más superior de la casa
Ocupación(es) - Ingresos Mensuales (S/.) # Beneficiaros Otros Ingresos # Beneficiaros
(1) Si el respondiente vacila, repita que todo es confidencial (2) Distingue entre obrero (trabaja para empresa) y agricultor (propio terreno). (3) Otros ingresos refiere de apoyo de familiares que viven en otros lados, si de vez en cuando se vende marcianos, animales, si tiene apoyo del gobierno, Alquila cuartos, etc.; (4) Si una de los ingresos no está compartido con todo la familia, apuntalo el # de beneficiarios en la tercera columna. Esta columna está en itálica porque no tiene que apuntar ningún número si el ingreso está compartido entre todos los integrantes.
Área (m2)
N° Habitaciones N° Integrantes N° que paran en la casa durante día
Marca cuántos en cada categoría de edad y división entre mujer y hombre. Si la casa tiene inquilinos, sólo tiene que notar las características de la familia.Juventud 5<x<18
N° 17 refiere a que columna va a utilizar para pregunta #17. Recuerde que la primera encuesta que hace va a usar columna "I," la segunda encuesta, columna "II," la tercera encuesta, columna "III," la cuatra encuesta, columna "I,"….sigue II, III, I, II, III, etc....en otras palabras cada casa sólo sería ofrecido los precios de una de las columnas, dónde Columna # I es la secuencia S/.18, 20, 22, 18, hasta S/. 24; Columna # II = S/. 24, 26, 28, 24, hasta S/. 30; y Columna # III es la secuencia S/.30, 32, 34, 30, hasta S/. 36.
Nombre Encuestador
No tiene que preguntar por la manzana y lote; si puede, nótalo cuando está esperando. Si la manzana y lote no están indicados en la puerta o caja de luz, marca la dirección de la casa (número y calle).
CARACTERÍSTICA DE LA VIVIENDA
(1) Sólo tiene que notar el costo mensual de la casa si la persona que está encuestando es un aquilante. Si el precio de alquilar incluye agua, luz, etc., no olvida apuntarlo en la línea puntada; (2) N° años Chao urbano aplica a todos los años que la persona ha vivido en Chao o Nuevo Chao (áreas urbanos); (3) Si la persona ha vivido en Chao por más de 20 años, no es necesario preguntarle la características de su vivienda antes de venir a Chao, *Por los que ha vivido en Chao por menos de 20 años, apuntar si antes vivía en 1) un área urbano o rural, Y 2) si proviene de la costa, sierra o de la selva. (4) N° años en casa actual implica la duración que la persona ha vivido en la vivienda dónde está encuestándole; (5) Habitaciones implica todos los espacios que son separados (6) área de propiedad incluye todo el terreno, no sólo la casa; (7) Si el respondiente tiene tierra Y piso EN LA CASA (no refiere al corral), pone un circulo alrededor de lo que es la mayoría, el mismo con respecto a materiales de la casa (adobe, estera, y/o ladrillo); (8) Integrantes implica todos que son familiares (9) # que paran en la casa implica que debe apuntar el # de todos que, mayormente, están permanente en la casa durante todo el día. Por ejemplo, si el papá, el hijo mayor, y inquilinos siempre están trabajando, no se cuentan
Si alquila, ¿costo mensual y qué incluye?
N° años Chao urbano Características de su vivienda antes de venir a Chao Urbano: 1)
(de dónde proviene) 2)
N° años casa actual
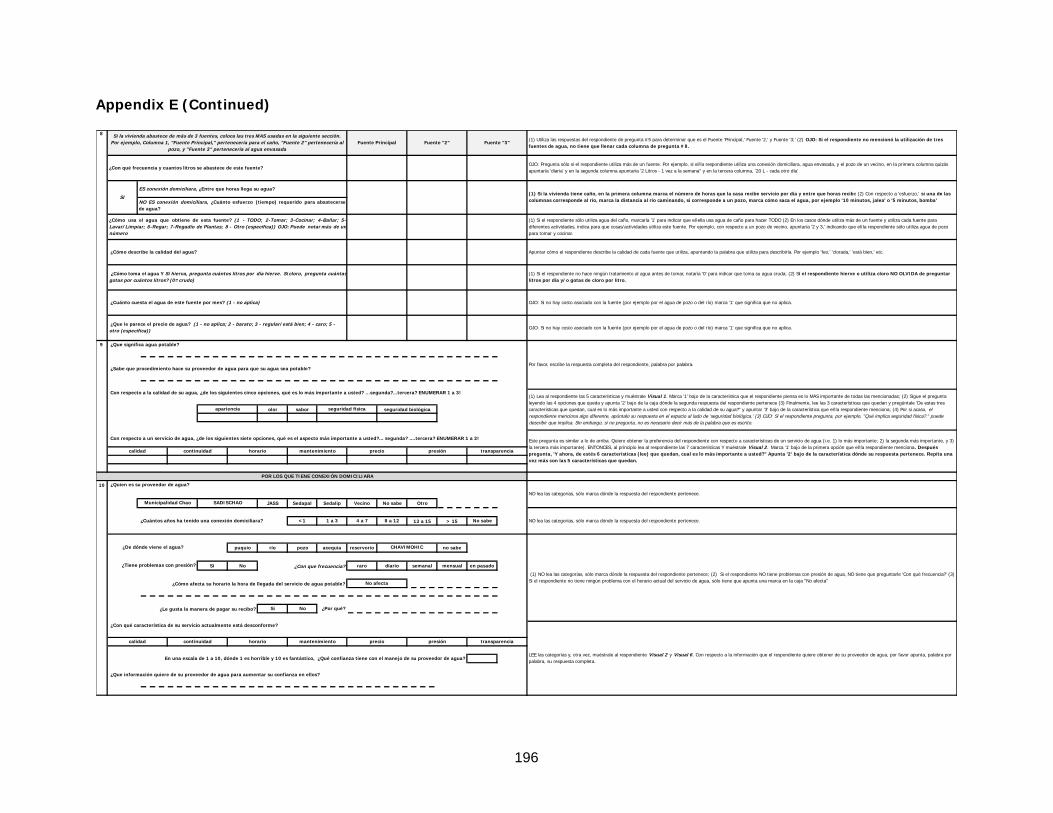
196
Appendix E (Continued)
8(1) Utiliza las respuestas del respondiente de pregunta #5 para determinar que es el Fuente 'Principal,' Fuente '2,' y Fuente '3;' (2) OJO: Si el respondiente no mencionó la utilización de tres fuentes de agua, no tiene que llenar cada columna de pregunta #8.
9
olor sabor
10
JASS Sedapal Sedalip Vecino No sabe Otro
¿Cuántos años ha tenido una conexión domiciliara? <1 1 a 3 4 a 7 8 a 12 13 a 15 > 15 No sabe
puquio río pozo acequia reservorio no sabe
Si No raro diario semanal mensual en pasado
Si No ¿Por qué?
¿Con qué característica de su servicio actualmente está desconforme?
¿Que información quiere de su proveedor de agua para aumentar su confianza en ellos?
LEE las categorías y, otra vez, muéstrale al respondiente Visual 2 y Visual 6. Con respecto a la información que el respondiente quiere obtener de su proveedor de agua, por favor apunta, palabra por palabra, su respuesta completa.
calidad continuidad horario mantenimiento precio presión transparencia
En una escala de 1 a 10, dónde 1 es horrible y 10 es fantástico, ¿Qué confianza tiene con el manejo de su proveedor de agua?
NO lea las categorías, sólo marca dónde la respuesta del respondiente pertenece.
¿De dónde viene el agua?
(1) NO lea las categorías, sólo marca dónde la respuesta del respondiente pertenece; (2) Si el respondiente NO tiene problemas con presión de agua, NO tiene que preguntarle 'Con qué frecuencia?' (3) Si el respondiente no tiene ningún problema con el horario actual del servicio de agua, sólo tiene que apunta una marca en la caja "No afecta"
CHAVIMOHIC
¿Tiene problemas con presión? ¿Con que frecuencia?
¿Cómo afecta su horario la hora de llegada del servicio de agua potable? No afecta
¿Le gusta la manera de pagar su recibo?
POR LOS QUE TIENE CONEXIÓN DOMICILIARA
¿Quien es su proveedor de agua?
NO lea las categorías, sólo marca dónde la respuesta del respondiente pertenece.
Municipalidad Chao SADISCHAO
Con respecto a un servicio de agua, ¿de los siguientes siete opciones, qué es el aspecto más importante a usted?... segunda? ….tercera? ENUMERAR 1 a 3! Este pregunta es similar a lo de arriba. Quiero obtener la preferencia del respondiente con respecto a características de un servicio de agua (i.e. 1) lo más importante; 2) la segunda más importante, y 3) la tercera más importante). ENTONCES, al principio lea al respondiente las 7 características Y muéstrale Visual 2. Marca '1' bajo de la primera opción que el/la respondiente menciona . Después pregunta, 'Y ahora, de estés 6 características (lee) que quedan, cual es lo más importante a usted?" Apunta '2' bajo de la característica dónde su respuesta pertenece. Repita una vez más con las 5 características que quedan.
calidad continuidad horario mantenimiento precio presión transparencia
Con respecto a la calidad de su agua, ¿de los siguientes cinco opciones, qué es lo más importante a usted? …segunda?...tercera? ENUMERAR 1 a 3!(1) Lea al respondiente las 5 características y muéstrale Visual 1. Marca '1' bajo de la característica que el respondiente piensa es lo MAS importante de todas las mencionadas; (2) Sigue el pregunta leyendo las 4 opciones que queda y apunta '2' bajo de la caja dónde la segunda respuesta del respondiente pertenece (3) Finalmente, lee las 3 características que quedan y pregúntale 'De estas tres características que quedan, cual es lo más importante a usted con respecto a la calidad de su agua?" y apuntar '3' bajo de la característica que el/la respondiente menciona; (4) Por si acaso, el respondiente menciona algo diferente, apúntalo su respuesta en el espacio al lado de 'seguridad biológica.' (3) OJO: Si el respondiente pregunta, por ejemplo, "Qué implica seguridad física?." puede describir que implica. Sin embargo, si no pregunta, no es necesario decir más de la palabra que es escrito.
apariencia seguridad física seguridad biológica
¿Cuánto cuesta el agua de este fuente por mes? (1 - no aplica) OJO: Si no hay costo asociado con la fuente (por ejemplo por el agua de pozo o del río) marca '1' que significa que no aplica.
¿Que le parece el precio de agua? (1 - no aplica; 2 - barato; 3 - regular/está bien; 4 - caro; 5 - otro (especifica)) OJO: Si no hay costo asociado con la fuente (por ejemplo por el agua de pozo o del río) marca '1' que significa que no aplica.
¿Que significa agua potable?
Por favor, escribe la respuesta completa del respondiente, palabra por palabra. ¿Sabe que procedimiento hace su proveedor de agua para que su agua sea potable?
¿Cómo usa el agua que obtiene de esta fuente? (1 - TODO; 2-Tomar; 3-Cocinar; 4-Bañar; 5-Lavar/Limpiar; 6-Regar; 7-Regadío de Plantas; 8 - Otro (especifica)) OJO: Puede notar más de unnúmero
(1) Si el respondiente sólo utiliza agua del caño, marcaría '1' para indicar que el/ella usa agua de caño para hacer TODO (2) En los casos dónde utiliza más de un fuente y utiliza cada fuente para diferentes actividades, indica para que cosas/actividades utiliza este fuente. Por ejemplo, con respecto a un pozo de vecino, apuntaría '2 y 3,' indicando que el/la respondiente sólo utiliza agua de pozo para tomar y cocinar.
¿Cómo describe la calidad del agua? Apuntar cómo el respondiente describe la calidad de cada fuente que utiliza, apuntando la palabra que utiliza para describirla. Por ejemplo 'feo,' 'clorada,' 'está bien,' etc.
¿Cómo toma el agua Y Si hierva, pregunta cuántos litros por día hierve. Si cloro, pregunta cuántasgotas por cuántos litros? (0=crudo)
(1) Si el respondiente no hace ningún tratamiento al agua antes de tomar, notaría '0' para indicar que toma su agua cruda; (2) Si el respondiente hierve o utiliza cloro NO OLVIDA de preguntar litros por día y/o gotas de cloro por litro.
SI
ES conexión domiciliara, ¿Entre que horas llega su agua?(1) Si la vivienda tiene caño, en la primera columna marca el número de horas que la casa recibe servicio por día y entre que horas recibe (2) Con respecto a 'esfuerzo,' si una de las columnas corresponde al río, marca la distancia al río caminando, si corresponde a un pozo, marca cómo saca el agua, por ejemplo '10 minutos, jalea' o '5 minutos, bomba'NO ES conexión domiciliara, ¿Cuánto esfuerzo (tiempo) requerido para abastecerse
de agua?
Si la vivienda abastece de más de 3 fuentes, coloca las tres MAS usadas en la siguiente sección. Por ejemplo, Columna 1, "Fuente Principal," pertenecería para el caño, "Fuente 2" pertenecería al
pozo, y "Fuente 3" pertenecería al agua envasadaFuente Principal Fuente "2" Fuente "3"
¿Con qué frecuencia y cuantos litros se abastece de este fuente?OJO: Pregunta sólo si el respondiente utiliza más de un fuente. Por ejemplo, si el/la respondiente utiliza una conexión domiciliara, agua envasada, y el pozo de un vecino, en la primera columna quizás apuntaría 'diaria' y en la segunda columna apuntaría '2 Litros - 1 vez a la semana" y en la tercera columna, '20 L - cada otro día'

197
Appendix E (Continued)
11
Si No
Si No ¿Cómo?
Si No ¿Por qué?
Si No ¿Por qué?
Si No Si No
12
Si No
acequia río abajo no sabe otro
campo rio pozo ciego otro
13 ¿Cuántos
salidas de agua? duchas? inodoros? nunca a veces siempre
palanca L balde L ¿descargas al día
si no
14
balde ducha río L invierno? L
si no si no ¿Cómo riega? manguera balde
L o M ¿Por qué riega? n/a
potable de pozo de acequia de lavar otro
L no sabe
cocinar? trapear? L
L
L por día N° Mascotas L por día
¿Cuántos litros de agua pura tomaría al día?
≤0.5 0.5< x ≤1 1< x ≤2 2< x ≤3 >3 ≤0.5 0.5< x ≤1 1< x ≤2 2< x ≤3 >3
Cocinar Tomar Higiene Limpiar Lavar Ropa Regar
¿Por qué tiene o no tiene plantas?
N° Animales
¿Cuántos litros de agua en otra forma de bebida toma al día?
Este número de Litros de agua por día sólo refiere a lo que toma el/la respondiente (i.e. NO a todo la familia). 'Agua pura' implica agua mismo. 'Agua en otra forma' significa té, café, limonada, etc.
De las siguientes 6 categorías, puede enumerar según la cantidad que utiliza, con "1" indicando que este actividad requiere la más agua - ENUMERAR 1 a 6!
Muéstrale al respondiente Visual 3. Después, el/la respondiente calificaría las categorías/actividades 1 al 6, dónde 1 indica que esta categoría utiliza lo más agua y 6 indica que esta actividad utiliza lo menos agua.
(1) Pregunta al respondiente que por favor estima cuántos litros utiliza cada vez que lava la ropa. Por favor, si él/ella dice 'no sabe,' ayúdale estimar, preguntando 'cuántos tinas llena, de qué tamaño, etc.' hasta que él/ella pueda estimar. Si todavía dice que no sabe, Ud. puede marcar 'No Sabe.'; (2) OJO: Por el pregunta de frecuencia de trapear y regar plantas puede utilizar los códigos D (diario), S (1 vez semanal), 2S (2 veces a la semana), 3S (3 veces a la semana), etc.; (3) Por el pregunta de 'tipo de agua,' puede utilizar los códigos DC (potable), P (pozo), R (agua de lavar, bañar, etc.), y A (agua de acequia); (4) Por la sección de animalitos y mascotas, la primera caja es para notar el número de animales y/o mascotas, y la segunda caja es dónde apuntar el número de litros el respondiente estima que da a todos los animalitos y/o mascotas por día.
¿Cuántos veces a la semana lava la ropa? Estima cuánto utiliza cada vez que lava la ropa?
¿Cuántos veces al mes lava la ropa en el río?
¿Cuántos litros por frecuencia? tipo de agua
N° personas regar plantas?
(1) Por lo hecho que muchas familias sólo pueden utilizar sus duchas cuando está llegando el agua, pone círculo alrededor de todas las maneras el/la respondiente utiliza para bañar 2) Si él/ella no puede estimar cuántos litros utiliza cada vez que baña en la ducha, pone número de minutos (M) que el caño está abierto; (3) Si la persona sólo baña en el río, no es necesario estimar cuántos minutos y litros que él/ella utiliza cada vez
¿Cómo se baña? ¿Veces por día en verano?
(1) Similar a los otros secciones, si el respondiente a veces utiliza balde y la manguera para regar, pone círculo alrededor de los dos. (2) Lo más importante parte aquí es averiguar, más o menos, cuánto agua el/la respondiente utiliza cada vez que riega, que tipo(s) de agua utiliza, y la frecuencia. Por ejemplo, '2 veces a la semana, 10 M (minutos), agua potable (P)' o 'cada día, 20 L (litros), agua lavada (R)'. Por favor distingue entre agua utilizada afuera de la casa (i.e. para la calle) y agua utilizada adentro de la casa (i.e. para el corral).
¿Regarse la calle? ¿Regarse adentro de la casa?
Estimar cuánto agua utiliza cada día que riega
Frecuencia
tipo de agua
(1) NO lea las opciones. Si el respondiente dice otra cosa, apúntala al lado de 'Otro.' (2) Muéstrale al respondiente Visual 6 para que él/ella pueda calificar la su deseo por el desagüe.
B - ¿Dónde hace sus necesidades? letrina de arrastre con agua
En una escala de 1 a 10, con 1 indicando que no le importa y 10 indicando que quiere con prisa, ¿qué nivel de interés tiene por desagüe?
Utiliza agua de lavar para descargar su inodoro?
(1) Sólo pregunta de cómo descarga y cuántos descargas por día si el/la respondiente tiene inodoro o baño de arrastre; (2) las descargas por día refiere sólo al respondiente, NO a todo la familia (3) por lo hecho que muchos sólo pueden descargar sus inodoros al momento que está llegando el agua, no deja de olvidar de notar los L utilizados por la palanca Y cuando tenga que usar un balde. ¿Cómo descarga su inodoro?
¿Tiene problemas con fugas de agua? ¿ N° actual? ¿ N° en el pasado?
¿casos de dengue?
SI el respondiente responde "Si" usa pregunta A, Si el respondiente responde "No" usa pregunta B¿La casa tiene alcantarillado? utiliza A utiliza B
NO lea las opciones. Si el respondiente dice otra cosa, apúntala al lado de 'Otro.'A - ¿A dónde va el agua de alcantarillado? pozos de oxidación
PARA TODOS - USOS DE AGUA
Por favor, escribe lo más detallado que puede la respuesta del respondiente con respecto a cómo usaría agua si el servicio fuera más continuo y porque quiere (o no quiere) medidores.
¿Tiene suficiente agua para todo sus necesidades?
¿Usaría más agua si fuera más continuo?
¿Quiere que el servicio de agua utiliza medidores?
¿Tiene confianza que su agua es segura para tomar?
(1) Por favor, escribe lo más detallado que puede la respuesta del respondiente con respecto a si tiene confianza que su agua es segura para tomar; (2) Muéstrale al respondiente Visual 6 para que él/ella pueda calificar la calidad du su agua; (3) SI el/la respondiente no toma el agua del caño (i.e. sólo toma agua envasada o del pozo), por favor, escribe un mensaje para que entiende perfectamente que agua él/ella está pensando en; (4) Si el respondiente hace un comento con respecto al diarrea y/o dengue, por favor apunta al lado del pregunta su comentario.En una escala de 1 a 10, con 1 indicando que está feo y 10 indicando que está rico, ¿Cómo lo califica la calidad de su agua?
En general, ¿tiene problemas con diarrea en su casa?

198
Appendix E (Continued)
15
desagüe corral calle acequia río plantas otro
16
Si No ¿Dónde?
Si No
otro
17
18 Si No Quizás 24 Si No Quizás 30 Si No Quizás
¿Por un servicio de agua de 12 horas por día, con la misma calidad que está ahora, estaría dispuesto a pagar S/. X mensual? - VISUAL IV.2
20 Si No Quizás 26 Si No Quizás 32 Si No Quizás
22 Si No Quizás 28 Si No Quizás 34 Si No Quizás
¿Para un servicio que provee agua segura, pero no necesariamente más horas por día, sería dispuesto pagar S/. X mensual? - VISUAL IV.4
18 Si No Quizás 24 Si No Quizás 30 Si No Quizás
¿Para un servicio de agua segura, de mejor calidad, que viene también por 12 horas por día, sería dispuesto pagar S/. X mensual? - VISUAL IV.5
24 Si No 30 Si No 36 Si No
18
Regular Escaza en Chao? Regular Escaza
Si No Frecuencia Diario Semanal Mensual Verano Anual Pasado
¿A dónde va usted cuando no hay agua? ¿Qué fuente(s) utiliza(n)?
otro
Si No N/A Cuánto? S/. por litro
19
20
Si No ¿Asiste? Si No
transporte
En una escala de 1 a 10, con 10 indicando que hace buenazo trabajo, ¿Qué nivel de confianza tiene con las obras que hace la Municipalidad?
(1) Muéstrele al respondiente Visual 6 para que él/ella pueda calificar su confianza con su vecinos; (2) Al fin de encuesta pregunta al respondiente si tiene unas comentarios, dudas, preguntas, etc. No olvida de darle muchas gracias por su tiempo y participación.
¿Hay reuniones comunitarias? ¿Qué temas tratan?
En una escala de 1 a 10, con 10 indicando que sus vecinos son como familia, ¿Qué nivel de confianza y apoyo tiene con su comunidad?
¿Este agua tiene un costo?
De los siguientes servicios públicos, enumera según importancia lo TRES más importante a usted - ENUMERAR 1, 2, 3
(1) Muéstrale al respondiente Visual 5 para que el/la respondiente pueda enumerar los 3 servicios más importantes para ellos (ojo: deja las otras 5 cajas blanco); (2) Muéstrele al respondiente Visual 6 para que él/ella pueda calificar su confianza en la Municipalidad de Chao.
agua calles asfaltadas desagüe educación
luz plaza de armas salud
(1) Diga 'abundante O escasez . Sólo si el respondiente diga 'regular,' apuntalo; (2) Si el respondiente responde 'No' tiene experiencia de escasez de agua, no es necesario preguntarle la frecuencia; (3) La caja bajo de 'anual' es para notar un número por si acaso el/la respondiente dice algo cómo "dos veces al año, cuatro veces al año" etc.; (4) "Tiene un costo" refiere a, cuando no hay agua, el respondiente compra agua envasada, compra agua de pozo, o quizás paga a alguien para traer/transportar agua a su casa.
¿Cree que el agua en Perú es: Abundante Abundante
¿Tiene experiencia con escasez de agua?
Si tiene conexión domiciliara, ¿por cual medio recibe la información de que no habrá servicio de agua?
puquio / río propio pozo pozo de vecino agua de vecino
I II III
Muéstrale al respondiente Visual 6 para que él/ella pueda calificar su confianza en sus respuestas y, después, su confianza que el último escenario es posible.
En una escala de 1 a 10, con 10 indicando que estás absolutamente cierto, ¿Qué nivel de certeza tiene por sus voluntad de pago respuestas?
En una escala de 1 a 10, con 10 indicando que estás absolutamente seguro, ¿Cuánto confianza tiene que un servicio de 12 horas por día de mejora calidad cómo he descrito sería posible e implementado?
Ahora le preguntaré si pagaría un monte específico para mejorar aspectos de su servicio de agua. Por favor, responde según su deseo y disponibilidad para implementar un servicio de agua así.
(1) Muéstrale Visual 4. SOLO LEA LOS NÚMEROS DE UNA COLUMNA PARA CADA CASA. (2) Si el respondiente dice "No" al último pregunta, pregúntale 'Entonces, cuanto pagaría para tener agua más segura, de mejor calidad, que viene 12 horas por día?' Marca el precio que el respondiente dice en la caja blanca al la derecha de la caja 'No.' (3) OJO: NO le da al respondiente la opción de 'Quizás.' Solo apunta 'quizás' si él/ella no quiere hacer una decisión por nada y dice esto en vez de 'Si' o 'No.'
¿Por un servicio de agua de 6 horas por día, con la misma calidad que está ahora, estaría dispuesto a pagar S/. X mensual? - VISUAL IV.1
I II III
I II III
¿Por un servicio de agua de 24 horas por día, con la misma calidad que está ahora, estaría dispuesto a pagar S/. X mensual? - VISUAL IV.3
ahorro en el uso de agua
¿Por qué practica conservación de agua?
WTP - OFRECER PRECIO DE COLUMNA I, II, o III
¿Dónde va el agua de su ducha y lavatorios? - MARCA TODOS No lea las opciones. Pone círculos alrededor de TODAS las destinaciones de agua "gris" que el/la respondiente menciona.tanque séptico
¿Ha recibido/escuchado información sobre conservación de agua?
NO lea las opciones de reúso. Si el respondiente menciona una práctica que no está, marca 'Otro' y apunta su comentario.
¿Practica alguna manera de conservar el agua en su casa? (para no despedirse de agua)?
artefactos de conservación reúso de agua reparar fugas de agua no regar la calle
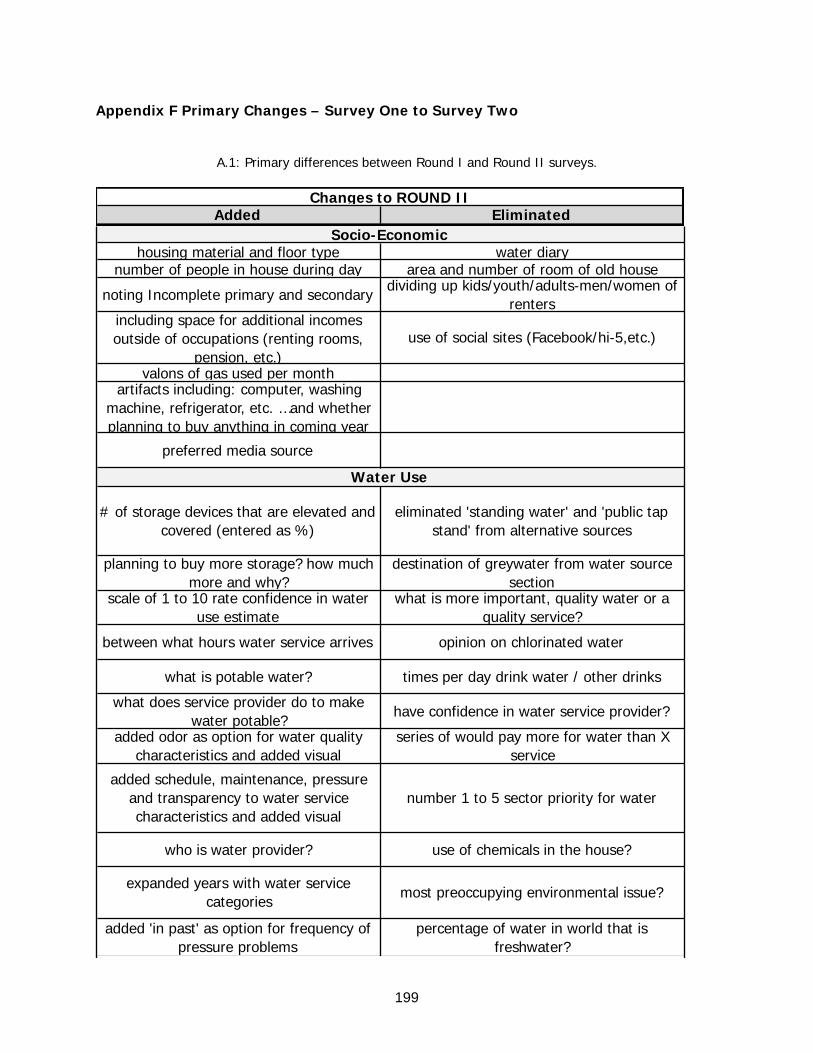
199
Appendix F Primary Changes – Survey One to Survey Two
A.1: Primary differences between Round I and Round II surveys.
Added Eliminated
housing material and floor type water diarynumber of people in house during day area and number of room of old house
noting Incomplete primary and secondarydividing up kids/youth/adults-men/women of
rentersincluding space for additional incomes outside of occupations (renting rooms,
pension, etc.)use of social sites (Facebook/hi-5,etc.)
valons of gas used per monthartifacts including: computer, washing
machine, refrigerator, etc. …and whether planning to buy anything in coming year
preferred media source
# of storage devices that are elevated and covered (entered as %)
eliminated 'standing water' and 'public tap stand' from alternative sources
planning to buy more storage? how much more and why?
destination of greywater from water source section
scale of 1 to 10 rate confidence in water use estimate
what is more important, quality water or a quality service?
between what hours water service arrives opinion on chlorinated water
what is potable water? times per day drink water / other drinks
what does service provider do to make water potable?
have confidence in water service provider?
added odor as option for water quality characteristics and added visual
series of would pay more for water than X service
added schedule, maintenance, pressure and transparency to water service characteristics and added visual
number 1 to 5 sector priority for water
who is water provider? use of chemicals in the house?
expanded years with water service categories
most preoccupying environmental issue?
added 'in past' as option for frequency of pressure problems
percentage of water in world that is freshwater?
Changes to ROUND II
Water Use
Socio-Economic

200
Appendix F (Continued)
Table A.1: (Continued).
have enough water for needs? get along with neighbors?
use more water if more continuous? how do perceive organization in your community?
hour of arrival affect daily schedule confidence water is safe to drink?
rate safety of water on scale of 1 to 10 rate performance of water service
provider on scale of 1 to 10
what characteristic of current service would most like to change?
what information would you like from water service provider to increase
confidence?
do you want the water service to use meters and why?
like the way pay bill and why? cases of diarrhea and dengue
what type of water to flush toilet rate on scale of 1 to 10 desire for sewage
liters cooking (per household per day) liters mopping, frequency, water type liters for plants, frequency, water type
why have or don't have plants? liters per day of animals/pets
number 1 to 5 water required for activities
why practice water conservation? received and/or heard information on
water conservation?
adjusted WTP section - scenarios and prices
confidence in WTP answers confidence in provider's ability to
implement described WTP scenarios
what alternative water source turn to when run out of water?
top 3 (of 8) public service projects? community meetings and attendance
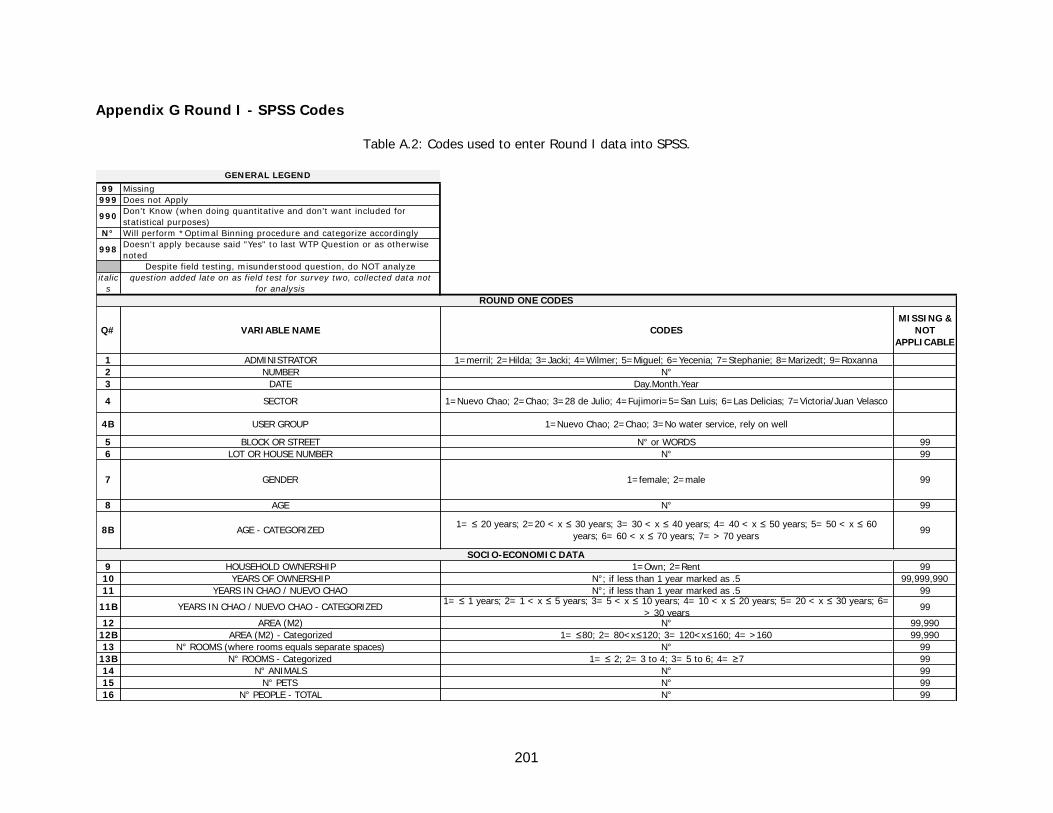
201
Appendix G Round I - SPSS Codes
Table A.2: Codes used to enter Round I data into SPSS.
99 Missing999 Does not Apply
990 Don't Know (when doing quantitative and don't want included for statistical purposes)
N° Will perform *Optimal Binning procedure and categorize accordingly
998 Doesn't apply because said "Yes" to last WTP Question or as otherwise noted
Despite field testing, misunderstood question, do NOT analyzeitalic
squestion added late on as field test for survey two, collected data not
for analysis
Q# VARIABLE NAME CODESMISSING &
NOT APPLICABLE
1 ADMINISTRATOR 1=merril; 2=Hilda; 3=Jacki; 4=Wilmer; 5=Miguel; 6=Yecenia; 7=Stephanie; 8=Marizedt; 9=Roxanna2 NUMBER N°3 DATE Day.Month.Year
4 SECTOR 1=Nuevo Chao; 2=Chao; 3=28 de Julio; 4=Fujimori=5=San Luis; 6=Las Delicias; 7=Victoria/Juan Velasco
4B USER GROUP 1=Nuevo Chao; 2=Chao; 3=No water service, rely on well
5 BLOCK OR STREET N° or WORDS 996 LOT OR HOUSE NUMBER N° 99
7 GENDER 1=female; 2=male 99
8 AGE N° 99
8B AGE - CATEGORIZED1= ≤ 20 years; 2=20 < x ≤ 30 years; 3= 30 < x ≤ 40 years; 4= 40 < x ≤ 50 years; 5= 50 < x ≤ 60
years; 6= 60 < x ≤ 70 years; 7= > 70 years99
9 HOUSEHOLD OWNERSHIP 1=Own; 2=Rent 9910 YEARS OF OWNERSHIP N°; if less than 1 year marked as .5 99,999,99011 YEARS IN CHAO / NUEVO CHAO N°; if less than 1 year marked as .5 99
11B YEARS IN CHAO / NUEVO CHAO - CATEGORIZED1= ≤ 1 years; 2= 1 < x ≤ 5 years; 3= 5 < x ≤ 10 years; 4= 10 < x ≤ 20 years; 5= 20 < x ≤ 30 years; 6=
> 30 years99
12 AREA (M2) N° 99,99012B AREA (M2) - Categorized 1= ≤80; 2= 80<x≤120; 3= 120<x≤160; 4= >160 99,99013 N° ROOMS (where rooms equals separate spaces) N° 99
13B N° ROOMS - Categorized 1= ≤ 2; 2= 3 to 4; 3= 5 to 6; 4= ≥7 9914 N° ANIMALS N° 9915 N° PETS N° 9916 N° PEOPLE - TOTAL N° 99
ROUND ONE CODES
GENERAL LEGEND
SOCIO-ECONOMIC DATA

202
Appendix G (Continued)
Table A.2: (Continued)
17 N° PEOPLE - FAMILY N° 9918 N° PEOPLE - RENTERS N° (where 0 means no renters) 9919 HOUSE BEFORE LOCATION - 1 1=Coast; 2=Mountain; 3=Jungle 9920 HOUSE BEFORE LOCATION- 2 1=Rural; 2=Urban 9921 N° ADULTS ≤18 N°, enter 0 if zero 9922 N° YOUTH 5<X≤18 N°, enter 0 if zero 9923 N° KIDS ≤5 N°, enter 0 if zero 9924 N° WOMEN N°, enter 0 if zero 9925 N° MEN N°, enter 0 if zero 9926 N° NONE N°, enter 0 if zero 9927 N° KINDERGARTEN N°, enter 0 if zero 9928 N° ELEMENTARY N°, enter 0 if zero 9929 N° MIDDLE/HIGH N°, enter 0 if zero 9930 N° UNIVERSITY N°, enter 0 if zero 9931 N° TECHNICAL TRAINING N°, enter 0 if zero 99
32 EDUCATION RESPONDENT 1=University; 2=Technical; 3=Secondary; 4=Primary; 5=Kindergarten; 6=None 99
33 HIGHEST EDUCATION MARKED (ASSUME HEAD OF HOUSEHOLD) 1=University; 2=Technical; 3=Secondary; 4=Primary; 5=Kindergarten; 6=None 99
34 N° INCOME EARNERS N° 99
35 PRINCIPAL OCCUPATION
1=Agriculture-owner; 2=Agriculture worker; 3=Technical; 4=Business Owner; 5=Commercial Employee; 6=Healthcare; 7=Education; 8=Artisan; 9=Outside support from family; 10=Outside support from
government; 11=Security / Watches over House; 12=Transport (driver); 13=Construction; 14=Rent Rooms/Property; 15=mining; 16=fishing; 17=ministry; 18=Government
99
36 TOTAL REPORTED MONTHLY INCOME N° 99,990
36B TOTAL REPORTED MONTHLY INCOME - Categorized1= ≤600 Nuevos Soles; 2= 600<x≤1000 Nuevos Soles; 3=1000<x≤1400 Nuevos Soles; 4= >1400 Nuevos
Soles99,990
37A ELECTRICITY - Y/N 1=Yes; 2=No37 ELECTRICITY - TIME WITH SERVICE IF YES, enter years with service, with 99=didn't fill in, 0.5=<1 year and IF DON'T HAVE (No)=0 9938 MONTHLY ELECTRIC BILL N° 99,999
39A CELL PHONES - Y/N 1=Yes; 2=No39 CELL PHONES - TIME WITH SERVICE IF YES, enter years with service, with 99=didn't fill in, 0.5=<1 year and IF DON'T HAVE (No)=0 9940 N° CELL PHONES N° 99,999,99041 S/. ADDED A MONTH N° (0 implies only have cellphone for receiving calls, don't buy saldo (minutes)) 99,999,990
42A LANDLINE - Y/N 1=Yes; 2=No42 LANDLINE - TIME WITH SERVICE IF YES, enter years with service, with 99=didn't fill in, 0.5=<1 year and IF DON'T HAVE (No)=0 9943 MONTHLY LANDLINE BILL N° 99,999,990
44A CABLE - Y/N 1=Yes; 2=No44 CABLE - TIME WITH SERVICE IF YES, enter years with service, with 99=didn't fill in, 0.5=<1 year and IF DON'T HAVE (No)=0 9945 MONTHLY CABLE BILL N° 99,999,990
46A NEXTEL - Y/N 1=Yes; 2=No46 NEXTEL - TIME WITH SERVICE IF YES, enter years with service, with 99=didn't fill in, 0.5=<1 year and IF DON'T HAVE (No)=0 9947 MONTHLY NEXTEL BILL N°, where 990=Business pays 99,999,990
48A INTERNET - Y/N 1=Yes; 2=No48 INTERNET - TIME WITH SERVICE IF YES, enter years with service, with 99=didn't fill in, 0.5=<1 year and IF DON'T HAVE (No)=0 9949 MONTHLY INTERNET BILL N° 99,999,990

203
Appendix G (Continued)
Table A.2: (Continued)
50 TRANSPORTATION - TIME WITH SERVICE IF YES, enter years with service, with 99=didn't fill in, 0.5=<1 year and IF DON'T HAVE (No)=0 9951 MONTHLY SPENT GAS/MAINTENANCE N° 99,999,99052 SOCIAL NETWORK? 0=NONE; 1=Facebook; 2=Hi5; 3=email; 4 = two or more 99
53 PRIMARY SOURCE 1=Tap; 2=Well; 3=Bottled Water; 4=River/Spring; 5=Canal; 6=Public Tap Stand 9954 SECONDARY SOURCE 1=Tap; 2=Well; 3=Bottled Water; 4=River/Spring; 5=Canal; 6=Public Tap Stand 99,99955 TERTIARY SOURCE 1=Tap; 2=Well; 3=Bottled Water; 4=River/Spring; 5=Canal; 6=Public Tap Stand 99,99956 TAP 1=Yes; 2=No 9957 HOUSEHOLD WELL 1=Yes; 2=No 9958 NEIGHBORS WELL 1=Yes; 2=No 9959 RIVER/SPRING 1=Yes; 2=No 9960 CANAL 1=Yes; 2=No 9961 BOTTLED WATER 1=Yes; 2=No 99
62 USES TAP WATER1=Everything; 2=Cooking; 3=Drinking; 4=Bathing; 5=Watering; 6=Cleaning and Washing; 7=Cooking and Drinking; 8=Cooking and Bathing; 9=Bathing and Cleaning; 10=Everything (but only when other sources
not available); 11=Have but Don't Use99,999
63 USES WELL WATER1=Everything; 2=Cooking; 3=Drinking; 4=Bathing; 5=Watering; 6=Cleaning and Washing; 7=Cooking and Drinking; 8=Cooking and Bathing; 9=Bathing and Cleaning; 10=Everything (but only when other sources
not available); 11=Have but Don't Use99,999
64 USES RIVER/SPRING1=Everything; 2=Cooking; 3=Drinking; 4=Bathing; 5=Watering; 6=Cleaning and Washing; 7=Cooking and Drinking; 8=Cooking and Bathing; 9=Bathing and Cleaning; 10=Everything (but only when other sources
not available); 11=Have but Don't Use99,999
65 USES CANAL1=Everything; 2=Cooking; 3=Drinking; 4=Bathing; 5=Watering; 6=Cleaning and Washing; 7=Cooking and Drinking; 8=Cooking and Bathing; 9=Bathing and Cleaning; 10=Everything (but only when other sources
not available); 11=Have but Don't Use99,999
66 USES BOTTLED WATER1=Everything; 2=Cooking; 3=Drinking; 4=Bathing; 5=Watering; 6=Cleaning and Washing; 7=Cooking and Drinking; 8=Cooking and Bathing; 9=Bathing and Cleaning; 10=Everything (but only when other sources
not available); 11=Have but Don't Use99,999
67 WHEN USE FAUCET1=All the time; 2=Weekly; 3=Monthly; 4=A few months a year; 5=Only when primary source isn't
available99,999
68 WHEN USE HOUSEHOLD WELL1=All the time; 2=Weekly; 3=Monthly; 4=A few months a year; 5=Only when the primary source isn't
available99,999
69 WHEN USE NEIGHBOR'S WELL1=All the time; 2=Weekly; 3=Monthly; 4=A few months a year; 5=Only when the primary source isn't
available99,999
70 WHEN USE RIVER/SPRING1=All the time; 2=Weekly; 3=Monthly; 4=A few months a year; 5=Only when the primary source isn't
available99,999
71 WHEN USE CANAL1=All the time; 2=Weekly; 3=Monthly; 4=A few months a year; 5=Only when the primary source isn't
available99,999
72 WHEN USE BOTTLED WATER1=All the time; 2=Weekly; 3=Monthly; 4=A few months a year; 5=Only when the primary source isn't
available99,999
73 HOURS TAP
1= ≤30 minutes; 2= 30<x<1 hour; 3= 1<x≤2 hours; 4= 2<x≤3 hours; 5= 3<x≤6 hours; 6= 6<x≤12 hours; 7= 24 hours; 8= ≤30 minutes *every other day; 9= 30<x≤1 hour *every other day; 10= 1<x≤2 hours *every other day; 11= 2<x≤3 hours *every other day; 12= 3<x≤6 hours *every other day; 13=
6<x≤12 hours
99,999
74 TIME TO RETRIEVE WELL WATER 1= <5 minutes; 2= 5<x≤10 minutes; 3= 10<x≤30 minutes; 4=30<x≤60 minutes; 5= >1 hour 99,99975 TIME TO RETRIEVE/USE RIVER WATER 1= <5 minutes; 2= 5<x≤10 minutes; 3= 10<x≤30 minutes; 4=30<x≤60 minutes; 5= >1 hour 99,999
WATER
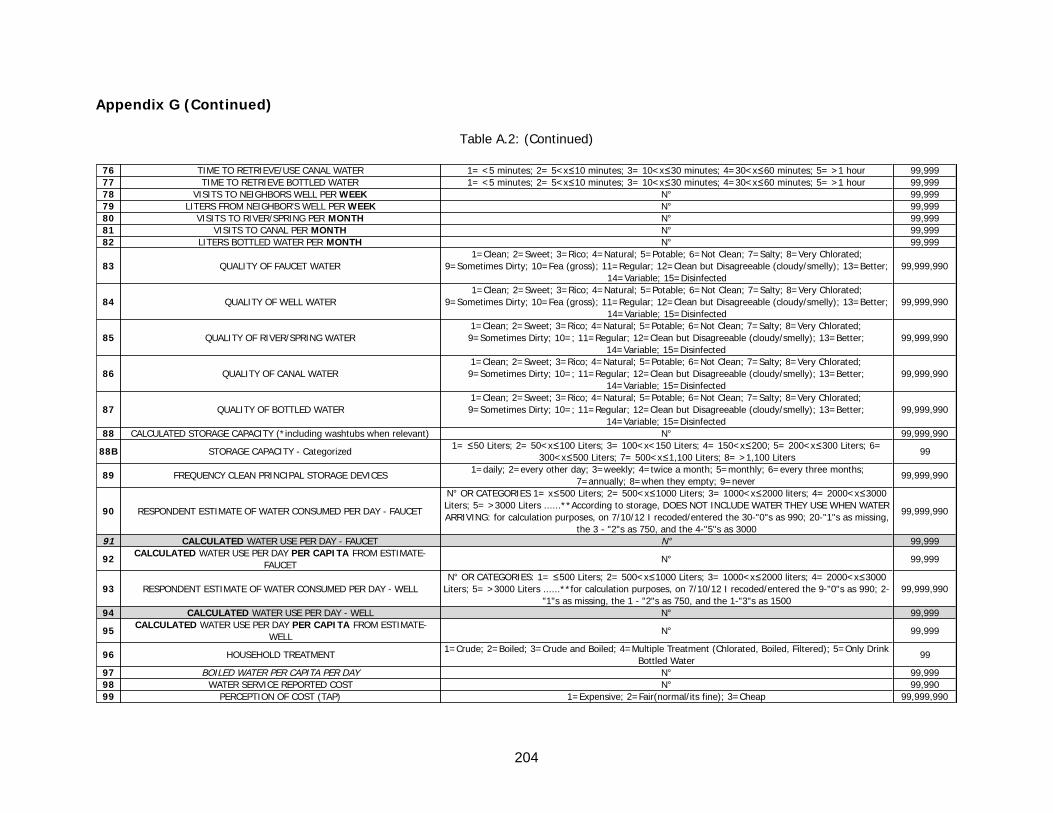
204
Appendix G (Continued)
Table A.2: (Continued)
76 TIME TO RETRIEVE/USE CANAL WATER 1= <5 minutes; 2= 5<x≤10 minutes; 3= 10<x≤30 minutes; 4=30<x≤60 minutes; 5= >1 hour 99,99977 TIME TO RETRIEVE BOTTLED WATER 1= <5 minutes; 2= 5<x≤10 minutes; 3= 10<x≤30 minutes; 4=30<x≤60 minutes; 5= >1 hour 99,99978 VISITS TO NEIGHBORS WELL PER WEEK N° 99,99979 LITERS FROM NEIGHBOR'S WELL PER WEEK N° 99,99980 VISITS TO RIVER/SPRING PER MONTH N° 99,99981 VISITS TO CANAL PER MONTH N° 99,99982 LITERS BOTTLED WATER PER MONTH N° 99,999
83 QUALITY OF FAUCET WATER1=Clean; 2=Sweet; 3=Rico; 4=Natural; 5=Potable; 6=Not Clean; 7=Salty; 8=Very Chlorated;
9=Sometimes Dirty; 10=Fea (gross); 11=Regular; 12=Clean but Disagreeable (cloudy/smelly); 13=Better; 14=Variable; 15=Disinfected
99,999,990
84 QUALITY OF WELL WATER1=Clean; 2=Sweet; 3=Rico; 4=Natural; 5=Potable; 6=Not Clean; 7=Salty; 8=Very Chlorated;
9=Sometimes Dirty; 10=Fea (gross); 11=Regular; 12=Clean but Disagreeable (cloudy/smelly); 13=Better; 14=Variable; 15=Disinfected
99,999,990
85 QUALITY OF RIVER/SPRING WATER1=Clean; 2=Sweet; 3=Rico; 4=Natural; 5=Potable; 6=Not Clean; 7=Salty; 8=Very Chlorated; 9=Sometimes Dirty; 10=; 11=Regular; 12=Clean but Disagreeable (cloudy/smelly); 13=Better;
14=Variable; 15=Disinfected99,999,990
86 QUALITY OF CANAL WATER 1=Clean; 2=Sweet; 3=Rico; 4=Natural; 5=Potable; 6=Not Clean; 7=Salty; 8=Very Chlorated; 9=Sometimes Dirty; 10=; 11=Regular; 12=Clean but Disagreeable (cloudy/smelly); 13=Better;
14=Variable; 15=Disinfected99,999,990
87 QUALITY OF BOTTLED WATER1=Clean; 2=Sweet; 3=Rico; 4=Natural; 5=Potable; 6=Not Clean; 7=Salty; 8=Very Chlorated; 9=Sometimes Dirty; 10=; 11=Regular; 12=Clean but Disagreeable (cloudy/smelly); 13=Better;
14=Variable; 15=Disinfected99,999,990
88 CALCULATED STORAGE CAPACITY (*including washtubs when relevant) N° 99,999,990
88B STORAGE CAPACITY - Categorized1= ≤50 Liters; 2= 50<x≤100 Liters; 3= 100<x<150 Liters; 4= 150<x≤200; 5= 200<x≤300 Liters; 6=
300<x≤500 Liters; 7= 500<x≤1,100 Liters; 8= >1,100 Liters99
89 FREQUENCY CLEAN PRINCIPAL STORAGE DEVICES 1=daily; 2=every other day; 3=weekly; 4=twice a month; 5=monthly; 6=every three months;
7=annually; 8=when they empty; 9=never99,999,990
90 RESPONDENT ESTIMATE OF WATER CONSUMED PER DAY - FAUCET
N° OR CATEGORIES 1= x≤500 Liters; 2= 500<x≤1000 Liters; 3= 1000<x≤2000 liters; 4= 2000<x≤3000 Liters; 5= >3000 Liters ......**According to storage, DOES NOT INCLUDE WATER THEY USE WHEN WATER ARRIVING: for calculation purposes, on 7/10/12 I recoded/entered the 30-"0"s as 990; 20-"1"s as missing,
the 3 - "2"s as 750, and the 4-"5"s as 3000
99,999,990
91 CALCULATED WATER USE PER DAY - FAUCET N° 99,999
92 CALCULATED WATER USE PER DAY PER CAPITA FROM ESTIMATE- FAUCET
N° 99,999
93 RESPONDENT ESTIMATE OF WATER CONSUMED PER DAY - WELLN° OR CATEGORIES: 1= ≤500 Liters; 2= 500<x≤1000 Liters; 3= 1000<x≤2000 liters; 4= 2000<x≤3000
Liters; 5= >3000 Liters ......**for calculation purposes, on 7/10/12 I recoded/entered the 9-"0"s as 990; 2-"1"s as missing, the 1 - "2"s as 750, and the 1-"3"s as 1500
99,999,990
94 CALCULATED WATER USE PER DAY - WELL N° 99,999
95 CALCULATED WATER USE PER DAY PER CAPITA FROM ESTIMATE- WELL
N° 99,999
96 HOUSEHOLD TREATMENT1=Crude; 2=Boiled; 3=Crude and Boiled; 4=Multiple Treatment (Chlorated, Boiled, Filtered); 5=Only Drink
Bottled Water99
97 BOILED WATER PER CAPITA PER DAY N° 99,99998 WATER SERVICE REPORTED COST N° 99,99099 PERCEPTION OF COST (TAP) 1=Expensive; 2=Fair(normal/its fine); 3=Cheap 99,999,990

205
Appendix G (Continued)
Table A.2: (Continued)
100 WATER SERVICE ACTUAL COST 0=0; 1=3.20; 2=10; 3=12; 4=15.30; 5=20 (commercial A); 6=other; 7=Included in Rent 99,990101 BOTTLED WATER COST PER MONTH N° (in this case DON'T put 0 if don't buy, simply code 999) 99,999102 PERCEPTION OF COST (BOTTLED WATER) 0=don't know; 1=Expensive; 2=Fair(normal/its fine); 3=cheap 99,999103 QUALITY WATER VS. QUALITY SERVICE 1=Quality of Water; 2=Quality of Service; 3=Answered both 99,990104 MOST IMPORTANT FACTOR IN QUALITY OF WATER 1=Taste; 2=Appearance; 3=Physical Quality; 4=Biological Quality; 5=marked 2 or more 99,990105 MOST IMPORTANT FACTOR FOR QUALITY WATER SERVICE 1 - Quality; 2 - Continuity; 3 - Price 99,990106 TASTE - CHLORINATED WATER 1= Agreeable; 2=Disagreeable; 3=normal; 4=disagreeable but important 99,990107 N° LITERS WATER DAILY 0=0; 1= <0.5 L; 2= 0.5<x≤1 L; 3= 1<x<≤2 L; 4= 2<x≤3 L; 5= >3 L; 6=Once in a While 6,99108 N° LITERS OTHER LIQUIDS DAILY 0=0; 1= <0.5 L; 2= 0.5<x≤1 L; 3= 1<x<≤2 L; 4= 2<x≤3 L; 5= >3 L; 6=Once in a While 6,99109 TIME WITH SERVICE 1= <1 year; 2=1 to 3 years; 3= 4 to 7 years; 4= >7 years 99,999,990110 ESTIMATED LITERS PER MINUTE 990=Don’t Know; 1= ≤1; 2= 1<x≤5; 3= 5<x≤10; 4= 10<x≤20; 5= >20 99,999
111 ORIGIN OF WATER0=Don't Know; 1=Spring; 2=River; 3=Well; 4=Reservoir; 5=CHAVIMOCHIC; 6=name of place (where 998
means wrote other (filtration, canal, tubes, SADISCHAO)99,999,998
112 PRESSURE PROBLEMS 1=Yes; 2=No 99,999113 FREQUENCY OF PRESSURE PROBLEMS 1=Rarely; 2=Daily; 3=Weekly; 4=Monthly; 5=Once in a While 99,999114 CONFIDENCE IN WATER PROVIDER 1=Yes; 2=No; 3=neither bad nor good 3,99,999115 WHY CONFIDENCE OR NO CONFIDENCE WORDS 999,99
115B WHY CONFIDENCE - Categorized
1=All Around Good Service-Trust; 2=Know Providers/Operators-Good Communication; 3=Treated and Maintained-Good Quality; 4=Daily, Continuous, Consistent-Sufficient Quantity; 5=Bad Service, Rob Money-NO Trust; 6=Don't Know Provider/Operator-Bad Communication; 7=Don't Treat and Maintain-Poor Quality;
8=Bad Schedule, Service Interruptions-NOT Sufficient; 9=Only Service-What Else Going to Do?
99,999,990
116 PRIORITY - ELECTRICITY 1=Yes; 2=No; 3=depends on if service of water was improved 99,999,990117 PRIORITY - CABLE 1=Yes; 2=No; 3=depends on if service of water was improved 99,999,990118 PRIORITY - INTERNET 1=Yes; 2=No; 3=depends on if service of water was improved 99,999,990119 PRIORITY - COMMUNICATION (CELLPHONE/LANDLINE) 1=Yes; 2=No; 3=depends on if service of water was improved 99,999,990120 PRIORITY - NEXTEL 1=Yes; 2=No; 3=depends on if service of water was improved 99,999,990121 PRIORITY - PERSONAL TRANSPORTATION 1=Yes; 2=No; 3=depends on if service of water was improved 99,999,990122 MOST IMPORTANT - 1 1=Agriculture; 2=Environment; 3=Commercial; 4=Domestic; 5=Industry 99,990123 SECOND MOST IMPORTANT 1=Agriculture; 2=Environment; 3=Commercial; 4=Domestic; 5=Industry 99,990124 THIRD MOST IMPORTANT 1=Agriculture; 2=Environment; 3=Commercial; 4=Domestic; 5=Industry 99,990125 FOURTH 1=Agriculture; 2=Environment; 3=Commercial; 4=Domestic; 5=Industry 99,990126 FIFTH 1=Agriculture; 2=Environment; 3=Commercial; 4=Domestic; 5=Industry 99,990127 N° FAUCETS N° - 0=don't have 99128 N° SHOWERS N° - 0=don't have 99
129 N° TOILETSN° - (where pour flush latrines are counted as they utilize water); 0 = use pit latrine or fields; 10 = have
toilet but only flushes when the water is arriving (aka, predominantly flushed with bucket); 11=have toilet but only flushed with bucket
99
129B N° TOILETS (to Match Round II codes) N° - where pour flush latrines are counted as they utilize water 99
130 LITERS TO FLUSH (BUCKET OR TANK) N°, where 90=broken 99,999,990131 FLUSHES PER DAY PER CAPITA N°, where 90=broken 99,999,990132 N° KNOWN LEAKS N° 999,99133 SEWAGE? 1=Yes; 2=No 99134 SEWAGE DESTINATION? 0=Don't Know; 1=Oxidation Ponds; 2=Canal; 3=River; 4=Ocean; 5="Down there"; 6="tubes/matrix" 99,999135 SANITATION ALTERNATIVE (to Match Round II codes) 1=pit latrine; 2=pour-flush latrine; 3=fields/river 99,999

206
Appendix G (Continued)
Table A.2: (Continued)
136 BLACKWATER DESTINATION 0=sewage; 1=septic pit; 2=ground (hole); 3=fields and river 99,999137 HOW BATHE 1=buckets; 2=shower; 3=buckets and shower (shower only works when water is arriving); 4=river 99138 N° - SUMMER N° where 0.5=every other day; 0.15=once a week; 998=bathe in river 99,998139 N° - WINTER N° where 0.5=every other day; 0.15=once a week; 998=bathe in river 99,998140 N° MINUTES - SHOWER N° 99,999,990141 N° LITERS - BUCKETS N° 99,999,990
142 CALCULATED - TOTAL LITERS TO BATHE PER CAPITA PER DAY - SUMMER
N° - ONLY CALCULATED FOR THOSE WHO ESTIMATED LITERS FROM BUCKET BATHS….DUE TO VARYING WATER PRESSURE, CANNOT CALCULATE HOW MUCH WATER IS USED IN AN X MINUTE SHOWER; 999
when bathed in river99,999
142B LITERS BATHING PER CAPITA PER DAY - SUMMER - Categorized
1= ≤10 Liters; 2= 10<x≤20 Liters; 3= 20<x≤30 Liters; 4= 30<x≤40 Liters; 5= 40<x≤50 Liters; 6= 50<x≤60 Liters; 7= 60<x≤100 Liters; 8= >100 Liters
99,999
143 CALCULATED - TOTAL LITERS TO BATHE PER CAPITA PER DAY - WINTERN° - ONLY CALCULATED FOR THOSE WHO ESTIMATED LITERS FROM BUCKET BATHS….DUE TO VARYING WATER PRESSURE, CANNOT CALCULATE HOW MUCH WATER IS USED IN AN X MINUTE SHOWER; 999-
when bathed in river99,999
143 B LITERS BATHING PER CAPITA PER DAY - SUMMER - Categorized
1= ≤10 Liters; 2= 10<x≤20 Liters; 3= 20<x≤30 Liters; 4= 30<x≤40 Liters; 5= 40<x≤50 Liters; 6= 50<x≤60 Liters; 7= 60<x≤100 Liters; 8= >100 Liters
99,999
144 WASH PLATES PER DAY N°, where 999=don't wash plates 99,999145 LITERS PER DISH WASH N°, where 0=don't know 99146 WASH HANDS PER DAY N° where 990=means gave qualitative response (see 146B below) 99146
B WASH HANDS PER DAY (QUALITATIVE, NO # WAS REPORTED) 1=Many Times; 2=Every Moment 99,999
147 LITERS PER HAND WASH N° 99,990148 BRUSH TEETH PER DAY N°, where 0=don't brush teeth 99,990149 LITERS PER TOOTHBRUSHING N° 99,999,990150 LITERS PER COOKING PER DAY N° (not per capita as in Round II…started to note almost near end just as a trial for Round II) 99151 LITERS PER CLEANING FLOOR PER DAY N° where 0=don't clean floor (similar to cooking, started to note almost near end as trial for Round II) 99
152 LITERS PER CLEANING PER DAY N° where 0=doesn't clean (doesn't have furniture) (similar to cooking and cleaning floor, started to note almost near end as a trial for Round II) 99
153 WATER STREET/OUTSIDE? (DAY) - DOES NOT INCLUDE PLANTS 0=don't water; 1=once a day; 2=twice a day; 3=three times a day; 4=every other day; 5=twice a week; 6=once a week; 50=every moment; 7=once in a while 99
153B WATER STREET/OUTSIDE - Y/N (to match Round II) 1=Yes; 2=No 99
154 WATER TYPE - STREET 1=Tap Water; 2=Well Water; 3=Washwater; 4=Tap and Washwater; 5=Well and Washwater; 6=Canal water 99,999
155 LITERS USED OUTSIDE PER WEEK N° - LITERS (where 998 means gave in minutes (#155B), since 999 means don't water) 99,999,998155
B LITERS USED OUTSIDE PER WEEK - Categorized 1= ≤20 Liters; 2= 20<x≤60 Liters; 3= 60<x≤100 Liters; 4= 100<x≤200 Liters; 5= 200<x≤300 Liters; 6= 300<x≤400 Liters; 7= 400<x≤500 Liter; 8= >500 Liters
99,999,998
155.C MINUTES WITH HOSE OUTSIDE PER WEEK N° - MINUTES (where 998 means gave in Liters (#155), since 999 means don't water) 99,999,998
156 WATER INSIDE? (DAY) 0=don't water; 1=once a day; 2=twice a day; 3=three times a day; 4=every other day; 5=twice a week; 6=once a week; 50=every moment; 7=once in a while 99
156B WATER INSIDE? - Y/N (to match Round II) 1=Yes; 2=No 99
157 WATER TYPE - INSIDE 1=Tap Water; 2=Well Water; 3=Washwater; 4=Tap and Washwater; 5=Well and Washwater; 6=Canal water 999,99

207
Appendix G (Continued)
Table A.2: (Continued)
158 LITERS USED INSIDE PER WEEK N° OR 50= gave in minutes 99,999,998158
B LITERS USED OUTSIDE PER WEEK - Categorized 1= ≤20 Liters; 2= 20<x≤60 Liters; 3= 60<x≤100 Liters; 4= 100<x≤200 Liters; 5= 200<x≤300 Liters; 6= 300<x≤400 Liters; 7= 400<x≤500 Liter; 8= >500 Liters
99,999,998
158C MINUTES WITH HOSE INSIDE PER WEEK N° OR 998= gave in liters 99,999,998
159 N° TIMES WASH CLOTHES PER WEEK N° where 0=don't wash (send elsewhere); 0.5=every other week 0,99160 LITERS USED PER LOAD N° where 0 implies that they wash clothes in river or canal 99,990161 CAC - N° LITERS WASH CLOTHES PER WEEK N° where 0 implies that they wash clothes in river or canal 99162 HYDROCHLORIC ACID 1=Yes; 2=No 99163 BLEACH 1=Yes; 2=No 99164 CAUSTIC SODA 1=Yes; 2=No 99165 DETERGENT (Ace, Ariel, Bolivar, Ayudín) 1=Yes; 2=No 99166 LEMON 1=Yes; 2=No 99167 VINEGAR 1=Yes; 2=No 99168 OTHER -Additional Cleaning Agents Mentioned - QUALITATIVE WORDS 99168
B OTHER - CODED 1=Don't Use Anything; 2=water (sometimes in addition to other chemicals, sometimes as itself "pure"); 3=Broom / Take Out Trash; 4= Ash; 5=Poet / Pinesol / Room Freshener; 6=Creso
999
169 WATER CONSERVATION 1=Yes; 2=No 99,990170 WATER CONSERVATION EXAMPLE WORDS 99,999
170B WATER CONSERVATION EXAMPLE - Categorized
1=Use Bare Minimum/Conserve Water/Don't Waste; 2= Boil / Add Chlorine (Treat) Water; 3=Cover Water (so kids/bugs don't dirty it); 4=Don't Water Street; 5=Reuse Water (washwater for street, old water for
laundry, etc.); 6=Close Faucets; 7=Install Water Conserving Artifacts; 8=Repair Leaks; 9=Not Possible/Not Enough Water; 10=No Need and/or Have Well
99,999
171 WTP - 24/7 - I 1=Yes; 2=No 9992, 9993172 WTP - QUALITY - I 1=Yes; 2=No 9992, 9993173 WTP - BOTH - I 1=Yes; 2=No 9992, 9993174 WTP - SEWAGE - I 1=Yes; 2=No 9992, 9993175 WTP - ALL - I 1=Yes; 2=No 9992, 9993176 WTP - OPINION - I N° 99,999,998177 WTP - 24/7 - II 1=Yes; 2=No 9991, 9993178 WTP - QUALITY - II 1=Yes; 2=No 9991, 9993179 WTP - BOTH - II 1=Yes; 2=No 9991, 9993180 WTP - SEWAGE - II 1=Yes; 2=No 9991, 9993181 WTP - ALL - II 1=Yes; 2=No 9991, 9993182 WTP - OPINION - II N° 99,999,998183 WTP - 24/7 - III 1=Yes; 2=No 9991, 9992184 WTP - QUALITY - III 1=Yes; 2=No 9991, 9992185 WTP - BOTH - III 1=Yes; 2=No 9991, 9992186 WTP - SEWAGE - III 1=Yes; 2=No 9991, 9992187 WTP - ALL - III 1=Yes; 2=No 9991, 9992188 WTP - OPINION - III N° 99,999,998189 WATER SCARCITY IN PERU 0=Don’t Know; 1=Abundant; 2=Scarce; 3=Regular (neither one nor the other) 99190 WATER SCARCITY IN CHAO 0=Don’t Know; 1=Abundant; 2=Scarce; 3=Regular (neither one nor the other) 99
WILLINGNESS TO PAY

208
Appendix G (Continued)
Table A.2: (Continued)
191 EXPERIENCE WITH WATER SCARCITY 1=Yes; 2=No 99
192 FREQUENCY1=Daily; 2=A few times a week; 3=Weekly; 4=Monthly; 5=Summer; 6=once a year; 7=a few times per
year; 8=in the past99,999,990
193 ENVIRONMENTAL PROBLEMS WORDS (additional issues mentioned, in order they were mentioned) 99
194 ENVIRONMENTAL PROBLEMS - PROMPTED
0=Don't Know; 1=Contamination of Water; 2=Natural Resource Exploitation; 3=Water Scarcity; 4=Contamination of Air; 5=Unplanned Urban Development; 6=Overfishing; 7=Endangered Species;
8=Improper Disposal of Toxins; 9=Desertification; 10=Soil Erosion; 11=Deforestation; 12=Climate Change; 13=Contaminated Air and Water
999
195 CLIMATE CHANGE IN PERU 0=Don't Know; 1=Yes; 2=No 99196 CLIMATE CHANGE IN CHAO 0=Don't Know; 1=Yes; 2=No 99197 ADDITIONAL COMMENT ON CLIMATE CHANGE WORDS 999
198 FRESH WATER - CATEGORY %0=Don't understand percentages; 1= ≤10%; 2= 10<x≤30%; 3= 30<x≤60%; 4= 60<x≤80%; 5= >80% ;
50XX where XX = the actual % they gave0,99
198B FRESH WATER - NUMERICAL ESTIMATE (%) For when instead marking a category, enumerator wrote down respondent's numerical estimate (%) 999
199 FRESH WATER - MODIFIED 0=don't know; 1=A Little; 2=Regular; 3=A Lot 99,999200 NEIGHBORS 1=Yes; 2=Regular; 3=No 99201 ORGANIZATION 0=don't know; 1=Good; 2=Regular; 3=Bad 99202 ADDITIONAL COMMENTS / POINTS OF INTEREST WORDS 99203 RENTERS PAY PER MONTH N° 99204 # IN HOUSE PER DAY N° 99
205 GREYWATER DESTINATION0=sewage; 1=street; 2=pit latrine; 3=inside house (corral); 4=canal; 5=septic tank; 6=street and sewage;
7= street and pit latrine; 8= street and inside house; 9=street and canal; 10=street and septic tank; 11=sewage and inside house
99
206 MENTION OF PLANT WATERING 1=Yes; 2=No 99
207 WATER TYPE - PLANTS1=Tap Water; 2=Well Water; 3=Washwater; 4=Tap and Washwater; 5=Well and Washwater; 6=Canal /
River water 99,999208 LITERS LAUNDRY PER CAPITA PER WEEK208
B LITERS LAUNDRY PER CAPITA PER WEEK - Categorized0=Only wash clothes in River; 1= ≤20 liters; 2= 20<x≤40 Liters; 3= 40<x≤60 Liters; 4= 60<x≤80
Liters; 5 = 80<x≤100 Liters; 6= >100 Liters

209
Appendix H Round II – SPSS Codes
Table A.3: Codes used to enter Round II data into SPSS.
99 Missing999 Does not Apply
990Don't Know (when doing quantitative and don't want included for statistical purposes)
N° Will perform *Optimal Binning procedure and categorize accordingly
998 Doesn't apply because said "Yes" to last WTP Question or as otherwise noted
Despite field testing, misunderstood question, do NOT analyze
Q# VARIABLE NAME CODESMISSING &
NOT APPLICABLE
0 ID N°1 ADMINISTRATOR 1=merril; 2=margarita; 3=Melchora; 4=Deysi; 5=Eduardo; 6=Gilberto; 7=Santos2 NUMBER N° 9993 DATE Month.Day.Year
4 SECTOR 1=Nuevo Chao; 2=Chao; 3=28 de Julio; 4=Alberto Fujimori; 5=San Luis; 6=Las Delicias; 7=La Victoria/Juan Velasco
4B GROUP 1=Nuevo Chao; 2=Chao; 3=No water service, rely on well
5 BLOCK OR STREET N° or WORDS 996 LOT OR HOUSE NUMBER N° 99
7 GENDER 1=female; 2=male 99
8 AGE N° 99
8B AGE - CATEGORIZED1= ≤20 years; 2= 20<x≤30 years; 3= 30<x≤40 years; 4= 40<x≤50 years; 5= 50<x≤60 years; 6=
60<x≤70 years; 7= >70 years99
9 HOUSEHOLD OWNERSHIP 1=Own; 2=Rent 9910 MONTHLY RENT N° 99,99911 WHAT INCLUDES WORDS 99,99912 YEARS IN CHAO / NUEVO CHAO N°; if less than 1 year marked as .5 99
12B YEARS IN CHAO / NUEVO CHAO - Categorized 1= ≤1 years; 2= 1<x≤5 years; 3= 5<x≤10 years; 4= 10<x≤20 years; 5= 20<x≤30 years; 6= >30 years 99
13 HOUSE BEFORE LOCATION - 1 1=Coast; 2=Mountain; 3=Jungle 9914 HOUSE BEFORE LOCATION- 2 1=Rural; 2=Urban 9915 YEARS IN CURRENT HOUSE N° 9916 AREA (METERS SQUARED) N° 99,990
16B AREA (M2) - Categorized 1= ≤80; 2= 80<x≤120; 3= 120<x≤160; 4= >160 99,99017 FLOOR TYPE 1=dirt; 2=tile/cement 9918 WALL MATERIAL 1=adobe; 2=straw; 3=brick; 4=wood 9919 N° ROOMS (where rooms equals separate, utilized, spaces) N° 99
19B N° ROOMS - Categorized 1= ≤2; 2= 3 to 4; 3= 5 to 6; 4= ≥7 99
GENERAL LEGEND
SOCIO ECONOMIC DATA
ROUND TWO CODES

210
Appendix H (Continued)
Table A.3: (Continued).
20 N° PEOPLE - FAMILY N° 9921 N° PEOPLE - RENTERS N°, where 0=no renters 99,99922 N° PEOPLE - TOTAL N° (add Family + Renters) 9923 N° PEOPLE - HOUSE DURING DAY N° (only family) 9924 N° ADULTS ≤18 N°, enter 0 if zero 9925 N° YOUTH 5<X≤18 N°, enter 0 if zero 9926 N° KIDS ≤5 N°, enter 0 if zero 9927 N° WOMEN N°, enter 0 if zero 9928 N° MEN N°, enter 0 if zero 99
29 EDUCATION RESPONDENT1=University; 2=Technical; 3=Secondary; 4=Incomplete Secondary; 5=Primary; 6=Incomplete Primary;
7=Kindergarten; 8=None99
30 EDUCATION OF PRINCIPAL WAGE EARNER1=University; 2=Technical; 3=Secondary; 4=Incomplete Secondary; 5=Primary; 6=Incomplete Primary;
7=Kindergarten; 8=None99
31 HIGHEST EDUCATION IN HOUSEHOLD1=University; 2=Technical; 3=Secondary; 4=Incomplete Secondary; 5=Primary; 6=Incomplete Primary;
7=Kindergarten; 8=None99
32 N° INCOME EARNERS N° 99
33 PRINCIPAL OCCUPATION
1=Agriculture-owner; 2=Agriculture worker; 3=Technical; 4=Business Owner; 5=Commercial Employee; 6=Healthcare; 7=Education; 8=Artisan; 9=Outside support from family; 10=Outside support from
government; 11=Security / Watches over House; 12=Transport (driver); 13=Construction; 14=Rent Rooms/Property; 15=mining; 16=fishing; 17=ministry; 18=government
99
34 TOTAL REPORTED MONTHLY INCOME N° 99,990
34B TOTAL REPORTED MONTHLY INCOME - Categorized1= ≤600 Nuevos Soles; 2= 600<x≤1000 Nuevos Soles; 3= 1000<x≤1400 Nuevos Soles; 4= >1400
Nuevos Soles99,990
35A ELECTRICITY 1=Yes; 2=No 9935 ELECTRICITY - TIME WITH SERVICE IF YES, enter years with service, with 99=didn't fill in, IF don't have (No)=0 99,99036 MONTHLY ELECTRIC BILL N° (998 implies renting and cost of electricity included in rent) 99,999,998
37A CELL PHONES 1=Yes; 2=No 9937 CELL PHONES - TIME WITH SERVICE IF YES, enter years with service, with 99=didn't fill in, IF don't have (No)=0 99,99038 N° CELL PHONES N° 99,99939 S/. ADDED A MONTH N° 99,999
40A LANDLINE 1=Yes; 2=No 9940 LANDLINE - TIME WITH SERVICE IF YES, enter years with service, with 99=didn't fill in, IF don't have (No)=0 99,99041 MONTHLY LANDLINE BILL N° 99,999
42A NEXTEL 1=Yes; 2=No 9942 NEXTEL - TIME WITH SERVICE IF YES, enter years with service, with 99=didn't fill in, IF don't have (No)=0 99,99043 MONTHLY NEXTEL BILL N°, where 990=Business pays 99,999
44A CABLE 1=Yes; 2=No 9944 CABLE - TIME WITH SERVICE IF YES, enter years with service, with 99=didn't fill in, IF don't have (No)=0 99,99045 MONTHLY CABLE BILL N° 99,999
46A GAS (COOKING) 1=Yes; 2=No 9946 GAS (COOKING) - TIME IF YES, enter years with service, with 99=didn't fill in, IF don't have (No)=0 99,99047 MONTHLY GAS BILL N° 99,999
48A INTERNET 1=Yes; 2=No 9948 INTERNET - TIME WITH SERVICE IF YES, enter years with service, with 99=didn't fill in, IF don't have (No)=0 99,99049 MONTHLY INTERNET BILL N° 99,999
50A TRANSPORT 1=Yes; 2=No 99

211
Appendix H (Continued)
Table A.3: (Continued).
50 TRANSPORTATION - TIME WITH SERVICE IF YES, enter years with service, with 99=didn't fill in, IF don't have (No)=0 99,99051 TRANSPORTATION - TYPE 1=car; 2=motorcycle; 3=Moto-taxi; 4=combi 99,99952 MONTHLY SPENT GAS/MAINTENANCE N° where 0=don't have 99,99953 COMPUTER N° where 0=don't have 9954 TELEVISION N° where 0=don't have 9955 WASHING MACHINE N° where 0=don't have 9956 CAMERA N° where 0=don't have 9957 REFRIGERATOR/FREEZER N° where 0=don't have 9958 BLENDER N° where 0=don't have 99
59 PLANNING TO BUY IN NEXT YEAR
1=computer/laptop; 2=television; 3=washing machine; 4=camera; 5=refrigerator/freezer; 6=blender; 7=sound system; 8=improve house; 9=more water storage; 10=stove; 11=higher education; 12=car;
13=no money to buy anything; 14=not thinking about anything; 15=internet; 16=iron; 17=support family; 18=furniture
99
60 MEDIA SOURCE1=Kadena 100; 2=La Exitosa; 3=Canal 7; 4=Canal Vision (9); 5=Canal America (4); 6=La Verdad; 7=La
Industria; 8=El Satelite; 9=Trome; 10=Internet; 11=Nothing; 12=Cellphone; 13=Other99
61 PRIMARY SOURCE 1=Tap; 2=Well; 3=Bottled Water; 4=Spring/River; 5=Canal; 6=Public Tap Stand 9962 SECONDARY SOURCE 1=Tap; 2=Well; 3=Bottled Water; 4=Spring/River; 5=Canal 99963 TERTIARY SOURCE 1=Tap; 2=Well; 3=Bottled Water; 4=Spring/River; 5=Canal 99964 TAP 1=Yes; 2=No 9965 HOUSEHOLD WELL 1=Yes; 2=No 9966 NEIGHBORS WELL 1=Yes; 2=No 9967 RIVER/SPRING 1=Yes; 2=No 9968 CANAL 1=Yes; 2=No 9969 BOTTLED WATER 1=Yes; 2=No 9970 # STORAGE DEVICES (NOT INCLUDING WASHTUBS) N° 9971 # THAT ARE ELEVATED N° 9972 % THAT HAVE COVERS (NOT INCLUDING WASHTUBS) PERCENTAGE 9973 DESIRE FOR MORE STORAGE 1=Yes; 2=No 9974 HOW MANY LITERS N° 9975 WHY words 99,999
75-B WHY OR WHY NOT - Categorized1= Lack water; 2= For storing more / Protection; 3= For when get sewage (future); 4= For during
summer; 5=For Continuous Water; 6=Fine with what have; 7=Not enough money; 8=Not their house, plan on leaving; 9=Already have one; 10=Have well; 11=No Space
99
76 FREQUENCY WASH ROTOPLAS 1=weekly; 2=monthly; 3=every 3 months; 4=twice a year; 5=annual; 6=never 99,999,99077 ESTIMATED WATER USE - FAMILY N° 99,99078 ESTIMATE WATER USE - FAMILY - Per Capita N° 9979 ESTIMATED WATER USE - RENTERS N° 99,999,99080 ESTIMATED WATER USE - RENTERS - Per Capita N° 99,999,99081 CERTAINTY OF ESTIMATE N° (1-10) 9982 WHEN USE FAUCET 1=All the time; 2=Weekly; 3=Monthly; 4=Seasonal; 5=Only when primary source isn't available 99,999
83 WHEN USE HOUSEHOLD WELL1=All the time; 2=Weekly; 3=Monthly; 4=Seasonal; 5=Only when primary source isn't available;
6=covered, not in use99,999
84 WHEN USE NEIGHBOR'S WELL 1=All the time; 2=Weekly; 3=Monthly; 4=Seasonal; 5=Only when primary source isn't available 99,999
WATER

212
Appendix H (Continued)
Table A.3: (Continued).
85 WHEN USE BOTTLED WATER1=All the time; 2=Weekly; 3=Monthly; 4=Seasonal; 5=Only when primary source isn't available (where frequency is NOT necessarily frequency bought, but frequency used, aka, bidon bought weekly is "all the
time")99,999
86 WHEN USE RIVER/SPRING 1=All the time; 2=Weekly; 3=Monthly; 4=Seasonal; 5=Only when primary source isn't available 99,99987 WHEN USE CANAL 1=All the time; 2=Weekly; 3=Monthly; 4=Seasonal; 5=Only when primary source isn't available 99,99988 VISITS TO NEIGHBORS WELL PER MONTH N° 99,99989 LITERS FROM NEIGHBOR'S WELL PER MONTH N° 99,99990 LITERS BOTTLED WATER PER MONTH N° 99,99991 VISITS TO RIVER/SPRING PER MONTH N° 99,99992 VISITS TO CANAL PER MONTH N° 99,999
93 HOURS TAP
1= ≤30 minutes; 2= 30<x<1 hour; 3= 1<x≤2 hours; 4= 2<x≤3 hours; 5= 3<x≤6 hours; 6= 6<x≤12 hours; 7= 24 hours; 8= ≤30 minutes *every other day; 9= 30<x≤1 hour *every other day; 10= 1<x≤2 hours *every other day; 11= 2<x≤3 hours *every other day; 12= 3<x≤6 hours *every other day; 13=
6<x≤12 hours
99,999
94 HOURS OF ARRIVAL words 99,999
94B HOURS OF ARRIVAL - Categorized1=Morning (5am-11am); 2=Midday (11am-3pm); 3=Late Afternoon (3pm-6pm); 4=Evening (6pm-9pm)
5=Sleeping (9pm-5am)99,999
95 TIME TO RETRIEVE WELL WATER 1= <5 minutes; 2= 5<x≤10 minutes; 3= 10<x≤30 minutes; 4= 30<x≤60 minutes; 5= >1 hour 99,99996 TIME TO RETRIEVE/USE RIVER WATER 1= <5 minutes; 2= 5<x≤10 minutes; 3= 10<x≤30 minutes; 4= 30<x≤60 minutes; 5= >1 hour 99,99997 TIME TO RETRIEVE/USE CANAL WATER 1= <5 minutes; 2= 5<x≤10 minutes; 3= 10<x≤30 minutes; 4= 30<x≤60 minutes; 5= >1 hour 99,999
98 USES TAP WATER1=Everything; 2=Drinking; 3=Cooking; 4=Drinking and Cooking; 5=Bathing; 6=Cleaning and Washing;
7=Bathing, Cleaning and Washing; 8=Only watering; 9=everything except drinking; 10=everything except cooking; 11=Drinking, Cooking and Bathing
99,999
99 USES WELL WATER1=Everything; 2=Drinking; 3=Cooking; 4=Drinking and Cooking; 5=Bathing; 6=Cleaning and Washing;
7=Bathing, Cleaning and Washing; 8=Only watering; 9=everything except drinking; 10=everything except cooking; 11=Drinking, Cooking and Bathing
99,999
100 USES BOTTLED WATER1=Everything; 2=Drinking; 3=Cooking; 4=Drinking and Cooking; 5=Bathing; 6=Cleaning and Washing;
7=Bathing, Cleaning and Washing; 8=Only watering; 9=everything except drinking; 10=everything except cooking; 11=Drinking, Cooking and Bathing
99,999
101 USES RIVER/SPRING1=Everything; 2=Drinking; 3=Cooking; 4=Drinking and Cooking; 5=Bathing; 6=Cleaning and Washing;
7=Bathing, Cleaning and Washing; 8=Only watering; 9=everything except drinking; 10=everything except cooking; 11=Drinking, Cooking and Bathing
99,999
102 USES CANAL1=Everything; 2=Drinking; 3=Cooking; 4=Drinking and Cooking; 5=Bathing; 6=Cleaning and Washing;
7=Bathing, Cleaning and Washing; 8=Only watering; 9=everything except drinking; 10=everything except cooking; 11=Drinking, Cooking and Bathing
99,999
103 QUALITY OF FAUCET WATER1=Clean; 2=Sweet; 3=Rico; 4=Natural; 5=Potable; 6=Not Clean; 7=Salty; 8=Very Chlorated;
9=Sometimes Dirty; 10=Fea (gross); 11=Regular; 12=Clean but disagreeable (cloudy/smelly); 13=Better; 14=Variable; 15=Disinfected
99,999
104 QUALITY OF WELL WATER1=Clean; 2=Sweet; 3=Rico; 4=Natural; 5=Potable; 6=Not Clean; 7=Salty; 8=Very Chlorated; 9=Sometimes Dirty; 10=; 11=Regular; 12=Clean but disagreeable (cloudy/smelly); 13=Better;
14=Variable; 15=Disinfected - One "Tasteless" coded as 9999,999
105 QUALITY OF BOTTLED WATER1=Clean; 2=Sweet; 3=Rico; 4=Natural; 5=Potable; 6=Not Clean; 7=Salty; 8=Very Chlorated; 9=Sometimes Dirty; 10=; 11=Regular; 12=Clean but disagreeable (cloudy/smelly); 13=Better;
14=Variable; 15=Disinfected; 16=Other (Special/Tasteless)99,999

213
Appendix H (Continued)
Table A.3: (Continued).
106 QUALITY OF RIVER/SPRING WATER1=Clean; 2=Sweet; 3=Rico; 4=Natural; 5=Potable; 6=Not Clean; 7=Salty; 8=Very Chlorated; 9=Sometimes Dirty; 10=; 11=Regular; 12=Clean but disagreeable (cloudy/smelly); 13=Better;
14=Variable; 15=Disinfected - One "Special" Coded as 9999,999
107 QUALITY OF CANAL WATER 1=Clean; 2=Sweet; 3=Rico; 4=Natural; 5=Potable; 6=Not Clean; 7=Salty; 8=Very Chlorated; 9=Sometimes Dirty; 10=; 11=Regular; 12=Clean but disagreeable (cloudy/smelly); 13=Better;
14=Variable; 15=Disinfected99,999
108 HOUSEHOLD TREATMENT1=Crude; 2=Boiled; 3=Crude and Boiled; 4=Multiple Treatment (Boiled, Chlorated and/or Filtered); 5=only
drink bottled water99
109 BOILED WATER PER CAPITA PER DAY N° 99,999109B BOILED WATER PER CAPITA PER DAY - Categorized 1= ≤0.5 Liters; 2= 0.5<x≤1 Liter; 3= 1<x≤2 Liters; 4= 2<x≤3 Liters; 5= >3 Liters110 DROPS OF CLOROX PER L N° 99,999111 WATER SERVICE REPORTED COST N° 99,999,990112 PERCEPTION OF COST 1=Expensive; 2=Fair(normal/its fine); 3=Cheap 99,999,990113 WATER SERVICE ACTUAL COST 0=0; 1=3.20; 2=10; 3=12; 4=15.30; 5=20 (commercial A); 6=other; 7=included in rent 99114 BOTTLED WATER COST PER MONTH N° (in this case DON'T put 0 if don't buy, simply code 999) 99,999115 PERCEPTION OF COST (BOTTLED) 0=Don't Know; 1=Expensive; 2=Fair(normal/its fine); 3=Cheap 99,999116 MEANING OF POTABLE words 99
116-B MEANING OF POTABLE-Categorized
0=Don't Know; 1=Vital for all Life; 2= Human/Domestic purpose / Consumption; 3=Clean/Pure/Quality/Healthy/Good; 4=Treated/Disinfected/Maintenance/Chlorate;
5=Tubes/Connection/Faucet; 6=Daily/Continuous/Don't lack; 7=From a service provider; 8=Gross; 9=Sweet/Tasty; 10=currently potable water does not exist; 11=arrives to everyone; 12=It's fine; 13=other
(from below, conserve water, etc.)
99
116-C MEANING OF POTABLE-Condensed and Recategorized
0=Don't Know; 1=Vital for all Life; 2= Human-Domestic purpose/Consumption; 3=Clean/Pure/Quality/Healthy/Good/Sweet/Tasty; 4=Treated/Disinfected/Maintenance/Chlorate;
5=Service/Tubes/Connection/Faucet/Arrives to Everyone; 6=Daily/Continuous/Don't lack; 7=other (from below, does not exist, gross, fine, conserve water)
99
117 WHAT PROVIDER DOES TO MAKE WATER POTABLE words 99
117-B WHAT PROVIDER DOES TO MAKE WATER POTABLE-Categorized0=Don't Know; 1=Clean/Disinfect/Treat/Purify; 2=Chlorate/Chemical; 3=Coagulants/Filter; 4=Put in Tubes;
5=Maintenance; 6=Tubes/Maintenance & Chlorify/Treat; 7=Extensive understanding; 8=Nothing99
117-C WHAT PROVIDER DOES-Condensed and Recategorized0=Don't Know; 1=Clean/Disinfect/Treat/Purify; 2=Chlorate/Chemical/Coagulants/Filter;
3=Tubes/Maintenance; 4=Tubes/Maintenance & Chlorate/Treat; 5=Nothing99
118 QUALITY OF WATER - ONE 0=Don't Know; 1=Appearance; 2=Smell; 3=Taste; 4=Physical Quality; 5=Biological Quality 99
119 QUALITY OF WATER - TWO0=Don't Know; 1=Appearance; 2=Smell; 3=Taste; 4=Physical Quality; 5=Biological Quality; 6=nothing
else important99
120 QUALITY OF WATER - THREE0=Don't Know; 1=Appearance; 2=Smell; 3=Taste; 4=Physical Quality; 5=Biological Quality; 6=nothing
else important99
121 QUALITY OF SERVICE - ONE0=don't know; 1=Quality; 2=Continuity; 3-Schedule; 4-Maintenance; 5=Price; 6=Pressure;
7=Transparency99
122 QUALITY OF SERVICE - TWO0=don't know; 1=Quality; 2=Continuity; 3-Schedule; 4-Maintenance; 5=Price; 6=Pressure;
7=Transparency99
123 QUALITY OF SERVICE - THREE0=don't know; 1=Quality; 2=Continuity; 3-Schedule; 4-Maintenance; 5=Price; 6=Pressure;
7=Transparency99
124 WHO IS WATER PROVIDER0=Don't Know; 1=Municipality; 2=SADISCHAO; 3=JASS; 4=Seda -pal -lip -pash; 5=Name of person;
6=other (Neighbor, CHAVIMOCHIC) 99,999
125 TIME WITH SERVICE 1= <1 year; 2= 1 to 3 years; 3= 4 to 7 years; 4= 8 to 12 years; 5= 13 to 15 years; 6= >15 years 99,999,990
FOR THOSE HOUSEHOLDS WITH TAP CONNECTION

214
Appendix H (Continued)
Table A.3: (Continued).
126 ORIGIN OF WATER 0=Don't Know; 1=Spring; 2=River; 3=Well; 4=reservoir; 5=CHAVIMOCHIC; 6=name of place 99,999127 PRESSURE PROBLEMS 1=Yes; 2=No 99,999128 FREQUENCY OF PRESSURE PROBLEMS 1=Rarely; 2=Daily; 3=Weekly; 4=Monthly; 5=once in a while-summer; 6=In Past 99,999129 AFFECT SCHEDULE 1=Yes; 2=No 99,999130 EXPLAIN words 99,999
130B EXPLAIN-Categorized1=comes very late; 2=comes too early; 3=arrives when away from house; 4=inconsistent arrival time;
5=pressure problems and/or time;6=have adapted schedule accordingly 6,99,999
131 WHAT MOST UNHAPPY WITH1=Quality; 2=Continuity; 3-Schedule; 4-Maintenance; 5=Price; 6=Pressure; 7=Transparency; 8=don't want
to change anything 99,999132 TRUST WITH PROVIDER N° (1-10) 99,999133 WHAT INFO NEEDED TO INCREASE TRUST words 99,999
133B WHAT INFO NEEDED TO INCREASE TRUST-Categorized
1=about quality/how water treated/where comes from; 2=about how maintain/how gets there; 3=about $$; 4=about cuts to service; 5=more communication in general; 6=more friendly/respect; 7=give
meetings/workshops; 8=improve quality; 9=improve continuity; 10=improve schedule; 11=no interest/nothing; 12=other
99,999,990
134 LIKE PAYMENT METHOD 1=Yes; 2=No 99,999135 WHY words 99,999
136 HAVE ENOUGH WATER 1=Yes; 2=No; (3=depends on day) 99137 USE MORE WATER IF MORE CONTINUOUS 1=Yes; 2=No 99138 EXPLAIN words 99,999
138B EXPLAIN-Categorized1=drinking; 2=cooking; 3=personal hygiene; 4=washing clothes; 5=cleaning; 6=watering street;
7=plants; 8=store more; 9=everything in general (mention of summer included); 10=no longer measure and/or store, use differently
99,999
139 USE METERS 1=Yes; 2=No 99140 WHY words 99,990
140B WHY-Categorized
1=Price According to Consumption/Just; 2=More Control (in general)/More Reliable Service/ Secure; 3=Can Measure/Minimize/Control (Personal) Water Use; 4=Put Wasters into Control; 5=Price According to
Consumption (Negative connotation, would have to control use like Electricity); 6=More Expensive; 7=Unreliable Technology (Measure Air, Break, etc.); 8=Not necessary/Too Little Water; 9=(Claim)Already
Have/Had 99,990141 CONFIDENCE IN QUALITY OF TAP WATER 1=Yes; 2=No 99,999142 WHY words 99,999
142B WHY-Categorized
1=Rica/Natural/Healthy/Potable/Clean; 2=Disinfected/Maintained/Treated; 3=Chlorated; 4=Good Source; 5=In Tubes/Faucet; 6=Horrible/Gross/Contaminated; 7=Worms/Organisms/Dead
Body/Microbes/Trash/Sand; 8=Too Much Chlorate; 9=Not Enough Chlorate; 10=Don't Know Source, Method, State of Tubes; 11=Lack of Trust/Bad Service/Have to Boil; 12=Good Daily Service/People Drink
It/Doesn't Cause Harm 99,999,990143 RATE QUALITY OF WATER N° (1-10) 99,999144 PROBLEMS WITH DIARRHEA 1=Yes; 2=No 99145 HAVE HAD DENGUE 1=Yes; 2=No 99146 SEWAGE 1=Yes; 2=No 99
147 SEWAGE DESTINATION0=Don't Know; 1=Oxidation Ponds; 2=Canal; 3=River; 4=Ocean; 5="Down there"; 6="tubes/matrix"
(where 998 indicates other)99,999,998
FOR ALL

215
Appendix H (Continued)
Table A.3: (Continued).
148 SANITATION ALTERNATIVE 1=pit latrine; 2=pour-flush latrine; 3=fields 99,999149 INTEREST IN SEWAGE N° (1-10) 99,999150 N° FAUCETS N° - 0=don't have 99151 N° SHOWERS N° - 0=don't have 99152 N° TOILETS N° (where pour flush latrines are counted as they utilize water) 99,999153 USE OF WASHWATER 1=Never; 2=Sometimes; 3=Always 99,999154 HOW FLUSH 1=Handle; 2=Bucket; 3=Both 99,999155 L - FLUSH N° 99,999,990156 L - BUCKET N° 99,999,990157 FLUSHES PER DAY N° 99158 PROBLEMS WITH LEAKS 1=Yes; 2=No 99,999159 # CURRENT N° 99,999160 # IN PAST N° 99,999161 HOW BATHE - SHOWER 1=Yes; 2=No 99162 HOW BATHE - BUCKET 1=Yes; 2=No 99163 HOW BATHE - RIVER 1=Yes; 2=No 99
16123 HOW BATHE (PRIMARY WAY, aka, only note 4, river, if only bathe in river
1=buckets; 2=shower; 3=buckets and shower (shower only works when water arriving); 4=river 99
164 TIMES PER DAY BATHE SUMMER N° 99165 TIMES PER DAY BATHE WINTER N° 99166 N° LITERS WATER - SUMMER N° 99,999
166B N° LITERS WATER - SUMMER - Categorized1= ≤10 Liters; 2= 10<x≤20 Liters; 3= 20<x≤30 Liters; 4= 30<x≤40 Liters; 5= 40<x≤50 Liters; 6=
50<x≤60 Liters; 7= 60<x≤100 Liters; 8= >100 Liters99
166C N° MINUTES SUMMER N° 99,999167 N° LITERS WATER - WINTER N° 99,999
167B N° LITERS WATER - WINTER - Categorized1= ≤10 Liters; 2= 10<x≤20 Liters; 3= 20<x≤30 Liters; 4= 30<x≤40 Liters; 5= 40<x≤50 Liters; 6=
50<x≤60 Liters; 7= 60<x≤100 Liters; 8= >100 Liters99
167C N° MINUTES WINTER N° 99,999168 GREYWATER DESTINATION - SEWAGE 1=Yes; 2=No 99169 GREYWATER DESTINATION - SEPTIC TANK 1=Yes; 2=No 99170 GREYWATER DESTINATION - CORRAL 1=Yes; 2=No 99171 GREYWATER DESTINATION - STREET 1=Yes; 2=No 99172 GREYWATER DESTINATION - CANAL 1=Yes; 2=No 99173 GREYWATER DESTINATION - RIVER 1=Yes; 2=No 99174 GREYWATER DESTINATION - PLANTS 1=Yes; 2=No 99175 WATER IN STREET 1=Yes; 2=No 99176 WATER IN HOUSE (CORRAL) 1=Yes; 2=No 99177 METHOD 1=Hose; 2=Bucket; 3=Both 99,999178 LITERS PER WEEK FOR WATERING N° 99,999
178B LITERS PER WEEK FOR WATERING - Categorized1= ≤20 Liters; 2= 20<x≤60 Liters; 3= 60<x≤100 Liters; 4= 100<x≤200 Liters; 5= 200<x≤300 Liters; 6=
300<x≤400 Liters; 7= 400<x≤500 Liter; 8= >500 Liters99,999
179 OR MINUTES PER WEEK FOR WATERING N° 99,999180 TYPE OF WATER 1=potable; 2=well; 3=washwater; 4=potable and washwater; 5=well and washwater; 6=canal water 99,999181 WHY words 99,999182 N° LAUNDRY "LOADS" PER WEEK N° where 0.5=every other week; 0=don't wash (send elsewhere) 0,99183 LITERS USED PER LOAD N° where 0 implies that they wash clothes in river or canal 99,990

216
Appendix H (Continued)
Table A.3: (Continued).
184 CALCULATED - N° LITERS WASH CLOTHES PER WEEK N°; 0 implies that they wash clothes in river or canal 99185 # TIMES GO TO RIVER TO WASH MONTH N° 99186 LITERS PER COOKING PER DAY PER CAPITA N°; where 0=don't cook and 990=don't know 99,990187 CALCULATED- LITERS PER MOPPING PER WEEK N° where 0=only use washwater, w/ 000 if given in minutes 99,999188 TYPE OF WATER MOPPING 1=potable; 2=well; 3=washwater; 4=potable and washwater; 5=well and washwater; 6=canal water 99,999189 CALCULATED - LITERS FOR PLANTS PER WEEK N° 99,999,990
189B CALCULATED - MINUTES FOR PLANTS PER WEEK N° 99,999190 TYPE OF WATER PLANTS 1=potable; 2=well; 3=washwater; 4=potable and washwater; 5=well and washwater; 6=canal water 99,999191 WHY HAVE PLANTS words 99,999
191-B WHY HAVE OR DON'T HAVE PLANTS - CODED
1= Adornment/Pretty/Enjoyment; 2=Environment (& Giving Life to Streets); 3=Health/Air/Medicine; 4=Food; 5=Shade; 6=No Time/$$; 7=No Water; 8=No Space; 9=Bad Conditions (Salty, Humidity, Rocky); 10=Animals/Kids Destroy; 11=Don't Like; 12=Already in Place; 13=Planning to Plant; 14=Not Their Home;
15=Theft; 16=Reuse Water
99,999
192 # ANIMALS N° 99192B # ANIMALS -CATEGORIZED 0= 0; 1= 1 to 3; 2= 4 to 6; 3= 7 to 9; 4= ≥ 10 193 # LITERS PER DAY (Animals) N° where 0 means they have no animals 99.999
193B # LITERS PER DAY (Animals) - Categorized0=Don't Give Water (Cuys aka Guinea Pigs); 1= ≤ 0.5 Liters; 2= 0.5 < x ≤ 2 Liters; 3= 2 < x ≤5 Liters;
4= 6 < x ≤ 10 Liters; 5= > 10 Liters99.999
194 # PETS N° 99194B # PETS - Categorized 0= 0; 1=1; 2=2; 3=3; 4= ≥4195 # LITERS PER DAY (PETS) N° where 0 means they have no pets 99,999
195B # LITERS PER DAY (Pets) - Categorized 0= Don't Give Water (cuys); 1= ≤ 0.5 Liters; 2= 0.5 < x ≤ 1 Liter; 3= 1 < x ≤ 4 Liters; 4= > 4 Liters 99,999196 #LITERS DRINK PER DAY - WATER 0=don't drink anything but water; 1= <0.5 L; 2= 0.5<x<1 L; 3= 1<x<2 L; 4= 2<x<3 L; 5= >3L 99197 # LITERS DRINK PER DAY - OTHER 0=don't drink anything but water; 1= <0.5 L; 2= 0.5<x<1 L; 3= 1<x<2 L; 4= 2<x<3 L; 5= >3L 99198 ORDER OF USE - COOKING N° (1 - 6) 99199 ORDER OF USE - DRINKING N° (1 - 6) 99200 ORDER OF USE - HYGIENE N° (1 - 6) 99201 ORDER OF USE - CLEANING N° (1 - 6) 99202 ORDER OF USE - CLOTHES WASHING N° (1 - 6) 99203 ORDER OF USE - WATERING N° (1 - 6) 99204 HEARD INFORMATION ABOUT CONSERVATION 1=Yes; 2=No 99205 WHERE HEARD CONSERVATION INFORMATION words 99,999
205B WHERE HEARD - Categorized1=JASS/SADISCHAO; 2=Radio; 3=TV; 4=Internet; 5=Elementary/High School; 6=Health Post;
7=Workshop/Meetings; 8=Neighbors; 9=Name of Place outside of Chao/Nuevo Chao (ex. Trujillo); 10=Pamphlets
99,999
206 PRACTICE WATER CONSERVATION 1=Yes; 2=No 99207 WATER CONSERVATION EXAMPLE words 99,999
207B WATER CONSERVATION EXAMPLE - Categorized
1=Use Bare Minimum/Conserve Water/Don't Waste; 2= Boil / Add Chlorate (Treat) Water; 3=Cover Water (so kids/bugs don't dirty it); 4=Don't Water Street; 5=Reuse Water (washwater for street, old water for
laundry, etc.); 6=Close Faucets; 7=Install Water Conserving Artifacts; 8=Repair Leaks; 9=Not Possible/Not Enough Water; 10=No Need and/or Have Well
99,999
208 WHY CONSERVE words 99,999
208B WHY CONSERVE - Categorized1=For Future Generations/So Don't Run Out; 2=For Others Who Lack Water (neighbors and other
cities/countries); 3=For Environment/Global Warming; 4=No Water/Have to Make it Last; 5=To Save in General/A Good Practice; 6=Health/Dengue Prevention; 7=Financial Reasons
99,999
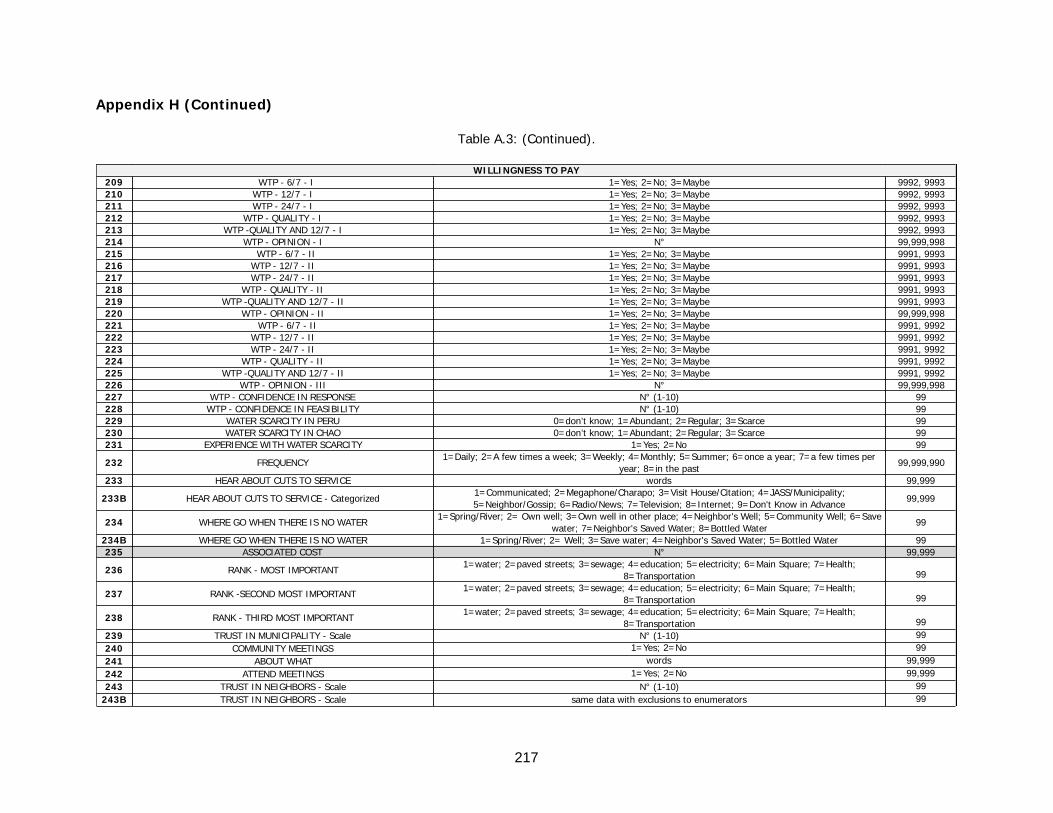
217
Appendix H (Continued)
Table A.3: (Continued).
209 WTP - 6/7 - I 1=Yes; 2=No; 3=Maybe 9992, 9993210 WTP - 12/7 - I 1=Yes; 2=No; 3=Maybe 9992, 9993211 WTP - 24/7 - I 1=Yes; 2=No; 3=Maybe 9992, 9993212 WTP - QUALITY - I 1=Yes; 2=No; 3=Maybe 9992, 9993213 WTP -QUALITY AND 12/7 - I 1=Yes; 2=No; 3=Maybe 9992, 9993214 WTP - OPINION - I N° 99,999,998215 WTP - 6/7 - II 1=Yes; 2=No; 3=Maybe 9991, 9993216 WTP - 12/7 - II 1=Yes; 2=No; 3=Maybe 9991, 9993217 WTP - 24/7 - II 1=Yes; 2=No; 3=Maybe 9991, 9993218 WTP - QUALITY - II 1=Yes; 2=No; 3=Maybe 9991, 9993219 WTP -QUALITY AND 12/7 - II 1=Yes; 2=No; 3=Maybe 9991, 9993220 WTP - OPINION - II 1=Yes; 2=No; 3=Maybe 99,999,998221 WTP - 6/7 - II 1=Yes; 2=No; 3=Maybe 9991, 9992222 WTP - 12/7 - II 1=Yes; 2=No; 3=Maybe 9991, 9992223 WTP - 24/7 - II 1=Yes; 2=No; 3=Maybe 9991, 9992224 WTP - QUALITY - II 1=Yes; 2=No; 3=Maybe 9991, 9992225 WTP -QUALITY AND 12/7 - II 1=Yes; 2=No; 3=Maybe 9991, 9992226 WTP - OPINION - III N° 99,999,998227 WTP - CONFIDENCE IN RESPONSE N° (1-10) 99228 WTP - CONFIDENCE IN FEASIBILITY N° (1-10) 99229 WATER SCARCITY IN PERU 0=don’t know; 1=Abundant; 2=Regular; 3=Scarce 99230 WATER SCARCITY IN CHAO 0=don’t know; 1=Abundant; 2=Regular; 3=Scarce 99231 EXPERIENCE WITH WATER SCARCITY 1=Yes; 2=No 99
232 FREQUENCY1=Daily; 2=A few times a week; 3=Weekly; 4=Monthly; 5=Summer; 6=once a year; 7=a few times per
year; 8=in the past99,999,990
233 HEAR ABOUT CUTS TO SERVICE words 99,999
233B HEAR ABOUT CUTS TO SERVICE - Categorized1=Communicated; 2=Megaphone/Charapo; 3=Visit House/Citation; 4=JASS/Municipality; 5=Neighbor/Gossip; 6=Radio/News; 7=Television; 8=Internet; 9=Don't Know in Advance
99,999
234 WHERE GO WHEN THERE IS NO WATER1=Spring/River; 2= Own well; 3=Own well in other place; 4=Neighbor's Well; 5=Community Well; 6=Save
water; 7=Neighbor's Saved Water; 8=Bottled Water99
234B WHERE GO WHEN THERE IS NO WATER 1=Spring/River; 2= Well; 3=Save water; 4=Neighbor's Saved Water; 5=Bottled Water 99235 ASSOCIATED COST N° 99,999
236 RANK - MOST IMPORTANT 1=water; 2=paved streets; 3=sewage; 4=education; 5=electricity; 6=Main Square; 7=Health;
8=Transportation 99
237 RANK -SECOND MOST IMPORTANT1=water; 2=paved streets; 3=sewage; 4=education; 5=electricity; 6=Main Square; 7=Health;
8=Transportation 99
238 RANK - THIRD MOST IMPORTANT1=water; 2=paved streets; 3=sewage; 4=education; 5=electricity; 6=Main Square; 7=Health;
8=Transportation 99239 TRUST IN MUNICIPALITY - Scale N° (1-10) 99240 COMMUNITY MEETINGS 1=Yes; 2=No 99241 ABOUT WHAT words 99,999242 ATTEND MEETINGS 1=Yes; 2=No 99,999243 TRUST IN NEIGHBORS - Scale N° (1-10) 99
243B TRUST IN NEIGHBORS - Scale same data with exclusions to enumerators 99
WILLINGNESS TO PAY
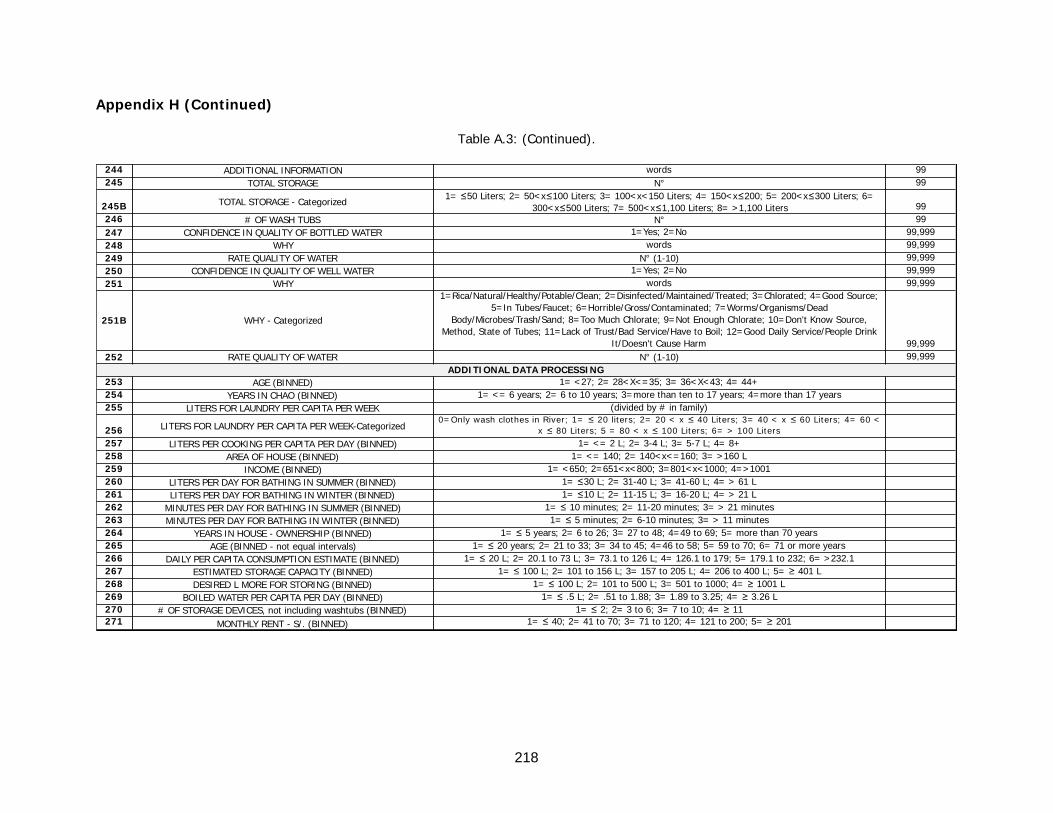
218
Appendix H (Continued)
Table A.3: (Continued).
244 ADDITIONAL INFORMATION words 99245 TOTAL STORAGE N° 99
245B TOTAL STORAGE - Categorized1= ≤50 Liters; 2= 50<x≤100 Liters; 3= 100<x<150 Liters; 4= 150<x≤200; 5= 200<x≤300 Liters; 6=
300<x≤500 Liters; 7= 500<x≤1,100 Liters; 8= >1,100 Liters 99246 # OF WASH TUBS N° 99247 CONFIDENCE IN QUALITY OF BOTTLED WATER 1=Yes; 2=No 99,999248 WHY words 99,999249 RATE QUALITY OF WATER N° (1-10) 99,999250 CONFIDENCE IN QUALITY OF WELL WATER 1=Yes; 2=No 99,999251 WHY words 99,999
251B WHY - Categorized
1=Rica/Natural/Healthy/Potable/Clean; 2=Disinfected/Maintained/Treated; 3=Chlorated; 4=Good Source; 5=In Tubes/Faucet; 6=Horrible/Gross/Contaminated; 7=Worms/Organisms/Dead
Body/Microbes/Trash/Sand; 8=Too Much Chlorate; 9=Not Enough Chlorate; 10=Don't Know Source, Method, State of Tubes; 11=Lack of Trust/Bad Service/Have to Boil; 12=Good Daily Service/People Drink
It/Doesn't Cause Harm 99,999252 RATE QUALITY OF WATER N° (1-10) 99,999
253 AGE (BINNED) 1= <27; 2= 28<X<=35; 3= 36<X<43; 4= 44+254 YEARS IN CHAO (BINNED) 1= <= 6 years; 2= 6 to 10 years; 3=more than ten to 17 years; 4=more than 17 years255 LITERS FOR LAUNDRY PER CAPITA PER WEEK (divided by # in family)
256 LITERS FOR LAUNDRY PER CAPITA PER WEEK-Categorized0=Only wash clothes in River; 1= ≤ 20 liters; 2= 20 < x ≤ 40 Liters; 3= 40 < x ≤ 60 Liters; 4= 60 <
x ≤ 80 Liters; 5 = 80 < x ≤ 100 Liters; 6= > 100 Liters257 LITERS PER COOKING PER CAPITA PER DAY (BINNED) 1= <= 2 L; 2= 3-4 L; 3= 5-7 L; 4= 8+258 AREA OF HOUSE (BINNED) 1= <= 140; 2= 140<x<=160; 3= >160 L259 INCOME (BINNED) 1= <650; 2=651<x<800; 3=801<x<1000; 4=>1001260 LITERS PER DAY FOR BATHING IN SUMMER (BINNED) 1= ≤30 L; 2= 31-40 L; 3= 41-60 L; 4= > 61 L261 LITERS PER DAY FOR BATHING IN WINTER (BINNED) 1= ≤10 L; 2= 11-15 L; 3= 16-20 L; 4= > 21 L262 MINUTES PER DAY FOR BATHING IN SUMMER (BINNED) 1= ≤ 10 minutes; 2= 11-20 minutes; 3= > 21 minutes263 MINUTES PER DAY FOR BATHING IN WINTER (BINNED) 1= ≤ 5 minutes; 2= 6-10 minutes; 3= > 11 minutes264 YEARS IN HOUSE - OWNERSHIP (BINNED) 1= ≤ 5 years; 2= 6 to 26; 3= 27 to 48; 4=49 to 69; 5= more than 70 years265 AGE (BINNED - not equal intervals) 1= ≤ 20 years; 2= 21 to 33; 3= 34 to 45; 4=46 to 58; 5= 59 to 70; 6= 71 or more years266 DAILY PER CAPITA CONSUMPTION ESTIMATE (BINNED) 1= ≤ 20 L; 2= 20.1 to 73 L; 3= 73.1 to 126 L; 4= 126.1 to 179; 5= 179.1 to 232; 6= >232.1267 ESTIMATED STORAGE CAPACITY (BINNED) 1= ≤ 100 L; 2= 101 to 156 L; 3= 157 to 205 L; 4= 206 to 400 L; 5= ≥ 401 L268 DESIRED L MORE FOR STORING (BINNED) 1= ≤ 100 L; 2= 101 to 500 L; 3= 501 to 1000; 4= ≥ 1001 L269 BOILED WATER PER CAPITA PER DAY (BINNED) 1= ≤ .5 L; 2= .51 to 1.88; 3= 1.89 to 3.25; 4= ≥ 3.26 L270 # OF STORAGE DEVICES, not including washtubs (BINNED) 1= ≤ 2; 2= 3 to 6; 3= 7 to 10; 4= ≥ 11271 MONTHLY RENT - S/. (BINNED) 1= ≤ 40; 2= 41 to 70; 3= 71 to 120; 4= 121 to 200; 5= ≥ 201
ADDITIONAL DATA PROCESSING

219
Appendix I Sample Size of Results
Table A.4 Sample size used to create each table and figure presented in Chapter Four.
Round I Round II CombinedSample
SizeSample
SizeSample
Size
C 209 295 295W 62 50 50NC 212 303 303
C 161 257 418NC 178 280 458C ---- 266 266
NC ---- 287 287C ---- 290 290
NC ---- 300 300C ---- 289 289
NC ---- 301 301C 184 266 266
NC 195 287 287C 197 282 479W 60 46 106NC 207 290 497
C 187 279 466W 54 47 101
NC 199 286 485C ---- 290 290
NC ---- 291 291C 208 295 503W 62 50 112NC 212 303 515C ---- 295 295W ---- 50 50NC ---- 303 303
C 203 289 492NC 125 300 425C 197 284 481
NC 120 299 419
C 204 284 488
W 60 44 104
NC 201 288 4894.6 Examples of household water storage situations ---- ---- ---- ----
C ---- 57 57W ---- 8 8NC ---- 93 93C ---- 217 217W ---- 33 33NC ---- 257 257C ---- 288 288W ---- 50 50NC ---- 299 299C ---- 291 291
NC ---- 301 301
Section 4.1
Section 4.2 Demand and Quantity4.2.1%Existing%Availability
4.2.2%Existing%Quantity
4.9 Respondents who would use more water if their water service were more continuous (Yes or No).
4.7 Respondents’ plans, and reasoning, for increasing water storage capabilities
4.8 Respondents reporting enough water (quantity) for their daily needs (Yes or No)
4.5 / 4.10
Reported amount of water households’ regularly store on a daily (C) or every other day (NC) basis (L) / Descriptive statistics of amount of
water households’ regularly store on a daily (C) or every other day (NC) basis (L)
4.11 Volume of additional water storage respondents would like to have (L)
4.7 Reported problems with water pressure
4.8 / 4.9Frequency of reported pressure problems, as varies by season /
Reported pressure problems, overall perspective
4.5 Household use of alternative water sources
4.6Reported frequency with which respondents (households) use
alternative sources
4.3 / 4.4
Reported experience with water scarcity; (S) stands for data from the first survey period (i.e. summer) and (W) stands for data from the second survey period (i.e. winter) / Reported experience with water
scarcity
4.4 Reported use of alternative water sources during periods of water scarcity
- Experience with Water Scarcity
- Affect Daily Schedule - Yes or No
4.3How arrival time (i.e. schedule) of water affects respondents’ daily
routines
4.2 Reported arrival time (i.e. schedule) of water services
4.1Summarized socio-economic characteristics of respondents and their
respective households
4.2 Reported length of time (years) that households have had a domestic water connection
Table / Figure CHAPTER FOUR Sector
4.1 Reported continuity (hours) of water services – summer versus winter

220
Appendix I (Continued)
Table A.4 (Continued).
C ---- 245 245NC ---- 236 236
C 168 292 460W 52 50 102NC 188 301 489C 57 187 244W 21 31 52NC 24 166 190C ---- 275 275W ---- 46 46NC ---- 297 297C 197 290 487W 55 50 105NC 204 301 505C ---- 289 289W ---- 47 47NC ---- 301 301C ---- 280 280W ---- 47 47NC ---- 283 283C 198 290 488W 58 48 106NC 203 291 494C ---- 293 293W ---- 50 50NC ---- 301 301C ---- 292 292W ---- 50 50NC 299 299C ---- 289 289W ---- 49 49NC ---- 283 283C ---- 291 291W ---- 46 46NC ---- 288 288C ---- 277 277
NC ---- 285 285
4.12 / 4.13 Photograph of street watering in Chao ---- ---- ---- ----C ---- 275 275W ---- 49 49NC ---- 283 283C ---- 289 289W ---- 47 47NC ---- 302 302C ---- 270 270W ---- 41 41NC ---- 283 283C ---- 242 242W ---- 37 37NC ---- 255 255C ---- 236 236W ---- 37 37NC ---- 236 236
4.15 Respondents’ understanding of term ‘potable water.’
4.16 Respondents’ understanding of service providers’ water treatment
Section 4.3 Demand and Quality
Section 4.4 Water Use Behaviors - conserving and wasteful
- Where learned about Water Conservation
4.25 Respondents’ attitudes toward metered water service and why
4.21 Where respondents learned about water conservation
4.24 Respondents’ perception of local water scarcity
- Want Water Metered - Yes or No
4.17Respondents’ opinions on most important aspect of a quality water
service
4.18Aspect of current water service respondents would most like to
change
4.11 Respondents’ opinions regarding most important aspect of water quality is
- Reported Problems with Diarrhea
4.13Reasons for respondents’ confidence (or lack of) in their drinking
water’s safety
4.13 (II)Reasons for respondents’ confidence (or lack of) in their drinking
water’s safety - WHY
- Perceived Quality of Water - Rated
4.12 Respondents’ opinions of their water quality
4.14 Reported household treatment of drinking water
- Boiled water per capita per Day
4.10 Respondents intended water use if water service were more continuous
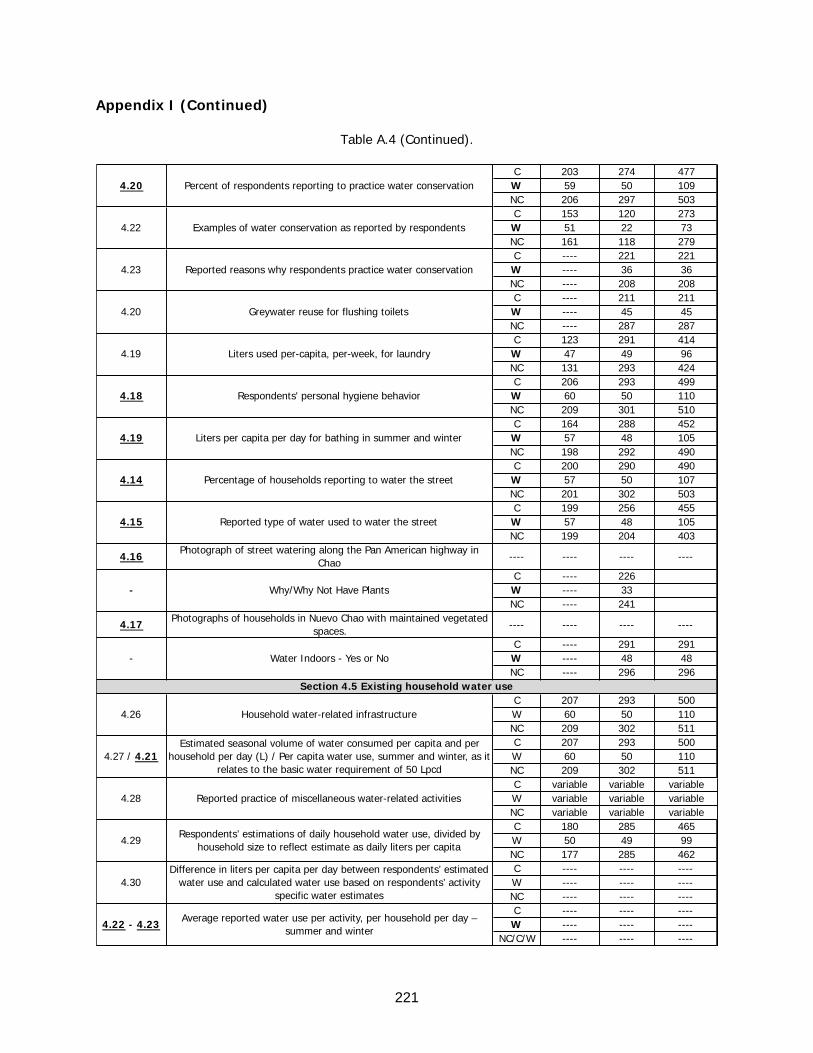
221
Appendix I (Continued)
Table A.4 (Continued).
C 203 274 477W 59 50 109NC 206 297 503C 153 120 273W 51 22 73NC 161 118 279C ---- 221 221W ---- 36 36NC ---- 208 208C ---- 211 211W ---- 45 45NC ---- 287 287C 123 291 414W 47 49 96NC 131 293 424C 206 293 499W 60 50 110NC 209 301 510C 164 288 452W 57 48 105NC 198 292 490C 200 290 490W 57 50 107NC 201 302 503C 199 256 455W 57 48 105NC 199 204 403
4.16Photograph of street watering along the Pan American highway in
Chao---- ---- ---- ----
C ---- 226W ---- 33NC ---- 241
4.17 Photographs of households in Nuevo Chao with maintained vegetated spaces.
---- ---- ---- ----
C ---- 291 291W ---- 48 48NC ---- 296 296
C 207 293 500W 60 50 110NC 209 302 511C 207 293 500W 60 50 110NC 209 302 511C variable variable variableW variable variable variableNC variable variable variableC 180 285 465W 50 49 99NC 177 285 462C ---- ---- ----W ---- ---- ----NC ---- ---- ----C ---- ---- ----W ---- ---- ----
NC/C/W ---- ---- ----
4.29Respondents’ estimations of daily household water use, divided by
household size to reflect estimate as daily liters per capita
4.22 - 4.23 Average reported water use per activity, per household per day – summer and winter
4.27 / 4.21Estimated seasonal volume of water consumed per capita and per
household per day (L) / Per capita water use, summer and winter, as it relates to the basic water requirement of 50 Lpcd
4.28 Reported practice of miscellaneous water-related activities
4.30Difference in liters per capita per day between respondents’ estimated
water use and calculated water use based on respondents’ activity specific water estimates
4.26 Household water-related infrastructure
- Why/Why Not Have Plants
- Water Indoors - Yes or No
Section 4.5 Existing household water use
4.14 Percentage of households reporting to water the street
4.15 Reported type of water used to water the street
4.18 Respondents' personal hygiene behavior
4.19 Liters per capita per day for bathing in summer and winter
4.20 Greywater reuse for flushing toilets
4.19 Liters used per-capita, per-week, for laundry
4.22 Examples of water conservation as reported by respondents
4.23 Reported reasons why respondents practice water conservation
4.20 Percent of respondents reporting to practice water conservation
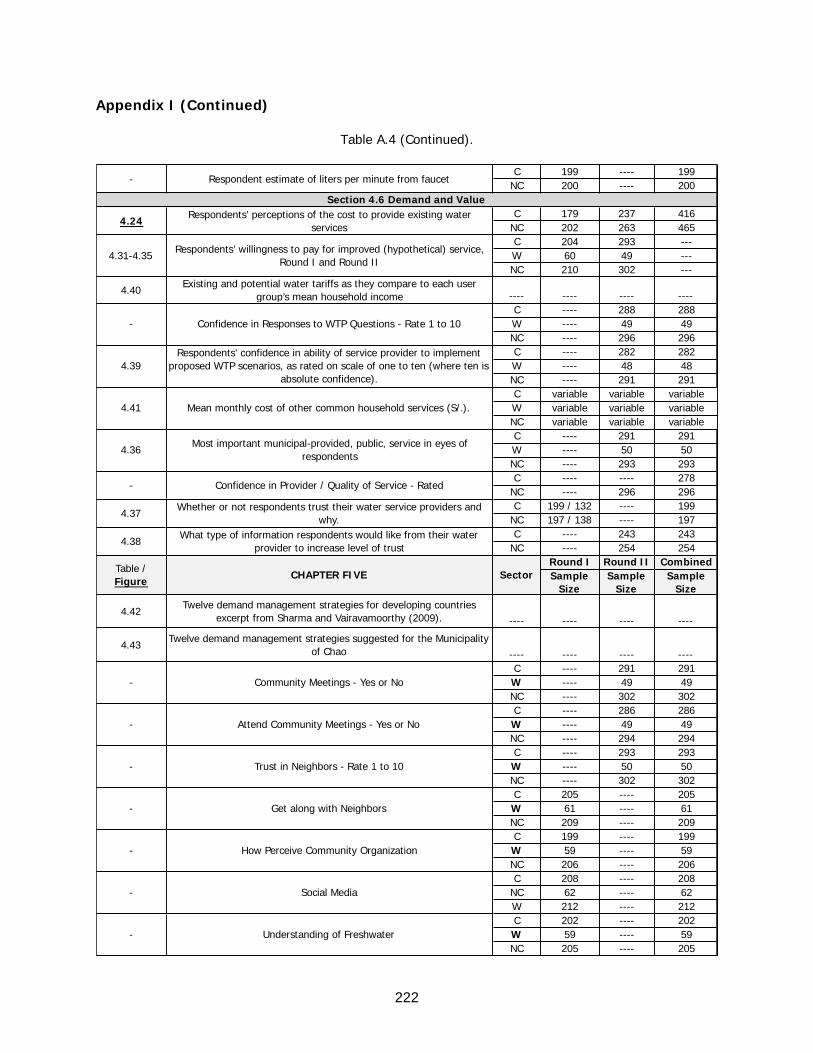
222
Appendix I (Continued)
Table A.4 (Continued).
C 199 ---- 199NC 200 ---- 200
C 179 237 416NC 202 263 465C 204 293 ---W 60 49 ---NC 210 302 ---
4.40Existing and potential water tariffs as they compare to each user
group’s mean household income ---- ---- ---- ----C ---- 288 288W ---- 49 49NC ---- 296 296C ---- 282 282W ---- 48 48NC ---- 291 291C variable variable variableW variable variable variableNC variable variable variableC ---- 291 291W ---- 50 50NC ---- 293 293C ---- ---- 278
NC ---- 296 296C 199 / 132 ---- 199
NC 197 / 138 ---- 197C ---- 243 243
NC ---- 254 254Round I Round II CombinedSample
SizeSample
SizeSample
Size
4.42Twelve demand management strategies for developing countries
excerpt from Sharma and Vairavamoorthy (2009). ---- ---- ---- ----
4.43Twelve demand management strategies suggested for the Municipality
of Chao ---- ---- ---- ----C ---- 291 291W ---- 49 49NC ---- 302 302C ---- 286 286W ---- 49 49NC ---- 294 294C ---- 293 293W ---- 50 50NC ---- 302 302C 205 ---- 205W 61 ---- 61NC 209 ---- 209C 199 ---- 199W 59 ---- 59NC 206 ---- 206C 208 ---- 208
NC 62 ---- 62W 212 ---- 212C 202 ---- 202W 59 ---- 59NC 205 ---- 205
- Get along with Neighbors
- Trust in Neighbors - Rate 1 to 10
- Community Meetings - Yes or No
- How Perceive Community Organization
- Attend Community Meetings - Yes or No
- Social Media
- Understanding of Freshwater
4.38What type of information respondents would like from their water
provider to increase level of trust
Table / Figure CHAPTER FIVE Sector
- Confidence in Provider / Quality of Service - Rated
4.37Whether or not respondents trust their water service providers and
why.
4.41 Mean monthly cost of other common household services (S/.).
4.36Most important municipal-provided, public, service in eyes of
respondents
- Confidence in Responses to WTP Questions - Rate 1 to 10
4.39Respondents’ confidence in ability of service provider to implement
proposed WTP scenarios, as rated on scale of one to ten (where ten is absolute confidence).
4.24 Respondents’ perceptions of the cost to provide existing water services
4.31-4.35Respondents’ willingness to pay for improved (hypothetical) service,
Round I and Round II
- Respondent estimate of liters per minute from faucet
Section 4.6 Demand and Value
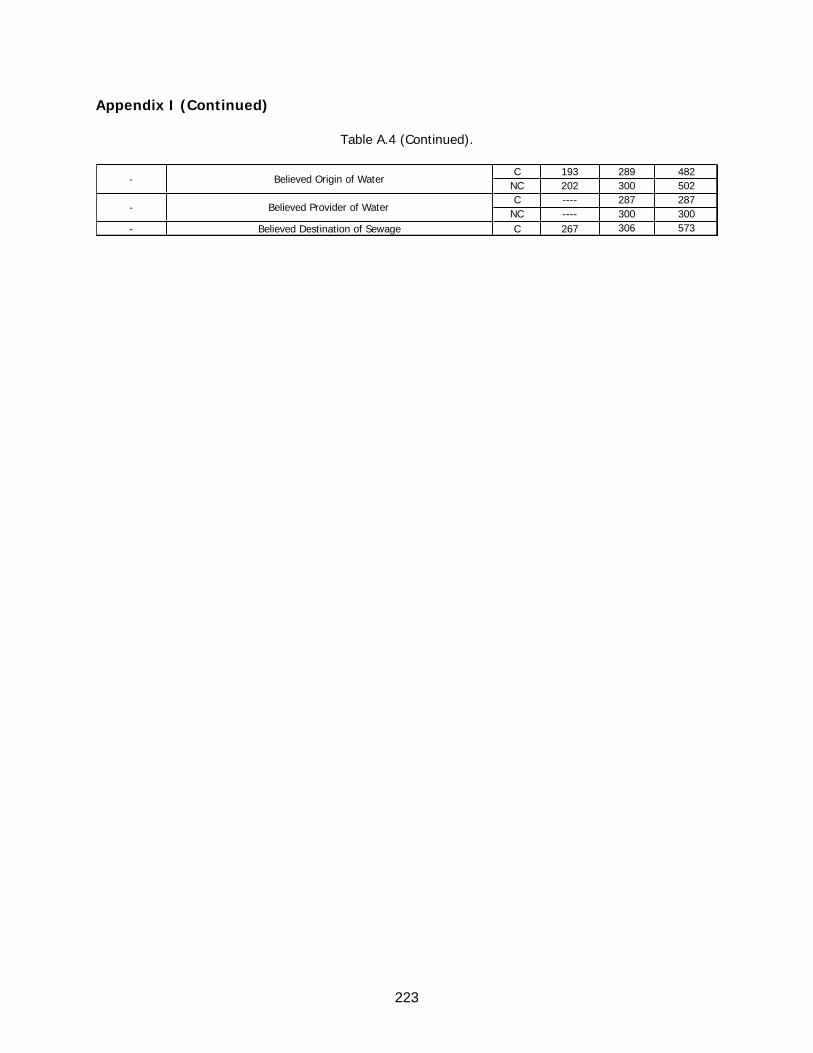
223
Appendix I (Continued)
Table A.4 (Continued).
C 193 289 482NC 202 300 502C ---- 287 287
NC ---- 300 300- Believed Destination of Sewage C 267 306 573
- Believed Provider of Water
- Believed Origin of Water