Embed Size (px)
Citation preview
Tuna Trophic Dynamics
1
Insight into the Trophic Ecology of Yellowfin Tuna, Thunnus albacares, from Compound-Specific Nitrogen Isotope Analysis of Proteinaceous Amino Acids
1Brian N. Popp, 2Brittany S. Graham, 3Robert J. Olson, 2Cecelia C. S. Hannides, 4Michael J. Lott, 5Gladis A. López-Ibarra, 5Felipe Galván-Magaña and 6Brian Fry
1University of Hawaii, Department of Geology and Geophysics, 1680 East-West Road, Honolulu, Hawaii 96822 USA
2University of Hawaii, Department of Oceanography,
1000 Pope Road, Honolulu, Hawaii 96822 USA
3Inter-American Tropical Tuna Commission, 8604 La Jolla Shores Drive, La Jolla, California 92037 USA
4University of Utah, Department of Biology
257 S 1400 E, Salt Lake City, Utah 84112 USA
5Centro Interdisciplinario de Ciencias Marinas-Instituto Politécnico Nacional, Apartado Postal 592, La Paz, Baja California Sur, C.P. 23000 Mexico
6Louisiana State University, Department of Oceanography & Coastal Sciences and Coastal
Ecology Institute, School of the Coast and Environment, Baton Rouge, Louisiana 70803 USA
Accepted for publication in Stable Isotopes as Indicators of Ecological Change volume in the Elseiver/Academic Press Terrestrial Ecology series (anticipated publication – August 2007)
Running Head Tuna Trophic Dynamics
Tuna Trophic Dynamics
2
1. Introduction
There is widespread concern and debate on the extent that commercial fisheries are altering the
structure and function of marine ecosystems (Pauly et al. 1998; NRC 1999; Myers and Worm
2003; Hampton et al. 2005; Sibert et al. 2006). Selective removal of large predatory fishes from
food webs can impart changes in trophic structure and stability via trophic cascades, defined as
inverse patterns in abundance or biomass across more than one trophic level in a food web
(Carpenter, Kitchell and Hodgson 1985; Pace et al. 1999). Recent calls for policy makers to
adopt an ecologically-based approach to fisheries management (Botsford, Castilla and Peterson
1997; Pikitch et al. 2004) places renewed emphasis on achieving accurate depictions of trophic
links and biomass flows through the food web in exploited systems. Such an approach would
take into consideration the indirect effects of fishing, such as declines in diversity, changes in the
species composition of the prey community, and changes in trophic-level structure (e.g.,
aggregate removals at various trophic levels) (Gislason et al. 2000).
There is general agreement of the importance of measuring changes in trophic structure as a
means to evaluate fishery impacts on ecosystems, and ecosystem indicators that take trophic
level into consideration are desirable (Gislason et al. 2000; Murawski 2000; Rice 2000).
Monitoring the trophic level of key food web components and functional groups instead of the
mean trophic level of the fisheries catch (Pauly et al. 2001) serves as a useful fisheries-
independent metric of ecosystem change and sustainability because it integrates an array of
biological and ecological relationships and processes. In addition to adopting ecosystem metrics,
ecosystem-based fisheries management is facilitated through the development of multi-species
models that represent indirect ecological interactions among species or guilds (Latour, Brush and
Bonzek 2003). Among these models, mass-balance models of food webs (e.g., Cox et al. 2002;
Olson and Watters 2003) explicitly represent trophic links between biomass pools based upon
diet relations determined from stomach contents analysis.
Tuna Trophic Dynamics
3
Stable isotope ratios have been used extensively in ecosystems research and are a valuable
compliment to traditional methods used to study food webs (Peterson and Fry 1987). In
particular, nitrogen isotopic ratios have been frequently used to examine trophic dynamics
(Peterson and Fry 1987; Lajtha and Michener 1994). At each trophic level, an increase of ~3‰
has been observed in the bulk tissue δ15N values of many consumers (Deniro and Epstein 1981;
Minagawa and Wada 1984; Post 2002). However, the δ15N value of any consumer is
predominantly a function of both the trophic level of that consumer and the δ15N value of the
primary producers at the base of the food web. In marine environments, the microalgae that
support marine food webs typically have δ15N values that change spatially and seasonally due to
incomplete utilization of nitrogenous nutrients (e.g., Altabet 2001; Lourey, Trull and Sigman
2003), uptake of partly denitrified nitrate (e.g., Cline and Kaplan 1975; Voss, Dippner and
Montoya 2001; Sigman et al. 2005), and because primary producers can use different sources of
nitrogen (nitrate, ammonium, N2) in different areas and seasons (e.g., Dugdale and Goering
1967; Owens 1987; Dugdale and Wilkerson 1991, Dore et al. 2002). When determining the
relative trophic level of top predators, characterizing the δ15N values of the base of marine food
webs can be challenging because marine microalge have very short life spans and can be difficult
to isolate from other organic suspended particulate material. An alternative approach is to use
primary consumers (e.g., zooplankton or bivalve mollusks), which may integrate short-term and
spatial variability in the δ15N values of their diet, to represent trophic level 2 or slightly higher
(e.g., Post 2002; Jennings et al. 2002). Unfortunately, zooplankton are also not ideal for this
purpose, since they too have short life spans and many are omnivorous (Rolff 2000).
Compound-specific isotopic analyses (CSIA) can compliment whole-tissue or whole-animal
isotopic results and can distinguish metabolic and trophic-level relationships in a food web from
changes in isotopic compositions at the base of the food web (Uhle et al. 1997; Fantle et al.
1999; McClelland and Montoya 2002). For example, Uhle et al. (1997) used the δ13C of
Tuna Trophic Dynamics
4
individual fatty and amino acids to elucidate the sources of metabolic carbon used for synthesis
of these compounds in foraminifera. Previous research has also shown that δ13C values of
essential and nonessential amino acids distinguished between the basal carbon sources and diet
of a consumer (Fantle et al. 1999). These researchers showed that essential amino acids (EAA),
which are produced only by plants and bacteria, were not heavily fractionated by juvenile blue
crabs whereas nonessential amino acids (NAA) were fractionated to a greater extent. More
recently, Jim et al. (2006) using laboratory rats grown on diets of isotopically- and nutritionally-
manipulated purified C3 and/or C4 macronutrients, found that EAA and conditionally-
indispensable amino acids were routed from diet to collagen with little isotopic fractionation,
whereas NAA differed by up to 20‰. The essential and nonessential amino acid designation is
based on the flow of carbon through biochemical systems, and although it is a convenient way to
organize our thoughts, it unfortunately does not necessarily provide an accurate picture of the
origins of amino nitrogen. For example, McClelland and Montoya (2002) indicated that a
mixture of EAA and NAA were incorporated with little alteration in δ15N values from dietary
sources into herbivorous zooplankton fed a known algal diet. These authors found δ15N values of
glycine, lysine, phenylalanine, serine, threonine and tyrosine were nearly identical in producer
and consumer. Of these amino acids, only lysine, phenylalanine, and threonine are considered
EAA. On the other hand, the amino acids alanine, aspartic acid, glutamic acid, isoleucine,
leucine, proline and valine were enriched in 15N by ~5-7‰ in the consumer relative to those in
the producer. Leucine, isoleucine and valine are considered EAA. The work of McClelland and
Montoya (2002) clearly showed that the classic essential and nonessential grouping of amino
acids did not correlate well with either δ15N values or trophic position in their simple laboratory
food web study. However, the principle finding of McClelland and Montoya (2002) for
applications of isotope ecology is that the δ15N values of some amino acids in consumers
apparently can provide accurate determination of the isotopic composition of the base of the food
web. We consider this group of compounds the “source” amino acids. On the other hand, other
amino acids are either synthesized by animal consumers de novo or undergo significant
Tuna Trophic Dynamics
5
transamination and deamination reaction, are enriched in 15N by ~5-7‰ relative to the first group
of amino acids, and appear to reflect the trophic level of the consumer (McClelland and Montoya
2002). We consider these the “trophic” amino acids.
In this paper, we tested the premise that a single sample from an upper trophic level pelagic
predator fish could provide information on both the trophic level of the fish and the δ15N value at
the base of the food web. We analyzed the nitrogen isotopic composition of individual amino
acids in white muscle tissue (WMT) of yellowfin tuna (Thunnus albacares) from the eastern
tropical Pacific (ETP) to determine if the observed variations in the δ15N values of WMT are
primarily controlled by the nitrogen isotopic composition at the base of the food web or the
trophic level of the tuna. We used the difference between the δ15N values of source and trophic
amino acids to estimate the trophic level of yellowfin, and we compare this to estimates based on
two independent methods, stomach content analysis and the isotopic difference between the δ15N
values of mesozooplankton and yellowfin tuna in the ETP. We found that nitrogen isotopic
analyses of individual amino acids in tuna can be used to distinguish between nutrient and
trophic dynamics in pelagic ecosystems and we discuss implications of these results for
investigating the long-term impact of commercial fishing on the food web structure of marine
ecosystems.
2. Oceanographic Setting
The ETP contains some of the most biologically-productive waters of the world’s oceans. In the
ETP, the northeast and southeast trade winds converge north of the equator along the
intertropical convergence zone. The northeast trade winds drive the north equatorial current to
the west at ~10°N and the southeast trade winds drive the south equatorial current to the west at
~3°S (Wyrtki 1966). The equatorial countercurrent flows eastward between the north and south
equatorial currents in the region where the trade winds are the weakest. This circulation pattern
Tuna Trophic Dynamics
6
results in a band of cold, nutrient-rich water near the equator that extends west from South
America far into the central equatorial Pacific. The intensity and spatial extent of this “cold
tongue” can vary seasonally and interannually (Chelton et al. 2001). Ekman drift in the most
eastern part of the ETP carries these nutrient-rich waters polewards along the coasts of Baja
California and of Ecuador and Peru (Philander, Hurlin and Seigel 1987).
Coastal upwelling along the eastern boundary of the ETP and oceanic upwelling along offshore
divergences bring new macronutrients (nitrogen, phosphorous and silicon) to the euphotic zone
(e.g., Wyrtki 1981), and can account for the high biological productivity of this region (Fiedler,
Philbrick and Chavez 1991). Oxic respiration associated with the sinking of organic matter
produced by high biological productivity can result in oxygen conditions low enough (~0.1 mL
L-1) that bacteria can use nitrate as an alternative electron acceptor in the respiratory process (i.e.,
denitrification). Although these low-oxygen oceanic regions represent only 0.1% of the total
ocean volume, half of the global denitrification occurs in pelagic oxygen minimum zones with
O2 levels less than 0.05 mL L-1 (Codispoti and Christensen 1985). The importance of pelagic
denitrification in the ETP has been recognized for many years on the basis of N-O-P
stoichiometric relationships, the existence of a nitrite maximum within the O2 minimum zone
(e.g., Brandhorst 1959; Thomas 1966; Cline and Richards 1972), and observations of apparent
N2O consumption in the O2 minimum zone (Cohen and Gordon 1978). The ETP is the largest
region of the world’s oceans with low oxygen and high rates of water column denitrification,
which results in ~35-45% of global pelagic denitrification (e.g., Cline and Richards 1972;
Codispoti and Richards 1976).
Denitrification preferentially consumes 14NO3-, which leads to a marked increase in nitrate δ15N
values in oceanic regions with strong oxygen minimum zones (Cline and Kaplan 1975; Liu and
Kaplan 1989; Voss, Dippner and Montoya 2001). Nitrogen isotopic compositions of nitrate
coupled with consideration of the nitrate deficit in the water column indicate that denitrification
Tuna Trophic Dynamics
7
in the ETP strongly affects the δ15N values of NO3- (Sigman et al. 2005), as well that of
suspended and sinking particulate matter (Voss, Dippner and Montoya 2001). Consequently,
variations in the δ15N value of primary producers, and in turn, consumers in the ETP can be
affected by the spatial and temporal intensity of algal production and denitrification.
3. Sample Collection and Analytical Methods
3.1 Samples – Yellowfin tuna were captured by purse-seine fishing vessels in the eastern Pacific
Ocean between 16 August 2003 and 6 December 2004, and were sampled on board the vessels
by observers of the Inter-American Tropical Tuna Commission (IATTC 2004). The fish were
measured (fork length (FL), mm) and the sex determined if the fish were mature enough to do so.
Samples of white muscle tissue (WMT) were removed from the dorsal region adjacent to the
second dorsal fin and stored at -20ºC until processed further. Stomachs and liver samples were
also collected, but the data reported here are only for white muscle. Subsamples of WMT from
up to 6 individuals per purse-seine set and size class (<900 and ≥900 mm FL) were combined
into one sample for stable isotope analysis. Purse-seine set locations are shown in Figure 1.1.
Samples of zooplankton were collected by a 0.6 m diameter bongo net (Smith and Richardson
1977), on board the NOAA research ships David Starr Jordan and McArthur II in the ETP from
5 August to 5 December 2003 (Figure 1.1). The bongo net frame with two 333-μm mesh
cylindrical-conical nets was towed obliquely from 200 m for 15 minutes and the material
collected by the inboard net was stored at -20ºC until processed further. A flowmeter was used
on the outboard net, where an average of about 400 m3 of water was filtered per tow. In the
laboratory, the zooplankton samples were thawed slowly, sorted for copepods (to species level),
amphipods (to order), euphausiids (to order), and chaetognaths (to phylum) using a stereoscopic
microscope, and refrozen. Collectively, we define these taxa as components of the
mesozooplankton guild, after Chai et al. (2002) and Olson and Watters (2003).
Tuna Trophic Dynamics
8
Samples of WMT for CSIA were chosen from similar-size yellowfin tuna along a broad
latitudinal gradient in the δ15N values. The latitudinal gradient was defined based on nitrogen
isotopic analysis of 95 composite samples of tuna bulk WMT. The samples selected for CSIA
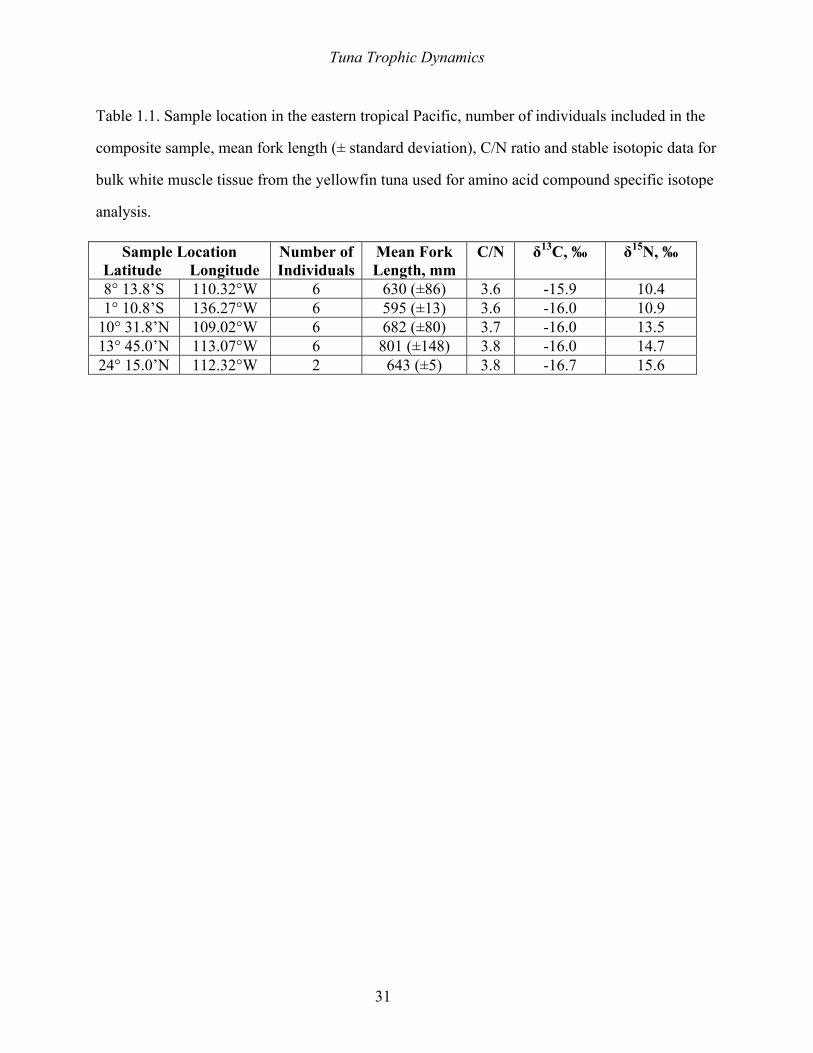
were from fish that ranged from about 600 to 800 mm (Table 1.1). Although our sample from the
equatorial region was chosen from fish caught further to the west than the other four samples
(Figure 1.1), the δ15N value of bulk WMT is representative of yellowfin tuna caught along the
equator in the ETP (Figure 1.2).
3.2 Bulk Isotope Analyses – The tuna tissue samples were lyophilized or oven dried (60°C, ~24
h) and homogenized to a fine powder using a mortar and pestle. An average of about 70
individuals per species (for the copepods), per order (for the amphipods and euphausiids), or per
phylum (for the chaetognaths) per sample was combined into a single sample for stable isotope
analysis. One-hundred forty-nine mesozooplankton samples were analyzed. Bulk carbon and
nitrogen isotopic compositions of tuna and mesozooplankton were determined using an on-line
carbon-nitrogen analyzer coupled with an isotope ratio mass spectrometer (Finnigan ConFlo
II/Delta-Plus). Isotope values are reported in standard δ-notation relative to the international V-
PDB and atmospheric N2 for carbon and nitrogen, respectively. A glycine standard was analyzed
approximately every 10 samples to ensure accuracy of all isotope measurements. Furthermore,
several samples were measured in duplicate or triplicate and the analytical error associated with
these measurements was typically <0.2‰.
3.3 Acid Hydrolysis – The samples were prepared for compound specific nitrogen isotope
analysis of amino acids by acid hydrolysis followed by derivatization to produce trifluoroacetic
amino acid esters (Macko et al. 1997). Approximately 10 mg homogenized sample was
hydrolyzed following procedures modified from Cowie and Hedges (1992). The homogenized
sample and norleucine (0.43 nmol mg-1 sample) were transferred to 5 mL reaction vials (Reacti-
Tuna Trophic Dynamics
9
Vial, Pierce Scientific), 1 mL 6N HCl added (Sequanal Grade, Pierce Scientific), the vial flushed
with N2 and capped using a Teflon/silicone liner (18 mm Tuf-Bond, Pierce Scientific) before
heating at 150°C for 70 minutes. Norleucine was used as an internal recovery standard. The
hydrolysate was evaporated to dryness at 55°C under a gentle stream of N2 and the residue re-
dissolved in 1 mL 0.01N HCl. This solution was purified by filtration (0.22 µm Millex-GP,
Millipore Corporation) followed by a rinse with 1 mL 0.01N HCl. The solution was further
purified by cation-exchange chromatography (Dowex 50W8-400, Sigma-Aldrich) following the
method of Metges, Petzke and Hennig (1996). Briefly, a 5-cm column of cation-exchange resin
was prepared in a Pasteur pipette and the amino acids eluted with 4 mL 2N ammonium
hydroxide. The eluant was evaporated to dryness under a stream of N2 at 80°C. Prior to
derivatization, samples were re-acidified with 1 mL 0.01N HCl and then evaporated to dryness
under a stream of N2 at 55°C. The samples were split and one-half was archived.
3.4 Derivatization – The samples were first reacted with acidified isopropanol to esterify the
carboxyl terminus of the amino acids. Approximately 2 mL of 4:1 isopropanol:acetyl chloride
were added to each sample, the vial was flushed with N2 and sealed with a Teflon-lined cap, and
then the sample was heated (110°C) for 60 min. The samples were then dried under a stream of
N2 at 60°C. The resultant amino acid esters were acylated by the addition of 1 mL 3:1 methylene
chloride: trifluoroacetic anhydride (TFAA, 99+%, Pierce Scientific). The vials were flushed with
N2, sealed with Teflon-lined caps and heated (100°C) for 15 minutes. Samples were then further
purified using solvent extraction (Ueda et al. 1989). The acylated amino acid esters were
evaporated at room temperature under a stream of N2 and then re-dissolved in 3 mL 1:2
chloroform:P-buffer (KH2PO4 + Na2HPO4 in Milli-Q water, pH 7). Vigorous shaking caused the
acylated amino acid esters to partition into the chloroform and high boiling point contamination
ended up in the buffer. The solvents were separated by centrifugation (10 min at 600g) the
chloroform was transferred to a clean vial, and the solvent extraction process repeated. Veuger et
al. (2005) showed full recovery of the acylated amino acid esters using this technique. Finally, to
Tuna Trophic Dynamics
10
insure complete derivatization, the acylation step was repeated. The samples were stored in 3:1
methylene chloride:trifluoroacetic anhydride at 4°C and analyzed within 1 month.
3.5 CSIA – The nitrogen isotopic composition of TFA derivatives of amino acids were analyzed
by isotope ratio monitoring gas chromatography-mass spectrometry using a Finnigan MAT 252
mass spectrometer interfaced to a Trace GC gas chromatograph through a GC-C III combustion
furnace (980°C), reduction furnace (650°C), and liquid nitrogen cold trap. L-2-aminoadipic acid
for which the δ15N value had been previously independently determined was co-injected as an
internal standard. Prior to analysis, the TFA derivatives were dried at room temperature under a
stream of N2 and re-dissolved in 100 μL of ethyl acetate. The samples (1 μL) and L-2-
aminoadipic acid (1 μL, ~20 nmole) were injected (split/splitless, 5:1 split ratio) onto a 50 m HP
Ultra-2 column (0.32 mm i.d., 0.5 µm film thickness) at an injector temperature of 180°C and a
constant helium flow rate of 2 mL min-1. The column oven was initially held for 2 min at 52°C
and increased, in stages, to temperatures of 190°C at a rate of 8.0°C min-1, and 300°C at 10.0°C
min-1, then finally held at 300°C for 8 min. The samples were analyzed in triplicate, and the
measured nitrogen isotope compositions were corrected relative to the δ15N value of the amino
acid internal standard. Reproducibility associated with these isotopic measurements averaged
1.4‰ and ranged from 0.1 to 4.4‰.
3.6 Tuna-Mesozooplankon Comparisons – Bulk δ15N values of yellowfin tuna and
mesozooplankton were compared to derive independent estimates of trophic level over a range of
latitudes in the ETP. The data were compared in fifteen 5x5-degree areas (Figure 1.1) where
samples of both taxa were collected. The trophic level of the yellowfin tuna (TLYFT) sampled
from each purse-seine set in the 5x5-degree areas was calculated as:
MesozooMesozooYFT
YFT TLTEF
NNTL +−
=1515 δδ (1)
Tuna Trophic Dynamics
11
where TLMesozoo is the estimated trophic level of mesozooplankton in the ETP, δ15NMesozoo is the
mean δ15N value of mesozooplankton in each 5-degree area, and TEF represents the trophic
enrichment factor between a consumer and its diet. TLMesozoo was estimated as 2.7 by Olson and
Watters (2003), based on the nutrient-phytoplankton-zooplankton-detritus model of Chai et al.
(2002) for the eastern equatorial Pacific. The TLMesozoo depends on the relative proportions of
mesozooplankton predation on microzooplankton and grazing on diatoms, derived from the
nitrogen balance of Chai et al. (2002). The trophic level of a food web component is 1.0 plus the
weighted average of the trophic levels of its prey. That is, ∑ ×+=
iii TLPTL )(0.1 (2)
where Pi is the diet proportion of the ith prey group and TLi is the trophic level of the ith prey
group. Several workers have adopted an average TEF value of 3.4‰ for many taxa (Minawaga
and Wada 1984; Vander Zanden and Rasmussen 2001; Post 2002), however there is
acknowledged variance in TEF values (e.g., Gannes, O’Brian and Martinez del Rio 1997). For
example, compilations of data for laboratory-grown ammonotelic fish show lower TEF values
(e.g. 2.0‰ Vanderklift and Ponsard 2003; 2.3‰ McCutchan et al. 2003). Recent field studies of
the nitrogen isotopic compositions of juvenile yellowfin tuna and their prey from Hawaii yielded
an average TEF of 2.1‰ based on ~85% characterization of the tuna diet (Graham et al. 2007).
4. Results and Discussion
4.1 Variation in δ15N Values of White Muscle Tissue – The bulk WMT nitrogen isotopic
composition of the five yellowfin tuna samples chosen for CSIA varied from 10.4‰ at ~10°S to
15.6‰ at ~25°N near the tip of Baja California (Table 1.1). Variation in δ15N values with
latitude in this small number of samples is representative of the variation in the δ15N values of
WMT in our much larger dataset for the ETP (Figure 1.2). This consistent spatial variation in the
δ15N values of an upper-level predator could be a result of several factors, including variation in
the organism’s trophic level due to dietary differences, in the organism’s physiology, or in the
Tuna Trophic Dynamics
12
nutrient dynamics at the base of the food web. Assuming a TEF of 3‰ for each trophic level in
this ecosystem, if the observed gradient in δ15N values with latitude were due to dietary
differences alone, then it would represent a gradient of ~1.7 trophic levels occupied by yellowfin
tuna. This observation is not explained by an ontogenetic gradient in foraging behavior or food
habits (M. Bocanegra-Castillo and F. Galván-Magaña, unpublished data) or by correlation
between tuna size and δ15N values of bulk WMT (Table 1.1, and unpublished data for the ETP).
Additional factors can affect the δ15N values of organisms such as diet quality and quantity and
even protein catabolism can affect a consumer’s δ15N value (see review by Gannes, O’Brian and
Martinez del Rio 1997). However, the diets of yellowfin tuna are protein-rich and we have
observed no obvious relationship between δ15N values and stomach fullness.
As described above, changes in the intensity of denitrification can affect the nitrogen isotopic
composition of the nitrate pool in the ETP. For example, Voss, Dippner and Montoya (2001)
showed that the δ15N values of sinking particles in the ETP, which most likely includes organic
matter derived from algae, bacteria and zooplankton, change from ~9‰ at 14°N to 11.2‰ at
24°N. If the gradient in δ15N values with latitude originates at the base of the food web in the
ETP, and that signal is propagated up the food web to the upper-level pelagic predators, it
provides another viable explanation for the observed latitudinal shift in the δ15N values of bulk
WMT. However, the degree to which isotopic variability at the base of the food web affect a
consumer’s δ15N value depends upon the animal’s movement patterns, life span, tissue turnover
rates and foraging behavior. Highly mobile organisms will integrate the δ15N values of the prey
consumed over large spatial scales, whereas less mobile consumers will reflect local spatial and
shorter temporal trends in nutrient dynamics at the base of the food web.
4.2. Variation in the δ15N Values of Amino Acids – To help interpret the coherent spatial
variation in the δ15N values of bulk WMT, we analyzed the isotopic composition of individual
amino acids in ETP yellowfin tuna. The nitrogen isotopic composition of eight individual amino
Tuna Trophic Dynamics
13
acids and two combinations of chemically-related amino acids were determined (Table 1.2).
However, before considering the results of the CSIA, it is informative to review sources of
amino nitrogen for metabolism. Nitrogen in the body and the diet of tunas is predominantly
protein and the amino acids from which protein is synthesized. Proteins are synthesized from
~20 common amino acids, which are divided into two classes, essential and nonessential amino
acids (e.g., Young and El-Khoury 1995). Essentiality of amino acids is not the same in all
organisms, but is often species-specific (e.g., NRC 1994; NRC 1995) and as discussed above
does not provide an accurate picture of the origins of amino nitrogen. Protein ingested by higher
organisms is denatured in the stomach and hydrolyzed to amino acids and short polypeptides.
Most of these compounds are absorbed and transported to the liver, where about 75% of the
amino acids are incorporated into the organism (NRC 1994; NRC 1995). The excess amino acids
are catabolized producing ammonia, which is eliminated mainly through the gills as ammonium.
The amino acids incorporated via the liver may undergo deamination and transamination to
provide the precursors for gluconeogensis, lipogenesis and protein synthesis (Smutna, Vorlova
and Svobodova 2002). Transamination reactions do not occur in some amino acids, whereas in
others there is complete equilibration and these reactions can change the 15N content of the
amino acids (e.g., Hare and Estep 1983; Macko et al. 1987; Hare et al. 1991). For example, Hare
and Estep (1983) found a 19‰ range in δ15N values in amino acids from bovine tendon collagen.
Tissues can vary in their protein composition and therefore in their amino acid distribution
(Wilson and Poe 1985; Gunasekera, Shim and Lam 1997), which in turn, can affect the bulk
tissue δ15N values.
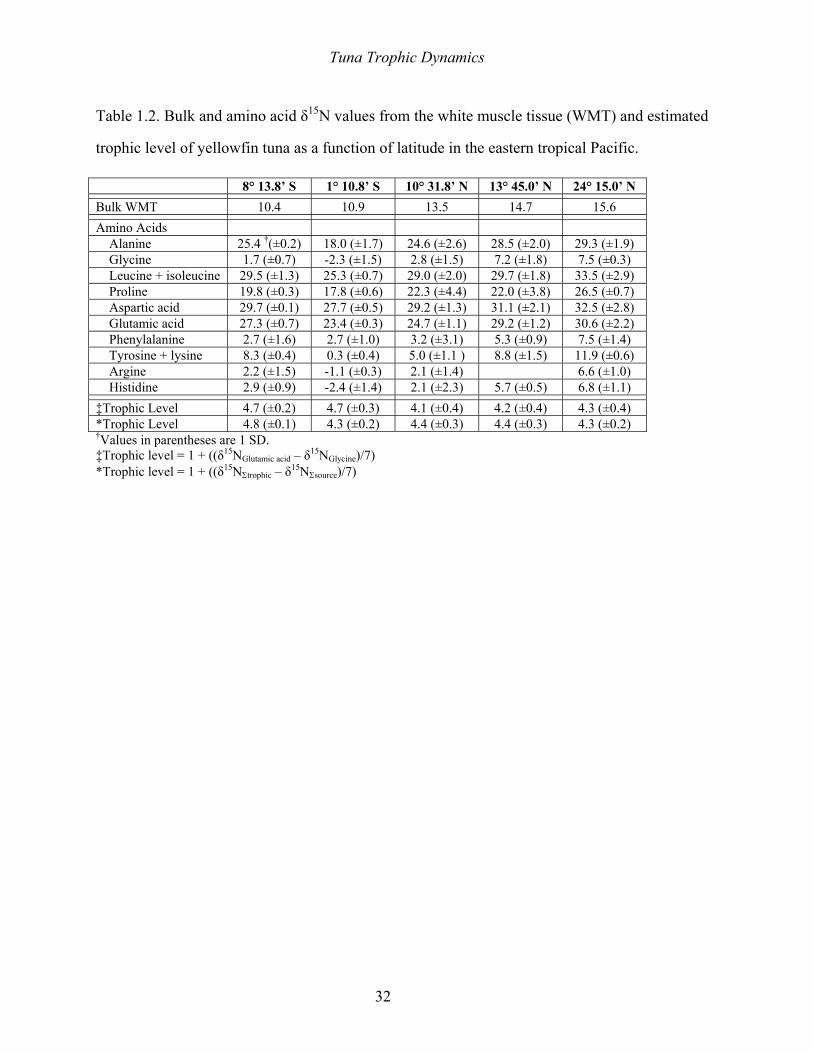
The distribution of δ15N values of individual amino acids in yellowfin tuna caught in the ETP are
strongly bimodal, comprising a group of “high” δ15N amino acids and a group of “low” δ15N
amino acids (Table 1.2). Enrichment in 15N is not related to the class of amino acid essentiality
but rather follows the patterns originally observed by McClelland and Montoya (2002). For
example, within the high δ15N group (Table 1.2), alanine, aspartic and glutamic acid are NAA
Tuna Trophic Dynamics
14
whereas leucine and isoleucine are considered EAA (e.g., Schepartz 1973). It should be noted
that leucine and isoleucine have similar metabolic origins and belong to the pyruvate family of
amino acids (e.g., Stryer 1988). In the low δ15N group (Table 1.2), phenylalanine is an EAA,
whereas glycine is usually considered to be a NAA (e.g., Schepartz 1973).
The δ15N values of individual amino acids have not commonly been measured in marine
organisms (e.g., Schmidt et al. 2004). However, nitrogen isotopic compositions of individual
amino acids have been determined for laboratory cultures of rotifers (McClelland and Montoya
2002), size-fractionated zooplankton from the tropical Atlantic (McClelland, Holl and Montoya
2003) and postlarval euphausiids from the Southern Ocean (Schmidt et al. 2004). These authors
found that alanine, leucine, isoleucine, aspartic acid and glutamic acid were strongly fractionated
in food-web relationships, whereas the 15N content of glycine, lysine, phenylalanine, serine and
tyrosine did not appear to change within the food web. These results imply that the δ15N values
of some amino acids such as alanine, aspartic acid and glutamic acid should reflect the relative
trophic position of yellowfin tuna in the food web and that the δ15N values of glycine and
phenylalanine should record the δ15N value of the source of nitrogen-supporting production.
Although glycine is not typically considered an EAA, results suggest that its carbon skeleton is
derived from an EAA without alternation of the 15N content of the amino nitrogen in the
molecule, or that in the marine organisms studied, glycine is derived from dietary sources
(McClelland and Montoya 2002; McClelland, Holl and Montoya 2003; Schmidt et al. 2004).
Glycine is thought to derive mainly from serine, which is produced from 3-phosphoglycerate, an
intermediate in glycolysis (Stryer 1988). It is possible that glycine is a conditionally essential
amino acid (e.g., see Reeds 2000) in yellowfin tuna. The degree to which glycine may be
regarded as essential or indispensable could be a function of the quantity of serine in the diet of
pelagic marine organisms. McClelland and Montoya (2002) also noted little 15N enrichment of
these amino acids in a consumer relative to its controlled diet, suggesting that the δ15N value of
glycine and serine appear to record the δ15N value of the source of nitrogen-supporting
Tuna Trophic Dynamics
15
production. One scenario that would give a conserved δ15N value of glycine would be that
glycine travels through the food web primarily as part of an amino acid dimer, with the other part
of the dimer being a rare amino acid. In this scenario, the glycine-containing dimers would be
conserved and shunted from prey protein into predator protein and not undergo expected
metabolic fractionations associated with deaminations and transaminations. Of course, this is
speculation at this time. In reality, we do not know why the nitrogen isotopic composition of
glycine reflects the δ15N value at the base of the food web, but existing laboratory (McClelland
and Montoya 2002) and field research (McClelland, Holl and Montoya 2003; Schmidt et al.
2004) suggests that glycine is conservative and records the δ15N values at the base of the food
web in large and small marine organism. On the other hand, the amino acids alanine, aspartic
acid and glutamic acid are mainly derived from intermediates in the citric acid cycle (Stryer
1988) and all show 15N enrichment in consumer organisms relative to glycine, lysine,
phenylalanine, serine and tyrosine in the same sample (McClelland and Montoya 2002;
McClelland, Holl and Montoya 2003; Schmidt et al. 2004).
Given the observed isotopic behavior of source and trophic amino acids, two general scenarios
can explain an increase in the δ15N values of yellowfin tuna with latitude in the ETP. If the
trophic level of yellowfin tuna increased with latitude, then one would expect the δ15N values of
source amino acids (glycine and phenylalanine) to remain constant at all latitudes, and
differences between the δ15N values of source and trophic (alanine, aspartic acid or glutamic
acid) amino acids to increase as the trophic level increases to the north (Figure 1.3a). If the
trophic level of the yellowfin tuna remained constant over the region, then the δ15N values the
source amino acids should parallel those of bulk WMT and the δ15N values of the trophic amino
acids (Figure 1.3b). Our results reveal that the δ15N values of glycine, phenylalanine, alanine,
aspartic acid, and glutamic acid in tuna show latitudinal trends similar to the δ15N values of bulk
WMT (Figure 1.4), indicating that the 15N enrichment in the north is due to changes in δ15N
values at the base of the food web. Increasing δ15N values to the north is consistent with the
Tuna Trophic Dynamics
16
effects of denitrification on the δ15N values of nitrate and the transfer of this isotopic
composition to phytoplankton (see also Fig. 7A in Voss, Dippner and Montoya 2001). It is
remarkable that the δ15N values of a highly-mobile and metabolically-active predator would
track processes at the base of the food web and our results suggest that even though yellowfin
tuna are capable of basin-wide migrations, in the ETP they may have a relatively high level of
regional residency.
4.3. Trophic Level of ETP Yellowfin Tuna – We used the difference between the δ15N values of
glutamic acid and glycine to estimate the trophic level of yellowfin tuna in the ETP, assuming
the difference between the δ15N values of glutamic acid and glycine is 7‰ per trophic level. We
chose 7‰ based on the work of McClelland and Montoya (2002). These authors cultured the
marine rotifer Brachionus plicatilis on a diet of the alga Tetraselmis suecica to examine changes
in the nitrogen isotopic composition of individual amino acids between a plankton consumer and
their food source. They found a ~2‰ increase in bulk δ15N value with trophic position, which
resulted from averaging large increases in the δ15N values of some amino acids and little or no
change in the δ15N values of others. McClelland and Montoya (2002) proposed that the amino
acids showing consistently large increases in δ15N values provided a more robust estimate of the
trophic level of a consumer than bulk tissue. In particular, glutamic acid was enriched in 15N by
~7‰ in the consumer relative to the food (McClelland and Montoya 2002). The trophic level
estimated from the weighted mean difference between the δ15N values of glutamic acid and
glycine assuming an amino acid TEF of 7‰ is 4.5±0.1 (1 SD). Weighting was based on the
analytical uncertainty in the δ15N values of the amino acids (Table 1.2). In contrast, the trophic
level calculated from the weighted mean difference between the δ15N values of glutamic acid and
phenylalanine is 4.2±0.1 (1 SD). We prefer to use the δ15N value of glycine, rather than
phenyalanine for trophic level estimates because phenylalanine can be used in large amounts to
form tyrosine if the latter is not adequately supplied in the diet (Schepartz 1973) and using our
CSIA methods, the δ15N value of glycine was easier to determine relative to phenylalanine
Tuna Trophic Dynamics
17
because close elution between phenylalanine and glutamic acid made quantification of the δ15N
value of phenylalanine more difficult. For comparison, we also calculated trophic level based on
the average difference between trophic (alanine + aspartic acid + glutamic acid) and source
(glycine + phenylalanine) amino acids. The trophic level calculated from the weighted mean
difference between the δ15N values of the trophic and source amino acids assuming a TEF of 7‰
is 4.6±0.1 (1 SD) (Table 1.2).
Bulk δ15N values of mesozooplankton exhibited the same geographical trend as the bulk WMT
and amino acid δ15N values of yellowfin tuna in the ETP, increasing from ~10ºS to ~25ºN
(Figure 1.2). These short-lived organisms at low trophic levels are more likely to track spatial
and temporal changes in nutrient dynamics than long-lived, highly-active predators. The similar
spatial pattern in tuna and mesozooplankton bulk δ15N values provides further evidence that the 15N enrichment in the north is due to changes in the δ15N values at the base of the food web.
Applying equation 1 to the δ15N values of both taxa (Figure 1.2, filled symbols) in the fifteen 5x5
degree areas where both taxa were collected (Figure 1.1) yielded a yellowfin tuna trophic level
estimate ranging from 4.1 (±0.3 SD) assuming a TEF value of 3.4‰ to 4.9 (±0.5 SD) assuming
the field-based TEF value of 2.1‰. These estimates are in close agreement with the trophic level
estimates derived from the compound specific stable isotope data. In addition, trophic level
estimates for yellowfin tuna using diet data in a mass balance ecosystem model for the ETP were
4.6-4.7 (Olson and Watters 2003). Thus, results of CSIA of amino acids in yellowfin tuna appear
to be a sensitive indicator of the trophic level of this upper-level pelagic predator, a conclusion in
broad agreement with that of McClelland and Montoya (2002).
5. Implications
Our results set the stage for the application of compound-specific stable isotope techniques to
support ecosystem-based approaches for the management of pelagic tuna fisheries. Fisheries that
Tuna Trophic Dynamics
18
target specific components of the food web act as potential agents of ecological change, in some
cases profoundly restructuring marine food webs (Estes et al. 1998; Jackson et al. 2001; Worm
and Myers 2003). One way that fishing may alter exploited ecosystems is termed “fishing down
the food web” (Pauly et al. 1998). The commonly-held interpretation of fishing down the food
web is a gradual reduction in the mean trophic level of fisheries landings caused by serial
depletion of high-trophic-level species and replacement by lower-trophic-level species, although
there is another more-tenable interpretation (Essington, Beaudreau and Wiedenmann 2006).
High-seas purse-seine and longline fisheries target tuna and billfish species that are dominant,
high-level predators in pelagic ecosystems. A decrease in the biomass of top predators could
impart a top-down trophic cascade, which could affect the overall structure and function of the
ecosystem (Carpenter, Kitchell and Hodgson 1985; Pace et al. 1999). Fisheries-induced
restructuring of food webs has not been demonstrated empirically for high-seas pelagic
ecosystems of the Pacific Ocean, although modeling studies of the central north Pacific (Cox et
al. 2002) and the ETP (Olson and Watters 2003) have shown strong evidence for top-down
effects of harvesting predators on the productivity of their prey (Walters et al. 2005). A recent
analysis of all available data from Pacific tuna fisheries for 1950-2004 indicated substantial,
though not catastrophic, impacts of fisheries on top-level predators and minor impacts on the
ecosystem in the Pacific Ocean (Sibert et al. 2006). We propose that trophic level estimates
derived from amino acid nitrogen isotopic analysis of archived samples of pelagic fishes will
provide valuable insight into the historic effects of fishing on pelagic marine ecosystems.
To examine the potential historical effects of commercial fishing on pelagic fisheries, using
stable isotope data, both the trophic level and isotope baseline of a single archived sample must
be estimated. Previous workers (Thompson, Furness and Lewis 1995; Bearhop et al. 2001;
Jennings et al. 2002; Becker and Beissinger 2006) have used bulk isotopic compositions to
examine short- and long-term effects of commercial fishing on the trophic level of marine
predators. These studies required extensive characterization of isotopic variability at the base of
Tuna Trophic Dynamics
19
marine food webs, which as we noted above can be notoriously difficult. The principle advantage
of δ15N analyses of individual amino acids is that using only a sample of the consumer, the
trophic level of the consumer and the δ15N value at the base of the food web can be estimated.
That is, additional sampling of basal food resources and prey is not required, since predator
trophic levels and the basal isotope values can be obtained simply by comparing of δ15N values
of trophic and source amino acids extracted from the tissues of the predator. Time series of
trophic-level and baseline isotope estimates for a given predator, using CSIA studies, could
provide insight into the relative importance of fisheries and physical forcing in structuring
marine ecosystems.
6. Summary and Future Research
Bulk δ15N values of yellowfin tuna white muscle tissue increased by ~5‰ from 10ºS to 25°N,
and followed spatial trends documented for hundreds of other δ15N analyses of tuna and
mesozooplankton. We observed parallel latitudinal trends in the δ15N values of bulk WMT,
source and trophic amino acids indicating that the 15N enrichment in the north was due to
changes in the δ15N values at the base of the food web. The increase in δ15N values to the north
was consistent with the effects of denitrification on the δ15N value of nitrate and the transfer of
this isotopic composition to phytoplankton.
We used the difference between the δ15N values of trophic (alanine, aspartic acid and glutamic
acid) and source (glycine and phenylalanine) amino acids to estimate the trophic level of ETP
yellowfin tuna. Assuming the difference between the δ15N values of source and trophic amino
acids changed by 7‰ per trophic level (McClelland and Montoya 2002), we estimated that the
trophic level of ETP tuna ranges from 4.2 to 4.6. This amino acid-derived estimate matched well
the estimate of 4.6 to 4.7 derived from diet analysis (Olson and Watters 2003) and an estimate of
4.1-4.9 calculated from a model based on the difference between the δ15N values of bulk
Tuna Trophic Dynamics
20
mesozooplankton and yellowfin tuna in the ETP. The implication of our results is that δ15N
analyses of individual amino acids in tuna can be used to estimate the δ15N values at the base of
the food web and their trophic level in a single sample. Other results of compound-specific
nitrogen isotopic analysis of amino acids in marine food webs suggest that this generalization
holds for marine organisms at a variety of trophic levels (McClelland and Montoya 2002;
McClelland, Holl and Montoya 2003; Schmidt et al. 2004). Compound-specific nitrogen isotopic
analysis of amino acids can offer a unique opportunity to elucidate the nitrogen dynamics in a
variety of food webs if these generalizations apply to other ecosystems.
We propose that differences between the δ15N values of source and trophic amino acids can be
used to examine possible historical changes in the trophic level of archived samples of fishes to
investigate potential effects of fisheries removal on the trophic dynamics of pelagic ecosystems.
However, before CSIA of amino acids is broadly applied to ecological studies, we must first
determine tissue-specific turnover rates of amino acids and test several critical assumptions. The
primary assumption that must be evaluated is the constancy and the mechanisms underlying the
7‰ per trophic level difference between the δ15N values of the source and trophic amino acids.
The agreement between trophic level estimates based on diet analysis (4.6-4.7) and those from
differences between the δ15N values of glutamic acid -glycine (4.5±0.1) and Σtrophic-Σsource
(4.6±0.1) amino acids provides some level of confidence in the TEF of 7‰, however this TEF
value must be further evaluated using laboratory and additional field studies. Second, we need to
better investigate the origins and metabolic cycling of amino nitrogen in the amino acids in
organisms and if these origins and metabolic cycling change at the ecosystem level, for example,
as a response to nitrogen availability. Third, it is known that EAA are produced by plants and
bacteria. However, currently little is known about controls on the δ15N values of bacterially-
produced amino acids (e.g., Veuger et al. 2005). We must evaluate amino acid production and
cycling in the microbial-loop (sensu Azam et al. 1983) on the δ15N values at the base of the food
web and of marine organisms that feed especially in mesopelagic environments.
Tuna Trophic Dynamics
21
To examine historical changes in trophic level, we must also consider the effects of preservation
on archived specimens. Archived samples of fish are typically preserved with alcohol or formalin.
Preservation of fish tissues with alcohol and formalin can have a small, uniform affect on bulk
nitrogen stable isotope values (Arrington and Winemiller 2002). Bulk nitrogen isotope values
generally increase by less than 1‰ in animal tissues treated with preservatives, which is small
relative to the observed shifts in δ15N values associated with trophic dynamics (Hobson, Gibbs
and Gloutney 1997; Bosley and Wainright 1999). Preliminary results on CSIA of amino acids in
subtropical Pacific zooplankton (Hannides and Popp, unpublished data) indicated little change in
the δ15N values of amino acids in samples preserved in formalin as compared with similar frozen
samples. We therefore suspect that affects of preservation of animal tissues in alcohol or
formalin to be small for individual amino acids, but this supposition must be thoroughly tested.
Consequently, several assumptions should be critically evaluated before the δ15N values of
individual amino acids in organisms can be used to examine animal physiology, foraging
behavior, movement patterns, and trophic level estimates in archived specimens to examine
natural and anthropogenic changes to ecosystem structure and function. If these assumptions can
be evaluated the future application of CSIA of amino acids may have great potential for many
biological fields, from animal physiology to conservation biology.
7. Acknowledgements
We thank H. Kreuzer-Martin, N. C. Popp, J. Tanimoto and T. Rust, and for assistance and advice
in the laboratory, J. Ehleringer for access to equipment and supplies at the University of Utah
where we began our CSIA research on amino acids in tuna and J. Sibert for thoughtful comments
and encouragement throughout our research on tuna. We also thank S. Hernandez-Trujillo,
CICIMAR Project CGPI:20060472, for his support. We are grateful to NOAA Fisheries,
Southwest Fisheries Science Center, USA, especially L. Ballance, V. Andreassi, K. Kopitsky, M.
Tuna Trophic Dynamics
22
Kelley, C. Hall, R. Dotson, D. Griffiths, and N. Bowlin, for kindly collecting zooplankton
samples on the STAR2003 cruises. Samples of tuna were collected by a team of observers in
Ecuador and Mexico, with the valuable assistance of E. Largacha, H. Pérez, K. Loor, V. Fuentes,
C. de la A, A. Basante. W. Paladines, F. Cruz, C. Maldonado, and the captains and crew of
several purse-seine vessels. The manuscript was improved by reviews of W. Bayliff and two
anonymous reviewers. This research was funded by Cooperative Agreement NA17RJ1230
between the Joint Institute for Marine and Atmospheric Research (JIMAR) and the National
Oceanic and Atmospheric Administration (NOAA). The views expressed herein are those of the
authors and do not necessarily reflect the views of NOAA of any of its subdivisions. BSG was
supported by a Pelagic Fisheries Research Program graduate assistantship. CCSH was supported
by an EPA STAR Graduate Fellowship. FGM and GALI were supported by CONACyT and
COFAA-PIFI-IPN. This is SOEST contribution number ####.
8. References
Altabet, M.A. 2001. Nitrogen isotopic evidence for micronutrient control of fractional NO3-
utilization in the equatorial Pacific. Limnology and Oceanography 46: 368–380.
Arrington, D.A., K.O. Winemiller. 2002. Preservation effects on stable isotope analysis of fish
muscle. Transaction of the American Fisheries Society 131: 337-342.
Azam, F., T. Fenchel, J. G. Field, J. S. Gray, and L. A. T. F. Meyer-Reil. 1983. The ecological
role of water-column microbes in the sea. Marine Ecology Progress Series 10: 257–263.
Bearhop, S., D. R. Thompson, R. A. Phillips, S. Waldron, K. C. Hamer, C. M. Gray, S. C. Votier,
B. P. Ross, and R. W. Furness. 2001. Annual variation in great skua diets: the importance of
commercial fisheries and predation on seabirds revealed by combining dietary analyses. The
Condor 103: 802-809.
Becker, B.H., and S.R. Beissinger. 2006. Centennial decline in the trophic level of an endangered
seabird after fisheries decline. Conservation Biology 20: 470-479.
Tuna Trophic Dynamics
23
Bosley, K.L., and S. C. Wainright. 1999. Effects of preservatives and acidification on the stable
isotope ratios (15N:14N, 13C:12C) of two species of marine animals. Canadian Journal of
Fisheries and Aquatic Sciences 56: 2181-2185.
Botsford, L.W., J.C. Castilla, and C.H. Peterson. 1997. The management of fisheries and marine
ecosystems. Science 277: 509-515.
Brandhorst, W. 1959. Nitrification and denitrification in the eastern tropical North Pacific.
Journal du Conseil International pour l'Exploration de la Mer 25: 3-20.
Carpenter, S.R., J.F. Kitchell, and J.R. Hodgson. 1985. Cascading trophic interactions and lake
productivity. BioScience 35: 634-639.
Chelton, D.B., S.K. Esbensen, M.G. Schlax, N. Thum, M.H Freilich, F.J. Wentz, C.L.
Gentemann, M.J. McPhaden, and P.S. Schopf. 2001. Observations of coupling between
surface wind stress and sea surface temperature in the eastern tropical Pacific, Journal of
Climate 14: 1479-1498.
Chai, F., R.C. Dugdale, T.-H. Peng, F.P. Wilkerson, and R.T Barber. 2002. One-dimensional
ecosystem model of the equatorial Pacific upwelling system. Part I: model development and
silicon and nitrogen cycle. Deep-Sea Research II 49: 2713-2745.
Cline, J.D., and F.A. Richards. 1972. Oxygen deficient conditions and nitrate reduction in the
eastern tropical North Pacific Ocean. Limnology and Oceanography 17: 885– 900.
Cline, J. D., and I.R. Kaplan. 1975. Isotopic fractionation of dissolved nitrate during
denitrification in the eastern tropical North Pacific Ocean. Marine Chemistry 3: 271– 299.
Codispoti, L.A., and F.A. Richards. 1976. An analysis of the horizontal regime of denitrification
in the eastern tropical North Pacific. Limnology and Oceanography 21: 379-388.
Codispoti, L.A., and J.C. Christensen. 1985. Nitrification, denitrification and nitrous oxide
cycling in the eastern tropical South Pacific. Marine Chemistry 16: 277-300.
Cohen, Y., and L.I. Gordon. 1978. Nitrous oxide production in the oxygen minimum of the
eastern tropical North Pacific: Evidence for its consumption during denitrification and
possible mechanisms for its production. Deep Sea Research 25: 509-524.
Tuna Trophic Dynamics
24
Cowie, G.L., and J.I. Hedges. 1992. Sources and reactivities of amino acids in a coastal marine
environment. Limnology and Oceanography 37: 703-724.
Cox, S.P., T.E. Essington, J.F. Kitchell, S.J.D. Martell, C.J. Walters, C. Boggs, and I. Kaplan.
2002. Reconstructing ecosystem dynamics in the central Pacific Ocean, 1952–1998. II. A
preliminary assessment of the trophic impacts of fishing and effects on tuna dynamics.
Canadian Journal of Fisheries and Aquatic Sciences 59: 1736-1747.
Deniro, M.J., and S. Epstein. 1981. Influence of diet on the distribution of nitrogen isotopes in
animals. Geochimica et Cosmochimica Acta 45: 341-351.
Dore, J.E., J.R. Brum, L.M. Tupas, and D.M. Karl. 2002. Seasonal and interannual variability in
sources of nitrogen supporting export in the oligotrophic subtropical North Pacific Ocean.
Limnology and Oceanography 47: 1595–1607.
Dugdale, R.C., and J.J. Goering. 1967. Uptake of new and regenerated forms of nitrogen in
primary production. Limnology and Oceanography 12: 196-206.
Dugdale, R.C. and F.P. Wilkerson. 1991. Low specific nitrate uptake rate: a common feature of
high-nutrient, low-chlorophyll marine ecosystems. Limnology and Oceanography 36: 1678-
1688.
Essington, T.E., A.H. Beaudreau, and J. Wiedenmann. 2006. Fishing through marine food webs.
Proceedings of the National Academy of Science 103: 3171-3175.
Estes, J.A., M.T. Tinker, T.M. Williams, and D.F. Doak. 1998. Killer whale predation on sea
otters linking oceanic and nearshore ecosystems. Science 282: 473-476.
Fantle, M.S., A.I. Dittel, S.M. Schwalm, C.E. Epifanio, and M.L. Fogel. 1999. A food web
analysis of the juvenile blue crab, Callinectes sapidus, using stable isotopes in whole animals
and individual amino acids. Oecologia 120: 416-426.
Fiedler, P.C., V. Philbrick, and F.P. Chavez. 1991. Oceanic upwelling and productivity in the
eastern tropical Pacific. Limnology and Oceanography 36: 1834-1850.
Gannes, L.Z., D.M. O’Brian, and C. Martinez del Rio. 1997. Stable isotopes in animal ecology:
assumptions, caveats, and a call for more laboratory studies. Ecology 78: 1271-1276.
Tuna Trophic Dynamics
25
Gislason, H., M. Sinclair, K. Sainsbury, and R. O’Boyle. 2000. Symposium overview:
incorporating ecosystem objectives within fisheries management. ICES Journal of Marine
Science 57: 468–475.
Graham, B.S., D. Grubbs, K. Holland and B.N. Popp. 2007. A rapid ontogenetic shift in the diet
of juvenile yellowfin tuna from Hawaii. Marine Biology 150: 647-658, Doi 10.1007/s00227-
006-0360-y.
Gunasekera, R.M., K.F. Shim, and T.J. Lam. 1997. Influence of dietary protein content on the
distribution of amino acids in oocytes, serum and muscle of Nile tilapia, Oreochromis
niloticus (L). Aquaculture 152: 205-221.
Hare, P.E., and M.L.F. Estep. 1983. Carbon and nitrogen isotopic composition of amino acids in
modern and fossil collagens. Carnegie Institution of Washington Yearbook 82: 410–414.
Hare, P.E, M.L. Fogel, T.W. Stafford, A.D. Mitchel, and T.C. Hoering. 1991. The isotopic
composition of carbon and nitrogen in individual amino acids isolated from modern and
fossil proteins. Journal of Archaeological Science 18: 277–292.
Hampton, J., J.R. Sibert, P. Kleiber, M.N. Maunder, and S.H. Harley. 2005. Decline of Pacific
tuna populations exaggerated? Nature 434: E1-E2.
Hobson, K.A., and H.E. Welch. 1992. Determination of trophic relationships within a high
Arctic marine food web using δ13C and δ15N analysis. Marine Ecology Progress Series 84:
9-18.
Hobson, K.A., H.L. Gibbs, and M.L. Gloutney. 1997. Preservation of blood and tissue samples
for stable-carbon and stable-nitrogen isotope analysis. Canadian Journal of Zoology 75:
1720-1723.
IATTC. 2004. Annual report of the Inter-American Tropical Tuna Commission, 2003. Inter-
American Tropical Tuna Commission, 98 pp.
Jackson, J.B.C., M.X. Kirby, W.H. Berger, K.A. Bjorndal, L.W. Botsford, B.J. Bourque, R.H.
Bradbury, R. Cooke, J. Erlandson, J.A. Estes, T.P. Hughes, S. Kidwell, C.B. Lange, H.S.
Tuna Trophic Dynamics
26
Lenihan, J.M. Pandolfi, C.H. Peterson, R.S. Steneck, M.J. Tegner, and R.R. Warner. 2001.
Historical overfishing and the recent collapse of coastal ecosystems. Science 293: 629–638.
Jennings, S., S. P. R. Greenstreet, L. Hill, G. J. Piet, J. K. Pinnegar, and K. J. Warr. 2002. Long-
term trends in the trophic structure of the North Sea fish community: evidence from stable-
isotope analysis, size-spectra and community metrics. Marine Biology 141: 1085-1097.
Jim, S., V. Jones, S.H. Ambrose, and R.P. Evershed. 2006. Quantifying dietary macronutrient
sources of carbon for bone collagen biosynthesis using natural abundance stable carbon
isotope analysis. British Journal of Nutrition 95: 1055-1062.
Lajtha, K., and R.H. Michener. 1994. Stable isotopes in ecology and environmental science,
Oxford: Blackwell Scientific Publications.
Latour, R.J., M.J. Brush, and C.F. Bonzek. 2003. Toward ecosystem-based fisheries
management: strategies for multispecies modeling and associated data requirements.
Fisheries 28: 10-22.
Liu, K.-K., and I.R. Kaplan. 1989. The eastern tropical Pacific as a source of 15N-enriched nitrate
in seawater off southern California. Limnology and Oceanography 34: 820– 830.
Lourey, M.J., T.W. Trull, and D.M. Sigman. 2003. Sensitivity of δ15N of nitrate, surface
suspended and deep sinking particulate nitrogen to seasonal nitrate depletion in the Southern
Ocean, Global Biogeochemical Cycles, 17: 1081, doi:10.1029/2002GB001973.
Macko, S.A., M.L. Fogel, P.E. Hare, and T.C. Hoering. 1987. Isotopic fractionation of nitrogen
and carbon in the synthesis of amino acids by microorganisms. Chemical Geology 65: 79-92.
Macko, S.A., M.E. Uhle, M.H. Engel, and V. Andrusevich. 1997. Stable nitrogen isotope
analysis of amino acid enantiomers by gas chromatography/combustion/isotope ratio mass
spectrometry. Analytical Chemistry 69: 926-929.
McClelland, J.W., and J.P. Montoya. 2002. Trophic relationships and the nitrogen isotopic
composition of amino acids in phytoplankton. Ecology 83: 2173-2180.
Tuna Trophic Dynamics
27
McClelland, J.W., C.M. Holl, and J.P. Montoya. 2003. Relating low δ15N values of zooplankton
to N2 fixation in the tropical North Atlantic: insights provided by stable isotope ratios of
amino acids. Deep-Sea Research I 50: 849-861.
McCutchan, J.H. Jr., W.M. Lewis, C. Kendall and C. C. McGrath. 2003. Variation in trophic
shift for stable isotope ratios of carbon, nitrogen and sulfur. OIKOS 102: 378-390.
Metges, C.C., K. Petzke, and U. Hennig. 1996. Gas chromatography/combustion/isotope ratio
mass spectrometric comparison of N-acetyl- and N-pivaloyl amino acid esters to measure 15N
isotopic abundances in physiological samples: a pilot study on amino acid synthesis in the
upper gastrointestinal tract of minipigs. Journal of Mass Spectrometry 31: 367–376.
Myers, R.A., and B. Worm. 2003. Rapid worldwide depletion of predatory fish communities.
Nature 423: 280-283.
Minagawa, M., and E. Wada. 1984. Stepwise enrichment of 15N along food chains: further
evidence and the relation between 15N and animal age. Geochimica et Cosmochimica Acta
48: 1135–1140.
Murawski, S.A. 2000. Definitions of overfishing from an ecosystem perspective. ICES Journal
of Marine Science 57: 649-658.
NRC. 1994. Nutrient Requirements of Poultry. 9th Edn. Washington, D.C.: National Academic
Press.
NRC. 1995. Nutrient Requirements of Laboratory Animals. 4th Edn. Washington, D.C., National
Academic Press.
NRC. 1999. Sustaining Marine Fisheries. Washington, D.C.: National Academy Press.
Olson, R.J., and G.M. Watters. 2003. A model of the pelagic ecosystem in the eastern tropical
Pacific Ocean. Inter-American Tropical Tuna Commission Bulletin 22: 135-218.
Owens, N.J.P. 1987. Natural variations in δ15N in the marine environment. Advances in Marine
Biology 24: 389–451.
Pace, M.L., J.J. Cole, S.R. Carpenter, and J.F. Kitchell. 1999. Trophic cascades revealed in
diverse ecosystems. Trends in Ecology and Evolution 14: 483-488.
Tuna Trophic Dynamics
28
Pauly, D., V. Christensen, J. Dalsgaard, R. Froese, and F. Torres, Jr. 1998. Fishing down marine
food webs. Science 279: 860-863.
Pauly, D., M. Lourdes Palomares, R. Froese, P. Saa, M. Vakily, D. Preikshot, and S. Wallace.
2001. Fishing down Canadian aquatic food webs. Canadian Journal of Fisheries and Aquatic
Sciences 58: 51-62.
Peterson, B.J., and B. Fry. 1987. Stable isotopes in ecosystem studies. Annual Review of Ecology
and Systematics 18: 293–320.
Philander, S.G.H., W.J. Hurlin, and A.D. Seigel. 1987. Simulation of the Seasonal Cycle of the
Tropical Pacific Ocean. Journal of Physical Oceanography 17: 1986-2002.
Pikitch, E.K., C. Santora, E.A. Babcock, A. Bakun, R. Bonfil, D.O. Conover, P. Dayton, P.
Doukakis, D. Fluharty, B. Heneman, E.D. Houde, J. Link, P.A. Livingston, M. Mangel, M.K.
McAllister, J. Pope, and K.J. Sainsbury. 2004. Ecosystem-based fishery management.
Science 305: 346-347.
Post, D.M. 2002. Using stable isotopes to estimate trophic position: models, methods and
assumptions. Ecology 83: 703–718.
Reeds, P.J. 2000. Criteria and significance of dietary protein sources in humans. Journal of
Nutrition 130: 1835S-1840S.
Rice, J.C. 2000. Evaluating fishery impacts using metrics of community structure. ICES Journal
of Marine Science 57: 682-688.
Rolff, C. 2000. Seasonal variation in δ13C and δ15N of size-fractionated plankton at a coastal
station in the northern Baltic proper. Marine Ecology Progress Series 203: 47–65
Schepartz, B. 1973. Regulation of amino acid metabolism in mammals. London: W.B. Saunders
Company, 205 p.
Schmidt, K., J.W. McClelland, E. Mente, J.P. Montoya, A. Atkinson, and M. Voss. 2004.
Trophic-level interpretation based on δ15N values: implications of tissue-specific
fractionation and amino acid composition. Marine Ecology Progress Series 266: 43-58.
Tuna Trophic Dynamics
29
Sibert, J., J. Hampton, P. Kleiber, and M. Maunder. 2006. Biomass, size, and trophic status of
top predators in the Pacific Ocean. Science 314: 1773-1776.
Sigman, D.M., J. Granger, P.J. DiFiore, M.M. Lehmann, R. Ho, G. Cane, and A. van Geen.
2005. Coupled nitrogen and oxygen isotope measurements of nitrate along the eastern North
Pacific margin. Global Biogeochemical Cycles 19: GB4022, doi:10.1029/2005GB002458.
Smith, P.E., and S.L. Richardson. 1977. Standard techniques for pelagic fish egg and larva
surveys. FAO Fisheries Technical Paper 175: 1-100.
Smutna, M., L.Vorlova, and Z. Svobodova. 2002. Pathobiochemistry of ammonia in the internal
environment of fish (review). Acta Vet Brno 71: 169-181.
Stryer, L. 1988. Biochemistry. 3rd Edition, New York: W.H. Freeman and Company.
Thomas, W.H. 1996. On denitrification in the northeastern tropical Pacific Ocean. Deep-Sea
Research 13: 1109– 1114.
Thompson, D. R., R. W. Furness, and S. A. Lewis. 1995. Diets and long-term changes in δ15N
and δ13C values in Northern fulmars Fulmarus glacialis from two northwest Atlantic
colonies. Marine Ecology Progress Series 125: 3-11.
Ueda, K., S.L. Morgan, A. Fox, J. Gilbart, A. Sonesson, L. Larsson, and G. Odham. 1989. D-
Alanine as a chemical marker for the determination of streptococcal cell wall levels in
mammalian tissues by gas chromatography/negative ion chemical ionisation mass
spectrometry. Analytical Chemistry 61: 265-270.
Uhle, M.E., S.A. Macko, H.J. Spero, M.H. Engel and D.W. Lea. 1997. Sources of carbon and
nitrogen in modern planktonic foraminifera: the role of algal symbionts as determined by buk
and compound specific stable isotopic analyses. Organic Geochemistry 27: 103-113.
Vanderklift, M.A. and S. Ponsard. 2003. Sources of variation in consumer-diet δ15N enrichment:
a meta-analysis. Oecologia 136: 169-182.
Vander Zanden, M.J. and J.B. Rasmussen. 2001. Variation in δ15N and δ13C trophic
fractionation: implications for aquatic food web studies. Limnology and Oceanography 46:
2061-2066.
Tuna Trophic Dynamics
30
Veuger, B., J.J. Middleburgh, T.S. Boschker, and M. Houtekamer. 2005. Analysis of 15N
incorporation into D-alanine: A new method for tracing nitrogen uptake by bacteria.
Limnology and Oceanography: Methods 3: 230-240.
Voss, M., J.W. Dippner, and J.P. Montoya. 2001. Nitrogen isotope patterns in the oxygen-
deficient waters of the Eastern Tropical North Pacific Ocean. Deep-Sea Research I 48: 1905-
1921.
Walters, C. 2003. Folly and fantasy in the analysis of spatial catch rate data. Canadian Journal of
Fisheries and Aquatic Sciences 60: 1433-1436.
Walters, C.J., V. Christensen, S.J. Martell, and J.F. Kitchell. 2005. Possible ecosystem impacts
of applying MSY policies from single-species assessment. ICES Journal Marine Science
62(3): 558-568.
Wilson, R.P., and W.E. Poe. 1985. Relationship of whole body and egg essential amino acid
patterns to amino acid requirement patterns in channel catfish, Ictalurus punctatus.
Comparative Biochemistry and Physiology 80B: 385-388.
Worm, B., and R.A. Myers. 2003. Meta-analysis of cod-shrimp interactions reveals top-down
control in oceanic food webs. Ecology 84: 162-173.
Wyrtki, K. 1966. Oceanography of the eastern equatorial Pacific Ocean. Oceanography and
Marine Biology Annual Reviews 4: 33-68.
Wyrtki, K. 1981. An estimate of equatorial upwelling in the Pacific. Journal of Physical
Oceanography 11: 1205-1214.
Young, V.R., and E. El-Khoury 1995. The notion of the nutritional essentiality of amino acids,
revisited, with a note on the indispensable amino acid requirements in adults. In Amino Acid
Metabolism and Therapy in Health and Nutritional Disease, ed. L.A. Cynober, pp. 191–232.
Boca Raton, FL: CRC Press.
Tuna Trophic Dynamics
31
Table 1.1. Sample location in the eastern tropical Pacific, number of individuals included in the
composite sample, mean fork length (± standard deviation), C/N ratio and stable isotopic data for
bulk white muscle tissue from the yellowfin tuna used for amino acid compound specific isotope
analysis.
Sample Location Latitude Longitude
Number of Individuals
Mean Fork Length, mm
C/N δ13C, ‰ δ15N, ‰
8° 13.8’S 110.32°W 6 630 (±86) 3.6 -15.9 10.4 1° 10.8’S 136.27°W 6 595 (±13) 3.6 -16.0 10.9
10° 31.8’N 109.02°W 6 682 (±80) 3.7 -16.0 13.5 13° 45.0’N 113.07°W 6 801 (±148) 3.8 -16.0 14.7 24° 15.0’N 112.32°W 2 643 (±5) 3.8 -16.7 15.6
Tuna Trophic Dynamics
32
Table 1.2. Bulk and amino acid δ15N values from the white muscle tissue (WMT) and estimated
trophic level of yellowfin tuna as a function of latitude in the eastern tropical Pacific.
8° 13.8’ S 1° 10.8’ S 10° 31.8’ N 13° 45.0’ N 24° 15.0’ N Bulk WMT 10.4 10.9 13.5 14.7 15.6 Amino Acids Alanine 25.4 †(±0.2) 18.0 (±1.7) 24.6 (±2.6) 28.5 (±2.0) 29.3 (±1.9) Glycine 1.7 (±0.7) -2.3 (±1.5) 2.8 (±1.5) 7.2 (±1.8) 7.5 (±0.3) Leucine + isoleucine 29.5 (±1.3) 25.3 (±0.7) 29.0 (±2.0) 29.7 (±1.8) 33.5 (±2.9) Proline 19.8 (±0.3) 17.8 (±0.6) 22.3 (±4.4) 22.0 (±3.8) 26.5 (±0.7) Aspartic acid 29.7 (±0.1) 27.7 (±0.5) 29.2 (±1.3) 31.1 (±2.1) 32.5 (±2.8) Glutamic acid 27.3 (±0.7) 23.4 (±0.3) 24.7 (±1.1) 29.2 (±1.2) 30.6 (±2.2) Phenylalanine 2.7 (±1.6) 2.7 (±1.0) 3.2 (±3.1) 5.3 (±0.9) 7.5 (±1.4) Tyrosine + lysine 8.3 (±0.4) 0.3 (±0.4) 5.0 (±1.1 ) 8.8 (±1.5) 11.9 (±0.6) Argine 2.2 (±1.5) -1.1 (±0.3) 2.1 (±1.4) 6.6 (±1.0) Histidine 2.9 (±0.9) -2.4 (±1.4) 2.1 (±2.3) 5.7 (±0.5) 6.8 (±1.1) ‡Trophic Level 4.7 (±0.2) 4.7 (±0.3) 4.1 (±0.4) 4.2 (±0.4) 4.3 (±0.4) *Trophic Level 4.8 (±0.1) 4.3 (±0.2) 4.4 (±0.3) 4.4 (±0.3) 4.3 (±0.2) †Values in parentheses are 1 SD. ‡Trophic level = 1 + ((δ15NGlutamic acid – δ15NGlycine)/7) *Trophic level = 1 + ((δ15NΣtrophic – δ15NΣsource)/7)
Tuna Trophic Dynamics
33
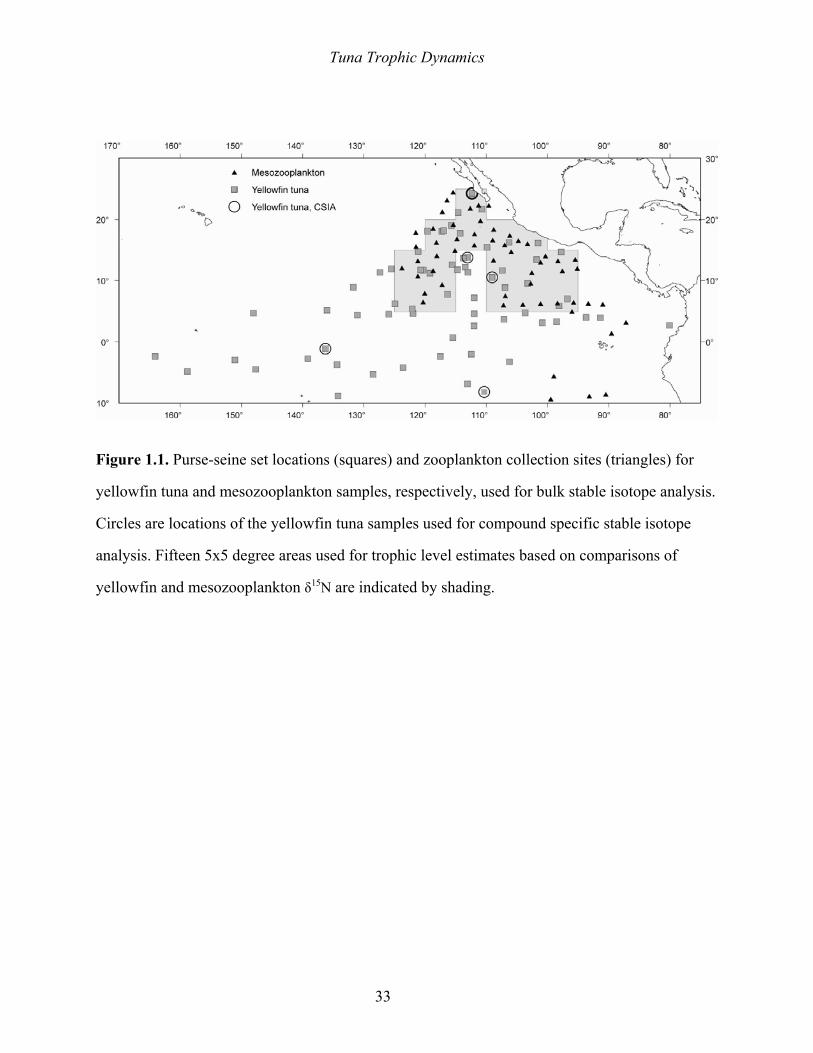
Figure 1.1. Purse-seine set locations (squares) and zooplankton collection sites (triangles) for
yellowfin tuna and mesozooplankton samples, respectively, used for bulk stable isotope analysis.
Circles are locations of the yellowfin tuna samples used for compound specific stable isotope
analysis. Fifteen 5x5 degree areas used for trophic level estimates based on comparisons of
yellowfin and mesozooplankton δ15N are indicated by shading.
Tuna Trophic Dynamics
34
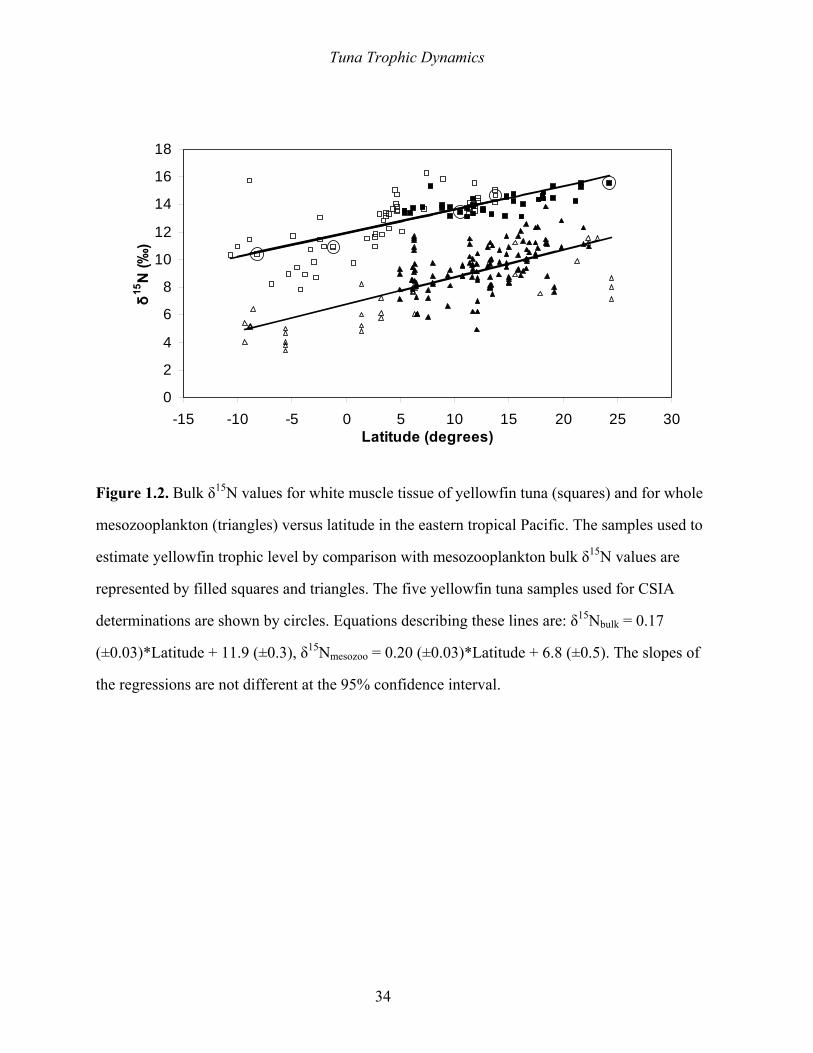
Figure 1.2. Bulk δ15N values for white muscle tissue of yellowfin tuna (squares) and for whole
mesozooplankton (triangles) versus latitude in the eastern tropical Pacific. The samples used to
estimate yellowfin trophic level by comparison with mesozooplankton bulk δ15N values are
represented by filled squares and triangles. The five yellowfin tuna samples used for CSIA
determinations are shown by circles. Equations describing these lines are: δ15Nbulk = 0.17
(±0.03)*Latitude + 11.9 (±0.3), δ15Nmesozoo = 0.20 (±0.03)*Latitude + 6.8 (±0.5). The slopes of
the regressions are not different at the 95% confidence interval.
0
2
4
6
8
10
12
14
16
18
-15 -10 -5 0 5 10 15 20 25 30Latitude (degrees)
δ15N
(‰)
Tuna Trophic Dynamics
35
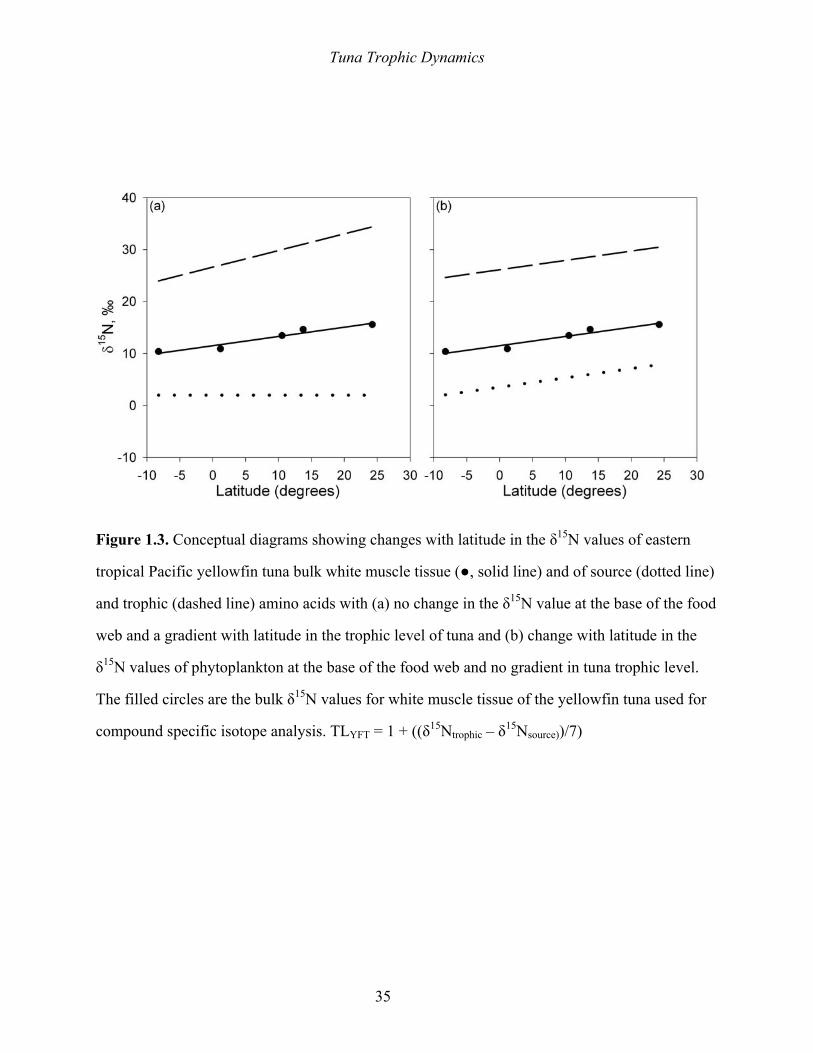
Figure 1.3. Conceptual diagrams showing changes with latitude in the δ15N values of eastern
tropical Pacific yellowfin tuna bulk white muscle tissue (●, solid line) and of source (dotted line)
and trophic (dashed line) amino acids with (a) no change in the δ15N value at the base of the food
web and a gradient with latitude in the trophic level of tuna and (b) change with latitude in the
δ15N values of phytoplankton at the base of the food web and no gradient in tuna trophic level.
The filled circles are the bulk δ15N values for white muscle tissue of the yellowfin tuna used for
compound specific isotope analysis. TLYFT = 1 + ((δ15Ntrophic – δ15Nsource))/7)
Tuna Trophic Dynamics
36
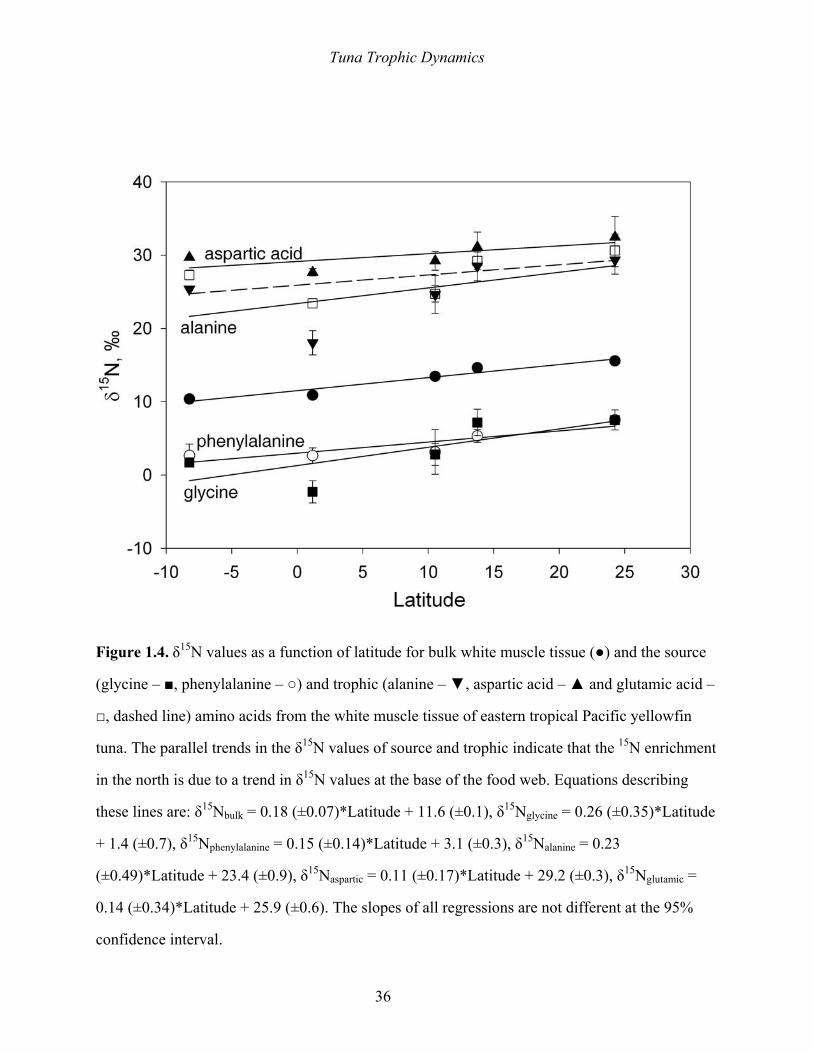
Figure 1.4. δ15N values as a function of latitude for bulk white muscle tissue (●) and the source
(glycine – ■, phenylalanine – ○) and trophic (alanine – ▼, aspartic acid – ▲ and glutamic acid –
□, dashed line) amino acids from the white muscle tissue of eastern tropical Pacific yellowfin
tuna. The parallel trends in the δ15N values of source and trophic indicate that the 15N enrichment
in the north is due to a trend in δ15N values at the base of the food web. Equations describing
these lines are: δ15Nbulk = 0.18 (±0.07)*Latitude + 11.6 (±0.1), δ15Nglycine = 0.26 (±0.35)*Latitude
+ 1.4 (±0.7), δ15Nphenylalanine = 0.15 (±0.14)*Latitude + 3.1 (±0.3), δ15Nalanine = 0.23
(±0.49)*Latitude + 23.4 (±0.9), δ15Naspartic = 0.11 (±0.17)*Latitude + 29.2 (±0.3), δ15Nglutamic =
0.14 (±0.34)*Latitude + 25.9 (±0.6). The slopes of all regressions are not different at the 95%
confidence interval.