Embed Size (px)
Citation preview

I N S I D E RR E P O R T
GOVERNMENT IT CONTRACTOR PARTNERINGPART ONE: THE SUBCONTRACTOR PERSPECTIVE

RESEARCH CONDUCTED BY:
Government IT Contractor PartneringPart One: The Subcontractor Perspective
I N S I D E R R E P O R T 2 0 1 3
Table of contents
I N S I D E R R E P O R T 2 0 1 3
3
Welcome 4
Key Partnering Attributes 5
Prime Contractor Performance Introduction 7
Prime Contractor Performance Cards 8
Open Ended Questions and Results 28
Conclusion 30
The Primes React 31
Appendices
A. Reading the Prime Contractor Performance Cards 32
B. Verbatim Comments from Respondents 34
C. Methodology and Respondent Profile 39
D. About Lodestar 41
Welcome to the inaugural Washington Technology Insider Report.For our three-part series, we started with the subcontractor community and asked a simple
question: What is the health of your relationship with your prime contractors? But the answer
was anything but simple.
Our in-depth survey identified three qualities that subcontractors hold dear when forming
partnerships with prime contractors: Teamwork, Industry Perception and Process. Of these three,
Teamwork is the most desirable attribute.
Respondents were then asked to evaluate the Washington Technology Top 100, our annual
rankings of the largest primes in the government market, against several criteria under those
three attributes. Enough statistically significant data was collected to take a deep dive into
20 companies. This list of 20 includes the largest of the large on the Top 100: Lockheed Martin,
Northrop Grumman, Boeing, Science Applications International Corp., and Computer Sciences
Corp., to name a few.
Interestingly our focus group of 20 primes all rated between good and very good. However, a
significant disconnect from those ratings was revealed when respondents were asked more
open-ended questions about the general industry relationship between prime contractors and
subcontractors. The four open-ended questions in the survey generated a whopping 1,454
comments, some of which are included in the Verbatim Respondent Comments appendix.
That kind of response speaks volumes about subcontractors’ feelings on the state of prime-sub
relationships – and shows a real gap between the ratings and the reality of partnering.
Take a look and let me know what you think at [email protected].
Nick Wakeman, Editor-in-Chief
I N S I D E R R E P O R T 2 0 1 3
RESEARCH CONDUCTED BY:
4
I N S I D E R R E P O R T 2 0 1 3
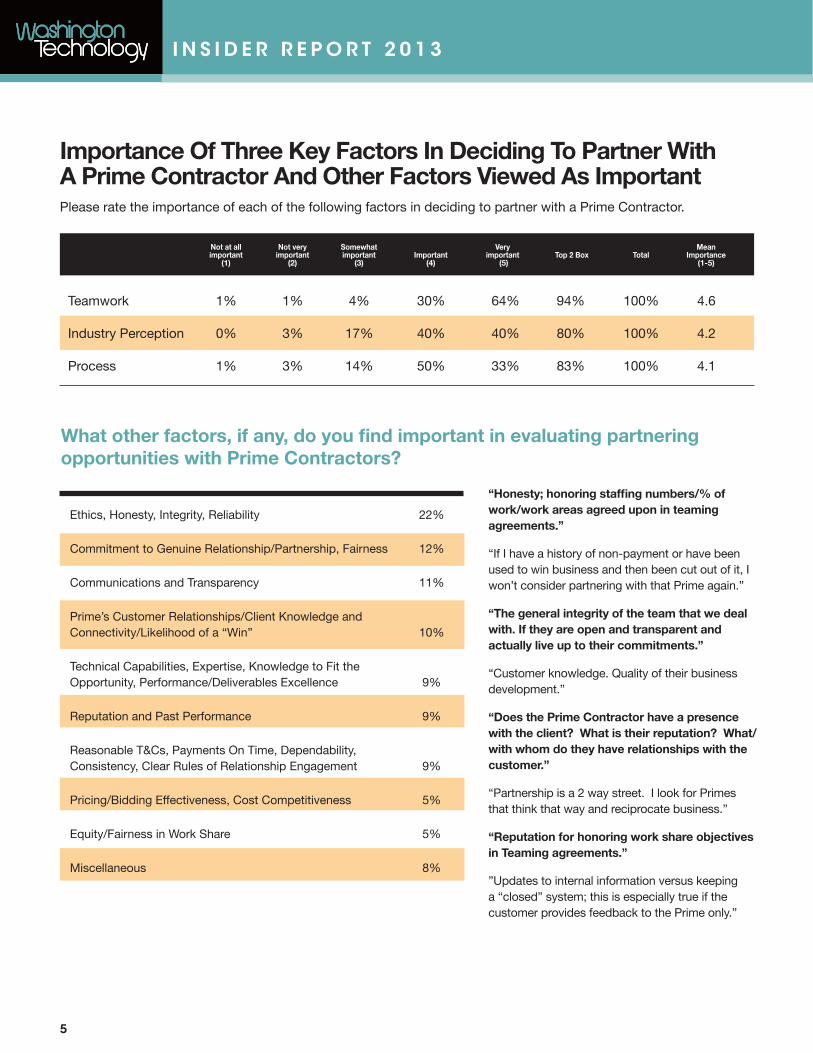
Importance Of Three Key Factors In Deciding To Partner With A Prime Contractor And Other Factors Viewed As ImportantPlease rate the importance of each of the following factors in deciding to partner with a Prime Contractor.
What other factors, if any, do you find important in evaluating partnering opportunities with Prime Contractors?
Teamwork 1% 1% 4% 30% 64% 94% 100% 4.6
Industry Perception 0% 3% 17% 40% 40% 80% 100% 4.2
Process 1% 3% 14% 50% 33% 83% 100% 4.1
Ethics, Honesty, Integrity, Reliability 22%
Commitment to Genuine Relationship/Partnership, Fairness 12%
Communications and Transparency 11%
Prime’s Customer Relationships/Client Knowledge and Connectivity/Likelihood of a “Win” 10%
Technical Capabilities, Expertise, Knowledge to Fit the Opportunity, Performance/Deliverables Excellence 9%
Reputation and Past Performance 9%
Reasonable T&Cs, Payments On Time, Dependability, Consistency, Clear Rules of Relationship Engagement 9%
Pricing/Bidding Effectiveness, Cost Competitiveness 5%
Equity/Fairness in Work Share 5%
Miscellaneous 8%
“Honesty; honoring staffing numbers/% of work/work areas agreed upon in teaming agreements.”
“If I have a history of non-payment or have been used to win business and then been cut out of it, I won’t consider partnering with that Prime again.”
“The general integrity of the team that we deal with. If they are open and transparent and actually live up to their commitments.”
“Customer knowledge. Quality of their business development.”
“Does the Prime Contractor have a presence with the client? What is their reputation? What/with whom do they have relationships with the customer.”
“Partnership is a 2 way street. I look for Primes that think that way and reciprocate business.”
“Reputation for honoring work share objectives in Teaming agreements.”
”Updates to internal information versus keeping a “closed” system; this is especially true if the customer provides feedback to the Prime only.”
Not at all Not very Somewhat Very Mean important important important Important important Top 2 Box Total Importance (1) (2) (3) (4) (5) (1-5)
5
I N S I D E R R E P O R T 2 0 1 3
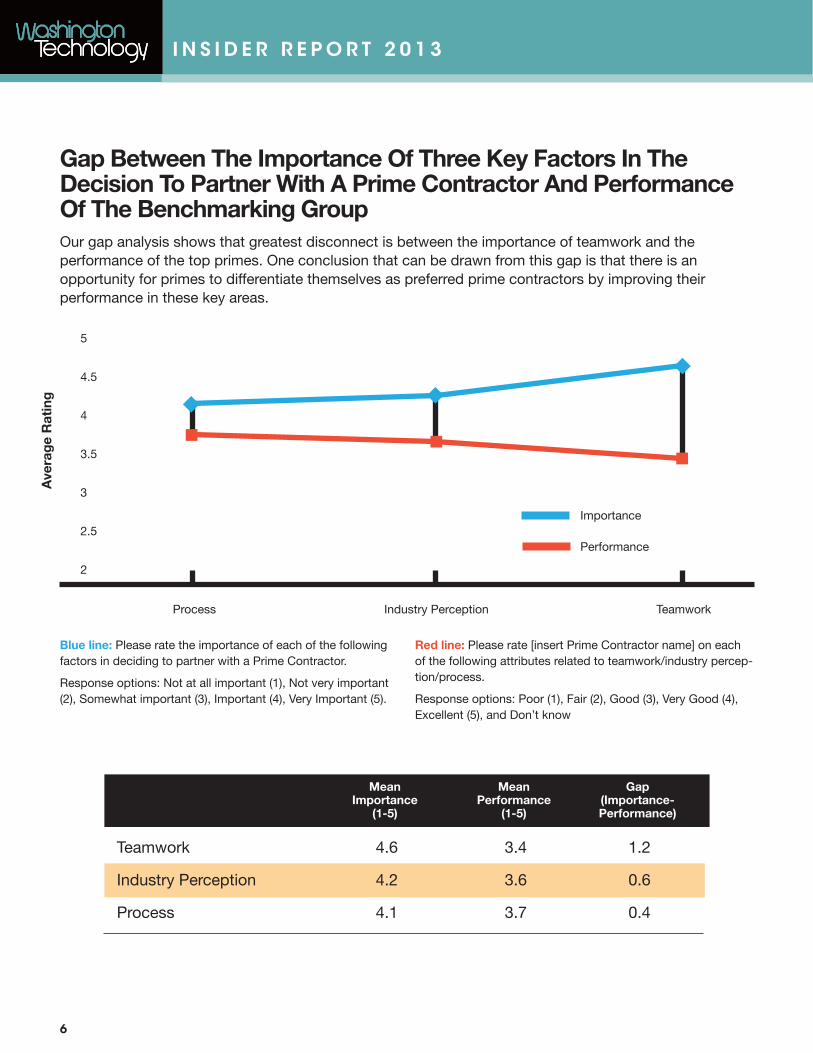
Gap Between The Importance Of Three Key Factors In The Decision To Partner With A Prime Contractor And Performance Of The Benchmarking GroupOur gap analysis shows that greatest disconnect is between the importance of teamwork and the performance of the top primes. One conclusion that can be drawn from this gap is that there is an opportunity for primes to differentiate themselves as preferred prime contractors by improving their performance in these key areas.
Teamwork 4.6 3.4 1.2
Industry Perception 4.2 3.6 0.6
Process 4.1 3.7 0.4
Blue line: Please rate the importance of each of the following factors in deciding to partner with a Prime Contractor.
Response options: Not at all important (1), Not very important (2), Somewhat important (3), Important (4), Very Important (5).
Red line: Please rate [insert Prime Contractor name] on each of the following attributes related to teamwork/industry percep-tion/process.
Response options: Poor (1), Fair (2), Good (3), Very Good (4), Excellent (5), and Don’t know
Ave
rag
e R
atin
g
Mean Mean Gap Importance Performance (Importance- (1-5) (1-5) Performance)
6
5
4.5
4
3.5
3
2.5
2
Importance
Performance
Process Industry Perception Teamwork
I N S I D E R R E P O R T 2 0 1 3
Prime Contractor Performance Ratings
The following prime contractor performance ratings represent survey respondents’ assessment of six key attributes in the areas of Teamwork, Industry Perception, and Process as applicable to their partnering relationship with the applicable prime.
The benchmark group of 20 prime contractors is comprised of those companies for which sufficient statistically significant data was collected to report their results. The benchmark group is listed below:
Accenture
BAE Systems
Boeing Co.
Booz Allen Hamilton
CACI International Inc.
Computer Sciences Corp.
Dell Inc.
Deloitte
General Dynamics Corp.
Hewlett-Packard Co.
IBM Corp.
L-3 Communications Corp.
Lockheed Martin Corp.
ManTech International Inc.
Northrop Grumman Corp.
Oracle Corp.
Raytheon Co.
SAIC
SRA International
Verizon Communications
Washington Technology2013 Prime Contractor Benchmarking Group
7
Click a contractor name to jump to their rating card.
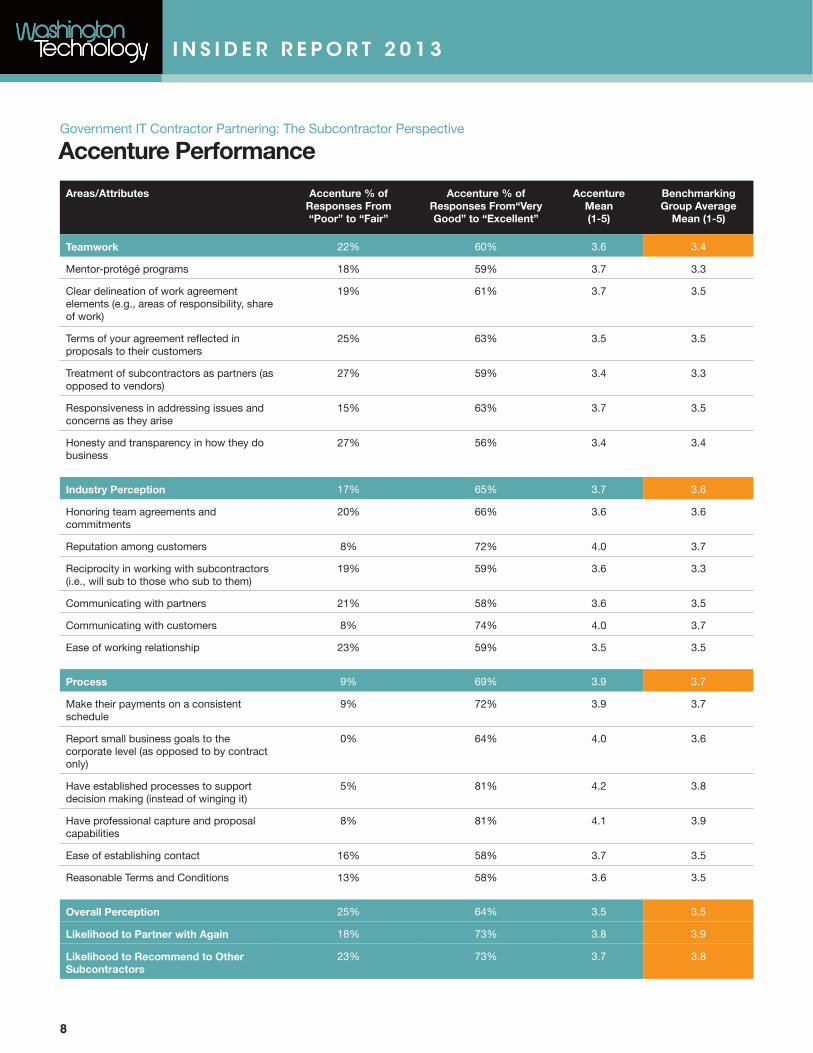
Accenture Performance
Areas/Attributes Accenture % of Responses From “Poor” to “Fair”
Accenture % of Responses From“Very Good” to “Excellent”
Accenture Mean(1-5)
Benchmarking Group Average
Mean (1-5)
Teamwork 22% 60% 3.6 3.4
Mentor-protégé programs 18% 59% 3.7 3.3
Clear delineation of work agreement elements (e.g., areas of responsibility, share of work)
19% 61% 3.7 3.5
Terms of your agreement reflected in proposals to their customers
25% 63% 3.5 3.5
Treatment of subcontractors as partners (as opposed to vendors)
27% 59% 3.4 3.3
Responsiveness in addressing issues and concerns as they arise
15% 63% 3.7 3.5
Honesty and transparency in how they do business
27% 56% 3.4 3.4
Industry Perception 17% 65% 3.7 3.6
Honoring team agreements and commitments
20% 66% 3.6 3.6
Reputation among customers 8% 72% 4.0 3.7
Reciprocity in working with subcontractors (i.e., will sub to those who sub to them)
19% 59% 3.6 3.3
Communicating with partners 21% 58% 3.6 3.5
Communicating with customers 8% 74% 4.0 3.7
Ease of working relationship 23% 59% 3.5 3.5
Process 9% 69% 3.9 3.7
Make their payments on a consistent schedule
9% 72% 3.9 3.7
Report small business goals to the corporate level (as opposed to by contract only)
0% 64% 4.0 3.6
Have established processes to support decision making (instead of winging it)
5% 81% 4.2 3.8
Have professional capture and proposal capabilities
8% 81% 4.1 3.9
Ease of establishing contact 16% 58% 3.7 3.5
Reasonable Terms and Conditions 13% 58% 3.6 3.5
Overall Perception 25% 64% 3.5 3.5
Likelihood to Partner with Again 18% 73% 3.8 3.9
Likelihood to Recommend to Other Subcontractors
23% 73% 3.7 3.8
Government IT Contractor Partnering: The Subcontractor Perspective
I N S I D E R R E P O R T 2 0 1 3
8

I N S I D E R R E P O R T 2 0 1 3
BAE Systems plc Performance
Areas/Attributes BAE Systems plc % of Responses From “Poor” to “Fair”
BAE Systems plc % of Responses From“Very Good” to “Excellent”
BAE Systems plc Mean
(1-5)
Benchmarking Group Average
Mean (1-5)
Teamwork 24% 47% 3.3 3.4
Mentor-protégé programs 44% 19% 2.5 3.3
Clear delineation of work agreement elements (e.g., areas of responsibility, share of work)
21% 53% 3.5 3.5
Terms of your agreement reflected in proposals to their customers
10% 58% 3.7 3.5
Treatment of subcontractors as partners (as opposed to vendors)
27% 50% 3.3 3.3
Responsiveness in addressing issues and concerns as they arise
15% 57% 3.5 3.5
Honesty and transparency in how they do business
26% 46% 3.3 3.4
Industry Perception 19% 54% 3.5 3.6
Honoring team agreements and commitments
21% 47% 3.4 3.6
Reputation among customers 12% 65% 3.7 3.7
Reciprocity in working with subcontractors (i.e., will sub to those who sub to them)
23% 44% 3.2 3.3
Communicating with partners 27% 50% 3.4 3.5
Communicating with customers 12% 66% 3.8 3.7
Ease of working relationship 18% 54% 3.5 3.5
Process 11% 60% 3.7 3.7
Make their payments on a consistent schedule
11% 55% 3.6 3.7
Report small business goals to the corporate level (as opposed to by contract only)
Insufficient data Insufficient data Insufficient data 3.6
Have established processes to support decision making (instead of winging it)
13% 68% 3.7 3.8
Have professional capture and proposal capabilities
6% 67% 3.9 3.9
Ease of establishing contact 14% 57% 3.7 3.5
Reasonable Terms and Conditions 12% 51% 3.5 3.5
Overall Perception 24% 50% 3.4 3.5
Likelihood to Partner with Again 12% 63% 3.8 3.9
Likelihood to Recommend to Other Subcontractors
23% 66% 3.9 3.8
Government IT Contractor Partnering: The Subcontractor Perspective
9

Boeing Performance
Areas/Attributes Boeing % of Responses From “Poor” to “Fair”
Boeing % of Responses From“Very Good” to
“Excellent”
Boeing Mean(1-5)
Benchmarking Group Average
Mean (1-5)
Teamwork 22% 45% 3.3 3.4
Mentor-protégé programs Insufficient Data Insufficient Data Insufficient Data 3.3
Clear delineation of work agreement elements (e.g., areas of responsibility, share of work)
16% 46% 3.4 3.5
Terms of your agreement reflected in proposals to their customers
13% 50% 3.6 3.5
Treatment of subcontractors as partners (as opposed to vendors)
28% 39% 3.1 3.3
Responsiveness in addressing issues and concerns as they arise
28% 46% 3.3 3.5
Honesty and transparency in how they do business
23% 42% 3.3 3.4
Industry Perception 14% 56% 3.6 3.6
Honoring team agreements and commitments
12% 54% 3.6 3.6
Reputation among customers 4% 75% 4.0 3.7
Reciprocity in working with subcontractors (i.e., will sub to those who sub to them)
26% 34% 3.2 3.3
Communicating with partners 18% 56% 3.6 3.5
Communicating with customers 8% 69% 3.9 3.7
Ease of working relationship 18% 48% 3.4 3.5
Process 14% 60% 3.7 3.7
Make their payments on a consistent schedule
10% 60% 3.8 3.7
Report small business goals to the corporate level (as opposed to by contract only)
Insufficient Data Insufficient Data Insufficient Data 3.6
Have established processes to support decision making (instead of winging it)
12% 75% 4.0 3.8
Have professional capture and proposal capabilities
8% 74% 3.9 3.9
Ease of establishing contact 18% 52% 3.5 3.5
Reasonable Terms and Conditions 20% 40% 3.3 3.5
Overall Perception 17% 52% 3.5 3.5
Likelihood to Partner with Again 11% 75% 4.0 3.9
Likelihood to Recommend to Other Subcontractors
11% 65% 3.8 3.8
Government IT Contractor Partnering: The Subcontractor Perspective
I N S I D E R R E P O R T 2 0 1 3
10

I N S I D E R R E P O R T 2 0 1 3
Booz Allen Hamilton Performance
Areas/Attributes BAH % of Responses From “Poor” to “Fair”
BAH % of Responses From“Very Good” to
“Excellent”
BAH Mean(1-5)
Benchmarking Group Average
Mean (1-5)
Teamwork 24% 37% 3.1 3.4
Mentor-protégé programs 28% 48% 3.1 3.3
Clear delineation of work agreement elements (e.g., areas of responsibility, share of work)
22% 40% 3.2 3.5
Terms of your agreement reflected in proposals to their customers
13% 33% 3.2 3.5
Treatment of subcontractors as partners (as opposed to vendors)
31% 29% 2.9 3.3
Responsiveness in addressing issues and concerns as they arise
24% 42% 3.2 3.5
Honesty and transparency in how they do business
23% 27% 3.0 3.4
Industry Perception 19% 52% 3.4 3.6
Honoring team agreements and commitments
21% 46% 3.3 3.6
Reputation among customers 6% 74% 3.9 3.7
Reciprocity in working with subcontractors (i.e., will sub to those who sub to them)
28% 44% 3.1 3.3
Communicating with partners 24% 43% 3.3 3.5
Communicating with customers 10% 63% 3.7 3.7
Ease of working relationship 25% 41% 3.2 3.5
Process 13% 48% 3.5 3.7
Make their payments on a consistent schedule
11% 50% 3.5 3.7
Report small business goals to the corporate level (as opposed to by contract only)
18% 45% 3.4 3.6
Have established processes to support decision making (instead of winging it)
7% 54% 3.6 3.8
Have professional capture and proposal capabilities
4% 63% 3.8 3.9
Ease of establishing contact 20% 43% 3.3 3.5
Reasonable Terms and Conditions 16% 32% 3.2 3.5
Overall Perception 23% 43% 3.1 3.5
Likelihood to Partner with Again 17% 67% 3.7 3.9
Likelihood to Recommend to Other Subcontractors
17% 63% 3.6 3.8
Government IT Contractor Partnering: The Subcontractor Perspective
11

I N S I D E R R E P O R T 2 0 1 3
CACI International Inc. Performance
Areas/Attributes CACI Int % of Responses From “Poor” to “Fair”
CACI Int % of Responses From“Very Good” to “Excellent”
CACI Int Mean(1-5)
Benchmarking Group Average
Mean (1-5)
Teamwork 31% 35% 3.1 3.4
Mentor-protégé programs 44% 33% 2.9 3.3
Clear delineation of work agreement elements (e.g., areas of responsibility, share of work)
25% 38% 3.3 3.5
Terms of your agreement reflected in proposals to their customers
22% 32% 3.2 3.5
Treatment of subcontractors as partners (as opposed to vendors)
40% 36% 3.0 3.3
Responsiveness in addressing issues and concerns as they arise
26% 30% 3.1 3.5
Honesty and transparency in how they do business
26% 38% 3.2 3.4
Industry Perception 23% 45% 3.3 3.6
Honoring team agreements and commitments
28% 43% 3.2 3.6
Reputation among customers 14% 52% 3.5 3.7
Reciprocity in working with subcontractors (i.e., will sub to those who sub to them)
33% 29% 3.0 3.3
Communicating with partners 26% 44% 3.3 3.5
Communicating with customers 14% 55% 3.6 3.7
Ease of working relationship 22% 45% 3.3 3.5
Process 17% 47% 3.5 3.7
Make their payments on a consistent schedule
12% 50% 3.5 3.7
Report small business goals to the corporate level (as opposed to by contract only)
28% 28% 3.1 3.6
Have established processes to support decision making (instead of winging it)
15% 54% 3.6 3.8
Have professional capture and proposal capabilities
8% 60% 3.7 3.9
Ease of establishing contact 20% 49% 3.5 3.5
Reasonable Terms and Conditions 21% 43% 3.3 3.5
Overall Perception 18% 46% 3.4 3.5
Likelihood to Partner with Again 14% 62% 3.8 3.9
Likelihood to Recommend to Other Subcontractors
16% 58% 3.7 3.8
Government IT Contractor Partnering: The Subcontractor Perspective
12

I N S I D E R R E P O R T 2 0 1 3
Computer Sciences Corp. Performance
Areas/Attributes CSC % of Responses From “Poor” to “Fair”
CSC % of Responses From“Very Good” to
“Excellent”
CSC Mean(1-5)
Benchmarking Group Average
Mean (1-5)
Teamwork 25% 43% 3.2 3.4
Mentor-protégé programs 36% 42% 3.1 3.3
Clear delineation of work agreement elements (e.g., areas of responsibility, share of work)
22% 48% 3.3 3.5
Terms of your agreement reflected in proposals to their customers
22% 47% 3.3 3.5
Treatment of subcontractors as partners (as opposed to vendors)
26% 37% 3.1 3.3
Responsiveness in addressing issues and concerns as they arise
20% 42% 3.3 3.5
Honesty and transparency in how they do business
23% 41% 3.2 3.4
Industry Perception 22% 43% 3.2 3.6
Honoring team agreements and commitments
16% 48% 3.4 3.6
Reputation among customers 18% 48% 3.4 3.7
Reciprocity in working with subcontractors (i.e., will sub to those who sub to them)
24% 36% 3.1 3.3
Communicating with partners 32% 44% 3.1 3.5
Communicating with customers 18% 42% 3.3 3.7
Ease of working relationship 26% 40% 3.1 3.5
Process 16% 47% 3.4 3.7
Make their payments on a consistent schedule
14% 47% 3.4 3.7
Report small business goals to the corporate level (as opposed to by contract only)
15% 40% 3.3 3.6
Have established processes to support decision making (instead of winging it)
15% 51% 3.5 3.8
Have professional capture and proposal capabilities
10% 54% 3.7 3.9
Ease of establishing contact 27% 44% 3.1 3.5
Reasonable Terms and Conditions 14% 47% 3.4 3.5
Overall Perception 25% 42% 3.2 3.5
Likelihood to Partner with Again 13% 64% 3.8 3.9
Likelihood to Recommend to Other Subcontractors
16% 64% 3.6 3.8
Government IT Contractor Partnering: The Subcontractor Perspective
13
I N S I D E R R E P O R T 2 0 1 3
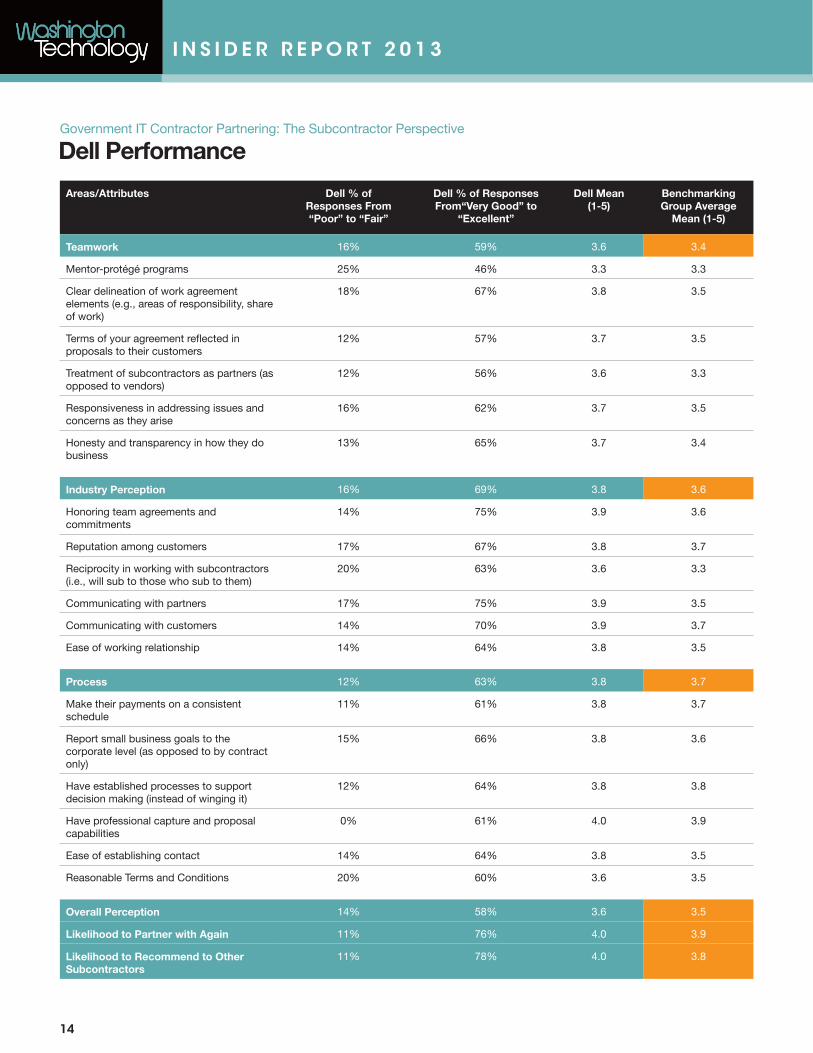
Dell Performance
Areas/Attributes Dell % of Responses From “Poor” to “Fair”
Dell % of Responses From“Very Good” to
“Excellent”
Dell Mean(1-5)
Benchmarking Group Average
Mean (1-5)
Teamwork 16% 59% 3.6 3.4
Mentor-protégé programs 25% 46% 3.3 3.3
Clear delineation of work agreement elements (e.g., areas of responsibility, share of work)
18% 67% 3.8 3.5
Terms of your agreement reflected in proposals to their customers
12% 57% 3.7 3.5
Treatment of subcontractors as partners (as opposed to vendors)
12% 56% 3.6 3.3
Responsiveness in addressing issues and concerns as they arise
16% 62% 3.7 3.5
Honesty and transparency in how they do business
13% 65% 3.7 3.4
Industry Perception 16% 69% 3.8 3.6
Honoring team agreements and commitments
14% 75% 3.9 3.6
Reputation among customers 17% 67% 3.8 3.7
Reciprocity in working with subcontractors (i.e., will sub to those who sub to them)
20% 63% 3.6 3.3
Communicating with partners 17% 75% 3.9 3.5
Communicating with customers 14% 70% 3.9 3.7
Ease of working relationship 14% 64% 3.8 3.5
Process 12% 63% 3.8 3.7
Make their payments on a consistent schedule
11% 61% 3.8 3.7
Report small business goals to the corporate level (as opposed to by contract only)
15% 66% 3.8 3.6
Have established processes to support decision making (instead of winging it)
12% 64% 3.8 3.8
Have professional capture and proposal capabilities
0% 61% 4.0 3.9
Ease of establishing contact 14% 64% 3.8 3.5
Reasonable Terms and Conditions 20% 60% 3.6 3.5
Overall Perception 14% 58% 3.6 3.5
Likelihood to Partner with Again 11% 76% 4.0 3.9
Likelihood to Recommend to Other Subcontractors
11% 78% 4.0 3.8
Government IT Contractor Partnering: The Subcontractor Perspective
14
I N S I D E R R E P O R T 2 0 1 3
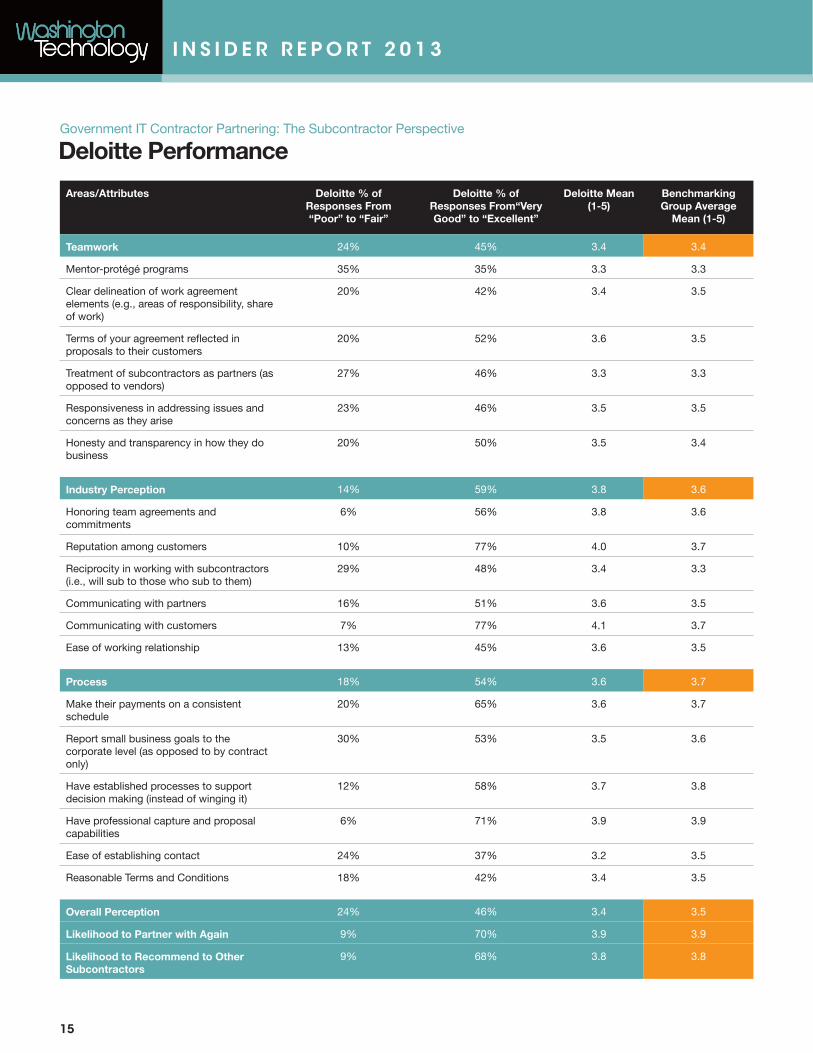
Deloitte Performance
Areas/Attributes Deloitte % of Responses From “Poor” to “Fair”
Deloitte % of Responses From“Very Good” to “Excellent”
Deloitte Mean(1-5)
Benchmarking Group Average
Mean (1-5)
Teamwork 24% 45% 3.4 3.4
Mentor-protégé programs 35% 35% 3.3 3.3
Clear delineation of work agreement elements (e.g., areas of responsibility, share of work)
20% 42% 3.4 3.5
Terms of your agreement reflected in proposals to their customers
20% 52% 3.6 3.5
Treatment of subcontractors as partners (as opposed to vendors)
27% 46% 3.3 3.3
Responsiveness in addressing issues and concerns as they arise
23% 46% 3.5 3.5
Honesty and transparency in how they do business
20% 50% 3.5 3.4
Industry Perception 14% 59% 3.8 3.6
Honoring team agreements and commitments
6% 56% 3.8 3.6
Reputation among customers 10% 77% 4.0 3.7
Reciprocity in working with subcontractors (i.e., will sub to those who sub to them)
29% 48% 3.4 3.3
Communicating with partners 16% 51% 3.6 3.5
Communicating with customers 7% 77% 4.1 3.7
Ease of working relationship 13% 45% 3.6 3.5
Process 18% 54% 3.6 3.7
Make their payments on a consistent schedule
20% 65% 3.6 3.7
Report small business goals to the corporate level (as opposed to by contract only)
30% 53% 3.5 3.6
Have established processes to support decision making (instead of winging it)
12% 58% 3.7 3.8
Have professional capture and proposal capabilities
6% 71% 3.9 3.9
Ease of establishing contact 24% 37% 3.2 3.5
Reasonable Terms and Conditions 18% 42% 3.4 3.5
Overall Perception 24% 46% 3.4 3.5
Likelihood to Partner with Again 9% 70% 3.9 3.9
Likelihood to Recommend to Other Subcontractors
9% 68% 3.8 3.8
Government IT Contractor Partnering: The Subcontractor Perspective
15

I N S I D E R R E P O R T 2 0 1 3
General Dynamics Performance
Areas/Attributes General Dynamics % of Responses From “Poor” to “Fair”
General Dynamics % of Responses From“Very Good” to “Excellent”
General Dynamics Mean
(1-5)
Benchmarking Group Average
Mean (1-5)
Teamwork 19% 53% 3.5 3.4
Mentor-protégé programs 26% 52% 3.4 3.3
Clear delineation of work agreement elements (e.g., areas of responsibility, share of work)
7% 55% 3.6 3.5
Terms of your agreement reflected in proposals to their customers
17% 55% 3.6 3.5
Treatment of subcontractors as partners (as opposed to vendors)
26% 53% 3.4 3.3
Responsiveness in addressing issues and concerns as they arise
16% 55% 3.5 3.5
Honesty and transparency in how they do business
19% 50% 3.4 3.4
Industry Perception 19% 55% 3.5 3.6
Honoring team agreements and commitments
16% 56% 3.6 3.6
Reputation among customers 10% 57% 3.7 3.7
Reciprocity in working with subcontractors (i.e., will sub to those who sub to them)
25% 48% 3.3 3.3
Communicating with partners 24% 48% 3.4 3.5
Communicating with customers 19% 65% 3.7 3.7
Ease of working relationship 20% 56% 3.5 3.5
Process 12% 59% 3.7 3.7
Make their payments on a consistent schedule
9% 62% 3.8 3.7
Report small business goals to the corporate level (as opposed to by contract only)
18% 60% 3.6 3.6
Have established processes to support decision making (instead of winging it)
8% 56% 3.8 3.8
Have professional capture and proposal capabilities
4% 69% 4.0 3.9
Ease of establishing contact 14% 54% 3.6 3.5
Reasonable Terms and Conditions 16% 51% 3.5 3.5
Overall Perception 17% 54% 3.6 3.5
Likelihood to Partner with Again 6% 77% 4.1 3.9
Likelihood to Recommend to Other Subcontractors
10% 71% 4.0 3.8
Government IT Contractor Partnering: The Subcontractor Perspective
16

I N S I D E R R E P O R T 2 0 1 3
Hewlett-Packard Performance
Areas/Attributes Hewlett-Packard % of Responses From “Poor” to “Fair”
Hewlett-Packard % of Responses From“Very Good” to “Excellent”
Hewlett-Packard Mean
(1-5)
Benchmarking Group Average
Mean (1-5)
Teamwork 20% 56% 3.6 3.4
Mentor-protégé programs 22% 48% 3.4 3.3
Clear delineation of work agreement elements (e.g., areas of responsibility, share of work)
14% 64% 3.7 3.5
Terms of your agreement reflected in proposals to their customers
13% 62% 3.7 3.5
Treatment of subcontractors as partners (as opposed to vendors)
31% 57% 3.4 3.3
Responsiveness in addressing issues and concerns as they arise
21% 51% 3.5 3.5
Honesty and transparency in how they do business
19% 54% 3.6 3.4
Industry Perception 19% 62% 3.7 3.6
Honoring team agreements and commitments
17% 63% 3.8 3.6
Reputation among customers 15% 68% 3.9 3.7
Reciprocity in working with subcontractors (i.e., will sub to those who sub to them)
26% 47% 3.3 3.3
Communicating with partners 20% 69% 3.8 3.5
Communicating with customers 16% 64% 3.8 3.7
Ease of working relationship 20% 59% 3.6 3.5
Process 12% 67% 3.8 3.7
Make their payments on a consistent schedule
11% 71% 4.0 3.7
Report small business goals to the corporate level (as opposed to by contract only)
9% 67% 3.9 3.6
Have established processes to support decision making (instead of winging it)
10% 66% 3.8 3.8
Have professional capture and proposal capabilities
4% 72% 4.0 3.9
Ease of establishing contact 18% 59% 3.5 3.5
Reasonable Terms and Conditions 19% 67% 3.8 3.5
Overall Perception 20% 62% 3.6 3.5
Likelihood to Partner with Again 2% 80% 4.3 3.9
Likelihood to Recommend to Other Subcontractors
11% 72% 4.0 3.8
Government IT Contractor Partnering: The Subcontractor Perspective
17

I N S I D E R R E P O R T 2 0 1 3
IBM Performance
Areas/Attributes IBM % of Responses From “Poor” to “Fair”
IBM % of Responses From“Very Good” to
“Excellent”
IBM Mean(1-5)
Benchmarking Group Average
Mean (1-5)
Teamwork 18% 55% 3.5 3.4
Mentor-protégé programs 26% 55% 3.4 3.3
Clear delineation of work agreement elements (e.g., areas of responsibility, share of work)
14% 57% 3.6 3.5
Terms of your agreement reflected in proposals to their customers
13% 61% 3.7 3.5
Treatment of subcontractors as partners (as opposed to vendors)
28% 49% 3.3 3.3
Responsiveness in addressing issues and concerns as they arise
15% 50% 3.5 3.5
Honesty and transparency in how they do business
13% 56% 3.6 3.4
Industry Perception 14% 61% 3.7 3.6
Honoring team agreements and commitments
16% 61% 3.6 3.6
Reputation among customers 7% 72% 4.0 3.7
Reciprocity in working with subcontractors (i.e., will sub to those who sub to them)
14% 54% 3.6 3.3
Communicating with partners 21% 63% 3.7 3.5
Communicating with customers 10% 63% 3.7 3.7
Ease of working relationship 14% 52% 3.5 3.5
Process 12% 60% 3.7 3.7
Make their payments on a consistent schedule
6% 64% 3.8 3.7
Report small business goals to the corporate level (as opposed to by contract only)
11% 55% 3.6 3.6
Have established processes to support decision making (instead of winging it)
5% 62% 3.8 3.8
Have professional capture and proposal capabilities
13% 66% 3.8 3.9
Ease of establishing contact 24% 59% 3.6 3.5
Reasonable Terms and Conditions 10% 52% 3.6 3.5
Overall Perception 16% 53% 3.5 3.5
Likelihood to Partner with Again 9% 82% 4.1 3.9
Likelihood to Recommend to Other Subcontractors
7% 75% 4.0 3.8
Government IT Contractor Partnering: The Subcontractor Perspective
18
I N S I D E R R E P O R T 2 0 1 3
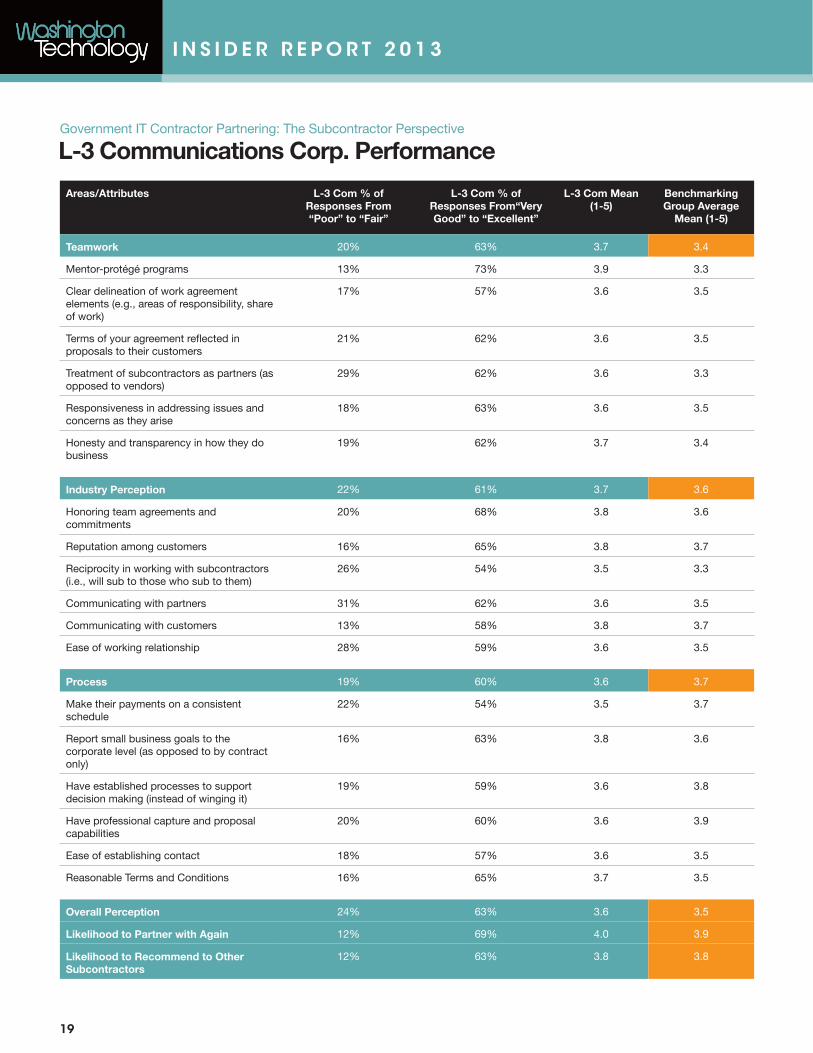
L-3 Communications Corp. Performance
Areas/Attributes L-3 Com % of Responses From “Poor” to “Fair”
L-3 Com % of Responses From“Very Good” to “Excellent”
L-3 Com Mean(1-5)
Benchmarking Group Average
Mean (1-5)
Teamwork 20% 63% 3.7 3.4
Mentor-protégé programs 13% 73% 3.9 3.3
Clear delineation of work agreement elements (e.g., areas of responsibility, share of work)
17% 57% 3.6 3.5
Terms of your agreement reflected in proposals to their customers
21% 62% 3.6 3.5
Treatment of subcontractors as partners (as opposed to vendors)
29% 62% 3.6 3.3
Responsiveness in addressing issues and concerns as they arise
18% 63% 3.6 3.5
Honesty and transparency in how they do business
19% 62% 3.7 3.4
Industry Perception 22% 61% 3.7 3.6
Honoring team agreements and commitments
20% 68% 3.8 3.6
Reputation among customers 16% 65% 3.8 3.7
Reciprocity in working with subcontractors (i.e., will sub to those who sub to them)
26% 54% 3.5 3.3
Communicating with partners 31% 62% 3.6 3.5
Communicating with customers 13% 58% 3.8 3.7
Ease of working relationship 28% 59% 3.6 3.5
Process 19% 60% 3.6 3.7
Make their payments on a consistent schedule
22% 54% 3.5 3.7
Report small business goals to the corporate level (as opposed to by contract only)
16% 63% 3.8 3.6
Have established processes to support decision making (instead of winging it)
19% 59% 3.6 3.8
Have professional capture and proposal capabilities
20% 60% 3.6 3.9
Ease of establishing contact 18% 57% 3.6 3.5
Reasonable Terms and Conditions 16% 65% 3.7 3.5
Overall Perception 24% 63% 3.6 3.5
Likelihood to Partner with Again 12% 69% 4.0 3.9
Likelihood to Recommend to Other Subcontractors
12% 63% 3.8 3.8
Government IT Contractor Partnering: The Subcontractor Perspective
19

I N S I D E R R E P O R T 2 0 1 3
Lockheed Martin Corporation Performance
Areas/Attributes LMC % of Responses From “Poor” to “Fair”
LMC % of Responses From“Very Good” to
“Excellent”
LMC Mean(1-5)
Benchmarking Group Average
Mean (1-5)
Teamwork 25% 49% 3.4 3.4
Mentor-protégé programs 20% 52% 3.5 3.3
Clear delineation of work agreement elements (e.g., areas of responsibility, share of work)
20% 53% 3.4 3.5
Terms of your agreement reflected in proposals to their customers
19% 48% 3.5 3.5
Treatment of subcontractors as partners (as opposed to vendors)
36% 45% 3.1 3.3
Responsiveness in addressing issues and concerns as they arise
24% 48% 3.3 3.5
Honesty and transparency in how they do business
29% 49% 3.3 3.4
Industry Perception 23% 52% 3.4 3.6
Honoring team agreements and commitments
24% 47% 3.4 3.6
Reputation among customers 12% 66% 3.8 3.7
Reciprocity in working with subcontractors (i.e., will sub to those who sub to them)
31% 42% 3.1 3.3
Communicating with partners 32% 48% 3.3 3.5
Communicating with customers 11% 61% 3.7 3.7
Ease of working relationship 27% 47% 3.3 3.5
Process 16% 57% 3.7 3.7
Make their payments on a consistent schedule
16% 55% 3.7 3.7
Report small business goals to the corporate level (as opposed to by contract only)
13% 57% 3.6 3.6
Have established processes to support decision making (instead of winging it)
8% 65% 3.9 3.8
Have professional capture and proposal capabilities
7% 75% 4.1 3.9
Ease of establishing contact 27% 44% 3.3 3.5
Reasonable Terms and Conditions 23% 46% 3.3 3.5
Overall Perception 24% 46% 3.3 3.5
Likelihood to Partner with Again 16% 68% 3.8 3.9
Likelihood to Recommend to Other Subcontractors
17% 64% 3.7 3.8
Government IT Contractor Partnering: The Subcontractor Perspective
20
I N S I D E R R E P O R T 2 0 1 3
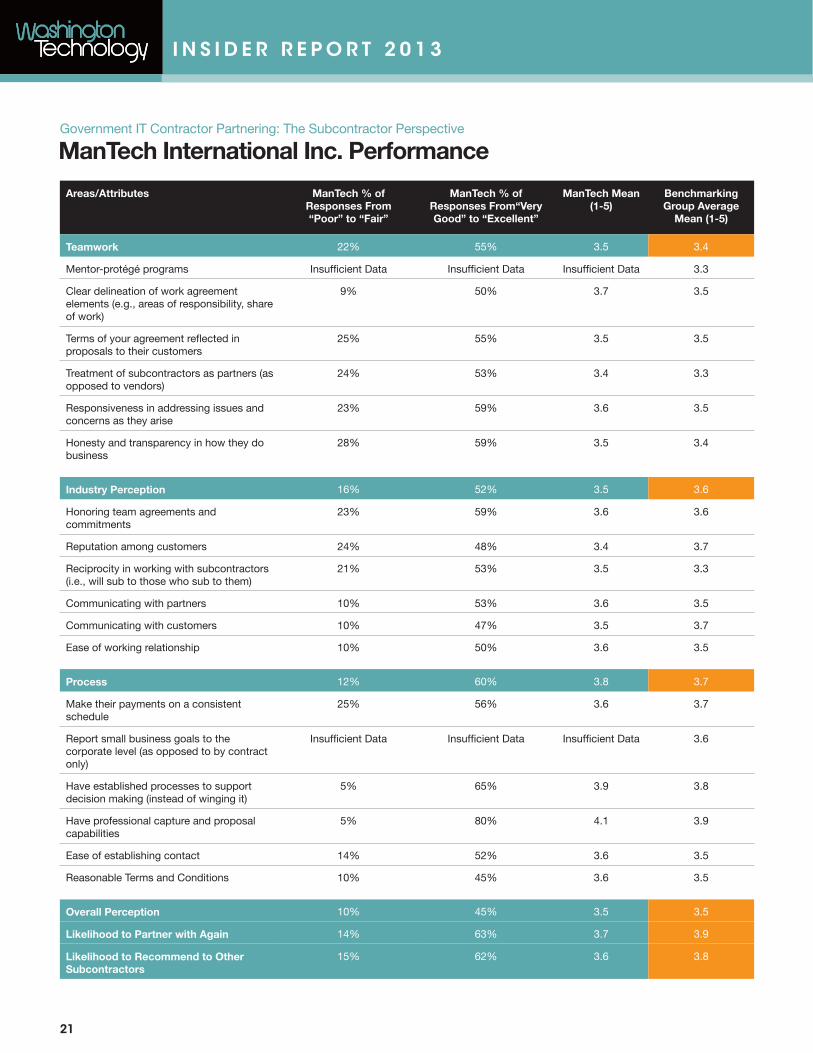
ManTech International Inc. Performance
Areas/Attributes ManTech % of Responses From “Poor” to “Fair”
ManTech % of Responses From“Very Good” to “Excellent”
ManTech Mean(1-5)
Benchmarking Group Average
Mean (1-5)
Teamwork 22% 55% 3.5 3.4
Mentor-protégé programs Insufficient Data Insufficient Data Insufficient Data 3.3
Clear delineation of work agreement elements (e.g., areas of responsibility, share of work)
9% 50% 3.7 3.5
Terms of your agreement reflected in proposals to their customers
25% 55% 3.5 3.5
Treatment of subcontractors as partners (as opposed to vendors)
24% 53% 3.4 3.3
Responsiveness in addressing issues and concerns as they arise
23% 59% 3.6 3.5
Honesty and transparency in how they do business
28% 59% 3.5 3.4
Industry Perception 16% 52% 3.5 3.6
Honoring team agreements and commitments
23% 59% 3.6 3.6
Reputation among customers 24% 48% 3.4 3.7
Reciprocity in working with subcontractors (i.e., will sub to those who sub to them)
21% 53% 3.5 3.3
Communicating with partners 10% 53% 3.6 3.5
Communicating with customers 10% 47% 3.5 3.7
Ease of working relationship 10% 50% 3.6 3.5
Process 12% 60% 3.8 3.7
Make their payments on a consistent schedule
25% 56% 3.6 3.7
Report small business goals to the corporate level (as opposed to by contract only)
Insufficient Data Insufficient Data Insufficient Data 3.6
Have established processes to support decision making (instead of winging it)
5% 65% 3.9 3.8
Have professional capture and proposal capabilities
5% 80% 4.1 3.9
Ease of establishing contact 14% 52% 3.6 3.5
Reasonable Terms and Conditions 10% 45% 3.6 3.5
Overall Perception 10% 45% 3.5 3.5
Likelihood to Partner with Again 14% 63% 3.7 3.9
Likelihood to Recommend to Other Subcontractors
15% 62% 3.6 3.8
Government IT Contractor Partnering: The Subcontractor Perspective
21

I N S I D E R R E P O R T 2 0 1 3
Northrop Grumman Performance
Areas/Attributes NG % of Responses From “Poor” to “Fair”
NG % of Responses From“Very Good” to
“Excellent”
NG Mean(1-5)
Benchmarking Group Average
Mean (1-5)
Teamwork 24% 56% 3.6 3.4
Mentor-protégé programs 34% 55% 3.4 3.3
Clear delineation of work agreement elements (e.g., areas of responsibility, share of work)
17% 58% 3.6 3.5
Terms of your agreement reflected in proposals to their customers
18% 54% 3.6 3.5
Treatment of subcontractors as partners (as opposed to vendors)
24% 55% 3.5 3.3
Responsiveness in addressing issues and concerns as they arise
25% 58% 3.6 3.5
Honesty and transparency in how they do business
25% 56% 3.6 3.4
Industry Perception 22% 56% 3.6 3.6
Honoring team agreements and commitments
22% 58% 3.6 3.6
Reputation among customers 18% 58% 3.7 3.7
Reciprocity in working with subcontractors (i.e., will sub to those who sub to them)
28% 51% 3.4 3.3
Communicating with partners 23% 56% 3.5 3.5
Communicating with customers 15% 58% 3.7 3.7
Ease of working relationship 24% 52% 3.5 3.5
Process 15% 60% 3.7 3.7
Make their payments on a consistent schedule
14% 61% 3.8 3.7
Report small business goals to the corporate level (as opposed to by contract only)
19% 61% 3.7 3.6
Have established processes to support decision making (instead of winging it)
9% 66% 3.9 3.8
Have professional capture and proposal capabilities
8% 72% 4.0 3.9
Ease of establishing contact 19% 52% 3.5 3.5
Reasonable Terms and Conditions 18% 49% 3.5 3.5
Overall Perception 23% 53% 3.5 3.5
Likelihood to Partner with Again 12% 74% 4.1 3.9
Likelihood to Recommend to Other Subcontractors
16% 72% 3.9 3.8
Government IT Contractor Partnering: The Subcontractor Perspective
22

I N S I D E R R E P O R T 2 0 1 3
Oracle Corp. Performance
Areas/Attributes Oracle % of Responses From “Poor” to “Fair”
Oracle % of Responses From“Very Good” to
“Excellent”
Oracle Mean(1-5)
Benchmarking Group Average
Mean (1-5)
Teamwork 14% 42% 3.4 3.4
Mentor-protégé programs Insufficient Data Insufficient Data Insufficient Data 3.3
Clear delineation of work agreement elements (e.g., areas of responsibility, share of work)
10% 48% 3.6 3.5
Terms of your agreement reflected in proposals to their customers
5% 48% 3.6 3.5
Treatment of subcontractors as partners (as opposed to vendors)
19% 38% 3.3 3.3
Responsiveness in addressing issues and concerns as they arise
14% 46% 3.5 3.5
Honesty and transparency in how they do business
23% 32% 3.2 3.4
Industry Perception 17% 47% 3.4 3.6
Honoring team agreements and commitments
10% 52% 3.6 3.6
Reputation among customers 10% 55% 3.6 3.7
Reciprocity in working with subcontractors (i.e., will sub to those who sub to them)
19% 41% 3.3 3.3
Communicating with partners 25% 35% 3.1 3.5
Communicating with customers 14% 50% 3.5 3.7
Ease of working relationship 23% 50% 3.4 3.5
Process 16% 53% 3.5 3.7
Make their payments on a consistent schedule
10% 45% 3.5 3.7
Report small business goals to the corporate level (as opposed to by contract only)
12% 48% 3.5 3.6
Have established processes to support decision making (instead of winging it)
15% 55% 3.5 3.8
Have professional capture and proposal capabilities
19% 62% 3.6 3.9
Ease of establishing contact 14% 59% 3.5 3.5
Reasonable Terms and Conditions 24% 47% 3.3 3.5
Overall Perception 13% 48% 3.6 3.5
Likelihood to Partner with Again 4% 78% 4.1 3.9
Likelihood to Recommend to Other Subcontractors
4% 78% 4.1 3.8
Government IT Contractor Partnering: The Subcontractor Perspective
23

I N S I D E R R E P O R T 2 0 1 3
Raytheon Co. Performance
Areas/Attributes Raytheon % of Responses From “Poor” to “Fair”
Raytheon % of Responses From“Very Good” to “Excellent”
Raytheon Mean(1-5)
Benchmarking Group Average
Mean (1-5)
Teamwork 24% 53% 3.4 3.4
Mentor-protégé programs 19% 54% 3.5 3.3
Clear delineation of work agreement elements (e.g., areas of responsibility, share of work)
21% 53% 3.5 3.5
Terms of your agreement reflected in proposals to their customers
24% 54% 3.4 3.5
Treatment of subcontractors as partners (as opposed to vendors)
28% 49% 3.3 3.3
Responsiveness in addressing issues and concerns as they arise
28% 53% 3.4 3.5
Honesty and transparency in how they do business
25% 52% 3.4 3.4
Industry Perception 24% 53% 3.4 3.6
Honoring team agreements and commitments
18% 56% 3.4 3.6
Reputation among customers 22% 59% 3.5 3.7
Reciprocity in working with subcontractors (i.e., will sub to those who sub to them)
26% 56% 3.4 3.3
Communicating with partners 25% 46% 3.3 3.5
Communicating with customers 24% 50% 3.4 3.7
Ease of working relationship 31% 48% 3.2 3.5
Process 20% 63% 3.6 3.7
Make their payments on a consistent schedule
24% 60% 3.5 3.7
Report small business goals to the corporate level (as opposed to by contract only)
20% 62% 3.7 3.6
Have established processes to support decision making (instead of winging it)
17% 69% 3.6 3.8
Have professional capture and proposal capabilities
16% 67% 3.8 3.9
Ease of establishing contact 19% 58% 3.6 3.5
Reasonable Terms and Conditions 24% 59% 3.5 3.5
Overall Perception 22% 53% 3.4 3.5
Likelihood to Partner with Again 10% 79% 4.1 3.9
Likelihood to Recommend to Other Subcontractors
12% 72% 3.9 3.8
Government IT Contractor Partnering: The Subcontractor Perspective
24

I N S I D E R R E P O R T 2 0 1 3
SAIC Performance
Areas/Attributes SAIC % of Responses From “Poor” to “Fair”
SAIC % of Responses From“Very Good” to
“Excellent”
SAIC Mean(1-5)
Benchmarking Group Average
Mean (1-5)
Teamwork 26% 47% 3.4 3.4
Mentor-protégé programs 34% 47% 3.3 3.3
Clear delineation of work agreement elements (e.g., areas of responsibility, share of work)
22% 48% 3.4 3.5
Terms of your agreement reflected in proposals to their customers
22% 47% 3.4 3.5
Treatment of subcontractors as partners (as opposed to vendors)
26% 48% 3.3 3.3
Responsiveness in addressing issues and concerns as they arise
23% 49% 3.4 3.5
Honesty and transparency in how they do business
28% 45% 3.3 3.4
Industry Perception 18% 54% 3.5 3.6
Honoring team agreements and commitments
17% 54% 3.5 3.6
Reputation among customers 10% 65% 3.8 3.7
Reciprocity in working with subcontractors (i.e., will sub to those who sub to them)
28% 46% 3.3 3.3
Communicating with partners 24% 49% 3.3 3.5
Communicating with customers 8% 61% 3.7 3.7
Ease of working relationship 20% 49% 3.4 3.5
Process 15% 56% 3.7 3.7
Make their payments on a consistent schedule
13% 55% 3.7 3.7
Report small business goals to the corporate level (as opposed to by contract only)
17% 47% 3.6 3.6
Have established processes to support decision making (instead of winging it)
13% 61% 3.7 3.8
Have professional capture and proposal capabilities
6% 72% 4.0 3.9
Ease of establishing contact 21% 52% 3.5 3.5
Reasonable Terms and Conditions 17% 50% 3.4 3.5
Overall Perception 17% 53% 3.5 3.5
Likelihood to Partner with Again 13% 69% 3.9 3.9
Likelihood to Recommend to Other Subcontractors
15% 62% 3.7 3.8
Government IT Contractor Partnering: The Subcontractor Perspective
25

I N S I D E R R E P O R T 2 0 1 3
SRA International Performance
Areas/Attributes SRA Int % of Responses From “Poor” to “Fair”
SRA Int % of Responses From“Very Good” to
“Excellent”
SRA Int Mean(1-5)
Benchmarking Group Average
Mean (1-5)
Teamwork 35% 44% 3.2 3.4
Mentor-protégé programs Insufficient Data Insufficient Data Insufficient Data 3.3
Clear delineation of work agreement elements (e.g., areas of responsibility, share of work)
28% 50% 3.4 3.5
Terms of your agreement reflected in proposals to their customers
26% 44% 3.4 3.5
Treatment of subcontractors as partners (as opposed to vendors)
50% 33% 2.7 3.3
Responsiveness in addressing issues and concerns as they arise
32% 48% 3.2 3.5
Honesty and transparency in how they do business
37% 47% 3.2 3.4
Industry Perception 24% 50% 3.4 3.6
Honoring team agreements and commitments
26% 52% 3.5 3.6
Reputation among customers 15% 50% 3.5 3.7
Reciprocity in working with subcontractors (i.e., will sub to those who sub to them)
30% 47% 3.1 3.3
Communicating with partners 27% 53% 3.3 3.5
Communicating with customers 25% 50% 3.4 3.7
Ease of working relationship 20% 50% 3.5 3.5
Process 26% 54% 3.5 3.7
Make their payments on a consistent schedule
Insufficient Data Insufficient Data Insufficient Data 3.7
Report small business goals to the corporate level (as opposed to by contract only)
Insufficient Data Insufficient Data Insufficient Data 3.6
Have established processes to support decision making (instead of winging it)
27% 63% 3.5 3.8
Have professional capture and proposal capabilities
23% 56% 3.7 3.9
Ease of establishing contact 26% 53% 3.4 3.5
Reasonable Terms and Conditions 26% 42% 3.4 3.5
Overall Perception 30% 45% 3.3 3.5
Likelihood to Partner with Again 19% 57% 3.7 3.9
Likelihood to Recommend to Other Subcontractors
20% 57% 3.5 3.8
Government IT Contractor Partnering: The Subcontractor Perspective
26

I N S I D E R R E P O R T 2 0 1 3
Verizon Communications Performance
Areas/Attributes Verizon % of Responses From “Poor” to “Fair”
Verizon % of Responses From“Very Good” to
“Excellent”
Verizon Mean(1-5)
Benchmarking Group Average
Mean (1-5)
Teamwork 14% 59% 3.7 3.4
Mentor-protégé programs 19% 57% 3.4 3.3
Clear delineation of work agreement elements (e.g., areas of responsibility, share of work)
13% 60% 3.7 3.5
Terms of your agreement reflected in proposals to their customers
9% 59% 3.8 3.5
Treatment of subcontractors as partners (as opposed to vendors)
10% 52% 3.7 3.3
Responsiveness in addressing issues and concerns as they arise
16% 64% 3.6 3.5
Honesty and transparency in how they do business
16% 64% 3.7 3.4
Industry Perception 12% 61% 3.7 3.6
Honoring team agreements and commitments
16% 54% 3.5 3.6
Reputation among customers 8% 67% 3.8 3.7
Reciprocity in working with subcontractors (i.e., will sub to those who sub to them)
13% 57% 3.6 3.3
Communicating with partners 12% 62% 3.8 3.5
Communicating with customers 12% 72% 3.8 3.7
Ease of working relationship 8% 56% 3.6 3.5
Process 13% 60% 3.8 3.7
Make their payments on a consistent schedule
10% 53% 3.7 3.7
Report small business goals to the corporate level (as opposed to by contract only)
16% 64% 3.8 3.6
Have established processes to support decision making (instead of winging it)
13% 70% 3.9 3.8
Have professional capture and proposal capabilities
8% 60% 3.9 3.9
Ease of establishing contact 20% 56% 3.6 3.5
Reasonable Terms and Conditions 12% 56% 3.6 3.5
Overall Perception 15% 57% 3.5 3.5
Likelihood to Partner with Again 8% 88% 4.2 3.9
Likelihood to Recommend to Other Subcontractors
8% 72% 3.9 3.8
Government IT Contractor Partnering: The Subcontractor Perspective
27
I N S I D E R R E P O R T 2 0 1 3
28
“Prime Contractors are looking for ways to respond to quick reaction contracts accurately and consistently without the overhead and process delays inherent in large prime contractor infrastructure and teaming allows freedom to share best practices to streamline proposal and program execution timelines.”
“The “value placed” by the Prime, in me the Sub, has improved. My perception is I am an acknowledged, respected piece of the overall equation, the solution put forth to the end clients.”
“The market is tighter with more competition than ever, most sub-contractors and prime ones are more willing to work things out if necessary.”
“Harder to negotiate work share - everyone fighting for margin - industry is like a melting ice cube putting pressure on all sides of deals.”
“Far more onerous terms and conditions, increased insurance limits, flow down of ridiculous T&Cs in which I have no part negotiating.”
“In general they don’t want to work with subs unless the contract requires it. They are process heavy and could care less what it cost a sub to comply with their process that often they don’t follow themselves. Often they are over focused on short term numbers and forget about value (they buy on price and bitch about their customers buying on price). This results in poor value returns for everyone and project cost that are five times too high.”
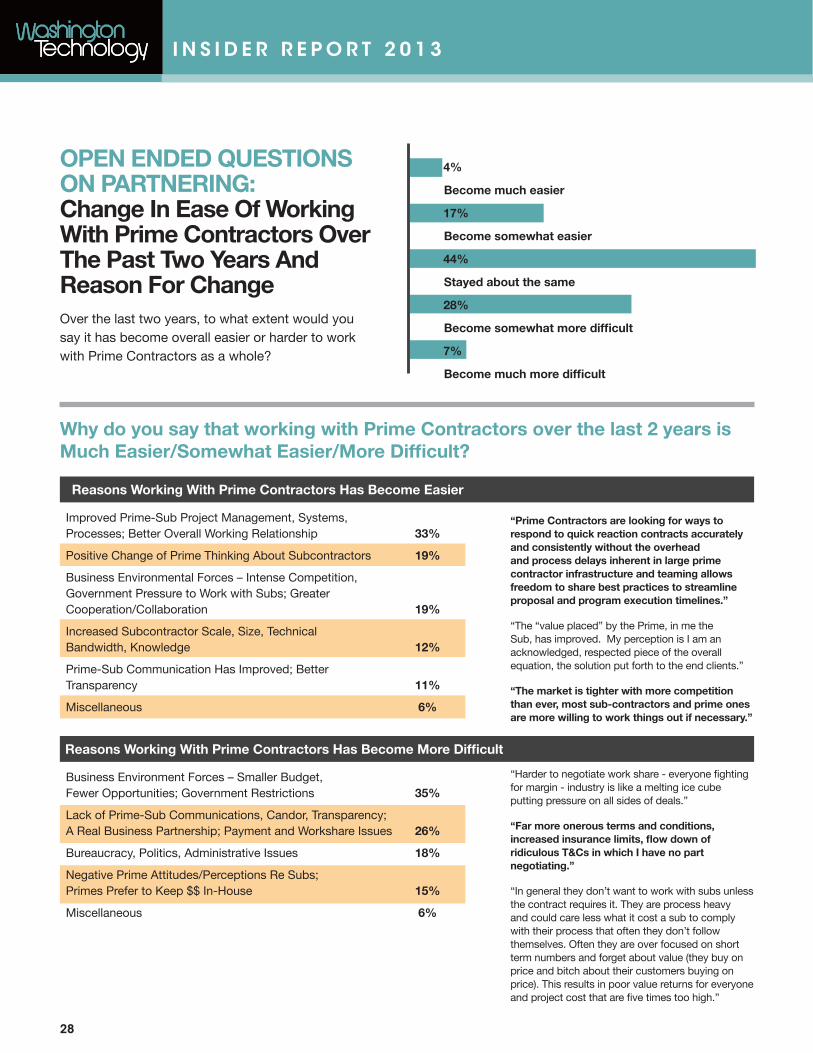
Improved Prime-Sub Project Management, Systems, Processes; Better Overall Working Relationship 33%
Positive Change of Prime Thinking About Subcontractors 19%
Business Environmental Forces – Intense Competition, Government Pressure to Work with Subs; Greater Cooperation/Collaboration 19%
Increased Subcontractor Scale, Size, Technical Bandwidth, Knowledge 12%
Prime-Sub Communication Has Improved; Better Transparency 11%
Miscellaneous 6%
Business Environment Forces – Smaller Budget, Fewer Opportunities; Government Restrictions 35%
Lack of Prime-Sub Communications, Candor, Transparency; A Real Business Partnership; Payment and Workshare Issues 26%
Bureaucracy, Politics, Administrative Issues 18%
Negative Prime Attitudes/Perceptions Re Subs; Primes Prefer to Keep $$ In-House 15%
Miscellaneous 6%
Over the last two years, to what extent would you say it has become overall easier or harder to work with Prime Contractors as a whole?
OPEN ENDED QUESTIONS ON PARTNERING:Change In Ease Of Working With Prime Contractors Over The Past Two Years And Reason For Change
Why do you say that working with Prime Contractors over the last 2 years is Much Easier/Somewhat Easier/More Difficult?
Reasons Working With Prime Contractors Has Become Easier
Reasons Working With Prime Contractors Has Become More Difficult
4%
17%
44%
28%
7%
Become much easier
Become somewhat easier
Stayed about the same
Become somewhat more difficult
Become much more difficult
I N S I D E R R E P O R T 2 0 1 3
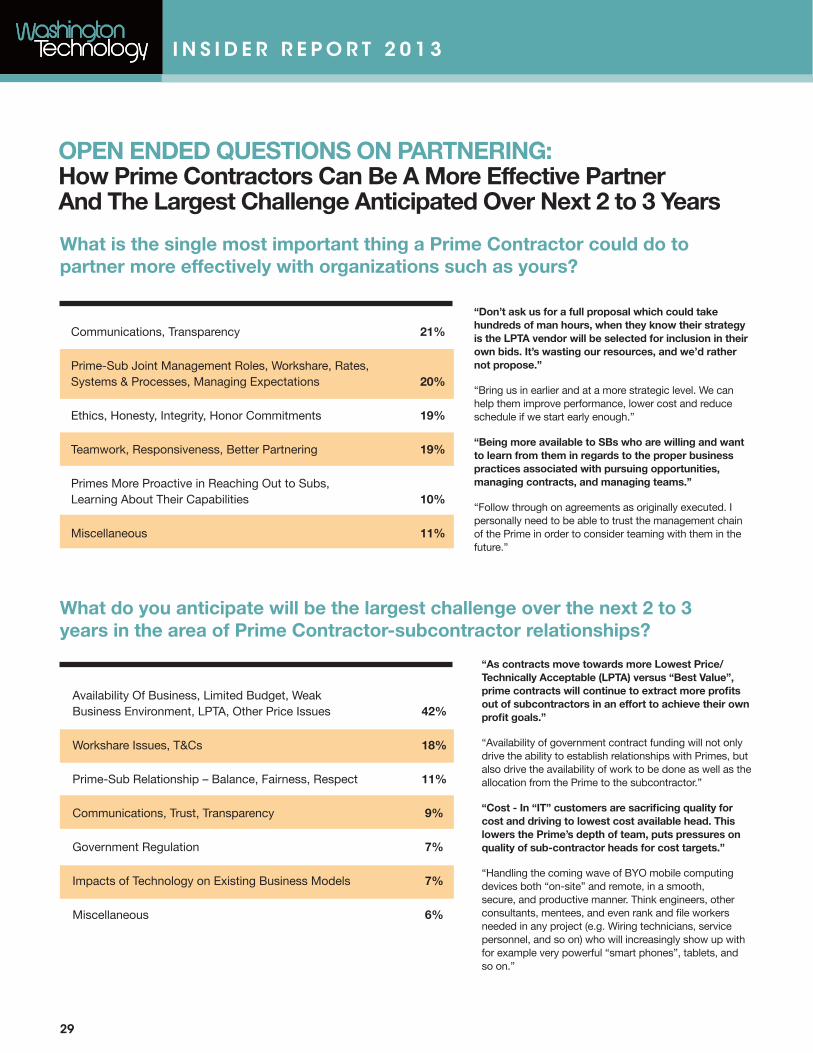
OPEN ENDED QUESTIONS ON PARTNERING:How Prime Contractors Can Be A More Effective Partner And The Largest Challenge Anticipated Over Next 2 to 3 Years
What is the single most important thing a Prime Contractor could do to partner more effectively with organizations such as yours?
What do you anticipate will be the largest challenge over the next 2 to 3 years in the area of Prime Contractor-subcontractor relationships?
“Don’t ask us for a full proposal which could take hundreds of man hours, when they know their strategy is the LPTA vendor will be selected for inclusion in their own bids. It’s wasting our resources, and we’d rather not propose.”
“Bring us in earlier and at a more strategic level. We can help them improve performance, lower cost and reduce schedule if we start early enough.”
“Being more available to SBs who are willing and want to learn from them in regards to the proper business practices associated with pursuing opportunities, managing contracts, and managing teams.”
“Follow through on agreements as originally executed. I personally need to be able to trust the management chain of the Prime in order to consider teaming with them in the future.”
“As contracts move towards more Lowest Price/Technically Acceptable (LPTA) versus “Best Value”, prime contracts will continue to extract more profits out of subcontractors in an effort to achieve their own profit goals.”
“Availability of government contract funding will not only drive the ability to establish relationships with Primes, but also drive the availability of work to be done as well as the allocation from the Prime to the subcontractor.”
“Cost - In “IT” customers are sacrificing quality for cost and driving to lowest cost available head. This lowers the Prime’s depth of team, puts pressures on quality of sub-contractor heads for cost targets.”
“Handling the coming wave of BYO mobile computing devices both “on-site” and remote, in a smooth, secure, and productive manner. Think engineers, other consultants, mentees, and even rank and file workers needed in any project (e.g. Wiring technicians, service personnel, and so on) who will increasingly show up with for example very powerful “smart phones”, tablets, and so on.”
Communications, Transparency 21%
Prime-Sub Joint Management Roles, Workshare, Rates, Systems & Processes, Managing Expectations 20%
Ethics, Honesty, Integrity, Honor Commitments 19%
Teamwork, Responsiveness, Better Partnering 19%
Primes More Proactive in Reaching Out to Subs, Learning About Their Capabilities 10%
Miscellaneous 11%
Availability Of Business, Limited Budget, Weak Business Environment, LPTA, Other Price Issues 42%
Workshare Issues, T&Cs 18%
Prime-Sub Relationship – Balance, Fairness, Respect 11%
Communications, Trust, Transparency 9%
Government Regulation 7%
Impacts of Technology on Existing Business Models 7%
Miscellaneous 6%
29
We can draw three primary conclusions from
this study:
1. On a company by company basis, the top
contractors in the market are doing a fairly
consistent job as a prime contractor,
but
2. Subcontractors put a higher value on the prime-
sub relationship than the primes are meeting,
and
3. The overall relationship has entered troubled
waters where subcontractors feel there is a need
for more communication, transparency and
honesty in how prime contractors and
subcontractors interact.
I N S I D E R R E P O R T 2 0 1 3
CONCLUS IONS
30
I N S I D E R R E P O R T 2 0 1 3
31
The Primes React
As we reviewed the results of our Insider Report on Contractor Partnering: The Subcontractor Perspective, one element screamed out to us: What do the primes think about these results?
That question has led us to plan our second Insider Report, which will explore the prime-subcontractor relationship from the Prime’s point of view.
To prepare for that research, we’ve reached out to several of the prime contractors featured in this report for their thoughts on the results and some preliminary insights on what they see as key aspects of the prime-subcontractor relationship.
We focused on four questions:
Did you find the results of this Insider Report surprising?In a nutshell, No.
“We encounter some of the same issues when we are a subcontractor as well,” an executive with CACI International said.
“We know our subcontractors like working with us but I know they feel like we don’t always live up to their expectations,” said a Verizon executive.
Where do relationships run into trouble?“I don’t think anyone comes to work and says How am I going to screw my subcontractors today? That doesn’t happen,” an executive with another top 20 company said. “But where relationships go wrong is when things get rushed.”
Several executives said they are working two years ahead of time on partnerships and alliance for opportunities, but often that is on the large marquee projects. Many other projects don’t get that kind of high level attention.
“When you are bidding on a new contract, there is a lot of pressure to make good margins and combine our strengths with our subs and do it quickly and profitably,”
the Verizon executive said. “I think that has become more of a challenge of late.”
What do primes and subs need to do to foster a good relationship?“There has to be strategic value to the relationship,” a Lockheed Martin executive said. “The sub has to get work that they value and they have to bring skills that are a value to our team.”
“You need to realize that you aren’t divvying up pieces of the pie, but attempting to bring capabilities together to go after the larger pie,” the CACI executive said.
What’s the biggest challenge going forward?The most common response was the budget and sequestration. There is more pressure on everyone to win and that has made strategic relationships harder.
“A sub may decide that Lockheed has a better chance here but GD or Northrop is better over there and they’ll move from prime to prime rather than form a long-term partnership,” the Lockheed executive said.
“You have the same or more companies going after less work so we don’t have the time to do the upfront work as well as we’d like,” an executive with a top 20 company said.
The budget pressures also are forcing a more inward perspective from companies. “This could lead to more disputes between primes and subs regarding workshare commitments, termination for convenience of the prime, non-solicitation of employees, etc,” the CACI executive said.
“We are under tremendous pressure to make margin and those pressures can impact our subs. That means sometimes we have to push down price reductions on them,” the Verizon executive said. “That’s been true the last two or three years and that’s going to continue.
I N S I D E R R E P O R T 2 0 1 3
Appendix A: Reading the Prime Contractor Performance Cards
For the attributes within each of the areas of Teamwork, Industry Perception, and Process, the frequencies (%s) and means shown for the Prime Contractor are the results across all respondents who answered that particular question for the Prime Contractor. The same method was used to calculate the Prime Contractor Means for Overall Perception, Likelihood to Partner with Again, and Likelihood to Recommend. The overall means shown for each of the three areas of Teamwork, Industry Perception, and Process were computed by averaging the means across each of the six relevant attributes, with each attribute given equal weight.
For the Benchmarking Group, the Average Means were calculated for each attribute in the areas of Teamwork, Industry Perception, and Process by averaging the means for each Prime Contractor in the Benchmarking Group for which sufficient data was collected, with each given equal weight in the analysis. The same method was used to calculate the Benchmarking Group Average Means for Overall Perception, Likelihood to Partner with Again, and Likelihood to Recommend. The overall averages for the areas of Teamwork, Industry Perception, and Process were computed by averaging the results of the Benchmarking Group Average Means across each of the relevant attributes, with each attribute given equal weight.
How the Prime Contractor Performance Results Were Calculated
32
I N S I D E R R E P O R T 2 0 1 3
Appendix A: Reading the Prime Contractor Performance Cards
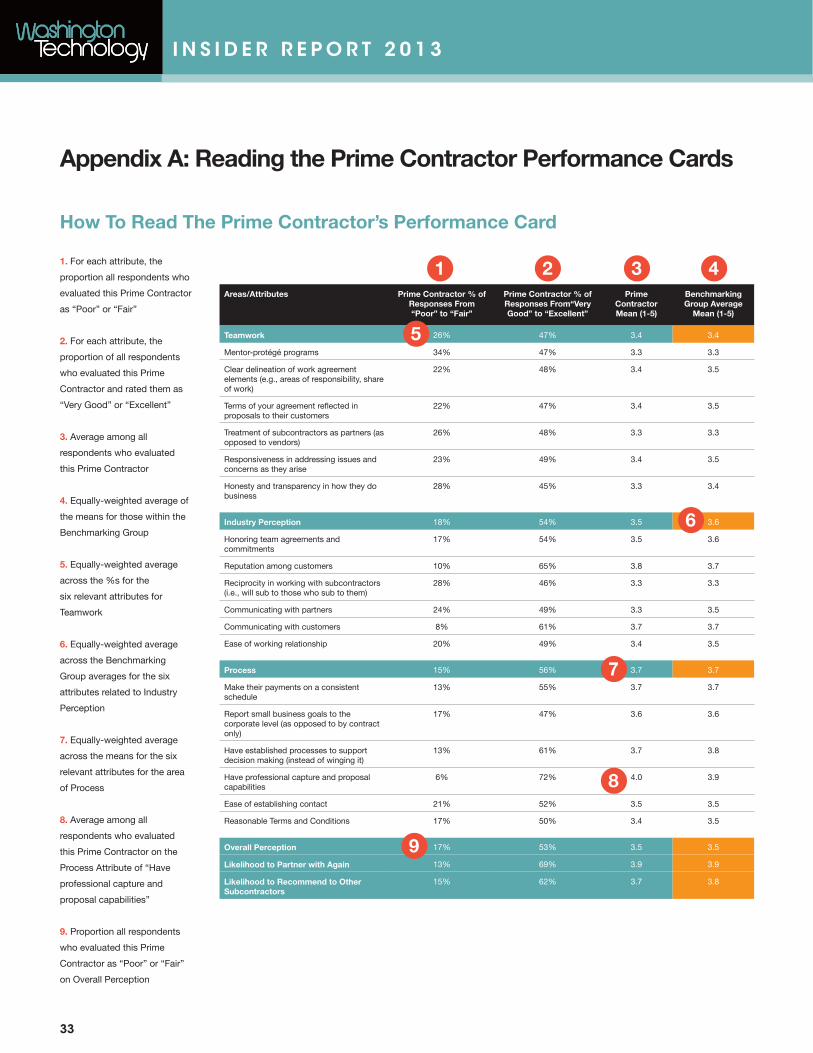
How To Read The Prime Contractor’s Performance Card
Areas/Attributes Prime Contractor % of Responses From “Poor” to “Fair”
Prime Contractor % of Responses From“Very Good” to “Excellent”
Prime Contractor Mean (1-5)
Benchmarking Group Average
Mean (1-5)
Teamwork 26% 47% 3.4 3.4
Mentor-protégé programs 34% 47% 3.3 3.3
Clear delineation of work agreement elements (e.g., areas of responsibility, share of work)
22% 48% 3.4 3.5
Terms of your agreement reflected in proposals to their customers
22% 47% 3.4 3.5
Treatment of subcontractors as partners (as opposed to vendors)
26% 48% 3.3 3.3
Responsiveness in addressing issues and concerns as they arise
23% 49% 3.4 3.5
Honesty and transparency in how they do business
28% 45% 3.3 3.4
Industry Perception 18% 54% 3.5 3.6
Honoring team agreements and commitments
17% 54% 3.5 3.6
Reputation among customers 10% 65% 3.8 3.7
Reciprocity in working with subcontractors (i.e., will sub to those who sub to them)
28% 46% 3.3 3.3
Communicating with partners 24% 49% 3.3 3.5
Communicating with customers 8% 61% 3.7 3.7
Ease of working relationship 20% 49% 3.4 3.5
Process 15% 56% 3.7 3.7
Make their payments on a consistent schedule
13% 55% 3.7 3.7
Report small business goals to the corporate level (as opposed to by contract only)
17% 47% 3.6 3.6
Have established processes to support decision making (instead of winging it)
13% 61% 3.7 3.8
Have professional capture and proposal capabilities
6% 72% 4.0 3.9
Ease of establishing contact 21% 52% 3.5 3.5
Reasonable Terms and Conditions 17% 50% 3.4 3.5
Overall Perception 17% 53% 3.5 3.5
Likelihood to Partner with Again 13% 69% 3.9 3.9
Likelihood to Recommend to Other Subcontractors
15% 62% 3.7 3.8
1 2 3 4
5
6
7
8
9
1. For each attribute, the
proportion all respondents who
evaluated this Prime Contractor
as “Poor” or “Fair”
2. For each attribute, the
proportion of all respondents
who evaluated this Prime
Contractor and rated them as
“Very Good” or “Excellent”
3. Average among all
respondents who evaluated
this Prime Contractor
4. Equally-weighted average of
the means for those within the
Benchmarking Group
5. Equally-weighted average
across the %s for the
six relevant attributes for
Teamwork
6. Equally-weighted average
across the Benchmarking
Group averages for the six
attributes related to Industry
Perception
7. Equally-weighted average
across the means for the six
relevant attributes for the area
of Process
8. Average among all
respondents who evaluated
this Prime Contractor on the
Process Attribute of “Have
professional capture and
proposal capabilities”
9. Proportion all respondents
who evaluated this Prime
Contractor as “Poor” or “Fair”
on Overall Perception
33
I N S I D E R R E P O R T 2 0 1 3
Appendix B: Verbatim Comments from Respondents
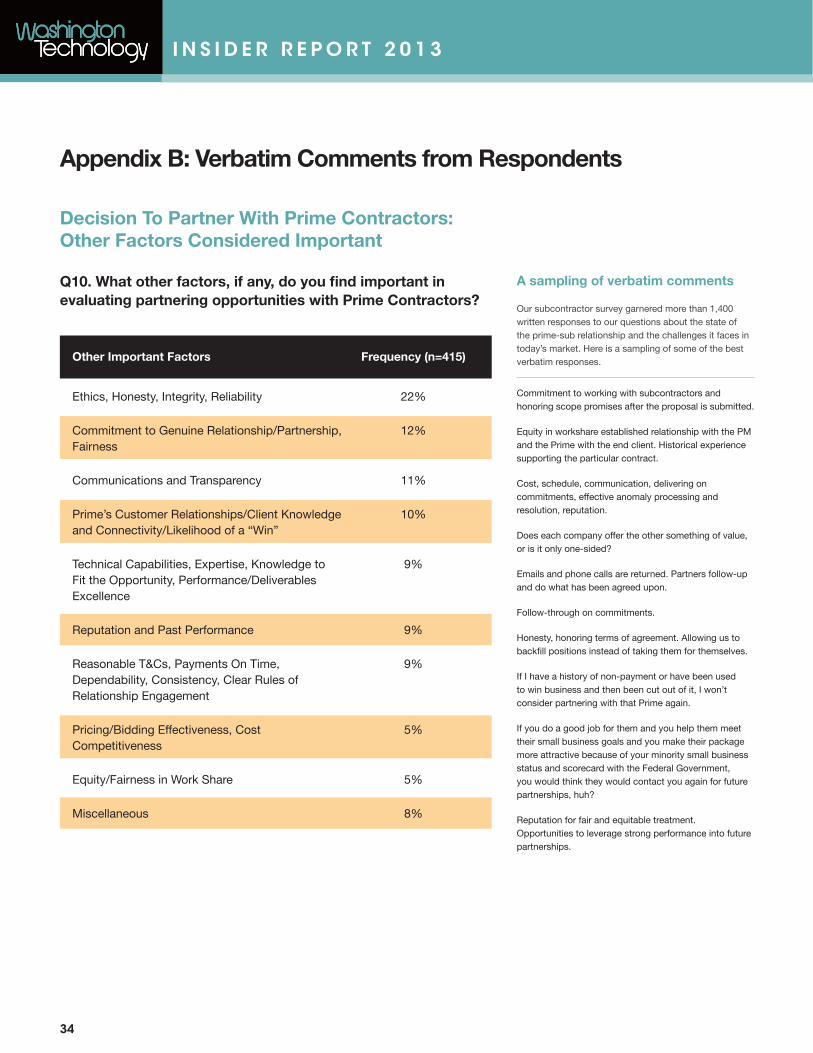
Q10. What other factors, if any, do you find important in evaluating partnering opportunities with Prime Contractors?
Decision To Partner With Prime Contractors: Other Factors Considered Important
34
Other Important Factors
Ethics, Honesty, Integrity, Reliability
Commitment to Genuine Relationship/Partnership, Fairness
Communications and Transparency
Prime’s Customer Relationships/Client Knowledge and Connectivity/Likelihood of a “Win”
Technical Capabilities, Expertise, Knowledge to Fit the Opportunity, Performance/Deliverables Excellence
Reputation and Past Performance
Reasonable T&Cs, Payments On Time, Dependability, Consistency, Clear Rules of Relationship Engagement
Pricing/Bidding Effectiveness, Cost Competitiveness
Equity/Fairness in Work Share
Miscellaneous
Frequency (n=415)
22%
12%
11%
10%
9%
9%
9%
5%
5%
8%
A sampling of verbatim comments
Our subcontractor survey garnered more than 1,400 written responses to our questions about the state of the prime-sub relationship and the challenges it faces in today’s market. Here is a sampling of some of the best verbatim responses.
Commitment to working with subcontractors and honoring scope promises after the proposal is submitted.
Equity in workshare established relationship with the PM and the Prime with the end client. Historical experience supporting the particular contract.
Cost, schedule, communication, delivering on commitments, effective anomaly processing and resolution, reputation.
Does each company offer the other something of value, or is it only one-sided?
Emails and phone calls are returned. Partners follow-up and do what has been agreed upon.
Follow-through on commitments.
Honesty, honoring terms of agreement. Allowing us to backfill positions instead of taking them for themselves.
If I have a history of non-payment or have been used to win business and then been cut out of it, I won’t consider partnering with that Prime again.
If you do a good job for them and you help them meet their small business goals and you make their package more attractive because of your minority small business status and scorecard with the Federal Government, you would think they would contact you again for future partnerships, huh?
Reputation for fair and equitable treatment. Opportunities to leverage strong performance into future partnerships.
I N S I D E R R E P O R T 2 0 1 3
Appendix B: Verbatim Comments from Respondents
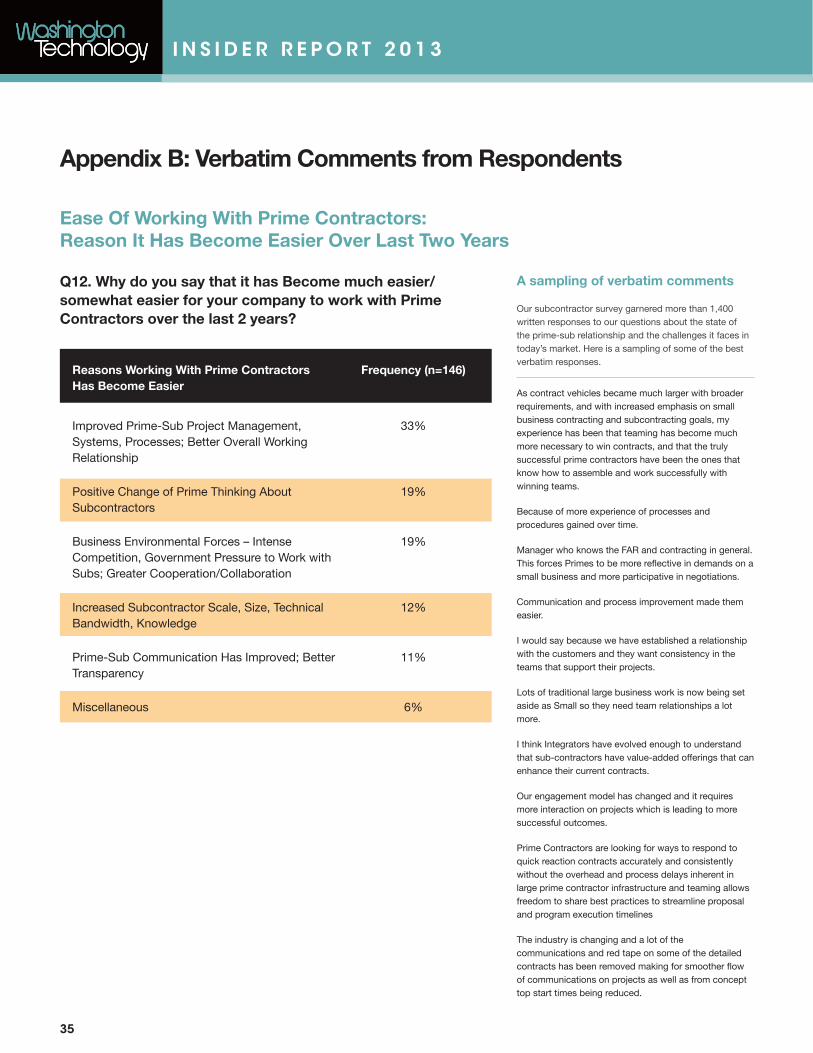
Q12. Why do you say that it has Become much easier/somewhat easier for your company to work with Prime Contractors over the last 2 years?
Ease Of Working With Prime Contractors: Reason It Has Become Easier Over Last Two Years
35
Reasons Working With Prime Contractors Has Become Easier
Improved Prime-Sub Project Management, Systems, Processes; Better Overall Working Relationship
Positive Change of Prime Thinking About Subcontractors
Business Environmental Forces – Intense Competition, Government Pressure to Work with Subs; Greater Cooperation/Collaboration
Increased Subcontractor Scale, Size, Technical Bandwidth, Knowledge
Prime-Sub Communication Has Improved; Better Transparency
Miscellaneous
Frequency (n=146)
33%
19%
19%
12%
11%
6%
A sampling of verbatim comments
Our subcontractor survey garnered more than 1,400 written responses to our questions about the state of the prime-sub relationship and the challenges it faces in today’s market. Here is a sampling of some of the best verbatim responses.
As contract vehicles became much larger with broader requirements, and with increased emphasis on small business contracting and subcontracting goals, my experience has been that teaming has become much more necessary to win contracts, and that the truly successful prime contractors have been the ones that know how to assemble and work successfully with winning teams.
Because of more experience of processes and procedures gained over time.
Manager who knows the FAR and contracting in general. This forces Primes to be more reflective in demands on a small business and more participative in negotiations.
Communication and process improvement made them easier.
I would say because we have established a relationship with the customers and they want consistency in the teams that support their projects.
Lots of traditional large business work is now being set aside as Small so they need team relationships a lot more.
I think Integrators have evolved enough to understand that sub-contractors have value-added offerings that can enhance their current contracts.
Our engagement model has changed and it requires more interaction on projects which is leading to more successful outcomes.
Prime Contractors are looking for ways to respond to quick reaction contracts accurately and consistently without the overhead and process delays inherent in large prime contractor infrastructure and teaming allows freedom to share best practices to streamline proposal and program execution timelines
The industry is changing and a lot of the communications and red tape on some of the detailed contracts has been removed making for smoother flow of communications on projects as well as from concept top start times being reduced.
I N S I D E R R E P O R T 2 0 1 3
Appendix B: Verbatim Comments from Respondents
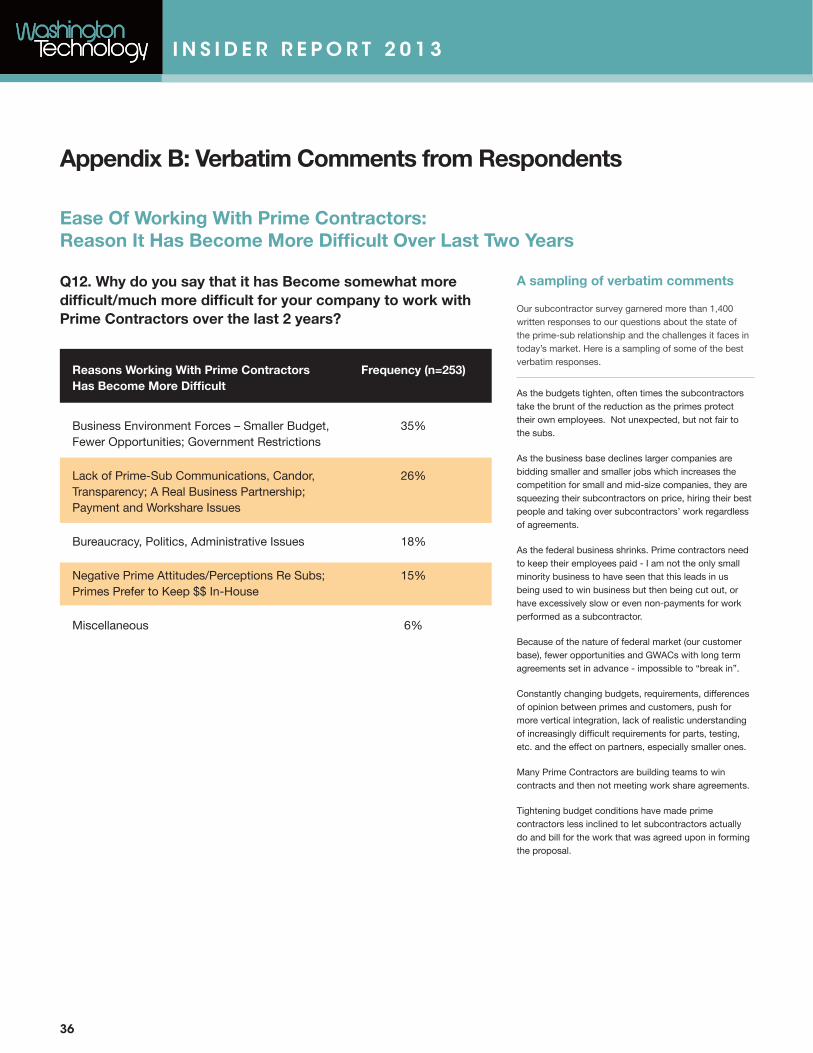
Q12. Why do you say that it has Become somewhat more difficult/much more difficult for your company to work with Prime Contractors over the last 2 years?
Ease Of Working With Prime Contractors: Reason It Has Become More Difficult Over Last Two Years
36
Reasons Working With Prime Contractors Has Become More Difficult
Business Environment Forces – Smaller Budget, Fewer Opportunities; Government Restrictions
Lack of Prime-Sub Communications, Candor, Transparency; A Real Business Partnership; Payment and Workshare Issues
Bureaucracy, Politics, Administrative Issues
Negative Prime Attitudes/Perceptions Re Subs; Primes Prefer to Keep $$ In-House
Miscellaneous
Frequency (n=253)
35%
26%
18%
15%
6%
A sampling of verbatim comments
Our subcontractor survey garnered more than 1,400 written responses to our questions about the state of the prime-sub relationship and the challenges it faces in today’s market. Here is a sampling of some of the best verbatim responses.
As the budgets tighten, often times the subcontractors take the brunt of the reduction as the primes protect their own employees. Not unexpected, but not fair to the subs.
As the business base declines larger companies are bidding smaller and smaller jobs which increases the competition for small and mid-size companies, they are squeezing their subcontractors on price, hiring their best people and taking over subcontractors’ work regardless of agreements.
As the federal business shrinks. Prime contractors need to keep their employees paid - I am not the only small minority business to have seen that this leads in us being used to win business but then being cut out, or have excessively slow or even non-payments for work performed as a subcontractor.
Because of the nature of federal market (our customer base), fewer opportunities and GWACs with long term agreements set in advance - impossible to “break in”.
Constantly changing budgets, requirements, differences of opinion between primes and customers, push for more vertical integration, lack of realistic understanding of increasingly difficult requirements for parts, testing, etc. and the effect on partners, especially smaller ones.
Many Prime Contractors are building teams to win contracts and then not meeting work share agreements.
Tightening budget conditions have made prime contractors less inclined to let subcontractors actually do and bill for the work that was agreed upon in forming the proposal.
I N S I D E R R E P O R T 2 0 1 3
Appendix B: Verbatim Comments from Respondents
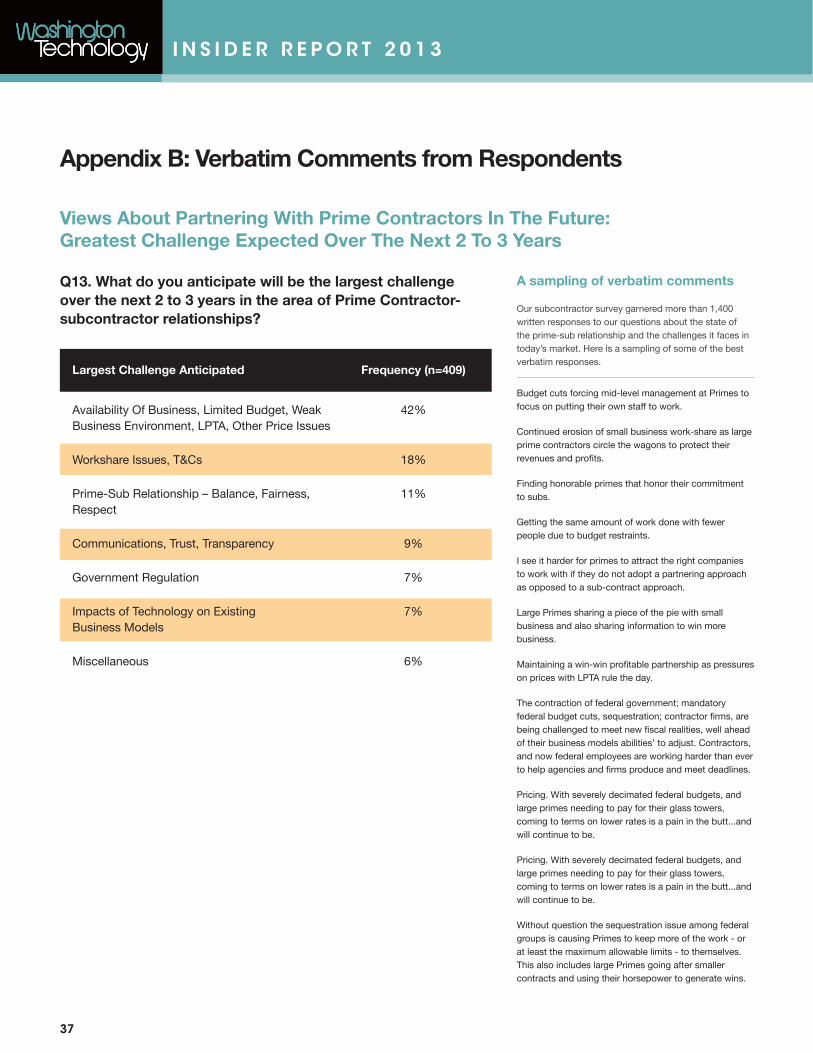
Q13. What do you anticipate will be the largest challenge over the next 2 to 3 years in the area of Prime Contractor-subcontractor relationships?
Views About Partnering With Prime Contractors In The Future: Greatest Challenge Expected Over The Next 2 To 3 Years
37
Largest Challenge Anticipated
Availability Of Business, Limited Budget, Weak Business Environment, LPTA, Other Price Issues
Workshare Issues, T&Cs
Prime-Sub Relationship – Balance, Fairness, Respect
Communications, Trust, Transparency
Government Regulation
Impacts of Technology on Existing Business Models
Miscellaneous
Frequency (n=409)
42%
18%
11%
9%
7%
7%
6%
A sampling of verbatim comments
Our subcontractor survey garnered more than 1,400 written responses to our questions about the state of the prime-sub relationship and the challenges it faces in today’s market. Here is a sampling of some of the best verbatim responses.
Budget cuts forcing mid-level management at Primes to focus on putting their own staff to work.
Continued erosion of small business work-share as large prime contractors circle the wagons to protect their revenues and profits.
Finding honorable primes that honor their commitment to subs.
Getting the same amount of work done with fewer people due to budget restraints.
I see it harder for primes to attract the right companies to work with if they do not adopt a partnering approach as opposed to a sub-contract approach.
Large Primes sharing a piece of the pie with small business and also sharing information to win more business.
Maintaining a win-win profitable partnership as pressures on prices with LPTA rule the day.
The contraction of federal government; mandatory federal budget cuts, sequestration; contractor firms, are being challenged to meet new fiscal realities, well ahead of their business models abilities’ to adjust. Contractors, and now federal employees are working harder than ever to help agencies and firms produce and meet deadlines.
Pricing. With severely decimated federal budgets, and large primes needing to pay for their glass towers, coming to terms on lower rates is a pain in the butt...and will continue to be.
Pricing. With severely decimated federal budgets, and large primes needing to pay for their glass towers, coming to terms on lower rates is a pain in the butt...and will continue to be.
Without question the sequestration issue among federal groups is causing Primes to keep more of the work - or at least the maximum allowable limits - to themselves. This also includes large Primes going after smaller contracts and using their horsepower to generate wins.
I N S I D E R R E P O R T 2 0 1 3
Appendix B: Verbatim Comments from Respondents
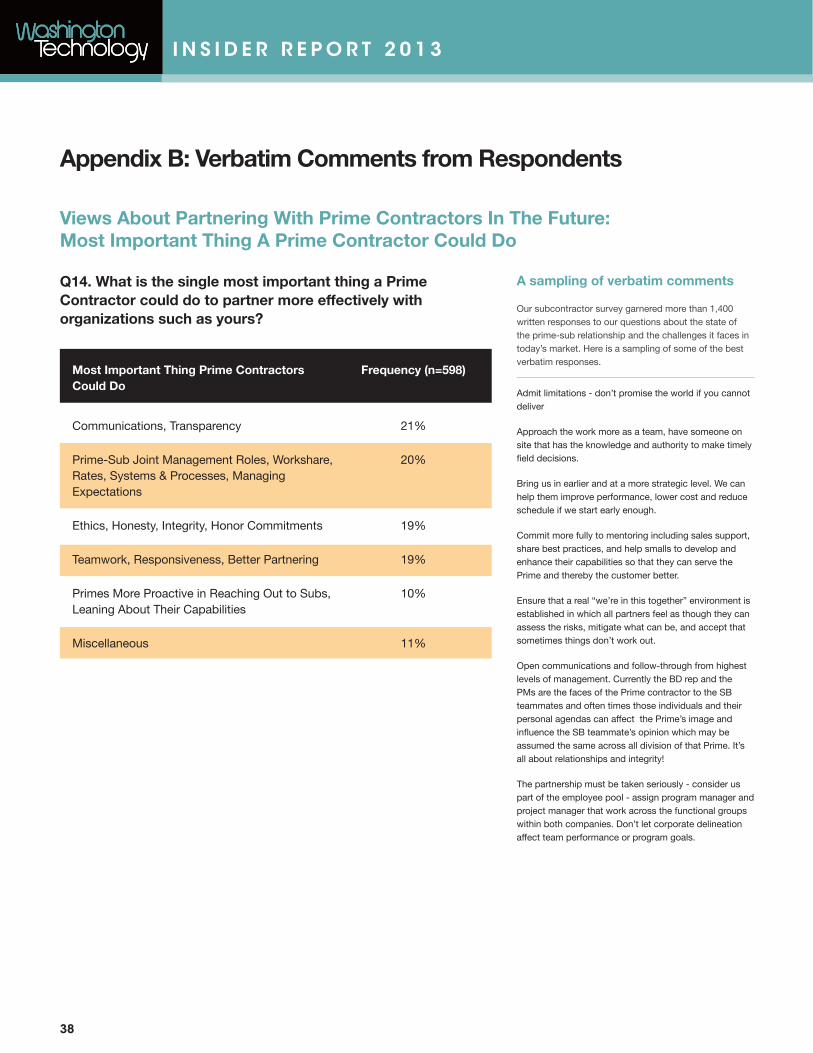
Q14. What is the single most important thing a Prime Contractor could do to partner more effectively with organizations such as yours?
Views About Partnering With Prime Contractors In The Future: Most Important Thing A Prime Contractor Could Do
38
Most Important Thing Prime Contractors Could Do
Communications, Transparency
Prime-Sub Joint Management Roles, Workshare, Rates, Systems & Processes, Managing Expectations
Ethics, Honesty, Integrity, Honor Commitments
Teamwork, Responsiveness, Better Partnering
Primes More Proactive in Reaching Out to Subs, Leaning About Their Capabilities
Miscellaneous
Frequency (n=598)
21%
20%
19%
19%
10%
11%
A sampling of verbatim comments
Our subcontractor survey garnered more than 1,400 written responses to our questions about the state of the prime-sub relationship and the challenges it faces in today’s market. Here is a sampling of some of the best verbatim responses.
Admit limitations - don’t promise the world if you cannot deliver
Approach the work more as a team, have someone on site that has the knowledge and authority to make timely field decisions.
Bring us in earlier and at a more strategic level. We can help them improve performance, lower cost and reduce schedule if we start early enough.
Commit more fully to mentoring including sales support, share best practices, and help smalls to develop and enhance their capabilities so that they can serve the Prime and thereby the customer better.
Ensure that a real “we’re in this together” environment is established in which all partners feel as though they can assess the risks, mitigate what can be, and accept that sometimes things don’t work out.
Open communications and follow-through from highest levels of management. Currently the BD rep and the PMs are the faces of the Prime contractor to the SB teammates and often times those individuals and their personal agendas can affect the Prime’s image and influence the SB teammate’s opinion which may be assumed the same across all division of that Prime. It’s all about relationships and integrity!
The partnership must be taken seriously - consider us part of the employee pool - assign program manager and project manager that work across the functional groups within both companies. Don’t let corporate delineation affect team performance or program goals.
I N S I D E R R E P O R T 2 0 1 3
Appendix C: Methodology and Respondent Profile
39
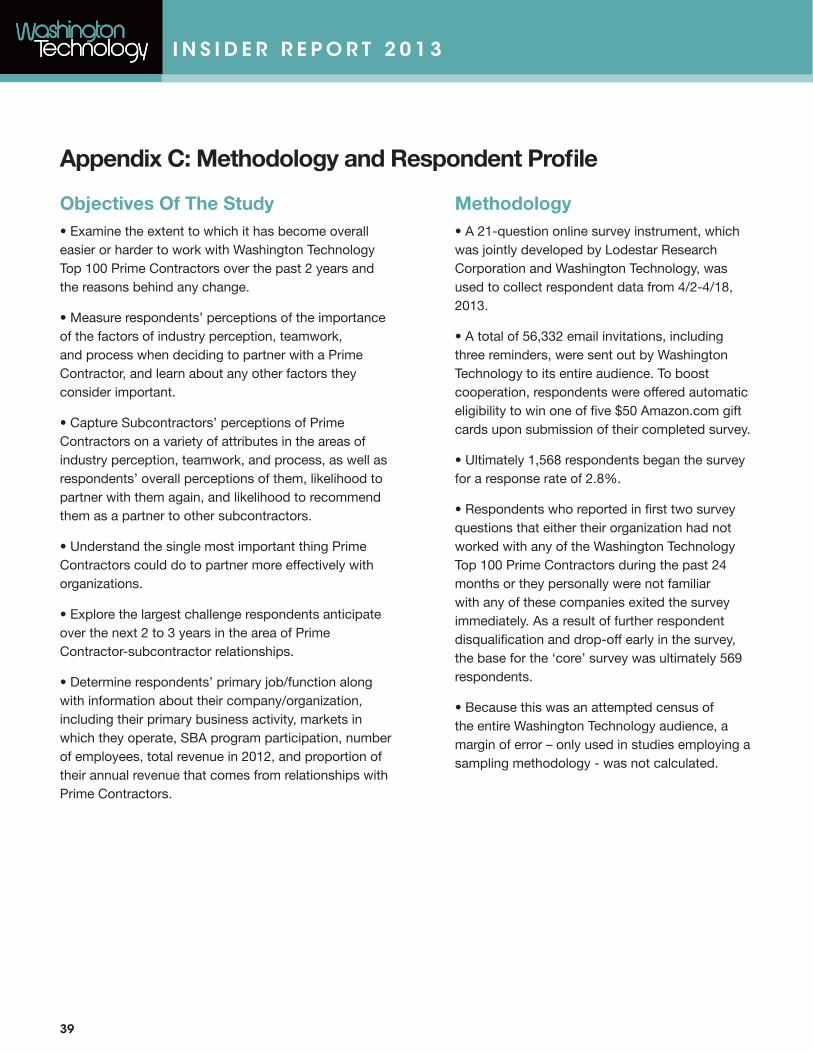
• Examine the extent to which it has become overall easier or harder to work with Washington Technology Top 100 Prime Contractors over the past 2 years and the reasons behind any change.
• Measure respondents’ perceptions of the importance of the factors of industry perception, teamwork, and process when deciding to partner with a Prime Contractor, and learn about any other factors they consider important.
• Capture Subcontractors’ perceptions of Prime Contractors on a variety of attributes in the areas of industry perception, teamwork, and process, as well as respondents’ overall perceptions of them, likelihood to partner with them again, and likelihood to recommend them as a partner to other subcontractors.
• Understand the single most important thing Prime Contractors could do to partner more effectively with organizations.
• Explore the largest challenge respondents anticipate over the next 2 to 3 years in the area of Prime Contractor-subcontractor relationships.
• Determine respondents’ primary job/function along with information about their company/organization, including their primary business activity, markets in which they operate, SBA program participation, number of employees, total revenue in 2012, and proportion of their annual revenue that comes from relationships with Prime Contractors.
Objectives Of The Study• A 21-question online survey instrument, which was jointly developed by Lodestar Research Corporation and Washington Technology, was used to collect respondent data from 4/2-4/18, 2013.
• A total of 56,332 email invitations, including three reminders, were sent out by Washington Technology to its entire audience. To boost cooperation, respondents were offered automatic eligibility to win one of five $50 Amazon.com gift cards upon submission of their completed survey.
• Ultimately 1,568 respondents began the survey for a response rate of 2.8%.
• Respondents who reported in first two survey questions that either their organization had not worked with any of the Washington Technology Top 100 Prime Contractors during the past 24 months or they personally were not familiar with any of these companies exited the survey immediately. As a result of further respondent disqualification and drop-off early in the survey, the base for the ‘core’ survey was ultimately 569 respondents.
• Because this was an attempted census of the entire Washington Technology audience, a margin of error – only used in studies employing a sampling methodology - was not calculated.
Methodology
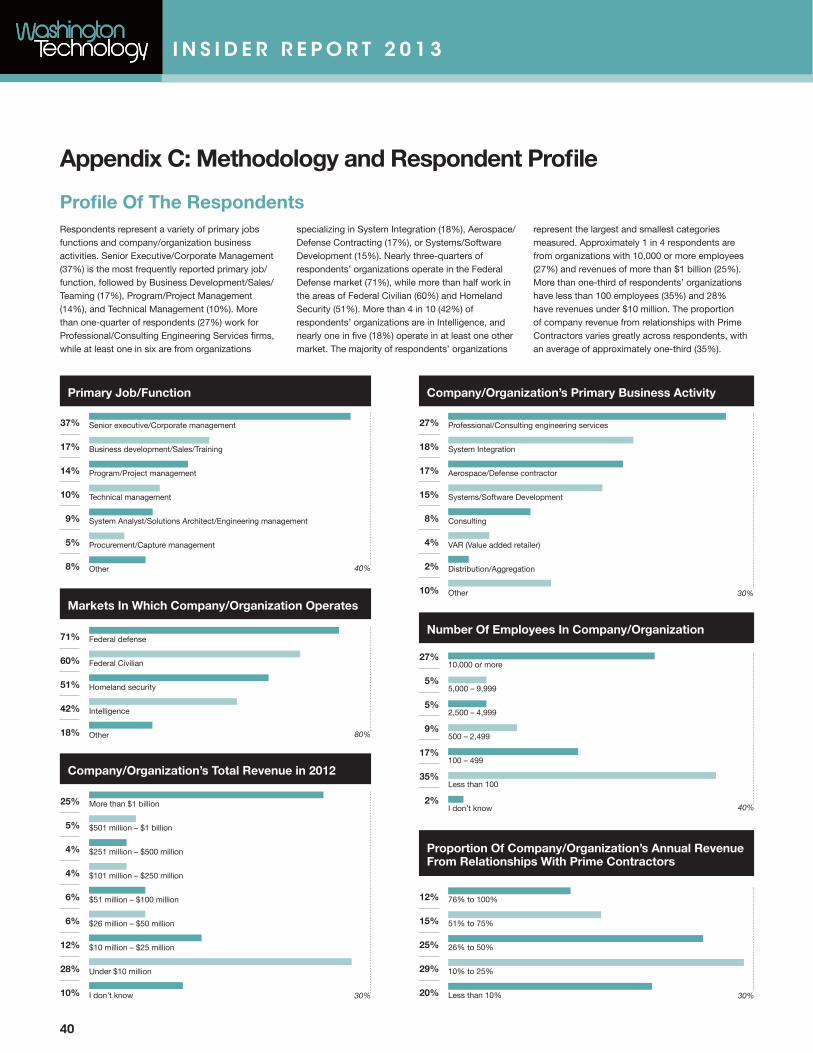
Senior executive/Corporate management
Business development/Sales/Training
Program/Project management
Technical management
System Analyst/Solutions Architect/Engineering management
Procurement/Capture management
Other
I N S I D E R R E P O R T 2 0 1 3
Appendix C: Methodology and Respondent Profile
40
Profile Of The RespondentsRespondents represent a variety of primary jobs functions and company/organization business activities. Senior Executive/Corporate Management (37%) is the most frequently reported primary job/function, followed by Business Development/Sales/Teaming (17%), Program/Project Management (14%), and Technical Management (10%). More than one-quarter of respondents (27%) work for Professional/Consulting Engineering Services firms, while at least one in six are from organizations
specializing in System Integration (18%), Aerospace/Defense Contracting (17%), or Systems/Software Development (15%). Nearly three-quarters of respondents’ organizations operate in the Federal Defense market (71%), while more than half work in the areas of Federal Civilian (60%) and Homeland Security (51%). More than 4 in 10 (42%) of respondents’ organizations are in Intelligence, and nearly one in five (18%) operate in at least one other market. The majority of respondents’ organizations
represent the largest and smallest categories measured. Approximately 1 in 4 respondents are from organizations with 10,000 or more employees (27%) and revenues of more than $1 billion (25%). More than one-third of respondents’ organizations have less than 100 employees (35%) and 28% have revenues under $10 million. The proportion of company revenue from relationships with Prime Contractors varies greatly across respondents, with an average of approximately one-third (35%).
Primary Job/Function
Markets In Which Company/Organization Operates
Company/Organization’s Total Revenue in 2012
Company/Organization’s Primary Business Activity
Number Of Employees In Company/Organization
Proportion Of Company/Organization’s Annual Revenue From Relationships With Prime Contractors
37%
17%
14%
10%
9%
5%
8%
Federal defense
Federal Civilian
Homeland security
Intelligence
Other
71%
60%
51%
42%
18%
More than $1 billion
$501 million – $1 billion
$251 million – $500 million
$101 million – $250 million
$51 million – $100 million
$26 million – $50 million
$10 million – $25 million
Under $10 million
I don’t know
25%
5%
4%
4%
6%
6%
12%
28%
10%
80%
30%
40%
Professional/Consulting engineering services
System Integration
Aerospace/Defense contractor
Systems/Software Development
Consulting
VAR (Value added retailer)
Distribution/Aggregation
Other
27%
18%
17%
15%
8%
4%
2%
10% 30%
10,000 or more
5,000 – 9,999
2,500 – 4,999
500 – 2,499
100 – 499
Less than 100
I don’t know
27%
5%
5%
9%
17%
35%
2%40%
76% to 100%
51% to 75%
26% to 50%
10% to 25%
Less than 10%
12%
15%
25%
29%
20% 30%
I N S I D E R R E P O R T 2 0 1 3
Appendix D: About Lodestar
Washington Technology is proud to partner with Lodestar for our inaugural Insider Report.Lodestar is a B2B consulting firm headquartered in Princeton, New Jersey. They offer a collaborative approach resulting in evidence-based recommendations that help our customers tell their story, develop new products and growth strategies, measure the impact of their investments and maximize their use of information resources.
Founded in 1998 by Dr. Tom Nelson, the firm has grown to now serve over 150 clients across a variety of industry verticals, including media and publishing, financial services, technology, and healthcare. Dedicated to three major practice areas — Marketing Sciences, Innovation and Information Management — the firm has also developed a rich portfolio of intellectual property, and expanded its domestic and international footprint.
Lodestar consists of 45+ associates with advanced competencies in research, strategy, innovation, technology, and information management – and a worldwide network of thought leaders, content specialists, futurists, and alliance partner agencies. Notably, our workforce is a highly diverse one, with associates bringing a variety of personal backgrounds, academic records, and professional histories to their work. We believe this is one of our core strengths, enabling an un-matched multidisciplinary perspective and approach in collaborating with our clients to solve real-world challenges. To learn more about Lodestar visit: http://www.lodestarlink.com/
41