Embed Size (px)
Citation preview
c o m e . c o n n e c t . c r e a t e
STS 543Effectiveness of policies to address household indebtedness:
Evidence from credit registry data in Malaysia
Muizz Aziz
Bank Negara Malaysia
19th August 2019, 2.00 pm – 3.40 pm
Insert your logo here
2
Outline
1
2
3
4
Malaysia’s experience with macroprudential policy
Micro data for macro-financial insights
Conclusion and policy implications
Results
3
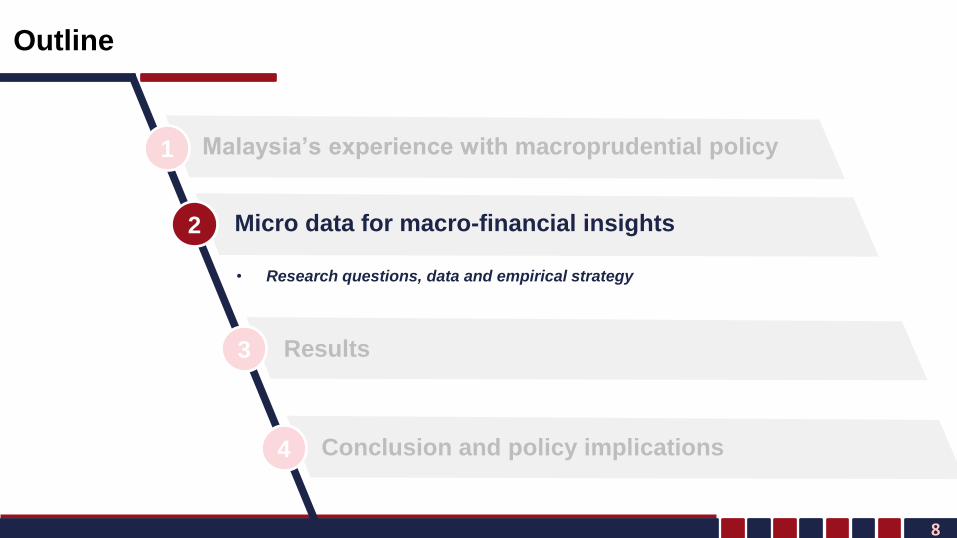
Outline
1
2
3
4
Malaysia’s experience with macroprudential policy
Micro data for macro-financial insights
Conclusion and policy implications
Results
• Where we were, what we did, and what followed
4
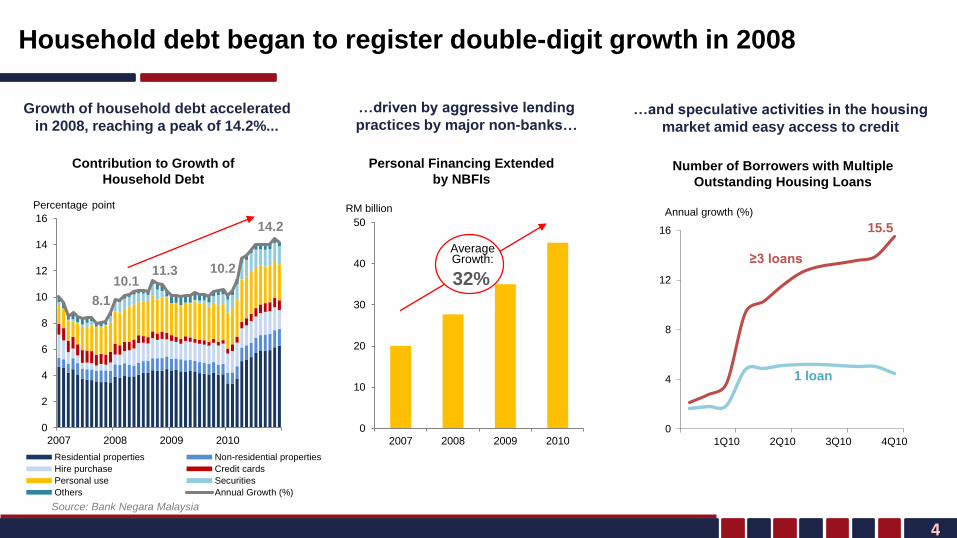
Growth of household debt accelerated
in 2008, reaching a peak of 14.2%...
Contribution to Growth of
Household Debt
8.1
10.111.3 10.2
14.2
0
2
4
6
8
10
12
14
16
2007 2008 2009 2010
Percentage point
…driven by aggressive lending
practices by major non-banks…
0
10
20
30
40
50
2007 2008 2009 2010
Personal Financing Extended
by NBFIs
RM billion
32
%32%
Average Growth:
…and speculative activities in the housing
market amid easy access to credit
Number of Borrowers with Multiple
Outstanding Housing Loans
15.5
0
4
8
12
16
1Q10 2Q10 3Q10 4Q10
≥3 loans
1 loan
Annual growth (%)
Household debt began to register double-digit growth in 2008
8.1 10.1 11.3 10.2 14.20246810121416
2007 2008 2009 2010
Residential properties Non-residential properties
Hire purchase Credit cards
Personal use Securities
Others Annual Growth (%)
Source: Bank Negara Malaysia
5
7.98.0
0
2
4
6
8
10
1Q
08
2Q
08
3Q
08
4Q
08
1Q
09
2Q
09
3Q
09
4Q
09
1Q
10
2Q
10
3Q
10
4Q
10
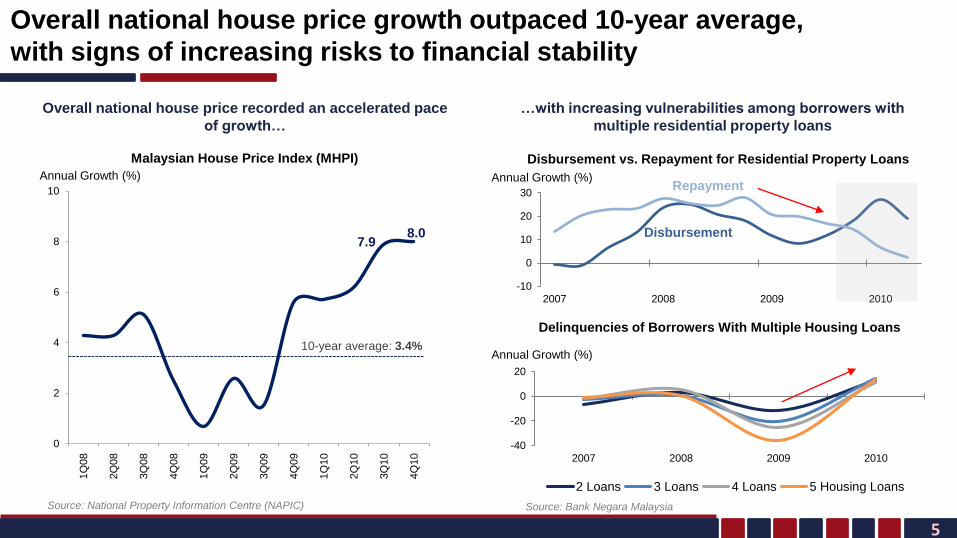
Overall national house price growth outpaced 10-year average,
with signs of increasing risks to financial stability
Annual Growth (%)
Overall national house price recorded an accelerated pace
of growth…
Malaysian House Price Index (MHPI)
Source: National Property Information Centre (NAPIC)
10-year average: 3.4%
…with increasing vulnerabilities among borrowers with
multiple residential property loans
Delinquencies of Borrowers With Multiple Housing Loans
Source: Bank Negara Malaysia
Annual Growth (%)
Annual Growth (%)
Disbursement vs. Repayment for Residential Property Loans
-10
0
10
20
30
2007 2008 2009 2010
Disbursement
Repayment
-40
-20
0
20
2007 2008 2009 2010
2 Loans 3 Loans 4 Loans 5 Housing Loans
6
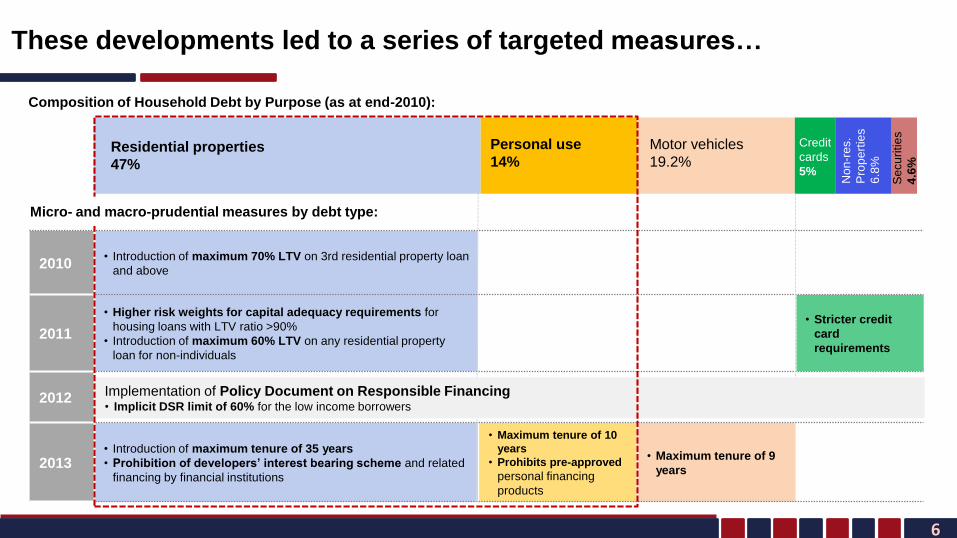
These developments led to a series of targeted measures…
Composition of Household Debt by Purpose (as at end-2010):
2010• Introduction of maximum 70% LTV on 3rd residential property loan
and above
2011
• Higher risk weights for capital adequacy requirements for
housing loans with LTV ratio >90%
• Introduction of maximum 60% LTV on any residential property
loan for non-individuals
• Stricter credit
card
requirements
2012
2013• Introduction of maximum tenure of 35 years
• Prohibition of developers’ interest bearing scheme and related
financing by financial institutions
• Maximum tenure of 10
years
• Prohibits pre-approved
personal financing
products
• Maximum tenure of 9
years
Residential properties
47%
Motor vehicles
19.2%
Personal use
14%
No
n-r
es.
Pro
pe
rtie
s
6.8
%
Credit
cards
5%
Se
cu
ritie
s
4.6
%
Implementation of Policy Document on Responsible Financing • Implicit DSR limit of 60% for the low income borrowers
Micro- and macro-prudential measures by debt type:
7
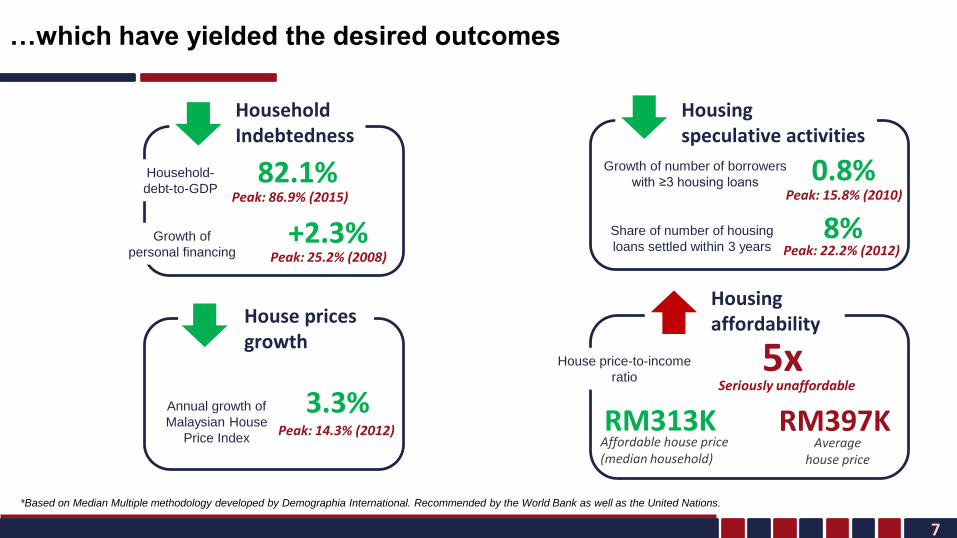
…which have yielded the desired outcomes
Household Indebtedness
Household-
debt-to-GDP82.1%
Peak: 86.9% (2015)
Growth of
personal financing+2.3%
Peak: 25.2% (2008)
Housing speculative activities
Growth of number of borrowers
with ≥3 housing loans 0.8%Peak: 15.8% (2010)
Share of number of housing
loans settled within 3 years8%
Peak: 22.2% (2012)
House pricesgrowth
Annual growth of
Malaysian House
Price Index
3.3%Peak: 14.3% (2012)
*Based on Median Multiple methodology developed by Demographia International. Recommended by the World Bank as well as the United Nations.
vs
Housing affordability
House price-to-income
ratio5x
Seriously unaffordable
RM313KAffordable house price (median household)
RM397KAverage
house price
8
Outline
1
2
3
4
Malaysia’s experience with macroprudential policy
Micro data for macro-financial insights
Conclusion and policy implications
Results
• Research questions, data and empirical strategy
9Copyright ISIWSC2019
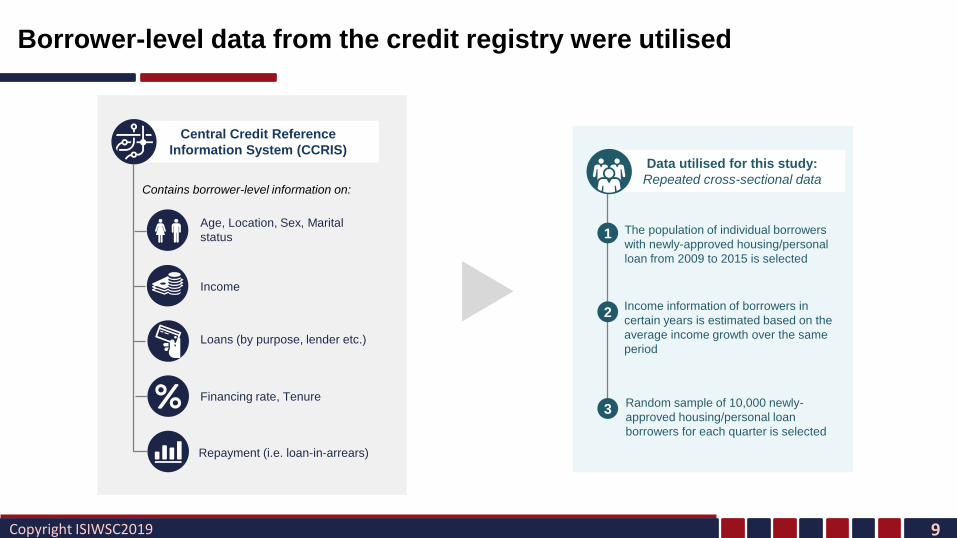
Borrower-level data from the credit registry were utilised
Central Credit Reference
Information System (CCRIS)
Contains borrower-level information on:
Age, Location, Sex, Marital
status
Income
Loans (by purpose, lender etc.)
Financing rate, Tenure
Repayment (i.e. loan-in-arrears)
Data utilised for this study:
Repeated cross-sectional data
The population of individual borrowers
with newly-approved housing/personal
loan from 2009 to 2015 is selected
Income information of borrowers in
certain years is estimated based on the
average income growth over the same
period
Random sample of 10,000 newly-
approved housing/personal loan
borrowers for each quarter is selected
2
3
1
10
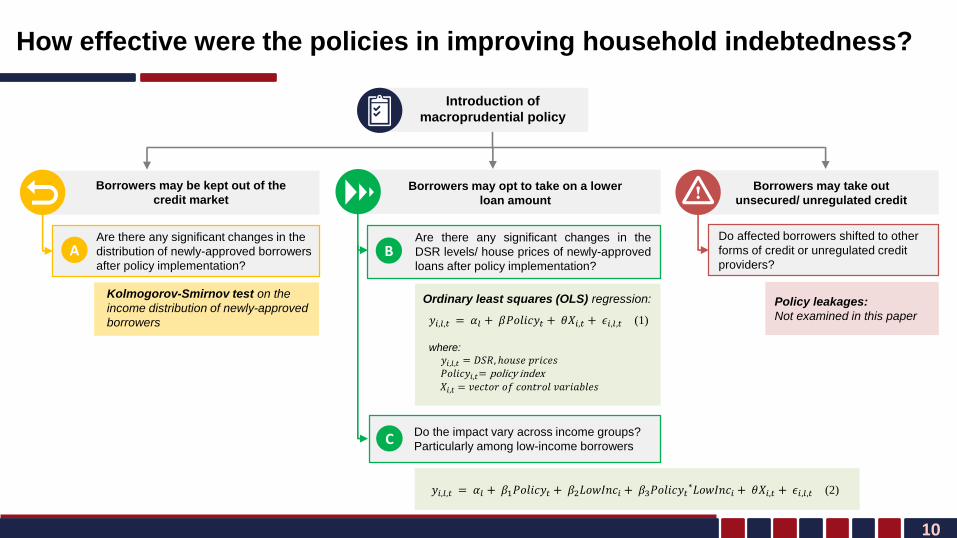
How effective were the policies in improving household indebtedness?
Introduction of
macroprudential policy
Borrowers may be kept out of the
credit marketBorrowers may opt to take on a lower
loan amount
Borrowers may take out
unsecured/ unregulated credit
Are there any significant changes in the
distribution of newly-approved borrowers
after policy implementation?
Are there any significant changes in the
DSR levels/ house prices of newly-approved
loans after policy implementation?
Do the impact vary across income groups?
Particularly among low-income borrowers
Do affected borrowers shifted to other
forms of credit or unregulated credit
providers?
Kolmogorov-Smirnov test on the
income distribution of newly-approved
borrowers
Ordinary least squares (OLS) regression:
𝑦𝑖,𝑙,𝑡 = 𝛼𝑙 + 𝛽𝑃𝑜𝑙𝑖𝑐𝑦𝑡 + 𝜃𝑋𝑖,𝑡 + 𝜖𝑖,𝑙,𝑡 (1)
𝑦𝑖,𝑙,𝑡 = 𝛼𝑙 + 𝛽1𝑃𝑜𝑙𝑖𝑐𝑦𝑡 + 𝛽2𝐿𝑜𝑤𝐼𝑛𝑐𝑖 + 𝛽3𝑃𝑜𝑙𝑖𝑐𝑦𝑡∗𝐿𝑜𝑤𝐼𝑛𝑐𝑖 + 𝜃𝑋𝑖,𝑡 + 𝜖𝑖,𝑙,𝑡 (2)
where:
𝑦𝑖,𝑙,𝑡 = 𝐷𝑆𝑅, ℎ𝑜𝑢𝑠𝑒 𝑝𝑟𝑖𝑐𝑒𝑠𝑃𝑜𝑙𝑖𝑐𝑦𝑖,𝑡= policy index𝑋𝑖,𝑡 = 𝑣𝑒𝑐𝑡𝑜𝑟 𝑜𝑓 𝑐𝑜𝑛𝑡𝑟𝑜𝑙 𝑣𝑎𝑟𝑖𝑎𝑏𝑙𝑒𝑠
Policy leakages:
Not examined in this paper
A B
C
11
Outline
1
2
3
4
Malaysia’s experience with macroprudential policy
Micro data for macro-financial insights
Conclusion and policy implications
Results
• Key findings
12
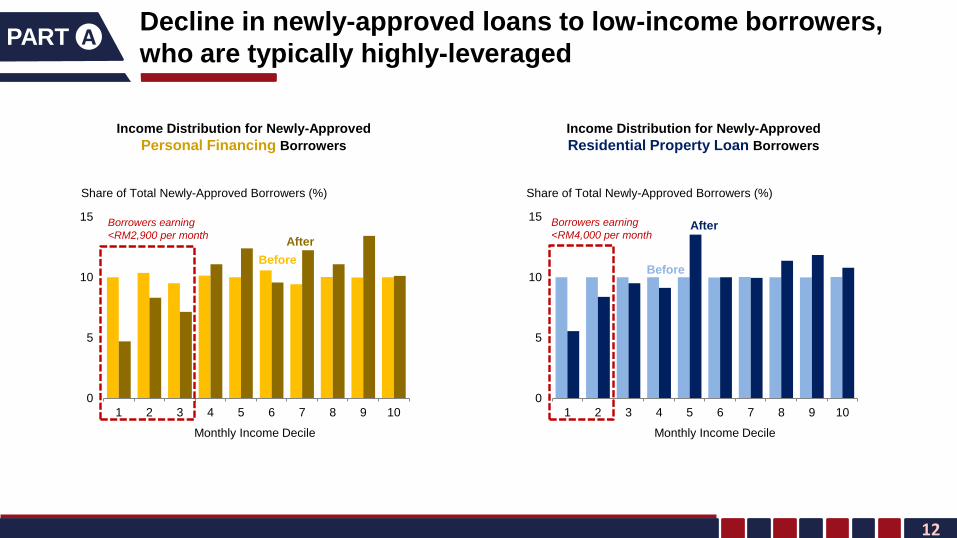
Decline in newly-approved loans to low-income borrowers,
who are typically highly-leveragedAPART
Income Distribution for Newly-Approved
Personal Financing Borrowers
0
5
10
15
1 2 3 4 5 6 7 8 9 10
Share of Total Newly-Approved Borrowers (%)
Monthly Income Decile
Income Distribution for Newly-Approved
Residential Property Loan Borrowers
0
5
10
15
1 2 3 4 5 6 7 8 9 10
Share of Total Newly-Approved Borrowers (%)
Monthly Income Decile
Borrowers earning
<RM2,900 per month
Borrowers earning
<RM4,000 per month
Before
After
Before
After
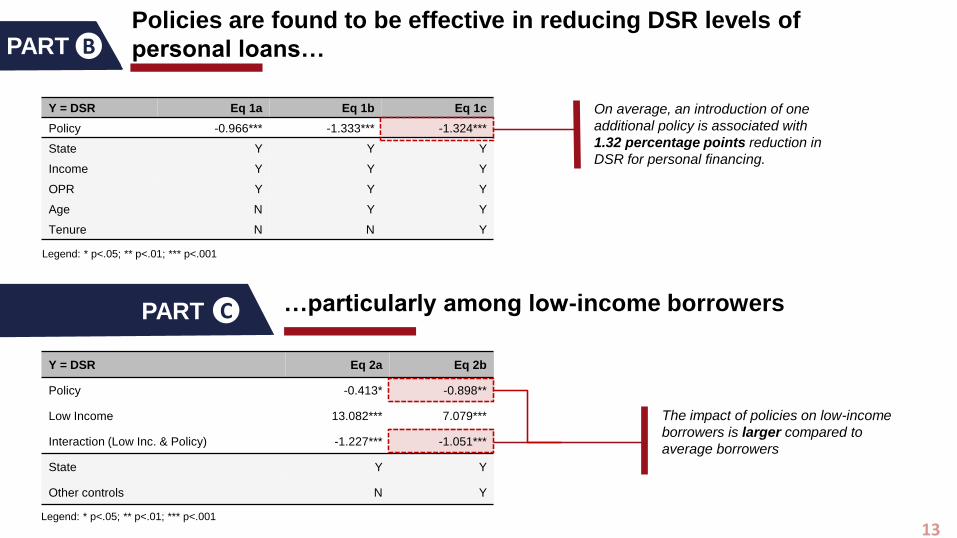
Policies are found to be effective in reducing DSR levels of
personal loans…BPART
PART C …particularly among low-income borrowers
Y = DSR Eq 1a Eq 1b Eq 1c
Policy -0.966*** -1.333*** -1.324***
State Y Y Y
Income Y Y Y
OPR Y Y Y
Age N Y Y
Tenure N N Y
On average, an introduction of one
additional policy is associated with
1.32 percentage points reduction in
DSR for personal financing.
Legend: * p<.05; ** p<.01; *** p<.001
Y = DSR Eq 2a Eq 2b
Policy -0.413* -0.898**
Low Income 13.082*** 7.079***
Interaction (Low Inc. & Policy) -1.227*** -1.051***
State Y Y
Other controls N Y
Legend: * p<.05; ** p<.01; *** p<.001
The impact of policies on low-income
borrowers is larger compared to
average borrowers
13
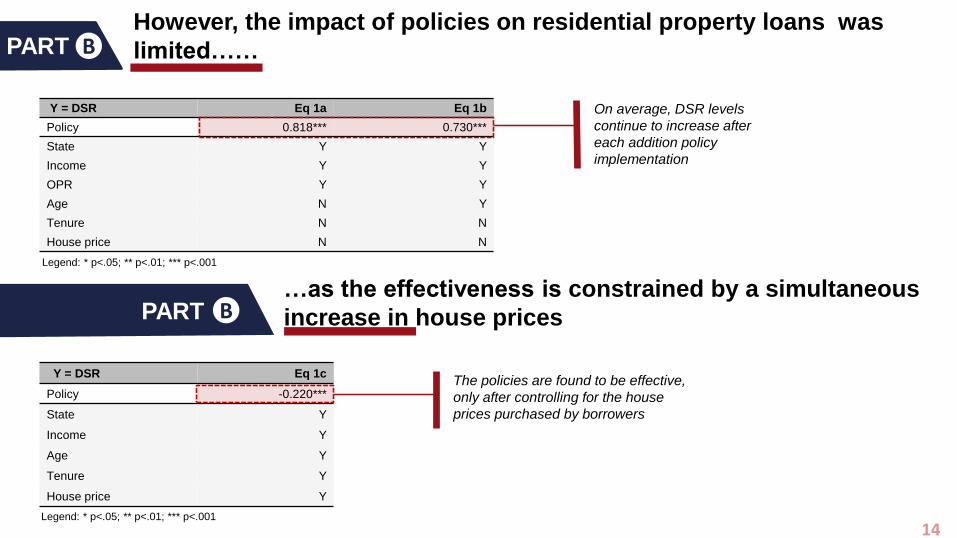
Y = DSR Eq 1c
Policy -0.220***
State Y
Income Y
Age Y
Tenure Y
House price Y
Y = DSR Eq 1a Eq 1b
Policy 0.818*** 0.730***
State Y Y
Income Y Y
OPR Y Y
Age N Y
Tenure N N
House price N N
However, the impact of policies on residential property loans was
limited……BPART
PART B…as the effectiveness is constrained by a simultaneous
increase in house prices
On average, DSR levels
continue to increase after
each addition policy
implementation
Legend: * p<.05; ** p<.01; *** p<.001
Legend: * p<.05; ** p<.01; *** p<.001
The policies are found to be effective,
only after controlling for the house
prices purchased by borrowers
14
15
Outline
1
2
3
4
Malaysia’s experience with macroprudential policy
Micro data for macro-financial insights
Conclusion and future research
Results
• Summary and what’s next?
16
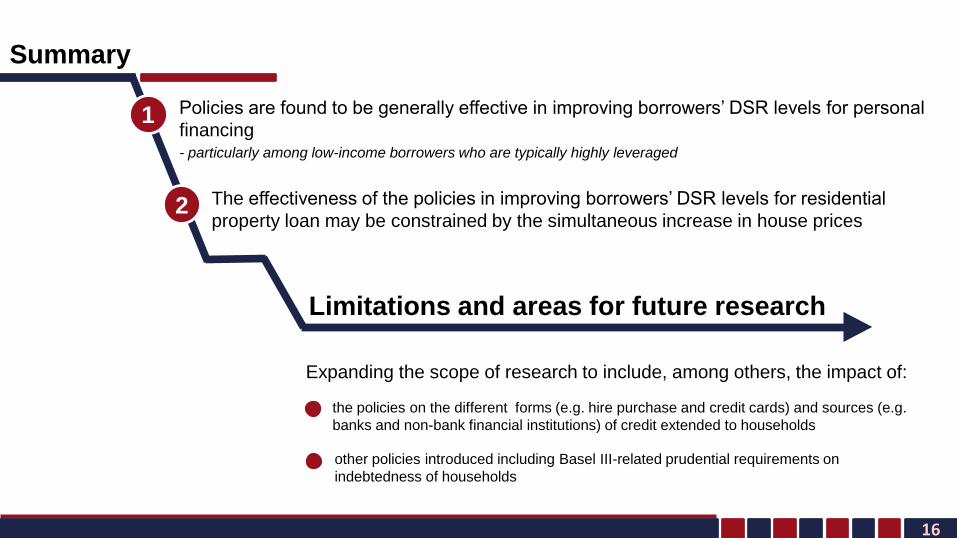
Summary
1
2
Limitations and areas for future research
Policies are found to be generally effective in improving borrowers’ DSR levels for personal
financing- particularly among low-income borrowers who are typically highly leveraged
The effectiveness of the policies in improving borrowers’ DSR levels for residential
property loan may be constrained by the simultaneous increase in house prices
Expanding the scope of research to include, among others, the impact of:
the policies on the different forms (e.g. hire purchase and credit cards) and sources (e.g.
banks and non-bank financial institutions) of credit extended to households
other policies introduced including Basel III-related prudential requirements on
indebtedness of households

c o m e . c o n n e c t . c r e a t e
THANK YOU