Embed Size (px)
Citation preview
Investor presentation Autumn 2015
Cautionary statement
This Review is intended to focus on matters which are relevant to the interests of shareholders in the
Company. The purpose of the Review is to assist shareholders in assessing the strategies adopted and
performance delivered by the Company and the potential for those strategies to succeed. It should not
be relied upon by any other party or for any other purpose.
Forward looking statements are made in good faith, based on a number of assumptions concerning
future events and information available to Directors at the time of their approval of this report. These
forward looking statements should be treated with caution due to the inherent uncertainties underlying
any such forward looking information. The user of these accounts should not rely unduly on these
forward looking statements, which are not a guarantee of performance and which are subject to a
number of uncertainties and other facts, many of which are outside of the Company’s control and could
cause actual events to differ materially from those in these statements. No guarantee can be given of
future results, levels of activity, performance or achievements.
2
Unless otherwise stated, all profit, margin and EPS data refer to normalised results, which can be found on the face of the Group Income
Statement in the first column. The definition of normalised profit is as follows: IFRS result excluding charges for intangible asset amortisation,
exceptional items (nil in 2015), loss on disposal of a business and tax relief thereon. The Board believes that the normalised result gives a better
indication of the underlying performance of the Group.
Contents
o Group strategy, investment case and business model
o Our markets
o Strategic focus and areas for growth
o Divisional highlights – Half Year 2015
o Financial results – Half Year 2015
o Appendix
3
Group strategy
Investment case
Business model
4
5
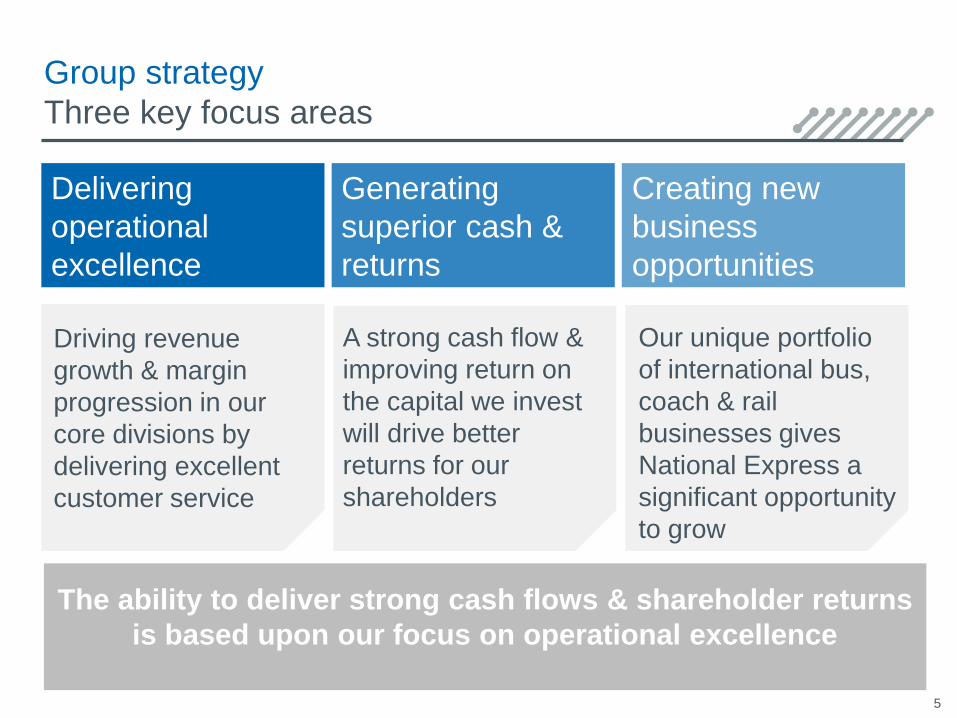
Group strategy
Three key focus areas
Delivering
operational
excellence
Generating
superior cash &
returns
Creating new
business
opportunities
Driving revenue
growth & margin
progression in our
core divisions by
delivering excellent
customer service
A strong cash flow &
improving return on
the capital we invest
will drive better
returns for our
shareholders
Our unique portfolio
of international bus,
coach & rail
businesses gives
National Express a
significant opportunity
to grow
The ability to deliver strong cash flows & shareholder returns
is based upon our focus on operational excellence
Investment case
Our diversity is our strength
6
o Best in class public transport operator with differentiated proposition to
deliver sustainable, long-term shareholder value:
o Well balanced and diversified portfolio
o Strong recurring revenue streams from perpetuity businesses and
established contract markets
o Strong free cash flow helping to drive organic growth and position us for
growth in new markets:
o Fast developing pipeline of substantial capital-light growth opportunities;
successful conversion of pipeline in German rail and the Middle East
o Bolt-on acquisition opportunities in North America
o Stable, long-term financing and commitment to investment grade rating
o Dividend policy: 2x Group earnings including long-term rail earnings
Business model
Using operational expertise & experience…
7
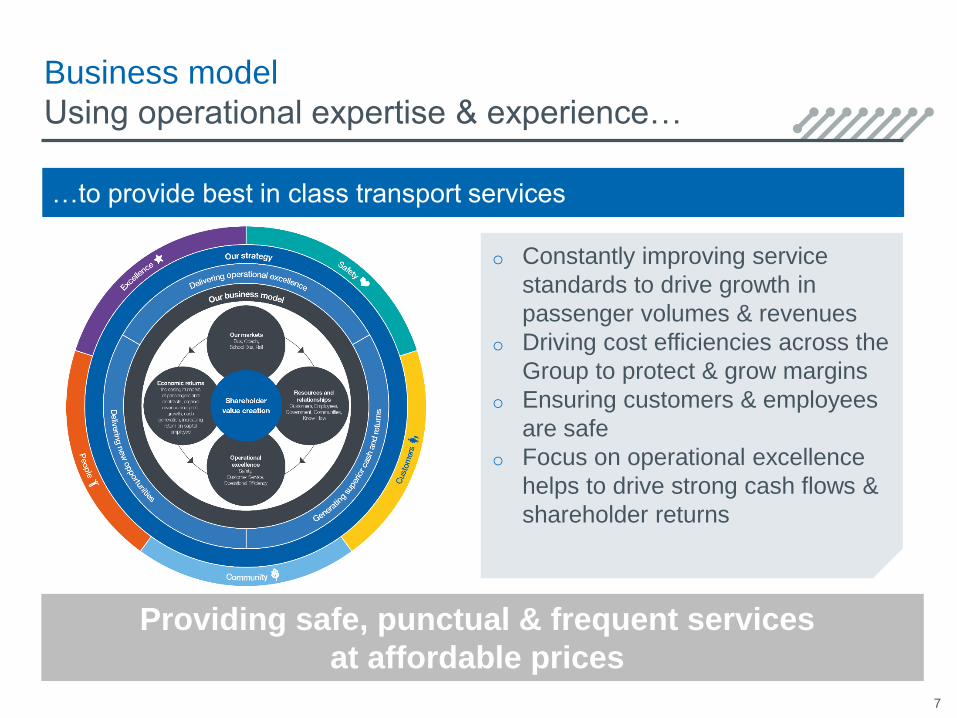
o Constantly improving service
standards to drive growth in
passenger volumes & revenues
o Driving cost efficiencies across the
Group to protect & grow margins
o Ensuring customers & employees
are safe
o Focus on operational excellence
helps to drive strong cash flows &
shareholder returns
…to provide best in class transport services
Providing safe, punctual & frequent services
at affordable prices
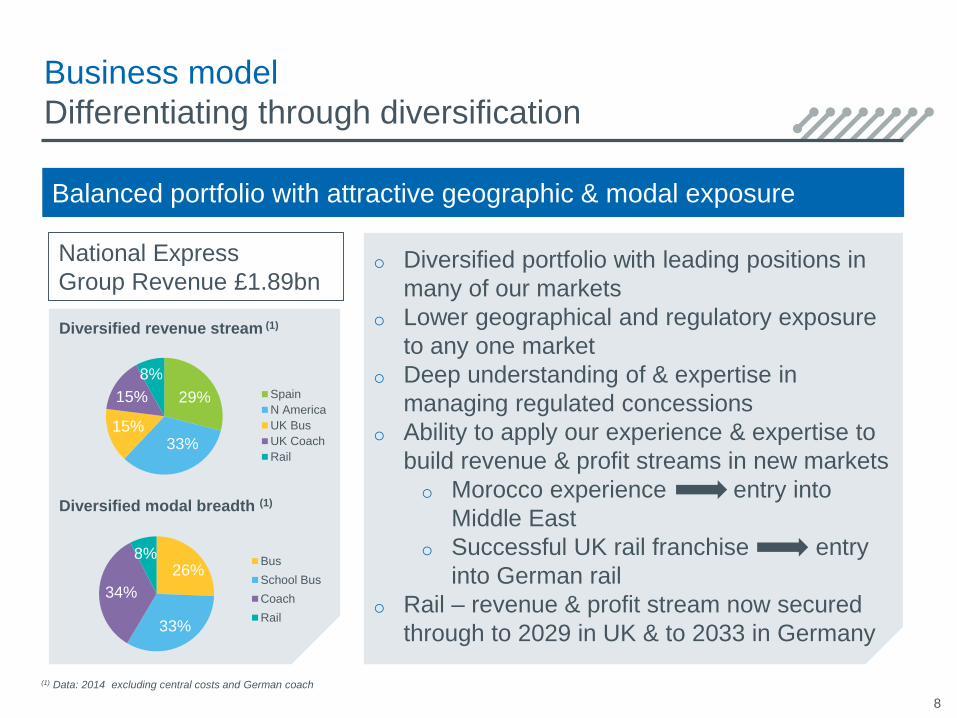
26%
33%
34%
8%Bus
School Bus
Coach
Rail
Business model
Differentiating through diversification
(1) Data: 2014 excluding central costs and German coach
Diversified revenue stream (1)
Diversified modal breadth (1)
8
o Diversified portfolio with leading positions in
many of our markets
o Lower geographical and regulatory exposure
to any one market
o Deep understanding of & expertise in
managing regulated concessions
o Ability to apply our experience & expertise to
build revenue & profit streams in new markets
o Morocco experience entry into
Middle East
o Successful UK rail franchise entry
into German rail
o Rail – revenue & profit stream now secured
through to 2029 in UK & to 2033 in Germany
National Express
Group Revenue £1.89bn
Balanced portfolio with attractive geographic & modal exposure
29%
33%15%
15%
8%Spain
N America
UK Bus
UK Coach
Rail
Delivering on our strategy
Strong track record on improving returns
9
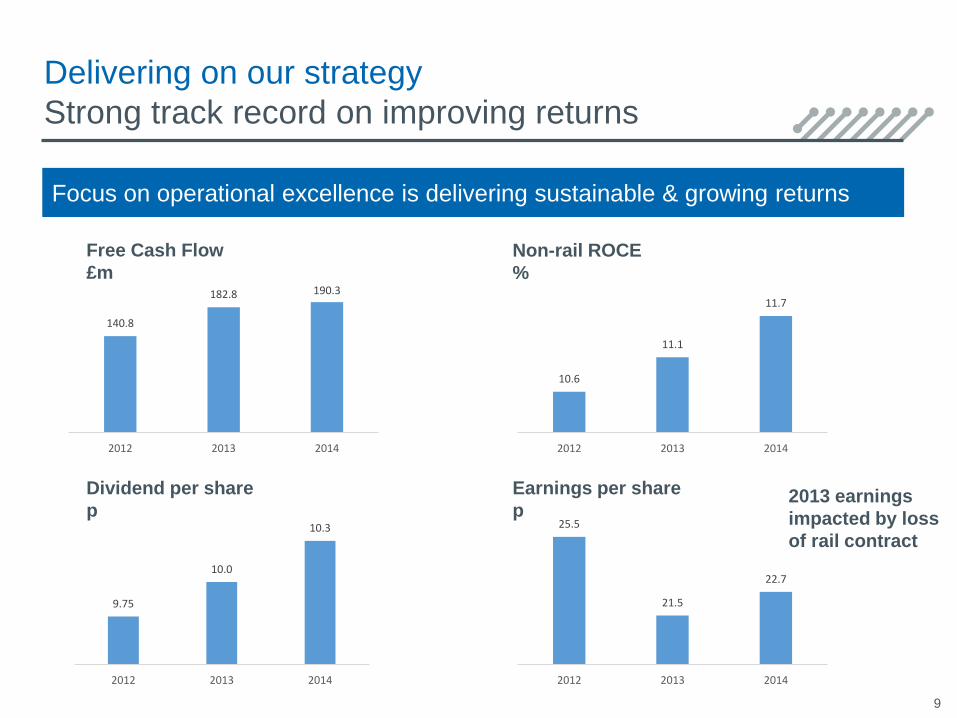
Focus on operational excellence is delivering sustainable & growing returns
140.8
182.8 190.3
2012 2013 2014
9.75
10.0
10.3
2012 2013 2014
10.6
11.1
11.7
2012 2013 2014
25.5
21.5
22.7
2012 2013 2014
Free Cash Flow
£m
Non-rail ROCE
%
Dividend per share
p
Earnings per share
p2013 earnings
impacted by loss
of rail contract
10
Our markets
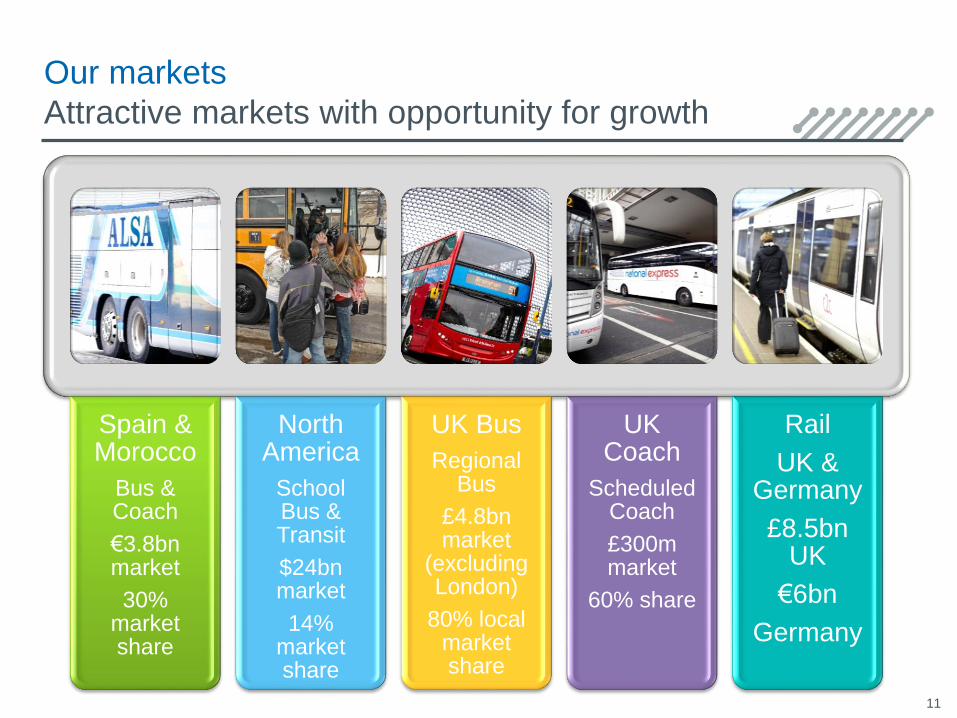
Our markets
Attractive markets with opportunity for growth
11
Spain & Morocco
Bus & Coach
€3.8bn market
30% market share
North America
School Bus & Transit
$24bn market
14% market share
UK Bus
Regional Bus
£4.8bn market
(excluding London)
80% local market share
UK Coach
Scheduled Coach
£300m market
60% share
Rail
UK & Germany
£8.5bn UK
€6bn
Germany
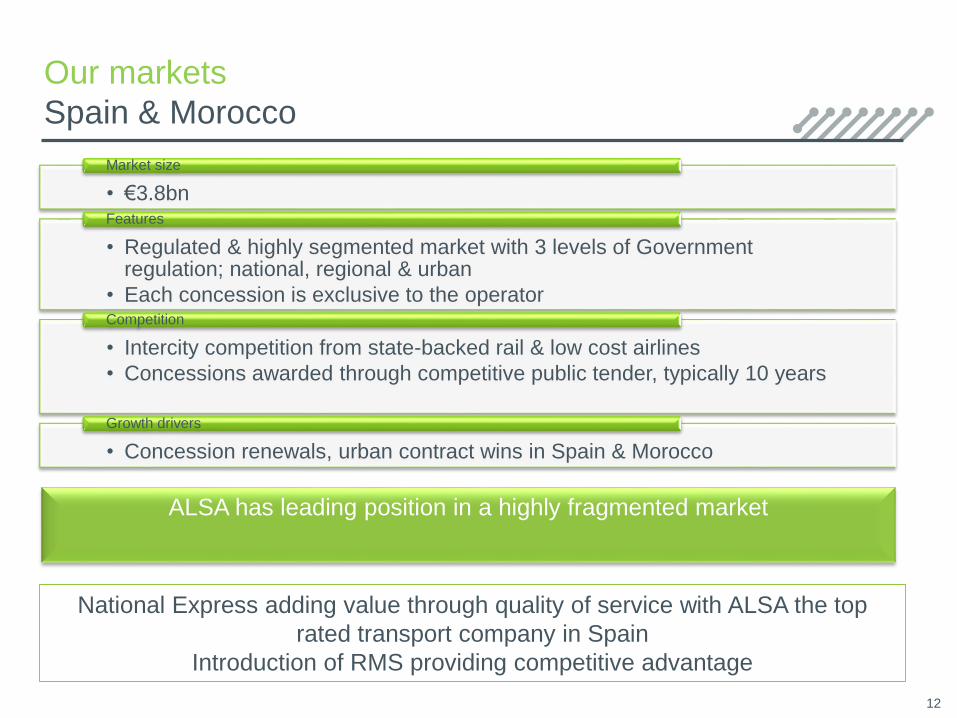
Our markets
Spain & Morocco
12
• €3.8bn
Market size
• Regulated & highly segmented market with 3 levels of Government regulation; national, regional & urban
• Each concession is exclusive to the operator
Features
• Intercity competition from state-backed rail & low cost airlines
• Concessions awarded through competitive public tender, typically 10 years
Competition
• Concession renewals, urban contract wins in Spain & Morocco
Growth drivers
ALSA has leading position in a highly fragmented market
National Express adding value through quality of service with ALSA the top
rated transport company in Spain
Introduction of RMS providing competitive advantage
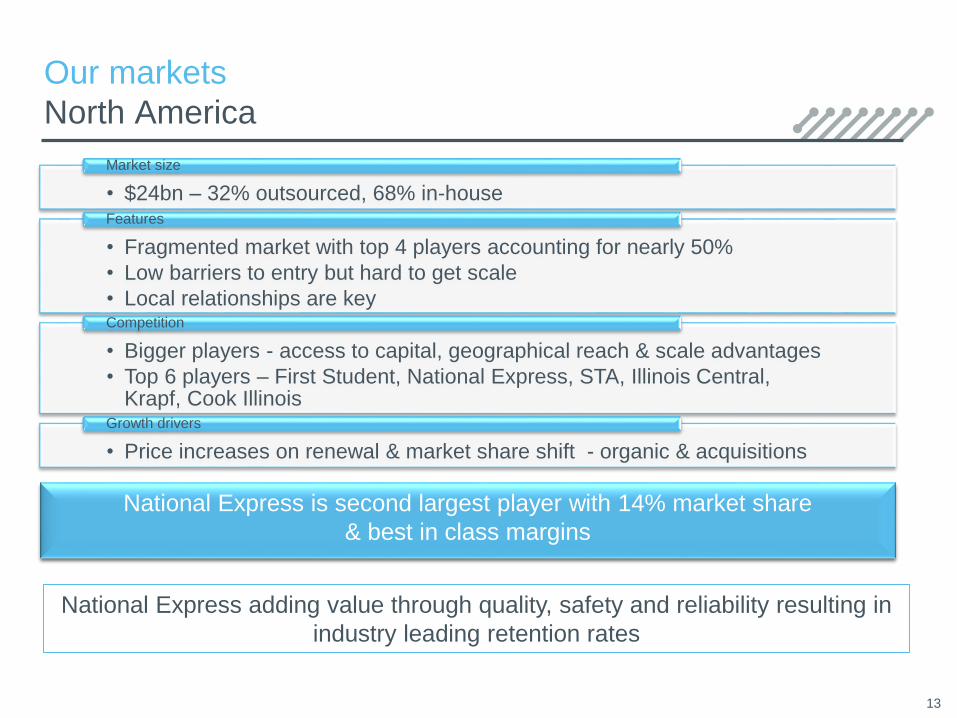
Our markets
North America
13
• $24bn – 32% outsourced, 68% in-house
Market size
• Fragmented market with top 4 players accounting for nearly 50%
• Low barriers to entry but hard to get scale
• Local relationships are key
Features
• Bigger players - access to capital, geographical reach & scale advantages
• Top 6 players – First Student, National Express, STA, Illinois Central, Krapf, Cook Illinois
Competition
• Price increases on renewal & market share shift - organic & acquisitions
Growth drivers
National Express is second largest player with 14% market share
& best in class margins
National Express adding value through quality, safety and reliability resulting in
industry leading retention rates
Our markets
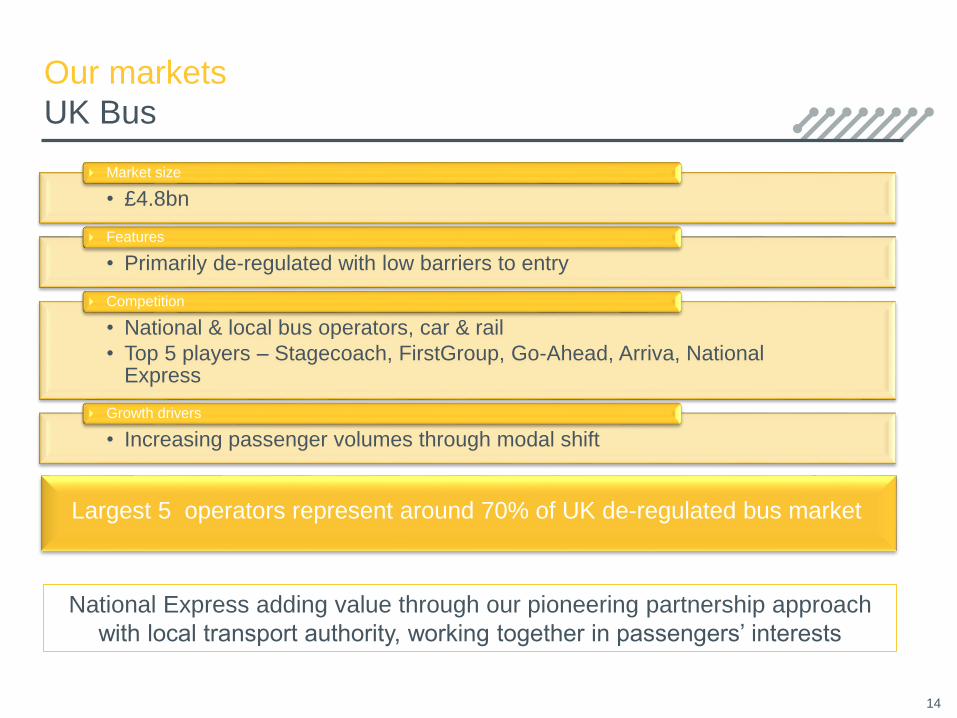
UK Bus
14
• £4.8bn
Market size
• Primarily de-regulated with low barriers to entry
Features
• National & local bus operators, car & rail
• Top 5 players – Stagecoach, FirstGroup, Go-Ahead, Arriva, National Express
Competition
• Increasing passenger volumes through modal shift
Growth drivers
Largest 5 operators represent around 70% of UK de-regulated bus market
National Express adding value through our pioneering partnership approach
with local transport authority, working together in passengers’ interests
Our markets
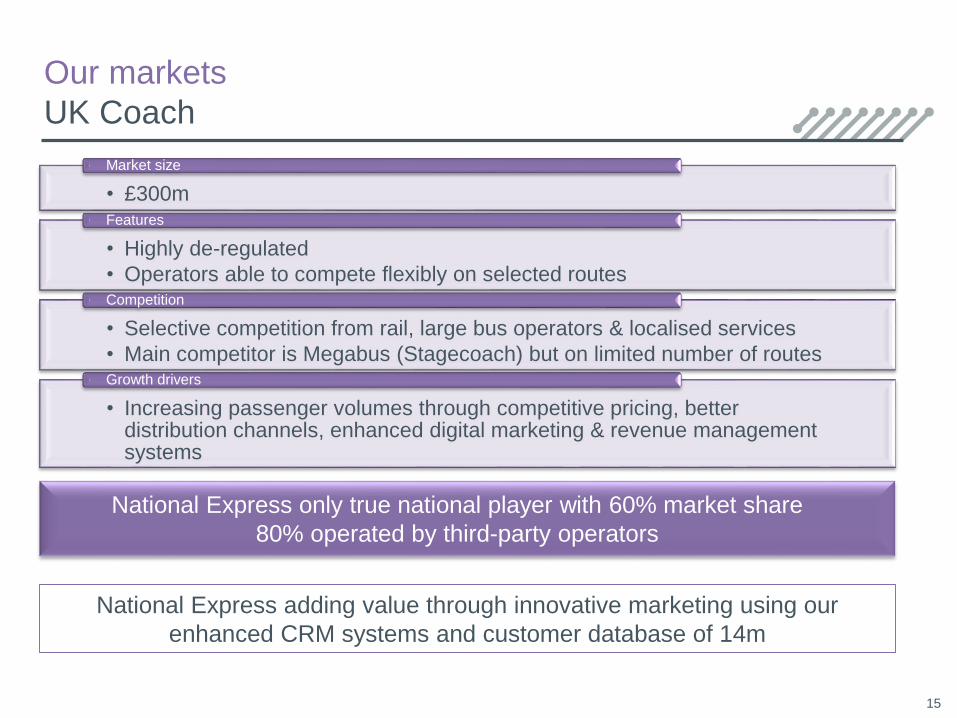
UK Coach
15
• £300m
Market size
• Highly de-regulated
• Operators able to compete flexibly on selected routes
Features
• Selective competition from rail, large bus operators & localised services
• Main competitor is Megabus (Stagecoach) but on limited number of routes
Competition
• Increasing passenger volumes through competitive pricing, better distribution channels, enhanced digital marketing & revenue management systems
Growth drivers
National Express only true national player with 60% market share
80% operated by third-party operators
National Express adding value through innovative marketing using our
enhanced CRM systems and customer database of 14m
Our markets
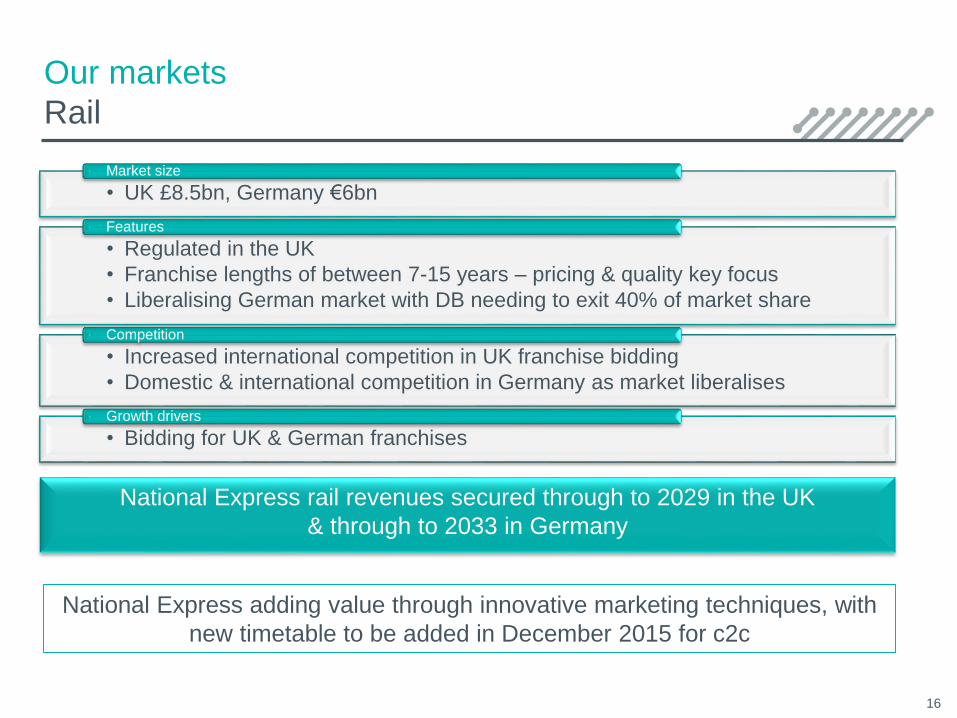
Rail
16
• UK £8.5bn, Germany €6bnMarket size
• Regulated in the UK
• Franchise lengths of between 7-15 years – pricing & quality key focus
• Liberalising German market with DB needing to exit 40% of market share
Features
• Increased international competition in UK franchise bidding
• Domestic & international competition in Germany as market liberalises
Competition
• Bidding for UK & German franchises Growth drivers
National Express rail revenues secured through to 2029 in the UK
& through to 2033 in Germany
National Express adding value through innovative marketing techniques, with
new timetable to be added in December 2015 for c2c
17
Strategic focus &
growth opportunities
Strength of balance sheet provides choices
o Net debt significantly reduced over past 2 years – gearing ratio reduced
to 2.25x net debt to EBITDA Financial Year 2014
o Deleveraged balance sheet provides options:
o Invest surplus cash in attractive growth opportunities
o North America – selective bolt-on opportunities
o Developing German Rail and Middle East
o We now see opportunity to deliver positive risk adjusted returns, while
maintaining capital discipline
o From 2015 onwards maintenance capex returning to more normal levels to
capture new growth - still expect to generate £100m of free cash flow
o Delivering long-term sustainable growth and shareholder value with
progressive dividend, covered by 2x Group earnings
18
Strong balance sheet underpinned by reliable cash generation
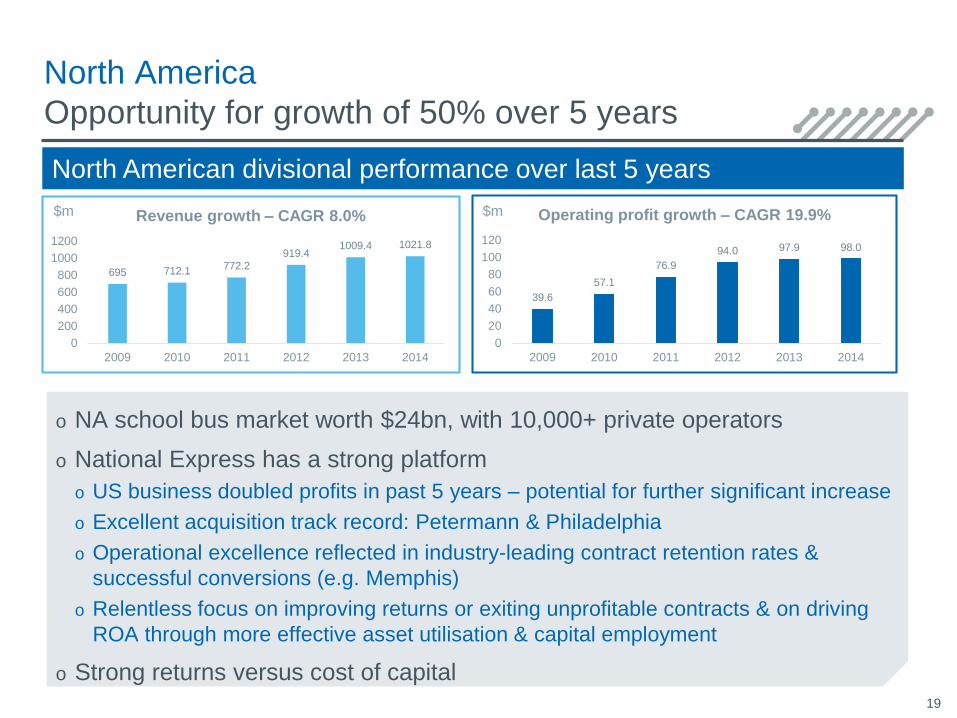
North America
Opportunity for growth of 50% over 5 years
o NA school bus market worth $24bn, with 10,000+ private operators
o National Express has a strong platform
o US business doubled profits in past 5 years – potential for further significant increase
o Excellent acquisition track record: Petermann & Philadelphia
o Operational excellence reflected in industry-leading contract retention rates &
successful conversions (e.g. Memphis)
o Relentless focus on improving returns or exiting unprofitable contracts & on driving
ROA through more effective asset utilisation & capital employment
o Strong returns versus cost of capital19
695 712.1772.2
919.41009.4 1021.8
0
200
400
600
800
1000
1200
2009 2010 2011 2012 2013 2014
Revenue growth – CAGR 8.0% $m
39.6
57.1
76.9
94.0 97.9 98.0
0
20
40
60
80
100
120
2009 2010 2011 2012 2013 2014
Operating profit growth – CAGR 19.9%$m
North American divisional performance over last 5 years
German Rail and Middle East
o German Rail – largest rail market in Europe
o €9bn p.a. market in regional and urban
o Built a pipeline of €2.6bn of revenue in just 2 years
o Momentum gathering: pre-qualified for 2 further bids – worth a potential €100m
revenues
o Strong pipeline of bid opportunities with around 30 contracts up for tender
in next 2 years
o Middle East - first mover advantage in fast developing markets
o Won first urban bus contract in Bahrain
o Provides platform for further growth in the region
o Submitted a further bid in the region to operate urban bus services in Makkah,
Saudi Arabia
o Active pipeline of opportunities – worth c.£0.8bn of revenue
20
Attractive growth markets with capital-light characteristics
Divisional highlightsHalf year 2015
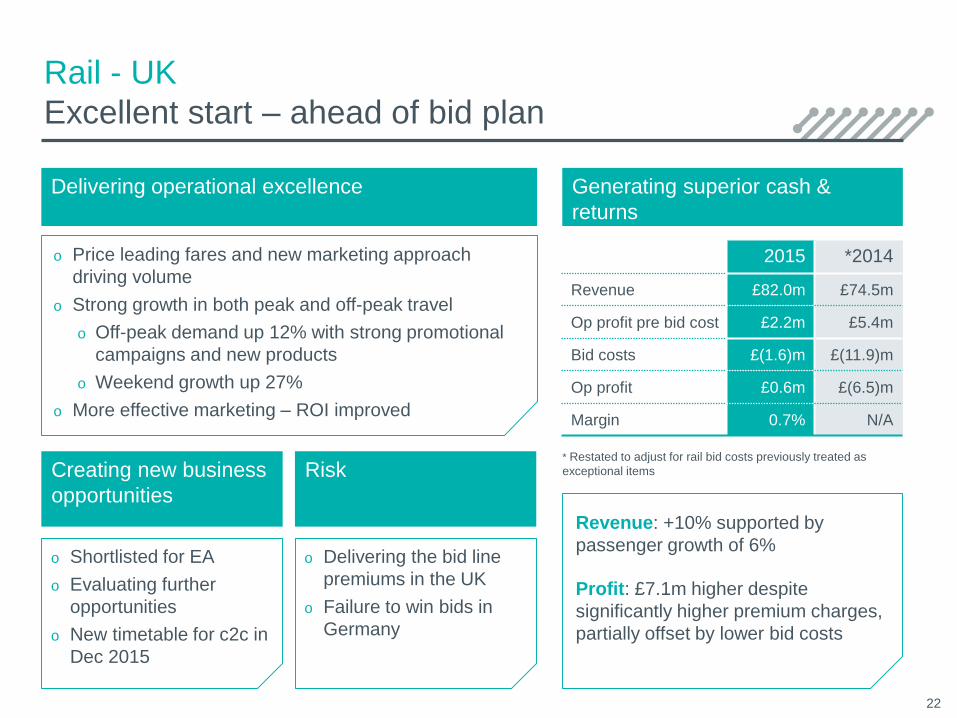
Rail - UK
Excellent start – ahead of bid plan
Delivering operational excellence
Creating new business
opportunities
22
2015 *2014
Revenue £82.0m £74.5m
Op profit pre bid cost £2.2m £5.4m
Bid costs £(1.6)m £(11.9)m
Op profit £0.6m £(6.5)m
Margin 0.7% N/A
o Price leading fares and new marketing approach
driving volume
o Strong growth in both peak and off-peak travel
o Off-peak demand up 12% with strong promotional
campaigns and new products
o Weekend growth up 27%
o More effective marketing – ROI improved
o Shortlisted for EA
o Evaluating further
opportunities
o New timetable for c2c in
Dec 2015
Revenue: +10% supported by
passenger growth of 6%
Profit: £7.1m higher despite
significantly higher premium charges,
partially offset by lower bid costs
o Delivering the bid line
premiums in the UK
o Failure to win bids in
Germany
* Restated to adjust for rail bid costs previously treated as
exceptional itemsRisk
Generating superior cash &
returns
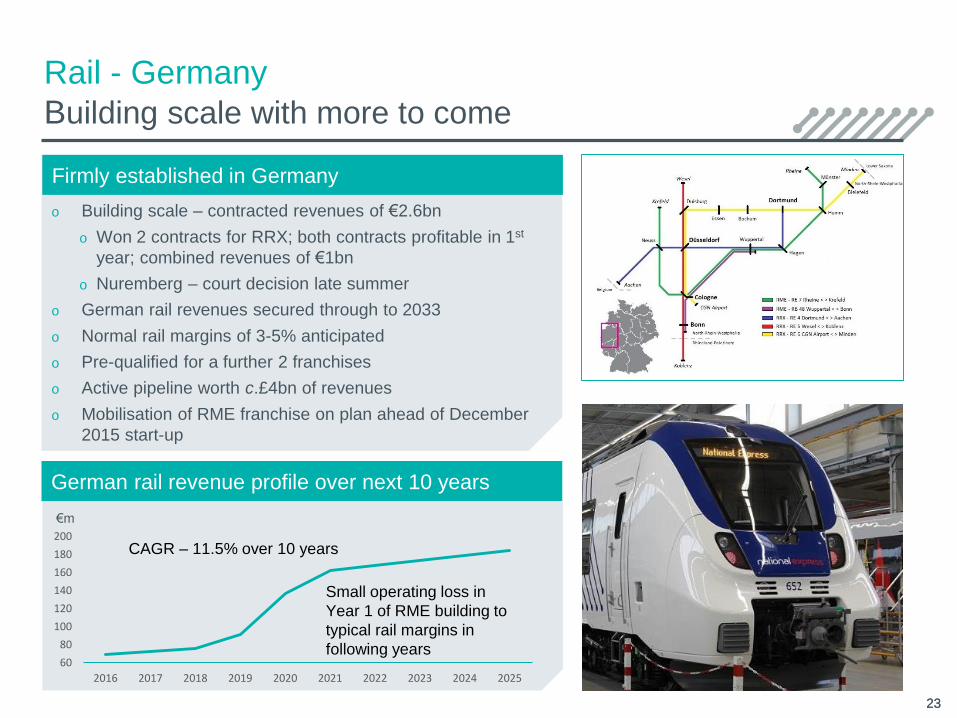
o Building scale – contracted revenues of €2.6bn
o Won 2 contracts for RRX; both contracts profitable in 1st
year; combined revenues of €1bn
o Nuremberg – court decision late summer
o German rail revenues secured through to 2033
o Normal rail margins of 3-5% anticipated
o Pre-qualified for a further 2 franchises
o Active pipeline worth c.£4bn of revenues
o Mobilisation of RME franchise on plan ahead of December
2015 start-up
Firmly established in Germany
Rail - Germany
Building scale with more to come
2323
New photo
required
60
80
100
120
140
160
180
200
2016 2017 2018 2019 2020 2021 2022 2023 2024 2025
CAGR – 11.5% over 10 years
Small operating loss in
Year 1 of RME building to
typical rail margins in
following years
€m
German rail revenue profile over next 10 years
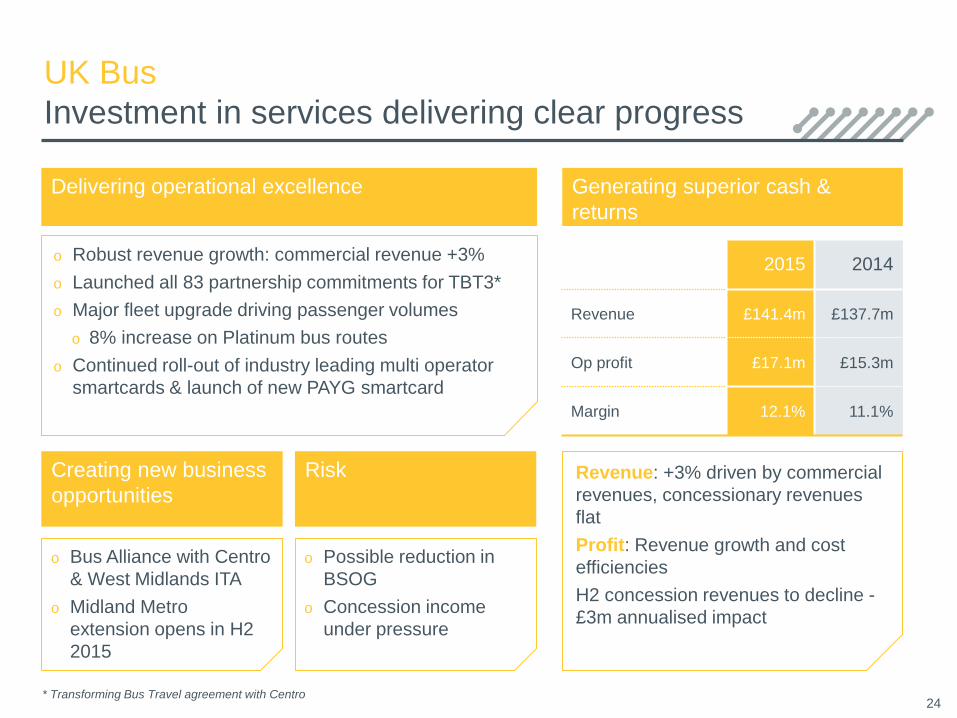
UK Bus
Investment in services delivering clear progress
Delivering operational excellence
Creating new business
opportunities
24
2015 2014
Revenue £141.4m £137.7m
Op profit £17.1m £15.3m
Margin 12.1% 11.1%
o Robust revenue growth: commercial revenue +3%
o Launched all 83 partnership commitments for TBT3*
o Major fleet upgrade driving passenger volumes
o 8% increase on Platinum bus routes
o Continued roll-out of industry leading multi operator
smartcards & launch of new PAYG smartcard
o Bus Alliance with Centro
& West Midlands ITA
o Midland Metro
extension opens in H2
2015
Revenue: +3% driven by commercial
revenues, concessionary revenues
flat
Profit: Revenue growth and cost
efficiencies
H2 concession revenues to decline -
£3m annualised impact
o Possible reduction in
BSOG
o Concession income
under pressure
Risk
Generating superior cash &
returns
* Transforming Bus Travel agreement with Centro
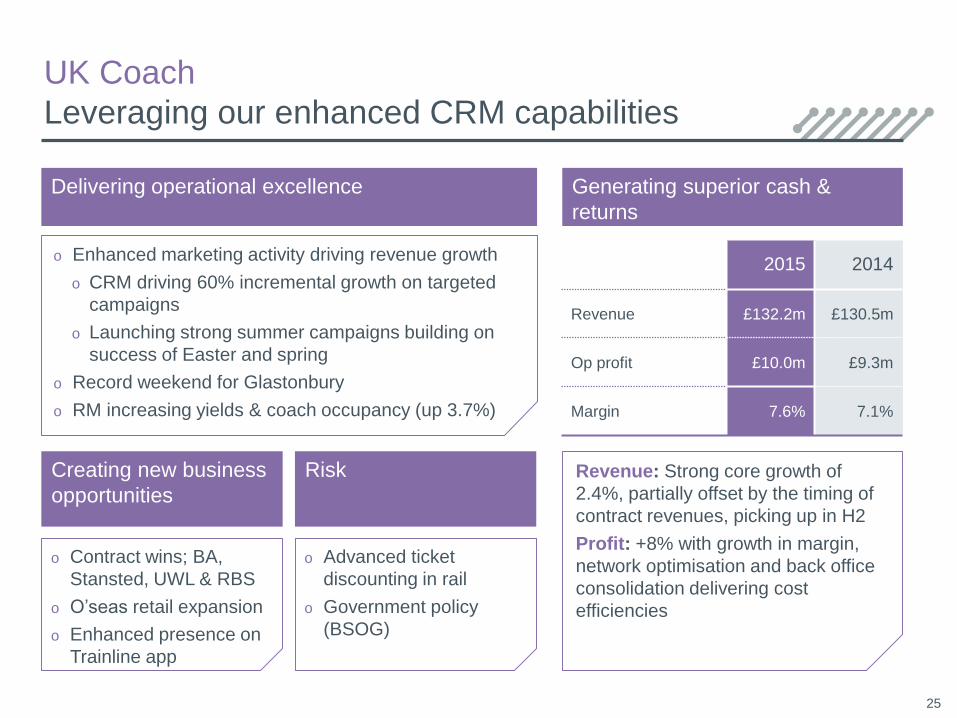
UK Coach
Leveraging our enhanced CRM capabilities
Delivering operational excellence
Creating new business
opportunities
25
2015 2014
Revenue £132.2m £130.5m
Op profit £10.0m £9.3m
Margin 7.6% 7.1%
o Enhanced marketing activity driving revenue growth
o CRM driving 60% incremental growth on targeted
campaigns
o Launching strong summer campaigns building on
success of Easter and spring
o Record weekend for Glastonbury
o RM increasing yields & coach occupancy (up 3.7%)
o Contract wins; BA,
Stansted, UWL & RBS
o O’seas retail expansion
o Enhanced presence on
Trainline app
Revenue: Strong core growth of
2.4%, partially offset by the timing of
contract revenues, picking up in H2
Profit: +8% with growth in margin,
network optimisation and back office
consolidation delivering cost
efficiencies
o Advanced ticket
discounting in rail
o Government policy
(BSOG)
Risk
Generating superior cash &
returns
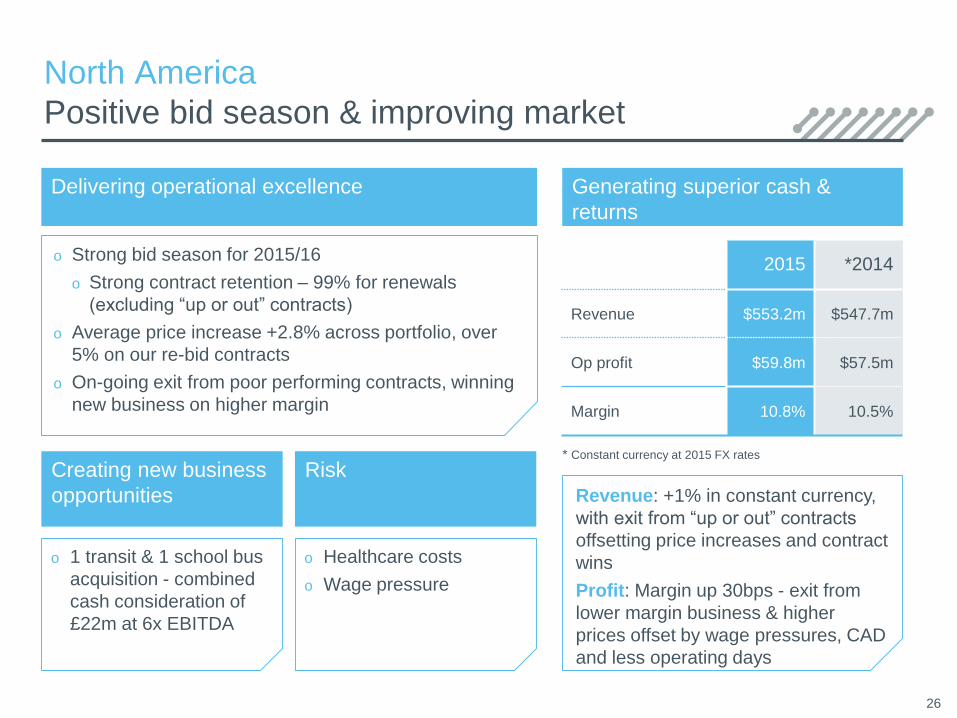
North America
Positive bid season & improving market
Delivering operational excellence
Creating new business
opportunities
26
2015 *2014
Revenue $553.2m $547.7m
Op profit $59.8m $57.5m
Margin 10.8% 10.5%
o Strong bid season for 2015/16
o Strong contract retention – 99% for renewals
(excluding “up or out” contracts)
o Average price increase +2.8% across portfolio, over
5% on our re-bid contracts
o On-going exit from poor performing contracts, winning
new business on higher margin
o 1 transit & 1 school bus
acquisition - combined
cash consideration of
£22m at 6x EBITDA
Revenue: +1% in constant currency,
with exit from “up or out” contracts
offsetting price increases and contract
wins
Profit: Margin up 30bps - exit from
lower margin business & higher
prices offset by wage pressures, CAD
and less operating days
o Healthcare costs
o Wage pressure
Risk
Generating superior cash &
returns
* Constant currency at 2015 FX rates
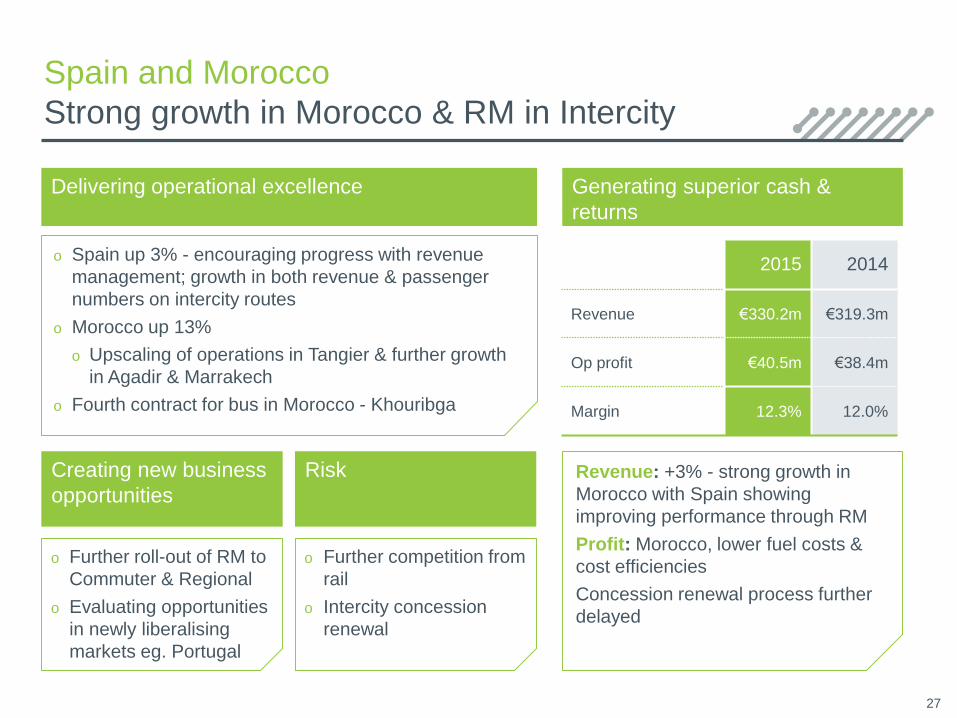
Spain and Morocco
Strong growth in Morocco & RM in Intercity
Delivering operational excellence
Creating new business
opportunities
27
2015 2014
Revenue €330.2m €319.3m
Op profit €40.5m €38.4m
Margin 12.3% 12.0%
o Spain up 3% - encouraging progress with revenue
management; growth in both revenue & passenger
numbers on intercity routes
o Morocco up 13%
o Upscaling of operations in Tangier & further growth
in Agadir & Marrakech
o Fourth contract for bus in Morocco - Khouribga
o Further roll-out of RM to
Commuter & Regional
o Evaluating opportunities
in newly liberalising
markets eg. Portugal
Revenue: +3% - strong growth in
Morocco with Spain showing
improving performance through RM
Profit: Morocco, lower fuel costs &
cost efficiencies
Concession renewal process further
delayed
o Further competition from
rail
o Intercity concession
renewal
Risk
Generating superior cash &
returns
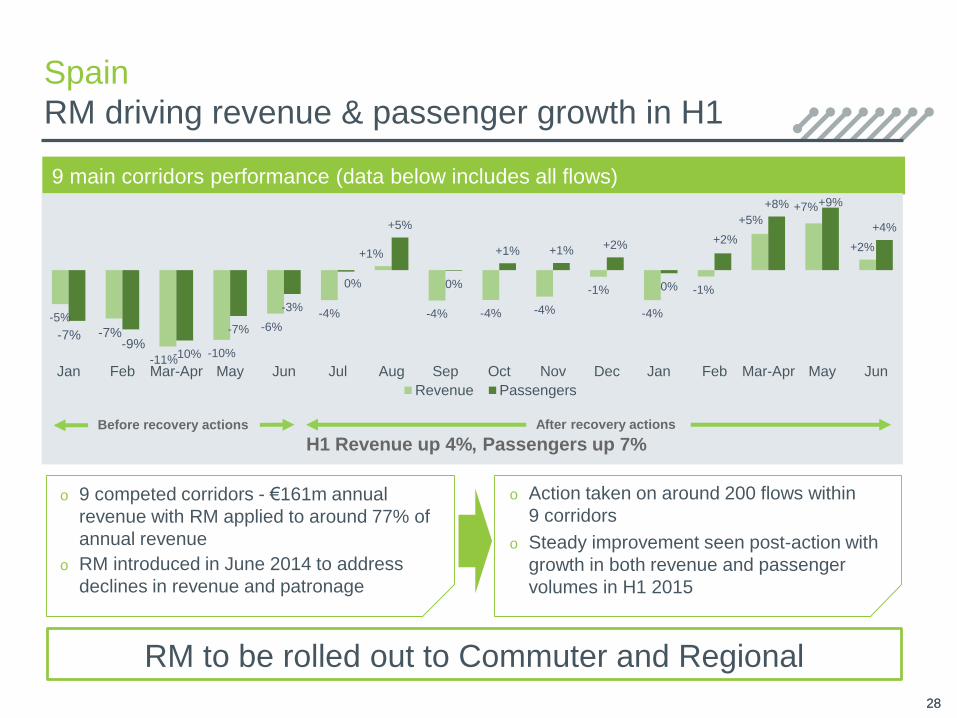
Spain
RM driving revenue & passenger growth in H1
2828
o 9 competed corridors - €161m annual
revenue with RM applied to around 77% of
annual revenue
o RM introduced in June 2014 to address
declines in revenue and patronage
o Action taken on around 200 flows within
9 corridors
o Steady improvement seen post-action with
growth in both revenue and passenger
volumes in H1 2015
9 main corridors performance (data below includes all flows)
-5%
-7%
-11%-10%
-6%-4%
+1%
-4% -4% -4%
-1%
-4%
-1%
+5%+7%
+2%
-7%-9%
-10%
-7%
-3%
0%
+5%
0%
+1% +1% +2%
0%
+2%
+8% +9%
+4%
Jan Feb Mar-Apr May Jun Jul Aug Sep Oct Nov Dec Jan Feb Mar-Apr May Jun
Revenue Passengers
H1 Revenue up 4%, Passengers up 7%After recovery actionsBefore recovery actions
RM to be rolled out to Commuter and Regional
29
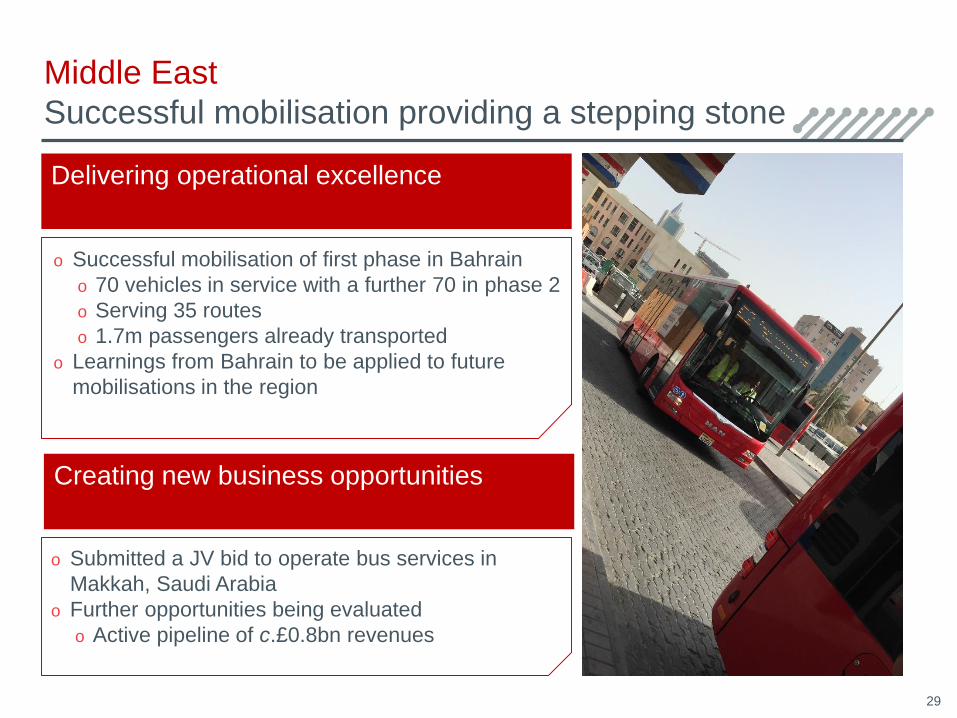
Middle East
Successful mobilisation providing a stepping stone
Delivering operational excellence
Creating new business opportunities
o Successful mobilisation of first phase in Bahrain
o 70 vehicles in service with a further 70 in phase 2
o Serving 35 routes
o 1.7m passengers already transported
o Learnings from Bahrain to be applied to future
mobilisations in the region
o Submitted a JV bid to operate bus services in
Makkah, Saudi Arabia
o Further opportunities being evaluated
o Active pipeline of c.£0.8bn revenues
30
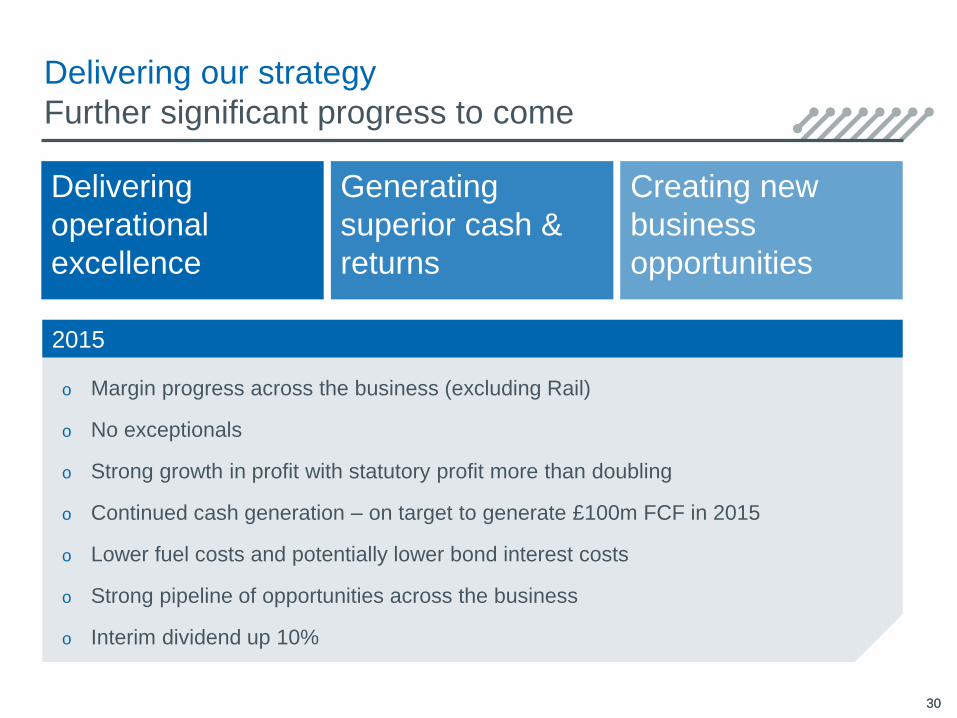
Delivering our strategy
Further significant progress to come
Delivering
operational
excellence
Generating
superior cash &
returns
Creating new
business
opportunities
2015
30
o Margin progress across the business (excluding Rail)
o No exceptionals
o Strong growth in profit with statutory profit more than doubling
o Continued cash generation – on target to generate £100m FCF in 2015
o Lower fuel costs and potentially lower bond interest costs
o Strong pipeline of opportunities across the business
o Interim dividend up 10%
31
Financial results
Half year 2015
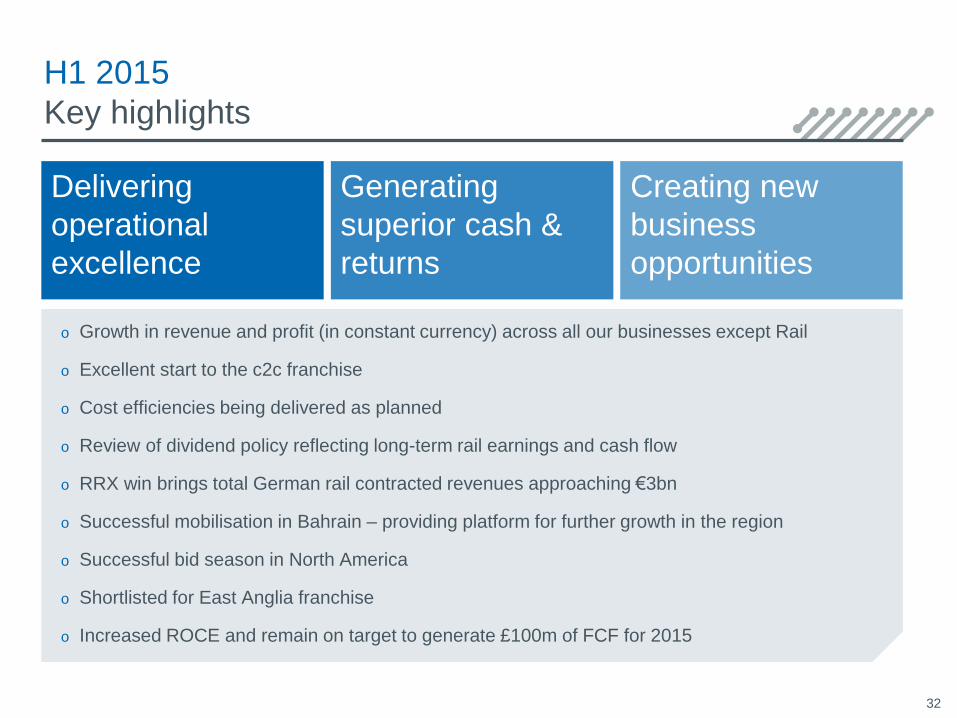
H1 2015
Key highlights
o Growth in revenue and profit (in constant currency) across all our businesses except Rail
o Excellent start to the c2c franchise
o Cost efficiencies being delivered as planned
o Review of dividend policy reflecting long-term rail earnings and cash flow
o RRX win brings total German rail contracted revenues approaching €3bn
o Successful mobilisation in Bahrain – providing platform for further growth in the region
o Successful bid season in North America
o Shortlisted for East Anglia franchise
o Increased ROCE and remain on target to generate £100m of FCF for 2015
32
Delivering
operational
excellence
Generating
superior cash &
returns
Creating new
business
opportunities
33
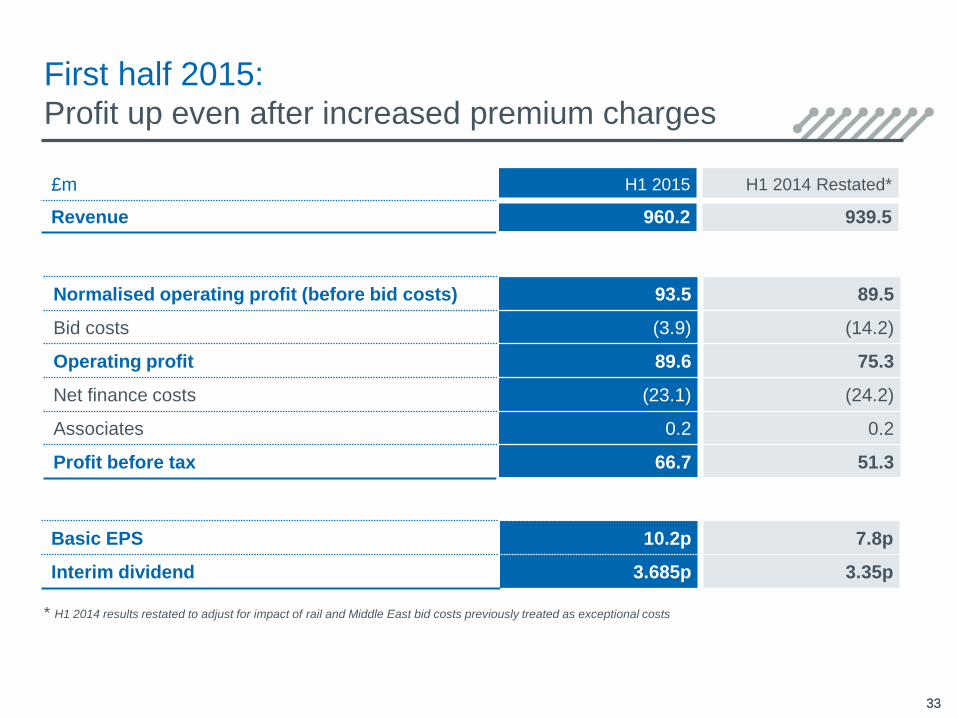
£m H1 2015 H1 2014 Restated*
Revenue 960.2 939.5
Normalised operating profit (before bid costs) 93.5 89.5
Bid costs (3.9) (14.2)
Operating profit 89.6 75.3
Net finance costs (23.1) (24.2)
Associates 0.2 0.2
Profit before tax 66.7 51.3
First half 2015:Profit up even after increased premium charges
Basic EPS 10.2p 7.8p
Interim dividend 3.685p 3.35p
33
* H1 2014 results restated to adjust for impact of rail and Middle East bid costs previously treated as exceptional costs
34
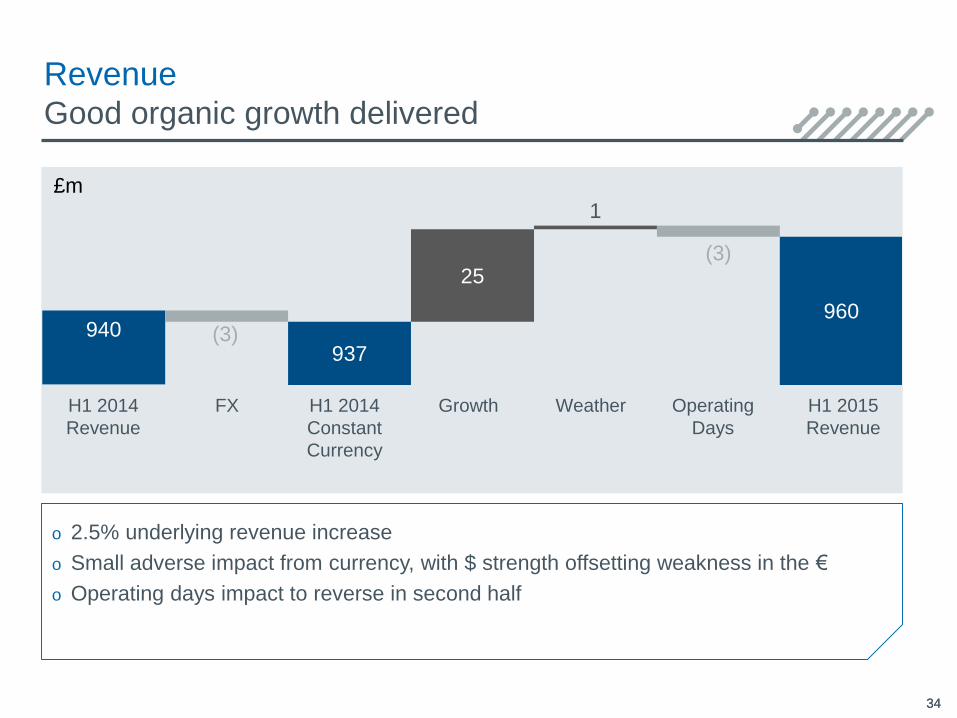
RevenueGood organic growth delivered
940 (3)937
25
1
(3)
960
£m
H1 2014
Revenue
Growth Operating
Days
H1 2015
Revenue
H1 2014
Constant
Currency
FX Weather
34
o 2.5% underlying revenue increase
o Small adverse impact from currency, with $ strength offsetting weakness in the €
o Operating days impact to reverse in second half
H1 2015
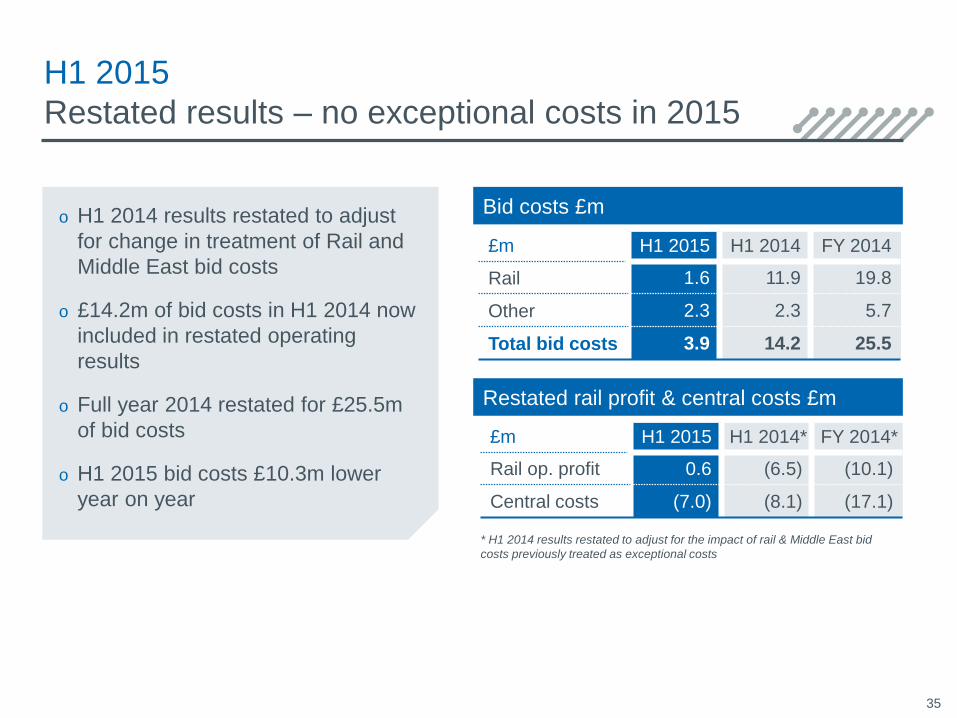
Restated results – no exceptional costs in 2015
£m H1 2015 H1 2014 FY 2014
Rail 1.6 11.9 19.8
Other 2.3 2.3 5.7
Total bid costs 3.9 14.2 25.5
* H1 2014 results restated to adjust for the impact of rail & Middle East bid
costs previously treated as exceptional costs
35
£m H1 2015 H1 2014* FY 2014*
Rail op. profit 0.6 (6.5) (10.1)
Central costs (7.0) (8.1) (17.1)
o H1 2014 results restated to adjust
for change in treatment of Rail and
Middle East bid costs
o £14.2m of bid costs in H1 2014 now
included in restated operating
results
o Full year 2014 restated for £25.5m
of bid costs
o H1 2015 bid costs £10.3m lower
year on year
Bid costs £m
Restated rail profit & central costs £m
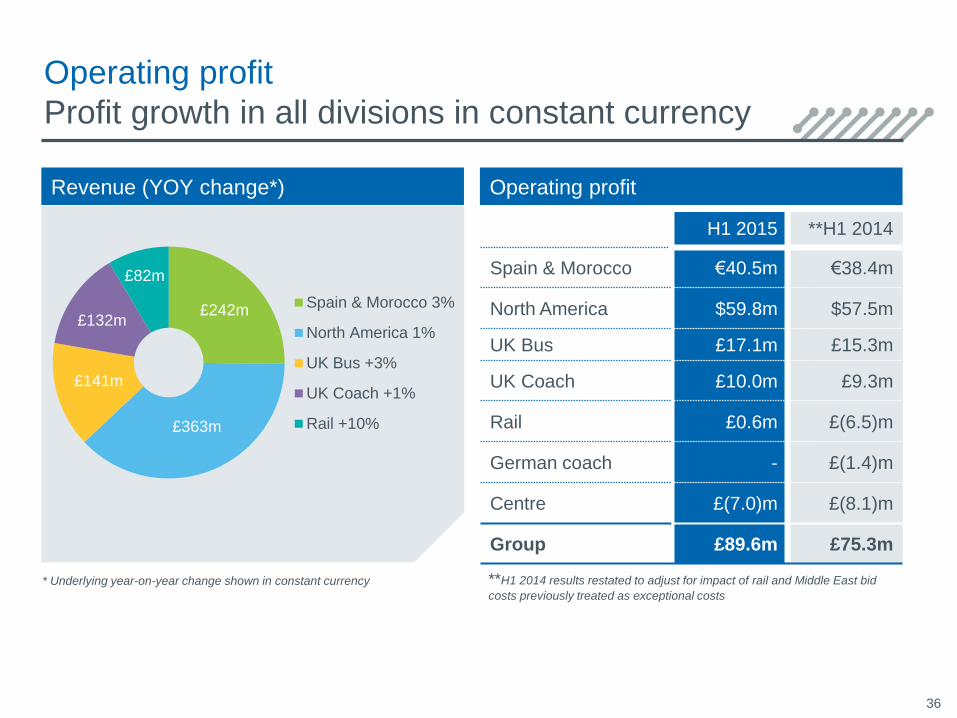
Revenue (YOY change*) Operating profit
£242m
£363m
£141m
£132m
£82m
Spain & Morocco 3%
North America 1%
UK Bus +3%
UK Coach +1%
Rail +10%
Operating profit
Profit growth in all divisions in constant currency
H1 2015 **H1 2014
Spain & Morocco €40.5m €38.4m
North America $59.8m $57.5m
UK Bus £17.1m £15.3m
UK Coach £10.0m £9.3m
Rail £0.6m £(6.5)m
German coach - £(1.4)m
Centre £(7.0)m £(8.1)m
Group £89.6m £75.3m
* Underlying year-on-year change shown in constant currency
36
**H1 2014 results restated to adjust for impact of rail and Middle East bid
costs previously treated as exceptional costs
37
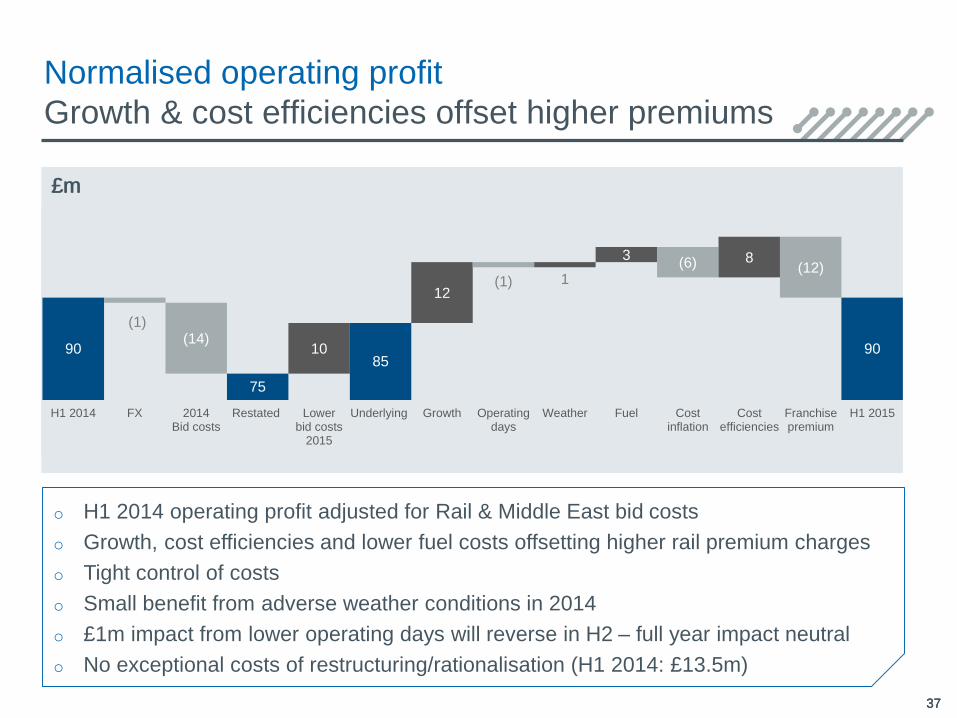
Normalised operating profit
Growth & cost efficiencies offset higher premiums
3737
£m£m
o H1 2014 operating profit adjusted for Rail & Middle East bid costs
o Growth, cost efficiencies and lower fuel costs offsetting higher rail premium charges
o Tight control of costs
o Small benefit from adverse weather conditions in 2014
o £1m impact from lower operating days will reverse in H2 – full year impact neutral
o No exceptional costs of restructuring/rationalisation (H1 2014: £13.5m)
90(14)
75
1085
12(1) 1
3(6) 8
(12)
90
H1 2014 FX 2014Bid costs
Restated Lowerbid costs
2015
Underlying Growth Operatingdays
Weather Fuel Costinflation
Costefficiencies
Franchisepremium
H1 2015
(1)
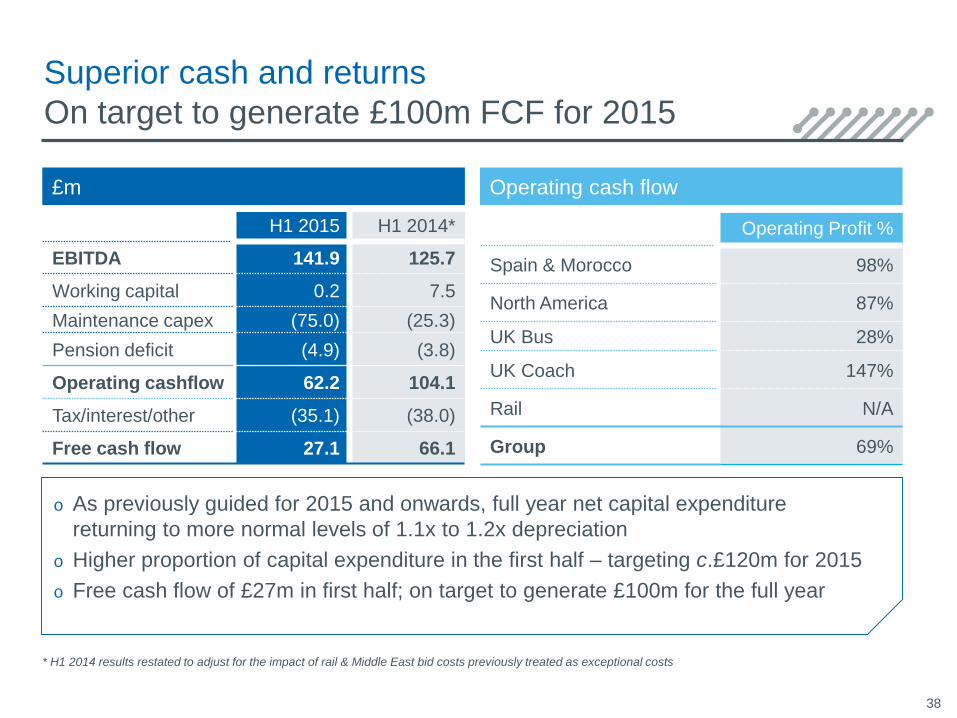
Operating cash flow
Superior cash and returns
On target to generate £100m FCF for 2015
Operating Profit %
Spain & Morocco 98%
North America 87%
UK Bus 28%
UK Coach 147%
Rail N/A
Group 69%
£m
H1 2015 H1 2014*
EBITDA 141.9 125.7
Working capital 0.2 7.5
Maintenance capex (75.0) (25.3)
Pension deficit (4.9) (3.8)
Operating cashflow 62.2 104.1
Tax/interest/other (35.1) (38.0)
Free cash flow 27.1 66.1
o As previously guided for 2015 and onwards, full year net capital expenditure
returning to more normal levels of 1.1x to 1.2x depreciation
o Higher proportion of capital expenditure in the first half – targeting c.£120m for 2015
o Free cash flow of £27m in first half; on target to generate £100m for the full year
* H1 2014 results restated to adjust for the impact of rail & Middle East bid costs previously treated as exceptional costs
38
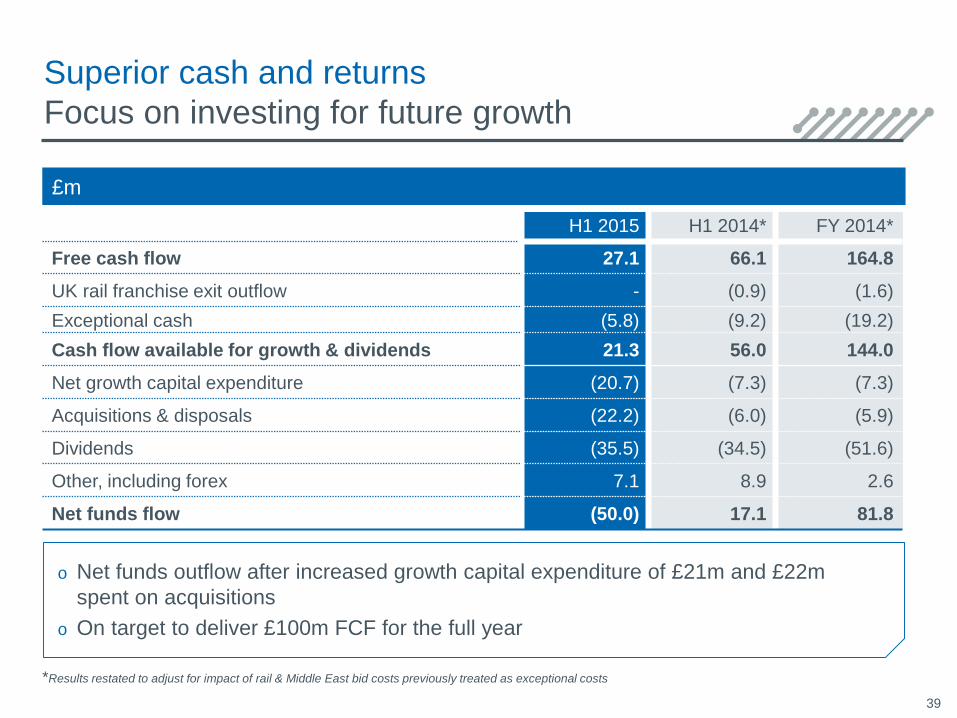
Superior cash and returns
Focus on investing for future growth
£m
H1 2015 H1 2014* FY 2014*
Free cash flow 27.1 66.1 164.8
UK rail franchise exit outflow - (0.9) (1.6)
Exceptional cash (5.8) (9.2) (19.2)
Cash flow available for growth & dividends 21.3 56.0 144.0
Net growth capital expenditure (20.7) (7.3) (7.3)
Acquisitions & disposals (22.2) (6.0) (5.9)
Dividends (35.5) (34.5) (51.6)
Other, including forex 7.1 8.9 2.6
Net funds flow (50.0) 17.1 81.8
39
o Net funds outflow after increased growth capital expenditure of £21m and £22m
spent on acquisitions
o On target to deliver £100m FCF for the full year
*Results restated to adjust for impact of rail & Middle East bid costs previously treated as exceptional costs
40
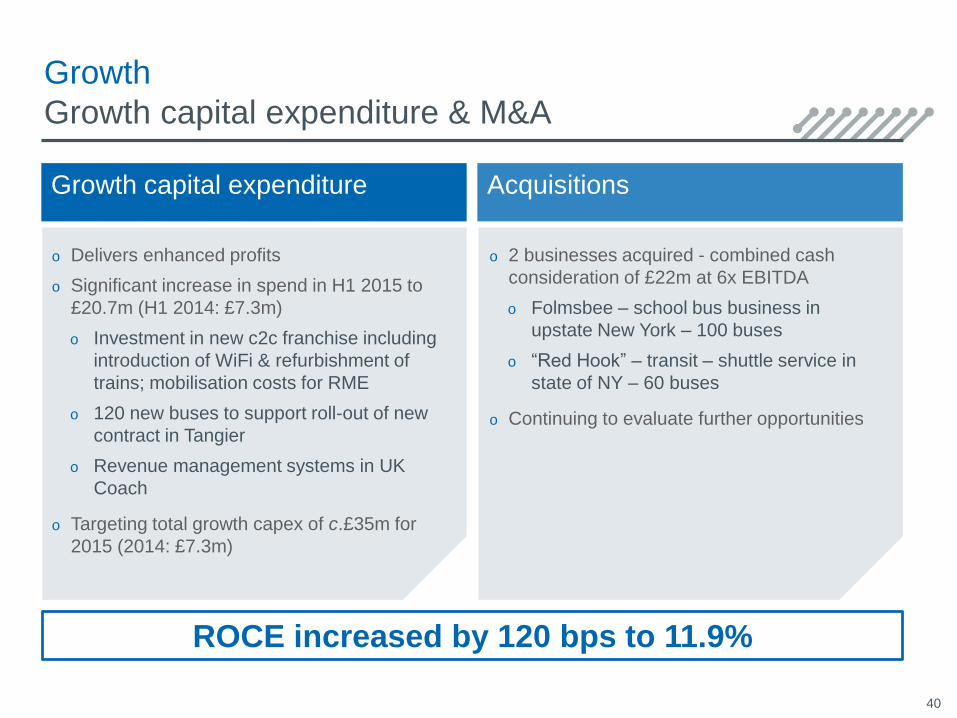
Growth
Growth capital expenditure & M&A
Growth capital expenditure Acquisitions
o Delivers enhanced profits
o Significant increase in spend in H1 2015 to
£20.7m (H1 2014: £7.3m)
o Investment in new c2c franchise including
introduction of WiFi & refurbishment of
trains; mobilisation costs for RME
o 120 new buses to support roll-out of new
contract in Tangier
o Revenue management systems in UK
Coach
o Targeting total growth capex of c.£35m for
2015 (2014: £7.3m)
o 2 businesses acquired - combined cash
consideration of £22m at 6x EBITDA
o Folmsbee – school bus business in
upstate New York – 100 buses
o “Red Hook” – transit – shuttle service in
state of NY – 60 buses
o Continuing to evaluate further opportunities
ROCE increased by 120 bps to 11.9%
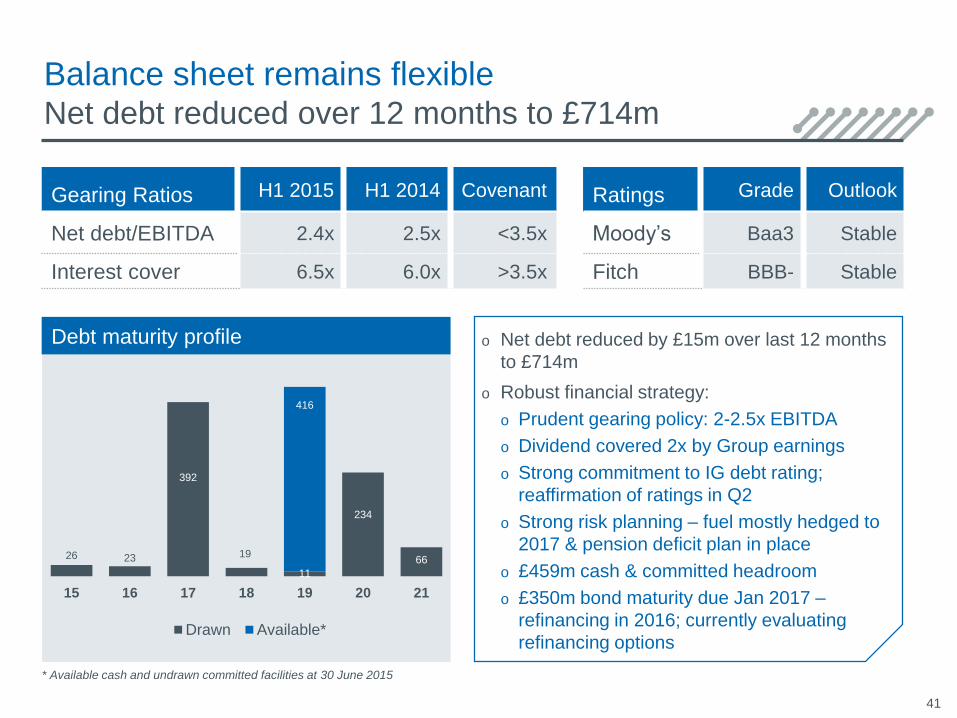
Debt maturity profile
Balance sheet remains flexibleNet debt reduced over 12 months to £714m
o Net debt reduced by £15m over last 12 months
to £714m
o Robust financial strategy:
o Prudent gearing policy: 2-2.5x EBITDA
o Dividend covered 2x by Group earnings
o Strong commitment to IG debt rating;
reaffirmation of ratings in Q2
o Strong risk planning – fuel mostly hedged to
2017 & pension deficit plan in place
o £459m cash & committed headroom
o £350m bond maturity due Jan 2017 –
refinancing in 2016; currently evaluating
refinancing options
* Available cash and undrawn committed facilities at 30 June 2015
26 23
392
19
11
234
66
416
15 16 17 18 19 20 21
Drawn Available*
Gearing Ratios H1 2015 H1 2014 Covenant
Net debt/EBITDA 2.4x 2.5x <3.5x
Interest cover 6.5x 6.0x >3.5x
Ratings Grade Outlook
Moody’s Baa3 Stable
Fitch BBB- Stable
41
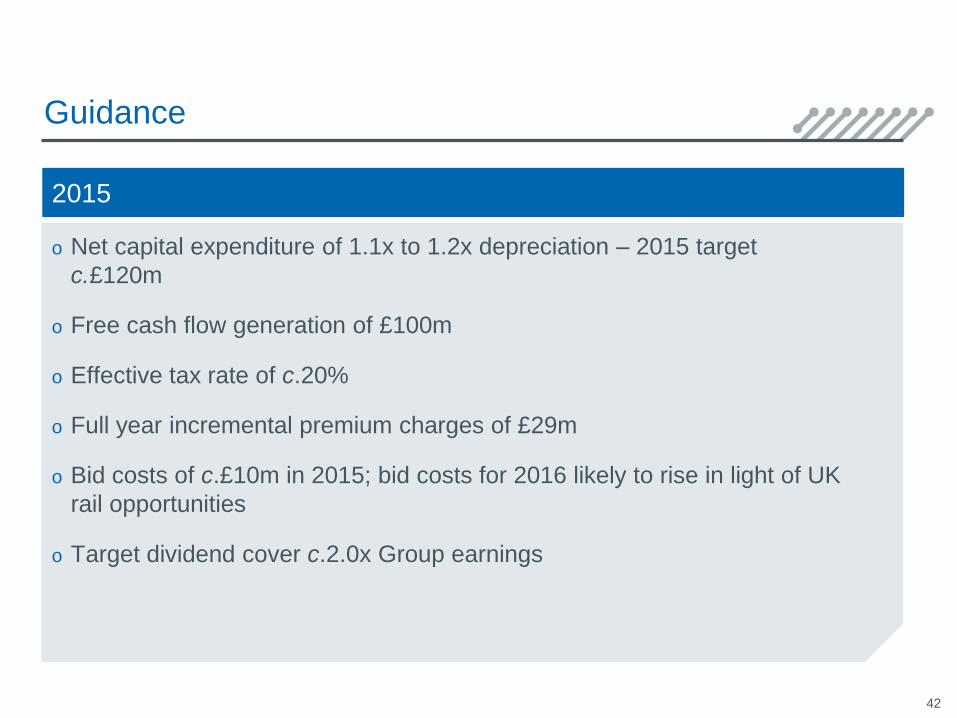
Guidance
o Net capital expenditure of 1.1x to 1.2x depreciation – 2015 target
c.£120m
o Free cash flow generation of £100m
o Effective tax rate of c.20%
o Full year incremental premium charges of £29m
o Bid costs of c.£10m in 2015; bid costs for 2016 likely to rise in light of UK
rail opportunities
o Target dividend cover c.2.0x Group earnings
42
2015

Appendix
44
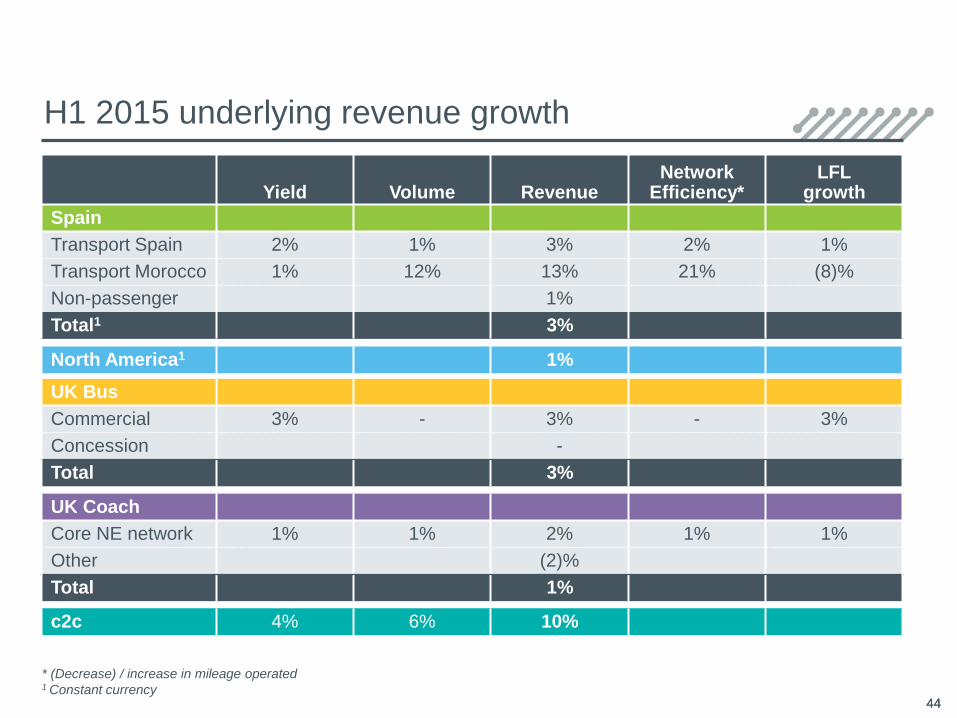
H1 2015 underlying revenue growth
Yield Volume RevenueNetwork
Efficiency*LFL
growth
Spain
Transport Spain 2% 1% 3% 2% 1%
Transport Morocco 1% 12% 13% 21% (8)%
Non-passenger 1%
Total1 3%
North America1 1%
UK Bus
Commercial 3% - 3% - 3%
Concession -
Total 3%
UK Coach
Core NE network 1% 1% 2% 1% 1%
Other (2)%
Total 1%
c2c 4% 6% 10%
* (Decrease) / increase in mileage operated1 Constant currency
44
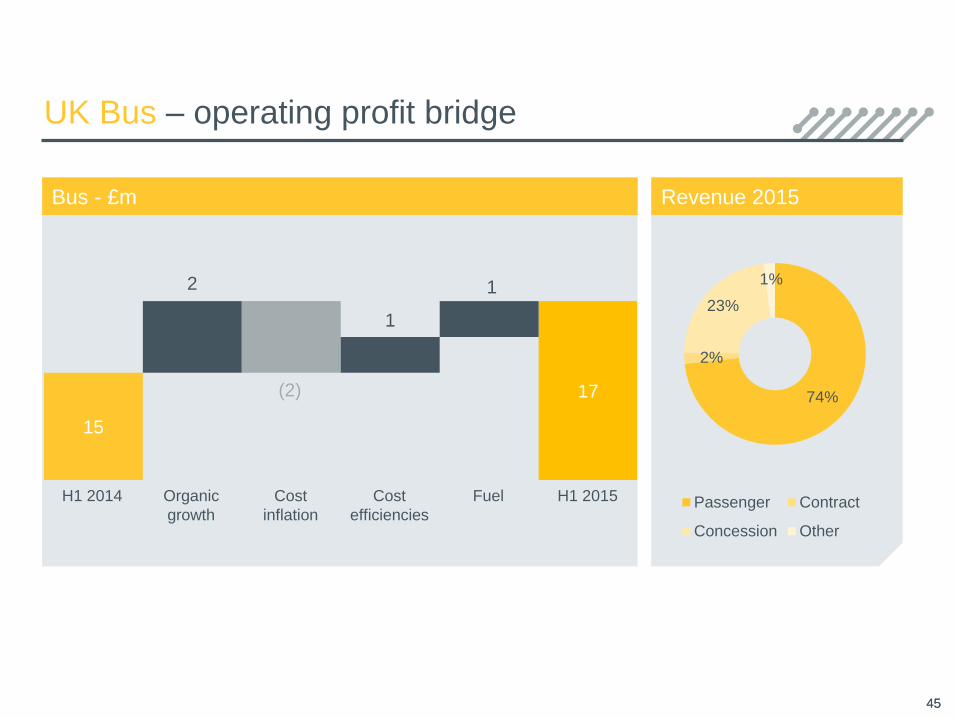
Bus - £m
UK Bus – operating profit bridge
45
Revenue 2015
74%
2%
23%
1%
Passenger Contract
Concession Other
Organic
growth
FuelCost
inflation
Cost
efficiencies
45
H1 2014 H1 2015
15
17
2
(2)
1
1
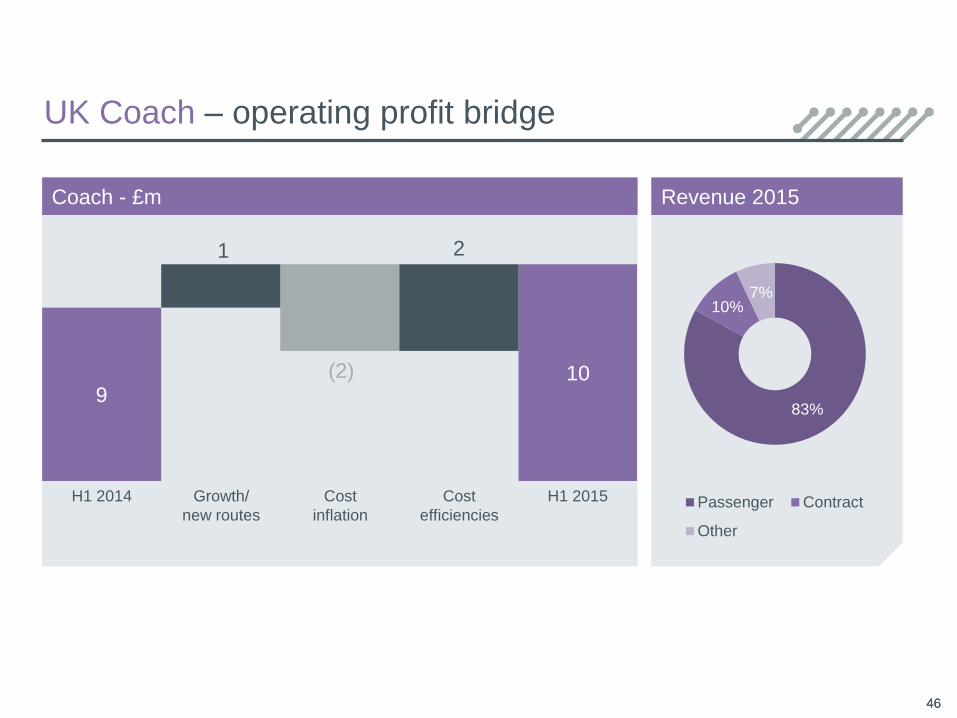
Coach - £m
UK Coach – operating profit bridge
46
Revenue 2015
83%
10%7%
Passenger Contract
Other
H1 2014 Cost
inflation
Cost
efficiencies
Growth/
new routes
H1 2015
46
9 10
1
(2)
2
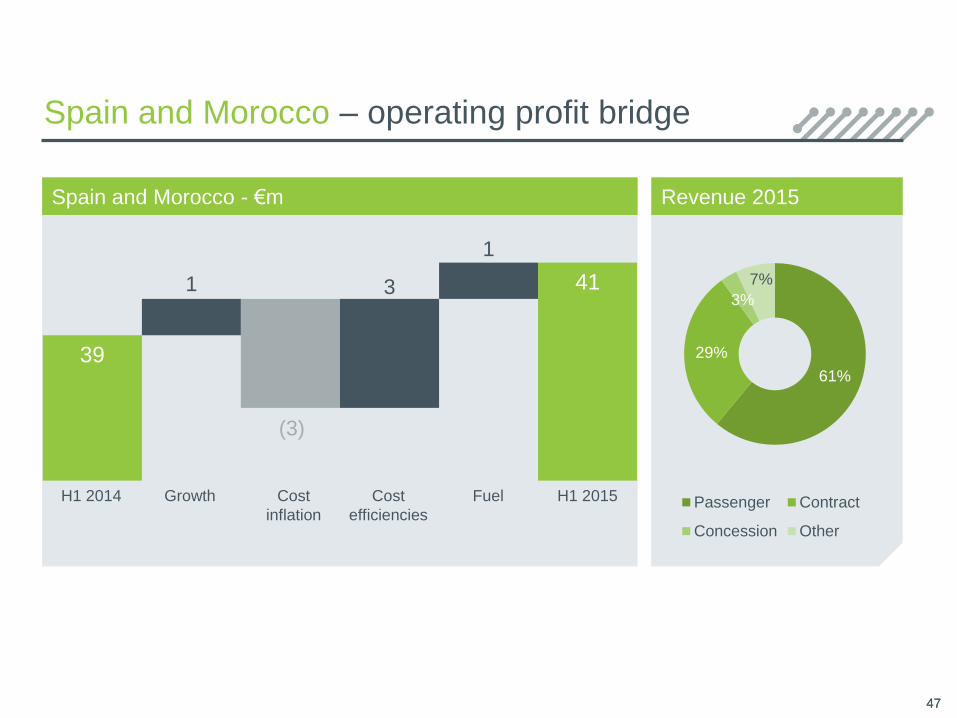
61%
29%
3%
7%
Passenger Contract
Concession Other
Spain and Morocco – operating profit bridge
47
Revenue 2015
FuelCost
inflation
Cost
efficiencies
47
Growth
39
41 1
(3)
3
1
Spain and Morocco - €m
H1 2014 H1 2015
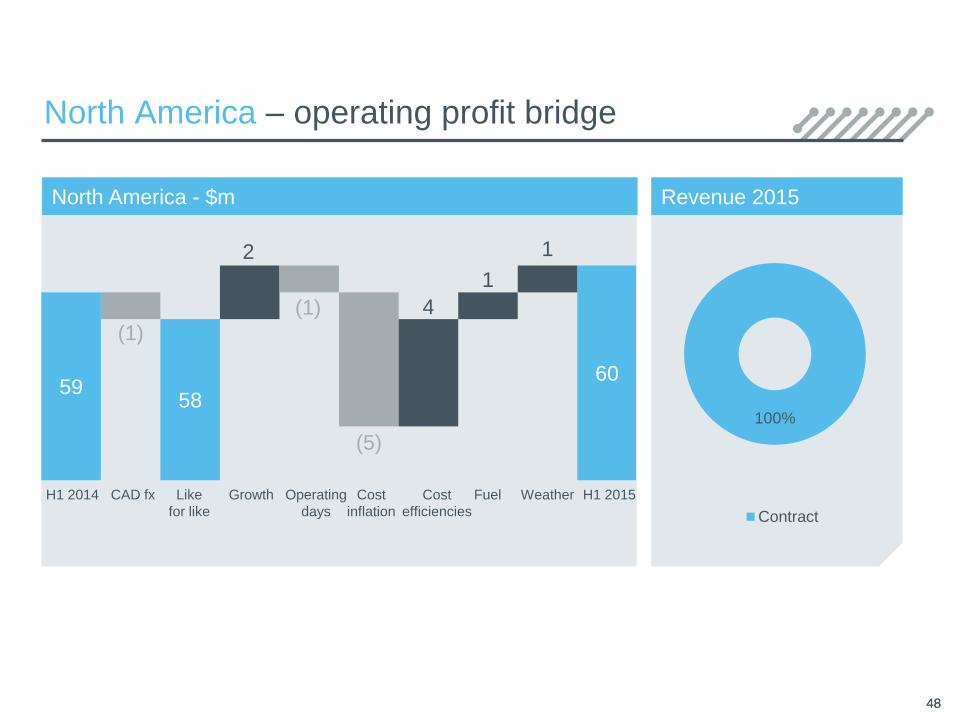
North America - $m
North America – operating profit bridge
48
Revenue 2015
Cost
inflation
Cost
efficiencies
Like
for like
Fuel
48
WeatherH1 2014 H1 2015CAD fx
100%
Contract
59 58
60
(1)
2
(1)
(5)
4
1
1
Growth Operating
days
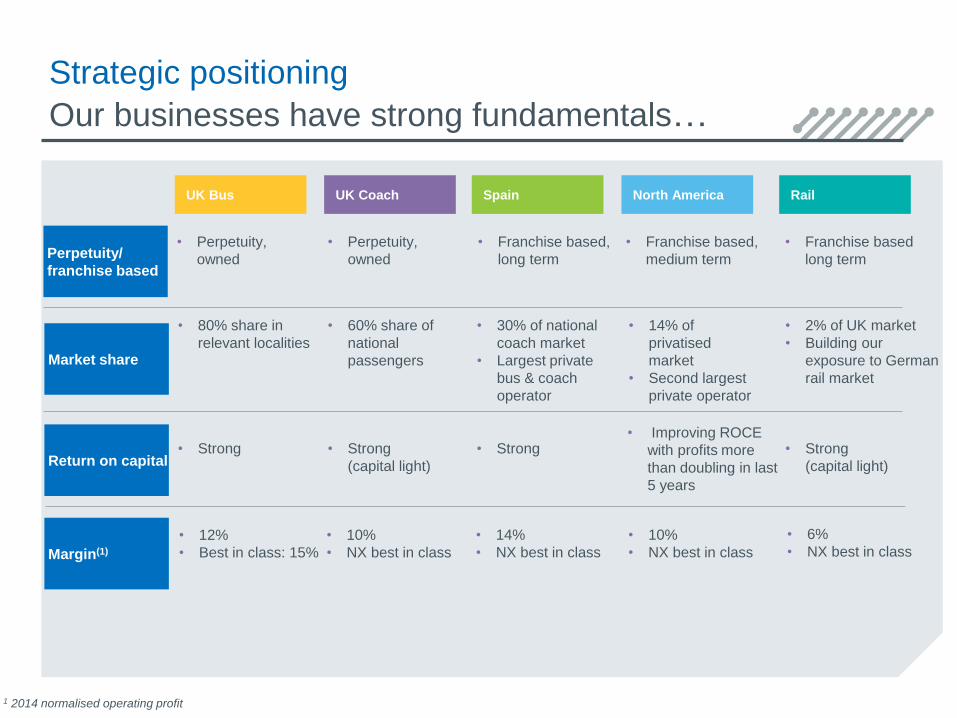
Perpetuity/
franchise based
• Perpetuity,
owned
• Perpetuity,
owned
• Franchise based,
long term
• Franchise based,
medium term
UK Bus UK Coach Spain North America
Strategic positioning
Our businesses have strong fundamentals…
Margin(1)
Return on capital• Strong • Strong
(capital light)
• Strong
(capital light)
Market share
• 80% share in
relevant localities
• 60% share of
national
passengers
• 2% of UK market
• Building our
exposure to German
rail market
• 30% of national
coach market
• Largest private
bus & coach
operator
• 14% of
privatised
market
• Second largest
private operator
• Strong• Improving ROCE
with profits more
than doubling in last
5 years
• 12%
• Best in class: 15%
• 10%
• NX best in class
• 6%
• NX best in class• 14%
• NX best in class
• 10%
• NX best in class
1 2014 normalised operating profit
• Franchise based
long term
Rail
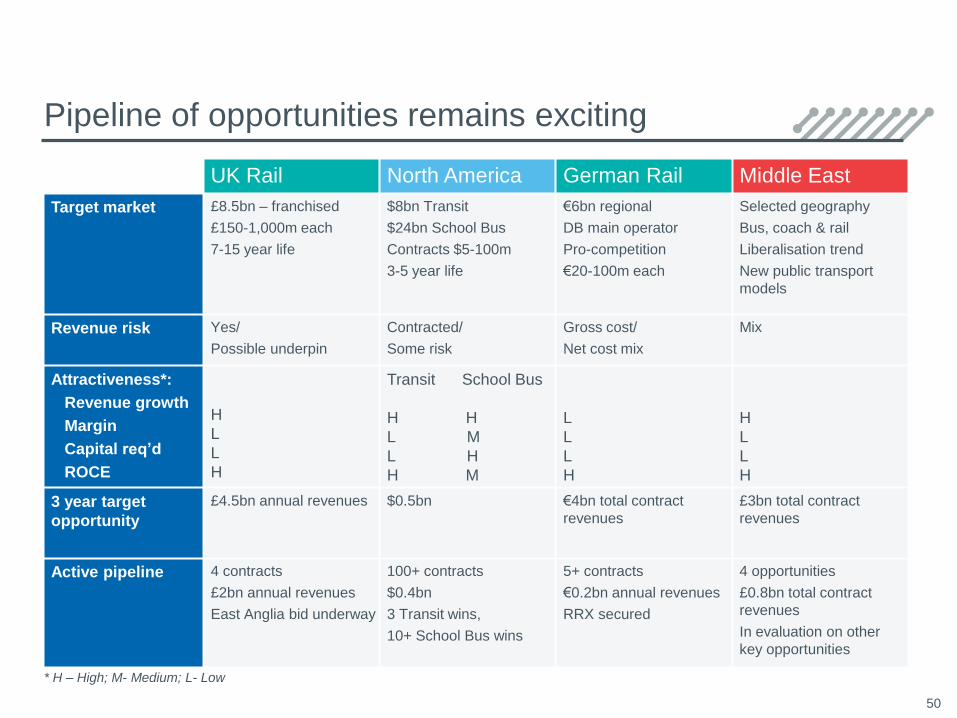
Pipeline of opportunities remains exciting
50
UK Rail North America German Rail Middle East
Target market £8.5bn – franchised
£150-1,000m each
7-15 year life
$8bn Transit
$24bn School Bus
Contracts $5-100m
3-5 year life
€6bn regional
DB main operator
Pro-competition
€20-100m each
Selected geography
Bus, coach & rail
Liberalisation trend
New public transport
models
Revenue risk Yes/
Possible underpin
Contracted/
Some risk
Gross cost/
Net cost mix
Mix
Attractiveness*:
Revenue growth
Margin
Capital req’d
ROCE
H
L
L
H
Transit School Bus
H H
L M
L H
H M
L
L
L
H
H
L
L
H
3 year target
opportunity
£4.5bn annual revenues $0.5bn €4bn total contract
revenues
£3bn total contract
revenues
Active pipeline 4 contracts
£2bn annual revenues
East Anglia bid underway
100+ contracts
$0.4bn
3 Transit wins,
10+ School Bus wins
5+ contracts
€0.2bn annual revenues
RRX secured
4 opportunities
£0.8bn total contract
revenues
In evaluation on other
key opportunities
* H – High; M- Medium; L- Low
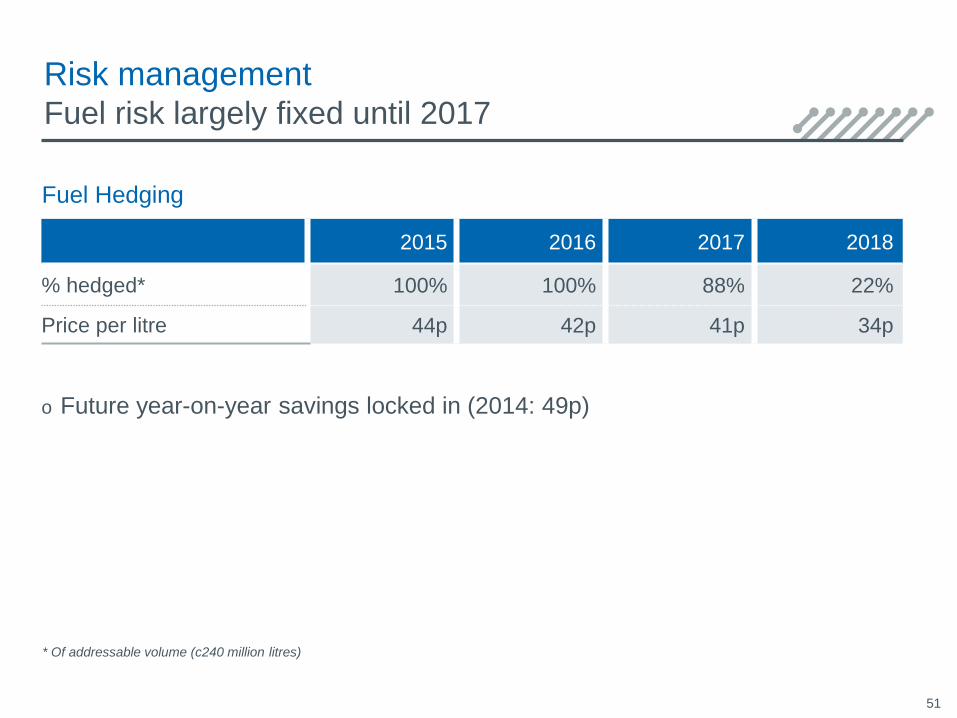
Risk managementFuel risk largely fixed until 2017
o Future year-on-year savings locked in (2014: 49p)
2015 2016 2017 2018
% hedged* 100% 100% 88% 22%
Price per litre 44p 42p 41p 34p
Fuel Hedging
51
* Of addressable volume (c240 million litres)
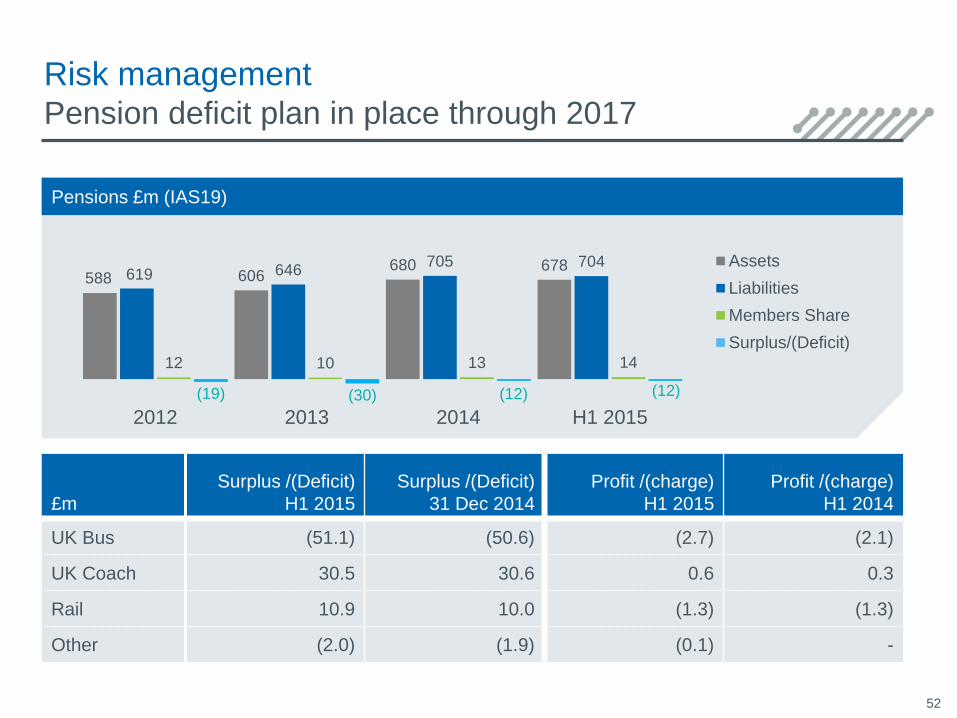
Risk managementPension deficit plan in place through 2017
£m
Surplus /(Deficit)
H1 2015
Surplus /(Deficit)
31 Dec 2014
Profit /(charge)
H1 2015
Profit /(charge)
H1 2014
UK Bus (51.1) (50.6) (2.7) (2.1)
UK Coach 30.5 30.6 0.6 0.3
Rail 10.9 10.0 (1.3) (1.3)
Other (2.0) (1.9) (0.1) -
52
588 606680 678
619 646705 704
12 10 13 14
(19) (30) (12) (12)
2012 2013 2014 H1 2015
Assets
Liabilities
Members Share
Surplus/(Deficit)
Pensions £m (IAS19)

National Express Group PLC