Embed Size (px)
Citation preview
INSEAD
This case was written by Karel Cool, BP Professor of European Competitiveness at INSEAD andDeidre Sorensen, MBA INSEAD, 1999. It is intended to be used as a basis for class discussionrather than to illustrate either effective or ineffective handling of an administrative situation. Wewould like to thank the Boston Consulting Group for their help in the data collection and analysis.
Copyright © 2000, INSEAD, Fontainebleau, France
Toys “R” Us in 1999
08/2000-4896
N.B. PLEASE NOTE THAT DETAILS OF ORDERING INSEAD CASES ARE FOUND ON THE BACK COVER. COPIES MAY NOT BE MADE WITHOUT PERMISSION.
INSPECTIO
N COPY
Not For R
epro
duction
INSPECTIO
N COPY
Not For R
epro
duction
INSEAD 1 4896
Copyright 2000 INSEAD, Fontainebleau, France.
“On Thursday, Aug. 26, Toys “R” Us CEO Robert Nakasone was convinced thathis ailing company was on the verge of a turnaround, and he was eager to prove it.
That morning, Nakasone had arranged a grand tour for me of the new Toys “R”Us showcase store in Alpharetta, Ga. My tour guide – Gregg Treadway, the vicepresident of new stores – put on a good show. Marching me down the aisles ofBarbies and Pokémon, he pointed to the carpeted floors, the skylights, the TVmonitors playing videos of the Lion King and the Little Mermaid. He talkedenthusiastically about stepped-up customer service… In the 18 months sinceNakasone had taken over Toy “R” Us, Treadway told me, ‘a new spirit had beenbreathed into the company. I can't explain it, it's just something we all feel.Something is really happening here.’
Four hours later, Nakasone was out of a job.”
Katrina Brooker, Fortune Magazine, 27 September 1999.
Introduction
By the end of April 1999, Toys “R” Us (TRU) had already been through a series oftumultuous events, watching the share price dip from over US$30 per share in April 1998 to alow of US$13 in January and then rebound to US$24 in the last few days of April 1999. Thebusiness had been struggling in recent years and an announcement in January that Wal-Marthad overtaken TRU as the number one toy retailer in the US had added speculation thatTRU’s formula was increasingly being challenged. An attempt to revive its image three yearspreviously through a store redesign had been met with a lukewarm response from consumers.
To make matters worse, online "e-tailing" had taken off in the period up to Christmas 1998and TRU had been slow off the mark in designing their website. Once they launched, they hadbeen plagued by problems, the worst of which resulted in the site being down for most ofNovember and December, the busiest season for toy retailers (see Exhibit 1). Not only wascompetition with online retailers heating up, the manufacturers themselves also were gettinginto direct-to-consumer marketing, selling their products through catalogues and websites andbypassing the retailer altogether.
In response to the various problems in 1998, TRU had reshuffled its top executives, designeda new store layout, closed many shops, changed the product mix, switched to a newadvertising agency and in April 1999, signed an agreement with Benchmark Capital to jointlydevelop a website in the context of a new subsidiary, toysrus.com. Despite the fact that acoherent long-term plan for the whole company did not seem completely formulated, themarket had reacted favorably to these changes, particularly the tie-up with Benchmark.
However, over the summer months, things turned dramatically for the worse. The CEO of thenew toysrus.com venture was abruptly relieved of his duties. Then, the new agreement withBenchmark Capital fell apart. Only a few weeks later, the relatively new CEO, RobertNakasone, resigned in what appeared to be a sudden move. The official explanation for hisdeparture was that there were differences “regarding the direction of the company”. These
INSPECTIO
N COPY
Not For R
epro
duction
INSPECTIO
N COPY
Not For R
epro
duction
INSEAD 2 4896
Copyright 2000 INSEAD, Fontainebleau, France.
differences were “minor” and the split was “amicable”, according to chairman and acting-CEO, Michael Goldstein. Industry observers believed otherwise. “It was about who’s toblame for running the company into the ground,” said one.1 It had “more to do with thepressure on retailers to successfully enter the new internet channel”, said another. “Theformer CEO was reluctant to made the dramatic change the market [was] demanding andtherefore lost the faith of the board.”2 Yet others put it down to the differences between theold and new guard within the executive level, where the founder of the company still ran theshow as chairman of the board.3
Regardless, the 1999 Christmas season was fast approaching. The new store design and theadvertising campaign painted a glossy picture of the firm from the outside but within, moralein the company was down and the strategic direction was in question. And despite the need torevitalize or reinvent a long-term plan, there was also a desperate need to solve the short-termquestion: where would TRU be by Christmas 1999? In January 1999, upon hearing that theywere now number two in the US, TRU announced they would, without doubt, regain theirnumber one place by the end of the year. They also predicted that they would be the bigwinners in the second e-Christmas.
The Toy Industry
The toy industry in the late 1990s was not to be underestimated: sales in 1998 had toppedUS$68 billion worldwide, a figure that had grown 5% annually over several years.Expenditures per child in the US were US$340.51 in 1997, accounting for more than 40% ofglobal sales4 (see Exhibits 2 and 3). However, various changes and trends had taken place inrecent years.
Demographics and Consumer Behavior
First, the traditional toy industry had to cope with changing demographics. While adults werethe usual purchasers of toys, the primary consumers were, of course, the children. In the US,the population of children aged 14 and younger, the main market for toys, was growing veryslowly, predicted at around 3.5% through 2010.5 In addition, children under five weredecreasing in overall numbers. The North American market made up only 4% of the world'schildren, yet boasted 41% of the world's toy sales. A decline in the population in the targetsegment thus could have significant consequences for the industry.
1 Katrina Brooker, ‘Toys Were Us’, Fortune Magazine, 27 September 1999.
2 Robert Rollo, Rollo Associates Executive Search Firm.
3 Interviews with investment bank analysts.
4 Toy Manufacturers of America.
5 US Census Bureau.
INSPECTIO
N COPY
Not For R
epro
duction
INSPECTIO
N COPY
Not For R
epro
duction

INSEAD 3 4896
Copyright 2000 INSEAD, Fontainebleau, France.
However, the wealth of the average child had been increasing steadily. 1996 statistics peggedUS child population (5-14 years) spending at US$27 billion, with direct influence overUS$117 billion.6 Personal income of children was expected to increase to US$67 billionoverall by 2001. Parents were expected to spend US$144 billion on their children by 2001,also a significant increase.
With 15% of toy sales purchases made by grandparents and other adults,7 it was alsoimportant to look at other demographic trends. The increased life expectancy in the US hadimproved the overall sales of children’s products to grandparents.
In terms of toy usage rates, children were ‘consuming’ faster. Toys were used less and lessbefore they were discarded and were handed down less often to younger siblings asadvancements and improvements quickly made certain toys outdated. In addition, childrenwere growing out of the traditional toys at younger ages, migrating to more high-tech toys andvideo games.8
Children were also more computer-literate with every passing year. While estimates on thereplacement of other leisure time with Internet and video games were varying in their results,there seemed to be some consensus that children were watching far less television. One studyfound that kids and teens on average were spending 40% less time watching TV and thatheavy Internet users were spending 55% less time in front of the TV screen.9 According to theNFO/Jupiter study, of the 83 million Internet users in the US, 17 million were kids and teenswho spent an average of seven hours a week online. This impacted not only the amount oftime children used traditional toys, but also the type of products that were being offered tochildren, and the means of advertising and brand building. It was also significant to observethe use of computers in the household. Of the children who had access to a home computer,two thirds used it for homework. Of those that used it for homework, 85% surfed the Internetas part of their homework research.10 Most children used up to one hour to complete theirhomework on the computer with half of that time spent online. 43% of children withcomputer access also used the Internet to communicate with friends.
In terms of Internet access, the US led the world. In 1998, more than 42% of US householdshad a PC.11 An IDC study found 51.6 million Internet users in the US (compared with 83million in the Jupiter study) and predicted 135.9 million by the year 2002. Purchases over theInternet were made by 18.6 million users in 1998, but that figure was expected to rise to 64.6million by 2002. The largest product categories were computer accessories and financialservices, while those where most growth was seen were gifts, toys, books and entertainment 6 Toy Manufacturers of America.
7 Owen Graduate School of Management report by an Owen Project Team under Prof. M. Eric Johnson,1998.
8 Owen Graduate School of Management report by an Owen Project Team under Prof. M. Eric Johnson,1998.
9 Jupiter/NFO study 1999, reported by CNN on 10 June 1999.
10 NPD Online Research.
11 US Census Bureau.
INSPECTIO
N COPY
Not For R
epro
duction
INSPECTIO
N COPY
Not For R
epro
duction
INSEAD 4 4896
Copyright 2000 INSEAD, Fontainebleau, France.
(see Exhibit 4). The online population tended to be wealthier and better educated, logging on27 times per month for 16 hours total, viewing 959 pages.12
Product Mix
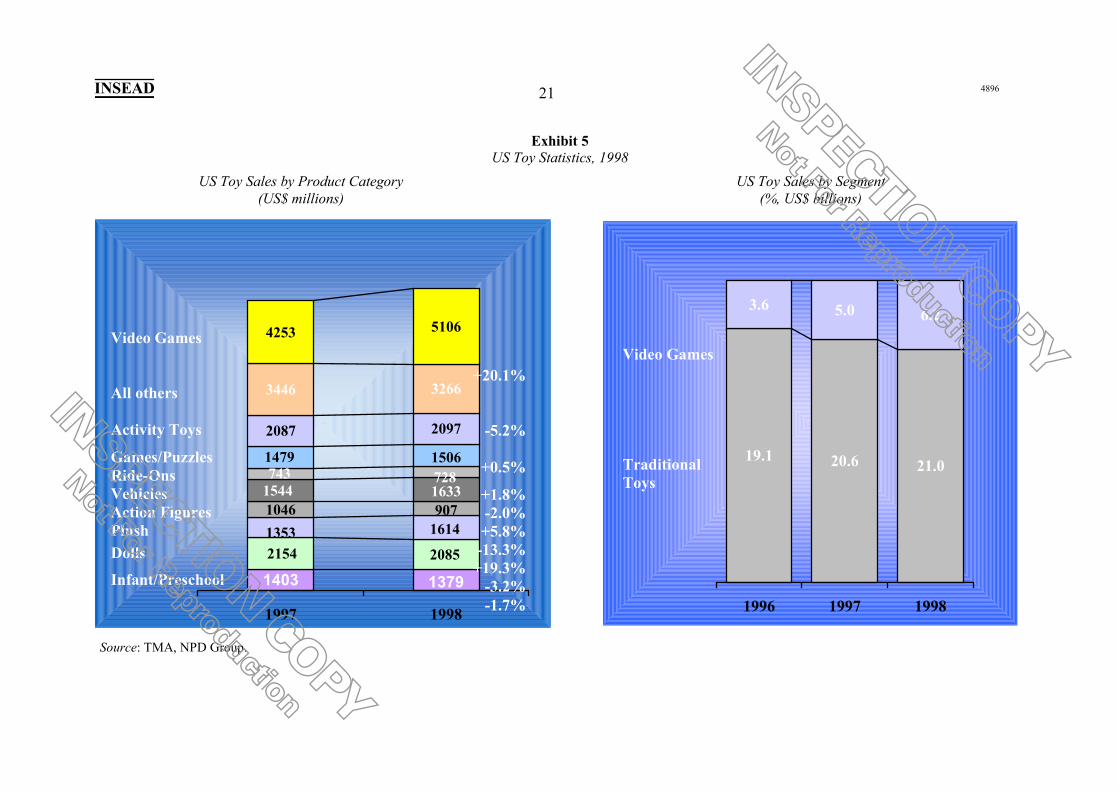
The definition of the toy market in the late 1990s had been undergoing a great deal of change.The market had been divided quite clearly between traditional toys and video games.However, traditional toys had, in many cases, become more high-tech. So-called ‘smart toys’had been growing rapidly, revolutionizing the product offerings and expanding what hadbecome a declining segment. For example, within traditional toys, the only segment that stillshowed strong growth was ‘plush’, mostly because this was one of the first manifestations ofsmart toys (e.g. Furby). In contrast, video games had grown at more than 20% per annum (seeExhibit 5).13
Profitability also varied across these categories. On average, toys offered the retailer a 30-35% profit margin. Traditional commodity toys (rubber balls, unbranded dolls) had thehighest ratio but it was branded traditional toys that offered the most profit dollars. Smart toyswere expected to be quite lucrative, although they offered lower profit margins. Video gameshad the lowest margins, at only 15%. However, they were small to display and thus took littlespace in stock or on store shelves.
Manufacturers
The industry was dominated by Mattel and Hasbro and had hundreds of small players.Acquisitions in the 1980s and 1990s had grown the combined US shares of Mattel and Hasbrofrom 21% in 1984 to 31.2% in 1997 (see Exhibit 6). In 1999, Mattel controlled not only itsown brand, but Tyco, Illco, Universal Matchbox, View Master, Fisher Price, Meccano andCorgi Cars. Hasbro owned Milton Bradley, General Consumer Electronics, Playskool,Tinkertoys, Kenner, Parker Bros., Tonka, Coleco and Selchow & Righter.
The remaining 68.8% was made up of small manufacturers. The third and fourth largestplayers had only 4.1% combined.14 Small manufacturers still produced a large number of thetoys, including ‘hit’ toys such as Beanie Babies, which initially came from an ‘unknown’toymaker. As more high-tech smart toys and e-games appeared on the market, the two bigmanufacturers were expected to grow their portfolios largely through acquisition.
Fortunes in the toy industry were built upon having strong core brands (e.g. Barbie) as well asthe hot toy of the season (see Exhibit 7). In 1997, it was Mattel’s Tickle-Me Elmo, followedin 1998 by Hasbro’s Furby and Playskool’s Teletubbies (marketed by Hasbro). In first quarterof 1999, Mattel suffered a 2% drop in revenues over the previous year, one of many factorsprompting a staff reduction of over 3000 positions.
12 Net Ratings, January 1999.
13 Interview with Toys “R” Us and Microsoft.
14 NPD Group.
INSPECTIO
N COPY
Not For R
epro
duction
INSPECTIO
N COPY
Not For R
epro
duction

INSEAD 5 4896
Copyright 2000 INSEAD, Fontainebleau, France.
Manufacturers had also entered partnerships with entertainment companies, ensuring accessto the majority of licensing agreements for product spin-offs from TV and movies. Hasbrohad relationships with such companies as Dreamworks, Lucas films and Steven SpielbergProductions. In the toy environment of the late 1990s, nearly 50% of toy sales for the twomajor manufacturers came from licensed toy sales.15
Shifts in Manufacturer Strategy
In the toy industry, the manufacturer and retailer had traditionally played specific roles. Themanufacturer designed and produced the product and took charge of distributing it to thevarious retailers. At that point, the retailer took over, stocking it and running productpromotion advertising for their stores. In terms of overall marketing, the advertising to buildthe brands in the eyes of the consumer was largely undertaken by the manufacturers. Theywere the ones who stepped in at the end of the process to decide the advertising campaign andrun the TV spots. While these processes and responsibilities had traditionally overlapped tosome degree, the division of tasks for many years had been relatively stable.
Over time, however, some of this had shifted. Online sales and new channels (fast food,Avon) had allowed a direct or near-direct link from the manufacturer to the consumer. BothMattel and Hasbro had launched websites, providing product information and the opportunityto play games online or through e-mail (particularly the Hasbro Interactive site), and ordertoys online. Mattel's merger with The Learning Company (TLC), completed in 1999, hadgiven them a tremendous database of consumers and websites (together, they operated 80), inline with Mattel's goal of creating a premier online site for children and their families.
These forays in new strategic directions had not always been met with great success. Whilethe market had initially reacted positively to Mattel's merger with TLC, they soon learned thatit was a merger gone awry. By the third quarter of 1999, Mattel was forced to announce thatits earnings were 55% lower than projected, largely due to the difficulties with the TLC deal.The stock plunged to less than US$12 per share, down from over US$40 less than a yearbefore and US$19 just prior to the announcement. Mattel also became embroiled in a classaction suit, which alleged that they violated GAAP and misled investors in theProxy/Prospectus for the merger with TLC. Already, the company had to deal with a 14% fallin overall Barbie sales, the cash cow of the company and a usual contributor of 40% of theprofits. All these issues caused the investment community to begin doubting the strength ofMattel and questioning the suitability of its management team.
Retailing
Traditional Brick-and-Mortar Retailing
The US toy market was divided into three broad distribution channels: discount stores (suchas Target and Wal-Mart), national toy stores (such as TRU) and other stores (such as 15 Wall Street Journal, 13 July 1995.
INSPECTIO
N COPY
Not For R
epro
duction
INSPECTIO
N COPY
Not For R
epro
duction

INSEAD 6 4896
Copyright 2000 INSEAD, Fontainebleau, France.
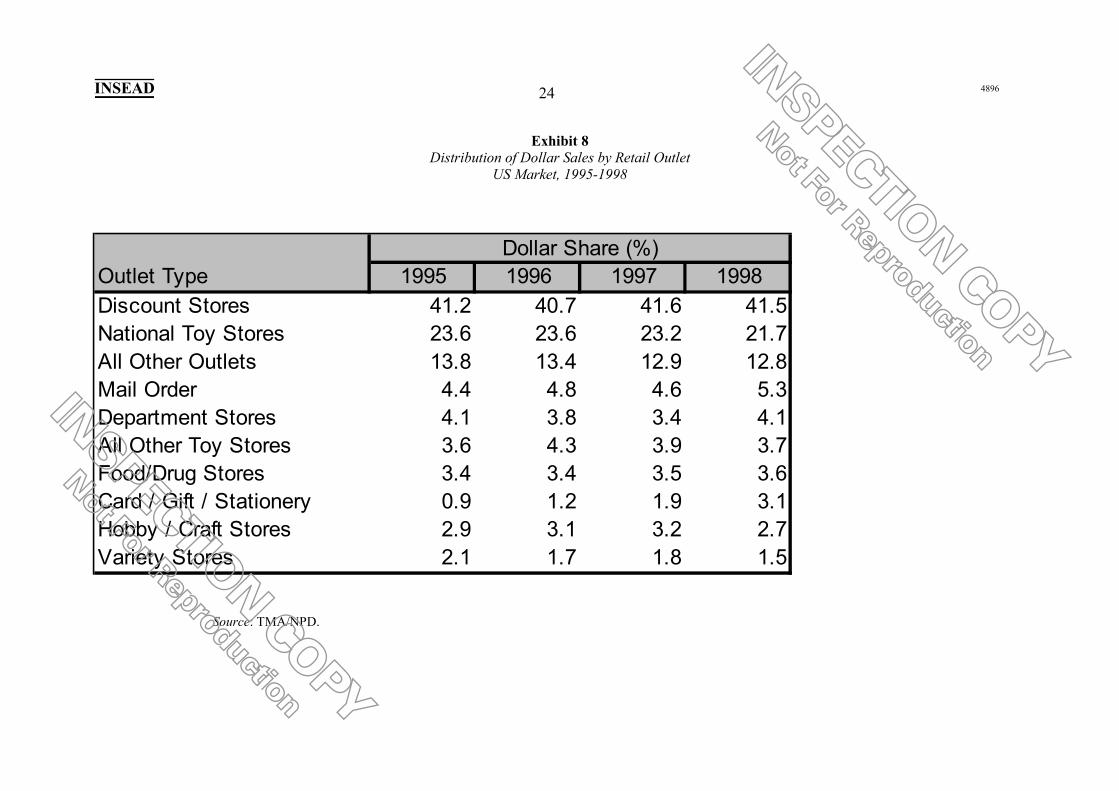
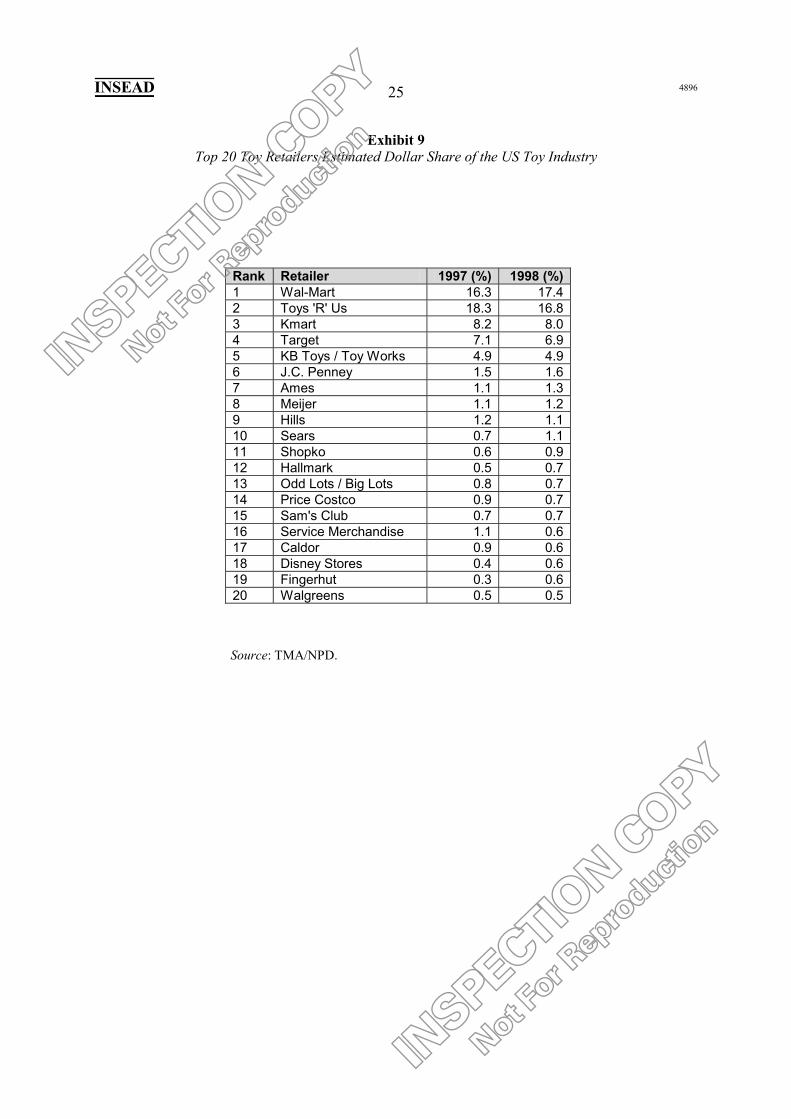
hobby/craft, local toy stores, card/stationery, variety, electronics stores and departmentstores). In 1997, discount stores accounted for 42%, toys stores for 28% and other stores for30% of sales.16 Competition had heated up in the past two years, with Wal-Mart overtakingTRU as the largest toy retailer in the US during the 1998 Christmas season. Market shares for1997 and 1998 are given in Exhibits 8 and 9.
Beyond these channels, manufacturers were also looking to new ways of reaching theconsumer. These ranged from movie theatres to fast food chains, and even included suchpartnerships as that with Avon, who, in 1998, was Mattel's fourth largest distributor.17
Discount Stores
The main dimension on which Target, K-Mart, Wal-Mart, and the bulk warehouses competedagainst TRU was price. TRU was accused by Price Club and other discount retailers ofworking with Mattel and Hasbro to keep prices artificially high by making it difficult to makedirect product comparisons between the stores. This was finally settled out of court,18 but itindicated the pressures on TRU from the discount chains.
Wal-Mart. Wal-Mart began retailing in 1962, when Sam Walton opened a tiny chain ofvariety stores in Arkansas and Kansas. In the 1980s, Wal-Mart became one of the mostsuccessful retailers in America, with a specific focus on customer experience. Wal-Martpioneered the practice of sharing sales data with major suppliers via computer. Thisinnovative strategy helped manage stock and guided merchandising decisions at a local level.This was important for product availability as well as the end profit margin. In the late 1980sand early 1990s, Wal-Mart expanded to include warehouse clubs and grocery chains such asSAM's Club and Supercenter. They also moved internationally in the 1990s to Canada,Europe and Asia. The ‘toys and sporting goods’ category made up 7% of Wal-Mart's totalsales.19 For the fiscal year ending 31 January 1999, annual sales were US$137 billion and netincome before taxes US$7.3 billion.
TRU had traditionally competed on the premise of being the largest toy retailer with thefullest selection. Wal-Mart had come into the toy market with a strategy of low cost andrather than carrying all products, it carried only the products it believed would be the hitproducts of the season.
Wal-Mart's success drew on two major factors. First, the ability to choose the most popularproducts prior to the season. TRU admitted Wal-Mart had managed to do this very well. 16 Toy Manufacturers of America.
17 Owen Graduate School of Management report by an Owen Project Team under Prof. M. Eric Johnson,1998.
18 TRU was required to pay US$40.5 million in cash and toys while Mattel and Little Tikes were required topay US$8.2 million and US$1.3 million in cash and toys to charities. Hasbro settled earlier and also paid intoys and cash. None of the companies admitted any wrongdoing.
19 Other categories represented the following percentage of sales: hardgoods (22%), soft goods/domestics(21%), grocery, candy and tobacco (16%), pharmaceuticals (9%), electronics (9%), health and beauty aids(7%), stationery (4%), shoes (2%), jewelry (2%), photo development (1%).
INSPECTIO
N COPY
Not For R
epro
duction
INSPECTIO
N COPY
Not For R
epro
duction
INSEAD 7 4896
Copyright 2000 INSEAD, Fontainebleau, France.
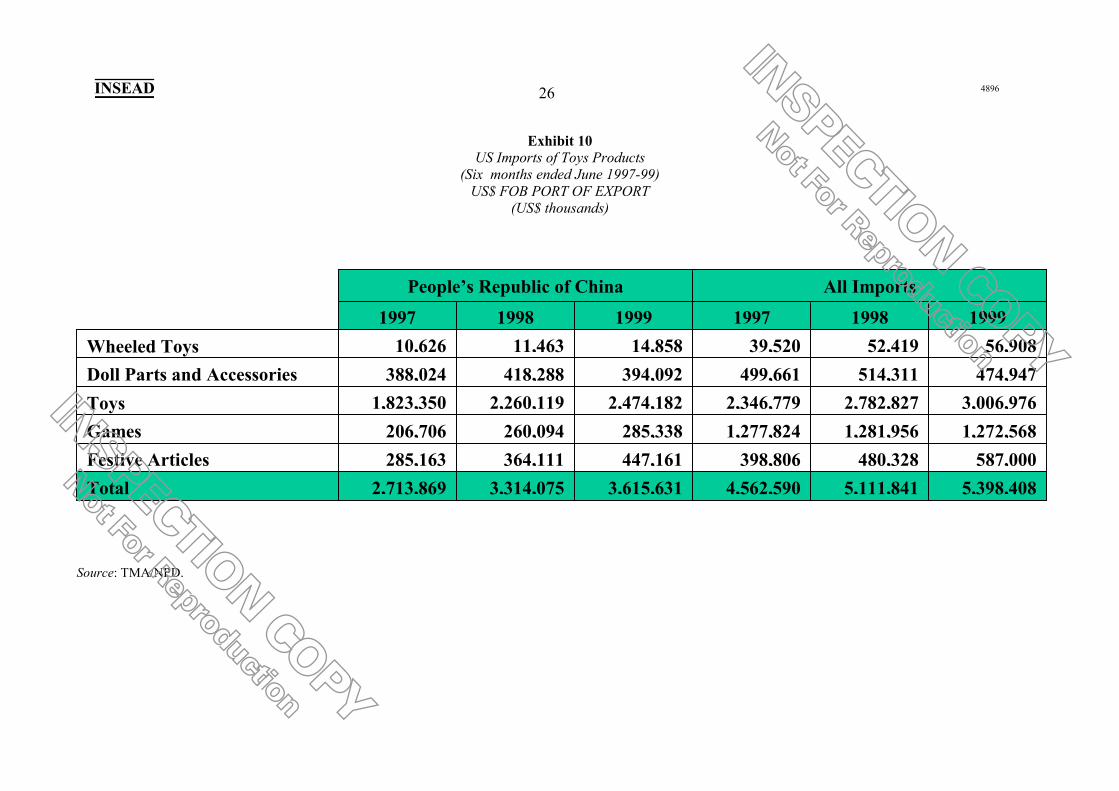
Second, Wal-Mart was well known for its extremely well managed logistics and inventoryflow. This type of inventory management was especially crucial in the toy industry during theChristmas crunch period, when manufacturers sometimes had to airlift products to the USfrom Asia on rented Boeing 747 jets to cope with demand (see Exhibit 10). Even with this,Wal-Mart realized that their state-of-the-art tracking system could not cope with the trendsand they allowed the toy manager override control on replenishment. These managers were onthe floor the entire day and had a good sense of stock-outs and lost sales.20
K-Mart. K-Mart was the second largest discount retailer in the US after Wal-Mart. Based inTroy, Michigan, K-Mart had 2160 discount stores throughout the US. K-Mart had beenfounded by the Kresge family in 1962. In the early 1960s, K-Mart and other discount chainsexpanded across the country and internationally, while Wal-Mart, due to a lack of funding,remained quite local. Wal-Mart's growth in the 1980s after its NYSE listing began to drivedown K-Mart's sales and, by the early 1990s, earnings began to fall. In 1995, K-Mart replacedits CEO and closed more than 200 stores in the US, starting a road to recovery that involvedthe spin-off of many of its divisions and subsidiaries. By 1999, K-Mart's sales and profitswere up. While the stock had not yet rebounded, prospects were brighter. In terms of its 1998US toy sales, K-Mart ranked third with 8%, after Wal-Mart and TRU. In late 1998, they hadintroduced an online gift shop, retailing various products including toys.
National Toy Retailers – Kay Bee/KB Toy Stores
The only national toy retailer other than TRU was Kay Bee/KB Toy Stores (KB). KB wasowned by Consolidated Stores Corp, a value retailer that focused on closeout merchandiseand toys. It owned 1322 retail toy and closeout toy stores in the US under the names KBToys, KB Toy Works, and KB Toy Outlet. While TRU was the largest national toy retaileroverall, KB Toy Stores was the largest mall-based toy retailer.
KB Toy Stores ranked fifth in 1998 with 4.9% market share in the US. In 1999, they joinedBrainPlay.com to develop KBToys.com, an online retailing venture owned 80% byConsolidated and 20% by BrainPlay.com. Consolidated added its bargaining clout andmarketing strengths while BrainPlay.com contributed the entrepreneurial online skills. Theventure was valued at approximately US$100 million. The site retailed toys, video games,software and videos.
Other General Retailers
General retailers made up the remaining market share in the US toy market: 12.8% otherstores; 5.3% mail order; 4.1% department stores; 3.7% other toy stores; 3.6% food/drugstores; 2.7% craft/hobby shops; and 1.5% variety stores. Despite their numbers, most of theseretailers, including JC Penney, garnered only 1% of the US toy sales on average. With high-tech smart toys and video games taking a greater share of overall toy sales, retailers weresetting aside larger portions of their stores to display and retail the products in a moreinteractive environment. 20 Owen Graduate School of Management report by an Owen Project Team under Prof. M. Eric Johnson,
1998.
INSPECTIO
N COPY
Not For R
epro
duction
INSPECTIO
N COPY
Not For R
epro
duction
INSEAD 8 4896
Copyright 2000 INSEAD, Fontainebleau, France.
JC Penney. JC Penney was a large department store, drug store and insurance retailer in NorthAmerica. They had 1230 department stores across the country and a licensed collection thatsold in Asia. They had more store space than any other US department store and retailedeverything from women's apparel through home furnishings to durables. Their toydepartment, as with most department stores, was quite small, likely less than 5% of sales.
Best Buy. Best Buy was the largest volume specialty retailer of consumer electronics, PCs,entertainment software and appliances. They had 335 stores in 36 states and offered CDs andDVDs online. In late 1998, they had entered the toy market through products such as radio-controlled cars and hand-held gaming devices. As more smart toys were developed, Best Buywas expected to grow this department and gain share from traditional toy retails. In 1999,Best Buy was considering building a dedicated toy section to accommodate the products.21
This came on the heels of a loss on these products after they had been unable to stock shelvesfast enough during a rush period in the previous year. Best Buy's customer base was differentfrom that of Wal-Mart in that they were slightly younger, better educated and in a higherincome bracket.
CompUSA. Based in Dallas, CompUSA was the leading computer retailer in America. Theyhad more than 200 stores in 40 states and sold hardware, software and accessories. Well-known for their retail sales, they also sold via mail order and direct orders from thegovernment, the corporate sector and the educational sector. Direct sales had allowed them tofare better than many of their competitors. Their subsidiary, Net.com, concentrated onInternet sales of hardware. In 1999, they had initiated an online auction site for PCs,peripherals and accessories: compUSAauctions.com. 1998 had been a difficult yearfinancially, as CompUSA had purchased a competitor and the industry was suffering fromlow PC prices. A downsizing and reorganization in late 1998 had been expected to lead to anincrease in profitability.
Growth of Online Retailing
EToys. eToys had been incorporated in late 1996 by Toby Lenk, former Corporate VicePresident of Strategic Planning in Disney. From its inception, eToys was an Internet pure playand was modeled on other successful online retailers. At that point in time, the Internet wasgaining momentum and online book sales and banking were taking hold. Still, most analystsand retailers believed that toy sales would not be successful online because shopping for toysrequired physical interaction with the product. Nonetheless, Lenk saw an opportunity andquickly put together a strong team of former retailers, investment bankers, strategists andsoftware developers.
In the following two years, they created a site with the specific goal of retailing children'sproducts such as toys, video games, software, videos and music. The concept was centered onthe idea that parents would prefer to shop at home rather than take the children to a mall andgo through the hassle of shopping in a loud, crowded toy store with kids in tow. The eToyssite featured product information, 24-hour shopping, customer service and quick product
21 ‘Stores Dedicate Sections to Smart Toys’, Reuters, 19 May 1999.
INSPECTIO
N COPY
Not For R
epro
duction
INSPECTIO
N COPY
Not For R
epro
duction

INSEAD 9 4896
Copyright 2000 INSEAD, Fontainebleau, France.
delivery. Of critical importance was securing the product range to make this a viableproposition. By 1999, eToys had over 9500 SKUs and 750 brands available on their site.
eToys believed they had a broader brand selection than the brick and mortar retailers whichsold only the major brands. They also had a more complete selection than the specialtyretailers which sold unique products but not necessarily the top brands. This was where theysaw their competitive advantage. They were not limited by store size or shelf space in theproducts they carried nor did they require a large inventory of all products because theyhoused all inventory in one distribution center, not in the backrooms of multiple retail outlets.They also believed they had further reach: being able to tap into the markets that were notserved well by the mall-based retailers.
To augment this general strategy, they worked hard to lay out a customer service plan thatwas in line with top Internet retailers and that was far ahead of where they felt theircompetitors were. They offered product reviews and recommendations, a gift center; a "myeToys" personalization service with birthday reminders, wish lists and address books, in-stocknotification and product news.
Within the first 18 months, eToys had garnered tremendous brand recognition in the industryand during the 1998 Christmas season generated 3.4 million hits, three times more thantoysrus.com.22 Full year 1998 sales topped US$15 million, far exceeding industry andcompany projections. One difficulty in the short term was that online sales appeared to be farmore seasonal than in the brick and mortar toy environment, which itself was subject toseasonal fluctuations: 4Q (fourth quarter) 1998 sales at eToys were more than 20 times thetotal sales in the previous three quarters.
eToys had invested highly in developing their web presence, allocating US$3 million to‘anchor tenancy’ on America Online and paying out commissions of 25% on each sales dollarto referring websites.23 Promotions throughout the 1998 Christmas season (including Furbygiveaways) drew in customers, who then formed part of the massive eToys database. Theyalso benefited from other campaigns such as the national Visa commercials, which featured aparent buying products from eToys – a very public validation of the legitimacy of eToys andthe safety of online purchases with credit cards. In 1999, advertising had been stepped up tofend off other competitors, and estimated ad spend in 3Q 1999 was approximately US$60million.24
This tremendous growth required eToys to purchase a new warehouse on the East Coast,raising capacity from 60,000 sq.ft to 439,000 sq.ft. Their workforce also increaseddramatically: from 20 in 1997 to more than 300 in early 1999.
Capitalizing on the tremendous publicity surrounding them, eToys went public in May 1999,with an initial share price of US$20. It shot up to more than US$80 in the first few days of
22 TRU claims this was due to an inability to track the hits correctly during the e-Christmas period, since the
site was up and down repeatedly.
23 ‘Inside the First E-Christmas’, Fortune Magazine, 1 February 1999.
24 Merrill Lynch.
INSPECTIO
N COPY
Not For R
epro
duction
INSPECTIO
N COPY
Not For R
epro
duction

INSEAD 10 4896
Copyright 2000 INSEAD, Fontainebleau, France.
trading. This gave eToys a market capitalization of just over US$6 billion, almost twice ashigh as TRU who had more than 350 times more sales than eToys. This stock was, naturally,very volatile, and at times fell to almost US$28 per share.
The cost structure of eToys, similar to other online retailers, was different to the traditionalbrick and mortar players (see Exhibits 11 and 12). Their assets were almost entirely cash andinventory. They garnered tremendous sales (US$8 million in the three months ending June1999, compared to US$381,000 the previous year), and yet incurred dramatic losses in netincome, due largely to the amount of advertising and promotion required to acquirecustomers. While the Boston Consulting Group/Shop.org study revealed that averagecustomer acquisition costs were US$42 for pure plays and US$22 for multi-channel retailers,eToys was estimated by market analysts to require US$129 per customer in Q2 1999, anincrease over US$107 the previous quarter.25 However, eToys had been able to raise theirquarterly revenues per customer, which, in Q2 1999, stood at US$22. Merrill Lynch expectedthat eToys would have over 1.2 million gross accounts by the end of the year.26
eToys also had an accumulated deficit in June 1999 of US$51.6 million. Internal and externalforecasters expected continued negative net income for the foreseeable future. With globalexpansion, increasing mindshare competition, a costly new distribution center, high customeracquisition costs and increasing advertising costs, eToys was considered by many analysts tobe "extraordinarily expensive compared to both comparable companies and projectedfinancial performance".27
Other e-tailers. By mid-1999, other e-tailers were also getting in, aiming to compete in the1999 Christmas season: Amazon.com, KBkids.com, Smarter Kids.com, toysmart.com, RedRocket.com, Netoy.com, JC Penney.com, Service Merchandise and FAO Schwarz.com. For acomparison of these players by two market research firms and a list of the most popular sites,see Exhibits 13 and 14. Also provided is a non-comprehensive list of key success factors inthe world of online children's marketing (see Exhibit 15).
Some of the online players had also teemed up in networks that helped direct the user tovarious member companies. Often, but not always, these were related to particular portals.Examples of networks would include the Microsoft Network and Lycos Network. Onenetwork in particular marketed itself entirely to families ensuring ‘clean’ content and offeringlinks to everything family-related: the Infoseek/Go! Network. This was a group that includedthe search engine, Infoseek, various chat groups and message boards, the ultra-popularDisney.com site, Family.com, ESPN.com, ABCNEWS.com and NFL.com. Disney was amajor investor in Go! as well, and had recently bought out Infoseek's share. Disney alsopurchased toysmart.com so that it could retail a huge variety of educational toys as acomplement to the previous Disney line-up.
25 Merrill Lynch.
26 Merrill Lynch.
27 Merrill Lynch, eToys report, 29 October 1999.
INSPECTIO
N COPY
Not For R
epro
duction
INSPECTIO
N COPY
Not For R
epro
duction
INSEAD 11 4896
Copyright 2000 INSEAD, Fontainebleau, France.
Toys “R” Us
History
Charles Lazarus conceived of a furniture store focusing entirely on children in 1948. Hebegan operations out of a converted bicycle shed in Washington D.C. After several starts andstops, the business became centered more and more around children's toys and, in 1957, heopened the first toy supermarket. Its aim, to achieve year-round toy sales, was a new conceptin the seasonal industry. These were pre-mall, pre-discount retailing days, when the industrywas fragmented and the bulk of retailers (mom and pop shops and department stores) stockedtheir shelves with toys mostly in the Christmas season.
The first store was a big success and soon he expanded, choosing the right location time aftertime. Charles Lazarus was a retailing guru. He was well known as someone who read themarket extremely well and whose intuition was unfailingly right. He believed that "the bigthing [was] having the largest variety of toys in stock" and selling "by the shopping cart!" Inthe 1970s and 1980s, this seemed to be dead-on.
In 1978, it became a public company and in the reorganization that took place, a revisedstrategy was brought in and the stores renamed Toys “R” Us. In the few years to follow,Lazarus created even larger warehouse stores, carrying all toys imaginable. Rapid growthensued, and the company found itself labeled as the ‘category killer’ of the toy market,growing at over 40% annually in the early 1980s. Many, in fact, credited TRU with thecreation of the category killer concept: the style of retailer that packed the shelves ofwarehouses, undercut competitors' pricing and operated on the lean.
By the mid-1980s, TRU had expanded to 200 stores across the US and in the process becamethe nation's largest toy retailer, with over 12% of the market, increasing share at 1.5% perannum. In 1983 alone, sales jumped 27% and net earnings 44%. It had gross marginsimpressively high at around 32%, with SG&A costs less than 20%. This was a formula thatworked and that drove the direction in the marketplace. Mom and pop shops wereincreasingly pressured by the underpricing and most of them fell casualties to TRU. By thelate 1980s, it dwarfed competitors such as Kay Bee Toys and put extreme pressures on ChildWorld and Lionel's Kiddie City, which increasingly struggled to service their debts and turnprofits. By the end of the decade, TRU's market share had soared to 25% and many analystsexpected this trend to continue. Even during the worst toy seasons in 1990 and 1991, TRUmanaged to outperform market expectations while competitors and manufacturers reeled atthe dismal growth in the industry overall.
By 1991, Child World, the nation's second largest toy retailer, was in serious trouble and theysuspended debt payments in an effort to stay alive. In the same year, Lionel (Kiddie City)filed for bankruptcy. In 1992, Child World was also liquidated. TRU claimed to havecaptured almost half of Child World's market within the six months following its demise andwas openly eyeing the market share left by Kiddie City.
Despite the troubles of its competitors, TRU was not resting on its laurels. It continued toexpand at a remarkable pace, opening countless new stores across the US, introducingcatalogue sales, broadening its scope (Kids “R” Us, Babies “R” Us, Books “R” Us, Parties
INSPECTIO
N COPY
Not For R
epro
duction
INSPECTIO
N COPY
Not For R
epro
duction

INSEAD 12 4896
Copyright 2000 INSEAD, Fontainebleau, France.
“R” Us) and entering new international markets. As each country fell to TRU, retailers andgovernments expressed their concerns about the onslaught of competition from retailers suchas TRU.
In its heyday, TRU became a symbol of American greatness in business. On a cold day inJanuary 1992, President George Bush stood by the side of Charles Lazarus, the third highestpaid CEO in corporate America, and talked to a crowd gathered in a parking lot of a JapaneseTRU. It was the official opening of the second TRU outlet in Japan and President Bushheralded it as an example of American success in Japan. After three years of trying to enterthe tightly regulated Japanese market as a foreign retailer, TRU had finally been grantedpermission in 1991, thanks to the help of McDonald's. (In return, McDonald's had taken a20% stake in the Japanese TRU outlets.)
In 1994, after years as head of TRU, Lazarus decided to hand the reigns over to a successor,Michael Goldstein. Goldstein was a long-time friend of Lazarus and had been educated in themanagement mindset employed by Lazarus. Lazarus stayed on as Chairman Emeritus of theBoard. Most directors were consultants and academics who also were Lazarus' long-timefriends. Yet, Lazarus remained highly involved in all business decisions and day-to-dayoperations of the firm. As the founder of the firm, he was highly respected by his executivesas well as the market.
In the course of Lazarus' last decade at the helm, TRU had taken over the industry and hadeaten everything in its path. It had revolutionized retailing in general and came to dominateand control the toy market. Prices had fallen drastically, toy sales had become a year-roundevent, mom and pop shops had been driven out of business, and mid-range retailers hadsuccumbed to the competitive pressures and been liquidated or bought out. TRU had becomea household name and a retailing model on which others, such as Home Depot, Office Depotand Costco, would design themselves. It was billed as the largest specialty retailer in theworld, the "master of the toy-selling universe", and it invoked both fear and admiration. (SeeExhibits 15 and 16 for financial data and Exhibit 17 for store location data.)
Operating Structure
TRU was a very capital-intensive retailer, having chosen to purchase most of its properties asit expanded (see Exhibit 18). Most TRU stores were stand-alone, measuring 46,000 sq.ft withsmaller (20,000-30,000 sq.ft) stores located in strip malls. Of the stores in the US, TRUowned 62% and leased the rest on long-term leases with multiple renewal options. They alsoowned 13 distribution centers and leased two more. These centers were, on average, 427,000sq.ft and were in strategic locations throughout the US.
On an international level, TRU operated the majority of its stores, although it hadapproximately 15 joint ventures and just under 50 franchised stores. Of those it operated, itowned 29% and leased 71%. It also operated 15 international distribution centers, five ofwhich it owned, and nine of which it leased.
The Kids "R" Us and Babies "R" Us stores also added to TRU’s property list. Of theseoperations, it owned 39% and leased 61%. It had four further distribution centers, of which itowned two and leased two. These averaged 158,000 sq.ft each.
INSPECTIO
N COPY
Not For R
epro
duction
INSPECTIO
N COPY
Not For R
epro
duction

INSEAD 13 4896
Copyright 2000 INSEAD, Fontainebleau, France.
TRU also operated a state-of-the-art computerized inventory system that allowed it to monitorthe activity and inventory in each region and store. Adding to the asset base, TRU owned itsown truck and trailer fleet, both within the US and abroad.
The Beginnings of Trouble and the Subsequent Restructuring
By the mid-1990s, the warehouse concept employed by TRU was still the same as that of the1980s, but growth had slowed. 1996 saw a drop in net income margin from 6.1% to 1.5%. Anew store design, Concept 2000, was introduced. Yet, after initial failure in various test-markets, the redesign was never employed on a large scale. This was a major setback for TRUas it was starting to face new competition. Furthermore, it became embroiled in a lawsuit,accused of price-fixing to prevent bulk discount stores such as Price Club from receiving thefull line of toy products from Mattel and Hasbro. This was finally settled out of court in 1999,but it indicated the pressure TRU was feeling.
Analysts speculated that the corporate culture that had developed around Lazarus might havebeen one reason the company failed to move forward in the 1990s. He had continued to drivemany of the operating decisions and was adamant that he still understood the toy market as hehad for so many years. Yet, earlier, he reportedly had been unreceptive to Cabbage PatchKids, a highly successful product. In 1998, he had been determined to prevent a new line ofeducational toys from being part of the TRU product line-up. When he finally gave in, thetoys became a big success, which was an utter surprise to him. Said one director at TRU, "It'shard when you've got a founder – a genius who built the company – to try to tell him thatthings have to change. It's hard to bring it up with Charles."
1996 and 1997 saw increased sales and slightly improved net income, though the margins didnot return to their former levels. TRU was also losing market share as others, notably Wal-Mart, were gaining. In 1998, TRU decided to undertake a large restructuring project toimprove profitability, which brought about the first-ever negative net income for TRU.
During this restructuring, it closed or downsized 50 stores globally and consolidateddistribution centers. It drove down costs by aggressively reducing inventory (at the cost ofsome of their manufacturers as well). TRU appointed a new CEO, Robert Nakasone, whothen brought in a stream of new executives, half of them from outside the company. This washastened, in fact, by the sudden departure of president, COO, Bruce Krysiak in April 1999.The compensation system was adjusted to reward division heads based on whether theirdivisions earned a return above the company's cost of capital.
With the new life this management team brought in, the stores were redesigned and infusedwith a new customer focus. The C3 (Customer-driven, Cost-effective Concept) design,expected to be rolled out fully by 2001, divided the store into various merchandising"worlds": Juvenile, R-Zone (electronics and video games), Action and Adventure, Girls,Outdoor Fun, Pre-School, Seasonal, Learning Center, and Family Fun (games/puzzles). Inaddition, the aisles were widened, more end-displays added and congestion eased. A 33%reduction in the backrooms increased sales floors by 20%. A greater focus was given to videogames, the largest growing toy segment, and discount products. An additional push wasplaced on the house brand and on becoming their own largest manufacturer.
INSPECTIO
N COPY
Not For R
epro
duction
INSPECTIO
N COPY
Not For R
epro
duction
INSEAD 14 4896
Copyright 2000 INSEAD, Fontainebleau, France.
There was also a new focus on the strong, yet rather neglected TRU brand, associating it withsuperior customer service in the stores. Disney executives were brought in to conductcustomer-focused training at the highest levels and this was pushed through to all employeesthrough changes in training, product knowledge dissemination, sales floor staffing andoperating processes. TRU switched its advertising agency to Leo Burnett, and launched forthe first time a Toys “R” Us branding campaign that focused solely on the store and not themanufacturers' products. This campaign began in August 1999 in the US.
These changes were seen by the market as quite positive (see Exhibit 19 for stock priceperformance). Yet there were questions regarding how far some of these could be pushed. Forexample, the goal of being "their own manufacturer" added complexity to the relationship thathad developed in the industry between manufacturers and retailers. While they needed oneanother, there was a question as to how far each of them could continue to move into theother’s territory. Some analysts28 believed that each would not enter far, with manufacturerspreferring to work with large retailers to distribute online, and with retailers such as TRU onlyintroducing small commodity lines of house-brand products.
TRU Online
Rapidly growing e-sales had pushed TRU to also develop an e-commerce service. TRUinitially launched its website in June 1998. It was immediately critiqued as cumbersome andnot net-friendly. Search and comparison capabilities did not offer the wide level of flexibilityof other sites, which could be searched by brand, child age, type of product and price. Thefailure to advertise (spending less than US$1 million compared to eToys' US$20 million) wascited by many analysts as a key factor that hurt toysrus.com in the 1998 Christmas season.They were also plagued by technical difficulties, particularly the inability of TRU's servers tohandle the extreme traffic.
After the dismal online sales in the first e-Christmas, TRU announced a major investment in anew toysrus.com site as well as an entire Internet division to develop the online sales channeland brand management. An initial investment of US$80 million was allocated to moving thee-commerce division of TRU to Silicon Valley and purchasing a US$30 million distributioncenter in Memphis (the geographic 'sweet spot' for US distribution). The new division wasworking with well-known venture capitalist, Benchmark Capital, who was responsible for E-Bay as well as other successful Internet start-ups. Initially, this tie-up with Benchmark alsogave TRU a significant boost. It immediately established some online credibility and allowedthem to draw on the expertise of the top VC firm in the business.
However, after several months on the project, Bob Moog, the new CEO of toysrus.com,resigned. A few days later, he told reporters, "Toys 'R' Us misjudged how much of a free-spirited entrepreneur they wanted. I think you can understand my frustration."29 Two monthslater, Benchmark Capital and TRU parted ways. Industry insiders put this down to TRUwanting to control the entire process and reap all the financial rewards while Benchmark wastrying to grab a large share of the revenues. "They [TRU] just couldn't let go; they were 28 Interview with Leah Stambler, analyst for toy manufacturers, Morgan Stanley.
29 Jerry Useem, ‘Can These Marriages Be Saved?’, Fortune Magazine, 8 November 1999.
INSPECTIO
N COPY
Not For R
epro
duction
INSPECTIO
N COPY
Not For R
epro
duction

INSEAD 15 4896
Copyright 2000 INSEAD, Fontainebleau, France.
seized by this cannibalization inertia," said an e-commerce analyst at Thomas WeiselPartners. While some analysts referred to the VC fund as "greedy", others felt there wereother issues at the heart of the matter. From the outside, it was difficult to assess exactly whatwent wrong.
Regardless, toysrus.com was moving ahead alone. The distribution center dedicated to e-commerce was 500,000 sq.ft, slightly larger than eToys'. eToys had a facility on the westcoast and another on the East Coast, while TRU had one large center with excellent access toall regions of the country. TRU had a large product selection to offer online and a largerinventory to draw from. TRU also had outsourced the maintenance of the servers to acompany that was technically strong.
In addition, TRU indicated they planned to leverage synergies with its brick and mortarstores. A 1998 study30 of online shoppers found that their largest concerns surrounded theissue of credibility and return policy. In fact, this appeared to give multi-channel retailers asignificant advantage (see Exhibit 20). With brick and mortar shops, TRU could back allpurchases with guarantees and return policies that could be acted upon at the local shop level.Other synergies such as instore access to the website or online baby registry accessible in thestores had been proposed to help TRU compete against web-only retailers such as eToys.
It was not clear, however, that senior management in TRU were entirely unified in their viewsabout the new subsidiary and its future within the firm. Some recognized the need for a flatter,more matrix-driven organization (which currently did not exist within corporate TRU) as wellas a more casual environment, which was less affected and influenced by the parentcorporation. However, analysts debated whether the overall corporate directors were aware ofthe long-term consequences of this separation. Indeed, many questions had been raised aboutthe new composition of the management team – were these the right leaders to take TRU intothe next competitive environment?
Outlook
Most analysts believed that the e-Christmas of 1999 was a make or break year for on-lineretailers. Estimates of toy sales on-line ranged from Jupiter Communications' $53m to GomezAdvisors' $230m. Both Forrester Research and the Boston Consulting Group estimated thevalue around $200m. While many sources did not project out more than one year, several ofthe research companies had supplied approximate values for on-line sales in three or fouryears' time. By 2002, Jupiter Communications foresaw sales of $555m while Gomez andForrester pegged the number at $1.5b and $1.6b respectively. These latter values wouldsuggest that 5% of total toy sales would be transacted on-line by 2002. See Exhibit 21.
TRU was pressured to compete successfully on-line while at the same time needing to fendoff brick and mortar competitors such as Wal-Mart. In addition, Wal-Mart had announced amajor internet initivative to counter e-tailers such as Amazon.com that had rapidly expandedtheir product range from books to music, videos, toys, etc. As also TRU’s manufacturers
30 BCG/Shop.org study.
INSPECTIO
N COPY
Not For R
epro
duction
INSPECTIO
N COPY
Not For R
epro
duction
INSEAD 16 4896
Copyright 2000 INSEAD, Fontainebleau, France.
starting to sell direct to the consumer, TRU urgently needed to rethink its entire strategy andpositioning. (See Exhibit 21 for promotion approaches for websites)
Where would toysrus.com be for the next e-Christmas, only three months away? The newCEO of toysrus.com, John Barbour, had many years of experience with entrepreneurialventures, but even he cautioned that the timeline may be too short to be Number One on the'web by the end of 1999. With the future of the subsidiary in doubt, and the current websiteold and clunky, it would seem that some executive decisions needed to be taken soon if TRUwas to be part of the on-line holiday season. Even with that, it would be a tough battle to winover the consumer.
INSPECTIO
N COPY
Not For R
epro
duction
INSPECTIO
N COPY
Not For R
epro
duction
INSEAD 17 4896
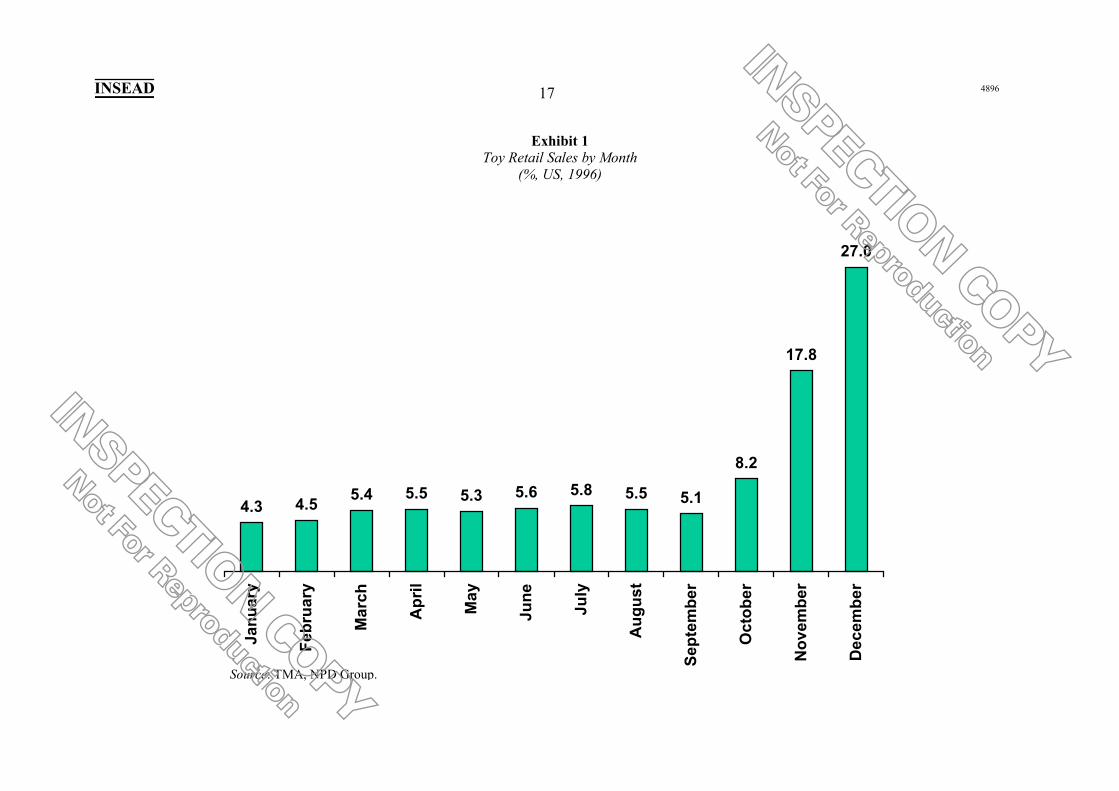
Exhibit 1Toy Retail Sales by Month
(%, US, 1996)
4.3 4.5 5.4 5.5 5.3 5.6 5.8 5.5 5.1
8.2
17.8
27.0Ja
nuar
y
Febr
uary
Mar
ch
Apr
il
May
June
July
Aug
ust
Sept
embe
r
Oct
ober
Nov
embe
r
Dec
embe
r
Source: TMA, NPD Group.
INSPECTION COPY
Not For Reproduction
INSPECTION COPY
Not For Reproduction

INSEAD 18 4896
Copyright 2000 INSEAD, Fontainebleau, France.
Exhibit 2Global Toy Sales 1996-1998(Retail Sales, US$ millions)
Source: World Toy Facts and Figures, March 1999, International Council of Toy Industries.
0
5000
10000
15000
20000
25000
30000
N. Amer. Europe Asia Latin & S.Amer.
Middle East Oceania Africa
INSPECTION COPY
Not For Reproduction
INSPECTION COPY
Not For Reproduction

INSEAD 19 4896
Copyright 2000 INSEAD, Fontainebleau, France.
Exhibit 3Global Toy Statistics, 1998
Source: World Toy Facts and Figures, March 1999, International Council of Toy Industries.
North America
48%
Europe29%
Asia13%
ROW10%
340.51
144.25
1.8516.03
252.02
116.81
1.54
Nor
thA
mer
ica
Euro
pe
Asia
Latin
& S
.A
mer
ica
Mid
dle
East
Oce
ania
Afr
ica
Toy Sales by Market Average Expenditure per Child
INSPECTION COPY
Not For Reproduction
INSPECTION COPY
Not For Reproduction

INSEAD 20 4896
Copyright 2000 INSEAD, Fontainebleau, France.
Exhibit 4Revenues for Online Retailing, 1998
ComputerGoods
Travel Auction HouseholdGoods
Food& Wine
ToysFinancialServices
Books &Entertain-
ment
Gift Apparel
1998 PercentageGrowth over 1997 230 80 250 290 N/A 340 210 150 40 60 310
1998 EstimatedRevenues($ Millions)
Auto
Source: Shop.org/Boston Consulting Group.
0
1
2
3
4
54,70
3,40
1,601,30
50 50 5030 20 7 4
3,00
1,50
2,10
Retailer Revenue(Direct Sales)Gross Value of
Transactions
INSPECTION COPY
Not For Reproduction
INSPECTION COPY
Not For Reproduction
INSEAD 21 4896
Exhibit 5US Toy Statistics, 1998
Source: TMA, NPD Group.
2087 2097
3446 3266
4253 5106
1403 1379
2154 2085
161413539071046
16331544743 728
15061479
1997 1998
19.1 20.6 21.0
3.6 5.0 6.2
1996 1997 1998
US Toy Sales by Product Category(US$ millions)
US Toy Sales by Segment(%, US$ billions)
Video Games
All others
Activity Toys
Games/PuzzlesRide-OnsVehiclesAction FiguresPlushDolls
Infant/Preschool
Video Games
TraditionalToys
+20.1%
-5.2%
+0.5%
+1.8%-2.0%+5.8%
-13.3%+19.3%
-3.2%-1.7%
INSPECTION COPY
Not For Reproduction
INSPECTION COPY
Not For Reproduction

INSEAD 22 4896
Exhibit 6Top Four Toy Manufacturers Estimated Dollar Share of the US Toy Retail Sales
Source: TMA / NPD
Rank Manufacturer 1995 (%) 1996 (%) 1997 (%)1 Mattel 18.3 18.4 19.02 Hasbro 12.2 12.6 12.23 Hallmark 2.8 2.4 2.14 Little Tikes 2.1 2.2 2.0
Top 4 Total 35.4 35.6 35.3
12.2
2.1 2.0 1.7 1.7 1.5 1.3 1.3 1.3
19.0
Mattel Hasbro Hallmark LittleTikes
Tiger Lego Ty Galloob Bandai Toy Biz
Top 10 Manufacturers in 1997 by % Share of Retail Sales
INSPECTION COPY
Not For Reproduction
INSPECTION COPY
Not For Reproduction
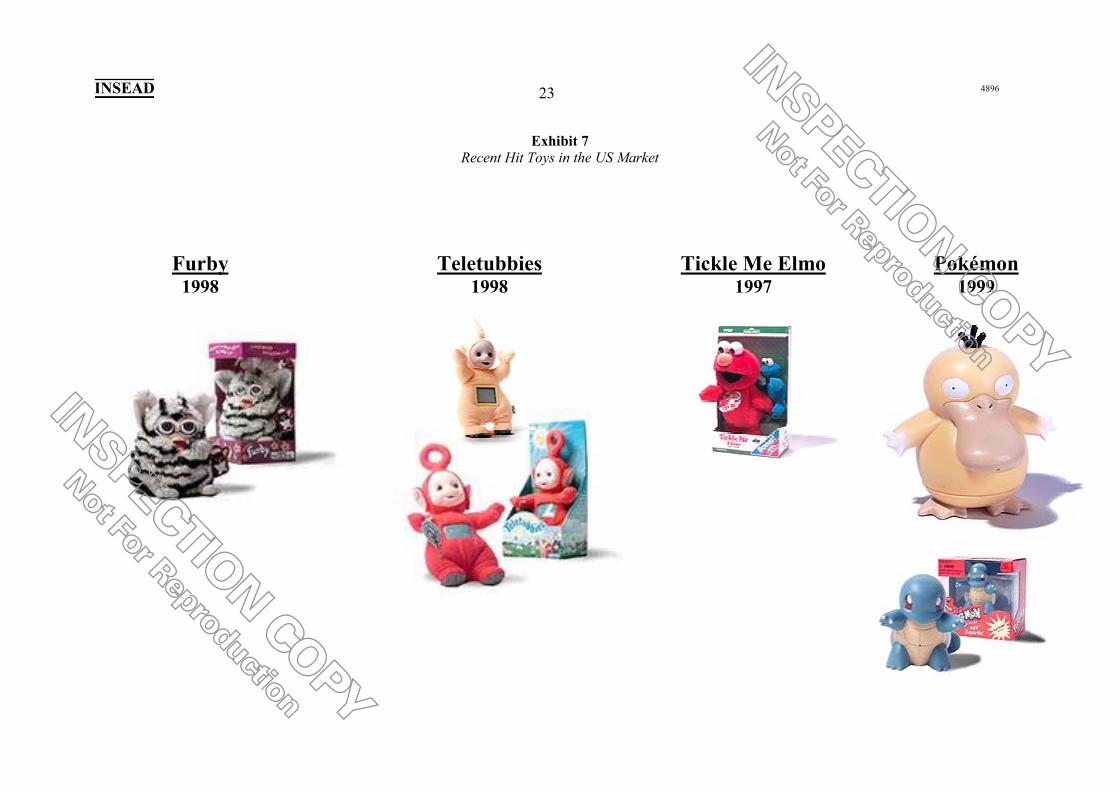
INSEAD 23 4896
Exhibit 7Recent Hit Toys in the US Market
Pokémon1999
Tickle Me Elmo1997
Teletubbies1998
Furby1998
INSPECTION COPY
Not For Reproduction
INSPECTION COPY
Not For Reproduction
INSEAD 24 4896
Exhibit 8Distribution of Dollar Sales by Retail Outlet
US Market, 1995-1998
Outlet Type 1995 1996 1997 1998Discount Stores 41.2 40.7 41.6 41.5National Toy Stores 23.6 23.6 23.2 21.7All Other Outlets 13.8 13.4 12.9 12.8Mail Order 4.4 4.8 4.6 5.3Department Stores 4.1 3.8 3.4 4.1All Other Toy Stores 3.6 4.3 3.9 3.7Food/Drug Stores 3.4 3.4 3.5 3.6Card / Gift / Stationery 0.9 1.2 1.9 3.1Hobby / Craft Stores 2.9 3.1 3.2 2.7Variety Stores 2.1 1.7 1.8 1.5
Dollar Share (%)
Source: TMA/NPD.
INSPECTION COPY
Not For Reproduction
INSPECTION COPY
Not For Reproduction
INSEAD 25 4896
Exhibit 9Top 20 Toy Retailers Estimated Dollar Share of the US Toy Industry
Source: TMA/NPD.
Rank Retailer 1997 (%) 1998 (%) 1 Wal-Mart 16.3 17.4 2 Toys 'R' Us 18.3 16.8 3 Kmart 8.2 8.0 4 Target 7.1 6.9 5 KB Toys / Toy Works 4.9 4.9 6 J.C. Penney 1.5 1.6 7 Ames 1.1 1.3 8 Meijer 1.1 1.2 9 Hills 1.2 1.1 10 Sears 0.7 1.1 11 Shopko 0.6 0.9 12 Hallmark 0.5 0.7 13 Odd Lots / Big Lots 0.8 0.7 14 Price Costco 0.9 0.7 15 Sam's Club 0.7 0.7 16 Service Merchandise 1.1 0.6 17 Caldor 0.9 0.6 18 Disney Stores 0.4 0.6 19 Fingerhut 0.3 0.6 20 Walgreens 0.5 0.5
INSPECTIO
N COPY
Not For R
epro
duction
INSPECTIO
N COPY
Not For R
epro
duction
INSEAD 26 4896
Exhibit 10US Imports of Toys Products
(Six months ended June 1997-99)US$ FOB PORT OF EXPORT
(US$ thousands)
Source: TMA/NPD.
People’s Republic of China All Imports1997 1998 1999 1997 1998 1999
10,626 11,463 14,858 39,520 52,419 56,908388,024 418,288 394,092 499,661 514,311 474,947
1,823,350 2,260,119 2,474,182 2,346,779 2,782,827 3,006,976206,706 260,094 285,338 1,277,824 1,281,956 1,272,568285,163 364,111 447,161 398,806 480,328 587,000
2,713,869 3,314,075 3,615,631 4,562,590 5,111,841 5,398,408
Wheeled ToysDoll Parts and AccessoriesToysGamesFestive ArticlesTotal
INSPECTION COPY
Not For Reproduction
INSPECTION COPY
Not For Reproduction

INSEAD 489627
Exhibit 11
eToys Inc.Consolidated Statements of Operations
(in $ thousands, except per share amounts)
QUARTER ENDEDSEPTEMBER 30
SIX MONTHS ENDEDSEPTEMBER 30
1999 1998 1999 1998
(UNAUDITED) (UNAUDITED) (UNAUDITED) (UNAUDITED)Net sales $ 13,306 $ 608 $ 21,281 $ 989Cost of sales 10,752 496 17,209 807
--------- --------- --------- ---------Gross profit 2,554 112 4,072 182Operating expenses:
Marketing and sales 20,012 2,372 31,585 3,742Product development 12,188 697 17,023 1,101General and administrative 4,298 554 7,254 893Goodwill amortization 9,546 80 9,626 159Deferred compensation amortization
3,314 69 7,096 113
--------- --------- --------- ---------Total operating expenses 49,358 3,772 72,584 6,008
--------- --------- --------- ---------Operating loss (46,804) (3,660) (68,512) (5,826)Interest income, net 1,860 277 2,786 272Provision for taxes -- -- (1) --
--------- --------- --------- ---------Net loss $ (44,944) $ (3,383) $ (65,727) $ (5,554)
========= ========= ========= =========Basic net loss per equivalent share $ (0.38) $ (0.10) $ (0.71) $ (0.17)
========= ========= ========= =========Pro forma basic net loss perequivalent share
$ (0.38) $ (0.04) $ (0.60) $ (0.07)
========= ========= ========= =========Shares used in computation of basicnet loss per equivalent share (1)
119,374 32,893 92,960 32,866
========= ========= ========= =========Shares used to compute pro formabasic net loss per equivalentshare (2)
119,374 87,523 108,784 74,645
========= ========= ========= ========= (1) Includes shares associated with the Redeemable Convertible Preferred Stock effective as of the closing of the company's initial public offering. See Note 5 to the Consolidated Financial Statements.
(2) Includes shares associated with the Redeemable Convertible Preferred Stock as if such conversion occurred on 1 April 1998, or at the date of original issuance, if later. See Note 5 to the Consolidated Financial Statements.
INSPECTIO
N COPY
Not For R
epro
duction
INSPECTIO
N COPY
Not For R
epro
duction

INSEAD 489628
Exhibit 12eToys Inc. Consolidated Balance Sheets (in $ thousands, except share amounts)
30 SEPT 1999 31 MARCH 1999
(UNAUDITED)ASSETSCurrent assets:
Cash and cash equivalents $ 140,601 $ 20,173Inventories 51,379 5,067Prepaids and other current assets 18,684 1,577
----------- ----------Total current assets 210,664 26,817Property and equipment 23,365 2,505Accumulated depreciation (2,156) (369)
----------- ----------21,209 2,136
Goodwill, net of accumulated amortization 180,066 637Other assets 2,238 1,076
----------- ----------Total assets $ 414,177 $ 30,666
=========== ==========LIABILITIES AND STOCKHOLDERS' EQUITYCurrent liabilities:
Accounts payable $ 66,471 $ 4,236Accrued expenses 6,798 530Current portion of long-term notes payable and capital lease obligations
3,083 230
----------- ----------Total current liabilities 76,352 4,996
Long-term notes payable and capital lease obligations 6,371 477Redeemable Convertible Preferred Stock, 19,593,089 shares authorized:
Series A Preferred Stock; $.0001 par value; none and 7,023,645 sharesissued and outstanding at 30 September 1999 and 31 March 1999,respectively
-- 4,355
Series B Preferred Stock; $.0001 par value; none and 11,886,649 sharesissued and outstanding at 30 September 1999 and 31 March 1999,respectively
-- 24,952
Series C Preferred Stock; $.0001 par value; none and 666,666 sharesissued and outstanding at 30 September 1999 and 31 March 1999,respectively
-- 19,984
Commitments and contingenciesStockholders' equity:
Common stock; $.0001 par value, 600,000,000 shares authorized; 119,643,088 and 34,535,415 issued and outstanding at 30 September 1999 and 31 March 1999, respectively
12 3
Additional paid-in-capital 474,886 45,837Receivables from stockholders (1,892) (138)Deferred compensation (44,997) (38,974)Accumulated other comprehensive loss (2) --Accumulated deficit (96,553) (30,826)
----------- ----------Total stockholders' equity (deficit) 331,454 (24,098)
----------- ----------Total liabilities and stockholders' equity $ 414,177 $ 30,666
INSPECTIO
N COPY
Not For R
epro
duction
INSPECTIO
N COPY
Not For R
epro
duction

INSEAD 489629
ETOYS INC. CONSOLIDATED STATEMENTS OF CASH FLOWS (IN $ THOUSANDS)SIX MONTHS ENDED
30 SEPTEMBER1999 1998
(UNAUDITED) (UNAUDITED)OPERATING ACTIVITIESNet loss $ (65,727) $ (5,554)Adjustments to reconcile net loss to net cash used in operating activities:
Non-cash interest -- 38Depreciation 1,373 109Amortization of intangibles 9,906 159Deferred compensation amortization related to stock options 7,096 113Other, net 71 --
Changes in operating assets and liabilities:Inventories (44,692) (1,667)Prepaids and other current assets (15,500) (2,892)Accounts payable 59,660 1,964Accrued expenses 1,836 23
--------- ---------Net cash used in operations (45,977) (7,707)
INVESTING ACTIVITIESCapital expenditures for property and equipment (10,024) (1,435)Net cash received from acquisition of BabyCenter, net of acquisition costs 2,571 --Other, net (1,389) (831)
--------- ---------Net cash used in investing activities (8,842) (2,266)
FINANCING ACTIVITIESProceeds from bridge loan -- 5,000Payments on bridge loan -- (2,238)Proceeds from issuance of Redeemable Convertible Preferred Stock -- 22,008Proceeds from issuance of common stock and exercise of stock options 176,190 2Payments on notes payable and capital leases (1,051) (14)Proceeds from receivables from stockholders 108 13
--------- ---------Net cash provided by financing activities 175,247 24,771
--------- ---------Net increase in cash and cash equivalents 120,428 14,798Cash and cash equivalents at beginning of period 20,173 1,552
--------- ---------Cash and cash equivalents at end of period $ 140,601 $ 16,350
========= =========Supplemental disclosures:
Interest paid $ 180 $ 44Notes payable and capital lease obligations incurred $ 7,788 $ 75Acquisition of BabyCenter:Fair value of assets acquired (including goodwill) $ 197,635 $ --Liabilities assumed (9,017) -- Stock issued (189,988) --Assumption of stockholders' receivables 1,862 --
--------- ---------Cash paid 492 --Cash acquired (3,063) --
--------- ---------Net cash received from acquisition of BabyCenter $ 2,571 $ --
INSPECTIO
N COPY
Not For R
epro
duction
INSPECTIO
N COPY
Not For R
epro
duction

INSEAD 30 4896
Exhibit 13Toy Seller Website Comparison I
Ranked from 1-10 on varying dimensions
FirmOverall
RankingEase of
UseCustomer
ConfidenceOn-Site
ResourcesRelationship
ServicesOverall Cost
1. eToys.com 8.16 8.90 7.78 7.91 8.34 7.942. Amazon.com 7.86 9.01 6.62 8.21 8.08 7.373. KBkids.com 7.69 7.21 8.06 7.27 5.64 10.004. Smarter Kids.com 7.46 7.80 6.91 7.36 7.25 7.955. Toysmart.com 7.21 8.39 7.18 7.65 7.71 5.116. Toys R Us.com 5.23 6.45 5.01 3.87 6.78 4.517. Red Rocket.com 4.92 6.48 5.15 3.67 4.02 5.338. Netoy.com 4.64 6.32 6.45 2.22 1.11 6.929. JC Penney.com 4.05 3.51 3.95 3.75 3.69 5.3210. Service Merchandise 4.04 4.15 4.27 2.27 2.97 6.6311. FAO Schwarz.com 2.80 3.27 4.23 2.75 2.15 1.50Average 5.82 6.50 5.96 5.18 5.25 6.23
Firm Gift BuyerEducational Toy Buyer
Trendy Toy Buyer
Bargain Shopper
1. eToys.com 8.14 7.55 8.03 7.942. Amazon.com 7.99 7.79 7.49 7.373. KBkids.com 8.01 7.60 7.77 10.004. Smarter Kids.com 7.54 8.03 5.16 7.955. Toysmart.com 7.11 7.90 5.08 5.116. Toys R Us.com 5.53 5.95 4.85 4.517. Red Rocket.com 5.14 4.39 4.59 5.338. Netoy.com 5.35 4.23 4.97 6.929. JC Penney.com 4.27 3.98 3.32 5.3210. Service Merchandise 4.16 4.03 2.93 6.6311. FAO Schwarz.com 3.05 2.27 3.23 1.50Average 6.03 5.79 5.22 6.23
FirmSells Leading
BrandsHighlights Top
Sellers Decision SupportAmazon.com yes no yesBrainplay yes no yeseToys yes yes yesFAO Schwartz yes yes noImagine the Challenge no no yesQVC no no noSmartKids yes yes yes
Note: The last column refers to whether or not the site provides product awardsand expert recommendations
Data collected by Gomez Advisors by threemethods• direct examination of the websites• questionnaires• telephone interviews
INSPECTION COPY
Not For Reproduction
INSPECTION COPY
Not For Reproduction

INSEAD 31 4896
Exhibit 14Toy Seller Website Comparison II
Source: Forrester Research.
KBkids.com 13.54 1 11.61 2 9.65 3 6.90 4 7.53 4 9.46 4 58.69 3Amazon.com 9.87 2 11.59 3 11.06 2 9.69 1 9.29 1 11.46 1 62.96 1Toys "R" Us 9.38 3 11.14 4 9.57 4 7.00 3 7.24 5 8.84 5 53.17 4eToys 9.27 4 12.46 1 11.20 1 8.68 2 8.71 2 9.88 2 60.20 2SmarterKids.com 7.42 5 10.10 5 8.12 5 7.67 5 8.55 3 9.79 3 51.65 5
Cost Features Total (unweighted)
Trans-acting
UsabilityCustomer Service
Delivery
Column 1 is “score”, column 2 is “ranking”.
Note: Forrester did not weight variables and provide a total performance measurement. The total here is calculated using the un-weighted variables.
INSPECTION COPY
Not For Reproduction
INSPECTION COPY
Not For Reproduction

INSEAD 32 4896
Exhibit 15Various Potential Success Factors in Online Toy Retailing
• Multiple search options and navigation features: this is especiallyimportant because the target audience is wide: fun for kids butpractical, easy to understand, and informative for parents andgrandparents.
• Sense of affinity and community: as with most of the majorsuccessful website (for kids or adults) there needs to be a sense ofcommunity and belonging, which fosters loyalty.
• Personalised and customised shopping/browsing: tailored to theindividual and tracking the individual's preferences.
• Provision of other links: this can be a source of revenue (receivingpayment for referring customers or for featuring a link), and it canprovide a base from which the customer explores the Internet,returning to the base site for a guide.
• Advertising and promotion for the site: eToys spent over US$20million on advertising in 1998. They paid out 25% of each salesdollar to other Internet site referrals. They ran a TV and print spotthat immediately created a surge in online sales.
• Focus on gifting: many of the online sales will be gifts, potentiallyfrom grandparents or other family members. Including wish lists, giftcertificates, gift search/finders, baby registry and gift wrap will allhelp promote this aspect and make buying easier.
• Multi-channel retailing indicates that there can be a crossover between onlinemarketing and instore sales (and vice-versa).
• Brand name and ‘coolness’: for kids and teens, this is important. The mostpopular sites for kids are all strong brand names in the physical world thatmarket directly to children. All these sites are interactive, providing ways forchildren to browse the products, while also playing, accessing information(ranging from homework help to science programmes), or e-mailing friends.
• Branding the online experience: another factor that studies have focused on isthe online branding. The top children's sites brand the entire onlineexperience, rather than simply extend the physical brand to a new medium.
• Scalability: it is increasingly important for online retailers to be able torespond to the rapid growth and to be able to cope with the demand. This is interms of the database, network and products. In a business where credibilityis of utmost importance, the reliability of the network cannot beoveremphasised.
• Deep information that allows consumers to make comparisons between anycombinations of products. This information should be timely and provided,potentially, by e-mail as well, drawing the consumer back to the site.
• Continuous updates: ensuring the site is up-to-date is not simply amaintenance task but part of the overall strategy … creating a new experiencedaily, and utilising seasonal promotions co-ordinated with the brick andmortar stores.
Source: Literature Searches; The Boston Consulting Group / Shop.org; Forrester Research.
INSPECTION COPY
Not For Reproduction
INSPECTION COPY
Not For Reproduction
INSEAD 33 4896
Copyright 2000 INSEAD, Fontainebleau, France.
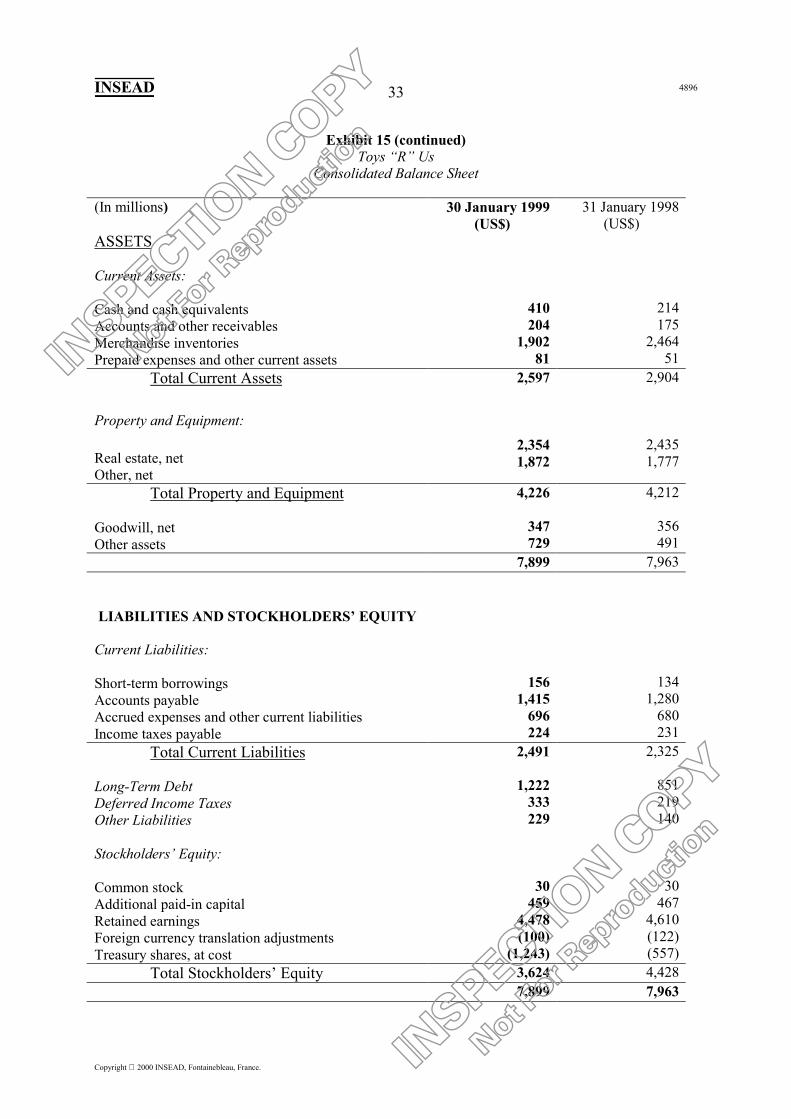
Exhibit 15 (continued)Toys “R” Us
Consolidated Balance Sheet
(In millions) 30 January 1999(US$)
31 January 1998(US$)
ASSETS
Current Assets:
Cash and cash equivalentsAccounts and other receivablesMerchandise inventoriesPrepaid expenses and other current assets
410204
1,90281
214175
2,46451
Total Current Assets
Property and Equipment:
Real estate, netOther, net
2,597
2,3541,872
2,904
2,4351,777
Total Property and Equipment
Goodwill, netOther assets
4,226
347729
4,212
356491
7,899 7,963
LIABILITIES AND STOCKHOLDERS’ EQUITY
Current Liabilities:
Short-term borrowingsAccounts payableAccrued expenses and other current liabilitiesIncome taxes payable
1561,415
696224
1341,280
680231
Total Current Liabilities
Long-Term DebtDeferred Income TaxesOther Liabilities
Stockholders’ Equity:
Common stockAdditional paid-in capitalRetained earningsForeign currency translation adjustmentsTreasury shares, at cost
2,491
1,222333229
30459
4,478(100)
(1,243)
2,325
851219140
30467
4,610(122)(557)
Total Stockholders’ Equity 3,624 4,4287,899 7,963
INSPECTIO
N COPY
Not For R
epro
duction
INSPECTIO
N COPY
Not For R
epro
duction

INSEAD 4896
Copyright 2000 INSEAD, Fontainebleau, France.
34
Exhibit 16Toys “R” Us
Consolidated Statement of Earnings
Year Ended(In millions except per share data) 30 January 1999
(US$)31 January 1998
(US$)1 February 1997
(US$)Net SalesCost of Sales
11,1708,191
11,0387,710
9,9326,892
Gross Profit 2,979 3,328 3,040
Selling, advertising, general and administrative expensesDepreciation, amortization and asset write-offsRestructuring and other charges
2,443255294
2,231253
-
2,020206
60Total Operating Expenses 2,992 2,484 2,286
Operating (Loss)/Income
Interest expenseInterest and other income
(13)
102(9)
844
85(13)
754
98(17)
Interest Expense, Net 93 72 81
(Loss)/Earnings Before Income TaxesIncome Taxes
(106)26
772282
673246
Net (Loss)/Earnings (132) 490 427
Basic (Loss)/Earnings Per Share (0.50) 1.72 1.56Diluted (Loss)/Earnings Per Share (0.50) 1.70 1.54
INSPECTION COPY
Not For Reproduction
INSPECTION COPY
Not For Reproduction

INSEAD 4896
Copyright 2000 INSEAD, Fontainebleau, France.
35
Exhibit 17Toys “R” Us
Store Locations
Locations in the US, as at year-end 1998 Locations outside the US, 1998
Toys Kids Babies Toys Kids BabiesAlabamaAlaskaArizonaArkansasCaliforniaColoradoConnecticutDelawareFloridaGeorgiaHawaiiIdahoIllinoisIndianaIowaKansasKentuckyLouisianaMaineMarylandMassachusettsMichiganMinnesotaMississippiMissouriMontana
81
114
871111
24718
12
3413
858
112
19192512
513
1
1---
23-61
104--
19711--196
132-5-
2-2-82-1
106--52-11113151-3-
NebraskaNevadaNew HampshireNew JerseyNew MexicoNew YorkNorth CarolinaNorth DakotaOhioOklahomaOregonPennsylvaniaRhode IslandSouth CarolinaSouth DakotaTennesseeTexasUtahVermontVirginiaWashingtonWest VirginiaWisconsin
Puerto Rico
345
264
46161
3358
33192
145461
22145
10
4704
1-2
18-
231-
18--
151--293-7--3
-212
-2-7-35-611313-4
131-71--
-113
Australia – 24Austria – 8Belgium – 3Canada – 64Denmark – 10France – 44Germany – 59Hong Kong – 5Indonesia – 3Israel – 5Japan – 76Luxembourg – 1Malaysia - 5
Netherlands – 9Portugal – 6Saudi Arabia – 3Singapore – 4South Africa – 8Spain – 29Sweden – 5Switzerland – 5Taiwan – 6Turkey – 5United ArabEmirates – 4United Kingdom – 61
INSPECTION COPY
Not For Reproduction
INSPECTION COPY
Not For Reproduction

INSEAD 4896
Copyright 2000 INSEAD, Fontainebleau, France.
36
Exhibit 18Value of Toys “R” Us properties and leases
Property and Equipment
Property and equipment are recorded at cost. Depreciation andamortization are provided using the straight-line method over theestimated useful lives of the assets or, where applicable, the terms of therespective leases, whichever is shorter. The company evaluates the needto recognize impairment losses relating to long-lived assets based onseveral factors including, but not limited to, management’s plans forfuture operations, recent operating results and projected cash flows.
Useful Life(in years)
January 30,1999
January 31,1998
LandBuildingsFurniture and equipmentLeaseholds and
leaseholdsimprovementsConstruction in progressLeased property
under capital leases
45-505-20
121/2-35
$ 8291,8421,861
1,21342
27
$ 8171,8491,711
1,15846
29
Less accumulateddepreciation andamortization
5,814
1,588
5,610
1,398
$ 4,226$ 4,212
Leases
The company leases a portion of the real estate used in its operations. Mostleases require the company to pay real estate taxes and other expenses;some require additional amounts based on percentages of sales.
Minimum rental commitments under non-cancelable operating leaseshaving a term of more than one year as of 30 January 1999 are as follows:
Total rent expense, net of sublease income was US$334, US$309 andUS$282 in 1998, 1997 and 1996, respectively.
Grossminimum
rentalsSublease
income
Netminimum
rentals199920002001200220032004 and subsequent
$ 355352346339338
2,964
$ 201815131160
$ 335334331326327
2,904$ 4,694 $ 137 $ 4,557
INSPECTION COPY
Not For Reproduction
INSPECTION COPY
Not For Reproduction
INSEAD 4896
Copyright 2000 INSEAD, Fontainebleau, France.
37
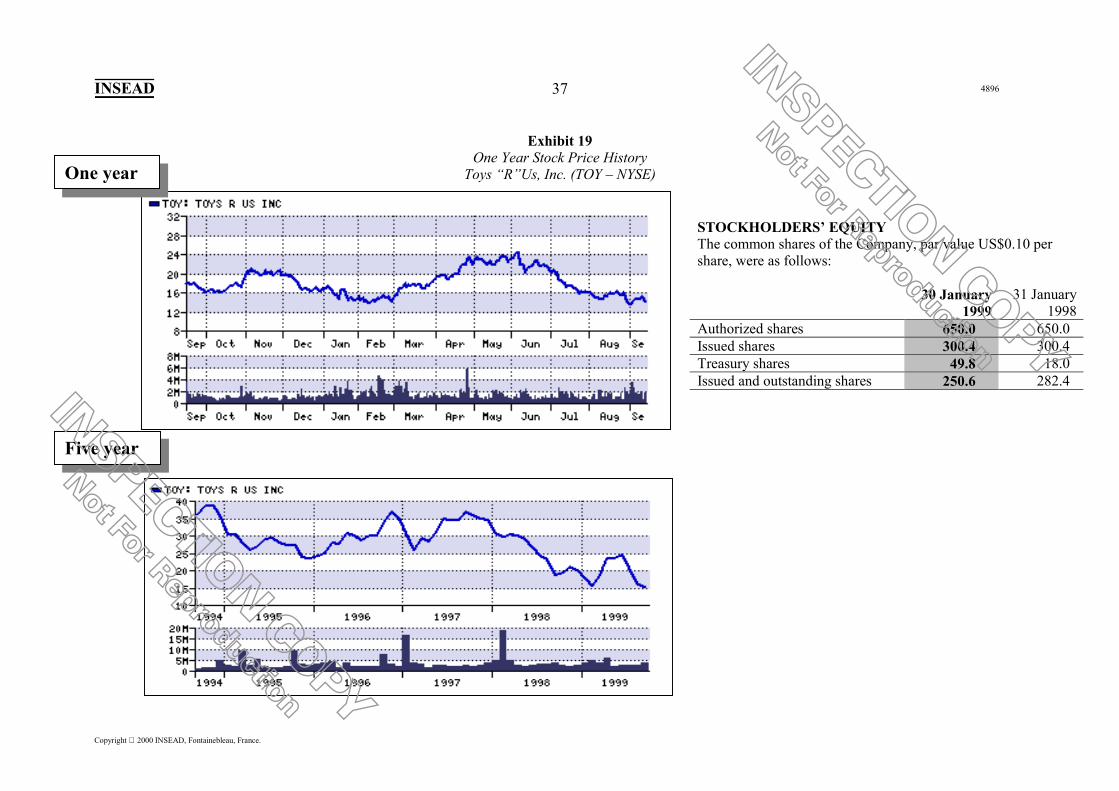
Exhibit 19One Year Stock Price History
Toys “R”Us, Inc. (TOY – NYSE)One year
Five year
STOCKHOLDERS’ EQUITYThe common shares of the Company, par value US$0.10 pershare, were as follows:
30 January1999
31 January1998
Authorized shares 650.0 650.0Issued shares 300.4 300.4Treasury shares 49.8 18.0Issued and outstanding shares 250.6 282.4INSPECTION COPY
Not For Reproduction
INSPECTION COPY
Not For Reproduction

INSEAD 4896
Copyright 2000 INSEAD, Fontainebleau, France.
38
Performance Benchmarks Virtual Channel ofMulti-channel Retailers
Virtual Only Retailers
Traffic & RevenueAnnual Growth Rates(1)
• Unique Visitors• Orders• Revenue
Percent Revenue from Portals
ConversionOrder Conversion Rate (2)
Buyer Conversion Rate (3)
LoyaltyRepeat Buyers % Total Buyers
Marketing & Advertising SpendingMarketing & Advertising % Revenue
Operating MetricsPercent On Time DeliveryCustomer Service Contacts/OrderAverage Service Response Time (days)
315%245%259%18%
3.5%6.1%
26%
52%
94%0.41.1
343%93%
161%31%
0.9%3.0%
17%
90%
91%1.11.4
Exhibit 20Effects on Performance of Multi-channel Retailing vs Virtual-Only
(1) Average annual growth rate based on 1997/98 monthly data; traffic of unique visitors implies that each visitor counted is a different individual;multiple log-ons by the same individual are not considered.
(2) Order conversion rate – orders/total visits.(3) Buyer conversion rate – buyers/unique visitors.
Source: The Boston Consulting Group/shop.org Online Retailer Survey.
INSPECTION COPY
Not For Reproduction
INSPECTION COPY
Not For Reproduction
INSEAD 4896
Copyright 2000 INSEAD, Fontainebleau, France.
39
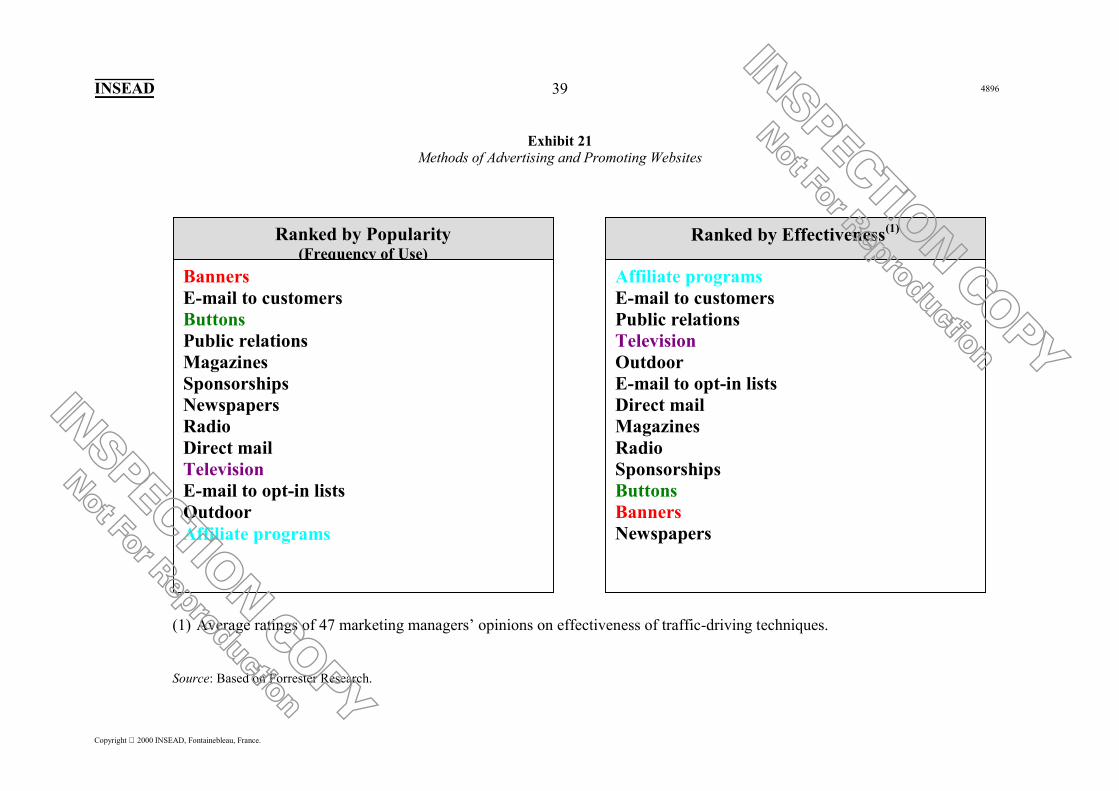
Exhibit 21Methods of Advertising and Promoting Websites
(1) Average ratings of 47 marketing managers’ opinions on effectiveness of traffic-driving techniques.
Source: Based on Forrester Research.
Ranked by Popularity(Frequency of Use)
Ranked by Effectiveness(1)
BannersE-mail to customersButtonsPublic relationsMagazinesSponsorshipsNewspapersRadioDirect mailTelevisionE-mail to opt-in listsOutdoorAffiliate programs
Affiliate programsE-mail to customersPublic relationsTelevisionOutdoorE-mail to opt-in listsDirect mailMagazinesRadioSponsorshipsButtonsBannersNewspapers
INSPECTION COPY
Not For Reproduction
INSPECTION COPY
Not For Reproduction

INSEAD 4896
Copyright 2000 INSEAD, Fontainebleau, France.
40
Exhibit 22Projections for toy sales through the Internet
1996-2002, US$ millions
0
300
600
900
1200
1500
1800
1996 1997 1998 1999 2000 2001 2002
BCGJupiterCommunications
ForresterResearch
Gomez Advisors
Source: Press searches, interviews.
INSPECTION COPY
Not For Reproduction
INSPECTION COPY
Not For Reproduction

Boulevard de Constance, 77305 Fontainebleau Cedex, France
Telephone 33 (0)1 60 72 40 00 Fax 33 (0)1 60 74 55 00/01 www.insead.fr
Printed by INSEAD
Please note that INSEAD does not distribute its case studies directly.INSEAD cases are distributed worldwide by three centres, the details of which are listed below:
The European Case Clearing HouseCranfield UniversityWharley EndBedford MK43 0JRENGLAND
Tel: 44 (0) 1234 750 903Fax: 44 (0) 1234 751 125E-mail: [email protected]
ECCH at Babson Ltd.Babson CollegeBabson ParkWellesley MA 02457USA
Tel: 1 781 239 5884Fax: 1 781 239 5885E-mail: [email protected]
CCMP49 rue de Tocqueville75017 ParisFRANCE
Tel: 33 (0) 1 55 65 64 44Fax: 33 (0) 1 40 54 06 93E-mail: [email protected]* A minimum order of 3 copies is required -
Credit cards are not accepted.
The European Case Clearing House (ECCH) Centrale des Cas et de Médias Pédagogiques*
INSEAD
INSPECTIO
N COPY
Not For R
epro
duction
INSPECTIO
N COPY
Not For R
epro
duction