Embed Size (px)
Citation preview

inquirono. 1 | 2007
The University of Alabama at Birmingham
in
quiro
n
o.1
2007
The U
niversity of Alabam
a at Birm
ingham

Copyright 2007
The rights to the papers published in this work are retained by the authors. Authors may publish their work in any other media, with
the exception of another undergraduate publication.
This is an internal document of the University of Alabama at Birmingham.
Front cover art: Yu-Hui HuangYu-Hui is a senior majoring in biology and art studio.
Back cover art: Kathy BatyKathy Baty is junior majoring in art studio.
from the editor
inquiro no. 1 | 2007
a b o u t inqui ro
Founded and staffed by undergraduate students at the University of Ala-bama at Birmingham, Inquiro is an annual research journal produced as an outlet for the pub-lication of undergraduate scientific research. UAB is an excellent undergraduate research university, and with the addition of a journal such as Inquiro in which to publish their findings, the package is complete. Any undergraduate student at UAB, as well as any student participating in a summer program at the university, is eligible to submit research. The rights to every paper published in In-quiro are retained by the author, leaving each individual free to sub-mit to and publish in a larger national journal or magazine. Students are invited to submit research papers, short re-ports derived from post-ers or research narratives throughout the year.
Inquiro: to search; to know. Curiosity about the natural world has been a defining trait of our species since the beginning of time. Ancient civilizations all over the world developed methods to harness the power of nature and to explain the mysteries of the universe. The human spirit of discovery has survived millennia and flourishes now more than ever before. As we uncover the secrets of the human genome, the laws of modern physics, and the delicate balance of our environment, we embark on unprecedented journeys into the unknown. Furthermore, it is a journey which allows us to escape national borders, age differences, and even language barriers. This journey is for all humanity.
Three years ago, I began this journey for myself. As a sophomore biology major, I knew the basics of genetics, chemistry, and biology, but I never expected that I would have the expertise or knowledge to work on a research project. The day that I began work in UAB’s Department of Nephrology was a day filled with firsts: It was the first time I had seen live cancer cells under a microscope. It was the first time I had measured out a microliter of anything. It was the first time I heard the terms FACS analysis and caspase pathway. As I look back on my days in that lab, I realize how much that experience changed me: I was no longer just a college student; I had become a researcher. I wasn’t just studying biology; I was discovering it!
from the editor
As a senior nearing graduation, research has become one of my passions. Now working in a world-class immunology lab, I am at the forefront of scientific inquiry. This experience is one that I share with many UAB students across the disciplines. From field studies in Antarctica to journeys in outer space, UAB investigators have been recognized on both national and global levels, creating an exciting environment in which to spark the interests of undergraduates.
UAB, more than any other institution in the state, encourages students to participate in research, and students are certainly re-sponding. Each year, dozens of undergraduates begin working in research labs, with goals of an honors thesis, practical experience, or even a part-time job. Given the difficulty and quality of work that our undergraduates produce, it only makes sense that these students should be given an outlet in which to feature their efforts. Although many university departments hold research symposiums throughout the year, it is rare for students to have the opportunity to display their work before peers and faculty from other disciplines, as well as to the university community as a whole. In light of this need, Inquiro was born.
While undergraduates may work in labs for a few semesters or a summer, it is unusual for students to publish their work in inter-nationally peer-reviewed journals, simply due to time constraints. This journal gives students the chance to experience the process of writing and preparing a research paper for publication. While the journal isn’t “peer reviewed” in its purest sense, each paper is re-viewed by at least one faculty member, so that students get a feel for submission and revision process.
The concept of the undergraduate journal has previously been embraced by other universities such as Harvard, Columbia, and Yale. With the inauguration of Inquiro, UAB students now have the opportunity ascend to the undergraduate publishing ranks with the best and brightest students in the nation. Please join us as we blaze the trail for the future of undergraduate research at the University of Alabama at Birmingham!
—Suzanne McCluskeyFounding Editor
inqui ro s t a f f
Founding Editor Suzanne McCluskey
Layout/Design Editors
Jaymee Smith
Taylor Nelson
Matt Morton
Staff Writers
Alex Vaughn
Larry Lawal
Christina Ho
Basil Bakir
Felix Kishinevsky
Kelci Burckhardt
Shalini Vaid
Michael Lester
Pratik Talati
L e t t e r f r o m t h e F o u n d i n g E d i t o r 1
S c i e n c e N e w s 5
R e s e a r c h E t h i c s 8
R e s e a r c h N a r r a t i v e 1 0
Shor t Rep or t sP h o t o c a t a l y t i c D e g r a d a t i o n o f I n d u s t r i a l D y e s i n U V - i r r a d i a t e d S u s p e n s i o n s o f T i t a n i a C o a t e d G l a s s M i c r o b a l l o o n s 1 2
I d e n t i f i c a t i o n o f P r o t e i n s t h a t P h y s i c a l l y I n t e r a c t w i t h t h e C e l l Cy c l e R e g u l a t e d U b i q u i t i n L i g a s e G 2 E 3 1 7
S e x R a t i o s P r o d u c e d i n t h e K e m p ’s R i d l e y R e c o v e r y P r o g r a m 2 0
I n t r a - a n d I n t e r - H e m i s p h e r i c S t r o o p E f f e c t s 2 3
H i s t o l o g i c a l E v a l u a t i o n o f H a t c h l i n g S e x R a t i o s o f H a w a i i a n G r e e n S e a Tu r t l e s 2 7
Bio lo gyF a c u l t y I n t e r v i e w : I n t o t h e A n t a r c t i c w i t h D r. C h a r l e s A m s l e r a n d D r. J a m e s M c C l i n t o c k 3 2
P a p e r s H G F I s R e l e a s e d B y I s c h e m i c R e n a l T i s s u e 3 6
Te s t - R e t e s t R e l i a b i l i t y o f C o m p u t e r i z e d D y n a m i c P o s t u r o g r a p h y i n C h i l d r e n W i t h a n d W i t h o u t C e r e b r a l P a l s y 4 0
P r o t e i n E x p r e s s i o n a n d M e t h y l a t i o n P a t t e r n s i n R e s p o n s e t o G l u c o s e D e p l e t i o n i n M C F - 7 C e l l s 4 7
inquiro no. 1 | 2007
contents
D e t e r m i n i n g t h e S e c o n d V i r i a l C o e f f i c i e n t ( B 2 2) b y S e l f - I n t e r a c t i o n C h r o m a t o g r a p h y ( S I C ) 5 0
F a c u l t y I n t e r v i e w : D r. L a r r y D e L u c a s : T h e F i r s t O p t o m e t r i s t i n S p a c e 5 5
Chemis t r yF a c u l t y I n t e r v i e w : Tr a c y H a m i l t o n : C h e m i s t r y ’s v e r y o w n R e n a i s s a n c e M a n 5 7
P a p e r s A M o n t e C a r l o I n v e s t i g a t i o n o f D N A S e p a r a t i o n i n t h e E n t r o p i c Tr a p D e v i c e 5 9
S t r u c t u r a l C h a r a c t e r i z a t i o n o f B a c i l l u s a n t h r a c i s N A D + S y n t h e t a s e b y L i m i t e d P r o t e o l y s i s 6 4
S t u d e n t F e a t u r e : S o n j a B r o o k s : G o l d w a t e r S c h o l a r 7 6
Math
P a p e r E x p l o r i n g t h e Va r i a n c e o f t h e S q u a r e R o o t o f a P o i s s o n R a n d o m Va r i a b l e 7 7
Phys i c s Fa c u l t y I n t e r v i e w : A n I n t e r v i e w w i t h D r. R e n a t o C a m a t a 8 0
A b o u t t h e s t a f f 8 3
A c k n o w l e d g m e n t s 8 7
S u b m i s s i o n G u i d e l i n e s f o r 2 0 0 8 8 8
inquiro no. 1 | 2007
contents
science news
Women’s Wage in Academia A study published in Academic Medicine suggests that wage discrimination in science can be corrected by aggressive administration intervention. The study, carried out in the University of Arizona’s School of Medicine, shows that wages of women scientists with doctorates in basic sciences went from 89% of their male counterparts to 97.6% after corrective action by the University admin-istration. The study relied on actual salary records instead of surveys. This, the authors argue, makes the study more reliable than past ones.
US Postdocs Stuggle to Find Faculty Slots Postdocs in the life sciences are struggling to move up in the academic hierarchy as they find that tenured faculty slots at major research institutions are staying static even as the number of Ph.D’s in the life sciences are increasing. In 2007, nearly 7,000 Ph.D’s were graduated by American universities, but the number of Ph.D’s in the life sciences with tenure stayed steady at 20,000 —the same number as there were in 1981. This equates to a drop in tenured Ph.D’s in the life sciences from 45% in 1981 to 30% to-day. Analysts credit this trend to an increase in federal funding for biomedical research, which has been focused toward creating infrastructure and not toward faculty.
Fabled “Arctic Passage” Not so Mythical Climate change is causing increased loss of ice mass in the northern waters of Canada. Analysts say this new passage may eventually be a major route for world-wide trade. Canadian claims to these waters, however, are not recognized by other nations.
Largest Academic Conference Held in San Diego The Society for Neuroscience annual meeting took place this November in San Diego. This conference, the largest academic conference held in any academic discipline, welcomed over 25,000 attendees.
Merck HIV Vaccine Fails A clinical trial of a new HIV vaccine being run by Merck re-cently failed, causing the pharmaceutical gi-ant to halt testing. Merck hoped the vaccine would stimulate native immunity against HIV by the introduction of three synthetic HIV genes through a combination of three weakened strains of adenoviruses, a large, unenveloped double-stranded viral family. The trial tested the vaccine on a population of approximately 700 people at high risk for HIV transmission. Both the comparison and experimental groups experienced the same rate of HIV infection and the experimental group tested for similar levels of bloodborne HIV as did the comparison group.
Women’s Wages, Postdoc Woes, and Fabled Arctic Passage Opens in Northern Canadian Waters
Basil Bakir
inquiro | the university of alabama at birmingham 5
science news
6 inquiro | no. 1 | 2007
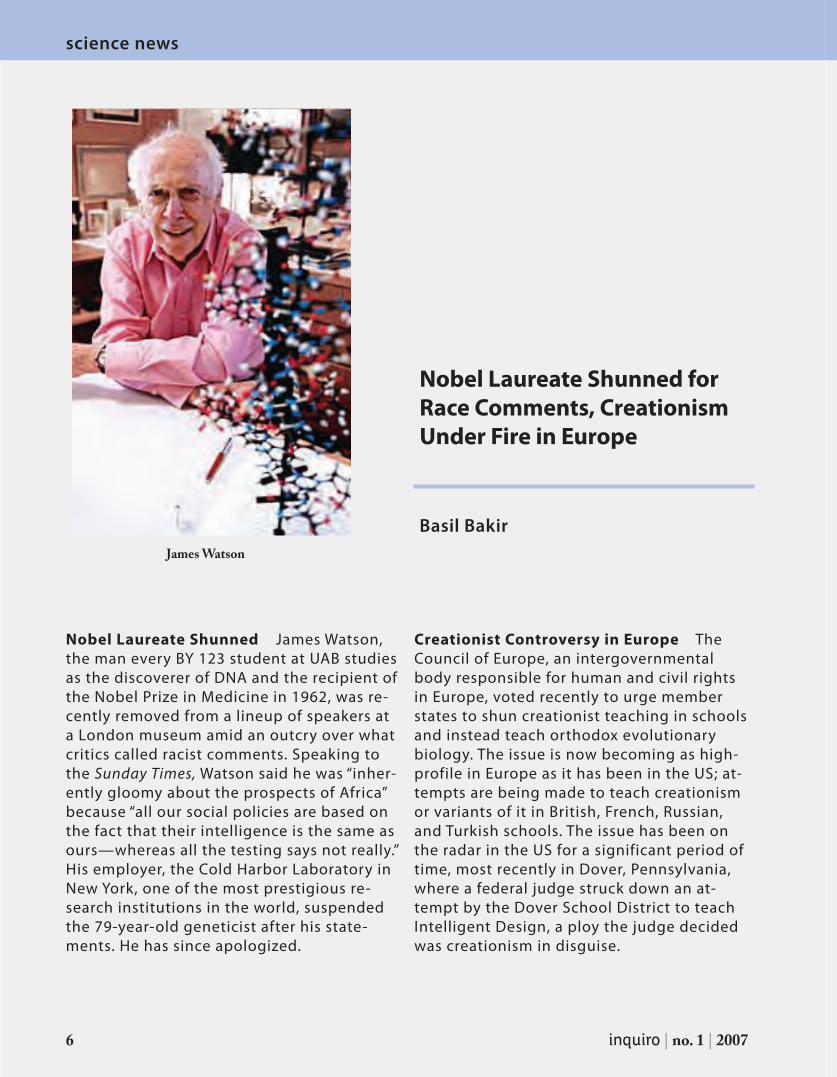
Nobel Laureate Shunned James Watson, the man every BY 123 student at UAB studies as the discoverer of DNA and the recipient of the Nobel Prize in Medicine in 1962, was re-cently removed from a lineup of speakers at a London museum amid an outcry over what critics called racist comments. Speaking to the Sunday Times, Watson said he was “inher-ently gloomy about the prospects of Africa” because “all our social policies are based on the fact that their intelligence is the same as ours—whereas all the testing says not really.” His employer, the Cold Harbor Laboratory in New York, one of the most prestigious re-search institutions in the world, suspended the 79-year-old geneticist after his state-ments. He has since apologized.
Creationist Controversy in Europe The Council of Europe, an intergovernmental body responsible for human and civil rights in Europe, voted recently to urge member states to shun creationist teaching in schools and instead teach orthodox evolutionary biology. The issue is now becoming as high-profile in Europe as it has been in the US; at-tempts are being made to teach creationism or variants of it in British, French, Russian, and Turkish schools. The issue has been on the radar in the US for a significant period of time, most recently in Dover, Pennsylvania, where a federal judge struck down an at-tempt by the Dover School District to teach Intelligent Design, a ploy the judge decided was creationism in disguise.
Nobel Laureate Shunned for Race Comments, Creationism Under Fire in Europe
Basil BakirJames Watson
science news
science news
physicists think endows all other particles with their mass.
Accused South Korean Stem Cell Scien-tist may be Working Again South Korean scientist Woo Suk Hwang, who in 2004 was found to have fabricated data that said hehad managed to create embryonic stem cells, may be working again in Thailand, ac-cording to reports published by Nature in September. The magazine said that a South Korean fertility expert claimed that Hwang and his colleagues had gone to Thailand to continue their work in the hope they could have more latitude in the country’s more re-laxed regulatory atmosphere. Hwang, who lost his license to work with human eggs, is on trial in South Korea for fraud and ethics violations.
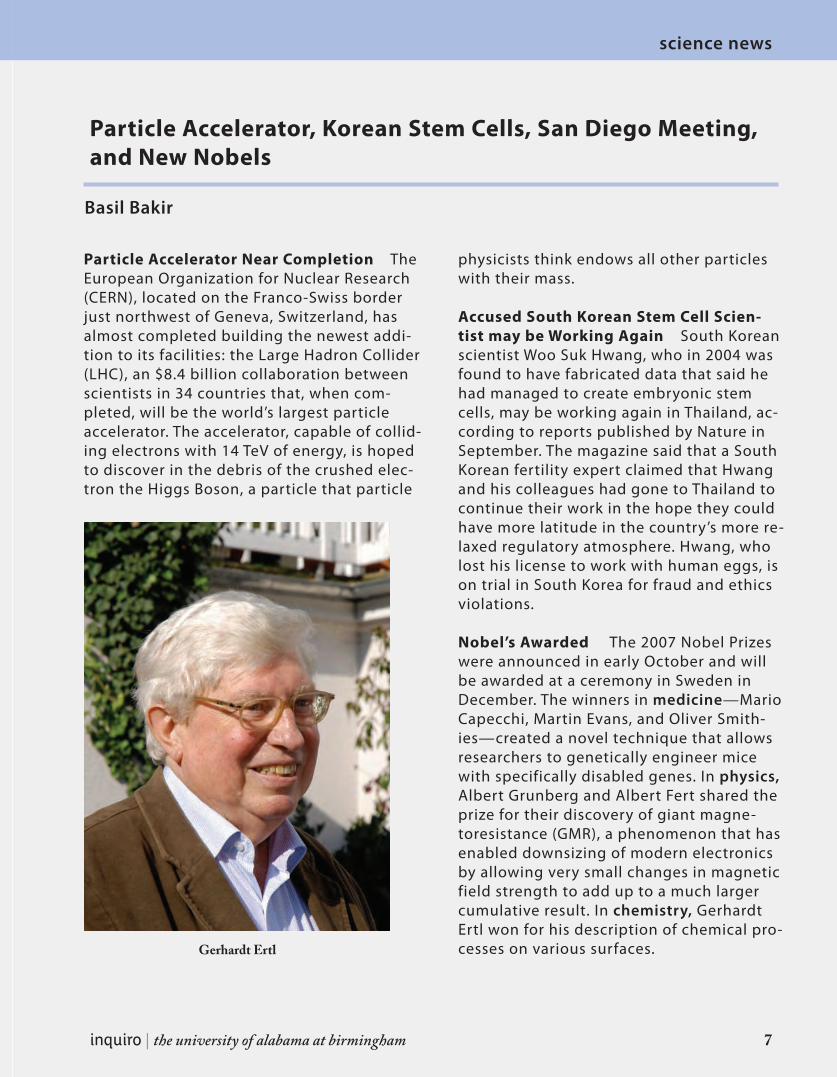
Nobel’s Awarded The 2007 Nobel Prizes were announced in early October and will be awarded at a ceremony in Sweden in December. The winners in medicine—Mario Capecchi, Martin Evans, and Oliver Smith-ies—created a novel technique that allows researchers to genetically engineer mice with specifically disabled genes. In physics, Albert Grunberg and Albert Fert shared the prize for their discovery of giant magne-toresistance (GMR), a phenomenon that has enabled downsizing of modern electronics by allowing very small changes in magnetic field strength to add up to a much larger cumulative result. In chemistry, Gerhardt Ertl won for his description of chemical pro-cesses on various surfaces.
Particle Accelerator Near Completion The European Organization for Nuclear Research (CERN), located on the Franco-Swiss border just northwest of Geneva, Switzerland, has almost completed building the newest addi-tion to its facilities: the Large Hadron Collider (LHC), an $8.4 billion collaboration between scientists in 34 countries that, when com-pleted, will be the world’s largest particle accelerator. The accelerator, capable of collid-ing electrons with 14 TeV of energy, is hoped to discover in the debris of the crushed elec-tron the Higgs Boson, a particle that particle
Particle Accelerator, Korean Stem Cells, San Diego Meeting, and New Nobels
Basil Bakir
Gerhardt Ertl
science news
inquiro | the university of alabama at birmingham 7
8 inquiro | no. 1 | 2007
research ethics
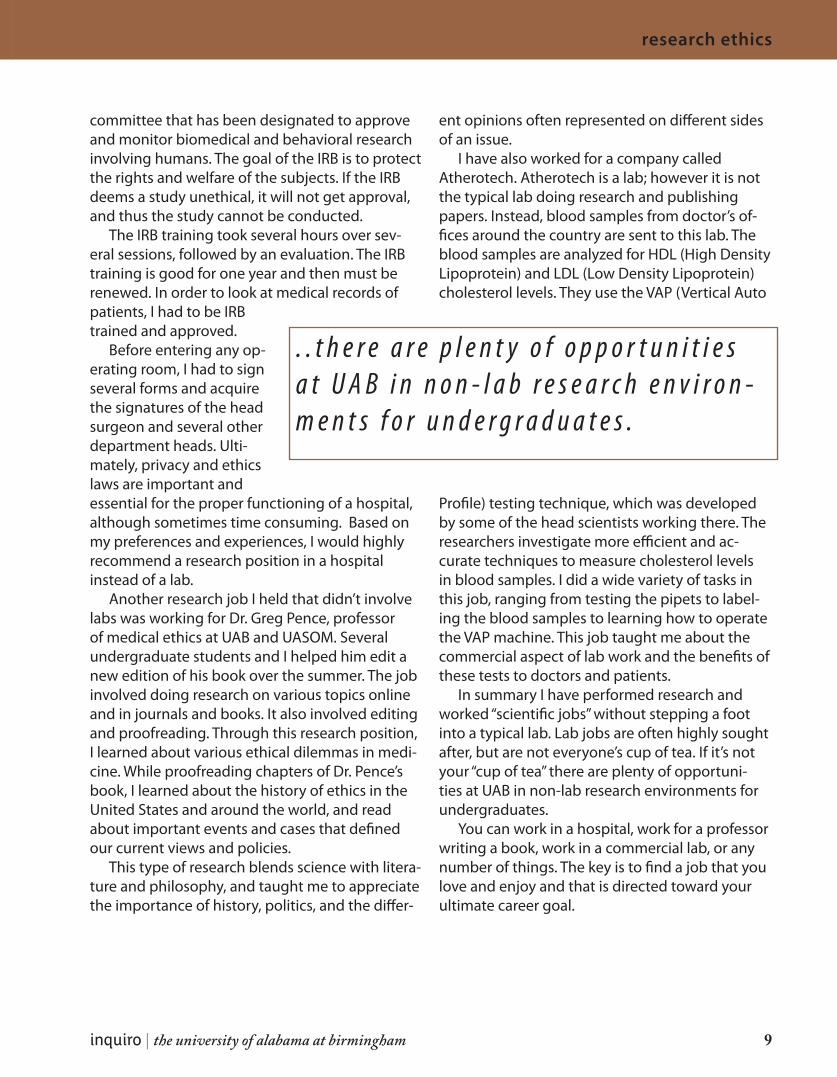
When you think of a research job as an under-graduate, what comes to mind? Probably some type of work in a lab right? When I think of a research job, I see a student working in a lab performing gel electrophoresis, running PCRs, working with mice, growing bacteria, treating cells with genes, preparing solutions, washing test tubes, or looking into microscopes. For some reason, I just couldn’t see myself doing any of those things. So, this past summer I was deter-mined to find a research job that did not involve work in a lab. I was determined to do something different.
Since I want to be a doctor, I found a job work-ing for a doctor. I wanted a chance to be around doctors and hospitals and learn more about the field I hope to enter into one day. Normally, undergraduate students shadow doctors to learn more about what they do and what a typical day in their job is like. I wanted to find a way to work with a doctor and not just shadow. So I found a job with a pediatric general surgeon at Children’s Hospital as a research assistant for the papers he writes.
I did spend the first few weeks shadowing in the operating room. But then I began working in earnest as a research assistant, reviewing medical records and operative notes, obtaining informa-tion, and then entering data into a database for analysis. I learned a lot about various surgical procedures and have become much more aware of conditions and diseases prevalent among children.
The job also gives me a chance to familiar-ize myself with medical terminology and paper development. The surgeons and the nurses write papers on the effectiveness of procedures, the longevity of implantable devices they surgically place in the patients, and these papers are pre-sented at conferences or are published in journals for other surgeons and doctors to disseminate their knowledge and experience to colleagues.
A major challenge working in healthcare is accomodating privacy laws. The U.S. Department of Health and Human Services issued the Privacy Rule to implement the requirement of the Health Insurance Portability and Accountability Act of 1996 (HIPAA). The Privacy Rule discusses the use and disclosure of a person’s health information. It also addresses the individual’s right to privacy and controls how health information can be used. The Privacy Rule aims to protect information but still allow health information to be accessed when needed in order to promote better health care and protect the health of the general public.
For example, if using the medical information of certain patients in a study can benefit what is understood about medicine and could benefit other patients, then this information is allowed to be used. Before I began my job as a research as-sistant for the Division of Pediatric Surgery, I had to complete an IRB training program. The IRB is the Institutional Review Board which is an ethics
Not Your Typical Lab Job
Shalini Vaid
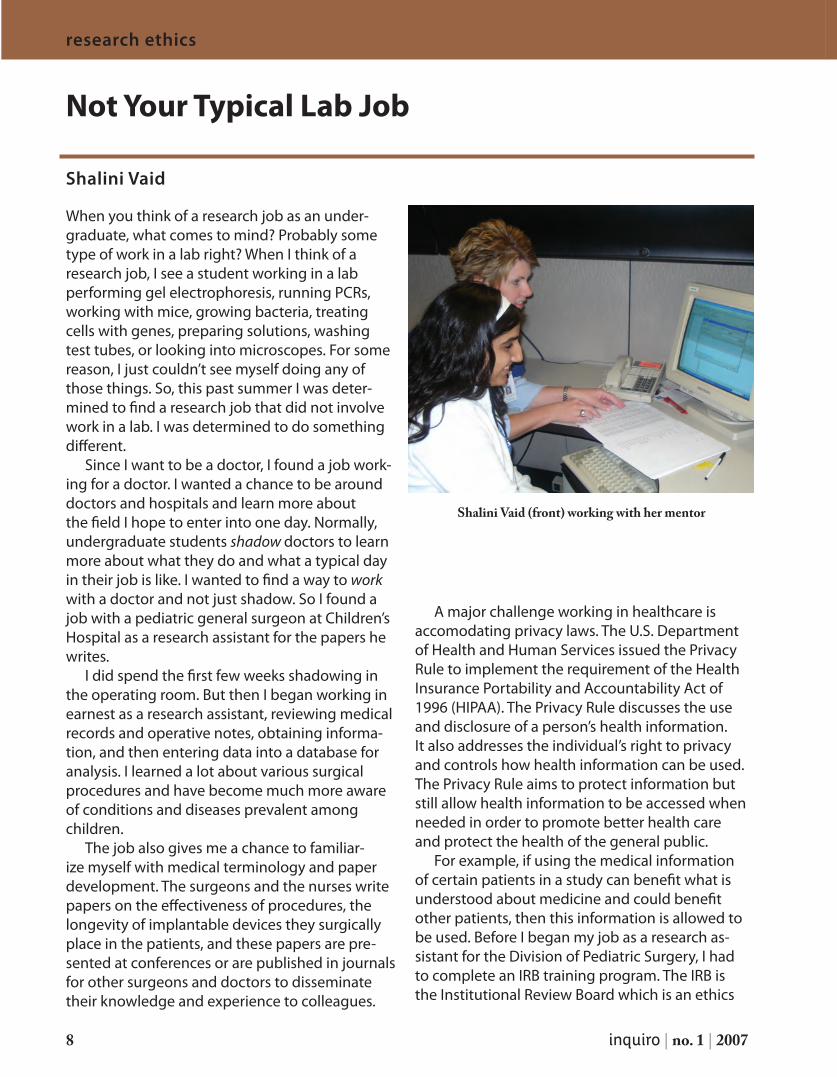
Shalini Vaid (front) working with her mentor
inquiro | the university of alabama at birmingham 9
research ethics
committee that has been designated to approve and monitor biomedical and behavioral research involving humans. The goal of the IRB is to protect the rights and welfare of the subjects. If the IRB deems a study unethical, it will not get approval, and thus the study cannot be conducted.
The IRB training took several hours over sev-eral sessions, followed by an evaluation. The IRB training is good for one year and then must be renewed. In order to look at medical records of patients, I had to be IRB trained and approved.
Before entering any op-erating room, I had to sign several forms and acquire the signatures of the head surgeon and several other department heads. Ulti-mately, privacy and ethics laws are important and essential for the proper functioning of a hospital, although sometimes time consuming. Based on my preferences and experiences, I would highly recommend a research position in a hospital instead of a lab.
Another research job I held that didn’t involve labs was working for Dr. Greg Pence, professor of medical ethics at UAB and UASOM. Several undergraduate students and I helped him edit a new edition of his book over the summer. The job involved doing research on various topics online and in journals and books. It also involved editing and proofreading. Through this research position, I learned about various ethical dilemmas in medi-cine. While proofreading chapters of Dr. Pence’s book, I learned about the history of ethics in the United States and around the world, and read about important events and cases that defined our current views and policies.
This type of research blends science with litera-ture and philosophy, and taught me to appreciate the importance of history, politics, and the differ-
ent opinions often represented on different sides of an issue.
I have also worked for a company called Atherotech. Atherotech is a lab; however it is not the typical lab doing research and publishing papers. Instead, blood samples from doctor’s of-fices around the country are sent to this lab. The blood samples are analyzed for HDL (High Density Lipoprotein) and LDL (Low Density Lipoprotein) cholesterol levels. They use the VAP (Vertical Auto
Profile) testing technique, which was developed by some of the head scientists working there. The researchers investigate more efficient and ac-curate techniques to measure cholesterol levels in blood samples. I did a wide variety of tasks in this job, ranging from testing the pipets to label-ing the blood samples to learning how to operate the VAP machine. This job taught me about the commercial aspect of lab work and the benefits of these tests to doctors and patients.
In summary I have performed research and worked “scientific jobs” without stepping a foot into a typical lab. Lab jobs are often highly sought after, but are not everyone’s cup of tea. If it’s not your “cup of tea” there are plenty of opportuni-ties at UAB in non-lab research environments for undergraduates.
You can work in a hospital, work for a professor writing a book, work in a commercial lab, or any number of things. The key is to find a job that you love and enjoy and that is directed toward your ultimate career goal.
. . t h e r e a r e p l e n t y o f o p p o r t u n i t i e s a t U A B i n n o n - l a b r e s e a r c h e n v i r o n -m e n t s f o r u n d e r g r a d u a t e s .
10 inquiro | no. 1 | 2007
research narrative
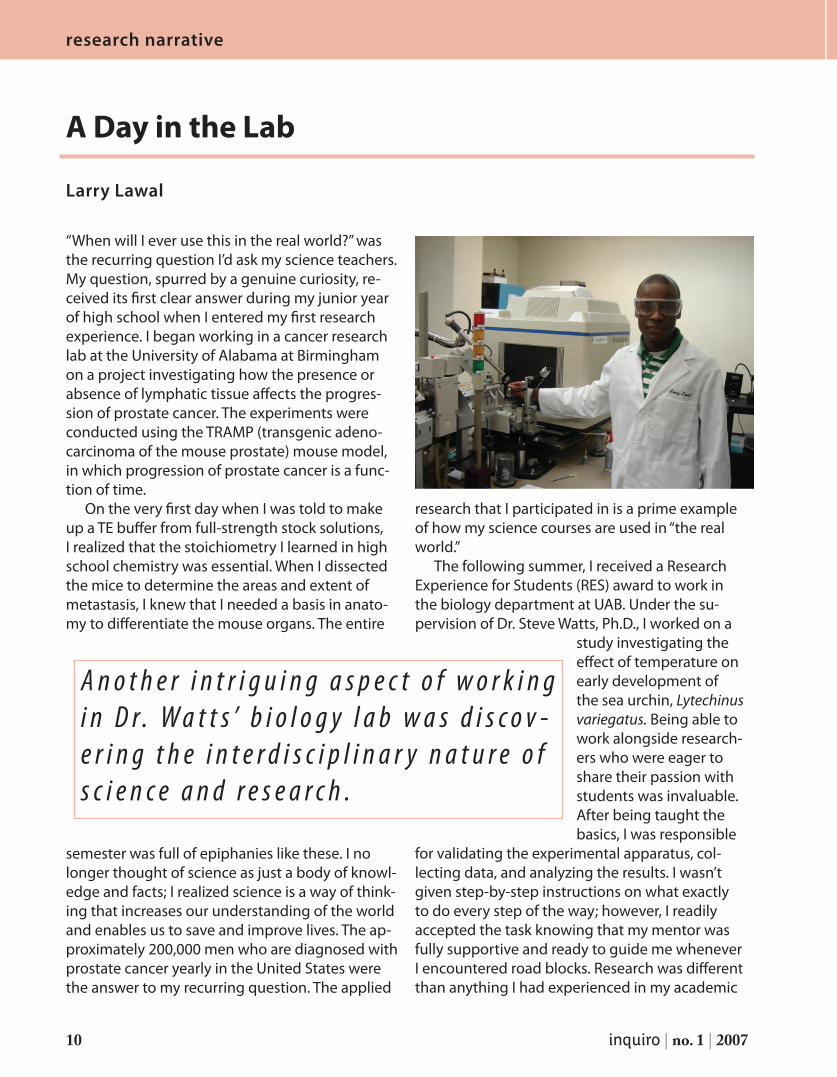
“When will I ever use this in the real world?” was the recurring question I’d ask my science teachers. My question, spurred by a genuine curiosity, re-ceived its first clear answer during my junior year of high school when I entered my first research experience. I began working in a cancer research lab at the University of Alabama at Birmingham on a project investigating how the presence or absence of lymphatic tissue affects the progres-sion of prostate cancer. The experiments were conducted using the TRAMP (transgenic adeno-carcinoma of the mouse prostate) mouse model, in which progression of prostate cancer is a func-tion of time.
On the very first day when I was told to make up a TE buffer from full-strength stock solutions, I realized that the stoichiometry I learned in high school chemistry was essential. When I dissected the mice to determine the areas and extent of metastasis, I knew that I needed a basis in anato-my to differentiate the mouse organs. The entire
semester was full of epiphanies like these. I no longer thought of science as just a body of knowl-edge and facts; I realized science is a way of think-ing that increases our understanding of the world and enables us to save and improve lives. The ap-proximately 200,000 men who are diagnosed with prostate cancer yearly in the United States were the answer to my recurring question. The applied
research that I participated in is a prime example of how my science courses are used in “the real world.”
The following summer, I received a Research Experience for Students (RES) award to work in the biology department at UAB. Under the su-pervision of Dr. Steve Watts, Ph.D., I worked on a
study investigating the effect of temperature on early development of the sea urchin, Lytechinus variegatus. Being able to work alongside research-ers who were eager to share their passion with students was invaluable. After being taught the basics, I was responsible
for validating the experimental apparatus, col-lecting data, and analyzing the results. I wasn’t given step-by-step instructions on what exactly to do every step of the way; however, I readily accepted the task knowing that my mentor was fully supportive and ready to guide me whenever I encountered road blocks. Research was different than anything I had experienced in my academic
A Day in the Lab
Larry Lawal
A n o t h e r i n t r i g u i n g a s p e c t o f w o r k i n g i n D r. W a t t s ’ b i o l o g y l a b w a s d i s c o v -e r i n g t h e i n t e r d i s c i p l i n a r y n a t u r e o f s c i e n c e a n d r e s e a r c h .
inquiro | the university of alabama at birmingham 11
research narrative
career until that point. Working in the lab required me to think independently and that, to me, is the most attractive part of research.
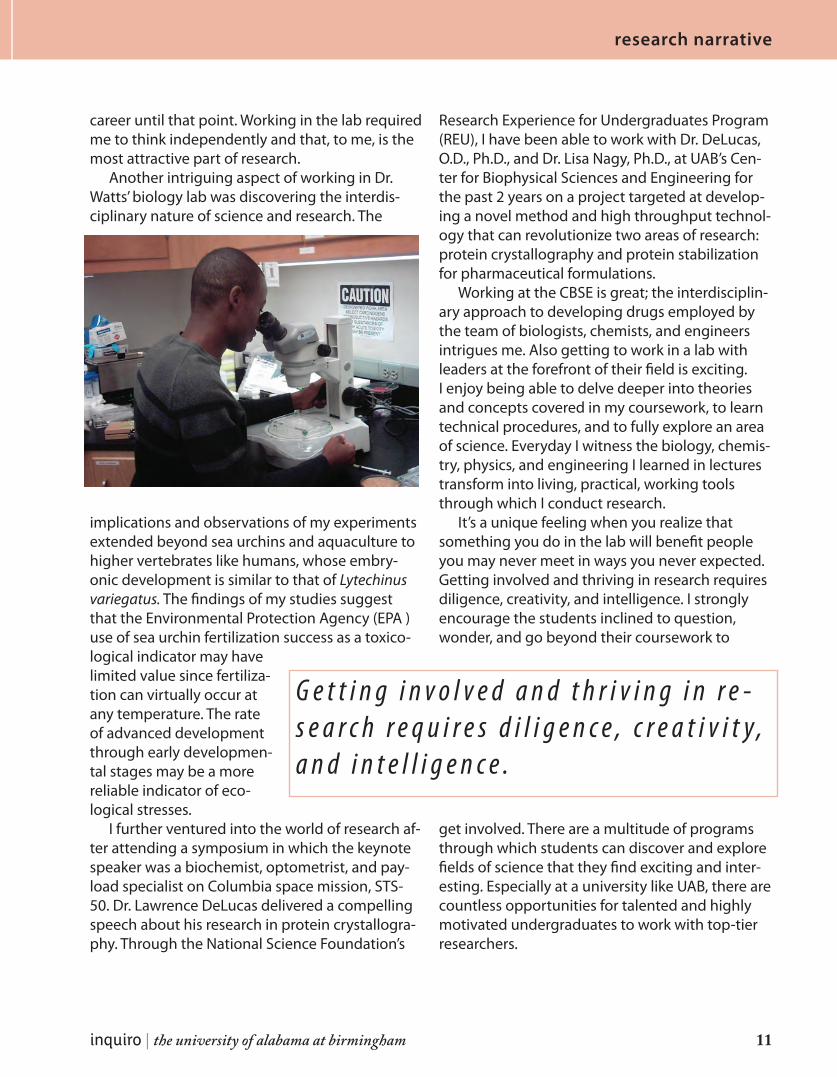
Another intriguing aspect of working in Dr. Watts’ biology lab was discovering the interdis-ciplinary nature of science and research. The
implications and observations of my experiments extended beyond sea urchins and aquaculture to higher vertebrates like humans, whose embry-onic development is similar to that of Lytechinus variegatus. The findings of my studies suggest that the Environmental Protection Agency (EPA )use of sea urchin fertilization success as a toxico-logical indicator may have limited value since fertiliza-tion can virtually occur at any temperature. The rate of advanced development through early developmen-tal stages may be a more reliable indicator of eco-logical stresses.
I further ventured into the world of research af-ter attending a symposium in which the keynote speaker was a biochemist, optometrist, and pay-load specialist on Columbia space mission, STS-50. Dr. Lawrence DeLucas delivered a compelling speech about his research in protein crystallogra-phy. Through the National Science Foundation’s
Research Experience for Undergraduates Program (REU), I have been able to work with Dr. DeLucas, O.D., Ph.D., and Dr. Lisa Nagy, Ph.D., at UAB’s Cen-ter for Biophysical Sciences and Engineering for the past 2 years on a project targeted at develop-ing a novel method and high throughput technol-ogy that can revolutionize two areas of research: protein crystallography and protein stabilization for pharmaceutical formulations.
Working at the CBSE is great; the interdisciplin-ary approach to developing drugs employed by the team of biologists, chemists, and engineers intrigues me. Also getting to work in a lab with leaders at the forefront of their field is exciting. I enjoy being able to delve deeper into theories and concepts covered in my coursework, to learn technical procedures, and to fully explore an area of science. Everyday I witness the biology, chemis-try, physics, and engineering I learned in lectures transform into living, practical, working tools through which I conduct research.
It’s a unique feeling when you realize that something you do in the lab will benefit people you may never meet in ways you never expected. Getting involved and thriving in research requires diligence, creativity, and intelligence. I strongly encourage the students inclined to question, wonder, and go beyond their coursework to
get involved. There are a multitude of programs through which students can discover and explore fields of science that they find exciting and inter-esting. Especially at a university like UAB, there are countless opportunities for talented and highly motivated undergraduates to work with top-tier researchers.
G e t t i n g i n v o l v e d a n d t h r i v i n g i n r e -s e a r c h r e q u i r e s d i l i g e n c e , c r e a t i v i t y , a n d i n t e l l i g e n c e .
12 inquiro | no. 1 | 2007
short reports
Photocatalytic Degradation of Industrial Dyes in UV-irradiated Suspensions of Titania-Coated Glass Microballoons
INTRODUCTION
Wastewater produced from the textile industry is distin-guished by the presence of color from various dyes. In fact, every day about 400 tons of dyes are discarded as waste from various industries world wide (Moreira et al., 2005). As a result of this aesthetically displeasing colorful effluent, the pol-lution produced is readily noted (Byrappa et al., 2006). There-fore, there is interest in discovering techniques to degrade this colored wastewater to comply with United States wastewater discharge permits (NPDES) before it causes harmful envi-ronmental effects (Garcia-Maontano et al., 2005) such as worsening the quality and reducing the gas solubility of water systems (Asad et al. 2006). In order to break down organic contaminants such as textile dyes, techniques of photocatalytic degradation using titania (TiO2) as a catalyst have been suc-cessfully applied in previous studies such as those performed by Akarsu et al. (2006) and Lachheb et al. (2002). TiO2 exists
in three different forms: anatase, brookite, and rutile. Among these three polymorph forms, anatase-TiO2 has gained the most attention due to its successful use as a catalyst (Akarsu et al., 2006). In the presence of ultraviolet (UV) light, titania, acting as a photocatalyst, is activated, leading to the oxidation of organic material through the excitation of an electron from its valence band to the conduction band. This process results in positively charged holes in the valence band which are able to oxidize organic compounds (Ren et al., 2006). Azo dyes, such as Procion Red MX-5B and Reactive Green H-E4BD, are synthetic dyes widely used in the textile industry. This type of textile dye has created a particular problem in the environment due to the stability of its molecular structures and its resulting resistance to many different standard techniques of degrada-tion (So et al., 2002).
Glass microballoons (GMBs) often have density values below 1.0 g/cm3, the density of water, and are used in syn-tactic foam composites for a variety of applications. GMBs
Kristen E. Kerr, M.L. Jones, M. Koopman, K.K. Chawla, W. Ricci, M. Lalor
The photocatalytic degradation of two common dyes used in the textile industry, PRO Forest Green H-Reactive H-E4BD (initial concentration: 0.0918 g/L of distilled water) and Procion Red MX-5B (initial concentration: 0.0227 g/L of distilled water) was examined through the introduction of titania (TiO2)-coated glass microballoons (GMBs) into the dye solutions. Under solar ultraviolet (UV) radiation, the degradation of the dye solutions was monitored both qualitatively, through observation and photography, and quantita-tively, through spectrophotometry analysis, comparing values to a control sample of dye solution also exposed to solar UV radiation but without titania-coated GMBs. The pho-todegradation experiments were carried out using one of two different forms of agita-tion: an aeration bubbler apparatus and a magnetic stirrer plate. The relative success of each of the two forms of agitation and their effect on the photocatalytic capabilities of titania-coated GMBs was used for comparison. The following results of the two samples agititated using the magnetic stirrer were observed: after 2 h, 30 min of UV exposure the PRO Forest Green H-Reactive H-E4BD dye sample was clear in appearance and had an ab-sorbance of 0 at 630 nm, and after 3 h of UV exposure the Procion Red MX-5B dye sample also appeared clear and had an absorbance of 0.006 at 510 nm. After 6 h and 10 min of UV exposure and agitation using the aeration bubbler apparatus, the PRO Forest Green H-Reactive H-E4BD dye sample had an absorbance of 0.345 at 630 nm, and the Procion Red MX-5B dye sample had an absorbance of 0.030 at 510 nm. Both of the dye samples appeared lighter in color in comparison to their respective initial concentrations. Scan-ning electron microscopy (SEM) showed that the titania coatings on the GMBs were more affected by the magnetic stirrer than by the aeration bubbler apparatus.
inquiro | the university of alabama at birmingham 13
short reports
can be coated with various materials, such as titania, and thus, have a range of potential uses (Koopman et al., 2003). As a result of the photocatalytic properties of titania, titania-coated GMBs are candidate materials in the treatment of wastewater produced by the textile industry by breaking down the dye, and therefore its color, in the polluted effluent. Furthermore, by using HGMs as a medium for bearing titania, both the recovery and reuse of this photocatalyst is made possible.
MATERIALS AND METHODS
Two commercially used textile azo dyes were obtained. One of the dyes, Procion Red MX-5B, was purchased from Sigma-Aldrich Co., and the other dye, PRO Forest Green H-Reactive H-E4BD was purchased from Pro Chemical and Dye. Stock solutions were prepared using distilled water. Tita-nia-coated HGMs were obtained from Trelleborg Emerson & Cuming, Inc. The HGMs had a true particle density (TPD) of 0.38 g/cm3 without the titania coating and a TPD of 0.44 g/cm3 after the titania coating had been added.
50 mL of PRO Forest Green H-Reactive H-E4BD dye with a concentration of 0.0918 g/L of distilled water was placed into 4 different beakers. Two of the beakers contained no GMBs and served as controls; one of these beakers was placed under solar UV-radiation, and one was placed in dark conditions. The third beaker contained 1.0605 g of titania-coated GMBs, was placed under solar UV-radiation, and was agitated using an aeration bubbler apparatus. The fourth bea-ker contained 1.0604 g of titania-coated GMBs, was placed under solar UV-radiation, and was agitated using a magnetic stirring plate.
Then, 50 mL of Procion Red MX-5B dye with a con-
centration of 0.0227 g/L of distilled water was placed into 4 separate beakers. The two controls mimicked the previous experiment. The third beaker containing 1.0641 g of titania-coated GMBs was placed under solar UV-radiation, and agi-tated using an aeration bubbler apparatus. The fourth beaker contained 1.0645 g of titania-coated GMBs, was placed under solar UV-radiation, and was agitated using a magnetic stirring plate.
For both the dye experiments, samples were taken after various intervals of UV-exposure, centrifuged using an IEC Clinical Centrifuge to isolate the dye solution from any suspended GMBs, and then evaluated using a Cary 100 UV-Visible Spectrophotometer. Additionally, scanning electron microscopy (SEM) was used to analyze the effects of agitation on the titania coatings of the HGMs.
RESULTS
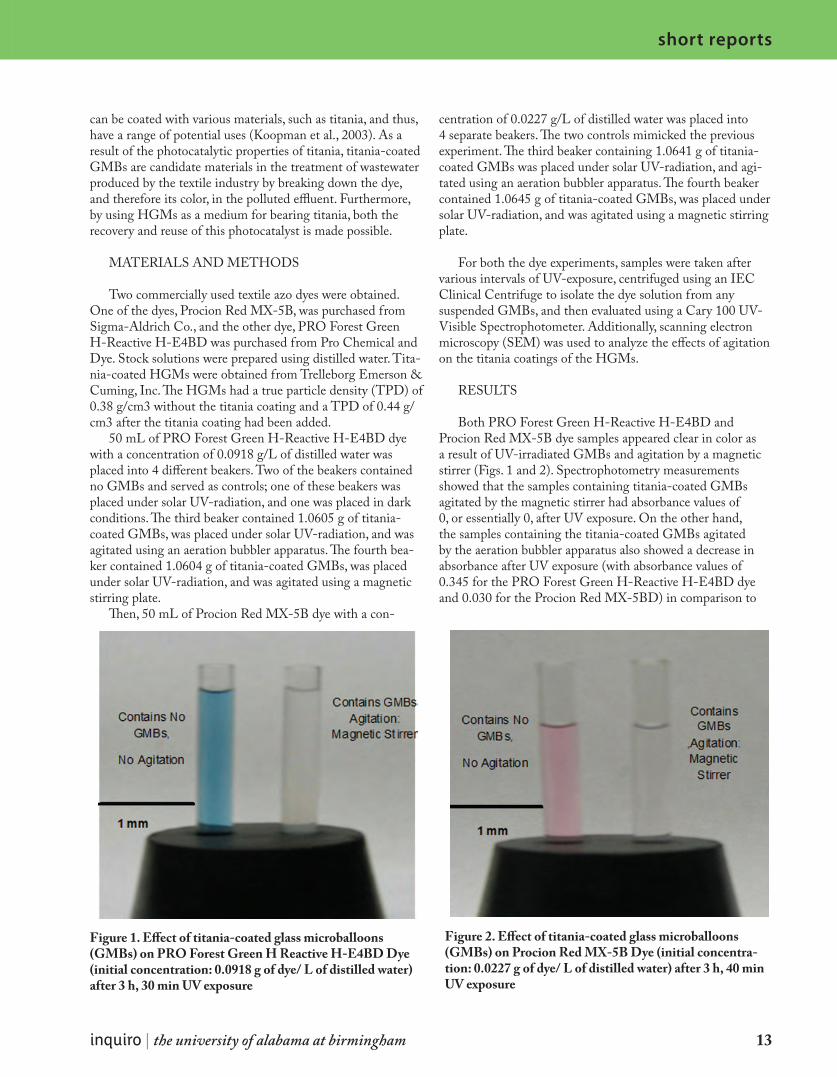
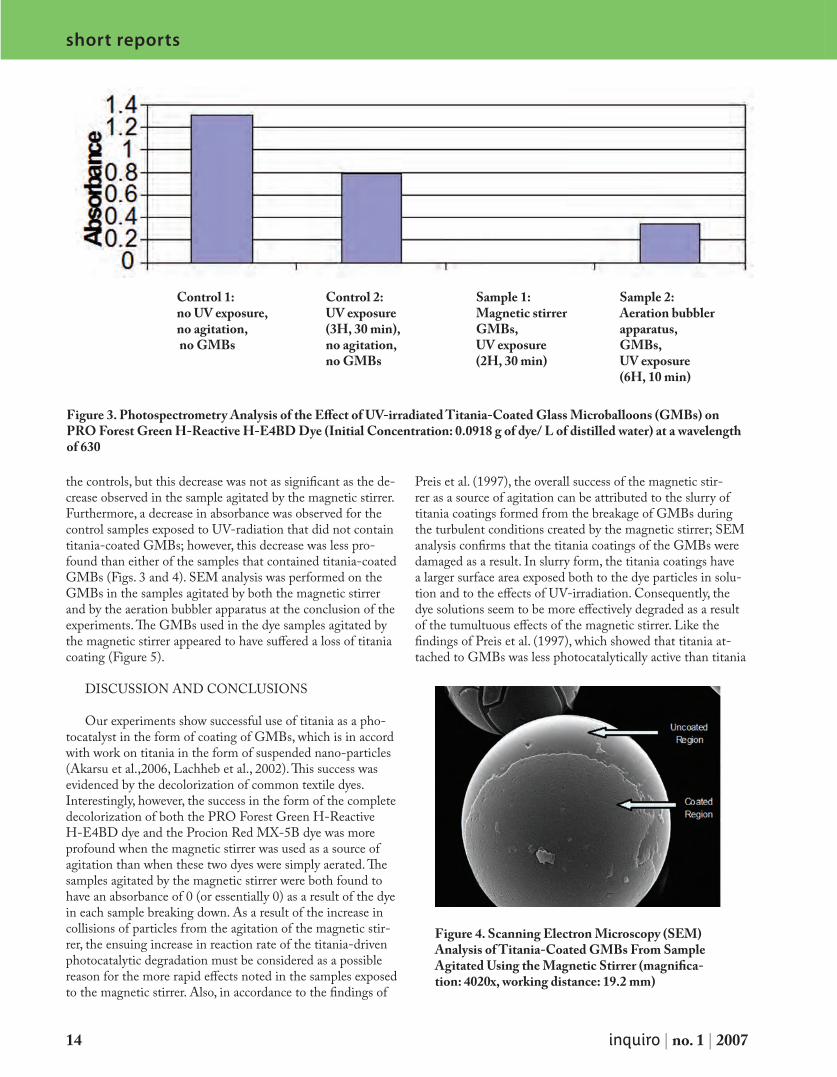
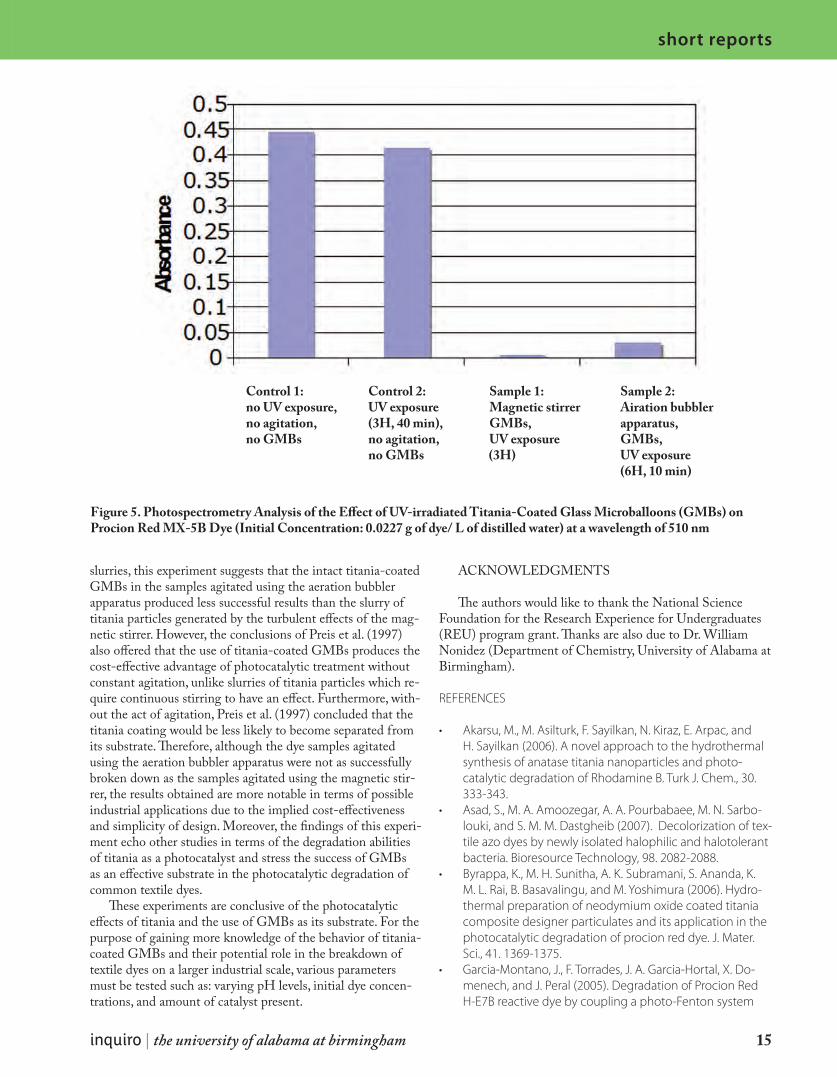
Both PRO Forest Green H-Reactive H-E4BD and Procion Red MX-5B dye samples appeared clear in color as a result of UV-irradiated GMBs and agitation by a magnetic stirrer (Figs. 1 and 2). Spectrophotometry measurements showed that the samples containing titania-coated GMBs agitated by the magnetic stirrer had absorbance values of 0, or essentially 0, after UV exposure. On the other hand, the samples containing the titania-coated GMBs agitated by the aeration bubbler apparatus also showed a decrease in absorbance after UV exposure (with absorbance values of 0.345 for the PRO Forest Green H-Reactive H-E4BD dye and 0.030 for the Procion Red MX-5BD) in comparison to
Figure 1. Effect of titania-coated glass microballoons (GMBs) on PRO Forest Green H Reactive H-E4BD Dye (initial concentration: 0.0918 g of dye/ L of distilled water) after 3 h, 30 min UV exposure
Figure 2. Effect of titania-coated glass microballoons (GMBs) on Procion Red MX-5B Dye (initial concentra-tion: 0.0227 g of dye/ L of distilled water) after 3 h, 40 min UV exposure
14 inquiro | no. 1 | 2007
short reports
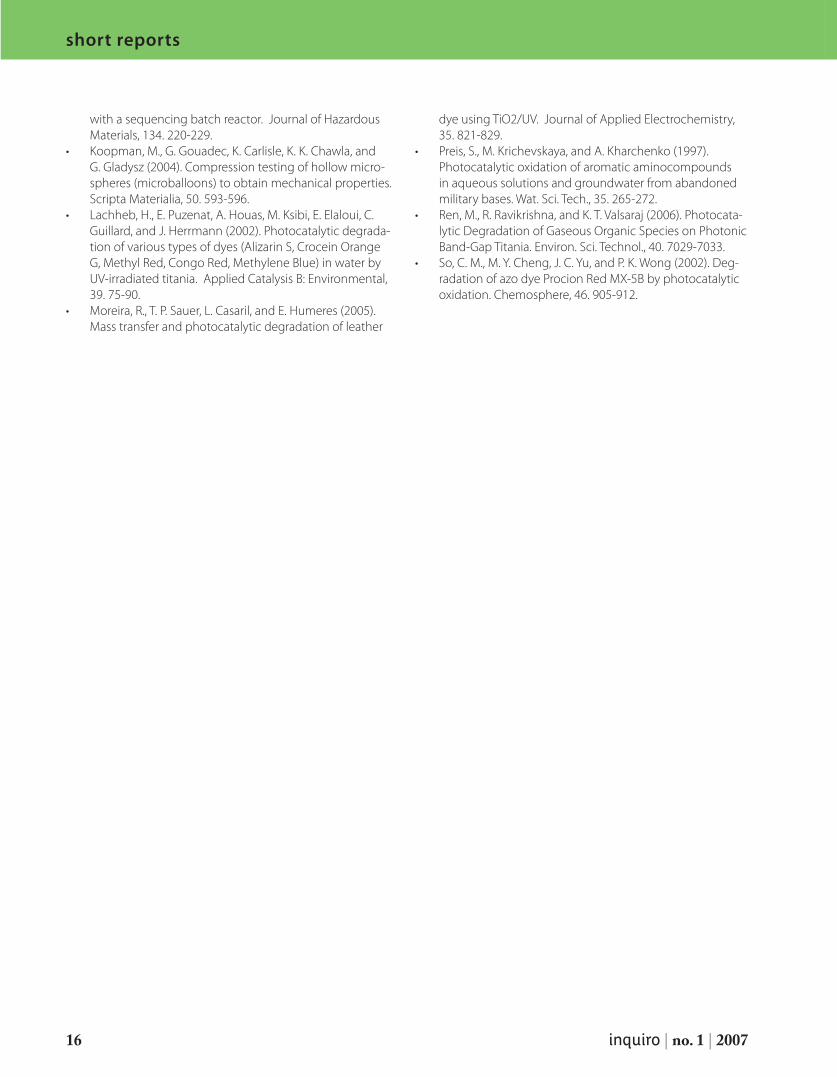
the controls, but this decrease was not as significant as the de-crease observed in the sample agitated by the magnetic stirrer. Furthermore, a decrease in absorbance was observed for the control samples exposed to UV-radiation that did not contain titania-coated GMBs; however, this decrease was less pro-found than either of the samples that contained titania-coated GMBs (Figs. 3 and 4). SEM analysis was performed on the GMBs in the samples agitated by both the magnetic stirrer and by the aeration bubbler apparatus at the conclusion of the experiments. The GMBs used in the dye samples agitated by the magnetic stirrer appeared to have suffered a loss of titania coating (Figure 5).
DISCUSSION AND CONCLUSIONS
Our experiments show successful use of titania as a pho-tocatalyst in the form of coating of GMBs, which is in accord with work on titania in the form of suspended nano-particles (Akarsu et al.,2006, Lachheb et al., 2002). This success was evidenced by the decolorization of common textile dyes. Interestingly, however, the success in the form of the complete decolorization of both the PRO Forest Green H-Reactive H-E4BD dye and the Procion Red MX-5B dye was more profound when the magnetic stirrer was used as a source of agitation than when these two dyes were simply aerated. The samples agitated by the magnetic stirrer were both found to have an absorbance of 0 (or essentially 0) as a result of the dye in each sample breaking down. As a result of the increase in collisions of particles from the agitation of the magnetic stir-rer, the ensuing increase in reaction rate of the titania-driven photocatalytic degradation must be considered as a possible reason for the more rapid effects noted in the samples exposed to the magnetic stirrer. Also, in accordance to the findings of
Preis et al. (1997), the overall success of the magnetic stir-rer as a source of agitation can be attributed to the slurry of titania coatings formed from the breakage of GMBs during the turbulent conditions created by the magnetic stirrer; SEM analysis confirms that the titania coatings of the GMBs were damaged as a result. In slurry form, the titania coatings have a larger surface area exposed both to the dye particles in solu-tion and to the effects of UV-irradiation. Consequently, the dye solutions seem to be more effectively degraded as a result of the tumultuous effects of the magnetic stirrer. Like the findings of Preis et al. (1997), which showed that titania at-tached to GMBs was less photocatalytically active than titania
Control 1: no UV exposure, no agitation, no GMBs
Control 2:UV exposure(3H, 30 min),no agitation,no GMBs
Sample 1:Magnetic stirrerGMBs,UV exposure(2H, 30 min)
Sample 2:Aeration bubblerapparatus,GMBs,UV exposure(6H, 10 min)
Figure 3. Photospectrometry Analysis of the Effect of UV-irradiated Titania-Coated Glass Microballoons (GMBs) on PRO Forest Green H-Reactive H-E4BD Dye (Initial Concentration: 0.0918 g of dye/ L of distilled water) at a wavelength of 630
Figure 4. Scanning Electron Microscopy (SEM) Analysis of Titania-Coated GMBs From Sample Agitated Using the Magnetic Stirrer (magnifica-tion: 4020x, working distance: 19.2 mm)
inquiro | the university of alabama at birmingham 15
short reports
slurries, this experiment suggests that the intact titania-coated GMBs in the samples agitated using the aeration bubbler apparatus produced less successful results than the slurry of titania particles generated by the turbulent effects of the mag-netic stirrer. However, the conclusions of Preis et al. (1997) also offered that the use of titania-coated GMBs produces the cost-effective advantage of photocatalytic treatment without constant agitation, unlike slurries of titania particles which re-quire continuous stirring to have an effect. Furthermore, with-out the act of agitation, Preis et al. (1997) concluded that the titania coating would be less likely to become separated from its substrate. Therefore, although the dye samples agitated using the aeration bubbler apparatus were not as successfully broken down as the samples agitated using the magnetic stir-rer, the results obtained are more notable in terms of possible industrial applications due to the implied cost-effectiveness and simplicity of design. Moreover, the findings of this experi-ment echo other studies in terms of the degradation abilities of titania as a photocatalyst and stress the success of GMBs as an effective substrate in the photocatalytic degradation of common textile dyes.
These experiments are conclusive of the photocatalytic effects of titania and the use of GMBs as its substrate. For the purpose of gaining more knowledge of the behavior of titania-coated GMBs and their potential role in the breakdown of textile dyes on a larger industrial scale, various parameters must be tested such as: varying pH levels, initial dye concen-trations, and amount of catalyst present.
ACKNOWLEDGMENTS
The authors would like to thank the National Science Foundation for the Research Experience for Undergraduates (REU) program grant. Thanks are also due to Dr. William Nonidez (Department of Chemistry, University of Alabama at Birmingham).
REFERENCES
Akarsu, M., M. Asilturk, F. Sayilkan, N. Kiraz, E. Arpac, and •H. Sayilkan (2006). A novel approach to the hydrothermal synthesis of anatase titania nanoparticles and photo-catalytic degradation of Rhodamine B. Turk J. Chem., 30. 333-343.Asad, S., M. A. Amoozegar, A. A. Pourbabaee, M. N. Sarbo-•louki, and S. M. M. Dastgheib (2007). Decolorization of tex-tile azo dyes by newly isolated halophilic and halotolerant bacteria. Bioresource Technology, 98. 2082-2088.Byrappa, K., M. H. Sunitha, A. K. Subramani, S. Ananda, K. •M. L. Rai, B. Basavalingu, and M. Yoshimura (2006). Hydro-thermal preparation of neodymium oxide coated titania composite designer particulates and its application in the photocatalytic degradation of procion red dye. J. Mater. Sci., 41. 1369-1375.Garcia-Montano, J., F. Torrades, J. A. Garcia-Hortal, X. Do-•menech, and J. Peral (2005). Degradation of Procion Red H-E7B reactive dye by coupling a photo-Fenton system
Sample 2:Airation bubblerapparatus,GMBs,UV exposure(6H, 10 min)
Sample 1:Magnetic stirrerGMBs,UV exposure
(3H)
Control 2:UV exposure(3H, 40 min),no agitation,no GMBs
Control 1: no UV exposure, no agitation,no GMBs
Figure 5. Photospectrometry Analysis of the Effect of UV-irradiated Titania-Coated Glass Microballoons (GMBs) on Procion Red MX-5B Dye (Initial Concentration: 0.0227 g of dye/ L of distilled water) at a wavelength of 510 nm
16 inquiro | no. 1 | 2007
short reports
with a sequencing batch reactor. Journal of Hazardous Materials, 134. 220-229.Koopman, M., G. Gouadec, K. Carlisle, K. K. Chawla, and •G. Gladysz (2004). Compression testing of hollow micro-spheres (microballoons) to obtain mechanical properties. Scripta Materialia, 50. 593-596. Lachheb, H., E. Puzenat, A. Houas, M. Ksibi, E. Elaloui, C. •Guillard, and J. Herrmann (2002). Photocatalytic degrada-tion of various types of dyes (Alizarin S, Crocein Orange G, Methyl Red, Congo Red, Methylene Blue) in water by UV-irradiated titania. Applied Catalysis B: Environmental, 39. 75-90.Moreira, R., T. P. Sauer, L. Casaril, and E. Humeres (2005). •Mass transfer and photocatalytic degradation of leather
dye using TiO2/UV. Journal of Applied Electrochemistry, 35. 821-829.Preis, S., M. Krichevskaya, and A. Kharchenko (1997). •Photocatalytic oxidation of aromatic aminocompounds in aqueous solutions and groundwater from abandoned military bases. Wat. Sci. Tech., 35. 265-272.Ren, M., R. Ravikrishna, and K. T. Valsaraj (2006). Photocata-•lytic Degradation of Gaseous Organic Species on Photonic Band-Gap Titania. Environ. Sci. Technol., 40. 7029-7033.So, C. M., M. Y. Cheng, J. C. Yu, and P. K. Wong (2002). Deg-•radation of azo dye Procion Red MX-5B by photocatalytic oxidation. Chemosphere, 46. 905-912.
inquiro | the university of alabama at birmingham 17
short reports
INTRODUCTION
Using a microarray screen, molecules that are transcrip-tionally regulated by the G2 DNA damage checkpoint were identified. Among the molecules identified in this screen was a putative ubiquitin ligase that we refer to as G2E3. We have demonstrated that this protein is regulated by many mechanisms. Included are cell cycle and DNA damage de-pendent transcriptional regulation, protein lability mediated by ubiquitination, and regulated subcellular localization by nuclear and nucleolar localization, DNA damage-dependent nucleolar delocalization, and CRM1-independent nuclear export. We have identified an ubiquitin ligase that ubiquit-inates G2E3 and several other interacting proteins, allowing predictions about the function of G2E3.
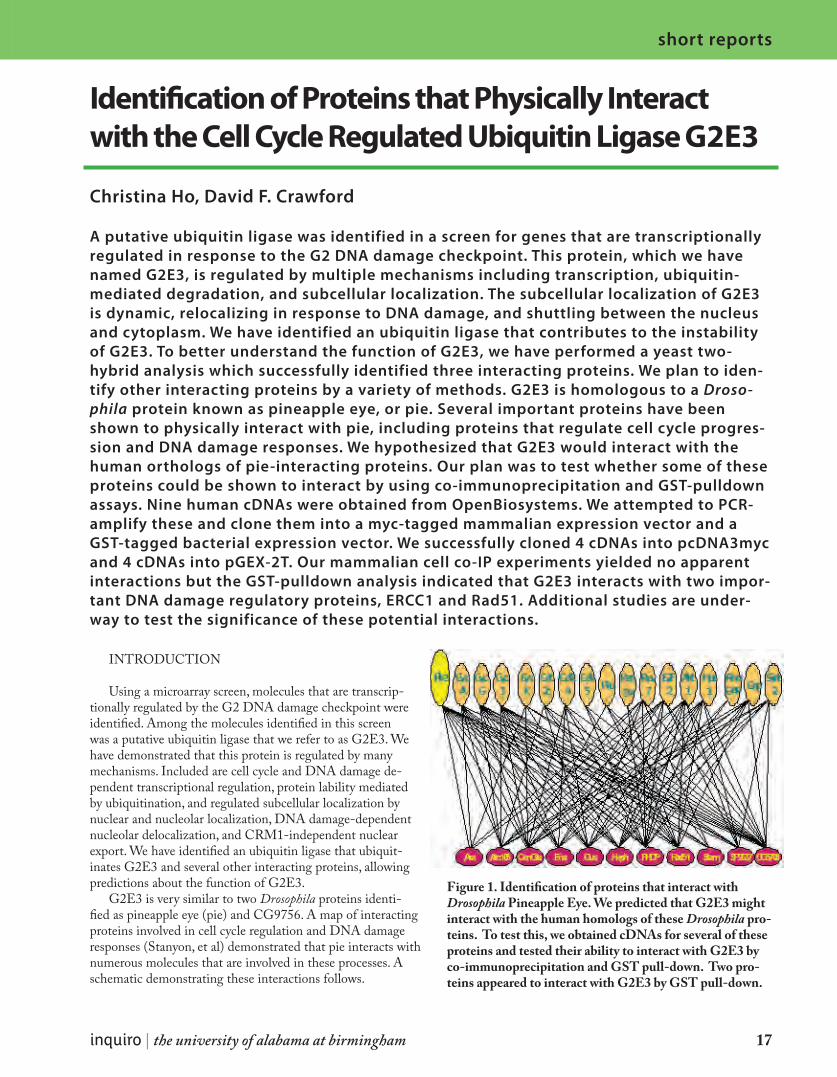
G2E3 is very similar to two Drosophila proteins identi-fied as pineapple eye (pie) and CG9756. A map of interacting proteins involved in cell cycle regulation and DNA damage responses (Stanyon, et al) demonstrated that pie interacts with numerous molecules that are involved in these processes. A schematic demonstrating these interactions follows.
Identification of Proteins that Physically Interact with the Cell Cycle Regulated Ubiquitin Ligase G2E3
Christina Ho, David F. Crawford
A putative ubiquitin ligase was identified in a screen for genes that are transcriptionally regulated in response to the G2 DNA damage checkpoint. This protein, which we have named G2E3, is regulated by multiple mechanisms including transcription, ubiquitin-mediated degradation, and subcellular localization. The subcellular localization of G2E3 is dynamic, relocalizing in response to DNA damage, and shuttling between the nucleus and cytoplasm. We have identified an ubiquitin ligase that contributes to the instability of G2E3. To better understand the function of G2E3, we have performed a yeast two- hybrid analysis which successfully identified three interacting proteins. We plan to iden-tify other interacting proteins by a variety of methods. G2E3 is homologous to a Droso-phila protein known as pineapple eye, or pie. Several important proteins have been shown to physically interact with pie, including proteins that regulate cell cycle progres-sion and DNA damage responses. We hypothesized that G2E3 would interact with the human orthologs of pie-interacting proteins. Our plan was to test whether some of these proteins could be shown to interact by using co-immunoprecipitation and GST-pulldown assays. Nine human cDNAs were obtained from OpenBiosystems. We attempted to PCR-amplify these and clone them into a myc-tagged mammalian expression vector and a GST-tagged bacterial expression vector. We successfully cloned 4 cDNAs into pcDNA3myc and 4 cDNAs into pGEX-2T. Our mammalian cell co-IP experiments yielded no apparent interactions but the GST-pulldown analysis indicated that G2E3 interacts with two impor-tant DNA damage regulatory proteins, ERCC1 and Rad51. Additional studies are under-way to test the significance of these potential interactions.
Figure 1. Identification of proteins that interact with Drosophila Pineapple Eye. We predicted that G2E3 might interact with the human homologs of these Drosophila pro-teins. To test this, we obtained cDNAs for several of these proteins and tested their ability to interact with G2E3 by co-immunoprecipitation and GST pull-down. Two pro-teins appeared to interact with G2E3 by GST pull-down.
18 inquiro | no. 1 | 2007
short reports
MATERIALS AND METHODS
Construct DevelopmentNine human cDNAs were obtained from Open Bio-
systems. PCR amplification with primers containing re-striction enzyme sites was performed. cDNAs and their corresponding primer sequences were as follows: Arix1 (5’-GAGGATCCTACGACTCGTGCGTGG and 5’-GGGAATTCGAGGCCGGCAGCTAG), ERCC-1 (5’-GGGGATCCGACCCTGGGAAGGACAA and 5’-GGGAATTCGGGATTACAGGCGGAAG), IRFBP-1 (5’-GAGGATCCGCGTCTGTGCAGGCG and 5’-GGGAATTCGCCTAGGGGTCCCGTT), Iroquois (5’-GGGGATCCTACCCGCAGTTTGG and 5’-GGGAATTCAGGCGCAGAAGGG), LMO4 (5’-GAGGATCCGTGAATCCGGGCAGC and 5’-GCGGGATATCTTAGCAGACCTTCTGGTCTG), PTB-1 (5’-GAGGATCCGACGGCATCGTCCCA and 5’-GGGAATTCCTAGATGGTGGACTT GGAGA), Rad51 (5’-GAGGATCCGCAATGCAGATGCAGC and 5’-GCGGGATATCTCAGTCTTTGGCATCTCC), SSB1 (5’-GAGGATCC GGTCAGAAGGTCACTGGAG and 5’-GGGAATTCGCGAACGTCACTGGTAGAG), and Stam (5’-GGAGATCTCCTCTTTTTGCCACCAA and 5’-GAGAATTCGGGTCCTATAGCAGAGCC). Inserts were digested with the appropriate restriction enzymes and cloned into pcDNA3myc (for mammalian cell expression) and pGEX2T or a related vector (for bacterial expression of GST-tagged protein). Recombinant plasmids were prepared for mammalian cell or bacterial expression as shown in Figure 2.
Co-ImmunoprecipitationRad51, ERCC-1, LM04, and SSB1 cDNAs were sub-
cloned into myc-tagged mammalian expression vector and transfected into Cos-7 cells. After overnight incubation, cells were harvested with PBS + 3mM EDTA and lysed in com-plete mammalian cell lysis buffer. Equal amounts of whole cell lysate (200μg) were incubated for 1hr with FLAG M2 beads. Pellets were washed six times and then eluted by boiling in SDS sample buffer and separated by SDS-PAGE.
ImmunoblottingFollowing SDS-PAGE, proteins were transferred by elec-
trophoresis to nitrocellulose membranes. The membranes were stained with Ponceau to confirm equal loading and then blocked in 5% milk. Blots were probed with primary antibody FLAG-M2 (Sigma) or Myc9E10 and then washed. HRP-conjugated secondary antibodies were added and incubated prior to washing. Blots were developed with ECL (Invitrogen).
Recombinant GST-tagged Protein PurificationBL21 (DE3) cells were transfected with pGEX2T
constructs. After growth to log phase, protein expression was induced with 500μM IPTG. After 2 hr, cells were harvested. FLAG-tagged G2E3 or G2E3 mutants were transiently expressed in Cos-7 cells and 24 hr following transfection, cells were lysed. 1mg of whole cell lysates were incubated 1hr with 50μg purified recombinant protein along with glutathione-sepharose. Following washing, sepharose beads were boiled in SDS and separated by SDS-PAGE. See Figure 3.
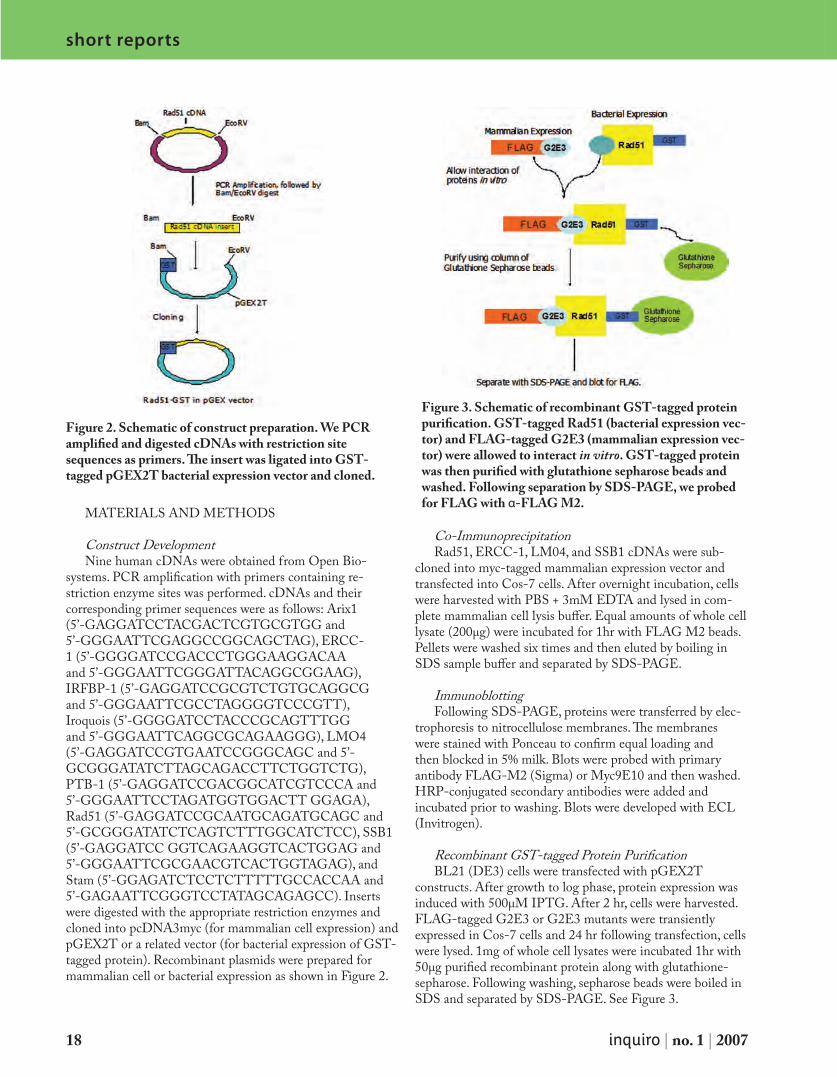
Figure 2. Schematic of construct preparation. We PCR amplified and digested cDNAs with restriction site sequences as primers. The insert was ligated into GST-tagged pGEX2T bacterial expression vector and cloned.
Figure 3. Schematic of recombinant GST-tagged protein purification. GST-tagged Rad51 (bacterial expression vec-tor) and FLAG-tagged G2E3 (mammalian expression vec-tor) were allowed to interact in vitro. GST-tagged protein was then purified with glutathione sepharose beads and washed. Following separation by SDS-PAGE, we probed for FLAG with α-FLAG M2.
inquiro | the university of alabama at birmingham 19
short reports
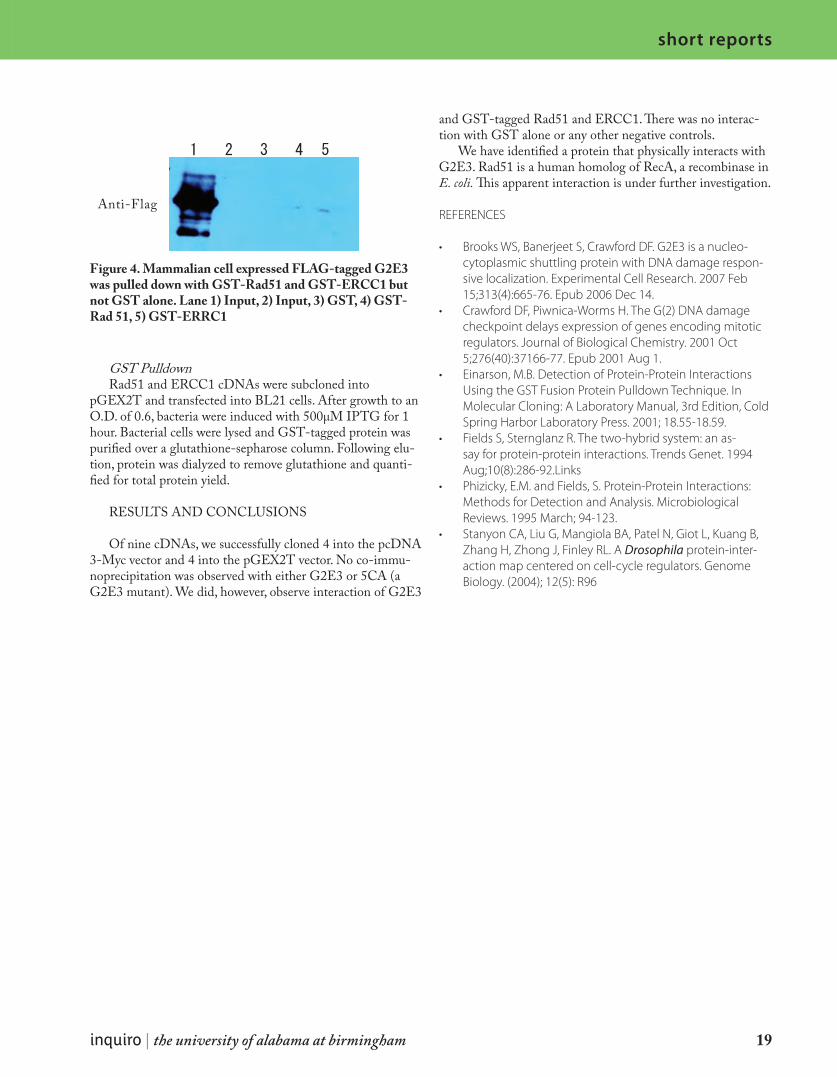
Figure 4. Mammalian cell expressed FLAG-tagged G2E3 was pulled down with GST-Rad51 and GST-ERCC1 but not GST alone. Lane 1) Input, 2) Input, 3) GST, 4) GST-Rad 51, 5) GST-ERRC1
GST PulldownRad51 and ERCC1 cDNAs were subcloned into
pGEX2T and transfected into BL21 cells. After growth to an O.D. of 0.6, bacteria were induced with 500μM IPTG for 1 hour. Bacterial cells were lysed and GST-tagged protein was purified over a glutathione-sepharose column. Following elu-tion, protein was dialyzed to remove glutathione and quanti-fied for total protein yield.
RESULTS AND CONCLUSIONS
Of nine cDNAs, we successfully cloned 4 into the pcDNA 3-Myc vector and 4 into the pGEX2T vector. No co-immu-noprecipitation was observed with either G2E3 or 5CA (a G2E3 mutant). We did, however, observe interaction of G2E3
and GST-tagged Rad51 and ERCC1. There was no interac-tion with GST alone or any other negative controls.
We have identified a protein that physically interacts with G2E3. Rad51 is a human homolog of RecA, a recombinase in E. coli. This apparent interaction is under further investigation.
REFERENCES
Brooks WS, Banerjeet S, Crawford DF. G2E3 is a nucleo-•cytoplasmic shuttling protein with DNA damage respon-sive localization. Experimental Cell Research. 2007 Feb 15;313(4):665-76. Epub 2006 Dec 14.Crawford DF, Piwnica-Worms H. The G(2) DNA damage •checkpoint delays expression of genes encoding mitotic regulators. Journal of Biological Chemistry. 2001 Oct 5;276(40):37166-77. Epub 2001 Aug 1.Einarson, M.B. Detection of Protein-Protein Interactions •Using the GST Fusion Protein Pulldown Technique. In Molecular Cloning: A Laboratory Manual, 3rd Edition, Cold Spring Harbor Laboratory Press. 2001; 18.55-18.59.Fields S, Sternglanz R. The two-hybrid system: an as-•say for protein-protein interactions. Trends Genet. 1994 Aug;10(8):286-92.LinksPhizicky, E.M. and Fields, S. Protein-Protein Interactions: •Methods for Detection and Analysis. Microbiological Reviews. 1995 March; 94-123.Stanyon CA, Liu G, Mangiola BA, Patel N, Giot L, Kuang B, •Zhang H, Zhong J, Finley RL. A Drosophila protein-inter-action map centered on cell-cycle regulators. Genome Biology. (2004); 12(5): R96
1 2 3 4 5
Anti-Flag
20 inquiro | no. 1 | 2007
short reports
INTRODUCTION
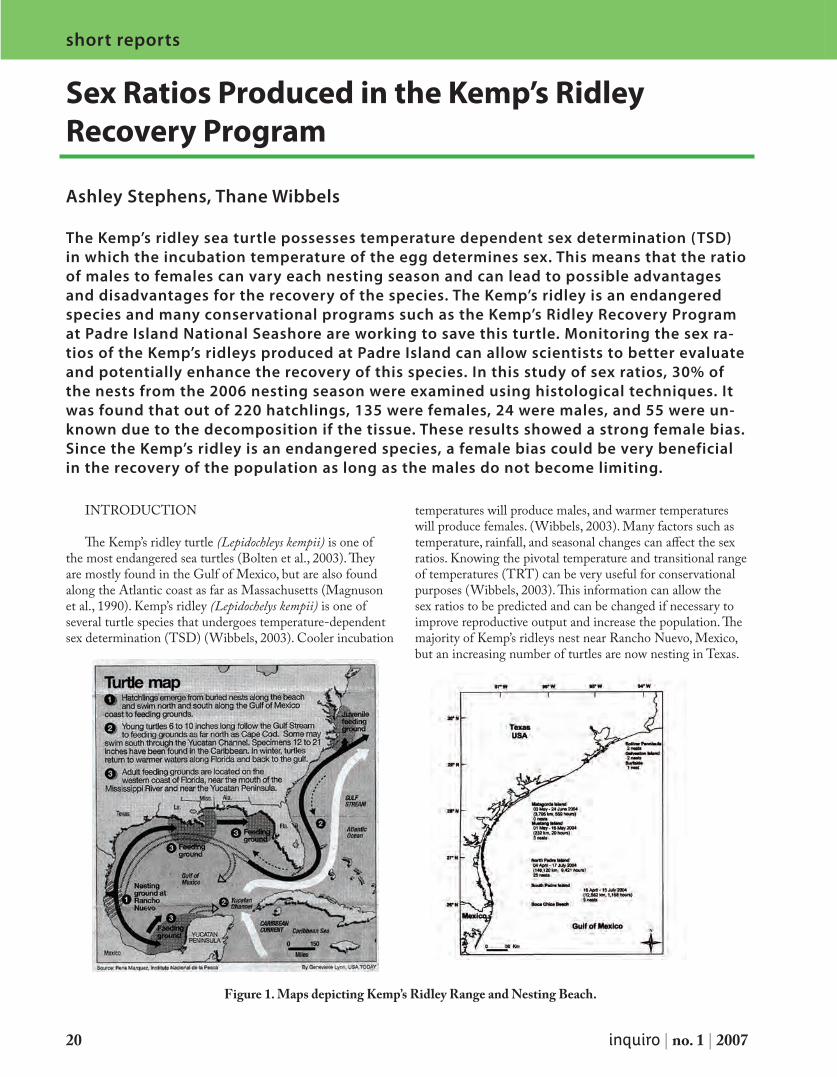
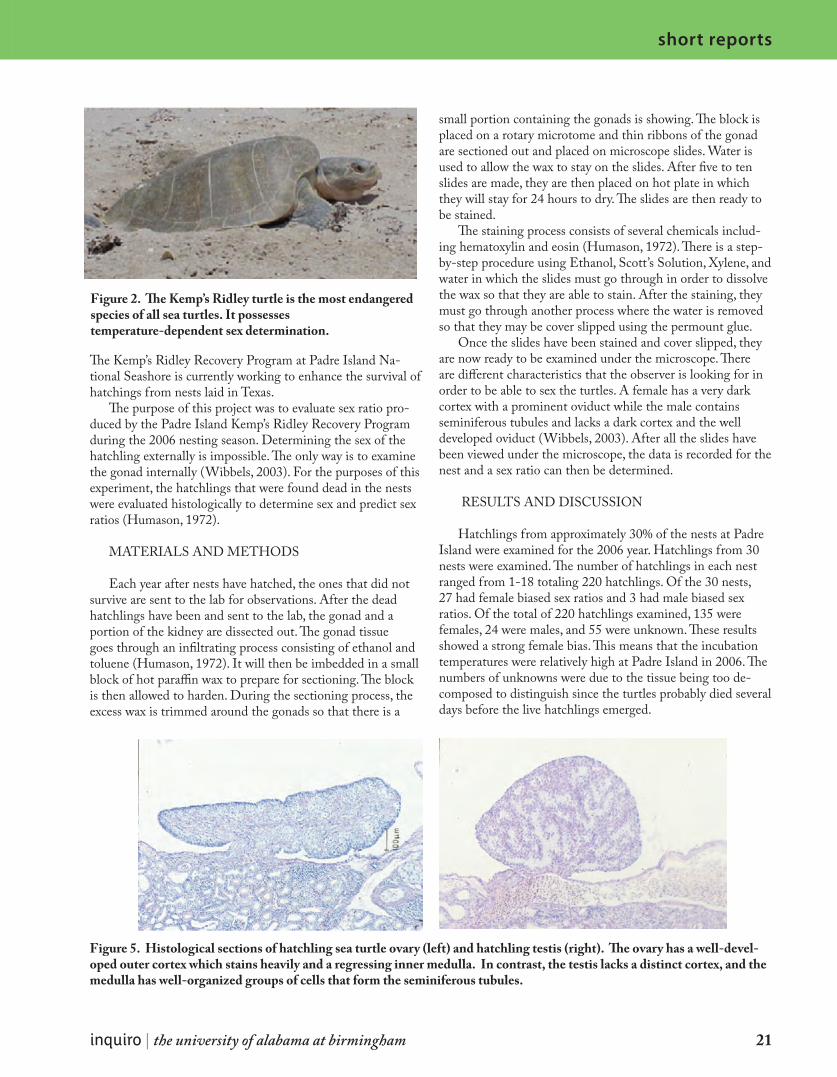
The Kemp’s ridley turtle (Lepidochleys kempii) is one of the most endangered sea turtles (Bolten et al., 2003). They are mostly found in the Gulf of Mexico, but are also found along the Atlantic coast as far as Massachusetts (Magnuson et al., 1990). Kemp’s ridley (Lepidochelys kempii) is one of several turtle species that undergoes temperature-dependent sex determination (TSD) (Wibbels, 2003). Cooler incubation
temperatures will produce males, and warmer temperatures will produce females. (Wibbels, 2003). Many factors such as temperature, rainfall, and seasonal changes can affect the sex ratios. Knowing the pivotal temperature and transitional range of temperatures (TRT) can be very useful for conservational purposes (Wibbels, 2003). This information can allow the sex ratios to be predicted and can be changed if necessary to improve reproductive output and increase the population. The majority of Kemp’s ridleys nest near Rancho Nuevo, Mexico, but an increasing number of turtles are now nesting in Texas.
Sex Ratios Produced in the Kemp’s Ridley Recovery Program
Ashley Stephens, Thane Wibbels
The Kemp’s ridley sea turtle possesses temperature dependent sex determination (TSD) in which the incubation temperature of the egg determines sex. This means that the ratio of males to females can vary each nesting season and can lead to possible advantages and disadvantages for the recovery of the species. The Kemp’s ridley is an endangered species and many conservational programs such as the Kemp’s Ridley Recovery Program at Padre Island National Seashore are working to save this turtle. Monitoring the sex ra-tios of the Kemp’s ridleys produced at Padre Island can allow scientists to better evaluate and potentially enhance the recovery of this species. In this study of sex ratios, 30% of the nests from the 2006 nesting season were examined using histological techniques. It was found that out of 220 hatchlings, 135 were females, 24 were males, and 55 were un-known due to the decomposition if the tissue. These results showed a strong female bias. Since the Kemp’s ridley is an endangered species, a female bias could be very beneficial in the recovery of the population as long as the males do not become limiting.
Figure 1. Maps depicting Kemp’s Ridley Range and Nesting Beach.
inquiro | the university of alabama at birmingham 21
short reports
The Kemp’s Ridley Recovery Program at Padre Island Na-tional Seashore is currently working to enhance the survival of hatchings from nests laid in Texas.
The purpose of this project was to evaluate sex ratio pro-duced by the Padre Island Kemp’s Ridley Recovery Program during the 2006 nesting season. Determining the sex of the hatchling externally is impossible. The only way is to examine the gonad internally (Wibbels, 2003). For the purposes of this experiment, the hatchlings that were found dead in the nests were evaluated histologically to determine sex and predict sex ratios (Humason, 1972).
MATERIALS AND METHODS
Each year after nests have hatched, the ones that did not survive are sent to the lab for observations. After the dead hatchlings have been and sent to the lab, the gonad and a portion of the kidney are dissected out. The gonad tissue goes through an infiltrating process consisting of ethanol and toluene (Humason, 1972). It will then be imbedded in a small block of hot paraffin wax to prepare for sectioning. The block is then allowed to harden. During the sectioning process, the excess wax is trimmed around the gonads so that there is a
small portion containing the gonads is showing. The block is placed on a rotary microtome and thin ribbons of the gonad are sectioned out and placed on microscope slides. Water is used to allow the wax to stay on the slides. After five to ten slides are made, they are then placed on hot plate in which they will stay for 24 hours to dry. The slides are then ready to be stained.
The staining process consists of several chemicals includ-ing hematoxylin and eosin (Humason, 1972). There is a step-by-step procedure using Ethanol, Scott’s Solution, Xylene, and water in which the slides must go through in order to dissolve the wax so that they are able to stain. After the staining, they must go through another process where the water is removed so that they may be cover slipped using the permount glue.
Once the slides have been stained and cover slipped, they are now ready to be examined under the microscope. There are different characteristics that the observer is looking for in order to be able to sex the turtles. A female has a very dark cortex with a prominent oviduct while the male contains seminiferous tubules and lacks a dark cortex and the well developed oviduct (Wibbels, 2003). After all the slides have been viewed under the microscope, the data is recorded for the nest and a sex ratio can then be determined.
RESULTS AND DISCUSSION
Hatchlings from approximately 30% of the nests at Padre Island were examined for the 2006 year. Hatchlings from 30 nests were examined. The number of hatchlings in each nest ranged from 1-18 totaling 220 hatchlings. Of the 30 nests, 27 had female biased sex ratios and 3 had male biased sex ratios. Of the total of 220 hatchlings examined, 135 were females, 24 were males, and 55 were unknown. These results showed a strong female bias. This means that the incubation temperatures were relatively high at Padre Island in 2006. The numbers of unknowns were due to the tissue being too de-composed to distinguish since the turtles probably died several days before the live hatchlings emerged.
Figure 2. The Kemp’s Ridley turtle is the most endangered species of all sea turtles. It possessestemperature-dependent sex determination.
Figure 5. Histological sections of hatchling sea turtle ovary (left) and hatchling testis (right). The ovary has a well-devel-oped outer cortex which stains heavily and a regressing inner medulla. In contrast, the testis lacks a distinct cortex, and the medulla has well-organized groups of cells that form the seminiferous tubules.
22 inquiro | no. 1 | 2007
short reports
Having a gender biased population could have significant conservation implications for the Kemp’s ridley. It may be advantageous to have a female bias as long as the males do not become limiting. The female bias could increase egg produc-tion in future years after these hatchlings mature. This could speed up the recovery of this species. These data suggest that the sex ratios produced in the Padre Island Kemp’s Ridley Recovery Program represent an advantageous outcome for the recovery of this endangered sea turtle.
REFERENCES
Bolten, Alan B., Schmid, Jeffrey R., Bjorndal, Karen A., Lin-•derberg, William J., Percival, H. Franklin, and Zwick, Paul D. “Home Range and Habitat Use by Kemp’s Ridley Turtles in West-Central Florida.” The Journal of Wildlife Management Vol. 67, No. 1. Jan., 2003, 196-206. 19 July 2007 <www.jstor.org>.Humason, G.L. 1972. • Animal Tissue Techniques. San Fran-cisco, CA: W.H. Freeman Magnuson, J.J., Bjorndal, K.A., DuPaul, W.D., Graham, G.L., •Owens, D.W., Peterson, C.H., Pritchard, P.C.H., Richardson, J.L., Saul, G.E., and West, C.W. 1990. Decline of the Sea Turtles: Causes and Prevention. Washington, DC: National Research Council, National Academy Press.Wibbels, T. (2003). Critical Approaches to Sex Determina-•tion in Sea Turtles. In: Lutz, P.L., Musick, J. A., Wyneken, J. (eds), The Biology of the Sea Turtles (pp. 103-134). Boca Raton FL: CRC Press LLC.
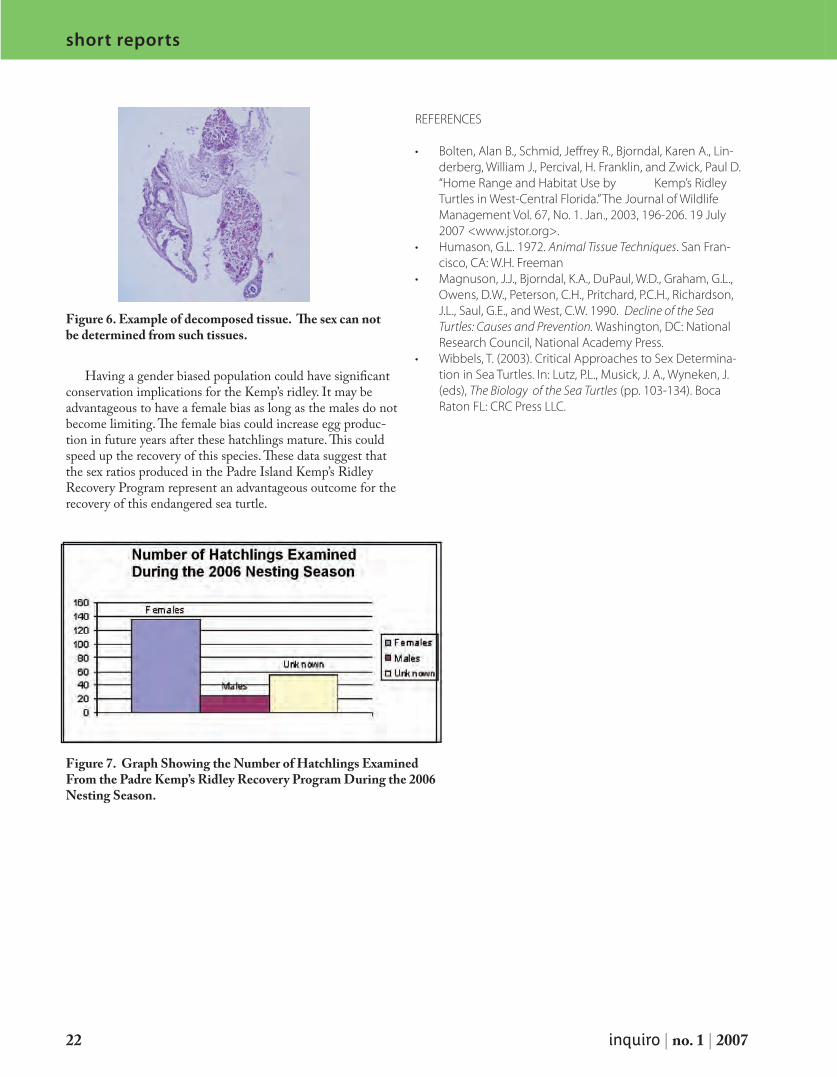
Figure 6. Example of decomposed tissue. The sex can not be determined from such tissues.
Figure 7. Graph Showing the Number of Hatchlings Examined From the Padre Kemp’s Ridley Recovery Program During the 2006 Nesting Season.
inquiro | the university of alabama at birmingham 23
short reports
INTRODUCTION
In a classic paper on interference in a reaction time task, Stroop (1935) found that it took longer for subjects to read a list of color names when they were printed in an ink color different from the color named and also that it took longer to correctly identify a list of ink colors when the printed words named colors other than the ink colors in which they were printed. These interference effects are generally attributed to the automatic aspects of the reading process, i.e., the reader’s mind automatically determines the semantic meaning of the word and this must be overridden if the subject is to attend to the ink color in which the word is printed. Such an interpreta-tion is supported by the absence of the classic Stroop effect in subjects not familiar with the semantic terms or children who are not yet reading. The basic Stroop paradigm has been widely used to study behavioral inhibition and frontal lobe function (Belanger and Cimino, 2002).
It is generally agreed that the left hemisphere of the human brain is usually more efficient at processing ver-bal tasks and that the right hemisphere is more efficient at nonverbal, spatial tasks (Gazzaniga, 2000). While the extent of hemispheric specialization is typically overblown in the popular press there is consistent data indicating a general left-hemisphere superiority for language processing and a right-hemisphere superiority for spatial tasks. In this experiment we wanted to examine whether the magnitude of Stroop-like interference would be affected by which hemisphere processed the Stroop stimuli. Given the literature on functional special-ization of the cerebral hemispheres one might expect different levels of interference between the semantics of color words and their ink color when these were presented to the left or right hemisphere. We also wanted to examine whether a
Stroop-like interference operated between the hemispheres in conditions where the color word and the ink color were pro-cessed by different hemispheres as examined by Dyer (1973). To allow an examination of within- and between-hemisphere conditions we used a non-traditional version of the Stroop task where the color word and ink color were spatially sepa-rated.
METHODS
Apparatus and stimuli: Stimuli consisted of a color word (blue, green, pink, or red) and a rectangular block of color (blue, green, pink, or red). The words were written in black, Times New Roman font with a font size of eighteen. The rect-angular block of color was the same size as the longest word,
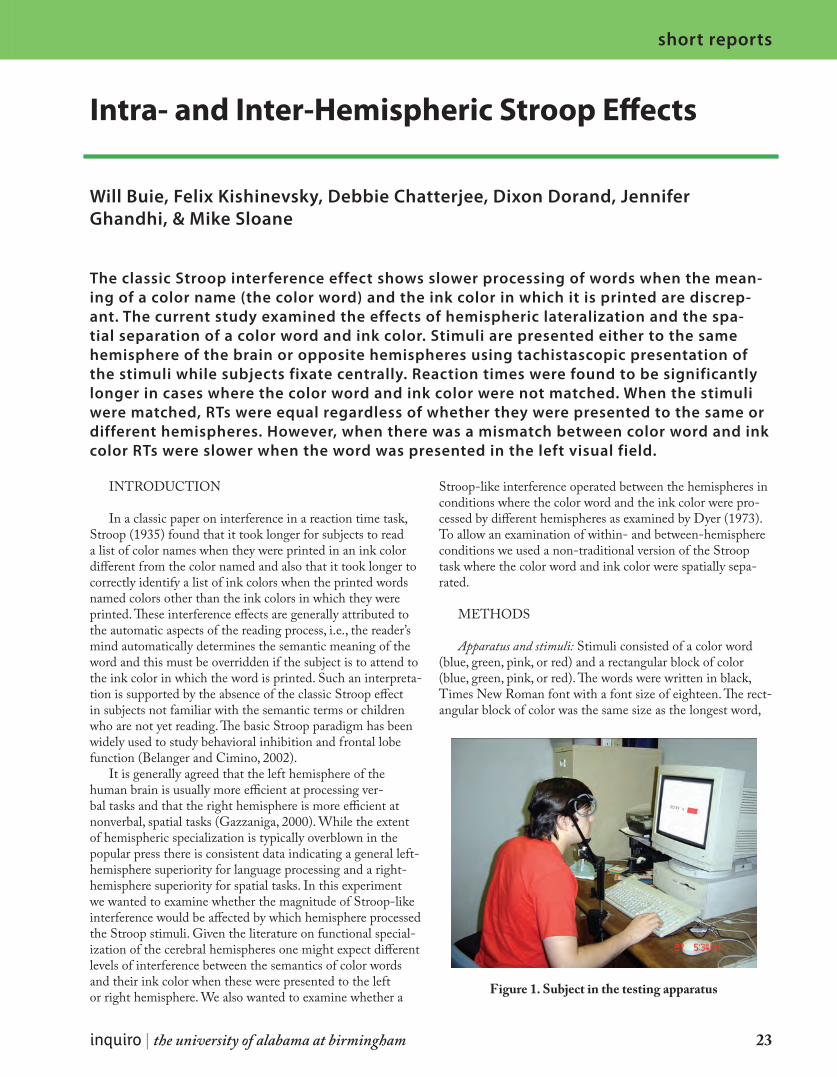
Intra- and Inter-Hemispheric Stroop Effects
Will Buie, Felix Kishinevsky, Debbie Chatterjee, Dixon Dorand, Jennifer Ghandhi, & Mike Sloane
The classic Stroop interference effect shows slower processing of words when the mean-ing of a color name (the color word) and the ink color in which it is printed are discrep-ant. The current study examined the effects of hemispheric lateralization and the spa-tial separation of a color word and ink color. Stimuli are presented either to the same hemisphere of the brain or opposite hemispheres using tachistascopic presentation of the stimuli while subjects fixate centrally. Reaction times were found to be significantly longer in cases where the color word and ink color were not matched. When the stimuli were matched, RTs were equal regardless of whether they were presented to the same or different hemispheres. However, when there was a mismatch between color word and ink color RTs were slower when the word was presented in the left visual field.
Figure 1. Subject in the testing apparatus
24 inquiro | no. 1 | 2007
short reports
“green.” The color word and colored block were spatially sepa-rated and presented to either the left hemisphere or the right hemisphere or presented to different hemispheres. In all cases the color word was presented above the colored rectangle. The
words and colored rectangles were aligned such that the edge nearest the center was 1° away from central fixation. The visual stimuli were presented using a PowerMac computer. Subjects used a chin rest to maintain a viewing distance of 57 cm from the center of the screen (Figure 1).
There were two categories of stimuli: intra-hemishperic (Figure 2) and inter-hemispheric (Figure 3). The intra- hemisphere stimuli consisted of stimuli in which the word and colored rectangle were both presented equally often to either the left or right visual field. There were equal numbers of pairs where the color word matched or failed to match the ink color of the rectangle. The inter-hemisphere stimuli con-sisted of stimuli where the color word and colored rectangle were presented in opposite visual fields. Again there were equal number of pairs where there was a match or mismatch between the color word and the ink color of the rectangle.
A given trial consisted of a central fixation X appearing for 1,000 ms, followed by a very brief blank interval, followed in turn by the experimental stimuli for 100 ms. Subjects were to indicate as quickly as possible whether the color word matched the ink color of the rectangle or not. Subjects indi-cated a Match by pressing a pre-selected key on the computer keyboard with their index finger of their right hand and a Mismatch by pressing the adjacent key using their adjacent finger of their right hand. A visual feedback signal (+/1) was given immediately after the subject’s response. If the subject failed to respond within 1,500 ms the trial timed out and the next trial was automatically initiated.
Procedure: Four female and ten male undergraduate par-ticipants were given a detailed set of instructions about the experiment. The importance of maintaining central fixation
Figure 2: Control stimuli: (a) matching LVF RH, (b) mis-matching LVF RH, (c) matching RVF LH, (d) mismatch-ing RVF LH
Figure 3: Experimental stimuli: word on (a) matching LVF RH, (b) mismatching LVF RH, (c) matching RVF LH, (d) mismatching RVF LH
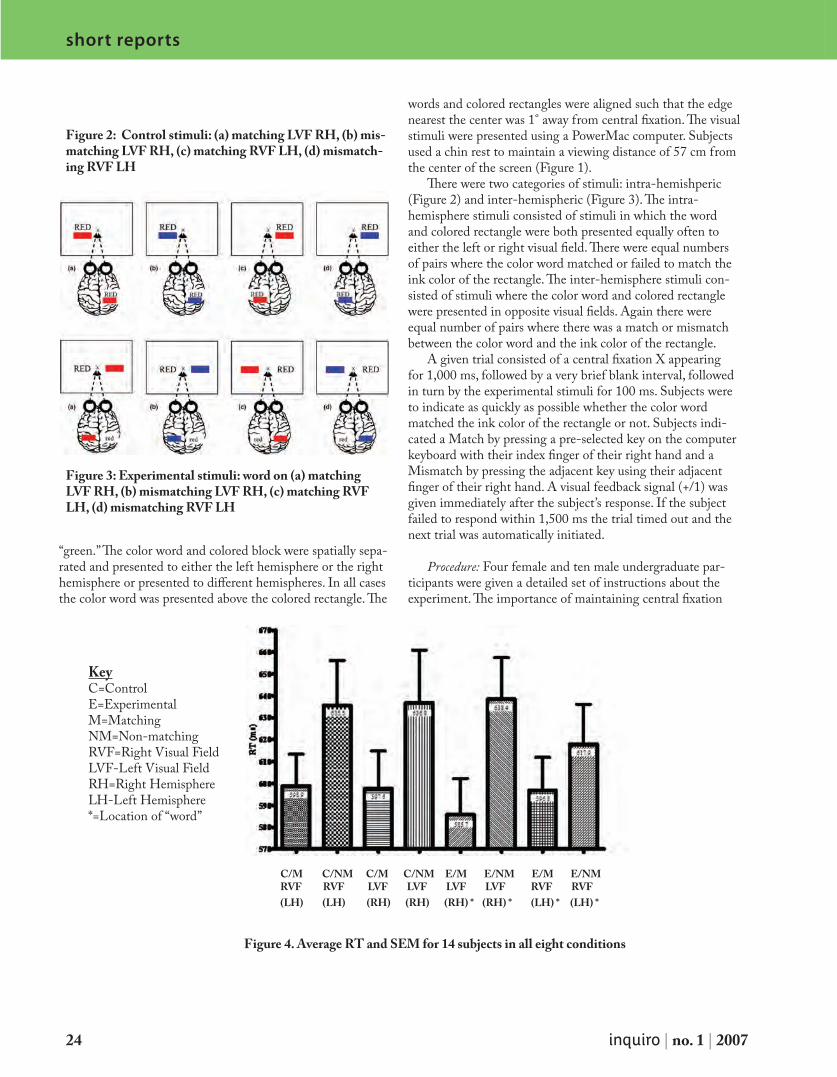
C/M C/NM C/M C/NM E/M E/NM E/M E/NM RVF RVF LVF LVF LVF LVF RVF RVF (LH) (LH) (RH) (RH) (RH) * (RH) * (LH) * (LH) *
KeyC=ControlE=ExperimentalM=MatchingNM=Non-matchingRVF=Right Visual FieldLVF-Left Visual FieldRH=Right HemisphereLH-Left Hemisphere*=Location of “word”
Figure 4. Average RT and SEM for 14 subjects in all eight conditions
inquiro | the university of alabama at birmingham 25
short reports
throughout the sequence of trials was stressed. Subjects were instructed to respond as quickly as possible without guessing. They were instructed to minimize their errors and not to sac-rifice accuracy for speed. Any questions were clarified before proceeding. Subjects were then asked to complete the Edin-burgh Handedness Inventory adapted from Oldfield (1971) to determine which hand was dominant. The subjects were also administered the Neitz Test of Color Vision for color blindness and a standard visual acuity test for near vision. All participants had excellent near visual acuity and were devoid of any color vision deficiency. Subjects were seated in an adjustable chair so that their eyes were level with the central fixation marker on the computer screen. The height of the chin rest was adjusted as necessary. Subjects were given a practice sequence of 48 trials for the intra- and inter-hemisphere type of condition. A sequence lasted about 3 minutes. Additional practice trials were administered if the subject’s error rate ex-ceeded 10%. Each subject completed two sequences of intra- and inter-hemisphere conditions alternating between the two with all subjects starting with the inter-hemisphere condition. Subjects were allowed to take breaks as needed between the three-minute test sequences.
The experimenter sat at the back of the room out of the subject’s view during all phases of testing.
RESULTS
Only RTs for correct responses were included in the analy-sis of the data. The error rate was less than 10%.
Figure 4 shows the mean and standard error of the mean for the RTs of the 14 subjects for each of the eight experimen-tal conditions.
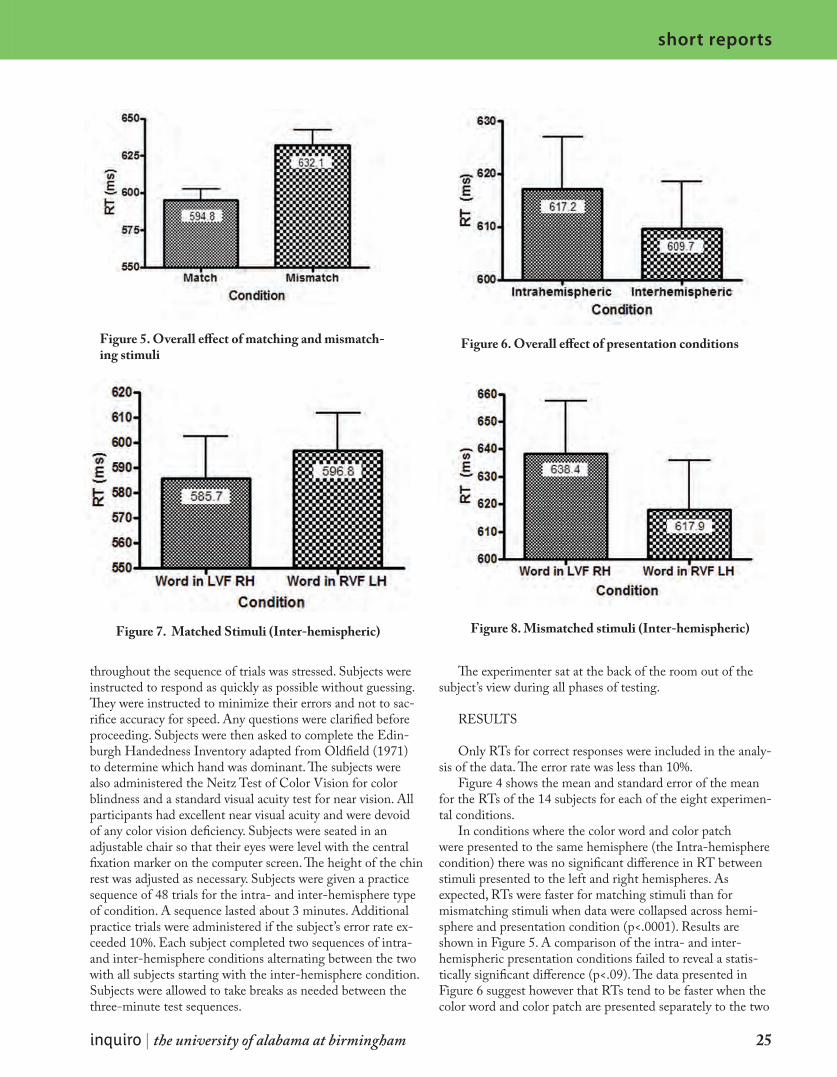
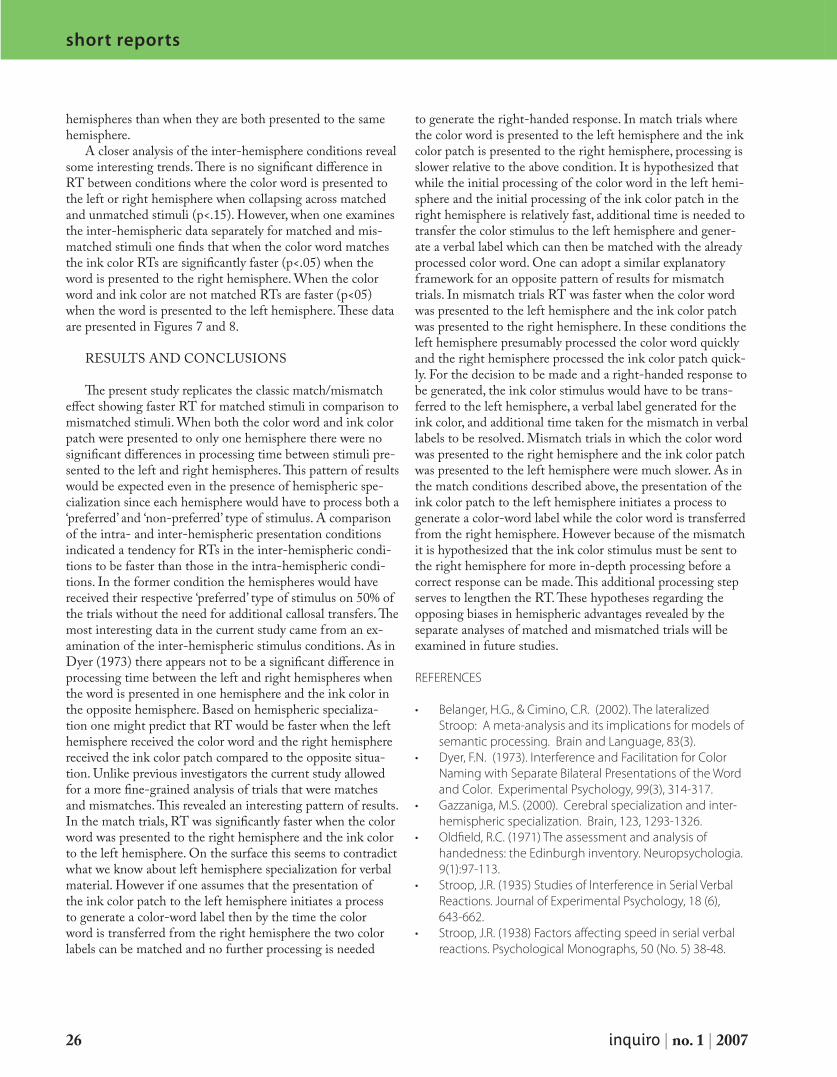
In conditions where the color word and color patch were presented to the same hemisphere (the Intra-hemisphere condition) there was no significant difference in RT between stimuli presented to the left and right hemispheres. As expected, RTs were faster for matching stimuli than for mismatching stimuli when data were collapsed across hemi-sphere and presentation condition (p<.0001). Results are shown in Figure 5. A comparison of the intra- and inter-hemispheric presentation conditions failed to reveal a statis-tically significant difference (p<.09). The data presented in Figure 6 suggest however that RTs tend to be faster when the color word and color patch are presented separately to the two
Figure 6. Overall effect of presentation conditionsFigure 5. Overall effect of matching and mismatch-ing stimuli
Figure 7. Matched Stimuli (Inter-hemispheric) Figure 8. Mismatched stimuli (Inter-hemispheric)
26 inquiro | no. 1 | 2007
short reports
hemispheres than when they are both presented to the same hemisphere.
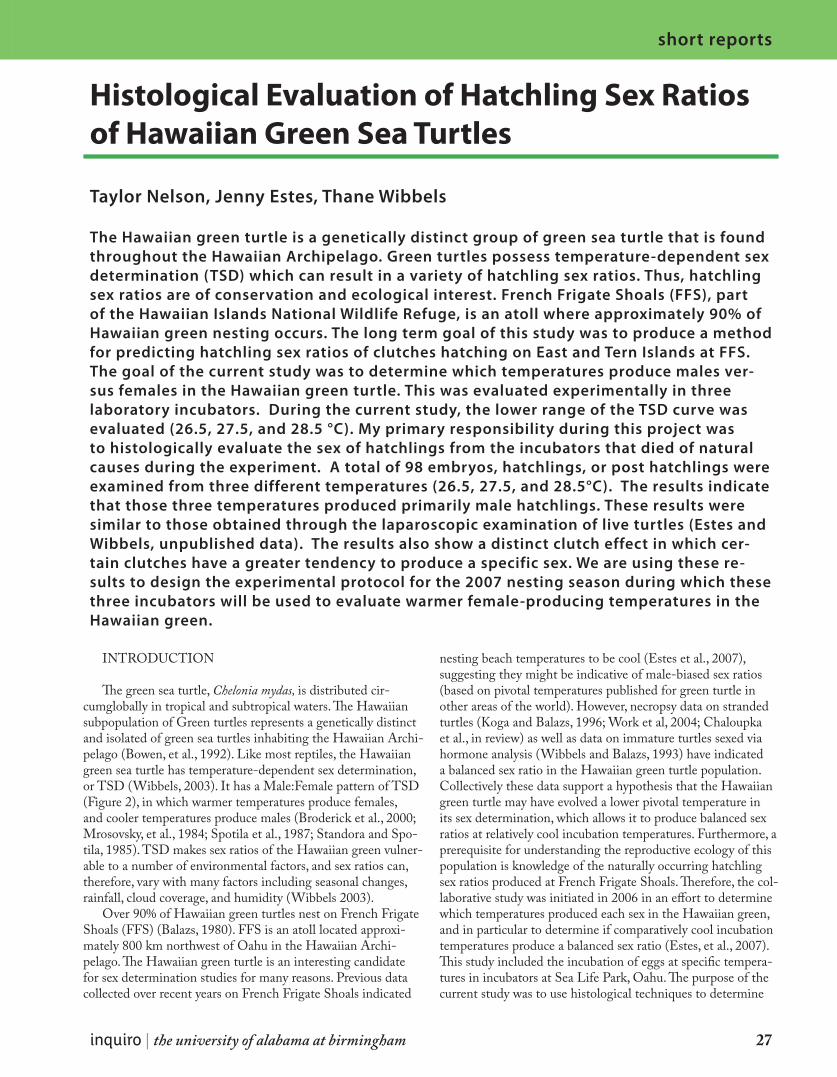
A closer analysis of the inter-hemisphere conditions reveal some interesting trends. There is no significant difference in RT between conditions where the color word is presented to the left or right hemisphere when collapsing across matched and unmatched stimuli (p<.15). However, when one examines the inter-hemispheric data separately for matched and mis-matched stimuli one finds that when the color word matches the ink color RTs are significantly faster (p<.05) when the word is presented to the right hemisphere. When the color word and ink color are not matched RTs are faster (p<05) when the word is presented to the left hemisphere. These data are presented in Figures 7 and 8.
RESULTS AND CONCLUSIONS
The present study replicates the classic match/mismatch effect showing faster RT for matched stimuli in comparison to mismatched stimuli. When both the color word and ink color patch were presented to only one hemisphere there were no significant differences in processing time between stimuli pre-sented to the left and right hemispheres. This pattern of results would be expected even in the presence of hemispheric spe-cialization since each hemisphere would have to process both a ‘preferred’ and ‘non-preferred’ type of stimulus. A comparison of the intra- and inter-hemispheric presentation conditions indicated a tendency for RTs in the inter-hemispheric condi-tions to be faster than those in the intra-hemispheric condi-tions. In the former condition the hemispheres would have received their respective ‘preferred’ type of stimulus on 50% of the trials without the need for additional callosal transfers. The most interesting data in the current study came from an ex-amination of the inter-hemispheric stimulus conditions. As in Dyer (1973) there appears not to be a significant difference in processing time between the left and right hemispheres when the word is presented in one hemisphere and the ink color in the opposite hemisphere. Based on hemispheric specializa-tion one might predict that RT would be faster when the left hemisphere received the color word and the right hemisphere received the ink color patch compared to the opposite situa-tion. Unlike previous investigators the current study allowed for a more fine-grained analysis of trials that were matches and mismatches. This revealed an interesting pattern of results. In the match trials, RT was significantly faster when the color word was presented to the right hemisphere and the ink color to the left hemisphere. On the surface this seems to contradict what we know about left hemisphere specialization for verbal material. However if one assumes that the presentation of the ink color patch to the left hemisphere initiates a process to generate a color-word label then by the time the color word is transferred from the right hemisphere the two color labels can be matched and no further processing is needed
to generate the right-handed response. In match trials where the color word is presented to the left hemisphere and the ink color patch is presented to the right hemisphere, processing is slower relative to the above condition. It is hypothesized that while the initial processing of the color word in the left hemi-sphere and the initial processing of the ink color patch in the right hemisphere is relatively fast, additional time is needed to transfer the color stimulus to the left hemisphere and gener-ate a verbal label which can then be matched with the already processed color word. One can adopt a similar explanatory framework for an opposite pattern of results for mismatch trials. In mismatch trials RT was faster when the color word was presented to the left hemisphere and the ink color patch was presented to the right hemisphere. In these conditions the left hemisphere presumably processed the color word quickly and the right hemisphere processed the ink color patch quick-ly. For the decision to be made and a right-handed response to be generated, the ink color stimulus would have to be trans-ferred to the left hemisphere, a verbal label generated for the ink color, and additional time taken for the mismatch in verbal labels to be resolved. Mismatch trials in which the color word was presented to the right hemisphere and the ink color patch was presented to the left hemisphere were much slower. As in the match conditions described above, the presentation of the ink color patch to the left hemisphere initiates a process to generate a color-word label while the color word is transferred from the right hemisphere. However because of the mismatch it is hypothesized that the ink color stimulus must be sent to the right hemisphere for more in-depth processing before a correct response can be made. This additional processing step serves to lengthen the RT. These hypotheses regarding the opposing biases in hemispheric advantages revealed by the separate analyses of matched and mismatched trials will be examined in future studies.
REFERENCES
Belanger, H.G., & Cimino, C.R. (2002). The lateralized •Stroop: A meta-analysis and its implications for models of semantic processing. Brain and Language, 83(3). Dyer, F.N. (1973). Interference and Facilitation for Color •Naming with Separate Bilateral Presentations of the Word and Color. Experimental Psychology, 99(3), 314-317.Gazzaniga, M.S. (2000). Cerebral specialization and inter-•hemispheric specialization. Brain, 123, 1293-1326.Oldfield, R.C. (1971) The assessment and analysis of •handedness: the Edinburgh inventory. Neuropsychologia. 9(1):97-113.Stroop, J.R. (1935) Studies of Interference in Serial Verbal •Reactions. Journal of Experimental Psychology, 18 (6), 643-662.Stroop, J.R. (1938) Factors affecting speed in serial verbal •reactions. Psychological Monographs, 50 (No. 5) 38-48.
inquiro | the university of alabama at birmingham 27
short reports
INTRODUCTION
The green sea turtle, Chelonia mydas, is distributed cir-cumglobally in tropical and subtropical waters. The Hawaiian subpopulation of Green turtles represents a genetically distinct and isolated of green sea turtles inhabiting the Hawaiian Archi-pelago (Bowen, et al., 1992). Like most reptiles, the Hawaiian green sea turtle has temperature-dependent sex determination, or TSD (Wibbels, 2003). It has a Male:Female pattern of TSD (Figure 2), in which warmer temperatures produce females, and cooler temperatures produce males (Broderick et al., 2000; Mrosovsky, et al., 1984; Spotila et al., 1987; Standora and Spo-tila, 1985). TSD makes sex ratios of the Hawaiian green vulner-able to a number of environmental factors, and sex ratios can, therefore, vary with many factors including seasonal changes, rainfall, cloud coverage, and humidity (Wibbels 2003).
Over 90% of Hawaiian green turtles nest on French Frigate Shoals (FFS) (Balazs, 1980). FFS is an atoll located approxi-mately 800 km northwest of Oahu in the Hawaiian Archi-pelago. The Hawaiian green turtle is an interesting candidate for sex determination studies for many reasons. Previous data collected over recent years on French Frigate Shoals indicated
nesting beach temperatures to be cool (Estes et al., 2007), suggesting they might be indicative of male-biased sex ratios (based on pivotal temperatures published for green turtle in other areas of the world). However, necropsy data on stranded turtles (Koga and Balazs, 1996; Work et al, 2004; Chaloupka et al., in review) as well as data on immature turtles sexed via hormone analysis (Wibbels and Balazs, 1993) have indicated a balanced sex ratio in the Hawaiian green turtle population. Collectively these data support a hypothesis that the Hawaiian green turtle may have evolved a lower pivotal temperature in its sex determination, which allows it to produce balanced sex ratios at relatively cool incubation temperatures. Furthermore, a prerequisite for understanding the reproductive ecology of this population is knowledge of the naturally occurring hatchling sex ratios produced at French Frigate Shoals. Therefore, the col-laborative study was initiated in 2006 in an effort to determine which temperatures produced each sex in the Hawaiian green, and in particular to determine if comparatively cool incubation temperatures produce a balanced sex ratio (Estes, et al., 2007). This study included the incubation of eggs at specific tempera-tures in incubators at Sea Life Park, Oahu. The purpose of the current study was to use histological techniques to determine
Histological Evaluation of Hatchling Sex Ratios of Hawaiian Green Sea Turtles
Taylor Nelson, Jenny Estes, Thane Wibbels
The Hawaiian green turtle is a genetically distinct group of green sea turtle that is found throughout the Hawaiian Archipelago. Green turtles possess temperature-dependent sex determination (TSD) which can result in a variety of hatchling sex ratios. Thus, hatchling sex ratios are of conservation and ecological interest. French Frigate Shoals (FFS), part of the Hawaiian Islands National Wildlife Refuge, is an atoll where approximately 90% of Hawaiian green nesting occurs. The long term goal of this study was to produce a method for predicting hatchling sex ratios of clutches hatching on East and Tern Islands at FFS. The goal of the current study was to determine which temperatures produce males ver-sus females in the Hawaiian green turtle. This was evaluated experimentally in three laboratory incubators. During the current study, the lower range of the TSD curve was evaluated (26.5, 27.5, and 28.5 °C). My primary responsibility during this project was to histologically evaluate the sex of hatchlings from the incubators that died of natural causes during the experiment. A total of 98 embryos, hatchlings, or post hatchlings were examined from three different temperatures (26.5, 27.5, and 28.5°C). The results indicate that those three temperatures produced primarily male hatchlings. These results were similar to those obtained through the laparoscopic examination of live turtles (Estes and Wibbels, unpublished data). The results also show a distinct clutch effect in which cer-tain clutches have a greater tendency to produce a specific sex. We are using these re-sults to design the experimental protocol for the 2007 nesting season during which these three incubators will be used to evaluate warmer female-producing temperatures in the Hawaiian green.
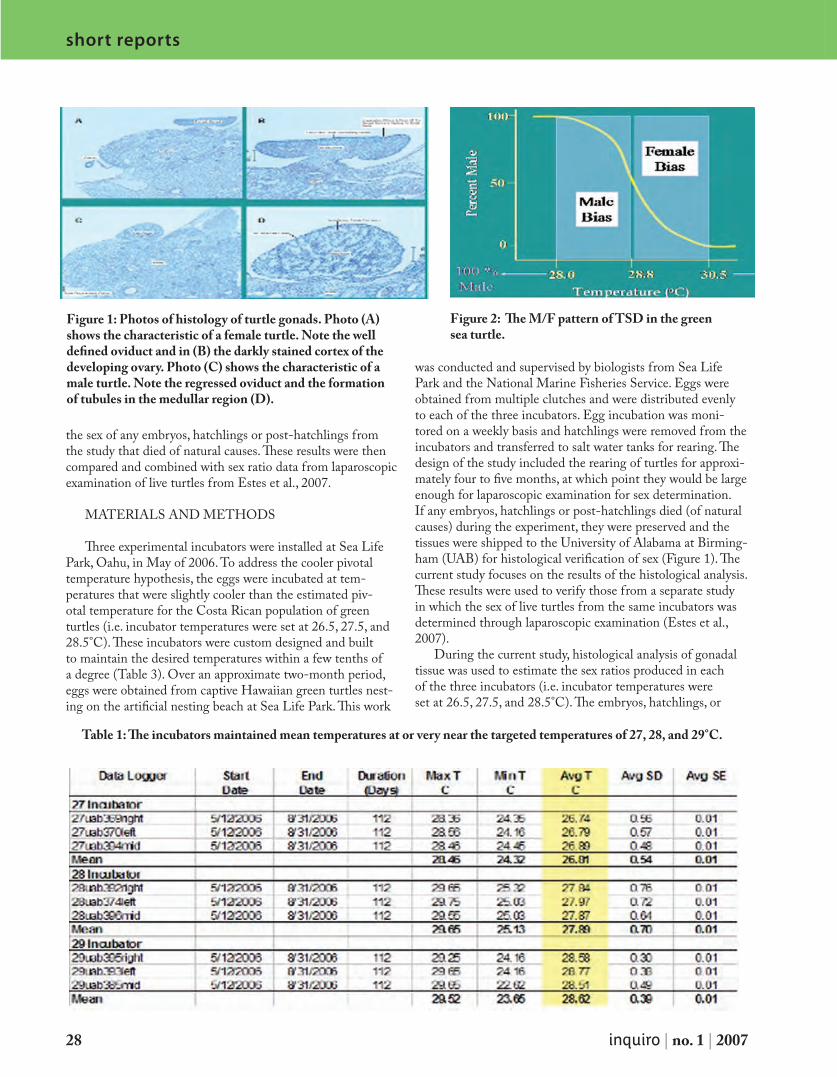
28 inquiro | no. 1 | 2007
short reports
the sex of any embryos, hatchlings or post-hatchlings from the study that died of natural causes. These results were then compared and combined with sex ratio data from laparoscopic examination of live turtles from Estes et al., 2007.
MATERIALS AND METHODS
Three experimental incubators were installed at Sea Life Park, Oahu, in May of 2006. To address the cooler pivotal temperature hypothesis, the eggs were incubated at tem-peratures that were slightly cooler than the estimated piv-otal temperature for the Costa Rican population of green turtles (i.e. incubator temperatures were set at 26.5, 27.5, and 28.5°C). These incubators were custom designed and built to maintain the desired temperatures within a few tenths of a degree (Table 3). Over an approximate two-month period, eggs were obtained from captive Hawaiian green turtles nest-ing on the artificial nesting beach at Sea Life Park. This work
was conducted and supervised by biologists from Sea Life Park and the National Marine Fisheries Service. Eggs were obtained from multiple clutches and were distributed evenly to each of the three incubators. Egg incubation was moni-tored on a weekly basis and hatchlings were removed from the incubators and transferred to salt water tanks for rearing. The design of the study included the rearing of turtles for approxi-mately four to five months, at which point they would be large enough for laparoscopic examination for sex determination. If any embryos, hatchlings or post-hatchlings died (of natural causes) during the experiment, they were preserved and the tissues were shipped to the University of Alabama at Birming-ham (UAB) for histological verification of sex (Figure 1). The current study focuses on the results of the histological analysis. These results were used to verify those from a separate study in which the sex of live turtles from the same incubators was determined through laparoscopic examination (Estes et al., 2007).
During the current study, histological analysis of gonadal tissue was used to estimate the sex ratios produced in each of the three incubators (i.e. incubator temperatures were set at 26.5, 27.5, and 28.5°C). The embryos, hatchlings, or
Figure 1: Photos of histology of turtle gonads. Photo (A) shows the characteristic of a female turtle. Note the well defined oviduct and in (B) the darkly stained cortex of the developing ovary. Photo (C) shows the characteristic of a male turtle. Note the regressed oviduct and the formation of tubules in the medullar region (D).
Figure 2: The M/F pattern of TSD in the green sea turtle.
Table 1: The incubators maintained mean temperatures at or very near the targeted temperatures of 27, 28, and 29°C.
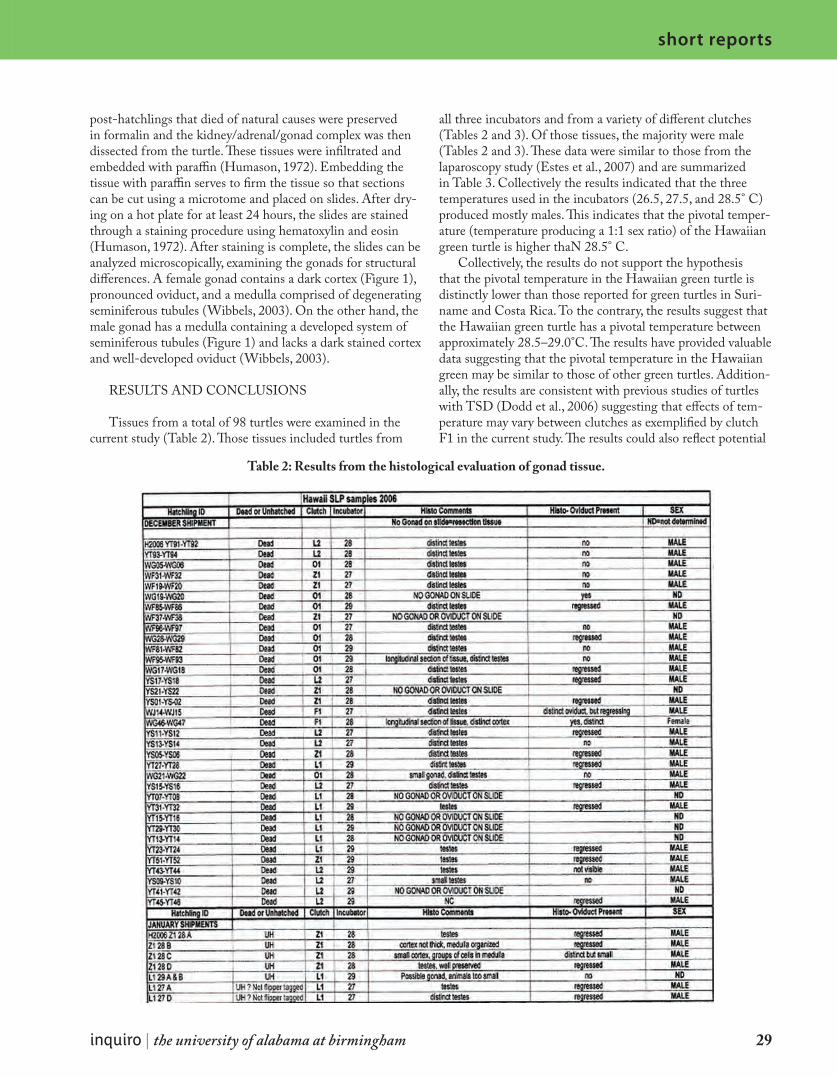
inquiro | the university of alabama at birmingham 29
short reports
post-hatchlings that died of natural causes were preserved in formalin and the kidney/adrenal/gonad complex was then dissected from the turtle. These tissues were infiltrated and embedded with paraffin (Humason, 1972). Embedding the tissue with paraffin serves to firm the tissue so that sections can be cut using a microtome and placed on slides. After dry-ing on a hot plate for at least 24 hours, the slides are stained through a staining procedure using hematoxylin and eosin (Humason, 1972). After staining is complete, the slides can be analyzed microscopically, examining the gonads for structural differences. A female gonad contains a dark cortex (Figure 1), pronounced oviduct, and a medulla comprised of degenerating seminiferous tubules (Wibbels, 2003). On the other hand, the male gonad has a medulla containing a developed system of seminiferous tubules (Figure 1) and lacks a dark stained cortex and well-developed oviduct (Wibbels, 2003).
RESULTS AND CONCLUSIONS
Tissues from a total of 98 turtles were examined in the current study (Table 2). Those tissues included turtles from
all three incubators and from a variety of different clutches (Tables 2 and 3). Of those tissues, the majority were male (Tables 2 and 3). These data were similar to those from the laparoscopy study (Estes et al., 2007) and are summarized in Table 3. Collectively the results indicated that the three temperatures used in the incubators (26.5, 27.5, and 28.5° C) produced mostly males. This indicates that the pivotal temper-ature (temperature producing a 1:1 sex ratio) of the Hawaiian green turtle is higher thaN 28.5° C.
Collectively, the results do not support the hypothesis that the pivotal temperature in the Hawaiian green turtle is distinctly lower than those reported for green turtles in Suri-name and Costa Rica. To the contrary, the results suggest that the Hawaiian green turtle has a pivotal temperature between approximately 28.5–29.0°C. The results have provided valuable data suggesting that the pivotal temperature in the Hawaiian green may be similar to those of other green turtles. Addition-ally, the results are consistent with previous studies of turtles with TSD (Dodd et al., 2006) suggesting that effects of tem-perature may vary between clutches as exemplified by clutch F1 in the current study. The results could also reflect potential
Table 2: Results from the histological evaluation of gonad tissue.
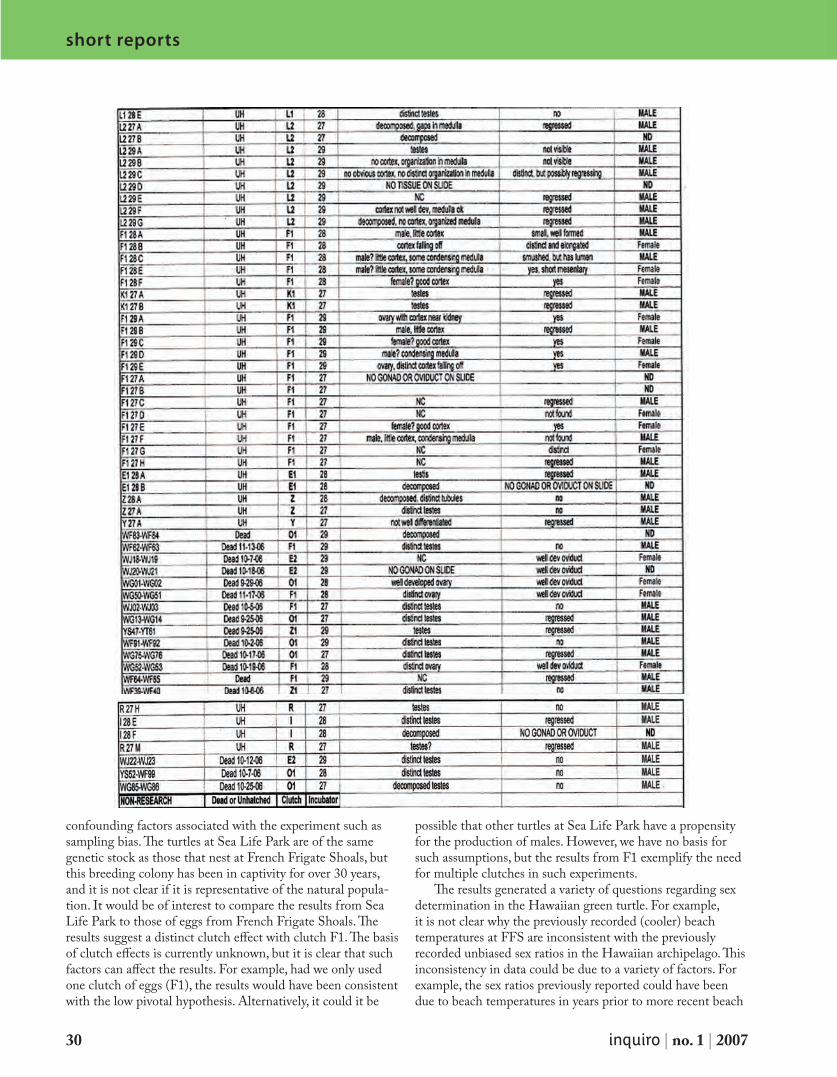
30 inquiro | no. 1 | 2007
short reports
confounding factors associated with the experiment such as sampling bias. The turtles at Sea Life Park are of the same genetic stock as those that nest at French Frigate Shoals, but this breeding colony has been in captivity for over 30 years, and it is not clear if it is representative of the natural popula-tion. It would be of interest to compare the results from Sea Life Park to those of eggs from French Frigate Shoals. The results suggest a distinct clutch effect with clutch F1. The basis of clutch effects is currently unknown, but it is clear that such factors can affect the results. For example, had we only used one clutch of eggs (F1), the results would have been consistent with the low pivotal hypothesis. Alternatively, it could it be
possible that other turtles at Sea Life Park have a propensity for the production of males. However, we have no basis for such assumptions, but the results from F1 exemplify the need for multiple clutches in such experiments.
The results generated a variety of questions regarding sex determination in the Hawaiian green turtle. For example, it is not clear why the previously recorded (cooler) beach temperatures at FFS are inconsistent with the previously recorded unbiased sex ratios in the Hawaiian archipelago. This inconsistency in data could be due to a variety of factors. For example, the sex ratios previously reported could have been due to beach temperatures in years prior to more recent beach
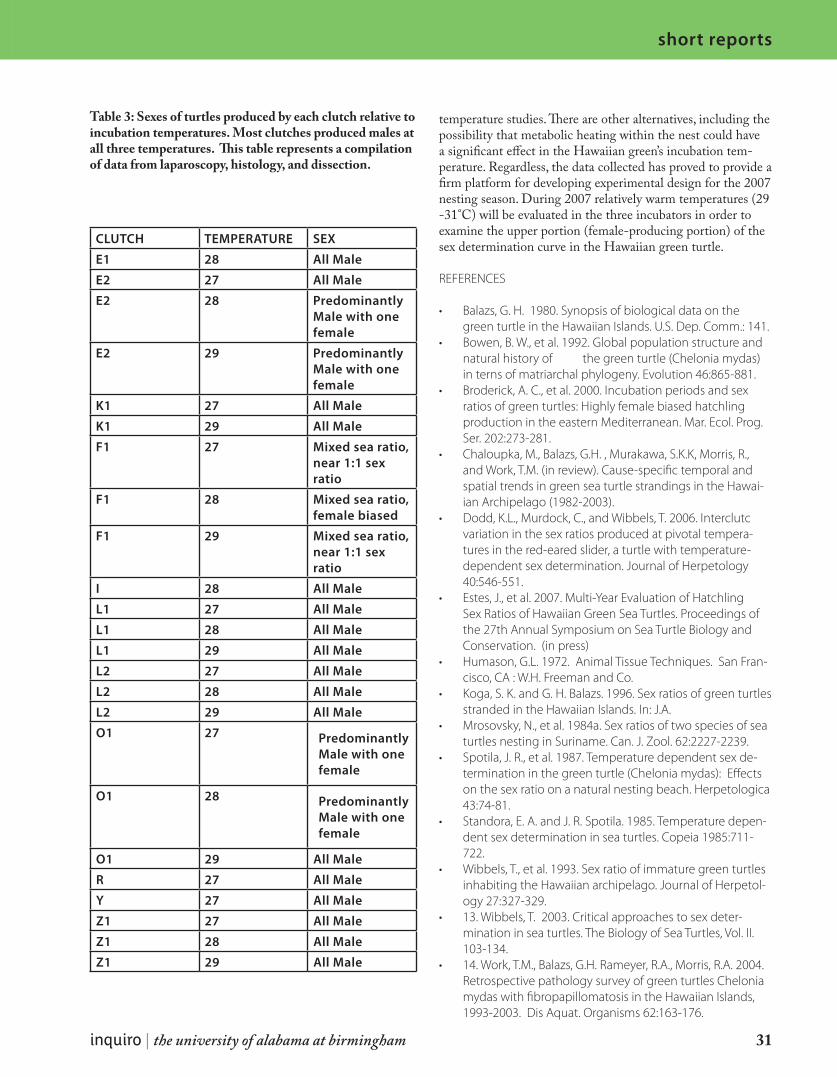
inquiro | the university of alabama at birmingham 31
short reports
temperature studies. There are other alternatives, including the possibility that metabolic heating within the nest could have a significant effect in the Hawaiian green’s incubation tem-perature. Regardless, the data collected has proved to provide a firm platform for developing experimental design for the 2007 nesting season. During 2007 relatively warm temperatures (29 -31°C) will be evaluated in the three incubators in order to examine the upper portion (female-producing portion) of the sex determination curve in the Hawaiian green turtle.
REFERENCES
Balazs, G. H. 1980. Synopsis of biological data on the •green turtle in the Hawaiian Islands. U.S. Dep. Comm.: 141.Bowen, B. W., et al. 1992. Global population structure and •natural history of the green turtle (Chelonia mydas) in terns of matriarchal phylogeny. Evolution 46:865-881.Broderick, A. C., et al. 2000. Incubation periods and sex •ratios of green turtles: Highly female biased hatchling production in the eastern Mediterranean. Mar. Ecol. Prog. Ser. 202:273-281.Chaloupka, M., Balazs, G.H. , Murakawa, S.K.K, Morris, R., •and Work, T.M. (in review). Cause-specific temporal and spatial trends in green sea turtle strandings in the Hawai-ian Archipelago (1982-2003).Dodd, K.L., Murdock, C., and Wibbels, T. 2006. Interclutc •variation in the sex ratios produced at pivotal tempera-tures in the red-eared slider, a turtle with temperature-dependent sex determination. Journal of Herpetology 40:546-551.Estes, J., et al. 2007. Multi-Year Evaluation of Hatchling •Sex Ratios of Hawaiian Green Sea Turtles. Proceedings of the 27th Annual Symposium on Sea Turtle Biology and Conservation. (in press)Humason, G.L. 1972. Animal Tissue Techniques. San Fran-•cisco, CA : W.H. Freeman and Co.Koga, S. K. and G. H. Balazs. 1996. Sex ratios of green turtles •stranded in the Hawaiian Islands. In: J.A. Mrosovsky, N., et al. 1984a. Sex ratios of two species of sea •turtles nesting in Suriname. Can. J. Zool. 62:2227-2239.Spotila, J. R., et al. 1987. Temperature dependent sex de-•termination in the green turtle (Chelonia mydas): Effects on the sex ratio on a natural nesting beach. Herpetologica 43:74-81.Standora, E. A. and J. R. Spotila. 1985. Temperature depen-•dent sex determination in sea turtles. Copeia 1985:711-722.Wibbels, T., et al. 1993. Sex ratio of immature green turtles •inhabiting the Hawaiian archipelago. Journal of Herpetol-ogy 27:327-329.13. Wibbels, T. 2003. Critical approaches to sex deter-•mination in sea turtles. The Biology of Sea Turtles, Vol. II. 103-134.14. Work, T.M., Balazs, G.H. Rameyer, R.A., Morris, R.A. 2004. •Retrospective pathology survey of green turtles Chelonia mydas with fibropapillomatosis in the Hawaiian Islands, 1993-2003. Dis Aquat. Organisms 62:163-176.
Table 3: Sexes of turtles produced by each clutch relative to incubation temperatures. Most clutches produced males at all three temperatures. This table represents a compilation of data from laparoscopy, histology, and dissection.
CLUTCH TEMPERATURE SEX
E1 28 All Male
E2 27 All Male
E2 28 Predominantly Male with one female
E2 29 Predominantly Male with one female
K1 27 All Male
K1 29 All Male
F1 27 Mixed sea ratio, near 1:1 sex ratio
F1 28 Mixed sea ratio, female biased
F1 29 Mixed sea ratio, near 1:1 sex ratio
I 28 All Male
L1 27 All Male
L1 28 All Male
L1 29 All Male
L2 27 All Male
L2 28 All Male
L2 29 All Male
O1 27 Predominantly Male with one female
O1 28 Predominantly Male with one female
O1 29 All Male
R 27 All Male
Y 27 All Male
Z1 27 All Male
Z1 28 All Male
Z1 29 All Male
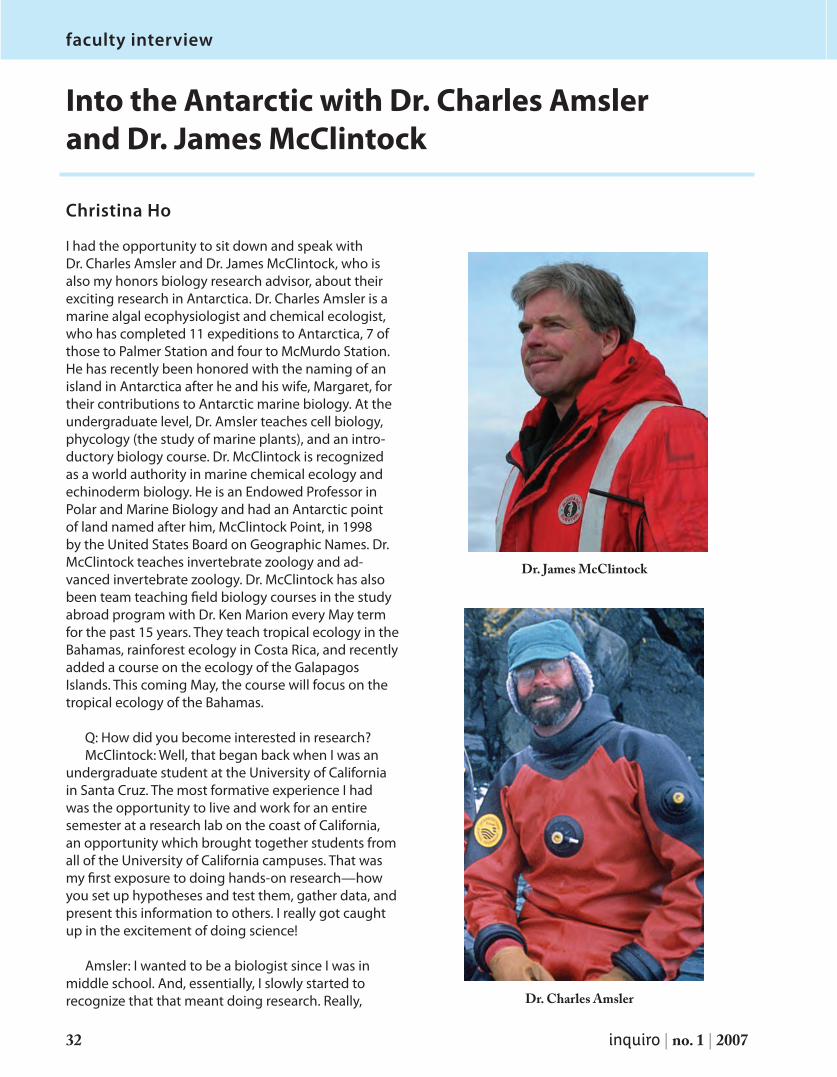
32 inquiro | no. 1 | 2007
faculty interview
I had the opportunity to sit down and speak with Dr. Charles Amsler and Dr. James McClintock, who is also my honors biology research advisor, about their exciting research in Antarctica. Dr. Charles Amsler is a marine algal ecophysiologist and chemical ecologist, who has completed 11 expeditions to Antarctica, 7 of those to Palmer Station and four to McMurdo Station. He has recently been honored with the naming of an island in Antarctica after he and his wife, Margaret, for their contributions to Antarctic marine biology. At the undergraduate level, Dr. Amsler teaches cell biology, phycology (the study of marine plants), and an intro-ductory biology course. Dr. McClintock is recognized as a world authority in marine chemical ecology and echinoderm biology. He is an Endowed Professor in Polar and Marine Biology and had an Antarctic point of land named after him, McClintock Point, in 1998 by the United States Board on Geographic Names. Dr. McClintock teaches invertebrate zoology and ad-vanced invertebrate zoology. Dr. McClintock has also been team teaching field biology courses in the study abroad program with Dr. Ken Marion every May term for the past 15 years. They teach tropical ecology in the Bahamas, rainforest ecology in Costa Rica, and recently added a course on the ecology of the Galapagos Islands. This coming May, the course will focus on the tropical ecology of the Bahamas.
Q: How did you become interested in research?McClintock: Well, that began back when I was an
undergraduate student at the University of California in Santa Cruz. The most formative experience I had was the opportunity to live and work for an entire semester at a research lab on the coast of California, an opportunity which brought together students from all of the University of California campuses. That was my first exposure to doing hands-on research—how you set up hypotheses and test them, gather data, and present this information to others. I really got caught up in the excitement of doing science!
Amsler: I wanted to be a biologist since I was in middle school. And, essentially, I slowly started to recognize that that meant doing research. Really,
Into the Antarctic with Dr. Charles Amsler and Dr. James McClintock
Christina Ho
Dr. James McClintock
Dr. Charles Amsler
inquiro | the university of alabama at birmingham 33
faculty interview
where I learned what research was about and what really set my career goals was when I was an under-graduate at Duke University. I got the opportunity to do research in the summer at the Duke Marine Lab, but then, especially coming back to the main campus and spending a lot of time there doing research with my faculty advisor and with graduate students and an adjoining group, is really where my passion set in for doing science.
Q: Where did you attend graduate school?Amsler: I did my masters at the University of North
Carolina in Wilmington, and my Ph.D. at the University of California in Santa Barbara.
McClintock: I did both my masters and doctorate degree at the University of South Florida in Tampa.
Q: So how long have you been at UAB and what persuaded you to come here?
McClintock: I’ve been at UAB for 20 years now. I did a post-doctorate at the University of California at Santa Cruz, and when I interviewed at UAB 20 years ago, I was very impressed and would go so far as to say surprised by what an exciting institution it was. It was young; it was vibrant; and I knew it was a place where I could be supported in my work and I got very excited about coming here. It’s been a very good place to do research and teach.
Amsler: I started here in the Fall of 1994. I came because I was really excited by the department, and they happened to have a job for someone like me. The department was and still is very vibrant, and it empha-sizes aquatic biology, systems, and organisms, which is what I work on, at the graduate and research level. While we have a large undergraduate responsibility to pre-medical and pre-professional students, at the graduate level, we’re different, and that works out very, very well for me.
Q: How long have you two been collaborating and how did that come about?
Amsler: I was and still am interested in chemical cues that are involved in the settlement of marine organisms, both the spores of algae, which is what I usually work on, and also the settlement of larvae of invertebrates. I wanted to start a project that blended that with applied antifouling research, that is, how to prevent things from settling on ships or pilings without killing them. Dr. McClintock had a previous
graduate student who was just finishing and had a project very much along those lines. I wanted to pick up on that work and use what he had found to start asking questions myself. So we developed a collabora-tion there. I had already been working in Antarctica in the past, and a few years later, there was an opportuni-ty to collaborate there. We worked very well together. It was very successful, and we’ve been collaborating ever since. Pretty much, we began working together in 1996, so it’s been over ten years now.
Q: Tell me a little about your current research project.
Amsler: Our main project is also our main collabora-tive project, and that’s focused on work in Antarctica. Our project is examining the role of very small, shrimp-like organisms, called amphipods, which are extraor-dinarily abundant. We have come to believe they are a major consumer in the community, both as a major herbivore and carnivore. We are focusing on the inter-actions between those tiny but incredibly numerous organisms and how the pressure of their herbivory on the seaweeds, and potentially their carnivory on the invertebrates, may be the primary force in structuring the community. That’s the focus of our main project.
Q: Do you have any other side projects?Amsler: In looking at predation pressure exerted by
these small organisms. One of the things we’re look-ing at currently is how they prey on small, filamentous algae. These little filamentous algae, which look like brown and green fuzz balls, are difficult to tell apart, so we have developed some taxonomic techniques to help us. These have actually led into some interesting taxonomic and evolutionary questions within these algae that are only tangentially involved with our main project. We’ve actually got an undergraduate student looking at just that particular point. We’ve also continued to be interested in the settlement factors as measured by motion of spores and larvae, and have got another undergraduate looking at physical and chemical factors that influence the movement of spores and hopefully unicellular red algae at very small spatial scales. They all revolve around chemical, physi-cal influences of the environment or of other organ-isms on each other.
Q: And this is all within the Antarctic environment?Amsler: Well, not necessarily. There are two taxo-
nomic questions that we’re looking at—one deals with Antarctica and one does not. With the spore swim-
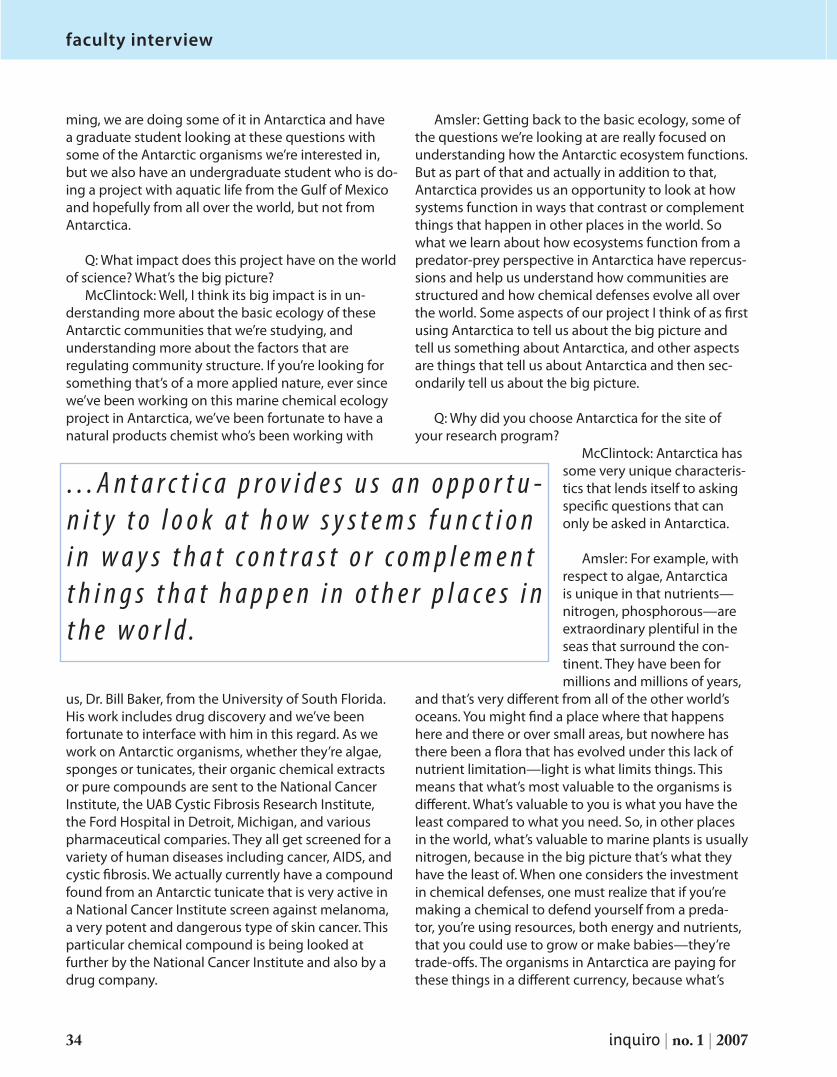
34 inquiro | no. 1 | 2007
faculty interview
ming, we are doing some of it in Antarctica and have a graduate student looking at these questions with some of the Antarctic organisms we’re interested in, but we also have an undergraduate student who is do-ing a project with aquatic life from the Gulf of Mexico and hopefully from all over the world, but not from Antarctica.
Q: What impact does this project have on the world of science? What’s the big picture?
McClintock: Well, I think its big impact is in un-derstanding more about the basic ecology of these Antarctic communities that we’re studying, and understanding more about the factors that are regulating community structure. If you’re looking for something that’s of a more applied nature, ever since we’ve been working on this marine chemical ecology project in Antarctica, we’ve been fortunate to have a natural products chemist who’s been working with
us, Dr. Bill Baker, from the University of South Florida. His work includes drug discovery and we’ve been fortunate to interface with him in this regard. As we work on Antarctic organisms, whether they’re algae, sponges or tunicates, their organic chemical extracts or pure compounds are sent to the National Cancer Institute, the UAB Cystic Fibrosis Research Institute, the Ford Hospital in Detroit, Michigan, and various pharmaceutical comparies. They all get screened for a variety of human diseases including cancer, AIDS, and cystic fibrosis. We actually currently have a compound found from an Antarctic tunicate that is very active in a National Cancer Institute screen against melanoma, a very potent and dangerous type of skin cancer. This particular chemical compound is being looked at further by the National Cancer Institute and also by a drug company.
Amsler: Getting back to the basic ecology, some of the questions we’re looking at are really focused on understanding how the Antarctic ecosystem functions. But as part of that and actually in addition to that, Antarctica provides us an opportunity to look at how systems function in ways that contrast or complement things that happen in other places in the world. So what we learn about how ecosystems function from a predator-prey perspective in Antarctica have repercus-sions and help us understand how communities are structured and how chemical defenses evolve all over the world. Some aspects of our project I think of as first using Antarctica to tell us about the big picture and tell us something about Antarctica, and other aspects are things that tell us about Antarctica and then sec-ondarily tell us about the big picture.
Q: Why did you choose Antarctica for the site of your research program?
McClintock: Antarctica has some very unique characteris-tics that lends itself to asking specific questions that can only be asked in Antarctica.
Amsler: For example, with respect to algae, Antarctica is unique in that nutrients—nitrogen, phosphorous—are extraordinary plentiful in the seas that surround the con-tinent. They have been for millions and millions of years,
and that’s very different from all of the other world’s oceans. You might find a place where that happens here and there or over small areas, but nowhere has there been a flora that has evolved under this lack of nutrient limitation—light is what limits things. This means that what’s most valuable to the organisms is different. What’s valuable to you is what you have the least compared to what you need. So, in other places in the world, what’s valuable to marine plants is usually nitrogen, because in the big picture that’s what they have the least of. When one considers the investment in chemical defenses, one must realize that if you’re making a chemical to defend yourself from a preda-tor, you’re using resources, both energy and nutrients, that you could use to grow or make babies—they’re trade-offs. The organisms in Antarctica are paying for these things in a different currency, because what’s
. . . A n t a r c t i c a p r o v i d e s u s a n o p p o r t u -n i t y t o l o o k a t h o w s y s t e m s f u n c t i o n i n w a y s t h a t c o n t r a s t o r c o m p l e m e n t t h i n g s t h a t h a p p e n i n o t h e r p l a c e s i n t h e w o r l d .
inquiro | the university of alabama at birmingham 35
faculty interview
most valuable to them is the carbon that they get from carbon dioxide that they fix with the sunlight, which is limiting over the course of the year. It’s allowed us to test ideas from other parts of the world that are based on cost and benefit defenses from systems that operate under a different currency. And if the ideas are right, then it shouldn’t matter what the currency is, but if a particular currency is what shaped the idea or observations that the ideas are based on, then that’s telling us that we need to back up and think at a basic level about the evolution of defense and what’s driven it, so it really gives us a powerful tool.
McClintock: And I would add from the invertebrate perspective, in looking at these predator-prey inter-actions that drive the evolution of chemical defense mechanisms, Antarctica is also unique. For example, sponges, soft corals and other organisms that use toxic chemistry to defend themselves because they can’t get up and run away from predators have preda-tors that are quite different from what you would find on a typical tropical coral reef. The primary sponge predators in Antarctica are sea stars. Sea stars actually extrude their stomach out of their mouth and lay it against the surface of their prey, so it’s quite remark-able. If you’re going to defend yourself most efficiently against this mode of predation, what you want to do is concentrate your chemical defenses in your outer layers, rather than invest in chemistry throughout the body. So these unique predator-prey interactions that occur in Antarctica lends themselves to some interesting questions that fall under the guise of what is known as Optimal Defense Theory, that is, where should you invest your resources to best insure de-fense of your most vulnerable body components or your offspring?
Q: How many scientists work in your lab?McClintock: I have a Research Associate, Mag-
gie Amsler, and then a current doctoral student, Gil Koplovitz. I also have two current Masters students, Jonathan Huang and Hamel Sevak, and then, well, you [Christina Ho] doing undergraduate honors research.
Amsler: I have three Ph.D. students, Kevin Peters, Craig Aumack, and Philip Bucolo, and two undergradu-ates working with me, Ben Huang and Karma Nelson. Dr. McClintock and I are also co-advising a postdoc-toral fellow, Dr. Jill Zamzow.
Q: Have you always been open to working with undergraduate students?
McClintock and Amsler: Yes, definitely.
Amsler: I often talk to freshmen coming into UAB or people looking at different universities, and I tell them that the opportunity to get involved in research and be part of the process of science is one of the things that is special about being at a research university. I encourage students to do research and definitely do everything I can to help facilitate this. And I think you’ll find that’s true in the vast majority of our faculty.
Q: Have you ever taken, or do you plan to take, an undergraduate student to Antarctica?
McClintock: Well, we’d like to.
Amsler: As a matter of fact, in a research proposal that we’ve got submitted right now, we specifically wrote in a field team spot for an undergraduate student. The problem normally is that there isn’t even enough space to take our graduate students along, or to take all of them, because the stations we work in are very bed-limited and space-limited. This new proposal is to work on a ship, where we’ll have more space avail-able. We came very close to taking an undergraduate for a short time last year, and actually our colleague Bill Baker took an undergraduate from his lab. Had he not been able to go, then one of our UAB undergrads would have filled that spot.
Q: What advice would you give to undergrads who are considering research activities, both now and as a career?
McClintock: My advice is to not to be bashful about approaching faculty that they’re interested in work-ing with, particularly at UAB, where there are so many opportunities to work with faculty who are active in their research. The best way to find out if this is really something you want to do as a career is to get in there and do it. You’ll find out really quickly if it is something that really grabs you or not.
Amsler: That’s exactly the same as my advice. It’s probably not something that you can start as a fresh-man or sophomore, in most cases because you really need that introductory biology background, but don’t wait past your sophomore year if you’re interested.
papers
36 inquiro | no. 1 | 2007
papers
Normally, the kidneys filter wastes and help balance water, salt, and electrolyte levels in the body. When the kidneys stop working, waste products, fluids, and electrolytes ac-cumulate. Acute kidney injury (AKI) is one class of renal injury that can result from renal ischemia, acute drug, or toxicant exposure [10]. AKI leads to the breakdown of the epi-thelium of the proximal tubule of the kidney, which is integral to the reabsorption and balancing of salts and electrolytes filtered in the kidney. Morphologically, AKI appears as a denuded epithelium and casts formed within blood vessels. These casts are made up of various proteins and dead or dying cells that have sloughed off of the epithelium. Renal ischemia, the primary cause of AKI in humans, is a decrease in the blood supply of the kidney caused by constriction or obstruction of the blood vessels, in part due to the cast formation. In animal models of AKI, renal ischemia has been shown to alter levels of various growth factors. Growth factor release from the injured regions of the kidney is thought to induce the repair process in the epithelium. We hypothesize that hepatocyte growth factor (HGF), a growth factor that may be involved in renal repair, is released from ischemic tissue and may induce the migration of reparative cells to the injured region.
INTRODUCTION
Recent findings suggest that in animal models of AKI, native kidney cells are the primary source of reparative cells. These reparative cells are believed to be either mature epithe-lial cells or daughter progenitor cells, two different modes of cellular repair of the kidneys that have been suggested to occur [2], [1]. One characteristic of reparative cells is the capacity to migrate, whether progenitor cells or mature epithelial cells. The recruitment of these reparative cells may be controlled by regulatory signal molecules including growth factors. The kid-ney is a known site of synthesis for several growth factors [9], and several have been suggested to be involved in the repair process in the kidney [3], [4], [5]. Uniquely, HGF has been shown to have ameliorative effects even when administered after the acute insult [8].
Past studies suggest that in AKI animal models, HGF exerts strong mitogenic and morphogenic effects for renal epi-thelial cells and HGF mRNA and blood HGF level are mark-edly induced after AKI [6]. When recombinant HGF was injected into during a four-week period, DNA synthesis of tubular epithelial cells was found to be higher than in control
mice without the HGF injection, suggesting that tubular cell expansion is promoted by HGF [11]. Additionally, in human patients with AKI, elevated urine HGF levels are described as consistent with a role for HGF in promoting tubular cell proliferation, whereas, patients with chronic glomerular or polycystic disease, as well as patients with advanced chronic renal insufficiency and healthy controls, show detectable but low urine HGF levels [11]. All of this evidence suggests that HGF may play an active role in promoting renal regeneration in AKI.
HGF is a pleiotropic growth factor synthesized in the kidney that affects growth, motility, differentiation, and morphogenesis of its target cells. HGF can be secreted from cells into the extracellular environment by cleavage of signal peptides. The receptor for HGF is c-Met tyrosine kinase, a proto-oncogene protein, which has two disulfide-linked sub-units, and an intracellular tyrosine kinase domain. Once HGF is released, it stimulates the c-Met receptor on its target cell in order to activate certain signal transduction cascades, and signaling via binding of HGF to the c-Met receptor induced by the tyrosine kinase activity results in the subsequent phos-phorylation of the c-terminal tyrosine residues [7].
There are still many aspects of HGF that are not fully
b iologyHGF Is Released By Ischemic Renal Tissue
Madhavi Tamarapalli
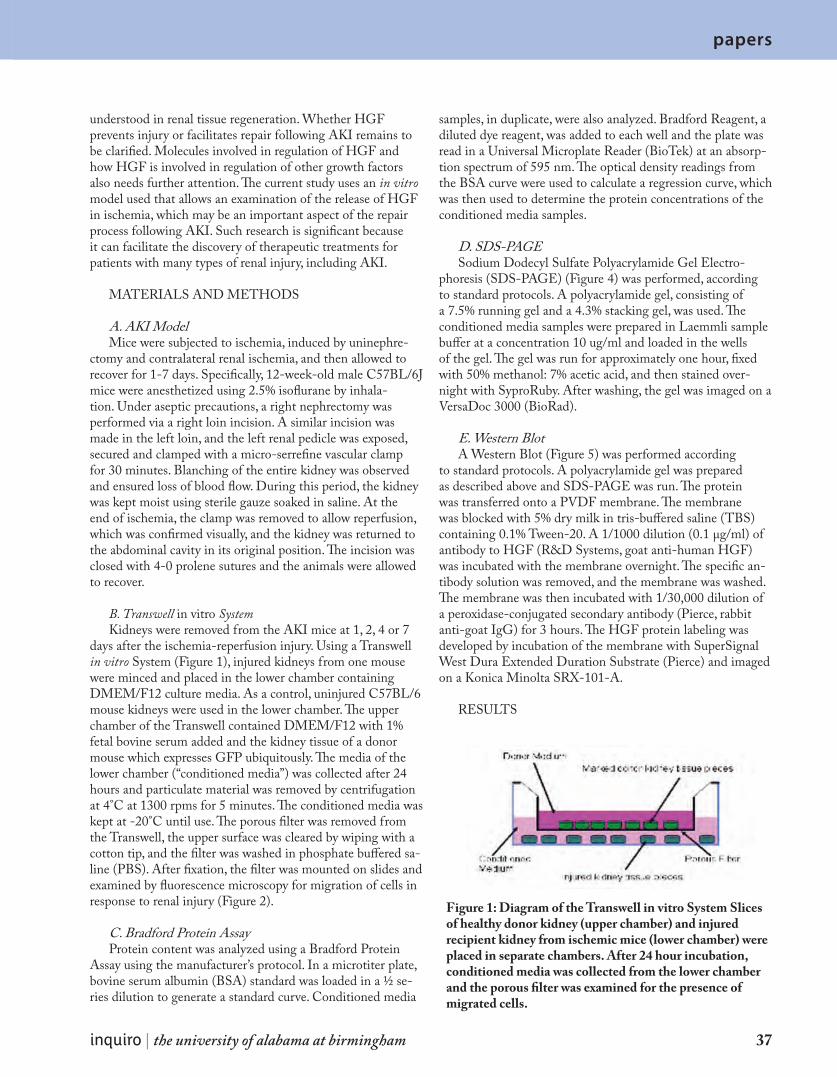
papers
inquiro | the university of alabama at birmingham 37
understood in renal tissue regeneration. Whether HGF prevents injury or facilitates repair following AKI remains to be clarified. Molecules involved in regulation of HGF and how HGF is involved in regulation of other growth factors also needs further attention. The current study uses an in vitro model used that allows an examination of the release of HGF in ischemia, which may be an important aspect of the repair process following AKI. Such research is significant because it can facilitate the discovery of therapeutic treatments for patients with many types of renal injury, including AKI.
MATERIALS AND METHODS
A. AKI ModelMice were subjected to ischemia, induced by uninephre-
ctomy and contralateral renal ischemia, and then allowed to recover for 1-7 days. Specifically, 12-week-old male C57BL/6J mice were anesthetized using 2.5% isoflurane by inhala-tion. Under aseptic precautions, a right nephrectomy was performed via a right loin incision. A similar incision was made in the left loin, and the left renal pedicle was exposed, secured and clamped with a micro-serrefine vascular clamp for 30 minutes. Blanching of the entire kidney was observed and ensured loss of blood flow. During this period, the kidney was kept moist using sterile gauze soaked in saline. At the end of ischemia, the clamp was removed to allow reperfusion, which was confirmed visually, and the kidney was returned to the abdominal cavity in its original position. The incision was closed with 4-0 prolene sutures and the animals were allowed to recover.
B. Transwell in vitro SystemKidneys were removed from the AKI mice at 1, 2, 4 or 7
days after the ischemia-reperfusion injury. Using a Transwell in vitro System (Figure 1), injured kidneys from one mouse were minced and placed in the lower chamber containing DMEM/F12 culture media. As a control, uninjured C57BL/6 mouse kidneys were used in the lower chamber. The upper chamber of the Transwell contained DMEM/F12 with 1% fetal bovine serum added and the kidney tissue of a donor mouse which expresses GFP ubiquitously. The media of the lower chamber (“conditioned media”) was collected after 24 hours and particulate material was removed by centrifugation at 4°C at 1300 rpms for 5 minutes. The conditioned media was kept at -20°C until use. The porous filter was removed from the Transwell, the upper surface was cleared by wiping with a cotton tip, and the filter was washed in phosphate buffered sa-line (PBS). After fixation, the filter was mounted on slides and examined by fluorescence microscopy for migration of cells in response to renal injury (Figure 2).
C. Bradford Protein AssayProtein content was analyzed using a Bradford Protein
Assay using the manufacturer’s protocol. In a microtiter plate, bovine serum albumin (BSA) standard was loaded in a ½ se-ries dilution to generate a standard curve. Conditioned media
samples, in duplicate, were also analyzed. Bradford Reagent, a diluted dye reagent, was added to each well and the plate was read in a Universal Microplate Reader (BioTek) at an absorp-tion spectrum of 595 nm. The optical density readings from the BSA curve were used to calculate a regression curve, which was then used to determine the protein concentrations of the conditioned media samples.
D. SDS-PAGESodium Dodecyl Sulfate Polyacrylamide Gel Electro-
phoresis (SDS-PAGE) (Figure 4) was performed, according to standard protocols. A polyacrylamide gel, consisting of a 7.5% running gel and a 4.3% stacking gel, was used. The conditioned media samples were prepared in Laemmli sample buffer at a concentration 10 ug/ml and loaded in the wells of the gel. The gel was run for approximately one hour, fixed with 50% methanol: 7% acetic acid, and then stained over-night with SyproRuby. After washing, the gel was imaged on a VersaDoc 3000 (BioRad).
E. Western BlotA Western Blot (Figure 5) was performed according
to standard protocols. A polyacrylamide gel was prepared as described above and SDS-PAGE was run. The protein was transferred onto a PVDF membrane. The membrane was blocked with 5% dry milk in tris-buffered saline (TBS) containing 0.1% Tween-20. A 1/1000 dilution (0.1 μg/ml) of antibody to HGF (R&D Systems, goat anti-human HGF) was incubated with the membrane overnight. The specific an-tibody solution was removed, and the membrane was washed. The membrane was then incubated with 1/30,000 dilution of a peroxidase-conjugated secondary antibody (Pierce, rabbit anti-goat IgG) for 3 hours. The HGF protein labeling was developed by incubation of the membrane with SuperSignal West Dura Extended Duration Substrate (Pierce) and imaged on a Konica Minolta SRX-101-A.
RESULTS
Figure 1: Diagram of the Transwell in vitro System Slices of healthy donor kidney (upper chamber) and injured recipient kidney from ischemic mice (lower chamber) were placed in separate chambers. After 24 hour incubation, conditioned media was collected from the lower chamber and the porous filter was examined for the presence of migrated cells.
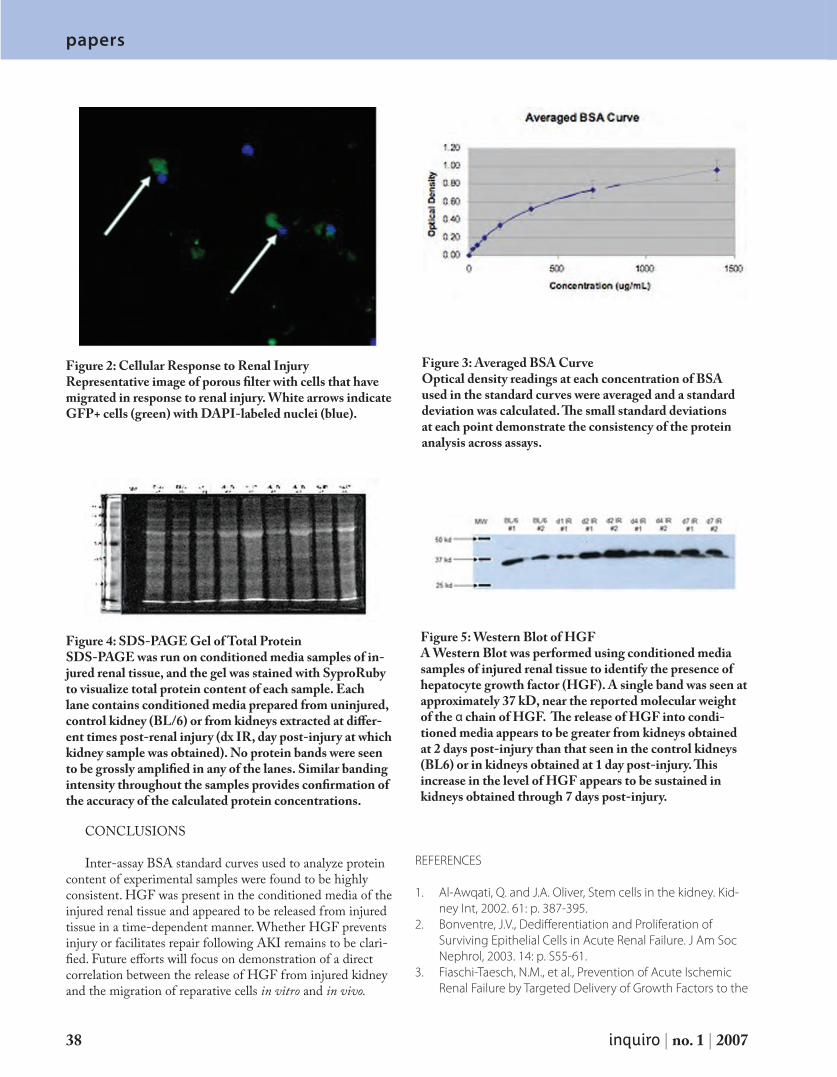
papers
38 inquiro | no. 1 | 2007
papers
CONCLUSIONS
Inter-assay BSA standard curves used to analyze protein content of experimental samples were found to be highly consistent. HGF was present in the conditioned media of the injured renal tissue and appeared to be released from injured tissue in a time-dependent manner. Whether HGF prevents injury or facilitates repair following AKI remains to be clari-fied. Future efforts will focus on demonstration of a direct correlation between the release of HGF from injured kidney and the migration of reparative cells in vitro and in vivo.
REFERENCES
Al-Awqati, Q. and J.A. Oliver, Stem cells in the kidney. Kid-1. ney Int, 2002. 61: p. 387-395.Bonventre, J.V., Dedifferentiation and Proliferation of 2. Surviving Epithelial Cells in Acute Renal Failure. J Am Soc Nephrol, 2003. 14: p. S55-61.Fiaschi-Taesch, N.M., et al., Prevention of Acute Ischemic 3. Renal Failure by Targeted Delivery of Growth Factors to the
Figure 2: Cellular Response to Renal InjuryRepresentative image of porous filter with cells that have migrated in response to renal injury. White arrows indicate GFP+ cells (green) with DAPI-labeled nuclei (blue).
Figure 3: Averaged BSA CurveOptical density readings at each concentration of BSA used in the standard curves were averaged and a standard deviation was calculated. The small standard deviations at each point demonstrate the consistency of the protein analysis across assays.
Figure 4: SDS-PAGE Gel of Total ProteinSDS-PAGE was run on conditioned media samples of in-jured renal tissue, and the gel was stained with SyproRuby to visualize total protein content of each sample. Each lane contains conditioned media prepared from uninjured, control kidney (BL/6) or from kidneys extracted at differ-ent times post-renal injury (dx IR, day post-injury at which kidney sample was obtained). No protein bands were seen to be grossly amplified in any of the lanes. Similar banding intensity throughout the samples provides confirmation of the accuracy of the calculated protein concentrations.
Figure 5: Western Blot of HGFA Western Blot was performed using conditioned media samples of injured renal tissue to identify the presence of hepatocyte growth factor (HGF). A single band was seen at approximately 37 kD, near the reported molecular weight of the α chain of HGF. The release of HGF into condi-tioned media appears to be greater from kidneys obtained at 2 days post-injury than that seen in the control kidneys (BL6) or in kidneys obtained at 1 day post-injury. This increase in the level of HGF appears to be sustained in kidneys obtained through 7 days post-injury.

papers papers
inquiro | the university of alabama at birmingham 39
Proximal Tubule in Transgenic Mice: The Efficacy of Para-thyroid Hormone-Related Protein and Hepatocyte Growth Factor. J Am Soc Nephrol, 2004. 15: p. 112-125.Humes, H.D., et al., Epidermal Growth Factor Enhances Re-4. nal Tubule Cell Regeneration and Repair and Accelerates the Recovery of Renal Function in Post-Ischemic Acute Renal Failure. J Clin Invest, 1989. 84: p. 1757-1761.Ichimura, T., et al., Induction of FGF-7 After Kidney Dam-5. age: A Possible Paracrine Mechanism for Tubule Repair. Am J Physiol Renal Physiol, 1996. 271: p. 967-976.Kawaida, K., et al., Hepatocyte Growth Factor Prevents 6. Acute Renal Failure of Accelerates Renal Regeneration in Mice. PNAS, 1994. 91(10): p. 4357-4361.Matsumoto, K. and T. Nakamura, Hepatocyte Growth Fac-7. tor: Renotropic Role and Potential Therapeutics for Renal Disease. Kidney Int, 2001. 59: p. 2023-2038.
Miller, S.B., et al., Hepatocyte Growth Factor Prevents Acute 8. Renal Failure of Accelerates Renal Recovery from Acute Ischemic Renal Injury in Rats. Am J Physiol Renal Physol, 1994. 266: p. F129-134.Nigam, S.K. and W. Lieberthal, Acute Renal Failure III. The 9. Role of Growth Factors in the Process of Renal Regenera-tion and Repair. Am J Physiol Renal Physiol, 2000. 279(1): p. F3-11.Nony, P.A. and R.G. Schnellmann, Mechanisms of Renal 10. Cell Repair and Regeneration After Acute Renal Failure. J Pharmacol Exp Ther, 2003. 304: p. 905-912.Vargas, G.A., et al., Hepatocyte Growth Factor in Renal Fail-11. ure: Promise and Reality. Kidney Int, 2000. 57: p. 1426-1436.
papers
40 inquiro | no. 1 | 2007
papers
b iology
There is little in published literature about motor control tests, and no published stud-ies on the performance of children with cerebral palsy. The MCT is an important test for therapists to use with children with cerebral palsy because it measures response to un-expected platform movements. It has been established that children with cerebral palsy have neuromuscular deficits, and it would be helpful for therapists to be able to measure response to these perturbations so they can design exercises that would better equip the children to function in an unpredictable world. Forssberg and Nashner (1981) studied the response of normal children to a sudden forward or backward movement of the support surface using a movable force platform and surface electromyography (EMG). They found that the latencies of children below 7 ½ years of age were more erratic and slower than the latencies demonstrated by adults in response to the stimulus. There was also a high degree of variability in the children’s EMG adjustments among the trials conducted, sug-gesting that younger children might randomly change the weighting of support surface, vestibular, and visual input when responding to sudden disturbances. No test-retest reli-ability was done for this study, and no studies addressing the response of children with cerebral palsy to a motor control test were found. To enable comprehensive balance testing of children with CP, the test-retest reli-ability of the SOT and MCT must be established. These results will increase confidence in the use of these measures to describe postural control abilities. Since the SOT has been proven reliable in typical children, we hypothesize that these tests will also be reliable in children with cerebral palsy.
INTRODUCTION
Children with Cerebral Palsy (CP), frequently have dif-ficulty maintaining balance, which decreases their ability to stand, sit upright, and walk. Standing balance is achieved through the interaction of three sensory systems: vestibular, somatosensory, and visual. The vestibular system uses input from the semicircular canals and otoliths in the inner ear to give information about head position and movement and subsequent postural adjustments. Movement of the head is detected by the semicircular canals, which sense the bending of sensory hair cells in response to movement of the endo-lymph (the fluid that fills the membranous labyrinth within the semicircular canals) (Lundy-Ekman, Laurie 2005b). The somatosensory system uses input from multiple skin, joint, and muscle receptors to detect and control musculoskeletal
movement (Lundy-Ekman, Laurie 2005a). The visual system uses information from the rods, cones, and central pathways to produce images (sight). Gaze stabilization during head move-ment is achieved by the interaction between the visual and vestibular systems. This interaction prevents the world from appearing to bounce or move during activities such as walking (Lundy-Ekman, Laurie 2005b). In order to balance in a given environment, a person must be able to properly utilize and integrate the input from the three systems. Children with CP are known to have neuromuscular impairments characterized by abnormal muscle tone (i.e., their muscles are too stiff or too loose all the time). Although peripheral receptors for vision and vestibular function are typically intact, whether children with CP are able to appropriately integrate these systems for balance is unknown.
Computerized Dynamic Posturography provides objective
Test-Retest Reliability of Computerized Dynamic Posturography in Children with and without Cerebral PalsyJennifer Yasu Stannard
papers
inquiro | the university of alabama at birmingham 41
data about the contribution of the three sensory systems in an individual’s ability to balance. The Smart EquiTest (Neuro-Com) is a machine which allows the experimenter to observe postural reactions as the environment is manipulated. The Sensory Organization Test (SOT) provides orientationally inaccurate input (i.e., movement of the visual surround and/or support surface) and the Motor Control Test (MCT) provides a platform perturbation. The SOT assesses whether the subject relies on one of the sensory systems above the others, is defi-cient in one or more systems, or is able to properly integrate the information from the three systems to maintain balance. Additionally, the SOT gives information about which strategy the subject is using to maintain balance (i.e., whether rotation of the body to stay upright occurs primarily about the hip or ankle joints). Ankle strategy is typically employed when slow adjustments are required and the center of gravity (COG) can be kept near the center of the support surface. Hip strategy, on the other hand, is usually used when rapid adjustments are needed and the center of gravity is near the perimeter. Ankle strategy is typically used if the support base is broad, while hip strategy is usually employed when the support base is narrow. Deficiencies in sensation could lead subjects to use a strategy for balance that is not optimal (NeuroCom International, Inc. 2005). The MCT measures the ability to maintain balance when the support surface is suddenly moved forward or back-ward. The amount of time between the onset of the stimulus and the muscular response employed to maintain balance is measured. While some studies have assessed the performance of children with CP on Computerized Dynamic Posturog-raphy tests (Hirabayashi, S. and Iwasaki, Y. 1995; Liao, H. F., Jeng, S. F., Lai, J. S. et al., 1997), none have addressed the issue of test-retest reliability for this population. Very few results of the MCT in the pediatric population have been reported, and no results have been reported for pediatric cerebral palsy patients.
When a test gives similar results over a specified period of time (usually a week or more), the test is considered reliable. Greater similarity between the results of two tests indicates higher reliability. If the reliability is not established, there is no way of knowing whether a change in test results is due to ma-chine error or subject learning as opposed to intervention (i.e. physical therapy) that the subject may have received between the two tests. Thus, it is extremely important for tests that will be used for clinical purposes to be considered reliable both so that specific interventions can be designed and determinations may be made regarding the effectiveness of that intervention. A general guideline for interpretation of reliability coefficients is that below 0.50 is “poor reliability”; 0.51-0.75 is “moder-ate reliability” and above 0.75 is “good reliability” (Portney and Watkins chapter 5). The purpose of this study is to assess the reliability of the SOT and MCT as objective measures of balancing abilities and strategies among both children with cerebral palsy and nondisabled children.
Children with cerebral palsy typically have much poorer balance than their nondisabled counterparts (Cherng, R. J., Su, F. C., Chen, J. J. et al., 1999; Liao, H. F. and Hwang, A. W.
2003; Liao, H. F. et al., 1997; Rose, J., Wolff, D. R., Jones, V. K. et al., 2002). The cause of this balance deficit has been the subject of several studies because it is thought that if balance could be improved via physical therapy or other intervention, walking ability would also improve. Liao et al. (2001) suggest-ed that postural stability, especially when standing with eyes closed, was a good predictor of walking function in children with CP. In an earlier paper, Liao and colleagues (1997) found that weight shift balance also seemed to be related to walk-ing function and that slow walking speed in children with cerebral palsy was likely due to an accumulation of multiple deficits, including poor motor control and balance function, high physiological cost associated with walking, and degree of hypertonus (higher hypertonus was related to slow walking speed in this study). Cherng and colleagues (1999) found that children with CP have significantly poorer balance than age-matched nondisabled children, but were unable to determine whether the problem was poor integration of sensory input or poor motor control. The SMART EquiTest will provide stability scores that will distinguish between balance deficits due to the inability to use a sensory system (i.e., vision, soma-tosensory, vestibular) versus those due to the inability to ap-propriately integrate all systems. These studies all relied upon data from some type of SOT system. Therefore, the SOT will provide important information that may guide interventions for children with CP.
The development of sensory strategies used for balance differs between children with CP and typically developing children. Hirabayashi and colleagues (1995) found that vestib-ular function for balance is not completely mature even in 14-15-year-olds. Rine et al. (1998) found that the ability to use somatosensory input to maintain postural control is mature by 6 years of age, and that there is a transitional period between 3 and 7 ½ years of age during which a more integrated, mature approach to postural control occurs. Similarly, Woollacott and Shumway-Cook (1990) suggested that strong depen-dence on visual cues between ages 2 and 5 represents a time of fine-tuning the visual system in preparation for the shift to dependence on all 3 systems. In an earlier paper, Shumway-Cook and Woollacott (1985) suggested that children appear to undergo a modification from somewhat random muscular responses and strong dependence on visual cues to fine-tuned muscular responses and an increased dependence on the somatosensory and vestibular systems around 4-6 years of age. Foudriat and colleagues (1993) found that children under 3 years of age tend to rely primarily on the visual system, the somatosensory system is utilized more starting around age 3, and the use of the vestibular system develops more slowly and is not mature even around age 6 (the oldest group of children tested). Although typical development of balance is charac-terized by a shift from primarily visual to the integration of the visual, vestibular, and somatosensory systems, Rose et al. (2001) found that children over age 3 with CP continue to rely heavily on vision to maintain balance. Furthermore, they found that balance does not tend to improve with age in chil-dren with CP as it does in their nondisabled counterparts.
papers
42 inquiro | no. 1 | 2007
papers
The SOT appears to be an ideal way to assess the under-lying causes of balance deficits in children with CP, but the reliability of the system for this population is unknown. In their review of available balance assessment tools, Westcott and colleagues (1997) noted that there is little in published literature about the test-retest reliability of NeuroCom Smart system. Cherng and colleagues (1999) did a reliability study as part of a study of the ability of children with CP to balance in various sensory conditions, but they did the test-retest on the nondisabled control group only. Gabriel and Mu also did a test-retest study on nondisabled children and found that the reliability was good (ICC = 0.90). However, these studies used a force plate and foam pad instead of a Computerized Plat-form Posturography system, so whether the reliability results are applicable to the Smart EquiTest system is questionable. Liao and colleagues (2001) did a test-retest reliability study of several types of balance tests, including the Smart EquiTest, in children with mild to moderate spastic diplegic CP, and found that only the conditions demonstrating postural stability while focusing on a central target with a fixed support system had good reliability. Tests demonstrating balance while the subject had his or her eyes open with fixed support, eyes closed with fixed support, swayed reference vision and fixed support, eyes open and swayed support, eyes closed and swayed support, and swayed reference vision and swayed support had poor reliabil-ity. However, only an intrasession test-retest was performed on the children with cerebral palsy. They did an intersession test on non-disabled children in which they separated the test periods by one week and found no learning effect and high reliability. There is no way to determine whether the poor reli-ability found for the children with CP is due to their disability or to the fact that they were tested and retested on the same day.
There is little in published literature about Motor Con-trol Tests, and no published studies on the performance of children with cerebral palsy. The MCT is an important test for therapists to use with children with cerebral palsy because it measures response to unexpected platform movements. It has been established that children with cerebral palsy have neuro-muscular deficits, and it would be helpful for therapists to be able to measure response to these perturbations so they can design exercises that would better equip the children to func-tion in an unpredictable world. Forssberg and Nashner (1982) studied the response of normal children to a sudden forward or backward movement of the support surface using a movable force platform and surface electromyography (EMG). They found that the latencies of children below 7 ½ years of age were more erratic and slower than the latencies demonstrated by adults in response to the stimulus. There was also a high de-gree of variability in the children’s EMG adjustments among the trials conducted, suggesting that younger children might randomly change the weighting of support surface, vestibular, and visual input when responding to sudden disturbances. No test-retest reliability was done for this study, and no studies addressing the response of children with cerebral palsy to a motor control test were found.
To enable comprehensive balance testing of children with CP, the test-retest reliability of the SOT and MCT must be established. These results will increase confidence in the use of these measures to describe postural control abilities. Since the SOT has been proven reliable in typical children, we hypoth-esize that these tests will also be reliable in children with cerebral palsy.
MATERIALS AND METHODS
SubjectsSubjects included 8 children with cerebral palsy and 9 typ-
ically developing children between the ages of 4 and 19 years (mean age 9.4). Subjects were recruited from The Children’s Hospital of Alabama and the Birmingham community for this study. Inclusion criteria included the ability to stand either with or without an assistive device for 15 minutes. Exclusion criteria included any orthopedic impairments that prevented the child from standing.
InstrumentationThe Smart EquiTest system (NeuroCom International
Inc., Clackamas, OR 97015) consists of an 18-in. x 18-in. dual force platform surrounded on three sides by a multicolored panel (the visual surround). Both the force platform and the visual surround are sway referenced. Participants wore a safety harness which attached to a bar at the top of the machine to prevent falls in the event that balance was lost completely. The force platform is composed of five load cells: four on the sides which measure vertical forces (ankle strategy) and one in the center which measures shear forces (hip strategy). The force platform uses the relative amounts of pressure on each load cell to detect the center of gravity (COG), shifts of body mass in response to various stimuli (six sensory conditions), and whether the subject is using primarily ankle or hip strategy in order to maintain balance. The computer system generates a graph comparing the responses of the participant to the ex-pected responses of typically developing subjects of the same age and height. The Smart EquiTest has been demonstrated to have good reliability when used to test typically developing children (Liao et al., 2001) and thus the data used to generate the comparisons may be considered accurate.
ProceduresAll participants were tested during two separate ses-
sions 7-10 days apart. During the first session, a battery of neuromuscular tests were done to screen for deficits in their neuromuscular, visual, or vestibular systems.
Neuromuscular Tests:•Gross Range of Motion: The subjects’ arms and legs were
moved to determine any restrictions in mobility.•Strength: The subject moved his or her arms and legs
against resistance.•Oculomotor Testing: (1) Visual Pursuit: the subject was
asked to visually track a target as the investigator moved it. (2) Saccades: Subjects were asked to move the eyes quickly from
papers papers
inquiro | the university of alabama at birmingham 43
one target to another (e.g., from the examiner’s nose to the examiner’s finger).
•Head Thrust: Subjects were asked to focus on the inves-tigator’s nose as the head is turned to one side quickly and at small amplitude. A corrective saccade back to the examiner’s nose indicated possible peripheral vestibular dysfunction.
SOTThe subjects’ feet were appropriately positioned on the
force platform prior to beginning the SOT. Children were allowed to wear shoes and orthotics and to use assistive de-vices (i.e., walker) as needed during both the SOT and the MCT in order to imitate the child’s typical ambulatory situ-ation as closely as possible. Additionally, the children were allowed to rest for as long as necessary any time they expressed fatigue.
They were then asked to stand still under the following six conditions: 1) Eyes open; 2) Eyes closed; 3) Eyes open, sway-referenced visual surround (the panel will move in response to any movement by the subjects); 4) Eyes open, swayed surface (the platform on which the subjects are standing will move); 5) Eyes closed, swayed surface; and 6) Eyes open, swayed surface and sway-referenced visual surround. Three trials of 20 seconds in duration were administered under each condi-tion. A Polaroid snapshot was taken and placed on the visual surround directly in front of the subject during the eyes open tests to give him or her something to look at and encourage cooperation. Children were given a pair of goggles to wear during the eyes closed tests to occlude vision. Data obtained from the Sensory Organization Tests (SOT) included strategy (whether rotation to maintain balance occurred primarily about the ankle or about the hip joint), and equilibrium score (overall balance under the condition). A composite score was also generated that included data from all six conditions.
MCTThe subjects’ feet were repositioned as needed. Subjects
were asked to stand still and look straight ahead during small, medium, and large forward and backward translations of the platform. Three tests of each condition were performed with a 1.5-2.5 second interval between each individual trial. The children’s feet were repositioned as necessary throughout test-ing. The Motor Control Test measures latency, which is the amount of time between the first movement of the platform and the subjects’ initial response.
All subjects underwent a second testing session 7-10 days later during which they repeated the SOT and MCT.
AnalysisThe Smart EquiTest generated a variety of scores which
were used during analysis. The Equilibrium Score indicated how well the patient’s sway remained within the expected angular limits of stability (12.5°). An equilibrium score close to 100 indicated that the subject was stable (swayed little) and a score of zero indicated that the subject lost balance. The strategy score gave information about whether ankle or hip strategy was predominant (see Instrumentation). A score near 0 indicated a heavy reliance of hip strategy and a score near 100 was indicative of the use of ankle strategy.
Since children typically sway more than adults, sensory ratios were calculated.
These ratios enabled examiners to remove the effect of sway during the eyes open, stable surface condition from the results. The overall visual effectiveness (ability to use vision for balance) was calculated by dividing the equilibrium score for condition 4 by the equilibrium score for condition 1, soma-tosensory effectiveness (ability to use musculoskeletal infor-mation and responses for balance) was obtained by dividing the equilibrium score for condition 3 by the equilibrium score for condition 1, and vestibular effectiveness (ability to use in-formation from the inner ear for balance) was determined by dividing the equilibrium score for condition 5 by the equilib-rium score for condition 1.
Several children did not complete all tests because they did not want to do the eyes closed condition (n=2) or they were afraid of the sway-referenced conditions (n=3). These children were not included in the analysis or in the number of recruited children reported in this paper.
SPSS Version 14.0 was used for statistical analysis. Descriptive statistics were done to include the means and standard deviations of all outcomes and sensory effectiveness ratios. Reliability of the SOT was analyzed using the intraclass correlation coefficient (ICC) model 3. Reliability was done for the average of all three trials (ICC 3,3) as well as for trial 1 only (ICC 3,1) to determine if three trials were necessary.
The R2 value was reported for any conditions with inad-equate variance for the ICC. For this reason, reliability of the MCT was analyzed using R2.
RESULTS
Descriptive data of the subjects with cerebral palsy (n=8) can be found in Table 1. Subjects #8 and #20 were noted to have abnormal smooth pursuit and saccades on the left side, indicating possible damage to the central visual pathways. Subject #8 also had a positive head thrust to the left which could indicate either peripheral vestibular hypofunction or central pathology. All other subjects had a normal oculomotor examination and a negative head thrust. All subjects except subject #20 stood independently for testing. Subject #20 was unable to stand without a posterior rolling walker. The walker was placed on the support surface so that the upper extremi-ties could be used for balance.
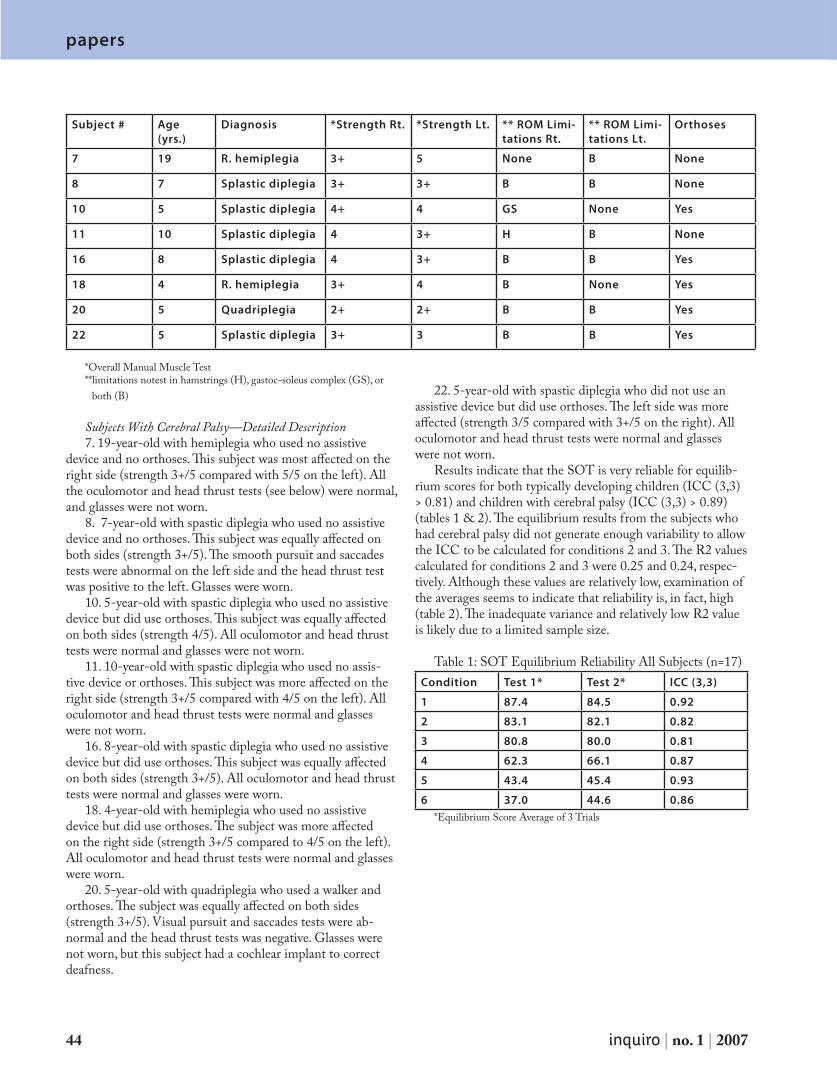
papers
44 inquiro | no. 1 | 2007
papers
Subject # Age (yrs.)
Diagnosis *Strength Rt. *Strength Lt. ** ROM Limi-tations Rt.
** ROM Limi-tations Lt.
Orthoses
7 19 R. hemiplegia 3+ 5 None B None
8 7 Splastic diplegia 3+ 3+ B B None
10 5 Splastic diplegia 4+ 4 GS None Yes
11 10 Splastic diplegia 4 3+ H B None
16 8 Splastic diplegia 4 3+ B B Yes
18 4 R. hemiplegia 3+ 4 B None Yes
20 5 Quadriplegia 2+ 2+ B B Yes
22 5 Splastic diplegia 3+ 3 B B Yes
*Overall Manual Muscle Test** limitations notest in hamstrings (H), gastoc-soleus complex (GS), or
both (B)
Subjects With Cerebral Palsy—Detailed Description7. 19-year-old with hemiplegia who used no assistive
device and no orthoses. This subject was most affected on the right side (strength 3+/5 compared with 5/5 on the left). All the oculomotor and head thrust tests (see below) were normal, and glasses were not worn.
8. 7-year-old with spastic diplegia who used no assistive device and no orthoses. This subject was equally affected on both sides (strength 3+/5). The smooth pursuit and saccades tests were abnormal on the left side and the head thrust test was positive to the left. Glasses were worn.
10. 5-year-old with spastic diplegia who used no assistive device but did use orthoses. This subject was equally affected on both sides (strength 4/5). All oculomotor and head thrust tests were normal and glasses were not worn.
11. 10-year-old with spastic diplegia who used no assis-tive device or orthoses. This subject was more affected on the right side (strength 3+/5 compared with 4/5 on the left). All oculomotor and head thrust tests were normal and glasses were not worn.
16. 8-year-old with spastic diplegia who used no assistive device but did use orthoses. This subject was equally affected on both sides (strength 3+/5). All oculomotor and head thrust tests were normal and glasses were worn.
18. 4-year-old with hemiplegia who used no assistive device but did use orthoses. The subject was more affected on the right side (strength 3+/5 compared to 4/5 on the left). All oculomotor and head thrust tests were normal and glasses were worn.
20. 5-year-old with quadriplegia who used a walker and orthoses. The subject was equally affected on both sides (strength 3+/5). Visual pursuit and saccades tests were ab-normal and the head thrust tests was negative. Glasses were not worn, but this subject had a cochlear implant to correct deafness.
22. 5-year-old with spastic diplegia who did not use an assistive device but did use orthoses. The left side was more affected (strength 3/5 compared with 3+/5 on the right). All oculomotor and head thrust tests were normal and glasses were not worn.
Results indicate that the SOT is very reliable for equilib-rium scores for both typically developing children (ICC (3,3) > 0.81) and children with cerebral palsy (ICC (3,3) > 0.89) (tables 1 & 2). The equilibrium results from the subjects who had cerebral palsy did not generate enough variability to allow the ICC to be calculated for conditions 2 and 3. The R2 values calculated for conditions 2 and 3 were 0.25 and 0.24, respec-tively. Although these values are relatively low, examination of the averages seems to indicate that reliability is, in fact, high (table 2). The inadequate variance and relatively low R2 value is likely due to a limited sample size.
Table 1: SOT Equilibrium Reliability All Subjects (n=17)Condition Test 1* Test 2* ICC (3,3)
1 87.4 84.5 0.92
2 83.1 82.1 0.82
3 80.8 80.0 0.81
4 62.3 66.1 0.87
5 43.4 45.4 0.93
6 37.0 44.6 0.86*Equilibrium Score Average of 3 Trials
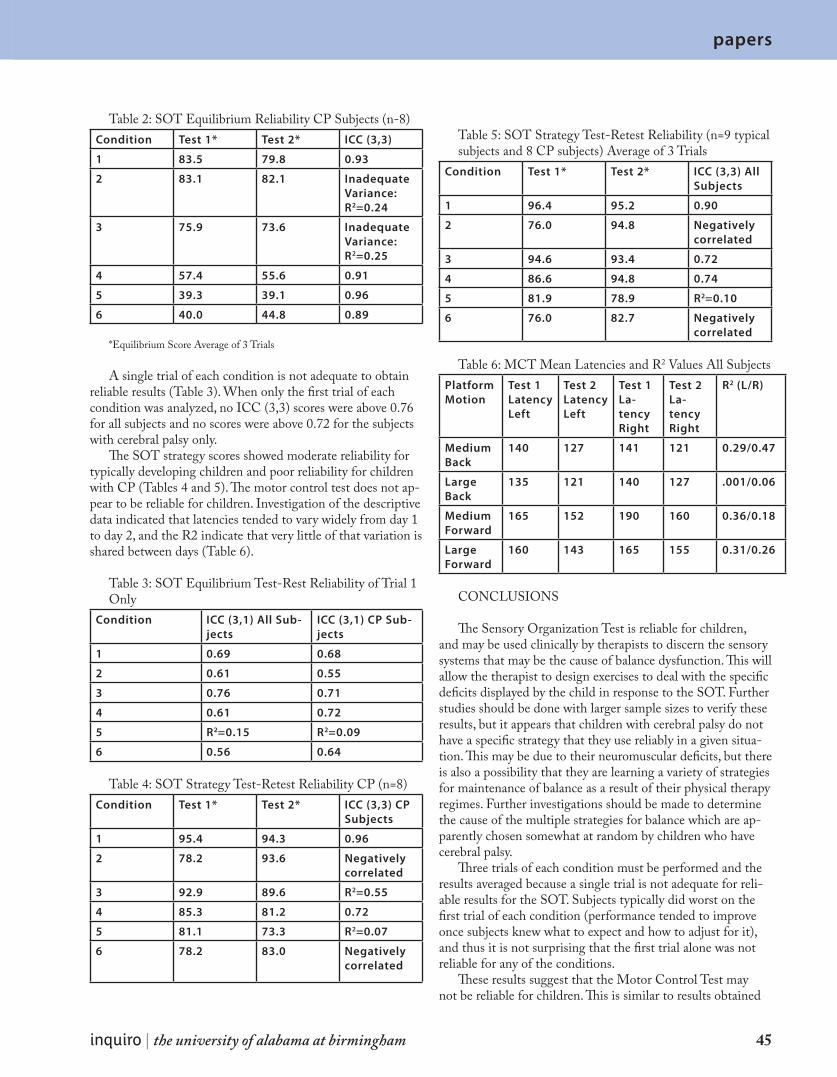
papers papers
inquiro | the university of alabama at birmingham 45
Table 2: SOT Equilibrium Reliability CP Subjects (n-8)Condition Test 1* Test 2* ICC (3,3)
1 83.5 79.8 0.93
2 83.1 82.1 Inadequate Variance: R2=0.24
3 75.9 73.6 Inadequate Variance: R2=0.25
4 57.4 55.6 0.91
5 39.3 39.1 0.96
6 40.0 44.8 0.89
*Equilibrium Score Average of 3 Trials
A single trial of each condition is not adequate to obtain reliable results (Table 3). When only the first trial of each condition was analyzed, no ICC (3,3) scores were above 0.76 for all subjects and no scores were above 0.72 for the subjects with cerebral palsy only.
The SOT strategy scores showed moderate reliability for typically developing children and poor reliability for children with CP (Tables 4 and 5). The motor control test does not ap-pear to be reliable for children. Investigation of the descriptive data indicated that latencies tended to vary widely from day 1 to day 2, and the R2 indicate that very little of that variation is shared between days (Table 6).
Table 3: SOT Equilibrium Test-Rest Reliability of Trial 1 Only
Condition ICC (3,1) All Sub-jects
ICC (3,1) CP Sub-jects
1 0.69 0.68
2 0.61 0.55
3 0.76 0.71
4 0.61 0.72
5 R2=0.15 R2=0.09
6 0.56 0.64
Table 4: SOT Strategy Test-Retest Reliability CP (n=8)Condition Test 1* Test 2* ICC (3,3) CP
Subjects
1 95.4 94.3 0.96
2 78.2 93.6 Negatively correlated
3 92.9 89.6 R2=0.55
4 85.3 81.2 0.72
5 81.1 73.3 R2=0.07
6 78.2 83.0 Negatively correlated
Table 5: SOT Strategy Test-Retest Reliability (n=9 typical subjects and 8 CP subjects) Average of 3 Trials
Condition Test 1* Test 2* ICC (3,3) All Subjects
1 96.4 95.2 0.90
2 76.0 94.8 Negatively correlated
3 94.6 93.4 0.72
4 86.6 94.8 0.74
5 81.9 78.9 R2=0.10
6 76.0 82.7 Negatively correlated
Table 6: MCT Mean Latencies and R2 Values All SubjectsPlatform Motion
Test 1 Latency Left
Test 2 Latency Left
Test 1 La-tency Right
Test 2 La-tency Right
R2 (L/R)
Medium Back
140 127 141 121 0.29/0.47
Large Back
135 121 140 127 .001/0.06
Medium Forward
165 152 190 160 0.36/0.18
Large Forward
160 143 165 155 0.31/0.26
CONCLUSIONS
The Sensory Organization Test is reliable for children, and may be used clinically by therapists to discern the sensory systems that may be the cause of balance dysfunction. This will allow the therapist to design exercises to deal with the specific deficits displayed by the child in response to the SOT. Further studies should be done with larger sample sizes to verify these results, but it appears that children with cerebral palsy do not have a specific strategy that they use reliably in a given situa-tion. This may be due to their neuromuscular deficits, but there is also a possibility that they are learning a variety of strategies for maintenance of balance as a result of their physical therapy regimes. Further investigations should be made to determine the cause of the multiple strategies for balance which are ap-parently chosen somewhat at random by children who have cerebral palsy.
Three trials of each condition must be performed and the results averaged because a single trial is not adequate for reli-able results for the SOT. Subjects typically did worst on the first trial of each condition (performance tended to improve once subjects knew what to expect and how to adjust for it), and thus it is not surprising that the first trial alone was not reliable for any of the conditions.
These results suggest that the Motor Control Test may not be reliable for children. This is similar to results obtained
papers
46 inquiro | no. 1 | 2007
by Forssberg and Nashner (1982) suggesting that children younger than 7 would not have reliable responses to a plat-form perturbation. It is possible that the sample used for this study simply contained too many young children, and that a study which focused on children older than 10 might show that the MCT is reliable for that population.
In conclusion, all of the subjects were able to complete the SOT and the MCT. Subject #20, who used a walker, did not sway on any condition and did not have a lower extrem-ity response to the platform perturbation on the MCT. This suggests that subjects with CP who stand and ambulate with a walker very rarely have to rely on their lower extremities. Although use of a walker provides stability under conflicting sensory situations, the child may become dependent on the walker, not exercising the visual and vestibular systems that will allow motor skill progression and independent walking. Future studies should continue to examine computerized dynamic posturography in more subjects with cerebral palsy.
REFERENCES
Cambier, D., Cools, A., Danneels, L., and Witvrouw, •E. Reference data for 4- and 5-year-old-children on the Balance Master: values and clinical feasibility.Eur.J.Pediatr.2001;160:317-Cherng, R. J., Chen, J. J., and Su, F. C. Vestibular system in •performance of standing balance of children and young adults under altered sensory conditions.Percept.Mot.Skills.2001;92:1167-1179.Cherng, R. J., Su, F. C., Chen, J. J., and Kuan, T. S. Perfor-•mance of static standing balance in children with spastic diplegic cerebral palsy under altered sensory environ-ments.Am.J.Phys.Med.Rehabil.1999;78:336-343.Crenna, P. Spasticity and ‘spastic’ gait in children with cere-•bral palsy.Neurosci.Biobehav.Rev.1998;22:571-578.Forssberg, H. and Nashner, L. M. Ontogenetic de-•velopment of postural control in man: adaptation to altered support and visual conditions during stance.J.Neurosci.1982;2:545-552.Foudriat, B. A., Di Fabio, R. P., and Anderson, J. H. Sensory •organization of balance responses in children 3-6 years
of age: a normative study with diagnostic implications.Int.J.Pediatr.Otorhinolaryngol.1993;27:255-271.Gabriel, L. S. and Mu, K. Computerized platform posturog-•raphy for children: test-retest reliability of the sensory test of the VSR System.Phys.Occup.Ther.Pediatr.2002;22:101-117.Hirabayashi, S. and Iwasaki, Y. Developmental perspec-•tive of sensory organization on postural control.Brain Dev.1995;17:111-113.Liao, H. F. and Hwang, A. W. Relations of balance function •and gross motor ability for children with cerebral palsy.Percept.Mot.Skills.2003;96:1173-1184.Liao, H. F., Jeng, S. F., Lai, J. S., Cheng, C. K., and Hu, M. H. •The relation between standing balance and walking func-tion in children with spastic diplegic cerebral palsy.Dev.Med.Child Neurol.1997;39:106-112.Liao, H. F., Mao, P. J., and Hwang, A. W. Test-retest reliability •of balance tests in children with cerebral palsy.Dev.Med.Child Neurol.2001;43:180-186.Lundy-Ekman, Laurie. Somatosensory System. In: Neuro-•science: Fundamentals for Rehabilitation. Philadelphia: W.B. Saunders Co.2005a.; 99-122.Lundy-Ekman, Laurie. Vestibular and Visual Systems. In: •Neuroscience:Fundamentals for Rehabilitation. Philadel-phia: W.B. Saunders Company; 2005b.349-381.NeuroCom International, Inc. Clinical Integration Seminar •Lecture Manual.2005;Poblano, A., Ishiwara, K., de Lourdes, Arias M., Garcia-Pe-•droza, F., Marin, H., and Trujillo, M. Motor control alteration in posturography in learning-disabled children.Arch.Med.Res.2002;33:485-488.Portney and Watkins M. Reliability. In: Foundations of Clini-•cal Research: Applications to Practice. New Jersey: Prentice Hall Health; 61-77.Rine, R. M., Rubish, K, and Feeney, C. Measurement of •Sensory System Effectiveness and Maturational Changes in Postural Control in Young Children.Pediatric Physical Therapy.2005;10:16-22.Rose, J., Wolff, D. R., Jones, V. K., Bloch, D. A., Oehlert, J. W., •and Gamble, J. G. Postural balance in children with cere-bral palsy.Dev.Med.Child Neurol.2002;44:58-63.
papers papers
inquiro | the university of alabama at birmingham 47
b iology
In normal cells caloric restriction has been shown to reduce rates of apoptosis and in-crease replicative age. Anti-aging effects are linked to the up-regulation of SIRT1. Caloric restriction has also been shown to reduce the proliferation of cancerous cell lines; how-ever, the regulation of SIRT1 in cancer cells is not clear. In addition, the effects of specific dietary restriction is another area that has not been well studied. In this study, MCF-7 breast cancer cells were grown in media supplemented with varying amounts of glucose. Periods of cell growth in glucose depleted media began with 500,000 cells, after 10 days cell counts showed 1,984,000 cells for cells grown in 0.0g/L, 6,122,560 cells in 1.0g/L, and 12,693,120 cells in 4.5g/L (normal). Analysis of protein expression found SIRT1 to be up regulated in MCF-7 cells; by day 10 of growth in glucose free media its down regulation was induced. The methylation of the hTERT promoter was also examined, but no change was seen in its methylation status. These results indicate glucose depletion may be a pos-sible supplemental measure to reduce breast cancer progression.
INTRODUCTION
Caloric restriction has shown lifespan extension in organ-isms as diverse as yeasts, drosophila, spiders, and mice. It is the only dietary measure known that shows an increase in maximum lifespan instead of average lifespan alone. One gene found to be upregulated as a result of caloric restriction is Sir2, which was first identified in calorie restricted yeasts, an increase in its expression has been shown to promote longev-ity [1]. In mammals, its orthologe, SIRT1, a NAD-dependent deacetylase, has been shown to increase longevity and decrease rates of carcinogenesis. Its activation is thought to be part of a defense mechanism that promotes survival of the cell in response to stress by deacetlylating, and subsequently deacti-vating, tumor suppressor genes that lead to apoptosis of the cell [2,3]. However the regulation of SIRT1 in cancer cells is not clear. Recent studies suggest the effects of its expres-sion may vary with cell type [4,5]. Increased rates of SIRT1 expression may also be a factor in carcinogenesis [10]. In one study silencing of SIRT1 greatly increased rates of apoptosis in epithelial cancer, and had no effect on noncancerous cells [10]. This was done in the absence of applied stress suggesting that the function of SIRT1 differs between cancerous and non-cancerous cells [10].
Calorie restriction has been shown to effectively increase expression of the gene SIRT1 [1]; however, the effect of specific types of dietary restriction has not been well studied. The identification of dietary measures that restrict specific
caloric sources and induce the same effects as total caloric restriction would aid in the identification of the specific metabolic pathways involved. Studies in our lab have shown that the specific dietary restriction of glucose may induce the same response as calorie restriction. Expression of SIRT1 was increased and a reduction in the replication rate of ageing in MRC-5 normal lung fibroblasts in vitro was seen with glucose depletion. Research on the effects of glucose depletion on the expression of SIRT1 in cancer cell lines is needed to give use-ful comparative data.
For the development of effective treatments, it is impor-tant to understand the mechanisms that affect the expression of SIRT1. In this study the expression of SIRT1 in MCF-7 breast cancer cells grown in glucose depleted media was ex-amined. An examination of the patterns of SIRT1 regulation is necessary to understand the effects of glucose restriction in normal and cancerous cell lines.
Epigenetic changes in the promoter region of hTERT, specifically methylation patterns, were also examined. Epigentic studies involve genomic modifications that do not affect the primary sequence. These factors have been shown to influence the regulation of genes associated with cancer and aging [6, 7]. Changes that occur in promoter regions affect the expression of specific genes. The regulation of hTERT, the catalytic subunit of telomerase is a useful marker for the effects of anti-cancerous treatments. Increased levels of telomerase are seen in most types of cancer and serve as a mechanism to escape cellular senes-cence by restoring telomere length [8]. In contradiction to the
Protein Expression and Methylation Patterns in Response to Glucose Depletion in MCF-7 Cells Leah Strickland, Joel Berletch, Trygve Tollefsbol
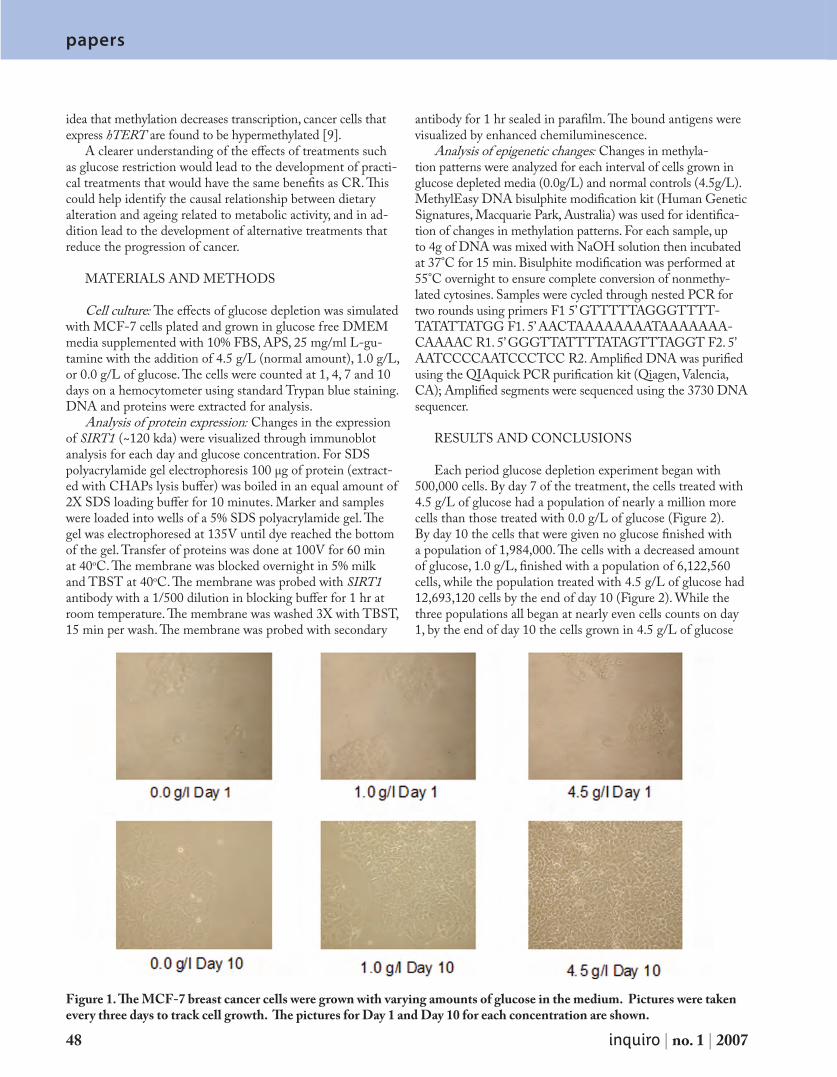
papers
48 inquiro | no. 1 | 2007
papers
idea that methylation decreases transcription, cancer cells that express hTERT are found to be hypermethylated [9].
A clearer understanding of the effects of treatments such as glucose restriction would lead to the development of practi-cal treatments that would have the same benefits as CR. This could help identify the causal relationship between dietary alteration and ageing related to metabolic activity, and in ad-dition lead to the development of alternative treatments that reduce the progression of cancer.
MATERIALS AND METHODS
Cell culture: The effects of glucose depletion was simulated with MCF-7 cells plated and grown in glucose free DMEM media supplemented with 10% FBS, APS, 25 mg/ml L-gu-tamine with the addition of 4.5 g/L (normal amount), 1.0 g/L, or 0.0 g/L of glucose. The cells were counted at 1, 4, 7 and 10 days on a hemocytometer using standard Trypan blue staining. DNA and proteins were extracted for analysis.
Analysis of protein expression: Changes in the expression of SIRT1 (~120 kda) were visualized through immunoblot analysis for each day and glucose concentration. For SDS polyacrylamide gel electrophoresis 100 μg of protein (extract-ed with CHAPs lysis buffer) was boiled in an equal amount of 2X SDS loading buffer for 10 minutes. Marker and samples were loaded into wells of a 5% SDS polyacrylamide gel. The gel was electrophoresed at 135V until dye reached the bottom of the gel. Transfer of proteins was done at 100V for 60 min at 40oC. The membrane was blocked overnight in 5% milk and TBST at 40oC. The membrane was probed with SIRT1 antibody with a 1/500 dilution in blocking buffer for 1 hr at room temperature. The membrane was washed 3X with TBST, 15 min per wash. The membrane was probed with secondary
antibody for 1 hr sealed in parafilm. The bound antigens were visualized by enhanced chemiluminescence.
Analysis of epigenetic changes: Changes in methyla-tion patterns were analyzed for each interval of cells grown in glucose depleted media (0.0g/L) and normal controls (4.5g/L). MethylEasy DNA bisulphite modification kit (Human Genetic Signatures, Macquarie Park, Australia) was used for identifica-tion of changes in methylation patterns. For each sample, up to 4g of DNA was mixed with NaOH solution then incubated at 37°C for 15 min. Bisulphite modification was performed at 55°C overnight to ensure complete conversion of nonmethy-lated cytosines. Samples were cycled through nested PCR for two rounds using primers F1 5’ GTTTTTAGGGTTTT-TATATTATGG F1. 5’ AACTAAAAAAAATAAAAAAA-CAAAAC R1. 5’ GGGTTATTTTATAGTTTAGGT F2. 5’ AATCCCCAATCCCTCC R2. Amplified DNA was purified using the QIAquick PCR purification kit (Qiagen, Valencia, CA); Amplified segments were sequenced using the 3730 DNA sequencer.
RESULTS AND CONCLUSIONS
Each period glucose depletion experiment began with 500,000 cells. By day 7 of the treatment, the cells treated with 4.5 g/L of glucose had a population of nearly a million more cells than those treated with 0.0 g/L of glucose (Figure 2). By day 10 the cells that were given no glucose finished with a population of 1,984,000. The cells with a decreased amount of glucose, 1.0 g/L, finished with a population of 6,122,560 cells, while the population treated with 4.5 g/L of glucose had 12,693,120 cells by the end of day 10 (Figure 2). While the three populations all began at nearly even cells counts on day 1, by the end of day 10 the cells grown in 4.5 g/L of glucose
Figure 1. The MCF-7 breast cancer cells were grown with varying amounts of glucose in the medium. Pictures were taken every three days to track cell growth. The pictures for Day 1 and Day 10 for each concentration are shown.
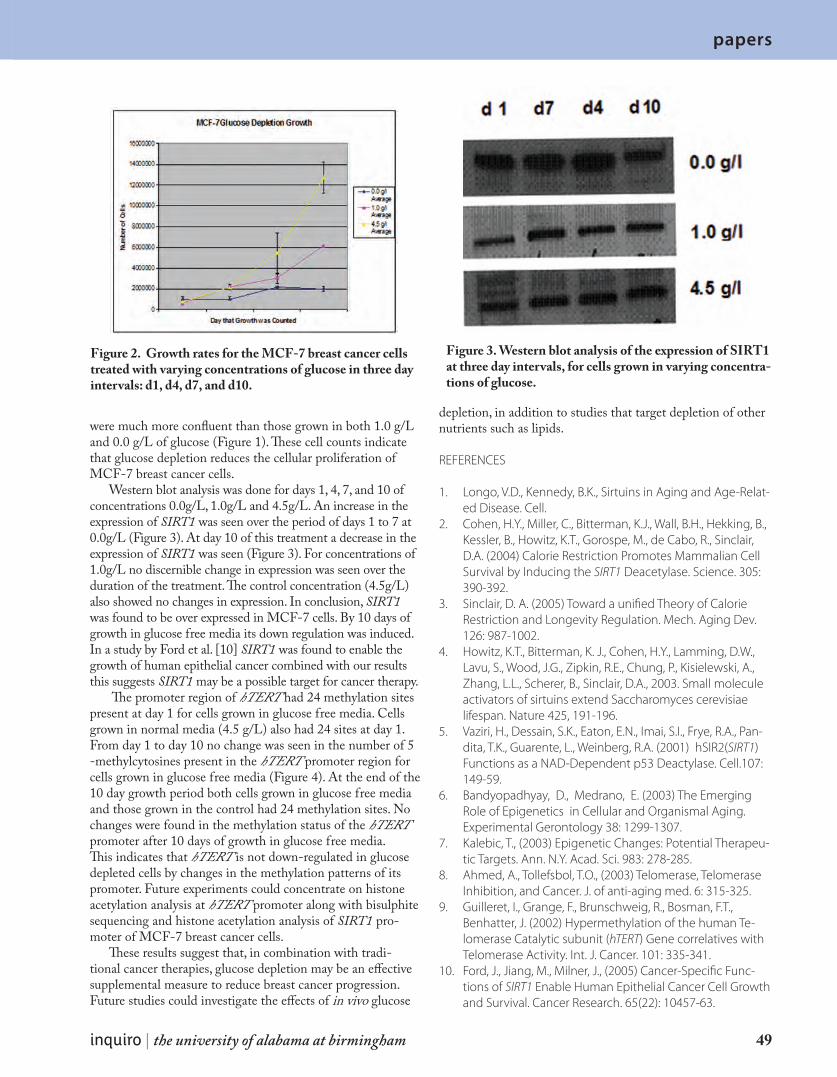
papers papers
inquiro | the university of alabama at birmingham 49
were much more confluent than those grown in both 1.0 g/L and 0.0 g/L of glucose (Figure 1). These cell counts indicate that glucose depletion reduces the cellular proliferation of MCF-7 breast cancer cells.
Western blot analysis was done for days 1, 4, 7, and 10 of concentrations 0.0g/L, 1.0g/L and 4.5g/L. An increase in the expression of SIRT1 was seen over the period of days 1 to 7 at 0.0g/L (Figure 3). At day 10 of this treatment a decrease in the expression of SIRT1 was seen (Figure 3). For concentrations of 1.0g/L no discernible change in expression was seen over the duration of the treatment. The control concentration (4.5g/L) also showed no changes in expression. In conclusion, SIRT1 was found to be over expressed in MCF-7 cells. By 10 days of growth in glucose free media its down regulation was induced. In a study by Ford et al. [10] SIRT1 was found to enable the growth of human epithelial cancer combined with our results this suggests SIRT1 may be a possible target for cancer therapy.
The promoter region of hTERT had 24 methylation sites present at day 1 for cells grown in glucose free media. Cells grown in normal media (4.5 g/L) also had 24 sites at day 1. From day 1 to day 10 no change was seen in the number of 5 -methylcytosines present in the hTERT promoter region for cells grown in glucose free media (Figure 4). At the end of the 10 day growth period both cells grown in glucose free media and those grown in the control had 24 methylation sites. No changes were found in the methylation status of the hTERT promoter after 10 days of growth in glucose free media. This indicates that hTERT is not down-regulated in glucose depleted cells by changes in the methylation patterns of its promoter. Future experiments could concentrate on histone acetylation analysis at hTERT promoter along with bisulphite sequencing and histone acetylation analysis of SIRT1 pro-moter of MCF-7 breast cancer cells.
These results suggest that, in combination with tradi-tional cancer therapies, glucose depletion may be an effective supplemental measure to reduce breast cancer progression. Future studies could investigate the effects of in vivo glucose
depletion, in addition to studies that target depletion of other nutrients such as lipids.
REFERENCES
Longo, V.D., Kennedy, B.K., Sirtuins in Aging and Age-Relat-1. ed Disease. Cell.Cohen, H.Y., Miller, C., Bitterman, K.J., Wall, B.H., Hekking, B., 2. Kessler, B., Howitz, K.T., Gorospe, M., de Cabo, R., Sinclair, D.A. (2004) Calorie Restriction Promotes Mammalian Cell Survival by Inducing the SIRT1 Deacetylase. Science. 305: 390-392.Sinclair, D. A. (2005) Toward a unified Theory of Calorie 3. Restriction and Longevity Regulation. Mech. Aging Dev. 126: 987-1002. Howitz, K.T., Bitterman, K. J., Cohen, H.Y., Lamming, D.W., 4. Lavu, S., Wood, J.G., Zipkin, R.E., Chung, P., Kisielewski, A., Zhang, L.L., Scherer, B., Sinclair, D.A., 2003. Small molecule activators of sirtuins extend Saccharomyces cerevisiae lifespan. Nature 425, 191-196.Vaziri, H., Dessain, S.K., Eaton, E.N., Imai, S.I., Frye, R.A., Pan-5. dita, T.K., Guarente, L., Weinberg, R.A. (2001) hSIR2(SIRT1) Functions as a NAD-Dependent p53 Deactylase. Cell.107: 149-59.Bandyopadhyay, D., Medrano, E. (2003) The Emerging 6. Role of Epigenetics in Cellular and Organismal Aging. Experimental Gerontology 38: 1299-1307. Kalebic, T., (2003) Epigenetic Changes: Potential Therapeu-7. tic Targets. Ann. N.Y. Acad. Sci. 983: 278-285.Ahmed, A., Tollefsbol, T.O., (2003) Telomerase, Telomerase 8. Inhibition, and Cancer. J. of anti-aging med. 6: 315-325.Guilleret, I., Grange, F., Brunschweig, R., Bosman, F.T., 9. Benhatter, J. (2002) Hypermethylation of the human Te-lomerase Catalytic subunit (hTERT) Gene correlatives with Telomerase Activity. Int. J. Cancer. 101: 335-341.Ford, J., Jiang, M., Milner, J., (2005) Cancer-Specific Func-10. tions of SIRT1 Enable Human Epithelial Cancer Cell Growth and Survival. Cancer Research. 65(22): 10457-63.
Figure 2. Growth rates for the MCF-7 breast cancer cells treated with varying concentrations of glucose in three day intervals: d1, d4, d7, and d10.
Figure 3. Western blot analysis of the expression of SIRT1 at three day intervals, for cells grown in varying concentra-tions of glucose.
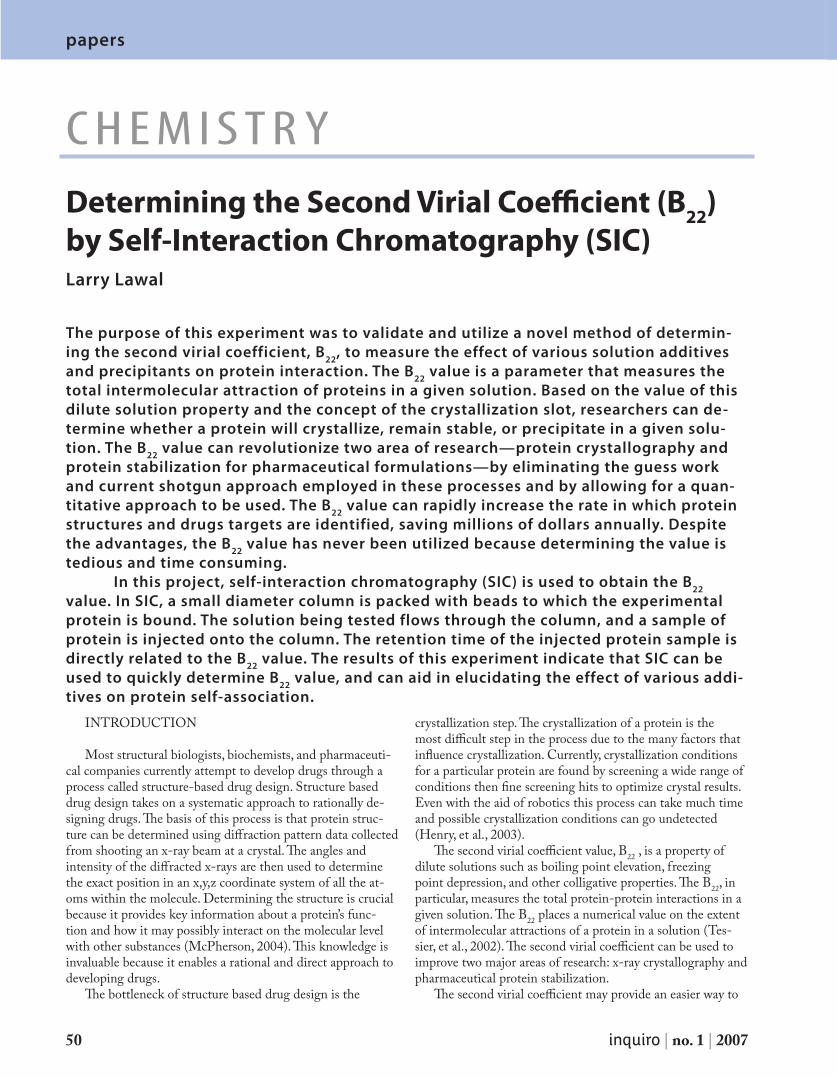
papers
50 inquiro | no. 1 | 2007
papers
The purpose of this experiment was to validate and utilize a novel method of determin-ing the second virial coefficient, B22, to measure the effect of various solution additives and precipitants on protein interaction. The B22 value is a parameter that measures the total intermolecular attraction of proteins in a given solution. Based on the value of this dilute solution property and the concept of the crystallization slot, researchers can de-termine whether a protein will crystallize, remain stable, or precipitate in a given solu-tion. The B22 value can revolutionize two area of research—protein crystallography and protein stabilization for pharmaceutical formulations—by eliminating the guess work and current shotgun approach employed in these processes and by allowing for a quan-titative approach to be used. The B22 value can rapidly increase the rate in which protein structures and drugs targets are identified, saving millions of dollars annually. Despite the advantages, the B22 value has never been utilized because determining the value is tedious and time consuming. In this project, self-interaction chromatography (SIC) is used to obtain the B22 value. In SIC, a small diameter column is packed with beads to which the experimental protein is bound. The solution being tested flows through the column, and a sample of protein is injected onto the column. The retention time of the injected protein sample is directly related to the B22 value. The results of this experiment indicate that SIC can be used to quickly determine B22 value, and can aid in elucidating the effect of various addi-tives on protein self-association.
INTRODUCTION
Most structural biologists, biochemists, and pharmaceuti-cal companies currently attempt to develop drugs through a process called structure-based drug design. Structure based drug design takes on a systematic approach to rationally de-signing drugs. The basis of this process is that protein struc-ture can be determined using diffraction pattern data collected from shooting an x-ray beam at a crystal. The angles and intensity of the diffracted x-rays are then used to determine the exact position in an x,y,z coordinate system of all the at-oms within the molecule. Determining the structure is crucial because it provides key information about a protein’s func-tion and how it may possibly interact on the molecular level with other substances (McPherson, 2004). This knowledge is invaluable because it enables a rational and direct approach to developing drugs.
The bottleneck of structure based drug design is the
crystallization step. The crystallization of a protein is the most difficult step in the process due to the many factors that influence crystallization. Currently, crystallization conditions for a particular protein are found by screening a wide range of conditions then fine screening hits to optimize crystal results. Even with the aid of robotics this process can take much time and possible crystallization conditions can go undetected (Henry, et al., 2003).
The second virial coefficient value, B22 , is a property of dilute solutions such as boiling point elevation, freezing point depression, and other colligative properties. The B22, in particular, measures the total protein-protein interactions in a given solution. The B22 places a numerical value on the extent of intermolecular attractions of a protein in a solution (Tes-sier, et al., 2002). The second virial coefficient can be used to improve two major areas of research: x-ray crystallography and pharmaceutical protein stabilization.
The second virial coefficient may provide an easier way to
Determining the Second Virial Coefficient (B22) by Self-Interaction Chromatography (SIC)
chemistr y
Larry Lawal
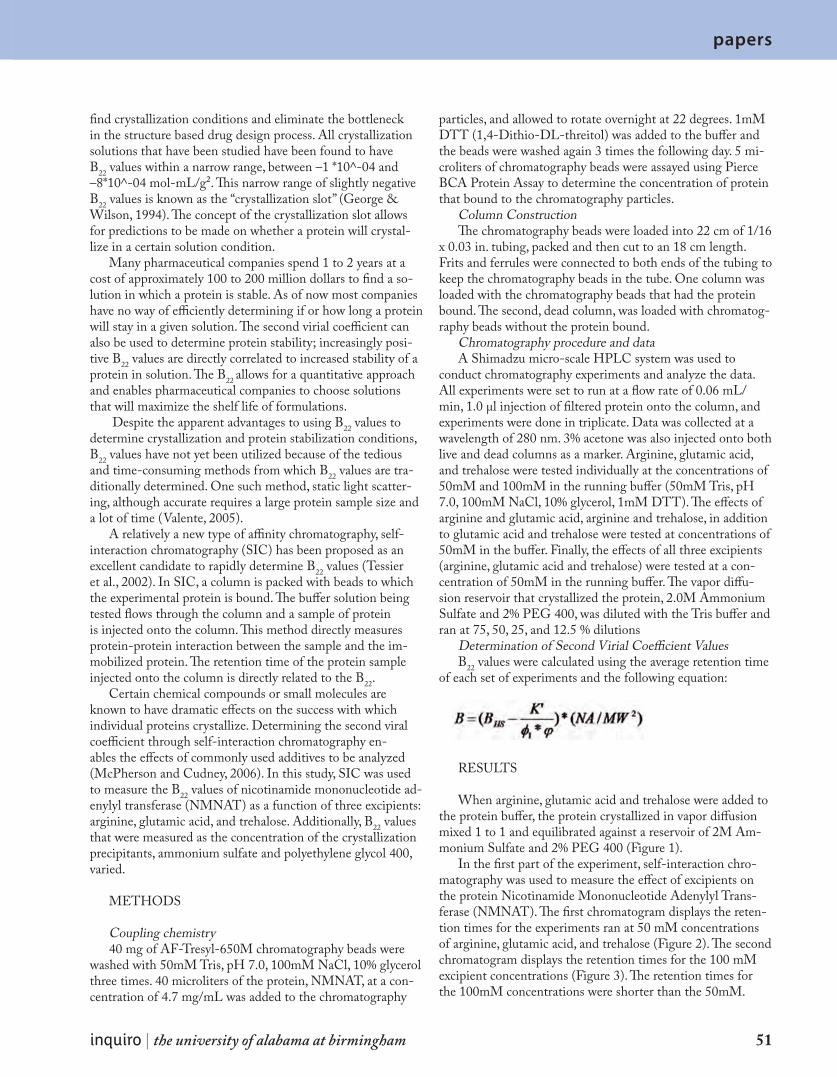
papers
inquiro | the university of alabama at birmingham 51
find crystallization conditions and eliminate the bottleneck in the structure based drug design process. All crystallization solutions that have been studied have been found to have B22 values within a narrow range, between –1 *10^-04 and –8*10^-04 mol-mL/g². This narrow range of slightly negative B22 values is known as the “crystallization slot” (George & Wilson, 1994). The concept of the crystallization slot allows for predictions to be made on whether a protein will crystal-lize in a certain solution condition.
Many pharmaceutical companies spend 1 to 2 years at a cost of approximately 100 to 200 million dollars to find a so-lution in which a protein is stable. As of now most companies have no way of efficiently determining if or how long a protein will stay in a given solution. The second virial coefficient can also be used to determine protein stability; increasingly posi-tive B22 values are directly correlated to increased stability of a protein in solution. The B22 allows for a quantitative approach and enables pharmaceutical companies to choose solutions that will maximize the shelf life of formulations.
Despite the apparent advantages to using B22 values to determine crystallization and protein stabilization conditions, B22 values have not yet been utilized because of the tedious and time-consuming methods from which B22 values are tra-ditionally determined. One such method, static light scatter-ing, although accurate requires a large protein sample size and a lot of time (Valente, 2005).
A relatively a new type of affinity chromatography, self-interaction chromatography (SIC) has been proposed as an excellent candidate to rapidly determine B22 values (Tessier et al., 2002). In SIC, a column is packed with beads to which the experimental protein is bound. The buffer solution being tested flows through the column and a sample of protein is injected onto the column. This method directly measures protein-protein interaction between the sample and the im-mobilized protein. The retention time of the protein sample injected onto the column is directly related to the B22.
Certain chemical compounds or small molecules are known to have dramatic effects on the success with which individual proteins crystallize. Determining the second viral coefficient through self-interaction chromatography en-ables the effects of commonly used additives to be analyzed (McPherson and Cudney, 2006). In this study, SIC was used to measure the B22 values of nicotinamide mononucleotide ad-enylyl transferase (NMNAT) as a function of three excipients: arginine, glutamic acid, and trehalose. Additionally, B22 values that were measured as the concentration of the crystallization precipitants, ammonium sulfate and polyethylene glycol 400, varied.
METHODS
Coupling chemistry40 mg of AF-Tresyl-650M chromatography beads were
washed with 50mM Tris, pH 7.0, 100mM NaCl, 10% glycerol three times. 40 microliters of the protein, NMNAT, at a con-centration of 4.7 mg/mL was added to the chromatography
particles, and allowed to rotate overnight at 22 degrees. 1mM DTT (1,4-Dithio-DL-threitol) was added to the buffer and the beads were washed again 3 times the following day. 5 mi-croliters of chromatography beads were assayed using Pierce BCA Protein Assay to determine the concentration of protein that bound to the chromatography particles.
Column ConstructionThe chromatography beads were loaded into 22 cm of 1/16
x 0.03 in. tubing, packed and then cut to an 18 cm length. Frits and ferrules were connected to both ends of the tubing to keep the chromatography beads in the tube. One column was loaded with the chromatography beads that had the protein bound. The second, dead column, was loaded with chromatog-raphy beads without the protein bound.
Chromatography procedure and dataA Shimadzu micro-scale HPLC system was used to
conduct chromatography experiments and analyze the data. All experiments were set to run at a flow rate of 0.06 mL/min, 1.0 μl injection of filtered protein onto the column, and experiments were done in triplicate. Data was collected at a wavelength of 280 nm. 3% acetone was also injected onto both live and dead columns as a marker. Arginine, glutamic acid, and trehalose were tested individually at the concentrations of 50mM and 100mM in the running buffer (50mM Tris, pH 7.0, 100mM NaCl, 10% glycerol, 1mM DTT). The effects of arginine and glutamic acid, arginine and trehalose, in addition to glutamic acid and trehalose were tested at concentrations of 50mM in the buffer. Finally, the effects of all three excipients (arginine, glutamic acid and trehalose) were tested at a con-centration of 50mM in the running buffer. The vapor diffu-sion reservoir that crystallized the protein, 2.0M Ammonium Sulfate and 2% PEG 400, was diluted with the Tris buffer and ran at 75, 50, 25, and 12.5 % dilutions
Determination of Second Virial Coefficient ValuesB22 values were calculated using the average retention time
of each set of experiments and the following equation:
RESULTS
When arginine, glutamic acid and trehalose were added to the protein buffer, the protein crystallized in vapor diffusion mixed 1 to 1 and equilibrated against a reservoir of 2M Am-monium Sulfate and 2% PEG 400 (Figure 1).
In the first part of the experiment, self-interaction chro-matography was used to measure the effect of excipients on the protein Nicotinamide Mononucleotide Adenylyl Trans-ferase (NMNAT). The first chromatogram displays the reten-tion times for the experiments ran at 50 mM concentrations of arginine, glutamic acid, and trehalose (Figure 2). The second chromatogram displays the retention times for the 100 mM excipient concentrations (Figure 3). The retention times for the 100mM concentrations were shorter than the 50mM.
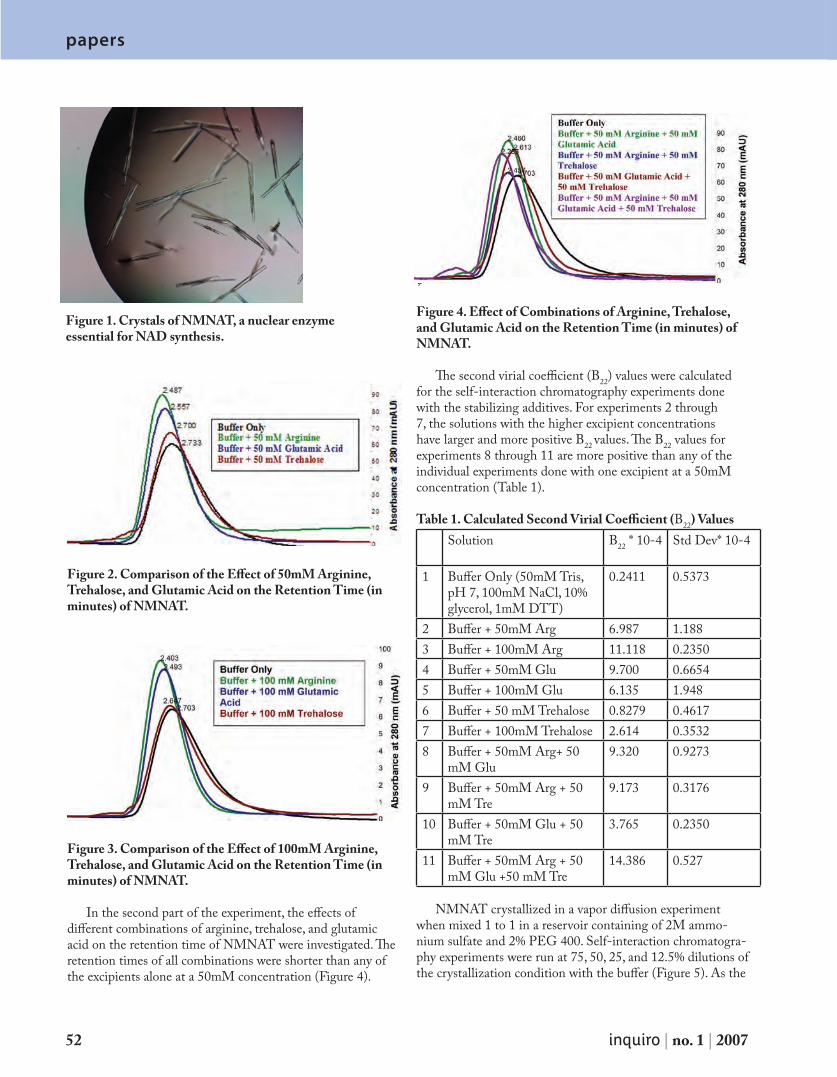
papers
52 inquiro | no. 1 | 2007
papers
Figure 2. Comparison of the Effect of 50mM Arginine, Trehalose, and Glutamic Acid on the Retention Time (in minutes) of NMNAT.
Figure 3. Comparison of the Effect of 100mM Arginine, Trehalose, and Glutamic Acid on the Retention Time (in minutes) of NMNAT.
In the second part of the experiment, the effects of different combinations of arginine, trehalose, and glutamic acid on the retention time of NMNAT were investigated. The retention times of all combinations were shorter than any of the excipients alone at a 50mM concentration (Figure 4).
4).
Figure 4. Effect of Combinations of Arginine, Trehalose, and Glutamic Acid on the Retention Time (in minutes) of NMNAT.
The second virial coefficient (B22) values were calculated for the self-interaction chromatography experiments done with the stabilizing additives. For experiments 2 through 7, the solutions with the higher excipient concentrations have larger and more positive B22 values. The B22 values for experiments 8 through 11 are more positive than any of the individual experiments done with one excipient at a 50mM concentration (Table 1).
Table 1. Calculated Second Virial Coefficient (B22) ValuesSolution B22 * 10-4 Std Dev* 10-4
1 Buffer Only (50mM Tris, pH 7, 100mM NaCl, 10% glycerol, 1mM DTT)
0.2411 0.5373
2 Buffer + 50mM Arg 6.987 1.1883 Buffer + 100mM Arg 11.118 0.23504 Buffer + 50mM Glu 9.700 0.66545 Buffer + 100mM Glu 6.135 1.9486 Buffer + 50 mM Trehalose 0.8279 0.46177 Buffer + 100mM Trehalose 2.614 0.35328 Buffer + 50mM Arg+ 50
mM Glu9.320 0.9273
9 Buffer + 50mM Arg + 50 mM Tre
9.173 0.3176
10 Buffer + 50mM Glu + 50 mM Tre
3.765 0.2350
11 Buffer + 50mM Arg + 50 mM Glu +50 mM Tre
14.386 0.527
NMNAT crystallized in a vapor diffusion experiment when mixed 1 to 1 in a reservoir containing of 2M ammo-nium sulfate and 2% PEG 400. Self-interaction chromatogra-phy experiments were run at 75, 50, 25, and 12.5% dilutions of the crystallization condition with the buffer (Figure 5). As the
Figure 1. Crystals of NMNAT, a nuclear enzyme essential for NAD synthesis.
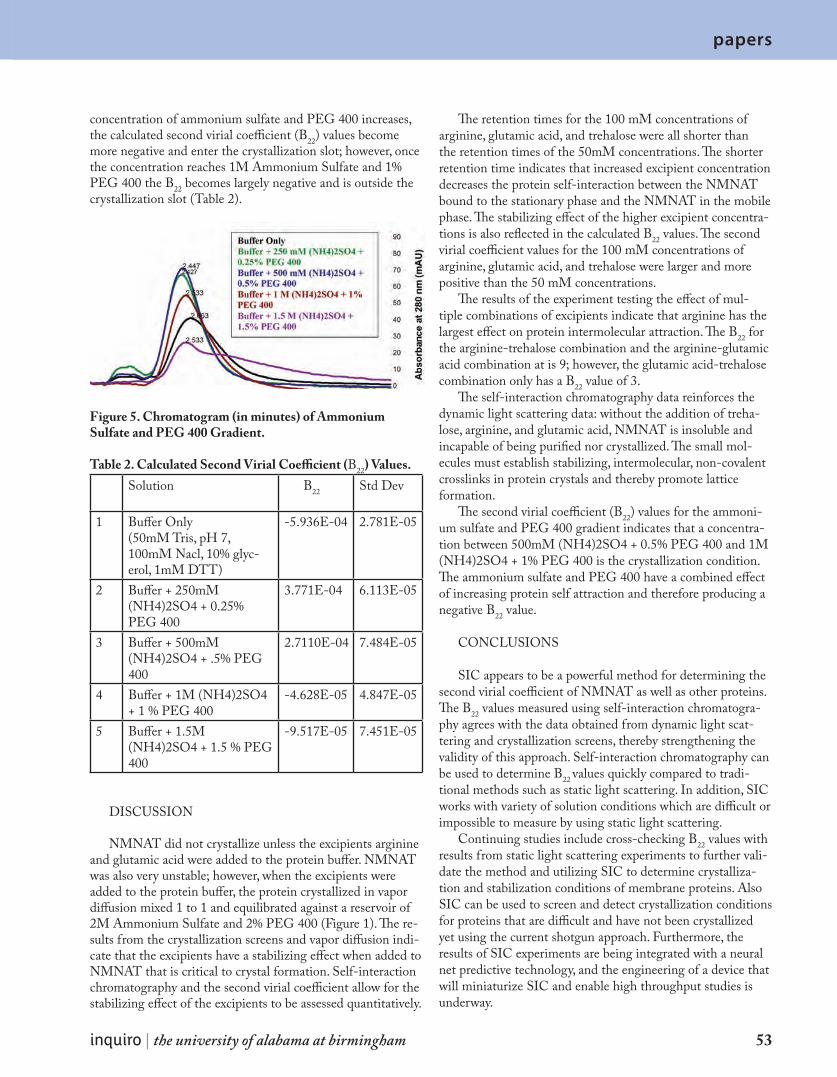
papers papers
inquiro | the university of alabama at birmingham 53
concentration of ammonium sulfate and PEG 400 increases, the calculated second virial coefficient (B22) values become more negative and enter the crystallization slot; however, once the concentration reaches 1M Ammonium Sulfate and 1% PEG 400 the B22 becomes largely negative and is outside the crystallization slot (Table 2).
Figure 5. Chromatogram (in minutes) of Ammonium Sulfate and PEG 400 Gradient.
Table 2. Calculated Second Virial Coefficient (B22) Values. Solution B22 Std Dev
1 Buffer Only(50mM Tris, pH 7, 100mM Nacl, 10% glyc-erol, 1mM DTT)
-5.936E-04 2.781E-05
2 Buffer + 250mM (NH4)2SO4 + 0.25% PEG 400
3.771E-04 6.113E-05
3 Buffer + 500mM (NH4)2SO4 + .5% PEG 400
2.7110E-04 7.484E-05
4 Buffer + 1M (NH4)2SO4 + 1 % PEG 400
-4.628E-05 4.847E-05
5 Buffer + 1.5M (NH4)2SO4 + 1.5 % PEG 400
-9.517E-05 7.451E-05
DISCUSSION
NMNAT did not crystallize unless the excipients arginine and glutamic acid were added to the protein buffer. NMNAT was also very unstable; however, when the excipients were added to the protein buffer, the protein crystallized in vapor diffusion mixed 1 to 1 and equilibrated against a reservoir of 2M Ammonium Sulfate and 2% PEG 400 (Figure 1). The re-sults from the crystallization screens and vapor diffusion indi-cate that the excipients have a stabilizing effect when added to NMNAT that is critical to crystal formation. Self-interaction chromatography and the second virial coefficient allow for the stabilizing effect of the excipients to be assessed quantitatively.
The retention times for the 100 mM concentrations of arginine, glutamic acid, and trehalose were all shorter than the retention times of the 50mM concentrations. The shorter retention time indicates that increased excipient concentration decreases the protein self-interaction between the NMNAT bound to the stationary phase and the NMNAT in the mobile phase. The stabilizing effect of the higher excipient concentra-tions is also reflected in the calculated B22 values. The second virial coefficient values for the 100 mM concentrations of arginine, glutamic acid, and trehalose were larger and more positive than the 50 mM concentrations.
The results of the experiment testing the effect of mul-tiple combinations of excipients indicate that arginine has the largest effect on protein intermolecular attraction. The B22 for the arginine-trehalose combination and the arginine-glutamic acid combination at is 9; however, the glutamic acid-trehalose combination only has a B22 value of 3.
The self-interaction chromatography data reinforces the dynamic light scattering data: without the addition of treha-lose, arginine, and glutamic acid, NMNAT is insoluble and incapable of being purified nor crystallized. The small mol-ecules must establish stabilizing, intermolecular, non-covalent crosslinks in protein crystals and thereby promote lattice formation.
The second virial coefficient (B22) values for the ammoni-um sulfate and PEG 400 gradient indicates that a concentra-tion between 500mM (NH4)2SO4 + 0.5% PEG 400 and 1M (NH4)2SO4 + 1% PEG 400 is the crystallization condition. The ammonium sulfate and PEG 400 have a combined effect of increasing protein self attraction and therefore producing a negative B22 value.
CONCLUSIONS
SIC appears to be a powerful method for determining the second virial coefficient of NMNAT as well as other proteins. The B22 values measured using self-interaction chromatogra-phy agrees with the data obtained from dynamic light scat-tering and crystallization screens, thereby strengthening the validity of this approach. Self-interaction chromatography can be used to determine B22 values quickly compared to tradi-tional methods such as static light scattering. In addition, SIC works with variety of solution conditions which are difficult or impossible to measure by using static light scattering.
Continuing studies include cross-checking B22 values with results from static light scattering experiments to further vali-date the method and utilizing SIC to determine crystalliza-tion and stabilization conditions of membrane proteins. Also SIC can be used to screen and detect crystallization conditions for proteins that are difficult and have not been crystallized yet using the current shotgun approach. Furthermore, the results of SIC experiments are being integrated with a neural net predictive technology, and the engineering of a device that will miniaturize SIC and enable high throughput studies is underway.

papers
54 inquiro | no. 1 | 2007
ACKNOWLEDGMENTS
This research was supported by the National Science Foundation (NSF)- Research Experiences for Undergradu-ates (REU)- site award under Grant No. DMR-0646842. This project was also made possible through the help of Dr. Larry DeLucas, O.D., Ph.D., Dr. Lisa Nagy, Ph.D., and Debbie McCombs at UAB’s Center for Biophysical Sciences and Engineering.
REFERENCES
Garcia, C., Hadley, D., Wilson, W., and Henry, C. Measuring •Protein Interactions by Microchip Self-Interaction Chroma-tography. Biotechnology Progress 19, 2003, 1006-1010.George, A. and Wilson, W. Predicting Protein Crystallization •from a Dilute Solution Property. Acta Crystallography Sec-tion D 50, 1994, 361-365.
McPherson, A. and Cudney, B. Searching for silver bullets: •An Alternative Strategy For Crystallizing Macromolecules. Journal of Structural Biology 156, 2006, 387-406.McPherson, A. Introduction to protein crystallization. •Methods 34, 2004, 254-256.Valente, J., Vrma, K., Manning, M., Wilson, W., and Henry, •C. Second Virial Coefficient Studies of Cosolvent-Induced Protein Self-Interaction. Biophysical Journal 89, 2005, 4211-4218.Tessier, P.M., Lenhoff, A.M., and Sandler, S.I. Rapid Measure-•ment of Protein Osmotic Second Virial Coefficients by Self- Interaction Chromatography. Biophysical Journal 82, 2002, 1620-1631.
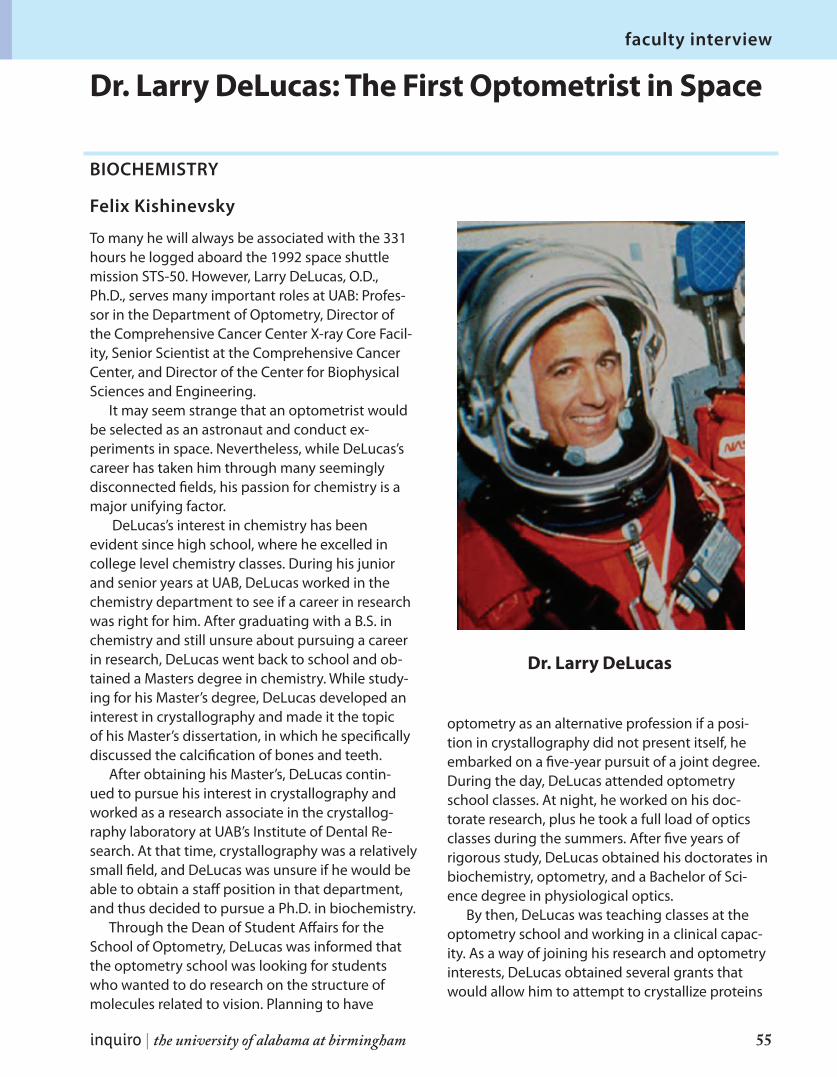
papers
inquiro | the university of alabama at birmingham 55
faculty interview
BIOCHEMISTRY
Dr. Larry DeLucas: The First Optometrist in Space
To many he will always be associated with the 331 hours he logged aboard the 1992 space shuttle mission STS-50. However, Larry DeLucas, O.D., Ph.D., serves many important roles at UAB: Profes-sor in the Department of Optometry, Director of the Comprehensive Cancer Center X-ray Core Facil-ity, Senior Scientist at the Comprehensive Cancer Center, and Director of the Center for Biophysical Sciences and Engineering.
It may seem strange that an optometrist would be selected as an astronaut and conduct ex-periments in space. Nevertheless, while DeLucas’s career has taken him through many seemingly disconnected fields, his passion for chemistry is a major unifying factor.
DeLucas’s interest in chemistry has been evident since high school, where he excelled in college level chemistry classes. During his junior and senior years at UAB, DeLucas worked in the chemistry department to see if a career in research was right for him. After graduating with a B.S. in chemistry and still unsure about pursuing a career in research, DeLucas went back to school and ob-tained a Masters degree in chemistry. While study-ing for his Master’s degree, DeLucas developed an interest in crystallography and made it the topic of his Master’s dissertation, in which he specifically discussed the calcification of bones and teeth.
After obtaining his Master’s, DeLucas contin-ued to pursue his interest in crystallography and worked as a research associate in the crystallog-raphy laboratory at UAB’s Institute of Dental Re-search. At that time, crystallography was a relatively small field, and DeLucas was unsure if he would be able to obtain a staff position in that department, and thus decided to pursue a Ph.D. in biochemistry.
Through the Dean of Student Affairs for the School of Optometry, DeLucas was informed that the optometry school was looking for students who wanted to do research on the structure of molecules related to vision. Planning to have
optometry as an alternative profession if a posi-tion in crystallography did not present itself, he embarked on a five-year pursuit of a joint degree. During the day, DeLucas attended optometry school classes. At night, he worked on his doc-torate research, plus he took a full load of optics classes during the summers. After five years of rigorous study, DeLucas obtained his doctorates in biochemistry, optometry, and a Bachelor of Sci-ence degree in physiological optics.
By then, DeLucas was teaching classes at the optometry school and working in a clinical capac-ity. As a way of joining his research and optometry interests, DeLucas obtained several grants that would allow him to attempt to crystallize proteins
Dr. Larry DeLucas
Felix Kishinevsky
56 inquiro | no. 1 | 2007
faculty interview
that were involved in eye disorders and also as-sociated with diabetes. Around this time, DeLucas began meeting with various NASA scientists from the Marshall Space Flight Center and discussing the possibility of growing crystals in space.
The ultimate goal of crystallography is struc-ture-based drug design. Crystallography research enables scientists to determine the exact molecular structure and position of atoms in a molecule. Pro-cessing this information through a computer can give researchers a three-dimensional image of the structure. Such knowledge of how proteins work allows scientists to design drugs that are more ef-fective at treating various diseases. In space, these crystals grow much larger and more slowly.
After designing a new and effective way to grow crystals in space, NASA flew DeLucas’ equipment and experiments aboard a total of four space shut-tles over nine months. After each flight, DeLucas redesigned his equipment to make it more effec-tive. However, after the Challenger disaster, NASA developed a much more stringent set of rules for any equipment brought aboard a shuttle and required DeLucas to contract an outside company to build his equipment. DeLucas subsequently decided to hire five engineers to design his equip-ment. At this point DeLucas’ career took a turn from merely crystallizing proteins to developing technology that would crystallize proteins more quickly and accurately, yet he did not discontinue his crystallography research.
One of DeLucas most famous achievements was serving as the payload specialist on the 1992 U.S. Microgravity Laboratory (Space Shuttle Mission STS-50) under Commander Dick Richards. Over a period of nearly two weeks, DeLucas traveled
over 5.7 million miles in 221 orbits and conducted several hundred experiments related to crystallog-raphy and various other fields.
DeLucas’s main role today is serving as the Director of the Center for Biophysical Sciences and Engineering. DeLucas is combining all of his interests into the ultimate goal of designing medi-cations that better target and treat the diseases that seem to evade current treatment methods. A more substantial project involves attempting to crystallize, in large quantities, the cystic fibrosis transmembrane protein. Employing a total of 105 people, including 27 engineers, 11 faculty mem-bers, 4 technicians, and the CBSE truly is an inter-disciplinary building.
DeLucas views interdisci-plinary teamwork as being vital to the future of scien-tific research. The days of a single scientist working by himself and being an expert in various fields of study are becoming rare, and coop-eration among scientists representing various fields of study is increasing. This is
evident at the CBSE, where biochemists, crystallog-raphers, and molecular geneticists work together.
Speculating on the future of scientific research, DeLucas believes that right now is the best time for scientific research. Advances in technology and the potential force of nanotechnology have made scientific research a very exciting place at the pres-ent. However, research opportunities sometimes decrease, and funding for scientific research is not at its current peak due to various factors. DeLucas advises those considering a career in research to have a clinical background that can help in direct-ing their research of choice. For DeLucas, a clinical background in optometry helped him in his re-search of the structure of proteins related to ocular diseases.
DeLucas is eager to share his love of science with high school students and undergraduates. He has high school students working in his lab every summer, and college undergraduates work with him throughout the school year.
D e L u c a s a d v i s e s t h o s e c o n s i d e r i n g a c a r e e r i n r e s e a r c h t o h a v e a c l i n i c a l b a c k g r o u n d t h a t c a n h e l p i n d i r e c t -i n g t h e i r r e s e a r c h o f c h o i c e .
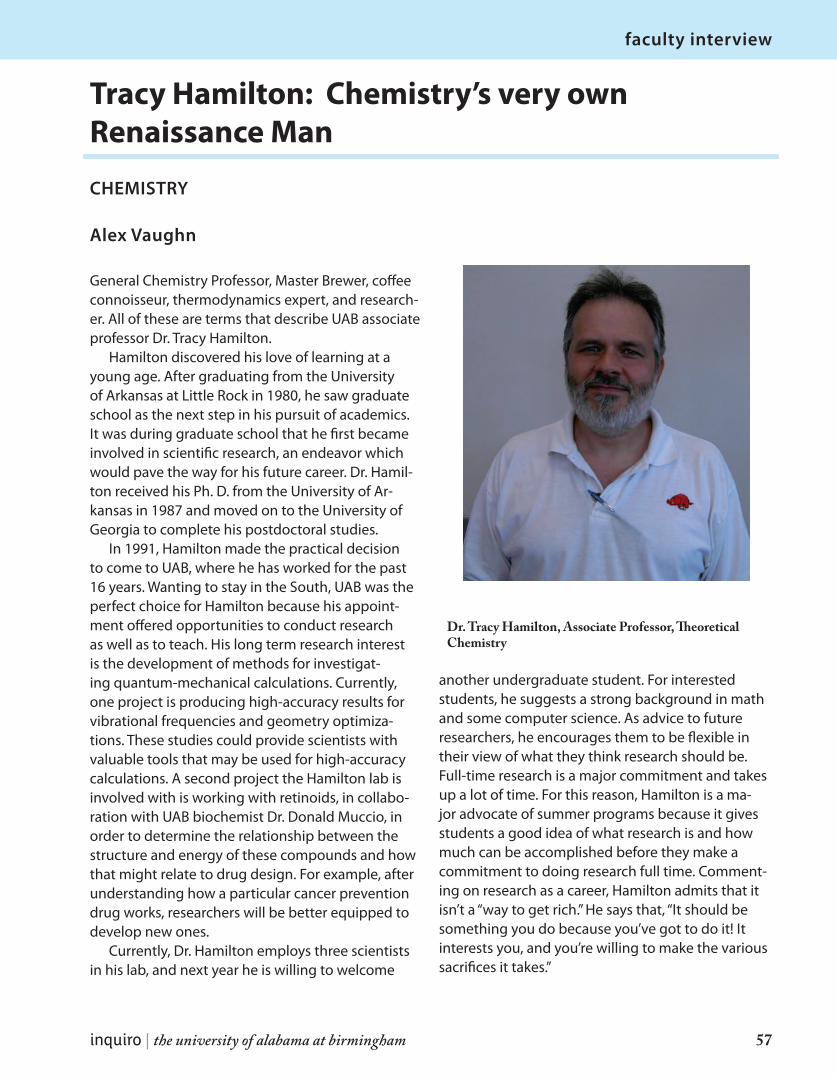
inquiro | the university of alabama at birmingham 57
faculty interview
General Chemistry Professor, Master Brewer, coffee connoisseur, thermodynamics expert, and research-er. All of these are terms that describe UAB associate professor Dr. Tracy Hamilton.
Hamilton discovered his love of learning at a young age. After graduating from the University of Arkansas at Little Rock in 1980, he saw graduate school as the next step in his pursuit of academics. It was during graduate school that he first became involved in scientific research, an endeavor which would pave the way for his future career. Dr. Hamil-ton received his Ph. D. from the University of Ar-kansas in 1987 and moved on to the University of Georgia to complete his postdoctoral studies.
In 1991, Hamilton made the practical decision to come to UAB, where he has worked for the past 16 years. Wanting to stay in the South, UAB was the perfect choice for Hamilton because his appoint-ment offered opportunities to conduct research as well as to teach. His long term research interest is the development of methods for investigat-ing quantum-mechanical calculations. Currently, one project is producing high-accuracy results for vibrational frequencies and geometry optimiza-tions. These studies could provide scientists with valuable tools that may be used for high-accuracy calculations. A second project the Hamilton lab is involved with is working with retinoids, in collabo-ration with UAB biochemist Dr. Donald Muccio, in order to determine the relationship between the structure and energy of these compounds and how that might relate to drug design. For example, after understanding how a particular cancer prevention drug works, researchers will be better equipped to develop new ones.
Currently, Dr. Hamilton employs three scientists in his lab, and next year he is willing to welcome
another undergraduate student. For interested students, he suggests a strong background in math and some computer science. As advice to future researchers, he encourages them to be flexible in their view of what they think research should be. Full-time research is a major commitment and takes up a lot of time. For this reason, Hamilton is a ma-jor advocate of summer programs because it gives students a good idea of what research is and how much can be accomplished before they make a commitment to doing research full time. Comment-ing on research as a career, Hamilton admits that it isn’t a “way to get rich.” He says that, “It should be something you do because you’ve got to do it! It interests you, and you’re willing to make the various sacrifices it takes.”
CHEMISTRY
Tracy Hamilton: Chemistry’s very ownRenaissance Man
Dr. Tracy Hamilton, Associate Professor, Theoretical Chemistry
Alex Vaughn
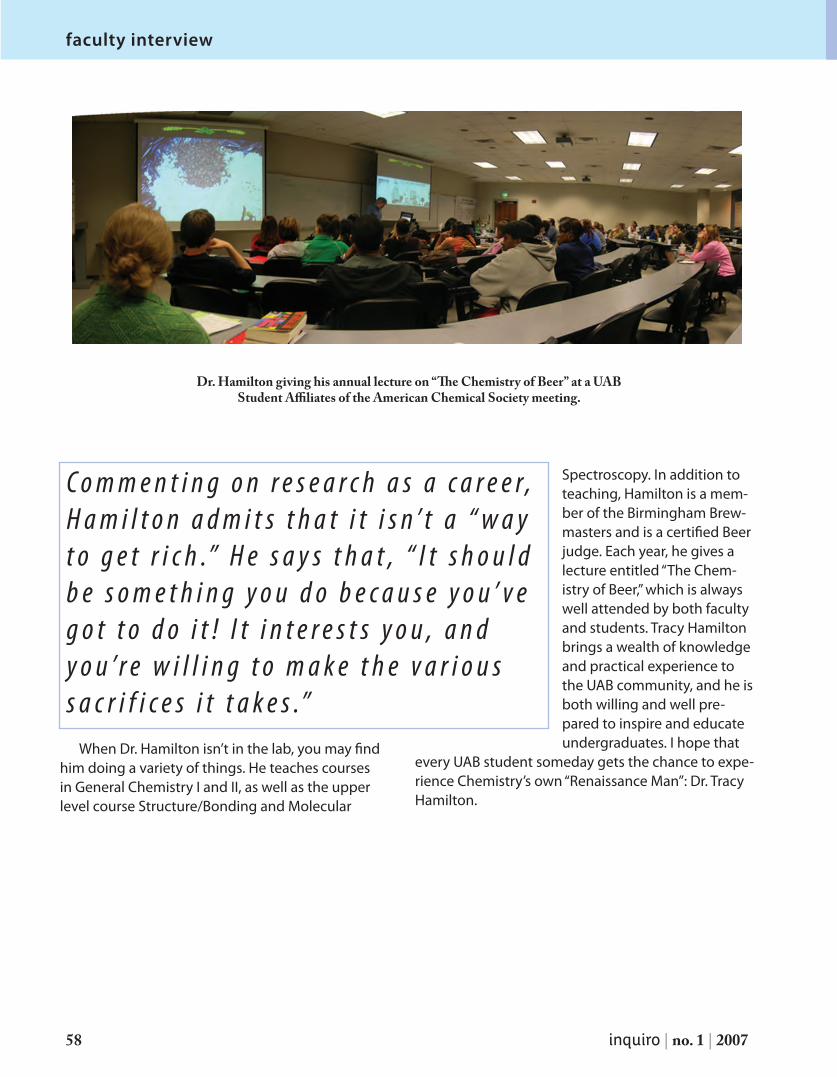
58 inquiro | no. 1 | 2007
faculty interview
Dr. Hamilton giving his annual lecture on “The Chemistry of Beer” at a UAB Student Affiliates of the American Chemical Society meeting.
When Dr. Hamilton isn’t in the lab, you may find him doing a variety of things. He teaches courses in General Chemistry I and II, as well as the upper level course Structure/Bonding and Molecular
Spectroscopy. In addition to teaching, Hamilton is a mem-ber of the Birmingham Brew-masters and is a certified Beer judge. Each year, he gives a lecture entitled “The Chem-istry of Beer,” which is always well attended by both faculty and students. Tracy Hamilton brings a wealth of knowledge and practical experience to the UAB community, and he is both willing and well pre-pared to inspire and educate undergraduates. I hope that
every UAB student someday gets the chance to expe-rience Chemistry’s own “Renaissance Man”: Dr. Tracy Hamilton.
C o m m e n t i n g o n r e s e a r c h a s a c a r e e r, H a m i l t o n a d m i t s t h a t i t i s n ’ t a “ w a y t o g e t r i c h .” H e s a y s t h a t , “ I t s h o u l d b e s o m e t h i n g y o u d o b e c a u s e y o u ’ v e g o t t o d o i t ! I t i n t e r e s t s y o u , a n d y o u ’ r e w i l l i n g t o m a k e t h e v a r i o u s s a c r i f i c e s i t t a k e s .”
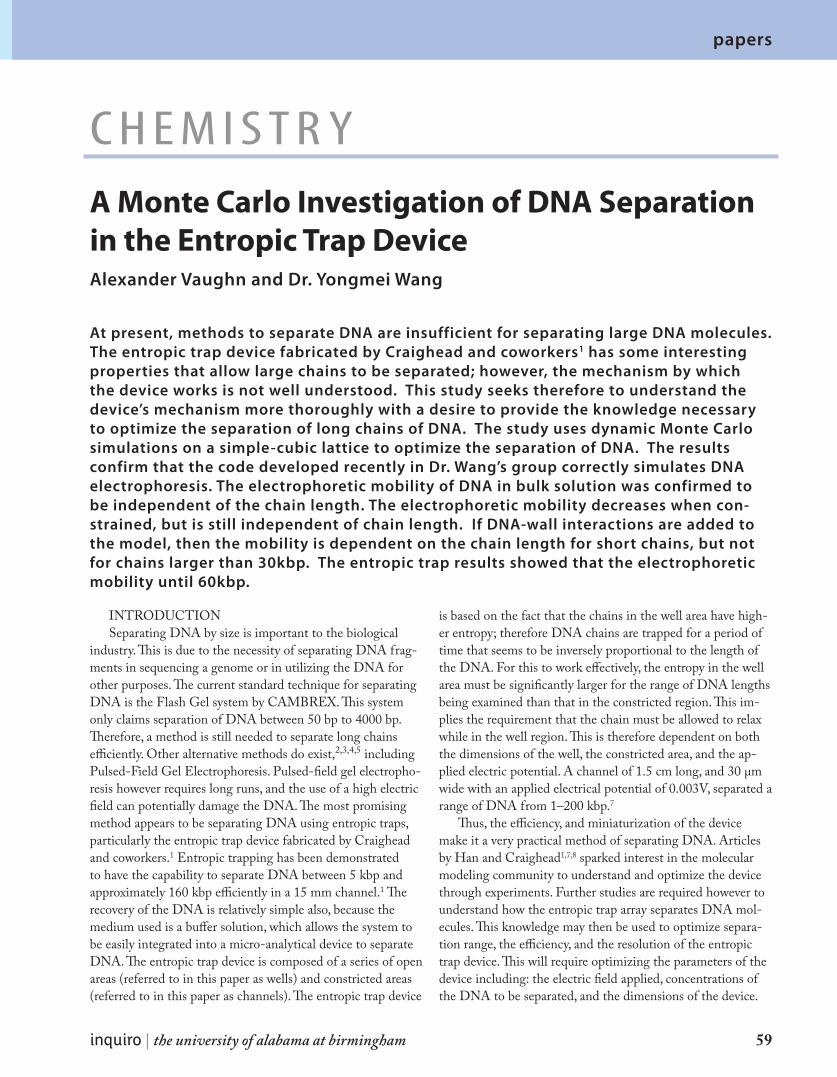
inquiro | the university of alabama at birmingham 59
At present, methods to separate DNA are insufficient for separating large DNA molecules. The entropic trap device fabricated by Craighead and coworkers1 has some interesting properties that allow large chains to be separated; however, the mechanism by which the device works is not well understood. This study seeks therefore to understand the device’s mechanism more thoroughly with a desire to provide the knowledge necessary to optimize the separation of long chains of DNA. The study uses dynamic Monte Carlo simulations on a simple-cubic lattice to optimize the separation of DNA. The results confirm that the code developed recently in Dr. Wang’s group correctly simulates DNA electrophoresis. The electrophoretic mobility of DNA in bulk solution was confirmed to be independent of the chain length. The electrophoretic mobility decreases when con-strained, but is still independent of chain length. If DNA-wall interactions are added to the model, then the mobility is dependent on the chain length for short chains, but not for chains larger than 30kbp. The entropic trap results showed that the electrophoretic mobility until 60kbp.
INTRODUCTIONSeparating DNA by size is important to the biological
industry. This is due to the necessity of separating DNA frag-ments in sequencing a genome or in utilizing the DNA for other purposes. The current standard technique for separating DNA is the Flash Gel system by CAMBREX. This system only claims separation of DNA between 50 bp to 4000 bp. Therefore, a method is still needed to separate long chains efficiently. Other alternative methods do exist,2,3,4,5 including Pulsed-Field Gel Electrophoresis. Pulsed-field gel electropho-resis however requires long runs, and the use of a high electric field can potentially damage the DNA. The most promising method appears to be separating DNA using entropic traps, particularly the entropic trap device fabricated by Craighead and coworkers.1 Entropic trapping has been demonstrated to have the capability to separate DNA between 5 kbp and approximately 160 kbp efficiently in a 15 mm channel.1 The recovery of the DNA is relatively simple also, because the medium used is a buffer solution, which allows the system to be easily integrated into a micro-analytical device to separate DNA. The entropic trap device is composed of a series of open areas (referred to in this paper as wells) and constricted areas (referred to in this paper as channels). The entropic trap device
is based on the fact that the chains in the well area have high-er entropy; therefore DNA chains are trapped for a period of time that seems to be inversely proportional to the length of the DNA. For this to work effectively, the entropy in the well area must be significantly larger for the range of DNA lengths being examined than that in the constricted region. This im-plies the requirement that the chain must be allowed to relax while in the well region. This is therefore dependent on both the dimensions of the well, the constricted area, and the ap-plied electric potential. A channel of 1.5 cm long, and 30 μm wide with an applied electrical potential of 0.003V, separated a range of DNA from 1–200 kbp.7
Thus, the efficiency, and miniaturization of the device make it a very practical method of separating DNA. Articles by Han and Craighead1,7,8 sparked interest in the molecular modeling community to understand and optimize the device through experiments. Further studies are required however to understand how the entropic trap array separates DNA mol-ecules. This knowledge may then be used to optimize separa-tion range, the efficiency, and the resolution of the entropic trap device. This will require optimizing the parameters of the device including: the electric field applied, concentrations of the DNA to be separated, and the dimensions of the device.
A Monte Carlo Investigation of DNA Separation in the Entropic Trap Device
chemistr y
Alexander Vaughn and Dr. Yongmei Wang
papers
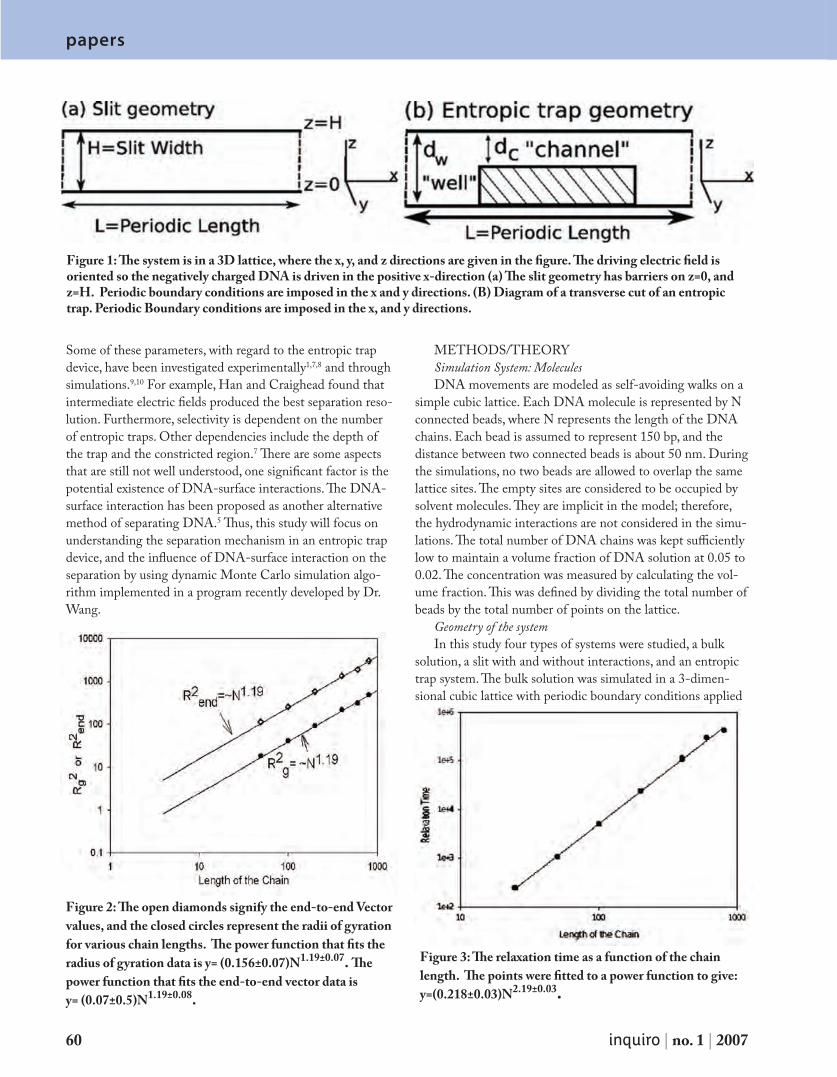
papers
60 inquiro | no. 1 | 2007
Some of these parameters, with regard to the entropic trap device, have been investigated experimentally1,7,8 and through simulations.9,10 For example, Han and Craighead found that intermediate electric fields produced the best separation reso-lution. Furthermore, selectivity is dependent on the number of entropic traps. Other dependencies include the depth of the trap and the constricted region.7 There are some aspects that are still not well understood, one significant factor is the potential existence of DNA-surface interactions. The DNA-surface interaction has been proposed as another alternative method of separating DNA.5 Thus, this study will focus on understanding the separation mechanism in an entropic trap device, and the influence of DNA-surface interaction on the separation by using dynamic Monte Carlo simulation algo-rithm implemented in a program recently developed by Dr. Wang.
METHODS/THEORYSimulation System: MoleculesDNA movements are modeled as self-avoiding walks on a
simple cubic lattice. Each DNA molecule is represented by N connected beads, where N represents the length of the DNA chains. Each bead is assumed to represent 150 bp, and the distance between two connected beads is about 50 nm. During the simulations, no two beads are allowed to overlap the same lattice sites. The empty sites are considered to be occupied by solvent molecules. They are implicit in the model; therefore, the hydrodynamic interactions are not considered in the simu-lations. The total number of DNA chains was kept sufficiently low to maintain a volume fraction of DNA solution at 0.05 to 0.02. The concentration was measured by calculating the vol-ume fraction. This was defined by dividing the total number of beads by the total number of points on the lattice.
Geometry of the systemIn this study four types of systems were studied, a bulk
solution, a slit with and without interactions, and an entropic trap system. The bulk solution was simulated in a 3-dimen-sional cubic lattice with periodic boundary conditions applied
Figure 1: The system is in a 3D lattice, where the x, y, and z directions are given in the figure. The driving electric field is oriented so the negatively charged DNA is driven in the positive x-direction (a) The slit geometry has barriers on z=0, and z=H. Periodic boundary conditions are imposed in the x and y directions. (B) Diagram of a transverse cut of an entropic trap. Periodic Boundary conditions are imposed in the x, and y directions.
Figure 3: The relaxation time as a function of the chain length. The points were fitted to a power function to give: y=(0.218±0.03)N2.19±0.03.
Figure 2: The open diamonds signify the end-to-end Vector values, and the closed circles represent the radii of gyration for various chain lengths. The power function that fits the radius of gyration data is y= (0.156±0.07)N1.19±0.07. The power function that fits the end-to-end vector data is y= (0.07±0.5)N1.19±0.08.
papers
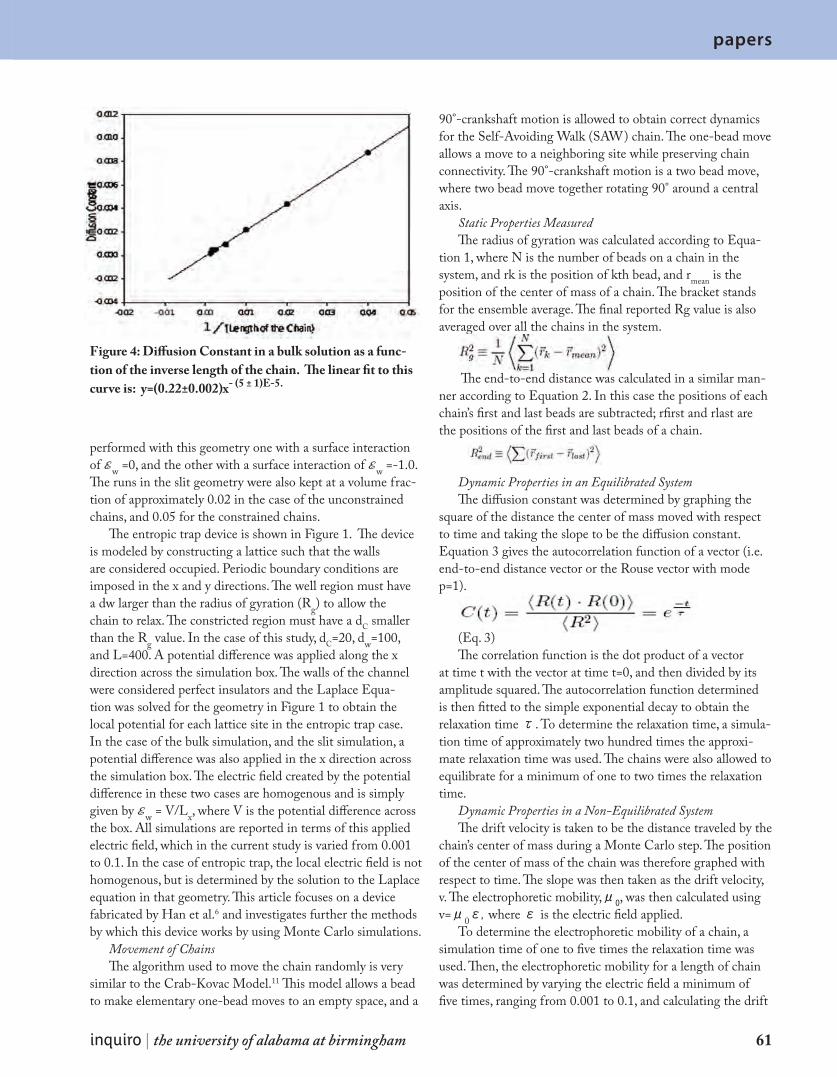
papers
inquiro | the university of alabama at birmingham 61
in all three directions. This simulates an infinite solution. The bulk solutions for measuring both static and dynamic prop-erties were kept at a volume fraction of approximately 0.02. Every bulk simulation run had a minimum of forty chains.
The slit geometry is also simulated in a 3-dimensional cubic lattice, but it contained two impenetrable surfaces along the z-directions. No beads can occupy the sites on the surface. When a bead is next to a surface site, then a bead-surface interaction, ℰw, can be applied. If ℰw =0, then the slit has no surface interactions. When ℰw <0, then the slit has surface interactions. The box size was chosen in a similar manner as the bulk solution, with the exception that the width was kept at a constant slit width of 20. Two series of calculations were
performed with this geometry one with a surface interaction of ℰw =0, and the other with a surface interaction of ℰw =-1.0. The runs in the slit geometry were also kept at a volume frac-tion of approximately 0.02 in the case of the unconstrained chains, and 0.05 for the constrained chains.
The entropic trap device is shown in Figure 1. The device is modeled by constructing a lattice such that the walls are considered occupied. Periodic boundary conditions are imposed in the x and y directions. The well region must have a dw larger than the radius of gyration (Rg) to allow the chain to relax. The constricted region must have a dC smaller than the Rg value. In the case of this study, dC=20, dw=100, and L=400. A potential difference was applied along the x direction across the simulation box. The walls of the channel were considered perfect insulators and the Laplace Equa-tion was solved for the geometry in Figure 1 to obtain the local potential for each lattice site in the entropic trap case. In the case of the bulk simulation, and the slit simulation, a potential difference was also applied in the x direction across the simulation box. The electric field created by the potential difference in these two cases are homogenous and is simply given by ℰw = V/Lx, where V is the potential difference across the box. All simulations are reported in terms of this applied electric field, which in the current study is varied from 0.001 to 0.1. In the case of entropic trap, the local electric field is not homogenous, but is determined by the solution to the Laplace equation in that geometry. This article focuses on a device fabricated by Han et al.6 and investigates further the methods by which this device works by using Monte Carlo simulations.
Movement of ChainsThe algorithm used to move the chain randomly is very
similar to the Crab-Kovac Model.11 This model allows a bead to make elementary one-bead moves to an empty space, and a
90°-crankshaft motion is allowed to obtain correct dynamics for the Self-Avoiding Walk (SAW) chain. The one-bead move allows a move to a neighboring site while preserving chain connectivity. The 90°-crankshaft motion is a two bead move, where two bead move together rotating 90° around a central axis.
Static Properties MeasuredThe radius of gyration was calculated according to Equa-
tion 1, where N is the number of beads on a chain in the system, and rk is the position of kth bead, and rmean is the position of the center of mass of a chain. The bracket stands for the ensemble average. The final reported Rg value is also averaged over all the chains in the system.
The end-to-end distance was calculated in a similar man-ner according to Equation 2. In this case the positions of each chain’s first and last beads are subtracted; rfirst and rlast are the positions of the first and last beads of a chain.
Dynamic Properties in an Equilibrated SystemThe diffusion constant was determined by graphing the
square of the distance the center of mass moved with respect to time and taking the slope to be the diffusion constant. Equation 3 gives the autocorrelation function of a vector (i.e. end-to-end distance vector or the Rouse vector with mode p=1).
(Eq. 3) The correlation function is the dot product of a vector
at time t with the vector at time t=0, and then divided by its amplitude squared. The autocorrelation function determined is then fitted to the simple exponential decay to obtain the relaxation time τ. To determine the relaxation time, a simula-tion time of approximately two hundred times the approxi-mate relaxation time was used. The chains were also allowed to equilibrate for a minimum of one to two times the relaxation time.
Dynamic Properties in a Non-Equilibrated SystemThe drift velocity is taken to be the distance traveled by the
chain’s center of mass during a Monte Carlo step. The position of the center of mass of the chain was therefore graphed with respect to time. The slope was then taken as the drift velocity, v. The electrophoretic mobility,�
0, was then calculated using
v=�0ε, where ε is the electric field applied. To determine the electrophoretic mobility of a chain, a
simulation time of one to five times the relaxation time was used. Then, the electrophoretic mobility for a length of chain was determined by varying the electric field a minimum of five times, ranging from 0.001 to 0.1, and calculating the drift
Figure 4: Diffusion Constant in a bulk solution as a func-tion of the inverse length of the chain. The linear fit to this curve is: y=(0.22±0.002)x- (5 ± 1)E-5.
papers
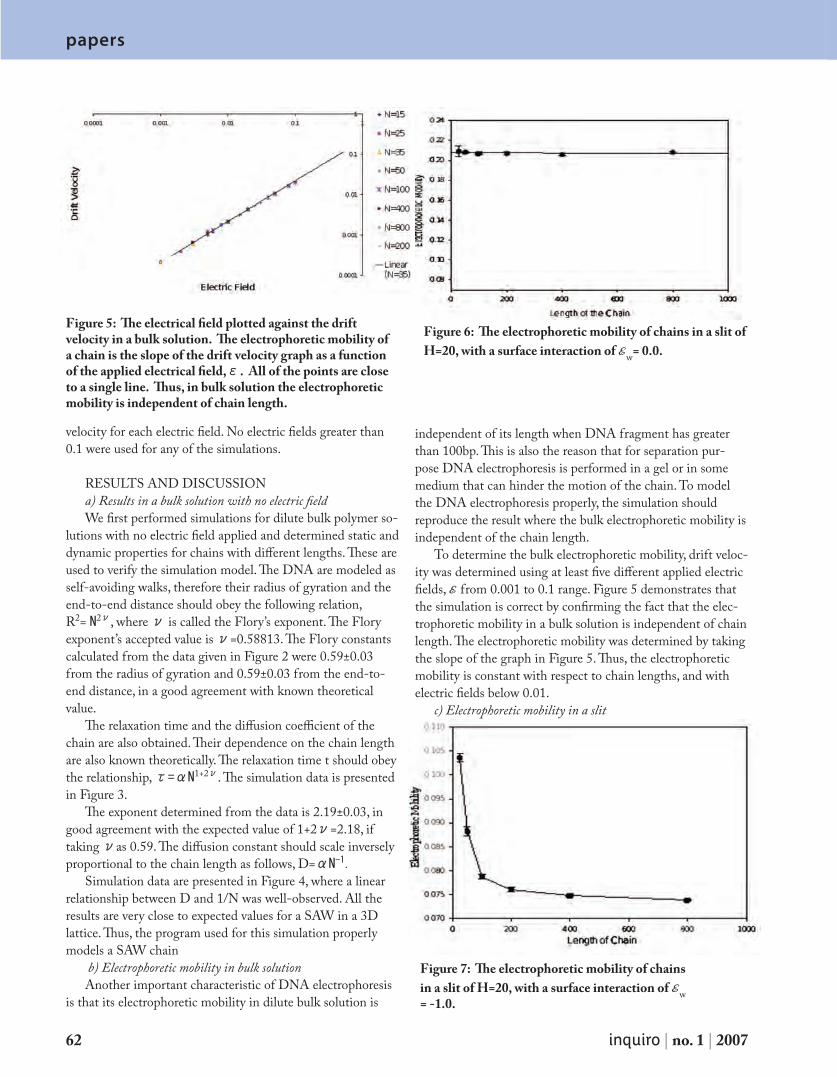
papers
62 inquiro | no. 1 | 2007
papers
velocity for each electric field. No electric fields greater than 0.1 were used for any of the simulations.
RESULTS AND DISCUSSIONa) Results in a bulk solution with no electric fieldWe first performed simulations for dilute bulk polymer so-
lutions with no electric field applied and determined static and dynamic properties for chains with different lengths. These are used to verify the simulation model. The DNA are modeled as self-avoiding walks, therefore their radius of gyration and the end-to-end distance should obey the following relation, R2= N2ν, where ν is called the Flory’s exponent. The Flory exponent’s accepted value is ν=0.58813. The Flory constants calculated from the data given in Figure 2 were 0.59±0.03 from the radius of gyration and 0.59±0.03 from the end-to-end distance, in a good agreement with known theoretical value.
The relaxation time and the diffusion coefficient of the chain are also obtained. Their dependence on the chain length are also known theoretically. The relaxation time t should obey the relationship, �=�N1+2ν. The simulation data is presented in Figure 3.
The exponent determined from the data is 2.19±0.03, in good agreement with the expected value of 1+2ν=2.18, if taking νas 0.59. The diffusion constant should scale inversely proportional to the chain length as follows, D=�N-1.
Simulation data are presented in Figure 4, where a linear relationship between D and 1/N was well-observed. All the results are very close to expected values for a SAW in a 3D lattice. Thus, the program used for this simulation properly models a SAW chain
b) Electrophoretic mobility in bulk solutionAnother important characteristic of DNA electrophoresis
is that its electrophoretic mobility in dilute bulk solution is
independent of its length when DNA fragment has greater than 100bp. This is also the reason that for separation pur-pose DNA electrophoresis is performed in a gel or in some medium that can hinder the motion of the chain. To model the DNA electrophoresis properly, the simulation should reproduce the result where the bulk electrophoretic mobility is independent of the chain length.
To determine the bulk electrophoretic mobility, drift veloc-ity was determined using at least five different applied electric fields, ℰ from 0.001 to 0.1 range. Figure 5 demonstrates that the simulation is correct by confirming the fact that the elec-trophoretic mobility in a bulk solution is independent of chain length. The electrophoretic mobility was determined by taking the slope of the graph in Figure 5. Thus, the electrophoretic mobility is constant with respect to chain lengths, and with electric fields below 0.01.
c) Electrophoretic mobility in a slit
Figure 6: The electrophoretic mobility of chains in a slit of H=20, with a surface interaction of ℰw= 0.0.
Figure 7: The electrophoretic mobility of chains in a slit of H=20, with a surface interaction of ℰw = -1.0.
Figure 5: The electrical field plotted against the drift velocity in a bulk solution. The electrophoretic mobility of a chain is the slope of the drift velocity graph as a function of the applied electrical field,ε. All of the points are close to a single line. Thus, in bulk solution the electrophoretic mobility is independent of chain length.
papers papers
inquiro | the university of alabama at birmingham 63
Two sets of simulations are performed to determine the
electrophoretic mobility of chains in a slit with H =20. In one set the surface has no interaction and on the other set the surface is adsorptive with ℰw=-1.0. Figure 6 shows that constrictions alone due to the slit geometry do not alter the electrophoretic mobility. The electrophoretic mobility of the chains still remain very close that in the bulk solution, around 0.209± 0.003. If interactions are added however, then Figure 7 shows that the electrophoretic mobility is not constant. Although, chains having a length larger than 400 have an electrophoretic mobility that is essentially constant. If each bead therefore is assumed to be equivalent to 150bp, then one may say that the slit with interactions is capable of separating DNA up to a length of 30,000bp.
d) Entropic Trap Array As can be seen in Figure 8, the electrophoretic mobil-
ity in an entropic trap array is directly related to the chain length. The mechanism by which this device works has not been investigated however in this study at the present time. However, in general these results do confirm the results from prior experimental studies up to 60kbp.1,7,8 The reason for the deviation compared to the expected results after 60kbp is un-known. These curves however require further characterization and study to draw any definite conclusions.
CONCLUSIONSIt can be concluded from these results that the simula-
tion correctly models DNA electrophoresis. In a bulk dilute solution, in the absence of any obstacles or constriction, the electrophoretic mobility is independent of the chain length, a known behavior for DNA electrophoresis. When a chain is in a constrained environment, it moves slower than in a non-constrained environment, but it could not be used to separate large chains effectively. A slit with DNA-wall interactions separates DNA with length below 400 effectively, but larger chains are not effectively separated. In the entropic trap device, the simulations confirmed that long chains do move faster with the device. In the future, more studies will be completed concerning DNA-wall interactions, by studying the effects of the strength of the interactions of a bead with the surface. Also, the entropic trap mechanism will be explored further by performing more calculations on the entropic trap.
REFERENCES
Han, J.; Craighead H.G. Science 2000, 288, 10261. Viovy ,J. Rev. of Mod. Phys.2000,72,8132. Slater, G.W.;Kenward, M.;McCormick, L.C.;Gauthier,M.G. Cur. 3. Op. in Biotech. 2003,14,58Luo H.; Gersappe D. Electrophoresis 2002,23,26904. Pernodet, N.; Samuilov, V.; Shin, K.; Sokolov, J.; Rafailovich, 5. M. H.; Gersappe, D.; Chu, B. Phys. Rev. Let. 2000,85,5651Ashton,R.;Padala,C., Kane, R.S. Cur. Op. in Biotech. 6. 2003,14,497Han, J.;Craighead,H.G. Anal. Chem. 2002,74,3947. Han, J.; Turner, S.W.; Craighead,H.G. Phys. Rev. Let. 8. 1999,83,1688Tessier,F.;Labrie,J.;Slater,G.W. Macromolecules 2002,35,47919. Streek, M; Schmid,F.;Duong,T.T.; Ros, A J. of Biotech. 10. 2004,112,78Naghizadeh, J.; Kovac, J. Phys. Rev. B 1986,34,198411. Frenkel, D.; Smit, B Understanding Molecular Simulation: 12. From Algorithms to Application; Computational Sciences Series; Academic Press: San Diego, CA, 2002; Vol. 1, pp 27-32.de Gennes, P.-G. Scaling Concepts in Polymer Physics, 13. Ithaca, Cornell University Press, 1979.
Figure 8: Electrophoretic mobility as it varies with the length of the chain in the entropic trap array. The electro-phoretic mobility increases as the chain length increases.
papers
64 inquiro | no. 1 | 2007
papers
Stephanie J. Hirst
chemistr y
NAD+ synthetase is the enzyme responsible for the conversion of nicotinic acid adenine dinucleotide (NaAD) into NAD+ in the final step of NAD+ biosynthesis. The prokaryotic and eukaryotic forms of NAD+ synthetase (or NADS) are different enough in size, en-zymatic activity, and substrate requirements that the enzyme may serve as a target in antibiotic development. B. anthracis NADS was subjected to limited proteolysis by tryp-sin and chymotrypsin in order to obtain information on the structure of the protein in solution, which was suspected to be different from the crystal structure. The proteolytic fragments were detected by SDS-PAGE and their masses determined by LC-MS. Tryptic cleavage occurred at Lys-9, Lys-86, Leu-95, Lys-132, Lys-206, and Lys-239. Chymotryp-tic cleavage occurred at Leu-11, Tyr-204, Trp-271, and Leu-277. These sites appear to be susceptible to cleavage because they are located in flexible regions and/or they are highly exposed to solvent. Some cleavages, such as those occurring in the C-terminal helix and at Leu-95, support the hypothesis that the crystal structure differs from the protein in solution because these cleavages would not be expected to occur in rigid sec-ondary structures.
INTRODUCTION
Nicotinamide adenine dinucleotide (NAD+) is a common coenzyme required for several biological functions, including energy metabolism, oxidation-reduction reactions, DNA-re-pair, and calcium-dependent signal transduction. The ubiqui-tous coenzyme can be synthesized via two different pathways: 1) a de novo pathway, in which NAD+ is synthesized from small molecules, and 2) a pyridine nucleotide salvage pathway. In any case, the last step of NAD+ biosynthesis is catalyzed by NAD+ synthetase (NADS) (1, 2). NADS (E.C. 6.3.5.1) is a common enzyme found in both prokaryotes and eukaryotes, and its catalytic activity is tightly regulated in all organisms (2). It has been shown that it is involved in the synthesis of a variety of biomolecules such as amino acids, purine and pyrimidine dinucleotides, amino sugars, and other coenzymes (1).
NADS is an amidotransferase and has recently been categorized as an “N type” ATP pyrophosphatase, which is a relatively new category of enzyme. The enzymes in this category are thought to share a common mechanism by which substrates are adenylated to promote amidation of the substrate. They often exhibit a “P loop” in the region of the pyrophosphate binding site that is rich in glycine. NADS syn-thesizes NAD+ from nicotinamide adenine dinucleotide in
two steps according to the reactions displayed in Figure 1. In this set of reactions, deamido-NAD+ is adenylated, and then ammonia is added to the intermediate, resulting in NAD+. This process requires at least two Mg2+ ions, which coordinate with active site residues and with ATP, thereby stabilizing the active site (1, 3, 4, 5).
Because the prokaryotic and eukaryotic forms of the enzyme are different in terms of size, enzymatic activity, and substrate requirements, it has recently become a primary target for the development of new antibiotics (3). This is an ever-growing field of research today because there is an unrelenting increase in the number of antibiotic-resistant bacteria, and multidrug resistance is an even more alarm-ing threat (6). Of particular interest in this experiment is the NAD+ synthetase from Bacillus anthracis, a spore-forming, gram-positive bacterium that causes anthrax, an acute, infec-tious disease characterized by various symptoms, including hemorrhage, edema, necrosis, and more. B. anthracis can be found world-wide, and it has recently attracted attention because of its potential use in bioterrorism. The spores of B. anthracis and anthrax were considered to be the main biologi-cal risk in the world in 1996. Therefore, the development of novel antibiotics that target B. anthracis has become rather significant (7, 8).
The crystal structure of B. anthracis NADS apo-enzyme
Structural Characterization of Bacillus anthracis NAD+ Synthetase by Limited Proteolysis
papers
inquiro | the university of alabama at birmingham 65
(banNADS) is displayed in Figure 2. The B. subtilis form of the enzyme, bsuNADS, has been studied more extensively and results obtained from studies of bsuNADS are often used to aid in understanding the structure and function of banNADS. Given that banNADS and bsuNADS have a sequence homol-ogy of at least 70%, it has been assumed that the two enzymes’ three-dimensional structures are very similar: They both consist of a compact homodimer with each monomer consist-ing of an α and ß subunit organized into a classic Rossmann fold. The ATP binding site is located where the two subunits meet, while the NaAD binding site is located in a deep cleft lying adjacent to the α/ß switch point, which extends across the monomer-monomer interface (3, 4).
In order to obtain good crystallographic data, the protein being studied needs to be very pure. Therefore, the addition of histidine-tags to proteins is often used to make purification easier and more efficient. The His-tag facilitates protein bind-ing to an affinity purification column charged with Ni (II). If the vector coded for an additional protease cleavage site, the His-tag may be removed and the protein purified further. This is not always done, as it is assumed that the His-tag has no ef-fect on the protein’s structure. It has been suspected that these His-tags may cause problems, such as altering the stability of the protein’s three-dimensional structure or increasing the
possibility of protein aggregation, but according to Carson et al., if there is any direct effect of the His-tag on the protein, it is rare (9).
In the case of the banNADS apo-enzyme solved by McDonald et al., the C-terminal His-tag appeared to lead to some modifications of the three-dimensional structure, in-cluding the fact that residues 257–265 were missing from the apo-enzyme crystal structure but were present in bsuNADS and other homologous structures. This suggests that the His-tag somehow prevents these residues from adopting a stable conformation. The tag itself appeared to occupy the active sites of both monomers of banNADS, but its enzymatic activity was confirmed by kinetic assay (4). It was then deemed neces-sary to perform an experiment that would yield structural information on the protein in solution by limited proteolysis of the banNADS apo-enzyme.
Although a three-dimensional structure of a protein can-not be obtained directly from limited proteolysis, the tech-nique has several advantages: The protein can be proteolyzed under physiological conditions, and it does not require large quantities of protein. Because proteolysis of highly ordered structures, such as α-helices and ß-strands, is thermodynami-cally unfavored, it is assumed that proteolysis would occur in regions of high motility and flexibility, such as loops and turns, and regions having high solvent accessibility surface areas (ASAs). This result has been confirmed in several studies, included those described by Fontana et al. (10).
Protein flexibility is vitally important to biological func-tion, and the presence of flexible regions, such as loops and turns, aid in this function. They may also work as hinges, al-lowing certain domains of the protein to transport a substrate (for example) from one domain to another (11). Flexible regions also often occur between domains and may allow these domains to move about freely in solution or may aid in protein-ligand binding (12). However, these regions often do not pack into arrays well and are thus not seen in the crys-tal structures. Proteolysis of a protein in solution can yield information on the flexibility a protein, beyond the surface loops that are disordered in crystal structures; this technique can help determine where disordered and ordered structures exist in solution, which can then be compared to those seen in the crystal structure. In the case of banNADS in particular,
Fig. 1. The conversion of NaAD to NAD+ by NAD+ synthetase
Fig. 2. Crystal structure of the B. anthracis NADS ho-modimer
papers
66 inquiro | no. 1 | 2007
papers
the ambiguity of the effect(s) of the C-terminal His-tag on the structure of the protein was cause for some concern: Is it in a region flexible enough to not affect enzymatic activ-ity? Also, one would expect proteolytic cleavage to coincide with the observation of flexible regions in the structure, but if cleavage occurs in an area that appears ordered in the crystal structure, it can be suspected that this area does not exist in a rigid, ordered structure 100% of the time. Proteins are known to be dynamic in solution, so such an observation is definitely possible.
In the current experiment, the NADS apo-enzyme from B. anthracis is subjected to limited proteolysis by trypsin and chymotrypsin. Trypsin, which cleaves on the carboxyl side of lysine (K) and arginine (R), is a ubiquitous endoprotease found in the pancreas. Its rate of hydrolysis tends to be slower if the residue at which cleavage occurs is located beside an acidic amino acid, and proteolysis may or may not occur if a proline is present beside the cleavage site. Trypsin has a mo-lecular weight of approximately 23.29 kDa and an optimum pH around 8.0 (13). Chymotrypsin is also a pancreatic endo-protease and cleaves on the carboxyl side of aromatic amino acids, such as tryptophan (W), tyrosine (Y), and phenylala-nine (F), and sometimes leucine (L). It has a molecular weight of approximately 25 kDa and an optimum pH of 7.8 (14).
The fragments resulting from proteolysis are detected qualitatively by SDS-PAGE, and the masses of the fragments are determined quantitatively by LC-ESI-MS, or liquid chro-matography electrospray ionization mass spectrometry. ESI-MS is well-suited for analyzing polar molecules which have a molecular weight between 100 Da and 1,000,000 Da (1,000 kDa). The ESI-MS itself, not including the liquid chromatog-raphy often performed in conjunction with the technique to further purify and separate fragments, operates by dissolving the sample in a polar, volatile solvent (such as ammonium ac-etate). The sample is then pumped through a narrow capillary tube (75–150 μM inner diameter, or i.d.) at a rate between 1 μL/min–1 mL/min. The capillary tip (not to be confused with the LC capillary) holds the sample to be ionized and sits within the ionization source of the mass spectrometer; to this tip, a strong electric voltage (3–4 kV) is applied. The result-ing electric field causes the sample emerging from the tip of
the capillary to be dispersed into highly-charged droplets. A nebulating gas, such as nitrogen, is used to helps direct the ionized spray to the mass spectrometer. The drying gas, also often nitrogen, flows across the ionization source and causes the solvent in the droplets to evaporate, leaving only the charged sample ions. Some of these ions pass through a sam-pling cone into an intermediate vacuum region and then into high vacuum region containing the analyzer, which can be one of several types, including TOF (time of flight, the type used in this experiment), quadrupole, etc. The lens voltages are set according to each individual sample (Figure 3). It is this type of mass spectrometry that is used to determine the exact masses of the fragments resulting from the proteolysis of B. anthracis NAD+ synthetase.
METHODS AND MATERIALS
Materials—The pET21b vector and DNase were pur-chased from Novagen (Madison WI), and BL21(DE3) E. coli was purchased from Invitrogen (Carisbad, CA). LB agar, LB broth, Tris, methanol, and glacial acetic acid were all purchased from Fisher Scientific. Ampicillin, all proteolytic enzymes, NH4HCO3, CaCl2, and all other reagents were pur-chased from Sigma Chemical Co. (St. Louis MO).
Optical densities were measured using a Beckman DU 640B UV/Visible spectrophotometer. French press was con-ducted using a French Pressure Cell Press from SIM Aminco Spectronic Instruments (Rochester, NY). The HiTrap 5-mL nickel affinity chromatography column, Superdex 200 16/60 gel filtration column, Äkta Explorer purification system, and the Fractionation 900 fraction collector were purchased from Amersham Biosciences (Piscataway, NJ); the software used to run the Äkta system was Unicorn. Concentration of protein solutions and buffer exchange were conducted using an Amicon Ultracentrifugal Filter Device with a minimum molecular weight limit of 10 kDa (Millipore Corporation, Billerica, MA). SDS-PAGE was conducted using Tris-HCl 4–20% Ready Gels and Precision Plus Protein Standard from BioRad Laboratories (Hercules, CA). Coomassie Brilliant Blue was purchased from Imperial Chemical Industries. Mass spectral analyses were performed with a Tandem Q-ToF 2
Fig. 3. Schematic of the operation of ESI-MS (Standard electrospray ionization source, Platform II) [15]
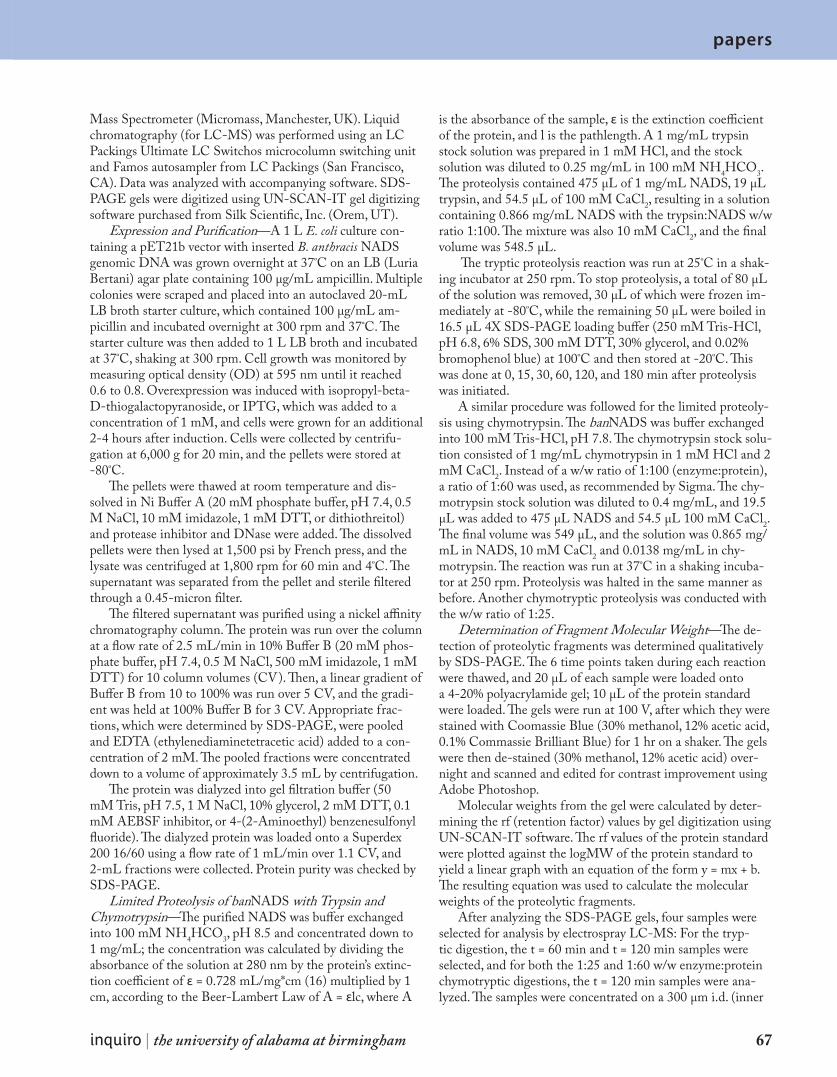
papers papers
inquiro | the university of alabama at birmingham 67
Mass Spectrometer (Micromass, Manchester, UK). Liquid chromatography (for LC-MS) was performed using an LC Packings Ultimate LC Switchos microcolumn switching unit and Famos autosampler from LC Packings (San Francisco, CA). Data was analyzed with accompanying software. SDS-PAGE gels were digitized using UN-SCAN-IT gel digitizing software purchased from Silk Scientific, Inc. (Orem, UT).
Expression and Purification—A 1 L E. coli culture con-taining a pET21b vector with inserted B. anthracis NADS genomic DNA was grown overnight at 37ºC on an LB (Luria Bertani) agar plate containing 100 μg/mL ampicillin. Multiple colonies were scraped and placed into an autoclaved 20-mL LB broth starter culture, which contained 100 μg/mL am-picillin and incubated overnight at 300 rpm and 37ºC. The starter culture was then added to 1 L LB broth and incubated at 37ºC, shaking at 300 rpm. Cell growth was monitored by measuring optical density (OD) at 595 nm until it reached 0.6 to 0.8. Overexpression was induced with isopropyl-beta-D-thiogalactopyranoside, or IPTG, which was added to a concentration of 1 mM, and cells were grown for an additional 2-4 hours after induction. Cells were collected by centrifu-gation at 6,000 g for 20 min, and the pellets were stored at -80ºC.
The pellets were thawed at room temperature and dis-solved in Ni Buffer A (20 mM phosphate buffer, pH 7.4, 0.5 M NaCl, 10 mM imidazole, 1 mM DTT, or dithiothreitol) and protease inhibitor and DNase were added. The dissolved pellets were then lysed at 1,500 psi by French press, and the lysate was centrifuged at 1,800 rpm for 60 min and 4ºC. The supernatant was separated from the pellet and sterile filtered through a 0.45-micron filter.
The filtered supernatant was purified using a nickel affinity chromatography column. The protein was run over the column at a flow rate of 2.5 mL/min in 10% Buffer B (20 mM phos-phate buffer, pH 7.4, 0.5 M NaCl, 500 mM imidazole, 1 mM DTT) for 10 column volumes (CV). Then, a linear gradient of Buffer B from 10 to 100% was run over 5 CV, and the gradi-ent was held at 100% Buffer B for 3 CV. Appropriate frac-tions, which were determined by SDS-PAGE, were pooled and EDTA (ethylenediaminetetracetic acid) added to a con-centration of 2 mM. The pooled fractions were concentrated down to a volume of approximately 3.5 mL by centrifugation.
The protein was dialyzed into gel filtration buffer (50 mM Tris, pH 7.5, 1 M NaCl, 10% glycerol, 2 mM DTT, 0.1 mM AEBSF inhibitor, or 4-(2-Aminoethyl) benzenesulfonyl fluoride). The dialyzed protein was loaded onto a Superdex 200 16/60 using a flow rate of 1 mL/min over 1.1 CV, and 2-mL fractions were collected. Protein purity was checked by SDS-PAGE.
Limited Proteolysis of banNADS with Trypsin and Chymotrypsin—The purified NADS was buffer exchanged into 100 mM NH4HCO3, pH 8.5 and concentrated down to 1 mg/mL; the concentration was calculated by dividing the absorbance of the solution at 280 nm by the protein’s extinc-tion coefficient of ε = 0.728 mL/mg*cm (16) multiplied by 1 cm, according to the Beer-Lambert Law of A = εlc, where A
is the absorbance of the sample, ε is the extinction coefficient of the protein, and l is the pathlength. A 1 mg/mL trypsin stock solution was prepared in 1 mM HCl, and the stock solution was diluted to 0.25 mg/mL in 100 mM NH4HCO3. The proteolysis contained 475 μL of 1 mg/mL NADS, 19 μL trypsin, and 54.5 μL of 100 mM CaCl2, resulting in a solution containing 0.866 mg/mL NADS with the trypsin:NADS w/w ratio 1:100. The mixture was also 10 mM CaCl2, and the final volume was 548.5 μL.
The tryptic proteolysis reaction was run at 25ºC in a shak-ing incubator at 250 rpm. To stop proteolysis, a total of 80 μL of the solution was removed, 30 μL of which were frozen im-mediately at -80ºC, while the remaining 50 μL were boiled in 16.5 μL 4X SDS-PAGE loading buffer (250 mM Tris-HCl, pH 6.8, 6% SDS, 300 mM DTT, 30% glycerol, and 0.02% bromophenol blue) at 100ºC and then stored at -20ºC. This was done at 0, 15, 30, 60, 120, and 180 min after proteolysis was initiated.
A similar procedure was followed for the limited proteoly-sis using chymotrypsin. The banNADS was buffer exchanged into 100 mM Tris-HCl, pH 7.8. The chymotrypsin stock solu-tion consisted of 1 mg/mL chymotrypsin in 1 mM HCl and 2 mM CaCl2. Instead of a w/w ratio of 1:100 (enzyme:protein), a ratio of 1:60 was used, as recommended by Sigma. The chy-motrypsin stock solution was diluted to 0.4 mg/mL, and 19.5 μL was added to 475 μL NADS and 54.5 μL 100 mM CaCl2. The final volume was 549 μL, and the solution was 0.865 mg/mL in NADS, 10 mM CaCl2 and 0.0138 mg/mL in chy-motrypsin. The reaction was run at 37ºC in a shaking incuba-tor at 250 rpm. Proteolysis was halted in the same manner as before. Another chymotryptic proteolysis was conducted with the w/w ratio of 1:25.
Determination of Fragment Molecular Weight—The de-tection of proteolytic fragments was determined qualitatively by SDS-PAGE. The 6 time points taken during each reaction were thawed, and 20 μL of each sample were loaded onto a 4-20% polyacrylamide gel; 10 μL of the protein standard were loaded. The gels were run at 100 V, after which they were stained with Coomassie Blue (30% methanol, 12% acetic acid, 0.1% Commassie Brilliant Blue) for 1 hr on a shaker. The gels were then de-stained (30% methanol, 12% acetic acid) over-night and scanned and edited for contrast improvement using Adobe Photoshop.
Molecular weights from the gel were calculated by deter-mining the rf (retention factor) values by gel digitization using UN-SCAN-IT software. The rf values of the protein standard were plotted against the logMW of the protein standard to yield a linear graph with an equation of the form y = mx + b. The resulting equation was used to calculate the molecular weights of the proteolytic fragments.
After analyzing the SDS-PAGE gels, four samples were selected for analysis by electrospray LC-MS: For the tryp-tic digestion, the t = 60 min and t = 120 min samples were selected, and for both the 1:25 and 1:60 w/w enzyme:protein chymotryptic digestions, the t = 120 min samples were ana-lyzed. The samples were concentrated on a 300 μm i.d. (inner
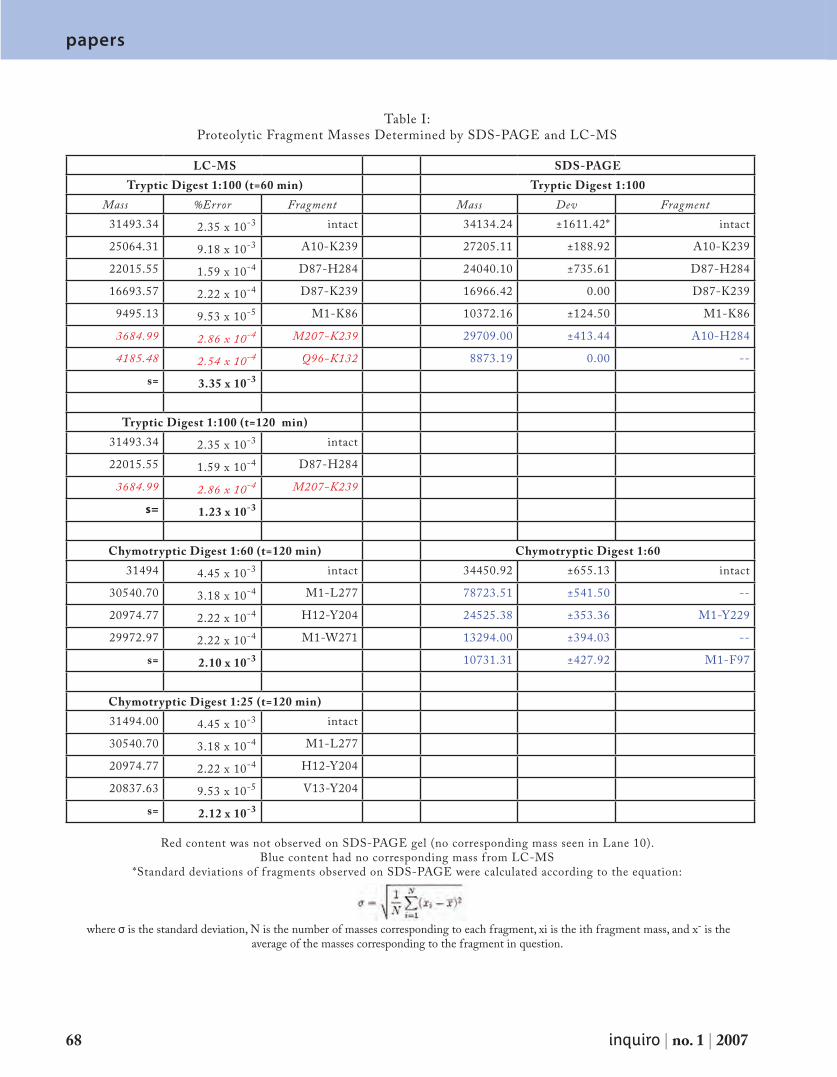
papers
68 inquiro | no. 1 | 2007
papers
LC-MS SDS-PAGETryptic Digest 1:100 (t=60 min) Tryptic Digest 1:100
Mass %Error Fragment Mass Dev Fragment31493.34 2.35 x 10⁻³ intact 34134.24 ±1611.42* intact
25064.31 9.18 x 10⁻³ A10-K239 27205.11 ±188.92 A10-K239
22015.55 1.59 x 10⁻⁴ D87-H284 24040.10 ±735.61 D87-H284
16693.57 2.22 x 10⁻⁴ D87-K239 16966.42 0.00 D87-K239
9495.13 9.53 x 10⁻⁵ M1-K86 10372.16 ±124.50 M1-K86
3684.99 2.86 x 10⁻⁴ M207-K239 29709.00 ±413.44 A10-H284
4185.48 2.54 x 10⁻⁴ Q96-K132 8873.19 0.00 --
s= 3.35 x 10⁻³
Tryptic Digest 1:100 (t=120 min)31493.34 2.35 x 10⁻³ intact
22015.55 1.59 x 10⁻⁴ D87-H284
3684.99 2.86 x 10⁻⁴ M207-K239
s= 1.23 x 10⁻³
Chymotryptic Digest 1:60 (t=120 min) Chymotryptic Digest 1:6031494 4.45 x 10⁻³ intact 34450.92 ±655.13 intact
30540.70 3.18 x 10⁻⁴ M1-L277 78723.51 ±541.50 --
20974.77 2.22 x 10⁻⁴ H12-Y204 24525.38 ±353.36 M1-Y229
29972.97 2.22 x 10⁻⁴ M1-W271 13294.00 ±394.03 --
s= 2.10 x 10⁻³ 10731.31 ±427.92 M1-F97
Chymotryptic Digest 1:25 (t=120 min)31494.00 4.45 x 10⁻³ intact
30540.70 3.18 x 10⁻⁴ M1-L277
20974.77 2.22 x 10⁻⁴ H12-Y204
20837.63 9.53 x 10⁻⁵ V13-Y204
s= 2.12 x 10⁻³
Red content was not observed on SDS-PAGE gel (no corresponding mass seen in Lane 10).Blue content had no corresponding mass f rom LC-MS
*Standard deviations of f ragments observed on SDS-PAGE were calculated according to the equation:
where σ is the standard deviation, N is the number of masses corresponding to each fragment, xi is the ith fragment mass, and x¯ is the average of the masses corresponding to the fragment in question.
Table I:Proteolytic Fragment Masses Determined by SDS-PAGE and LC-MS
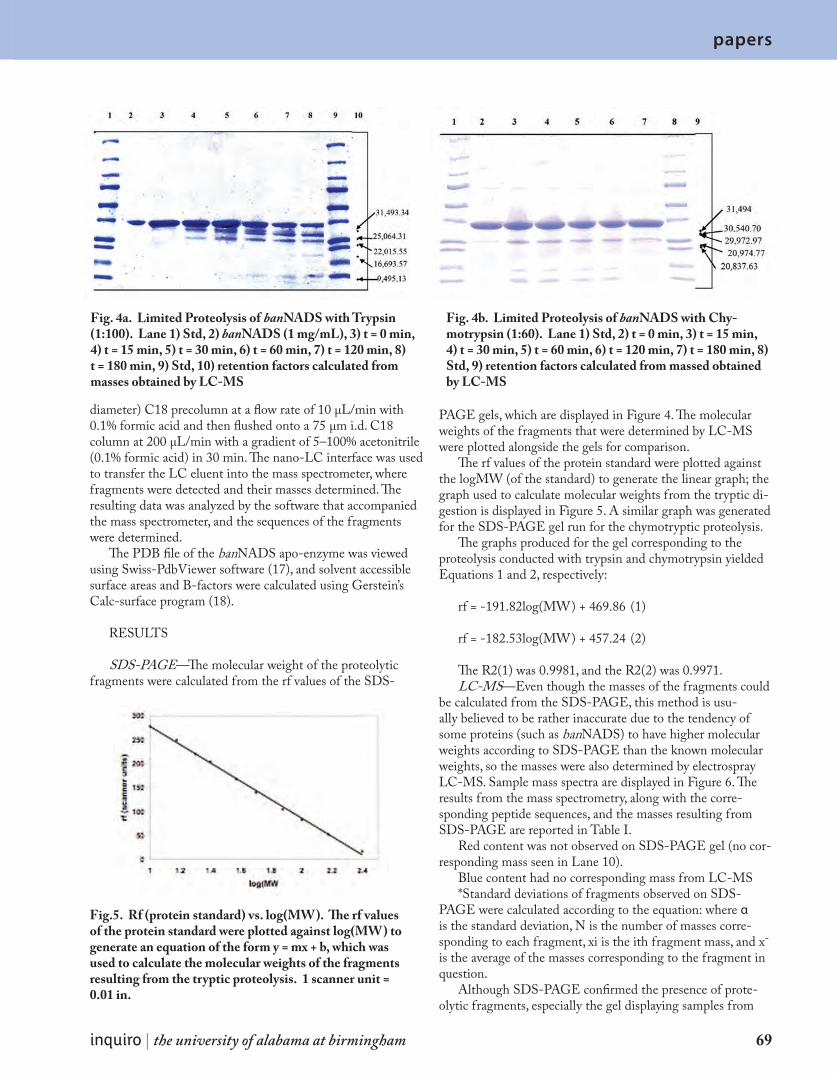
papers papers
inquiro | the university of alabama at birmingham 69
diameter) C18 precolumn at a flow rate of 10 μL/min with 0.1% formic acid and then flushed onto a 75 μm i.d. C18 column at 200 μL/min with a gradient of 5–100% acetonitrile (0.1% formic acid) in 30 min. The nano-LC interface was used to transfer the LC eluent into the mass spectrometer, where fragments were detected and their masses determined. The resulting data was analyzed by the software that accompanied the mass spectrometer, and the sequences of the fragments were determined.
The PDB file of the banNADS apo-enzyme was viewed using Swiss-PdbViewer software (17), and solvent accessible surface areas and B-factors were calculated using Gerstein’s Calc-surface program (18).
RESULTS
SDS-PAGE—The molecular weight of the proteolytic fragments were calculated from the rf values of the SDS-
PAGE gels, which are displayed in Figure 4. The molecular weights of the fragments that were determined by LC-MS were plotted alongside the gels for comparison.
The rf values of the protein standard were plotted against the logMW (of the standard) to generate the linear graph; the graph used to calculate molecular weights from the tryptic di-gestion is displayed in Figure 5. A similar graph was generated for the SDS-PAGE gel run for the chymotryptic proteolysis.
The graphs produced for the gel corresponding to the proteolysis conducted with trypsin and chymotrypsin yielded Equations 1 and 2, respectively:
rf = -191.82log(MW) + 469.86 (1)
rf = -182.53log(MW) + 457.24 (2)
The R2(1) was 0.9981, and the R2(2) was 0.9971.LC-MS—Even though the masses of the fragments could
be calculated from the SDS-PAGE, this method is usu-ally believed to be rather inaccurate due to the tendency of some proteins (such as banNADS) to have higher molecular weights according to SDS-PAGE than the known molecular weights, so the masses were also determined by electrospray LC-MS. Sample mass spectra are displayed in Figure 6. The results from the mass spectrometry, along with the corre-sponding peptide sequences, and the masses resulting from SDS-PAGE are reported in Table I.
Red content was not observed on SDS-PAGE gel (no cor-responding mass seen in Lane 10).
Blue content had no corresponding mass from LC-MS*Standard deviations of fragments observed on SDS-
PAGE were calculated according to the equation: where α is the standard deviation, N is the number of masses corre-sponding to each fragment, xi is the ith fragment mass, and x¯ is the average of the masses corresponding to the fragment in question.
Although SDS-PAGE confirmed the presence of prote-olytic fragments, especially the gel displaying samples from
Fig. 4a. Limited Proteolysis of banNADS with Trypsin (1:100). Lane 1) Std, 2) banNADS (1 mg/mL), 3) t = 0 min, 4) t = 15 min, 5) t = 30 min, 6) t = 60 min, 7) t = 120 min, 8) t = 180 min, 9) Std, 10) retention factors calculated from masses obtained by LC-MS
Fig. 4b. Limited Proteolysis of banNADS with Chy-motrypsin (1:60). Lane 1) Std, 2) t = 0 min, 3) t = 15 min, 4) t = 30 min, 5) t = 60 min, 6) t = 120 min, 7) t = 180 min, 8) Std, 9) retention factors calculated from massed obtained by LC-MS
Fig.5. Rf (protein standard) vs. log(MW). The rf values of the protein standard were plotted against log(MW) to generate an equation of the form y = mx + b, which was used to calculate the molecular weights of the fragments resulting from the tryptic proteolysis. 1 scanner unit = 0.01 in.
papers
70 inquiro | no. 1 | 2007
papers
tryptic proteolysis, LC-MS generated much more accurate and precise mass values than did the SDS-PAGE in terms of actual mass values, with both percent errors and standard deviations of less than 0.1%. Indeed, the gel displayed in Figure 4a accurately depicts the presence of tryptic fragments, but only qualitatively. While the majority of fragment masses resulting from the tryptic digest (as determined by LC-MS) appeared to have corresponding bands on the SDS-PAGE gel, the same could not be assumed for the results of the chymotryptic proteolysis (Fig. 4). In fact, most of the bands seen on the gel run on the chymotrypsin proteolysis samples were not seen in the mass spectra, and no reasonable cleavage sites could be found to correspond to two of the bands seen on the gel. There were also two bands on the gel that was run on the trypsin proteolysis samples that were not seen in the mass spectra, one of which could not be matched with a conclusive cleavage pattern.
The observed cleavage sites are displayed on the primary structure sequence map of banNADS in Figure 7. There were some fragments that were expected to be seen in the mass spectra but were not. These were determined by ob-serving flexible and exposed regions on the crystal structure of banNADS and are displayed on the crystal structure in Figures 8 and 9, respectively.
MTLQEQIMKA10 LHVQPVIDPK20 AEIRKRVD-
FL30 KDYVKKTGAK40
GFVLGISGGQ50 DSTLAGRLAQ60 LAVEE-IRNEG70 GNATFIAVRL80
PYKVQKDEDD90 AQLALQFIQA100 DQSVAF-DIAS110 TVDAFSNQYE120
NLLDESLTDF130 NKGNVKARIR140 MVTQYAIGGQ150 KGLLVIGTDH160
AAEAVTGFFT170 KFGDGGADLL180 PLTGLT-KRQG190
RALLQELGAD200 ERLYLKMPTA210 DLL-DEKPGQA220 DETELGITYD230
QLDDYLEGKT240 VPADVAEKIE250 KRYTVSE-HKR260
QVPASMFDDW270 WKLAAALEHH280 HHHH
Most of the tryptic cleavages occurred on the carboxyl side of lysine; although, there was one anomalous cleavage at Leu-95. The only anomalous chymotryptic cleavage occurred at His-12, but the concentration of this fragment (Val-13–Tyr-204) appeared to be relatively small, according to the inten-sity of the corresponding peak seen in the mass spectra (not shown). One cleavage occurred in the P1 loop (residues 85-87), and two occurred in the P2 loop (206–226). Two cleav-ages (both by chymotrypsin) occurred within the C-terminal α-helix (266–284). There were six cleavages by trypsin and five cleavages by chymotrypsin.
Location of Cleavage Sites—The three-dimensional structure of the banNADS apo-enzyme was viewed using Swiss-PdbViewer, and Figures 8 and 9 were generated. Lys-9 appeared to be located at the end of an α-helix, as did Lys-132. Leu-11 and His-12 were located in the loop connected
Fig. 6. Sample mass spectra resulting from LC-MS. a) Raw data resulting from LC-MS of sample of tryptic proteolysis at t = 60 min; b) Resulting molecular masses after analysis of raw data for the sample used in 6a
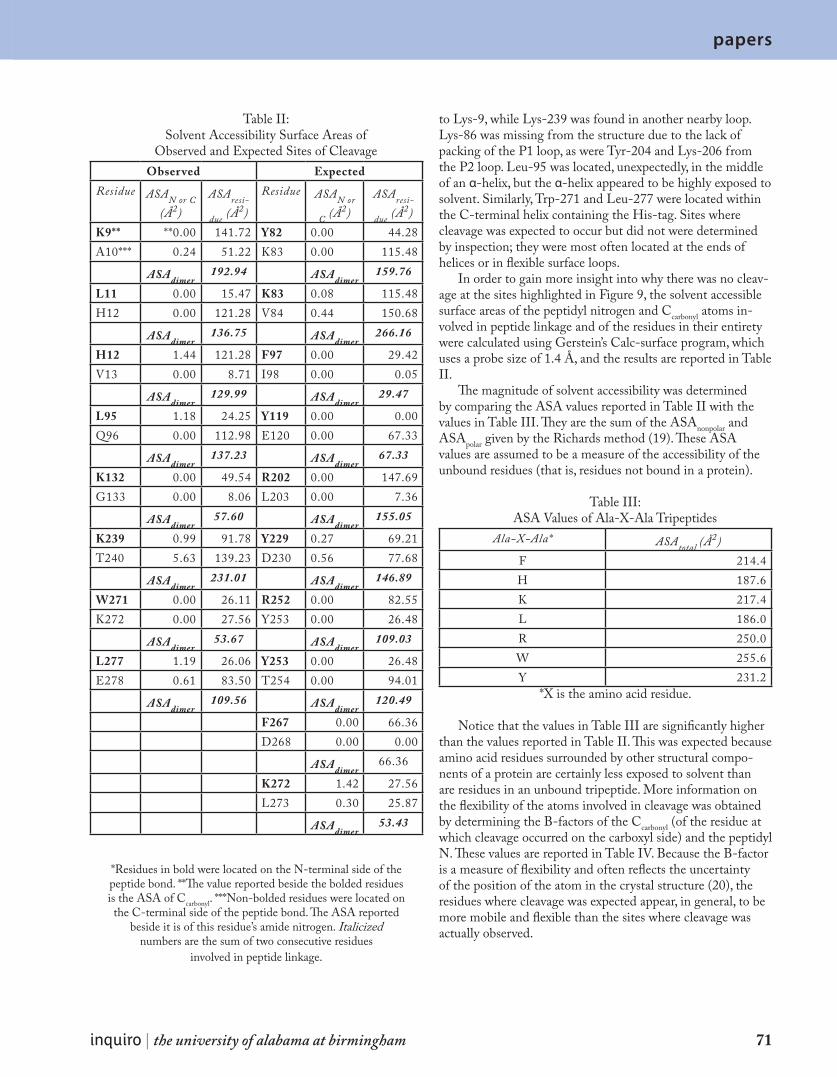
papers papers
inquiro | the university of alabama at birmingham 71
Table II:Solvent Accessibility Surface Areas of
Observed and Expected Sites of CleavageObser ved Expected
Residue ASAN or C
(Å2)ASAresi-
due (Å2)
Residue ASAN or
C (Å2)ASAresi-
due (Å2)K9** **0.00 141.72 Y82 0.00 44.28A10*** 0.24 51.22 K83 0.00 115.48
ASAdimer192.94 ASAdimer
159.76
L11 0.00 15.47 K83 0.08 115.48H12 0.00 121.28 V84 0.44 150.68
ASAdimer136.75 ASAdimer
266.16
H12 1.44 121.28 F97 0.00 29.42V13 0.00 8.71 I98 0.00 0.05
ASAdimer129.99 ASAdimer
29.47
L95 1.18 24.25 Y119 0.00 0.00Q96 0.00 112.98 E120 0.00 67.33
ASAdimer137.23 ASAdimer
67.33
K132 0.00 49.54 R202 0.00 147.69G133 0.00 8.06 L203 0.00 7.36
ASAdimer57.60 ASAdimer
155.05
K239 0.99 91.78 Y229 0.27 69.21T240 5.63 139.23 D230 0.56 77.68
ASAdimer231.01 ASAdimer
146.89
W271 0.00 26.11 R252 0.00 82.55K272 0.00 27.56 Y253 0.00 26.48
ASAdimer53.67 ASAdimer
109.03
L277 1.19 26.06 Y253 0.00 26.48E278 0.61 83.50 T254 0.00 94.01
ASAdimer109.56 ASAdimer
120.49
F267 0.00 66.36D268 0.00 0.00
ASAdimer66.36
K272 1.42 27.56L273 0.30 25.87
ASAdimer53.43
*Residues in bold were located on the N-terminal side of the peptide bond. **The value reported beside the bolded residues is the ASA of Ccarbonyl. ***Non-bolded residues were located on the C-terminal side of the peptide bond. The ASA reported
beside it is of this residue’s amide nitrogen. Italicized numbers are the sum of two consecutive residues
involved in peptide linkage.
to Lys-9, while Lys-239 was found in another nearby loop. Lys-86 was missing from the structure due to the lack of packing of the P1 loop, as were Tyr-204 and Lys-206 from the P2 loop. Leu-95 was located, unexpectedly, in the middle of an α-helix, but the α-helix appeared to be highly exposed to solvent. Similarly, Trp-271 and Leu-277 were located within the C-terminal helix containing the His-tag. Sites where cleavage was expected to occur but did not were determined by inspection; they were most often located at the ends of helices or in flexible surface loops.
In order to gain more insight into why there was no cleav-age at the sites highlighted in Figure 9, the solvent accessible surface areas of the peptidyl nitrogen and Ccarbonyl atoms in-volved in peptide linkage and of the residues in their entirety were calculated using Gerstein’s Calc-surface program, which uses a probe size of 1.4 Å, and the results are reported in Table II.
The magnitude of solvent accessibility was determined by comparing the ASA values reported in Table II with the values in Table III. They are the sum of the ASAnonpolar and ASApolar given by the Richards method (19). These ASA values are assumed to be a measure of the accessibility of the unbound residues (that is, residues not bound in a protein).
Table III:ASA Values of Ala-X-Ala Tripeptides
Ala-X-Ala* ASAtotal (Å2)F 214.4H 187.6K 217.4L 186.0R 250.0W 255.6Y 231.2
*X is the amino acid residue.
Notice that the values in Table III are significantly higher than the values reported in Table II. This was expected because amino acid residues surrounded by other structural compo-nents of a protein are certainly less exposed to solvent than are residues in an unbound tripeptide. More information on the flexibility of the atoms involved in cleavage was obtained by determining the B-factors of the Ccarbonyl (of the residue at which cleavage occurred on the carboxyl side) and the peptidyl N. These values are reported in Table IV. Because the B-factor is a measure of flexibility and often reflects the uncertainty of the position of the atom in the crystal structure (20), the residues where cleavage was expected appear, in general, to be more mobile and flexible than the sites where cleavage was actually observed.
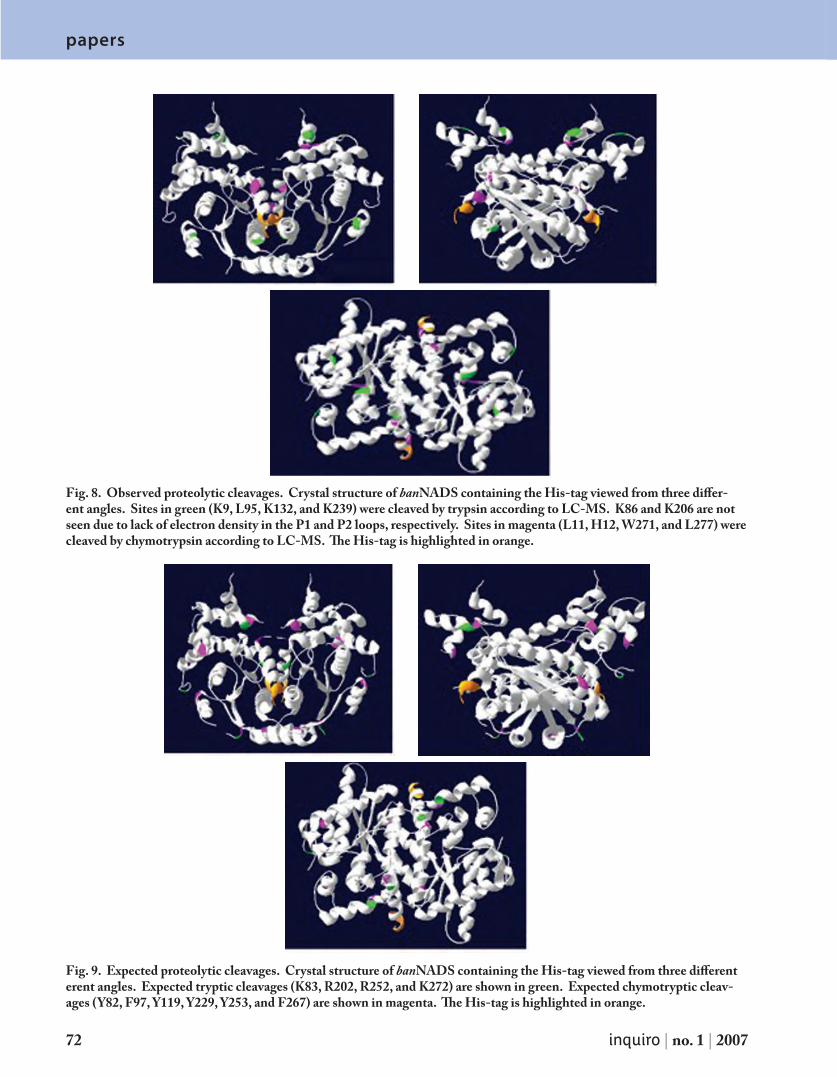
papers
72 inquiro | no. 1 | 2007
papers
Fig. 8. Observed proteolytic cleavages. Crystal structure of banNADS containing the His-tag viewed from three differ-ent angles. Sites in green (K9, L95, K132, and K239) were cleaved by trypsin according to LC-MS. K86 and K206 are not seen due to lack of electron density in the P1 and P2 loops, respectively. Sites in magenta (L11, H12, W271, and L277) were cleaved by chymotrypsin according to LC-MS. The His-tag is highlighted in orange.
Fig. 9. Expected proteolytic cleavages. Crystal structure of banNADS containing the His-tag viewed from three different erent angles. Expected tryptic cleavages (K83, R202, R252, and K272) are shown in green. Expected chymotryptic cleav-ages (Y82, F97, Y119, Y229, Y253, and F267) are shown in magenta. The His-tag is highlighted in orange.
papers papers
inquiro | the university of alabama at birmingham 73
Table IVB-Factors of Observed and Expected Sites of Cleavage
Obser ved ExpectedResidue B-FactorC or N (Å2) Residue B-FactorC or N (Å2)*K9 **38.08 Y82 31.82***A10 37.05 K83 35.21L11 34.43 K83 44.78H12 33.43 V84 48.51H12 32.71 F97 27.74V13 29.56 I98 26.52L95 28.79 Y119 25.43Q96 29.96 E120 24.25K132 23.75 R202 47.97G133 23.84 L203 47.72K239 35.04 Y229 43.94T240 36.00 D230 43.36W271 28.00 R252 59.72K272 27.31 Y253 58.72L277 31.79 Y253 60.17E278 32.11 T254 61.58
F267 48.31D268 44.66K272 25.78L273 26.13
*Residues in bold were located on the N-terminal side of the peptide bond.
**The value reported beside the bolded residues is the B-Factor of Ccarbonyl.
***Non-bolded residues were located on the C-terminal side of the peptide bond. The B-Factor reported beside it is of this residue’s amide nitrogen.
DISCUSSION AND CONCLUSIONS
Even though protein structures solved by x-ray diffraction are generally considered to be similar due to the high percent-age of solvent (i.e., water) present in a crystal of a protein, the technique has its disadvantages. One of the main drawbacks is that, in order to solve any structure using x-ray crystallogra-phy, the molecule(s) being studied must be in the solid state. However, the native state of a protein is dynamic and is found in solution, and it is this form of the protein in which we are interested (11).
Because there was some evidence suggesting that the His-tag on the banNADS apo-enzyme may have affected the protein’s crystal structure, limited proteolysis of the protein seemed appropriate in order to gain more information on the native protein (that is, the protein found in solution). The NADS was subjected to proteolysis by trypsin and chy-motrypsin, and the progression of the proteolysis was observed by SDS-PAGE. The tryptic proteolysis samples were run on
the gel displayed in Figure 4a. The gel shows quite nicely how the concentration of banNADS decreased over time, while the amount of proteolytic fragments increased. The frag-ment masses determined by LC-MS appeared to correspond well to several of the fragments seen on the gel. In contrast, in Figure 4b, the concentration of NADS does not appear to decrease over time, and the fragment masses determined by mass spectrometry do not appear to correlate well with the bands seen on the gel. Because this was not the case with the gel displaying the results of the proteolysis with trypsin, it can be assumed that there was a problem with the samples run on the gel displayed in Figure 4b, and/or there were experimental complications concerning the way in which the gel was run.
SDS-PAGE Provides Information on the Cleavage Process—Interestingly, a fragment seen in Figure 4a, which has a calculated molecular weight of approximately 30 kDa, seems to indicate a possible single cleavage at Lys-9, resulting in a fragment containing residues 10–284 (and another con-taining residues 1–9). The size of this band appears to decrease between 15 and 180 min into the reaction, but the band cor-responding to the fragment containing residues 10–239 (~25 kDa) (Table I) seems to increase in size. This information is consistent with the idea that the fragment containing residues 10–239 resulted from two consecutive cleavages: 1) The pro-tein was first cleaved at Lys-9, resulting in the large fragment (10–284), and 2) this large fragment was cleaved again at Lys-239. Similarly, LC-MS detected fragments corresponding to residues 1–86 (~9.5 kDa), 87–284 (~22 kDa), and 87–239 (~16.7 kDa) (Table I). All three of these fragments also appear on the gel (Fig. 4a), with the concentrations of frag-ment 1–86 and fragment 87–239 increasing over time while the concentration of fragment 87–284 appeared to remain relatively constant. Because fragment 87–239 did not appear until 120 min, and fragment 87–284 first appeared after only 15 min, one is led to assume that there was first a cleavage at Lys-86 and then another at Lys-239, resulting in the frag-ment containing residues 87–239. The reason for this sequence of cleavages is unclear; perhaps it is a result of the short length of the loop containing Lys-239, which extends only from residues 237–242, and its location between α-helices 11 and 12 (4). Another fragment (not seen on the SDS-PAGE gel) corresponds to residues 207–239; the results, however, give no definite explanation for how this fragment was produced, but this fragment does further suggest that Lys-239 is readily cleaved by trypsin. One possible explanation for this cleav-age pattern could be that, when cleavages that disrupt the homodimer occur, the protein unfolds, allowing for more secondary cleavages.
SDS-PAGE of Chymotryptic Proteolysis Samples—Because the gel displayed in Figure 4b is probably not a good representation of the proteolytic reactions that occurred dur-ing the experiment, it is difficult to determine the means by which fragment 12–204 and fragment 13–204 were generated. There are also no data from mass spectrometry supporting the assumption of sequential cleavage to produce these fragments. Fortunately, there were a couple fragments resulting from
papers
74 inquiro | no. 1 | 2007
papers
single cleavages detected by mass spectrometry, including those containing amino acids 1–271 and 1–277. The bands seen on the gel, not including the one corresponding to ban-NADS, may be impurities in the sample, but it seems unlikely that they are resultant of proteolysis with chymotrypsin.
Observed vs. Expected Sites of Cleavage—Several of the cleavage sites discussed above (Lys-9, Lys-86, Lys-206, and Lys-239) coincided well with the crystal structure of banNADS; that is, these sites appeared to be located in or contiguous with seemingly flexible regions, such as loops found on the surface of the protein. However, there was definitely one cleavage that was not expected: Leu-95. Not only does trypsin cleave almost always on the carboxyl side of lysine and arginine, but this residue appeared to be located in the middle of helix α4 (4), even though this helix appears to be very solvent-exposed. Fragment 96–132 is included in the results, though, because of the relatively large intensity of the mass spectral peak (not shown). Despite the significance of this anomalous result, an explanation of why tryptic proteoly-sis occurred at Leu-95 is lacking. Perhaps the relatively large accessible surface area (ASA) of 137.23 Å2 (Table II) contrib-utes to promotion of cleavage at this site.
The ASA of both observed sites of cleavages and expected sites of cleavage were calculated, and from the data reported in Table II, it seems that, in general, the observed cleavages occurred in areas having higher ASA values. Because the PDB file of banNADS lacked residues 85–87 (P1 loop), 206–226 (P2 loop), and 257–265 and because sites of expected cleav-age were determined only by inspection, there are some data “missing.” That is, several of the latter sites listed, such as residues 82, 83, 202, 229, 252, etc., cannot really be compared to actual similar sites where cleavage was observed in terms of ASA because ASA values of sites of observed cleavages could not be determined. It is quite possible, then, that these observed cleavage sites had even higher ASA values than the ones listed in Table II.
The chymotryptic cleavages at 271 and 277 also occurred within an α-helix, but cleavage of peptide bonds in highly-ordered, rigid secondary structures is thermodynamically unfavored. This is because, in order for cleavage to occur in a helix, stabilizing interactions, such as hydrogen bonds, would have to be broken. Therefore, if these residues were located in α-helices 100% of the time that the protein was in solu-tion, then cleavage by limited proteolysis would not occur. The results, then, suggest that these regions of secondary structure are not always locked into rigid helices, but rather, they are dy-namic and flexible, at least sometimes. Indeed, McDonald et al determined that residues 266–284 were found in the form of a helix in the apo-enzyme. When ligand was bound to the crystallized protein, the C-terminal helix became a more flex-ible random coil (4).
The results of the limited proteolysis then support the hypothesis that the structure of banNADS in solution differs from that of the crystallized form. Perhaps this is a direct result of the presence of the His-tag, which may, through its interaction with other components of the protein, such as
its contacts with α12, α6, and α7 (4), have caused structural changes resultant of the destabilization of some areas of the protein (and stabilization of other areas) and/or abnormal interactions among the amino acid residues.
Future Experiments—Even though much information was obtained from this experiment, some of the results are inconclusive, and more experiments need to be performed in order to make more concrete conclusions. Suggested experi-ments to perform in addition to the one discussed in this paper included running the proteolysis using another protease such as elastase or V8 protease. Limited proteolysis with chymotrypsin should probably be repeated to obtain a gel that more accurately displays the results of chymotryptic cleavage. Other techniques, such as CD-spectroscopy, can also be used to complement the experimental results from limited prote-olysis.
ACKNOWLEDGMENTS
This experiment was funded by a grant from the NIH and would not have been possible without the invaluable assistance and advice of my Honors Committee: Drs. Christie Brouil-lette, David Graves, and Aaron Lucius (and Dr. Gary Gray, Honors adviser). Special thanks also to Marion Kirk (UAB Comprehensive Cancer Center), who conducted the LC-MS, and to Dr. Pamela Pruett, Dr. Irina Protassevitch, Dr. Heather McDonald, Tasha Kane, and Wendy Yang for helping me dur-ing my time spent at UAB CBSE.
REFERENCES
Rizzi, M., Nessi, C., Mattevi, A., Coda, A., Bolognesi, M., and 1. Galizzi, A. (1996) EMBO.15, 5125-5134Rizzi, M. and Schindelin, H. (2002) Curr. Opin. Struct. Biol. 2. 12, 709-720Deredjiev, Y., Symersky, J., Singh, R., Jedrzejas, M., Brouil-3. lette, C., Brouillette, W., Muccio, D., Chattopadbyay, D., and DeLucas, L. (2001) Acta Cryst. D57, 806-812McDonald, H. M., Pruett, P., Deivanayagam, C., Protassev-4. itch, I., Carson, S. M., DeLucas, L. J., Brouillette, W. J., and Brouillette, C. G. (2007) SubmittedRizzi, M., Bolognesi, M., and Coda, A. (1998) Structure 6, 5. 1129-1140McDevitt, D., Payne, D., Holmes, D., and Rosenberg, M. 6. (2002) J. Appl. Microbiol. 92, 28S-34SCenter for Disease Control and Prevention. Department of 7. Health and Human Services. Center for Infectious Dis-eases / Division of Bacterial and Mycotic Diseases (2005) [Online]. Available from http://www.bt.cdc.gov/ Accessed 2006 July 10Jedrzejas, M. J. (2002) Crit. Rev. Biochem. Mol. Biol. 37, 339-8. 373Carson, M., Johnson, D., McDonald, H., Brouillette, C., and 9. DeLucas, L. (2007) Acta Cryst. D63, 295-301Fontana, A., Polverino de Laureto, P., Spolaore, B., Frare, 10.

papers papers
inquiro | the university of alabama at birmingham 75
E., Picotti, P., and Zambonin, M. (2004) Acta Biochem. Polonica 51, 299-321Carlson, G. (ed.) (2006) Principles of Biochemistry. (4th Ed.) 11. New Jersey: Prentice Hall[Online]. Available from http://molpharm.aspetjounrals.12. org/ Accessed 2007 April 12 Sigma-Aldrich, Inc. Proteomics Guide: Trypsin 13. Sigma-Aldrich, Inc. Enzyme Explorer: Chymotrypsin14. Ashcroft, A. E. An Introduction to Mass Spectrometry. 15. (2007) [Online]. Available from http://www.astbury.leeds.ac.uk/facil/MStut/mstutorial.htm Accessed 2007 February 1Gasteiger, E., Hoogland, C., Gattiker, A., Duvaud, S., Wilkins, 16. M. R., Appel, R. D., and Bairoch, A. Protein Identification and
Analysis Tools on the ExPASy Server: (in) John M. Walker (ed.): The Proteomics Protocols Handbook, Humana Press (2005) pp. 571-607. [Online]. Available from http://www.expasy.ch/tools/protparam.html Accessed 2006 June 14Gues, N. and Peitsch, M. C. (1997) Electrophoresis 18, 2714-17. 2723Gerstein, M. (1992) Acta Cryst. A48, 271-276. [Online]. 18. Available from http://molbio.info.nih.gov/structbio/basic.html Accessed 2007 April 12Baker, B. and Murphy, M. (1998) Methods in Enzymology 19. 295, 294-315Radivoiac, P., Obradovic, Z., Smith, D. K., Zhu, G., Vucetic, 20. S., Brown, C. J., Lawson, J. D., Dunker, A. K. (2004) Protein Science 13, 71-80
76 inquiro | no. 1 | 2007
CHEMISTRY
Sonja Brooks: Goldwater Scholar
Kelci Burckhardt
The School of Natural Sciences and Mathematics at UAB includes the departments of biology, chemis-try, computer and information sciences, mathematics, and physics. Each department offers outstanding opportunities for undergraduates to explore and perform research. One student who has been involved in these research opportunities is UAB junior Sonja Brooks.
Sonja’s path towards chemistry was established before she arrived. She was nominated during her senior year in high school to apply for the Chemistry Scholars’ Program. This program offers top incoming students the opportunity to be teaching assistants in undergraduate chemistry courses and complete un-dergraduate research alongside faculty mentors. Sonja has been a chemistry teaching assistant since the beginning of her freshman year and continues these duties teaching students in the organic lab.
During the summer after her freshman year, Sonja began her research experiences in the lab of David Graves, Ph.D., a biophysical chemist and the chemistry department chair. In Dr. Graves’s lab, she worked on a project studying the binding of the dye ethidium bro-mide to G-quadruplex DNA. This complex has an in-tramolecular structure that has been shown to inhibit telomerase activity, which has become an interesting drug target in the field of oncology.
Continuing her research in Dr. Graves’s lab through-out her sophomore year, Sonja was one of 317 stu-dents nationally to be selected as a Barry M. Goldwater scholar. She is the fifth UAB student to have received this honor, which is awarded to students who have conducted extensive research and intend to pursue a career in mathematics or the sciences.
After spending Christmas break in Germany with
extended family, Sonja decided she wanted to return over the summer, but also wanted to continue to gain research experience. Remarkably, her research advisor received a letter from the American Chemical Society about the Deutscher Akademischer Austausch Dienst (DAAD) summer internship program. She applied to three research projects that had been proposed by graduate students in Germany and was matched with her top choice—a three-month internship at the Max Planck Institute for Medical Research in Heidelberg, Germany. While there, she worked on characterization studies of the proteins involved in endocytosis, she used site-directed mutagenesis to change the proteins and then studied their interactions using isothermal titration calorimetry. While working on this project extensively during the week, she was able to travel throughout Europe on the weekends.
Along with her extensive research experience, Sonja is the president of the Student Affiliates of the American Chemical Society (SAACS), co-chair of the University Honors Program Activities Committee, and plays intramural soccer.
Sonja plans to continue her research next year as she works to graduate with honors in chemistry. Her plans are to attend graduate school for biochemistry and then to work at a leading research institution or university. Her experiences in undergraduate research have helped her to narrow down which field she wants to enter and have allowed her to learn lab techniques that will help her throughout her career.
Anyone interested in applying for the Goldwater Scholarship should visit the UAB Web site of the fel-lowships and scholarships office. Students interested in the DAAD-RISE program should visit http://www.daad.de/rise.
student feature papers
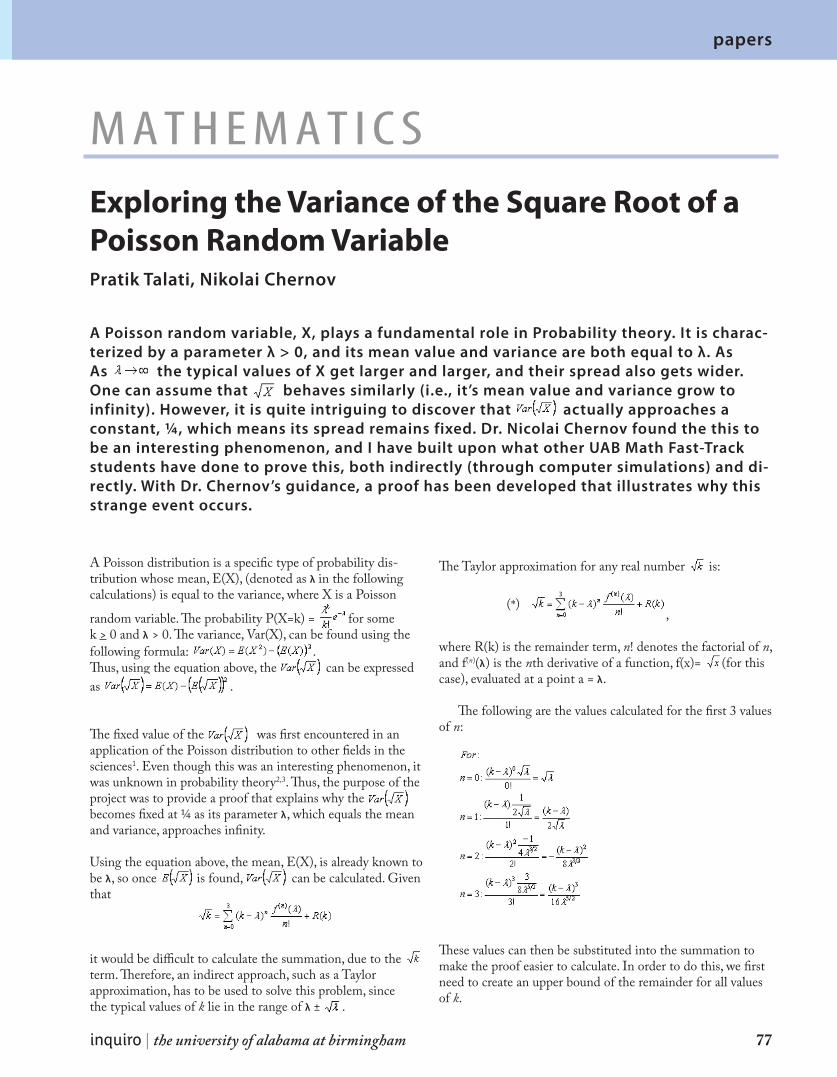
inquiro | the university of alabama at birmingham 77
A Poisson random variable, X, plays a fundamental role in Probability theory. It is charac-terized by a parameter λ > 0, and its mean value and variance are both equal to λ. As As the typical values of X get larger and larger, and their spread also gets wider. One can assume that behaves similarly (i.e., it’s mean value and variance grow to infinity). However, it is quite intriguing to discover that actually approaches a constant, ¼, which means its spread remains fixed. Dr. Nicolai Chernov found the this to be an interesting phenomenon, and I have built upon what other UAB Math Fast-Track students have done to prove this, both indirectly (through computer simulations) and di-rectly. With Dr. Chernov’s guidance, a proof has been developed that illustrates why this strange event occurs.
A Poisson distribution is a specific type of probability dis-tribution whose mean, E(X), (denoted as λ in the following calculations) is equal to the variance, where X is a Poisson
random variable. The probability P(X=k) = for some k > 0 and λ > 0. The variance, Var(X), can be found using the following formula: .Thus, using the equation above, the can be expressed as .
The fixed value of the was first encountered in an application of the Poisson distribution to other fields in the sciences1. Even though this was an interesting phenomenon, it was unknown in probability theory2,3. Thus, the purpose of the project was to provide a proof that explains why the becomes fixed at ¼ as its parameter λ, which equals the mean and variance, approaches infinity.
Using the equation above, the mean, E(X), is already known to be λ, so once is found, can be calculated. Given that
it would be difficult to calculate the summation, due to the term. Therefore, an indirect approach, such as a Taylor approximation, has to be used to solve this problem, since the typical values of k lie in the range of λ ± .
The Taylor approximation for any real number is:
(*) ,
where R(k) is the remainder term, n! denotes the factorial of n, and f(n)(λ) is the nth derivative of a function, f(x)= (for this case), evaluated at a point a = λ.
The following are the values calculated for the first 3 values of n:
These values can then be substituted into the summation to make the proof easier to calculate. In order to do this, we first need to create an upper bound of the remainder for all values of k.
Exploring the Variance of the Square Root of a Poisson Random Variable
mathemat ics
Pratik Talati, Nikolai Chernov
papers

papers
78 inquiro | no. 1 | 2007
For small values of k, the remainder can be calculated using the Lagrange form:
R(k) =
where λ < <k
Since this remainder is evaluated at some unknown point , we can create an upper bound on R(k) for small values (and eventually for all values) of k.
In this case, for R(k), the bound can be for
some constant C > .
The remainder of large values of k can be calculated by the following:
Given that ,
In this term, the k3 term is dominant, so the equation of R(k) will act like a cubic for large values of k. In order to create an upper bound for this function, we will need to choose a quartic equation because it grows faster than a cubic function for large values of k. Therefore, we can select a large constant, C2, for the quartic function such that it grows faster than the cubic function at a point we desire. In this situation, since we already have an upper bound for small values of k, if we choose C2 such that for all values of k excluding the small values of k, the quartic function grows faster than the cubic function, then we can establish an upper bound for the remainder term that can be used to evaluate the error term for the Taylor polyno-mial.
Therefore, it can be stated that a bound for R(k) exists such that |R(k)| <
for a large value of C2 that satisfies
the above condition. Thus, substituting the value of the Taylor
approximation of into , we have
where |R(k)| <
for some C3 larger than C and C2.
Multiplying and separating out the terms, we have the follow-ing:
(**)
Many of these summations are very difficult to solve. With the help of Moment Generating Functions, however, the complex summations can be evaluated.
A Moment Generating Function, in probability, generates the moments of a probability distribution. The moments can be generated using M(t) = E(eXt), the expectation value of eXt.
Thus, using M(t) = , the different moments can be calculated by taking derivatives of the function. This function can be evaluated at time t = 0 to generate the following values:
Similarly, if further derivatives are taken, the following mo-ments are generated:
M(4)(0) = λ4 + 6λ3 + 7λ2 + λ (Figure 1)
Figure 1.
papers

papers
inquiro | the university of alabama at birmingham 79
Thus, with substitution into (**), the following is obtained:
for some C4 larger than C3
Thus,
Finally, because as
Remark: By using more terms in the Taylor expression (*), we can obtain more accurate asymptotical formulas for . In particular, we can show that K and compute the values of b1, b2, etc.
papers
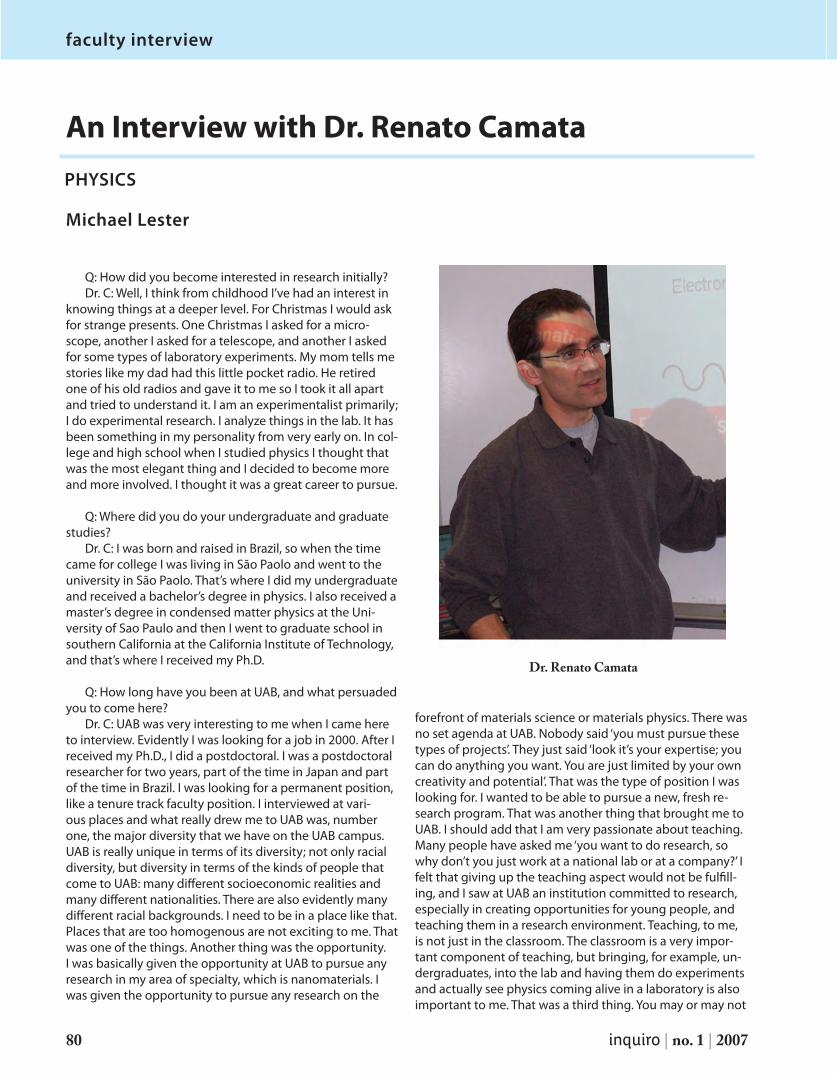
80 inquiro | no. 1 | 2007
faculty interview
PHYSICS
An Interview with Dr. Renato Camata
Michael Lester
Q: How did you become interested in research initially?Dr. C: Well, I think from childhood I’ve had an interest in
knowing things at a deeper level. For Christmas I would ask for strange presents. One Christmas I asked for a micro-scope, another I asked for a telescope, and another I asked for some types of laboratory experiments. My mom tells me stories like my dad had this little pocket radio. He retired one of his old radios and gave it to me so I took it all apart and tried to understand it. I am an experimentalist primarily; I do experimental research. I analyze things in the lab. It has been something in my personality from very early on. In col-lege and high school when I studied physics I thought that was the most elegant thing and I decided to become more and more involved. I thought it was a great career to pursue.
Q: Where did you do your undergraduate and graduate studies?
Dr. C: I was born and raised in Brazil, so when the time came for college I was living in São Paolo and went to the university in São Paolo. That’s where I did my undergraduate and received a bachelor’s degree in physics. I also received a master’s degree in condensed matter physics at the Uni-versity of Sao Paulo and then I went to graduate school in southern California at the California Institute of Technology, and that’s where I received my Ph.D.
Q: How long have you been at UAB, and what persuaded you to come here?
Dr. C: UAB was very interesting to me when I came here to interview. Evidently I was looking for a job in 2000. After I received my Ph.D., I did a postdoctoral. I was a postdoctoral researcher for two years, part of the time in Japan and part of the time in Brazil. I was looking for a permanent position, like a tenure track faculty position. I interviewed at vari-ous places and what really drew me to UAB was, number one, the major diversity that we have on the UAB campus. UAB is really unique in terms of its diversity; not only racial diversity, but diversity in terms of the kinds of people that come to UAB: many different socioeconomic realities and many different nationalities. There are also evidently many different racial backgrounds. I need to be in a place like that. Places that are too homogenous are not exciting to me. That was one of the things. Another thing was the opportunity. I was basically given the opportunity at UAB to pursue any research in my area of specialty, which is nanomaterials. I was given the opportunity to pursue any research on the
forefront of materials science or materials physics. There was no set agenda at UAB. Nobody said ‘you must pursue these types of projects’. They just said ‘look it’s your expertise; you can do anything you want. You are just limited by your own creativity and potential’. That was the type of position I was looking for. I wanted to be able to pursue a new, fresh re-search program. That was another thing that brought me to UAB. I should add that I am very passionate about teaching. Many people have asked me ‘you want to do research, so why don’t you just work at a national lab or at a company?’ I felt that giving up the teaching aspect would not be fulfill-ing, and I saw at UAB an institution committed to research, especially in creating opportunities for young people, and teaching them in a research environment. Teaching, to me, is not just in the classroom. The classroom is a very impor-tant component of teaching, but bringing, for example, un-dergraduates, into the lab and having them do experiments and actually see physics coming alive in a laboratory is also important to me. That was a third thing. You may or may not
Dr. Renato Camata
inquiro | the university of alabama at birmingham 81
faculty interview
know that in the physics department we have a program called research experience for undergraduates (REU).
Q: Speaking of REUs, you are involved in the summer REU here at UAB, correct?
Dr. C: I am involved. For several years I was a co-principal investigator on the actual grant with the national science foundation. The principal investigator is Dr. Vora. Dr. Har-rison was also with us. For several years I was officially involved at that highest level. Since last year, due to other commitments and other research directions, I am no longer a co-principle investigator in that grant. I am still involved in the program as a mentor. I mentor undergraduate students who come to the program. Every summer we have 15-plus undergraduates who start doing research, so no single fac-ulty member can mentor all these graduate students; there’s a very major commitment. Many faculty from UAB come and give their presentations to UAB students, and then there is a matching of interest. Students choose a project and thereby a research mentor to work with during the summer. So every summer I typically have one or two undergraduates who work with me in my laboratory here pursuing there research, so I continue to be very involved with that.
Q: How would a student get involved with an REU?Dr. C: Our program typically starts in May, but we re-
ceived applications very early in the year: January, February. The sooner someone sends in an application, the greater the chances of the student receiving an offer to come to UAB, though they can be UAB students as well. UAB stu-dents compete with students from across the country to get into this program. Applications can be found on the web site (http://www.phy.uab.edu/research/reu.htm)
Q: Could you give a basic description of your current research projects?
Dr. C: Yes. We have three major areas of research right now. One of them is in the area of biomaterials. We’re very interested in materials composed of calcium phosphate. These materials are bioactive and important in cellular, living processes. Tissues, living cells, living organs, they interact with calcium phosphate on very fundamental levels. For example, calcium phosphate is the basis for the rigidity of our bones and structural, skeletal framework. The inorganic materials that cells use to build our framework are partially calcium phosphates. Of course, bone has more than calcium phosphates. It has polymers like collagen which behave more like plastic. Bone is a mixture of these calcium phosphates, which act more like ceramics, and collagen fibers. It is what we call a composite material. We are very interested in studying calcium phosphates and the atomic structure of calcium phosphates. X-ray diffrac-tion techniques help us understand the atomic structure of calcium phosphate and how that can be manipulated. That’s one area. It has applications in dentistry and produc-tion of new bone tissues. We have another set of projects
in semiconductor materials. One of them that we’re very interested in is a material called zinc-selenide. These materi-als allow for the generation of very efficient laser light in the mid-infrared. It’s not a wavelength we can see, but there are many technological applications that require very compact, very small laser sources that will emit light in the mid-infrared. There is also a great need for sensor, detectors of light in the mid-infrared. These materials, the zinc-selenide semiconductor, when we engineer them properly by adding certain impurities, particularly chromium impurities, emit light in the mid-infrared. Through some careful engineering design, we get them to emit laser light that can be used for very compact sources, for examples, to detect dangerous substances. This has applications in detection of chemicals in laboratory settings, in medical diagnostics, or in home-land security. In the third area, I am very involved in the fabrication of nanoparticles. One material that we make is zinc-oxide nanoparticles. We’re very interested in how these materials can be produced and how they interact in the gas phase. These are produced by vaporizing solid materials and getting them to condense as extremely small droplets that are on the nanoscale. Each droplet will have between a hundred and ten thousand atoms. We study how these droplets aggregate, how they collide in the gas phase, and how we can use them to make devices that detect light and emit light for use in sensors.
Q: What are some possible future applications of these projects?
Dr. C: With the biomaterials, a classical example would be orthopedic implants. It is not uncommon for people who have accidents to have a big trauma, such as a frac-ture, that cannot be repaired, unless you put in a metallic implant. This is true particularly for the elderly. People who are more advanced in years, for example, tend to suffer falls and fracture their hips. It is very difficult to repair them. The only way to repair them is to insert a titanium implant to actually replace the hip. This is what people call a total hip replacement. Sometimes it doesn’t have to be a trauma injury; sometimes people have degeneration of the articula-tions, which become extremely painful. These implants are typically made of a strong metal, like titanium for example, which is at the same time strong and light. You want to be able to put these implants in there and have perfect integra-tion between the implant and the bone. These things are a little bit different though. Our bones are not made of metal. So one application of this is taking a metal implant and ap-plying a coat of these biomaterials, which are more similar to bone than the metal itself, and that kind of cloaks the implant in this bone-like material, which tends to improve integration of the material with the bone tissue. One prob-lem of the implants is that they typically don’t last forever. So if a person, especially an older person, has a hip replace-ment, you wouldn’t want to have to replace it ten years later. You would like it to last for the lifetime of the person. So one thing that we’re working on is improving the lifetime of the
82 inquiro | no. 1 | 2007
faculty interview
device. Usually they last 10 to 15 years, but we could get them to last like 30 years. That’s one thing. We’re also very interested in developing bone tissue. It would be ideal, in-stead of having to put a piece of steel or titanium to repair a bone, if you could repair it with the bone itself. The problem is that it’s very hard to do that. We can’t grow bone yet, but we are working on projects, we have a project now, col-laborating with biomedical engineering. I produce calcium phosphate nanoparticles and he produces organic fibers that when combined, create something that is a mimic for bones. So in the laboratory we’re trying to grow these
bones, or at least the organic and inorganic framework where we can then put the cells on and have them do the remaining job of growing the bone.
Q: How many scientists work in this laboratory?Dr. C: The way academic research is organized, each
faculty involved in research has a research group. I have my own group including myself, graduate students, and undergraduate students. On any given moment, we tend to have between 5 and 7 people involved in our group. There are larger groups that include postdoctoral researchers as well. In this building there are four groups working. Right now on this floor we have probably 15 people working. Not everybody’s here all the time.
Q: What advice would you give to undergraduates who are considering research as a career?
Dr. C: Get your feet wet early, because there are lots of things to learn in research. I think a research summer experi-ence would be an outstanding way to get started. An REU program during the summer is well structured and well pro-grammed so you have a very productive experience. Second to that is involvement during the academic year. I would tell students to come to the school of natural science and mathematics. We in the physics department are very inter-ested in students who want to do research. We also have the department of chemistry and the department of biology, computer science, mathematics, etc. Knock on doors. Touch base with faculty. Ask their instructors who they can do re-search with and what are the interesting projects that they have for research. I would say also start simple, with not
tremendous ambitions in the beginning, but get your feet wet. The transition between the classroom to real research is, of course, a big one, so the sooner a person gets involved with the excitement of research, the better.
Q: A lot of natural science and mathematics majors tend to be pre-medical students. Would you still suggest research for undergraduates who are maybe looking toward a clinical career as a physician or a dentist, or would you think of it as less important for them but more important for people who plan to pursue a Ph.D.?
Dr. C: I would say almost on the contrary. People who are going to pursue, say a Ph.D. in physics, they will do research no matter what. For them, even if they delay they will get into re-search. Now a person going into a medical career may not have that opportunity, so now is the time for that person to learn a little about research because that will have tremendous benefits for their medical career. Let me give you an example. One day someone will be an orthopedic
surgeon. Wouldn’t it be beneficial for that person to have actually learned about the materials? That could actually make him or her a better surgeon, a better physician. You know, when you get to medical school, you have a lot of things to learn, and they have to stay in the mind. You know, it’s a lot of learning about facts. I think it is very beneficial to have had an opportunity to actually learn about the world of research, where it’s not so much about learning the facts that you’re going to need, but also thinking in a structured way, where there is no pathway. You have to come up with your own questions and your own answers. Of course on the undergraduate level, mentors will guide you through that process.
There is another added benefit here. Many of the tools that physicians will use in diagnostics, in surgery, in treat-ments, are based on physics, chemistry, and biology tech-niques that when you are in medical school you don’t have a chance to learn. Now is the time to learn about something like X-ray diffraction, which will teach you about the struc-ture of nature, which may actually give you great insights in the future when you have to use similar techniques. In the area of nanoscience and nanotechnology, there will be many treatments in the future that will be based on nanoparticles. This is the time for an undergraduate to learn about what a nanoparticle is. How are they produced? Why are their properties so different? Why are they used? All of these things are basic research questions that an under-graduate student involved in research will learn. If he or she goes later into a medical career, this is all strong background that they will carry through their lives.
G e t y o u r f e e t w e t e a r l y , b e c a u s e t h e r e a r e l o t s o f t h i n g s t o l e a r n i n r e s e a r c h . I t h i n k a r e s e a r c h s u m m e r e x p e r i e n c e w o u l d b e a n o u t s t a n d i n g w a y t o g e t s t a r t e d .
Suzanne is a senior majoring in Biology. She works as a research assistant in the Department of Developmental and Clinical Im-munology with Dr. Max Cooper, and has previously done re-search at the Jackson Laboratory in Bar Harbor, Maine as part of a Research Experience for Undergraduates. Suzanne is a mem-ber of EMSAP, the University Honors Program, Alpha Lambda Delta, and Phi Kappa Phi, and she also serves as a teaching assistant for General Chemistry classes. After studying abroad in South America, she plans to begin medical school in 2008.
S u z a n n e M c C l u s k e y
F o u n d i n g E d i t o r
Alex Vaughn is a senior majoring in Chemistry. He is treasurer of SAACS treasurer and is a Chemistry Fel-low. Alex has also been participating in Dr. Hamilton’s research group for three years, in addition to partici-pating in two Research Experience for Undergraduates programs. Outside of school, he enjoys reading books on a variety of subjects and going to the Campus House.
A l e x Va u g h n
S t a f f W r i t e r
Jaymee Smith is a senior Biology major at UAB, planning on beginning medical school in 2008. Currently she works as a pharmacy technician, a supplemental instructor, and a respiratory fit tester for the department of public health and safety. She also worked under the direction of Dr. Menjor Unlap for her honors biology research. Jaymee is a member of Alpha Lambda Delta and EMSAP.
J a y m e e S m i t h
L a y o u t / D e s i g n E d i t o r
about the staff
Taylor Nelson graduated from UAB in May 2007 with a BS in Biology. He hopes to enter dental school in 2008. As an undergraduate, he was an active mem-ber of Delta Sigma Phi and various honor societies such as Alpha Lambda Delta and Phi Kappa Phi. He also worked as a chemistry teaching assistant and with Dr. Thane Wibbles on his biology honors project. His interests include SCUBA diving, sports, and music.
Ta y l o r N e l s o n
L a y o u t / D e s i g n E d i t o r
F e l i x K i s h i n e v s k y
S t a f f W r i t e r
C h r i s t i n a H o
S t a f f W r i t e r
Christina Ho is a junior majoring in Biology. She is cur-rently working on her honors biology research project with Dr. James McClintock and has previously performed research with Dr. David Crawford through the Cancer Re-search Experiences for Students Program. She is a member of EMSAP and the University Honors Program and is in-volved with International Mentors, Alpha Lambda Delta, Golden Key, and the UHP Recycling Volunteer Program. Upon graduation, she plans to attend medical school.
Felix is a junior Psychology major. He is a member of the University Honors Program, Phi Kappa Phi, and the Psy-chology Honors Program. He is currently working on his psychology honors thesis with Dr. Rosalyn Weller. He pre-viously worked as a lab assistant in the Wallace Tumor In-stitute with Dr. Vincenzo Guarcello. Outside of school, Fe-lix serves as a medical translator and enjoys reading and playing tennis. Felix plans to attend medical school in 2009.
about the staff
about the staff
K e l c i B u r c k h a r d t
S t a f f W r i t e r
Basil Bakir is a junior biomedical engineering major. He works in the Department of Psychiatry and Behavioral Neu-robiology as a lab assistant. After completing his degree, he hopes to enter an MSTP program and obtain a Ph.D. in molecular biology and complete a residency in psychia-try. He enjoys history, neuroscience, and politics. He is a member of the Science and Technology Honors Program.
L a r r y L a w a l
S t a f f W r i t e r
Larry Lawal is a junior biology major at UAB. He cur-rently works in the crystallography lab at the Cen-ter for Biophysical Sciences and Engineering with Dr. Larry DeLucas. In addition to being a teaching assis-tant in the University Honors Program, Larry is also involved with Big Brothers Big Sisters, Alpha Epsi-lon Delta, and SHAPE. His interests include playing tennis, reading, and watching movies. Upon gradu-ation, he plans to attend medical school in 2009.
Kelci Burckhardt is a senior public health major at UAB. She will begin a combined program in law and public health in the Fall of 2008, planning to eventu-ally work for an international health nonprofit organi-zation. During her undergraduate career, she served as a chemistry teaching assistant and as the University Honors Program Steering Committee Chair. Kelci is also a member of Alpha Lamda Delta and Phi Kappa Phi.
B a s i l B a k i r
S t a f f W r i t e r
about the staff

N a m e N a m e
about the staff
S h a l i n i Va i d
S t a f f W r i t e r
M i c h a e l L e s t e r
S t a f f W r i t e r
Shalini Vaid is a sophomore Biology and French dou-ble major at UAB. Her interests include foreign lan-guages, Indian dance, and medicine. She is a mem-ber of EMSAP, Indian Cultural Association, Asian American Organization, American Medical Students Association, and Alpha Lamda Delta. Shalini cur-rently works as a research assistant in the Division of Pediatric Surgery at Children’s Hospital. She plans to attend medical school after studying abroad in France.
about the staff
Matt Morton is a sophomore Biomedical Engineering and Pre-medicine major. He is a member of the Science and Technology Honors Program. Currently, he is work-ing in an HIV/AIDS Epidemiology research lab on the UAB campus. After completing his degree, he hopes to at-tend medical school and pursue his interest in genetics.
Michael Lester is a junior currently pursuing a BS in Physics with a concentration in Biophysics. Mi-chael plans to attend medical school after gradu-ation and obtain an MD. Michael is a member of the Early Medical School Acceptance Program.
Pratik Talati is a sophomore Chemistry and Mathematics double major at UAB. His interests include reading, vol-unteering, and research. Currently, he is a lab assistant in the Department of Psychiatry and Behavioral Neu-robiology with Dr. Rita Cowell. He is a member of the University Honors Program, Math Fast-Track program, Chemistry Fellows program, and Alpha Lambda Delta.
P r a t i k Ta l a t i
S t a f f W r i t e r
M a t t M o r t o n
L a y o u t / D e s i g n E d i t o r
research narrativeacknowledgments
Acknowledgments
Without the help and support of UAB faculty and staff, the vision of Inquiro could not have been made a reality. Many
thanks the following individuals:
2007 Faculty Reviewers:
Dr. Thane WibbelsDr. Jacqueline Nikles
Dr. Tracy HamiltonDr. Anne Cusic
Dr. Aaron LuciusDr. Nikolai ChernovDr. Dianne TuckerDr. Larry DeLucas
Dr. Mike Sloane and the University Honors Program
Dr. Dianne Tucker and the Science and Technology Honors Program
Dr. Chris Reaves and Office of Undergraduate Research
Russell Helms, University Honors Program (production and printing)
A special thanks to Dr. Lowell Wenger and Dr. Charles Watkins, Dean and Associate Dean of the School of Natural Sciences and Mathematics for their
continued support of this endeavor from the very beginning.
The production and publication of this journal was made possible through the funding supplied by the School of Natural Sciences and Mathematics of
the University of Alabama at Birmingham.
inquiro | the university of alabama at birmingham 87

research narrativesubmission guidelines
Any student participating in mathematic or science research at UAB is invited to submit a research paper for submission in the 2008 issue of inquiro. Papers will be subject to student and faculty review. Initial submissions should follow these guidelines: 1. 12 point font, double spaced, pages numbered with the authors name ap-pearing in a header on every page (further formatting will be required upon acceptance)
2. Figures, tables, and graphs should be submitted in their original formats in the highest resolution possible as separate files. A tiff file at 300 dpi is ideal. Do not submit images embedded in a text document.
3. All papers should be submitted with a cover letter indicating the stu-dent’s area of study, classification, research mentor, paper title, and why the paper would make a good contribution to this publication.
Staff also invite students to submit research narratives, interviews with faculty members, and science related editorials.
Anyone who wishes to join the inquiro staff should send an e-mail detailing his or her interests, research experience, and/or publication experience to the e-mail account below.
Please send submissions or questions to [email protected]
For more information visit the web site at www.uab.edu/undergraduate-research
Just click on the inquiro link to view our Web pages.
*Students retain all rights to their submitted work, except to publish in another undergraduate science journal. Inquiro is an internal university document of the University of Alabama at Birmingham.
2008 inquiro SubmiSSion GuidelineS
88 inquiro | no. 1 | 2007
inquiro staff 2007