Embed Size (px)
Citation preview

Inpatient Antimicrobial Stewardship Program Implementation
Kendall Van Tyle, PharmD, BCPS, ASP Chair
Northern Navajo Medical Center

Objectives
Define antimicrobial stewardship
Cite reasons why inpatient antibiotic stewardship programs(ASP) are important
Recall time-line and key milestones for implementation ofI.H.S. ASP for inpatient
Compare & contrast examples of ASP elements
List potential starting points for ASP implementation foryour site
List some resources available

Stewardship
“The management or care for something, particularly the kind that is successful”
The Goal
Prospective optimization of antibiotic therapy – period.

Antimicrobial Stewardship
Strategic efforts to optimize antimicrobial prescribing
Drug
Dose
Duration
De-escalation
Indication - recognize when not needed

Something To Ponder
Antibiotic stewardship asks us to think about the community, not only the patient being treated
The adverse effects of antibiotic overuse and misuse have implications beyond the patient and outside of your facility
Why Implement ASP?
“If best infection control practices and antibiotic stewardship were nationally adopted, more than 600,000 infections and 37,000 deaths could be prevented over 5
years.”
MMWR / August 4, 2015 / Vol. 64

CDC Emerging Infections Program (EIP) Assessment of Prescribing in 36 Hospitals
Antibiotic prescribing could potentially be improved in over onethird (37%) of common prescription scenarios
Examples:
“UTI” – Asymptomatic bacteria accounted for 21% of patientsreceiving treatment with antibiotics
Vancomycin use• No Gram (+) bacterial growth, but still treated >3 days: 22%
• Culture grew only oxacillin-susceptible Staphylococcus aureus, butpatient still treated >3 days : 5%
Fridkin et al. MMWR. 2014:63(09);194-200

Rationale For Antibiotic Stewardship
Improve Patient Care and Safety Prevent C. Difficile infections
Minimize Adverse Events
Reduce Resistance Preserve antimicrobial effectiveness
Decrease excess deaths
Recommends that a regulatory requirement for antibiotic stewardship be in place by 2017
https://www.whitehouse.gov/sites/default/files/microsites/ostp/PCAST/pcast_carb_report_sept2014.pdf

As California Goes….
“Starting July 1 (2015), acute care hospitals in California must put into effect antimicrobial stewardship programs…….”
http://www.ashp.org/menu/News/PharmacyNews/NewsArticle.aspx?id=4174#sthash.70TCbofW.dpuf

https://www.cms.gov/Medicare/Provider-Enrollment-and-Certification/SurveyCertificationGenInfo/Downloads/Survey-and-Cert-Letter-15-12-Attachment-1.pdf

“No Citation Risk – Information Only”
1.C.9 -The hospital has written policies...
1.C.10 – The hospital has designated a leader…
1.C.11 – Requires an indication for all antibiotic orders
1.C.12 – Formal requirement of antibiotic “time out’ at 48h
1.C.13 – Monitors consumption of antibiotics…
https://www.cms.gov/Medicare/Provider-Enrollment-and-Certification/SurveyCertificationGenInfo/Downloads/Survey-and-Cert-Letter-15-12-Attachment-1.pdf
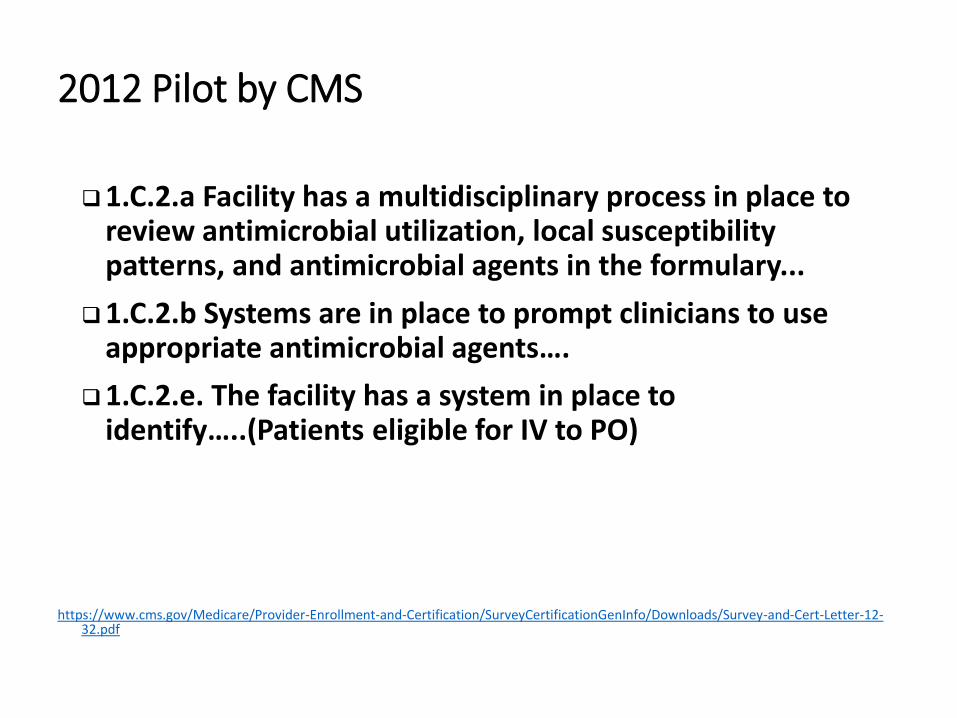
2012 Pilot by CMS
1.C.2.a Facility has a multidisciplinary process in place to review antimicrobial utilization, local susceptibility patterns, and antimicrobial agents in the formulary...
1.C.2.b Systems are in place to prompt clinicians to use appropriate antimicrobial agents….
1.C.2.e. The facility has a system in place to identify…..(Patients eligible for IV to PO)
https://www.cms.gov/Medicare/Provider-Enrollment-and-Certification/SurveyCertificationGenInfo/Downloads/Survey-and-Cert-Letter-12-32.pdf

Current Regulatory Need
CMS lack of payment for hospital acquired infections – these are deemed preventable
The Joint Commission Reduce risk of HAI’s
Implement strategies to reduce transmission of MDROs
NHSN event reporting for C. difficile

Proposed Timeline“Rome was not built in a day”

Implementation Timeline
• Goal is full implementation within 3 years
• Follow the Core Elements of Hospital Antibiotic Stewardship Programs outlined by the CDC as a guide
Available at:
http://www.cdc.gov/getsmart/healthcare/implementation/core-elelments.html
• Goals for each year are flexible

Year 1 Goals
• Leadership Support
• Physician & Pharmacist Champions
• Policies & Procedures
• Antibiogram Development
• Antimicrobial Stewardship Education Program

Year 1 – Leadership Support
• Critical for success of ASP
• Formal statements of support
• Addition of stewardship activities on PMAPs and COERs
• Supporting training and education
• Ensuring participation from the various differentdepartments involved in ASP• Form an ASP workgroup/committee
• Obtaining financial support

Year 1 – Physician/Pharmacy Champions
• Identify physician champion• Training in infectious diseases/ASP beneficial
• Can leverage telemedicine
• Hospitalists may be ideal secondary to increasing presence in inpatient care
• Identify pharmacist champion• Training in infectious diseases/ASP beneficial
• The Pharmacy and Therapeutics committee should NOT be considered the stewardship team

Year 1 (cont.)
• Policies & Procedures (Examples)• Define the ASP Committee as a required committee for the hospital
• Identify required members
• Outline committee charges
• Identify frequency of meetings
• Document dose, duration, and indication
• Facility specific treatment recommendations
• Identify reporting requirements• Ex. Reports to P&T and/or medical staff
• Avoid implementing too many policies and interventionssimultaneously

Year 1 (cont.)
• Antibiogram Development• Done at least yearly for facility
• Can be done more often if need identified
• Can be done for individual hospital units if need identified• Ex. ICU, Burn Ward
• Follow best practices• Discussed later

Year 1 cont.
• Antimicrobial Stewardship Education Program• Include reasons for starting ASP
• Describe increasing resistance
• Describe best practices in treatment of infectious diseases
• View as a process, not an event• Continuous
• Multiple approaches

Year 2 Goals
• Guideline development
• Implementation of Interventions
• Development of Tracking Measures
• Continue ASP Education

Year 2 cont.
• Guideline development • For specific indications/disease states
• EHR indication specific order sets• CAP/HCAP
• MDROs
• UTI
• Cellulitis/Diabetic Foot
• MDROs
• C. Diff
• Treatment of culture proven invasive infections

Year 2 cont.
• Implementation of Interventions• Broad Interventions
• Antibiotic “time outs”
• Prior authorization
• Prospective audit and feedback
• Pharmacy-driven Interventions• Auto IV to PO conversions
• Dose adjustments (ex. Renal adjustment)
• Dose optimization
• Automatic alerts where therapy might be unnecessarily duplicative
• Auto-stop orders
• Detection and prevention of ABX-related DDI

Year 2 cont.
• Development of Tracking Measures• Monitoring Antibiotic Prescribing
• Monitor adherence to documentation policy (dose, duration, and indication)
• Monitor adherence to facility-specific treatment recommendations
• Monitor compliance with one or more of the specific interventions
• Antibiotic Use and Outcome Measures• Track C. difficle infections
• Produce an antibiogram report
• Monitor use by Days of Therapy, Defined Daily Dose, and/or direct expenditure

Implementation TimelineYear 3
• Year 3 Goals• Reporting of Intervention Results
• Reporting Information to Staff on Improving Antibiotic Use and Resistance
• Continue ASP Education

Year 1 – Foundational Project
• Create an antibiogram if none exists
• Update existing antibiogram
• Review “best practices” checklist

Obtain Raw Data
• Work with microbiology lab supervisor
• Obtain report of susceptibility results for a given time frame,usually 1 calendar year
• Use “best practices” check list at this stage to eliminateduplicate isolates and validate data

Present Data
• Will usually need to transcribe data into a more user friendly format• PDF – posted in E.H.R.
• Pocket Card
• Review “best practices” check list at this stage to validate/present data appropriately


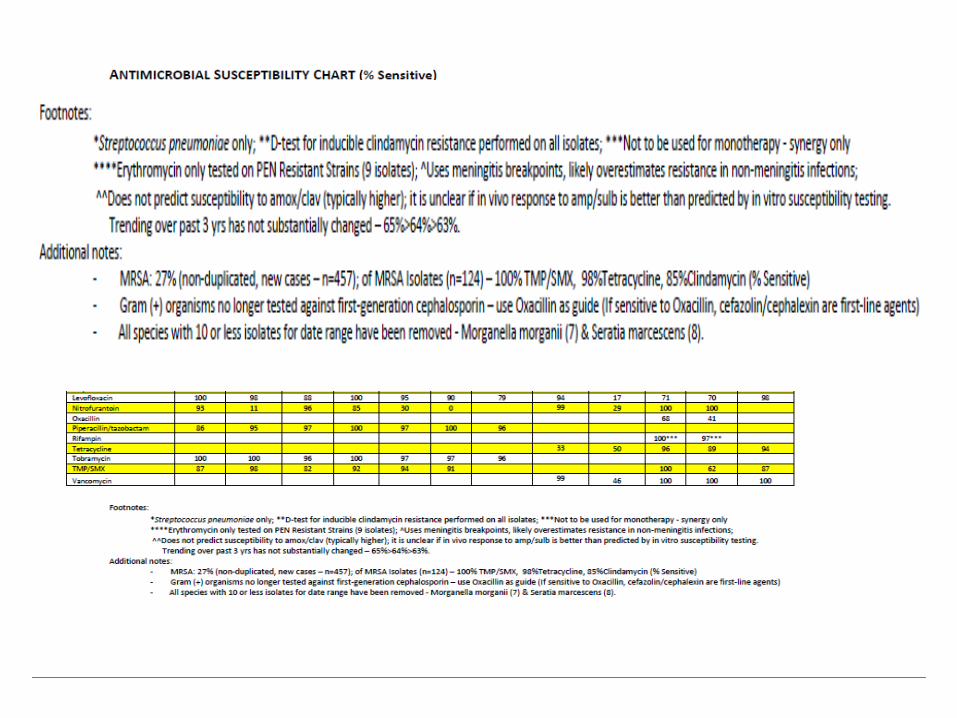


Antibiogram Checklist
Adapted from:• Hindler JR, Stelling J. Analysis and presentation of cumulative antibiograms:
a consensus guideline from the Clinical and Laboratory Standards Institute.CID. 2007;44:867-73.
• Boehme MS, Somsel PA, Downes FP. Systematic review of antibiograms: anational laboratory systems approach for improving antimicrobialsusceptibility testing practices in Michigan. Pub H Rep. 2010;125(sup. 2):63-72.

Year 1 - Suggestions
• Consider simply documenting what pharmacy already does/sees• Can be used for hypothesis generation
• Might reveal some “low-hanging fruit”
• Lead to ASP interventions/policies in year 2 and beyond
• Find those in your organization already involved in quality measures

Year 2 – Foundational Project
• Creation of local antibiotic use guidelines• Focus on common indications for facility
• Use antibiogram data and national guidelines
• Highly recommended to adapt these to Electronic Health Record, if possible


Year 2 Suggestions
• Consider your guidelines/E.H.R menus as an intervention
• Define and collect some baseline measures/data• Orders for XX drug for YY indication
• Survey prescriber use of guidelines/menus
• Recollect data at some point post intervention
• Repeat this process for every intervention identified andimplemented

Year 3 - Suggestions
• Review what worked and what didn’t
• Develop a process for continuous quality improvement• If an intervention succeeded, how to sustain it
• If it didn’t – why?• Evaluate variables defined and measured; methods
• Evaluate process
• PDSA cycles• Plan, Do, Study, Act – repeat.

Metrics

Options
Type Metric Definition
• Defined Daily Doses (DDD)
• Total Grams antibiotics useddivided by WHO approved DDDvalues
Consumption
• Grams• Total Grams used from
administered, dispensed, orpurchased data sources/reports
• Days of Therapy (DOT)• Number of days that the patient
receives at least one dose of anantibiotic
• Length of Therapy (LOT)• Number of days that the patient
receives therapy regardless ofnumber of drugs or doses received
• Expenditures • Dollars spent

Options
Type Metric Definition
Patient Outcomes• Health Care Associated
Infections
• Rate of disease-specific infections (e.g. C. Diff, MRSA, VAP)
• ASP Intervention rates• ASP Intervention Acceptance rates
Resistance • Antibiotic Resistant Organisms
• % of patients with resistant organism(s)• Antibiogram data• % of isolates of a pathogen with
antibiotic resistance

Advantages vs Disadvantages
Metric Advantage(s) Disadvantage(s)
Defined Daily Dose (DDD)
• Easy to calculate• Can be utilized as a
“benchmark” betweenhospitals, regions, andcountries
• Never intended to be used as ametric to study ASP impact
• Biases against combination therapy,even when that therapy might be anarrower spectrum
• Assumes routine dosing –“penalized” if using clinicallyappropriate higher or lower dosing
• Not applicable to pediatrics
Grams
• Purchase data easy to obtain• Not affected by price
fluctuations• Can be used to calculate DDD
• Purchase data is the least accurate
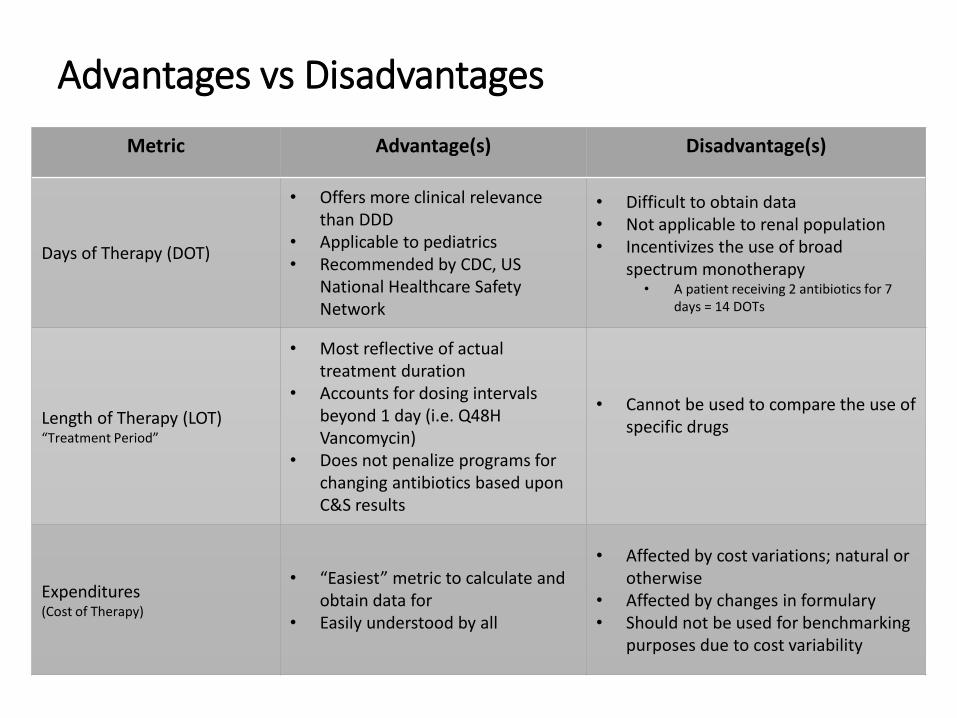
Advantages vs Disadvantages
Metric Advantage(s) Disadvantage(s)
Days of Therapy (DOT)
• Offers more clinical relevance than DDD
• Applicable to pediatrics• Recommended by CDC, US
National Healthcare Safety Network
• Difficult to obtain data• Not applicable to renal population• Incentivizes the use of broad
spectrum monotherapy• A patient receiving 2 antibiotics for 7
days = 14 DOTs
Length of Therapy (LOT) “Treatment Period”
• Most reflective of actual treatment duration
• Accounts for dosing intervalsbeyond 1 day (i.e. Q48H Vancomycin)
• Does not penalize programs for changing antibiotics based upon C&S results
• Cannot be used to compare the use of specific drugs
Expenditures (Cost of Therapy)
• “Easiest” metric to calculate and obtain data for
• Easily understood by all
• Affected by cost variations; natural or otherwise
• Affected by changes in formulary• Should not be used for benchmarking
purposes due to cost variability

Advantages vs Disadvantages
Metric Advantage(s) Disadvantage(s)
Antimicrobial-free Days
• Avoids issues related to Broad vs Narrow spectrum therapy
• Avoids issues related to Mono- vs Duo-Therapy
• Focuses on whether patients are receiving an antibiotic or not
• Mostly used as a disease-specific consumption measure (i.e. ventilator-associated pneumonia)
Point Prevalence“Snapshot” Surveys
• Resource-efficient• Typically done at a single site on a single
day• Data collected may include % patients
prescribed antibiotics, % “restricted” antibiotics prescribed, # antibiotics per patient, duration of therapy, dosing and dosage interval, time for IV to PO switch
• Can be used to measure and compare antibiotic use at multiple sites
• Can only provide feedback on limited elements of prescribing
• May not consistently reflect typical practice within a Unit or Hospital

Using Bar Coded Medication Administration Data (BCMA)
Paper published by the VA in 2012
Compares BCMA vs. Orders data
Used to help calculate some of the metrics described
NHSN AU Modulehttp://www.cdc.gov/nhsn/PDFs/training/AUR-training.pdf
Infect Control Hosp Epidemiol 2012;33(4):4090411

BCMA Log Output - RPMS

“Crunched” Data –Days of Therapy

ASP Resources
• CDC• http://www.cdc.gov/getsmart/healthcare/implementation.html
• IDSA/SHEA• http://www.idsociety.org/Stewardship_Policy/#sthash.gZe2Eucl.dpuf
• ASHP• http://www.ashp.org/menu/PracticePolicy/ResourceCenters/Inpatient-
Care-Practitioners/Antimicrobial-Stewardship

Additional Resources
• I.H.S. ASP Workgroup members
• I.H.S. ASP Listserv
• Antibiogram Checklist
• Metric Databases (RPMS)
• PDSA forms
• Cited References

IHS NPC ASP Workgroup Members
• Dr. Daniel Marino: [email protected] Phone: 520-295-2401
• Robin Bartlett: [email protected] Phone: 615-467-1577
• Shani Bjerke: [email protected] Phone: 218-679-3912
• Linda Crosby: [email protected] Phone: 541-553-2134
• Jeff Gildow: [email protected] Phone: 402-878-2231
• Tim Langford: [email protected]
Phone: 541-882-1487 x354
• Chris McKnight: [email protected]: 828-497-9163 x6379
• Jodi Tricinella: [email protected] Phone: 918-342-6298
• Kendall Van Tyle: [email protected] Phone: 505-368-7250
• Thaddus Wilkerson: [email protected] Phone: 907-729-2155
• Ron Won: [email protected] Phone: (503) 414-5579
• Jon Schuchardt: [email protected] Phone: (605) 355-2281
56

Conclusions/Pep Talk
• Implementation is important• Think “patient safety”
• Think “public health”
• Implementation is easy• Take it one step at a time
• One step will lead to the next
• Implementation is rewarding• Impact and positive change
• Do something today.