Embed Size (px)
Citation preview

Annual Report 2015
Innovative, sustainable and profitable

CONTENTS
1 ABOUT FM MATTSSON MORA GROUP AB
2 150 YEARS OF INNOVATION
4 2015 IN BRIEF
7 STATEMENT FROM THE CHAIRMAN
8 MARKET OVERVIEW
10 THE COMPANY IN BRIEF
12 OPERATIONS
18 QUALITY AT EVERY STAGE
20 SUSTAINABILITY AND CORPORATE SOCIAL RESPONSIBILITY (CSR)
22 LEADERSHIP AND EMPLOYEES
24 CORPORATE GOVERNANCE
29 AUDITOR’S STATEMENT ON THE CORPORATE GOVERNANCE REPORT
29 SHARE AND OWNERSHIP INFORMATION
32 ADMINISTRATION REPORT
36 FINANCIAL STATEMENTS
46 NOTES
71 AUDIT REPORT
72 SENIOR MANAGERS
73 BOARD OF DIRECTORS
74 DEFINITIONS
75 FINANCIAL OVERVIEW
76 INFORMATION AND CONTACT DETAILS

With over 150 years in the market, FM Mattsson
Mora Group is currently the Nordic region’s leading
manufacturer of water taps. Thanks to their attractive
design, a high level of quality and sustainable features,
the strong brands of Mora Armatur, FM Mattsson
and Damixa are the obvious choice for many Nordic
homes. Our brands are also an obvious part of our
mission to deliver clean water in an energy-efficient
manner. Then, now and in the future.
150 YEARS OF INNOVATION
2015 was a special year for FM Mattsson Mora Group, marking 150 years since Frost Matts Mattsson opened the doors of his brass foundry in Östnor outside Mora in the province of Dalarna.
1865FM Mattsson is founded in Östnor outside Mora.
1927Mora Armatur is founded.
2003The two companies merge, forming FM Mattsson Mora Group.
2014FM Mattsson Mora Group acquires Damixa, strengthening its role as the leading manufacturer of mixer taps in the Nordic region.
2015The Group is renamed FM Mattsson Mora Group AB and prepares to be listed on the stock exchange.
The company was founded in 1865, originally as a maker of parts for Mora clocks. In 1876, Frost Matts cast his first tap – boiler tap in brass. He was an enterprising man who made sure to involve several local villagers in his new project. The business grew, and when Frost Matts died in 1914, he left a small factory, FM Mattsson AB with approximately 20 employees, to his two sons Frost Karl and Frost Anders.
After a long strike and difficult working conditions, one of the sons, Frost Karl, started a competing business in 1927 – Mora Armatur – across the street. The two tap companies developed alongside of each other, and the healthy competition between them would lead to the success of both brands in the ensuing decades. After developing side by side for 75 years, they formed a joint group of companies in 2003. The Group performed a strategic acquisition of the Danish firm Damixa in 2014. 150 years after the company was founded, the Group changed its name from Ostnor to FM Mattsson Mora Group to form stronger links with its history and its strong brands.
Technical innovations in terms of functionality and water and ener-gy-saving features have driven the Group forward, with its artisan tradition as a stable foundation. This combination has proven to be extremely successful, as FM Mattsson Mora Group is the source of several innovations: Sweden’s first compact tap, which was devel-oped in the early 1960s; the introduction of the single-lever mixer in the mid-1960s; the launch of the first thermostatic mixer in Sweden in the 1970s; and the first tap in Sweden with ceramic sealing, which was launched in the early 1980s. In the early 1990s, FM Mattsson also launched the first soft-closing single-lever mixer, which prevents water hammer effects. At the same time, Mora Armatur launched the ESS system, a low-energy mixer system that can reduce hot water consumption by about 20 to 30 percent compared with the product it replaces.
Today, FM Mattsson Mora Group continues to develop technical innovations in order to promote sustainability through its products. But the Group has not forgotten its roots: its head office and one of its production facilities are still located in the village of Östnor, the place where it all started in 1865.
2
150 YEARS

THE SILJAN JUBILEE MIXER TAP
Siljan is FM Mattsson’s new signature line, and as the name indicates the jubilee mixer tap was developed for the company’s 150-year jubilee. The FM Mattsson Siljan jubilee mixer tap is a water-saving device made from brass. The surface has lacquer-sealed bronze colouration. It combines a brushed antique appearance with clean contemporary product design, both referencing and honouring 150 years of artisanal expertise combined with today’s technology.
A JUBILEE CELEBRATION AT LAKE SILJAN
In September 2015, FM Mattsson marked its 150th anniversary with a major celebration for all of its employees, partners and other specially invited guests. The festivities took place in the company’s head- quarters in Östnor, and they went on for two days.
3

EVENTS DURING THE YEAR
• Net sales amounted to SEK 1,112.6 million (969).
• Operating income totalled SEK 85.7 million (48.3).
• Operating income before items affecting comparability amounted to SEK 90.6 million.
• The operating margin was 7.7 percent (5.0).
• Earnings per share totalled SEK 5.38 (2.72).
• The Board of Directors proposes a dividend of SEK 3.00 per share (3.00), and an extra dividend of SEK 5.00 per share.
• Fredrik Skarp was appointed as the new President and CEO of FM Mattsson Mora Group, beginning on 14 March 2016. Claes Seldeby stepped down in January 2016.
• FM Mattsson Mora Group’s listing on the stock exchange was rescheduled for a later date.
KEY PERFORMANCE INDICATORS
Group, SEK million 2013 2014 2015
Net sales 823.7 969.0 1,112.6Operating income 70.0 48.3 85.7Profit after financial items 67.5 42.8 80.7Operating margin, % 8.5 5.0 7.7Total assets 673.7 757.4 791.5Equity/assets ratio, % 50 42 44Cash flow after investments 53.7 –67.8 83.4Return on capital employed, % 16 10 18Return on equity, % 16 10 18Average number of employees 452 553 545
2015 IN BRIEF
2015 saw strong growth and profits nearly doubled. The Group also celebrated its 150th anniversary and changed its name to FM Mattsson Mora Group. The company’s broad product range, with three brands and a strong pipeline of new products, and greater control over sales efforts were important factors be-hind its growth. The ongoing integration of Damixa and efficiency-enhancement measures implemented during the year contributed to this improvement in profitability. 2015 was also a time to prepare both the organisation and the company for a future spread of ownership and stock-exchange listing.
NET SALES AND OPERATING MARGIN
n Net sales, SEK millionn Net sales 2015, SEK millionn Operating margin, %
OPERATING INCOME
n Operating income, SEK millionn Operating income 2015, SEK million
NET DEBT AND CASH FLOW AFTER INVESTMENTS
n Net debt, SEK millionn Net debt 2015, SEK millionn Operating cash flow after investments,
SEK million
0
200
400
600
800
1,000
1,200
15141312110
4
8
12
16
20
241,113
919860 824
969
7.6
4.5
8.5 7.7
5.0
0
20
40
60
80
100
1514131211
85.7
69.6
38.3
70.0
48.3
-100
-50
0
50
100
150
1514131211-100
-50
0
50
100
150
84.785.3
67.053.7
135.9
17.640.4
5.7
-67.8
83.4
4 FM MATTSSON MORA GROUP ANNUAL REPORT 2015
2015 IN BRIEF

Name change to:
FM Mattsson Mora Group
Earnings per share, SEK
5.38
FMM Siljan was launched in September 2015
Damixa Pine was launched in September 2015
Mora Pullout was launched in December 2015
Revenue growth
14.8%
Operating income, SEK
85.7
Mora NYXX was launched in December 2015
Damixa A-Pex shower package was launched in October 2015
Damixa Fern was launched in February 2015
Mora Cera Duo was launched in December 2015
5FM MATTSSON MORA GROUP ANNUAL REPORT 2015
2015 N BRIEF


Behind these positive developments lie factors such as a strength-ened organisation, greater control over the value chain and an improved product portfolio with innovative solutions for the mod-ern home. FM Mattsson Mora Group has also demonstrated that it is capable of implementing and integrating strategic acquisitions, such as Damixa in 2014, which has whetted our appetite for more exciting structural transactions.
FM Mattsson Mora Group is now the Nordic region’s leading manufacturer of mixer taps for kitchens and bathrooms – in other words, products that are found in every home. We are a company with long-standing traditions, having spent 150 years in the mar-ket, and based on our history we have built up a solid brand and strong long-term relationships with major players in the market. We changed our name from Ostnor to FM Mattsson Mora Group in connection with our 150th anniversary in September. Today, FM Mattsson Mora Group is a modern company that excels in technology for water and energy savings – and continues to have a high level of ambition when it comes to innovation and tech-nological progress.
Thus, we are an established player in a market where several trends and driving forces are working in our favour. However, the competition in our market is intense, and we face both large global players and many small-scale niche operators. This is why it is important to remain at the cutting edge. We expect our focus on quality, innovation and efficient supply-chain processes to continue to pay off. With three complementary brands, we now have the product breadth to generate interesting opportunities.
Our vision is to deliver clean water in an energy-efficient manner. This means that FM Mattsson Mora Group develops products that help to save water and energy, and we intend to continue doing so.
Our focus at present is to strengthen our market position in all of the Nordic countries and to continue to generate growth in selected export markets outside the Nordic region. We intend to
grow both geographically and by broadening our product range. Growth should occur organically, at a higher pace than the market, and we are actively looking at more acquisition targets with a view to strengthening our market position and contributing to long-term profit growth. With a new CEO at the helm, the work of preparing the company for a future spread of ownership and stock-exchange listing continues. FM Mattsson Mora Group’s ambition is to con-tinue to be a driver of the structural transformation of the sector.
Johnny AlvarssonChairman of the Board
In recent years, FM Mattsson Mora Group has strengthened its leading position in the Nordic market – and last year was no exception. In 2015, the business grew by about 15 percent through both acquisitions and organic growth, and the Group achieved sales of over SEK 1 billion. Meanwhile, profitability has improved significantly, primari-ly driven by increased volume, but also as a result of steady efficiency-enhancement efforts. And we intend to continue along the path that we’ve staked out.
STATEMENT FROM THE CHAIRMAN
7FM MATTSSON MORA GROUP ANNUAL REPORT 2015
STATEMENT FROM THE CHAIRMAN

NORDIC REGION THE GROUP’S PRINCIPAL MARKET The vast majority of FM Mattsson Mora Group’s sales, 88 percent, are conducted in the Nordic region. FM Mattsson Mora Group estimates that in 2015, 3.1 million mixer taps were sold in the Nordic mixer tap market (the Nordic mixer tap market in this case refers to the mixer tap markets in Sweden, Norway, Denmark and Finland), representing volume growth of 2.6 percent compared with 2014. The company expects that the market will continue to grow over the next three years.
The mixer tap market is indirectly affected by macroeconomic factors such as GDP, housing market trends, housing prices, the level of building activity, disposable household income and consumer optimism. The most important factor when it comes to develop-ment is the section of the construction market known as RMO, which stands for renovation, maintenance and overhaul. Sales of replacement mixer taps fall into this category. In the Nordic region, the RMO segment is responsible for about 85 percent of all mixer taps sold. New construction is also an important factor for the development of the market.
When housing prices rise, new construction and household willingness to perform RMO projects also increase, since invest-ments in housing pay off if a home’s value can be expected to rise by more than the renovation cost.
DRIVERS The mixer tap market follows the trend for kitchens and bathrooms, which are increasingly viewed as lifestyle products. Mixer taps are now one decorating feature among many that should conform to a particular style. This makes design an increasingly important issue for FM Mattsson Mora Group. At the same time, customers are demanding more advanced technology and greater value for money. Sales to consumers are gradually increasing in importance and consumer influence is growing when it comes to projects and other sales via professionals.
Environmental issues also have a greater influence on the choice of mixer taps. Awareness that energy consumption can be signifi-cantly decreased through the use of new resource-efficient mixer taps is growing among customers and consumers. For example, one-fifth of the energy in a single-family home is used for hot water, and in flats the share is even higher. Customers are also increasingly looking for lead-free materials in order to show that they have high environmental standards. In Sweden in particular, several environmental classification systems have been established for this purpose and are becoming an accepted standard among customers. In the case of building projects, the total environmental impact of a building is becoming an increasingly important factor and environmentally friendly buildings with low energy consumption are becoming the standard.
FM Mattsson Mora Group operates in the mixer tap market, primarily in the Nordic region. The trend in the Nordic market is toward higher demand for design, innovation, functionality, water and energy-efficiency, electronics and environmentally friendly ma-terials. The influence of consumers is gradually becoming more important as bathroom and kitchen taps are increasingly viewed as decorating features and the demand for more resource-efficient taps grows.
MARKET OVERVIEW
Historically, the Nordic RMO sector has been less sensitive to general economic conditions than the new construction sector. Growth in the RMO sector has historically been less volatile than in the new construction sector.
THE DIFFERENCE BETWEEN THE RMO SECTOR AND THE RMO DEDUCTION
• RMO is an abbreviation for renovation, maintenance and overhaul. In this annual report, which focuses on the mixer tap market, the concept is mainly used in reference to the RMO segment, which is interchangeably referred to as the RMO sector.
• The RMO segment engages in sales of mixer taps to replace existing mixer taps.
• The RMO segment should not be confused with the RMO deduction, which is tax provision that offers private individuals in Sweden a tax reduction of 30 percent of the cost beginning on 1 January 2016, up to SEK 100,000 for services related to renovation, maintenance and overhaul.
RMO
New construction–25
–20
–15
–10
–5
0
5
10
15
20
2017
e20
16e
2015
e20
1420
1320
1220
1120
1020
0920
0820
0720
0620
0520
0420
0320
0220
0120
0019
9919
9819
9719
9619
9519
9419
9319
9219
91
HISTORIC TREND IN NEW CONSTRUCTION AND RMO IN THE NORDIC CONSTRUCTION MARKET, ANNUAL CHANGE
RMO
New construction–25
–20
–15
–10
–5
0
5
10
15
20
2017
e20
16e
2015
e20
1420
1320
1220
1120
1020
0920
0820
0720
0620
0520
0420
0320
0220
0120
0019
9919
9819
9719
9619
9519
9419
9319
9219
91
Source: Euroconstruct, September 2015.
8 FM MATTSSON MORA GROUP ANNUAL REPORT 2015
MARKET OVERVIEW

MARKET STRUCTURE ManufacturersMost players in the Nordic mixer tap market manufacture and sell products under their own brands. There are also companies that purchase mixer taps and sell them under their own brands. Whole-salers that sell mixer taps under their own brands are also found in all of the Nordic countries. In general, mixer taps with “private label” brands are usually positioned in the economy segment, implying that they are simpler and lower-priced than the market average.
The players are often local, but also include a few global players that are gradually increasing their efforts to enter the Nordic market. There has been some consolidation in recent years, with several acquisitions completed.
Multiple sales channelsWholesalers are in an extremely strong position in the Nordic market and offer their customers warehousing of mixer taps, as well as logistics solutions. They supply mixer taps to consumer channels such as stores for the heating/ventilation/sanitation and construction markets, as well as professionals and the project mar-ket. Some building materials chains purchase and offer taps under their own brands alongside the well-established brands. They are also increasingly offering total solutions including installation to both consumers and the project market.
Newer channels, such as e-commerce and DIY stores, are grow-ing rapidly, often with integrated offerings where store chains also have an online store.
MARKET SEGMENTATION The mixer tap market can also be categorised by price level, quality, functionality and design. Based on these categories, FM Mattsson Mora Group has defined three price segments: economy, medium and premium. The medium segment is by far the largest in the Nordic market with a volume estimated at about 70 percent, while the economy segment is the smallest.Premium comprises mixer taps that are modern and innovative, have special features and are considered unique.Medium comprises mixer taps for customers who request func-tionality combined with high quality and design.Economy comprises mixer taps that are sold in large volumes at a lower-than-average market price. The quality of these taps is generally lower, and their design is less sophisticated. They are usually sold outside the wholesaler chains or under retailers’ own brands, known as private-label products.
Specifiers• Architects • Heating/water/sanitation
consultants
Installers• Bravida • Caverion
Thousands of installers
Clients• NCC • Peab • Skanska
Stores• Bad & Värme • K-rauta • Bygghemma.se • Comfort • Hornbach
Manufacturers of mixer taps or companies that sell mixer taps manufactured by third parties
Customers that purchase directly from manufacturers
Dahl
Ahlsell
Onninen
and others
Store chains
OEM
Direct to installers
Players with a strong influence on purchasing decisions. This segment does not include end customers. End customers
• Private households
• Public organisations
• Property companies
• Construction companies
• OEM players
Own production
Not own production
IKEA
Tapwell
Manufacturers Direct customers Indirect customers The end customer
Oras
Gustavsberg
Wholesalers
•
skiss
Premium(≈20%)
Medium(≈70%)
Economy (≈10%)
9FM MATTSSON MORA GROUP ANNUAL REPORT 2015
MARKET OVERVIEW

BUSINESS CONCEPT The company’s business concept is to develop, manufacture and provide solutions for kitchens and bathrooms, and offer high-value customer service. Our offering to the market and customers is based on attractive design, environmentally and health-friendly products, high quality and innovation.
VISIONFM Mattsson Mora Group aims to be a global premium supplier and to deliver clean water in an energy-efficient way, using sustainable, modern design with Scandinavian roots.
STRENGTHS AND COMPETITIVE ADVANTAGES FM Mattsson Mora Group’s strengths can be summarised as follows:n The Nordic market leader, with well-known brands and
150 years of experiencen Strong product portfolio and high rate of innovationn Unique and strong position among business partnersn The Nordic market leader in design, technology and
environmentally friendly solutionsn Flexible and efficient productionn A driver of the industry’s restructuring processn Solid platform for continued growth n High availability of spare parts, technical service and
personalised advice
BUSINESS MODEL The company’s sales of the Mora Armatur and FM Mattsson brands in the Nordic market are almost exclusively made directly to whole-salers, which then resell the products to installation companies and various types of stores, while about a quarter of Damixa’s sales are made directly to stores, with the remainder sold to wholesalers. The Nordic wholesale segment consists of a small number of major players, about 20 companies in total. In recent years, some wholesalers have launched their own brands of mixer taps and shower systems, which has made it even more important for FM Mattsson Mora Group to enhance its competitiveness by continuing to develop strong brands that are in demand among end custom-ers. Several newer sales channels, such as e-commerce and DIY stores, are growing stronger, which presents both challenges and opportunities. These channels now account for a minor share of FM Mattsson Mora Group’s sales, but the proportion is expected to grow in the coming years and the company’s ambition is to meet demand in important channels.
THE COMPANY IN BRIEF
Resellers/influencers Users
Initiative
”Pull”
InfluencersInitiators/ decision makers
End customer/influencer
Users
Initiative
”Push”
THE PROFESSIONAL MARKET (“CULTURE”: CONSTRUCTION AND PROPERTY)
Specifiers Clients
Installers
Consumers
(Public housing, offices, public buildings)
No influence
THE CONSUMER MARKET (“CULTURE”: RETAIL/FURNISHING)
Heating/water/sanitation stores
DIY Stores
Small installers
Consumers
(Owners of single-family homes, terrace houses and tenant-owned apartments)
Largeinfluence
Wholesalers
10 FM MATTSSON MORA GROUP ANNUAL REPORT 2015
THE COMPANY IN BRIEF

FINANCIAL TARGETS AND OUTCOMES In 2015, FM Mattsson Mora Group’s Board of Directors adopted the following financial targets for the company.
Financial targets Outcome 2015
Annual organic growth of at least 3 percent in net sales over a business cycle, excluding acquisition effects 6.2%Operating margin (EBIT) of at least 10 percent over a business cycle 7.7%Annual dividend corresponding to about 50 percent of profit after tax, provided thatthe equity/assets ratio is not lower than 30 percent after payment of the dividend Proposed, 56%*An equity/assets ratio over 40 percent 44%
* Plus an extra divided of SEK 5.00 per share
STRATEGIC DIRECTIONFM Mattsson Mora Group has defined a number of strategic areas in order to create value for its customers, to be an attractive employer and to gradually achieve the vision of delivering clean water.
Profitable growthThe company’s strategy for profitable long-term growth is to organically refine its strong existing brands, while at the same time increasing its presence in both new and existing markets by:n further developing the Mora Armatur, FM Mattsson and Damixa
brands by developing three complementary and competitive product portfolios with high customer value, high profitability and a clear market position.
n further strengthening its position as the market leader in Sweden, Denmark and Iceland, while strengthening its position as the second-largest player in Norway and Finland. In addition, the company strives for profitable growth in selected export markets.
n remaining an active player in the continuing consolidation of the market through rational acquisitions.
EfficiencyFM Mattsson Mora Group intends to continue enhancing its pro-duction efficiency, focusing on higher productivity and improved capital utilisation by:n continuing to improve its logistics and purchasing processes by
reducing throughput times and increasing the delivery reliability of raw materials for production. The objective is to reduce the time from customer order to delivery, thus improving the level of service to customers and business partners.
n increasing the capacity utilisation of its production facilities by continuing to relocate manufacturing back to Sweden, which will enable additional gross margin enhancement and delivery reliability.
n enacting productivity-enhancing measures, such as reduced purchasing and production costs as a result of the acquisition of Damixa ApS, which has been effectively integrated into the Group since 2014.
Technology and designThe Group’s goal is to promote innovation in its own area of operation and develop the most prestigious products in the mixer tap market. The Group intends to continue its technological lead-ership by:n continually improving its product development with shorter
development times for new products.n focusing particularly on design and customer value. The company
will continue to develop its in-house design expertise, as well as continuing to develop partnerships with external designers.
n continuously pursuing technological advancements in electronics, water and energy-saving features, application engineering, input technology and materials.
Leadership and employeesFM Mattsson Mora Group aims to be an attractive employer that can recruit, retain and develop talented employees. Leadership at all levels of the organisation should promote high performance, and the day-to-day actions of our employees should reflect our shared values and commitment to corporate social responsibility.
11FM MATTSSON MORA GROUP ANNUAL REPORT 2015
THE COMPANY IN BRIEF

GEOGRAPHICAL PLATFORM FM Mattsson Mora Group has a solid Nordic platform through its own sales companies in Sweden, Norway, Denmark and Finland, and an international presence for future expansion through its own sales companies in Belgium, the Netherlands, Singapore, China, Hong Kong and Germany. The company’s head office is located in the village of Östnor, in Mora, Sweden. The company has one production facility in Mora and one in Odense, Denmark.
THREE BRANDS Work is under way to more clearly differentiate the positions of the three brands in the various price segments of the market, based on the company’s strong market position and three well-established brands. The basic aim of this work is to maintain FM Mattsson’s lead-ing position in the medium segment and to gradually expand the Mora Armatur brand from the medium segment into the premium segment. Damixa’s brand positioning and product mix currently extend across multiple segments, but the company’s ambition is to more clearly position Damixa as a brand focused on the economy and medium segments, while maintaining its high-level design. The company has held a dominant position in the Swedish market for many years through the Mora Armatur and FM Mattsson brands. Similarly, the Danish Damixa company and brand, which were acquired in 2014, command an extremely strong position in their home market of Denmark. These brands share a number of success factors, including a long history and innovative, high-quality product portfolios, which have contributed to their strong relationships with wholesalers, installers, resellers and clients.
FM Mattsson Mora Group is the Nordic region’s leading manufacturer of fittings such as water taps and thermostatic mixers. The company’s products are marketed under the strong and well-established brands of Mora Armatur, FM Mattsson and Damixa. For over 150 years, the company has consistently focused on cutting-edge technology, high quality, attractive design and eco-friendliness – which has resulted in an outstanding reputation and strong relationships with both professionals and consumers.
OPERATIONS
SALES BY BRAND
FM Mattsson 45%
Mora Armatur 33%
Damixa 22%
SHARE OF SALES International 12%
Nordic region 88%
12 FM MATTSSON MORA GROUP ANNUAL REPORT 2015
OPERATIONS


OVERVIEW Ten years ago, Mora Armatur began its transformation from a Swedish producer of sanitary fixtures to a brand with products characterised by high quality and perceived value, with a price to confirm its position in the upper-medium and premium segments. In Sweden, the Mora Armatur brand competes with a handful of European brands, and Mora Armatur’s success is the result of long-standing and well-managed customer relationships. The objective for the Mora Armatur brand is for the products to feature high-level design without com-prising on technology. The brand should be a platform for Scandinavian design and Swedish engineering and be a lifestyle brand, in order to attract long-term customer groups, such as architects and interior designers, as well as home furnishing and design stores.
With the Mora Armatur brand, the company has been involved in an ongoing design collaboration since 2011 with Thomas Sandell, one of Sweden’s most acclaimed architects and designers. The combination of solid engineering knowl-edge and leading design expertise is a prerequisite for Mora Armatur’s continued development and its move to the pre-mium segment.
Mora Armatur’s share of the Group’s sales was 33 percent in 2015. Its market share in Sweden, its home market, was about 18 percent in 2014.
RANGEMora Armatur’s current product portfolio encompasses the medium and premium price segments. Mora Armatur’s prod-uct lines are characterised by sophisticated design and inno-vation, and environmental awareness. The objective for each product is that behind an exterior perceived as innovative and stylish, lies all of the technology required to maintain a sense of precision for the customer. The Mora Styxx mixer tap is one example of a premium product that, in a short time, has attracted both financial success and a positive reception for its form and function. The products Mora Cera Duo, Mora NYXX and Mora Pullout were launched during the year.
DESIGN PHILOSOPHY
Modern Scandinavian design – for everyday use.
MORA ARMATUR
“Crafted by hand in Mora”
THE BENEFIT FOR CUSTOMERSThe company’s products are safe, attractive and worth buy-ing. They don’t have the cheapest purchase price, but they have the lowest ownership cost. Mora Armatur assumes responsibility for sustainability and safe usage, for the bene-fit of homes and families. Mora Armatur intends to provide higher quality and perceived value, at a price that confirms its position.
OUR OFFERING“Modern Scandinavian design – for everyday use.”
FOR WHOM?Progressive consumers with an interest in design, architects or decorators – motivated, aware people who often serve as leaders for wider groups of consumers and who value contemporary Scandinavian design.
14
OPERATIONS

OVERVIEW The FM Mattsson brand is the market leader in the Swedish mixer tap market. The FM Mattsson brand is also firmly estab-lished in other Nordic countries, but with lower market shares than in Sweden. FM Mattsson’s dominant position in Sweden is based on the brand’s over 150-year history of delivering high-quality and innovative products. A broad product range, technology, quality and reliability are the strengths that differ-entiate the FM Mattsson brand. The products use different types of energy and water-saving technology, such as the cold start feature, which can save up to 30 percent in hot water consumption while maintaining comfort. This technology is based on the user’s interaction with the mixer tap. Advanced technology, functional design and a high level of service have made FM Mattsson one of the most popular brands in the market and the “plumber’s choice”.
FM Mattsson’s share of the Group’s sales was 45 percent in 2015, while its market share in Sweden, its home market, was about 40 percent in 2014.
RANGE FM Mattsson offers a wide range of products in the medium segment. The products are based on proven solutions with high quality and, in many cases, a market-leading level of technology, such as soft-closing and pressure-balanced ther-mostats. The existing range, particularly the 9000E line with accompanying installation products, currently meets most mix-er-tap needs and requirements in Swedish homes and public buildings. In recent years, the range has also been expanded to include products that focus on design, in response to the growing interest in design among end customers. The launch of the new medium-segment Siljan line commenced in 2015, and the line met with great success. The Siljan line will gradually replace the 9000 line as part of FM Mattsson’s basic offering, but with significantly upgraded technology and design.
DESIGN PHILOSOPHY Functional design
n The tap is a utility item that is part of everyday life.n Utility items should be beautiful, simple and solidly made.n Sustainable solutions.n Sustainable design.Single-lever mixers from FM Mattsson have a soft-closing ceramic seal. Hot water limits, adjustable flow and cold starts are standard features. The EcoPlus flow limiter reduces water consumption and saves both money and energy. All materials are approved for use in food prepara-tion.
FM MATTSSON
THE BENEFIT FOR CUSTOMERSA broad product range featuring functional design and high quality, which is environmentally and energy-efficient and worth every penny.
ERBJUDANDE“The plumber’s choice” – a professional identity associ-ated with tradition and craftsmanship since 1865, as well as safe and reliable products.
FOR WHOM? By professionals, for professionals – and for everyone who wants to be a professional.
“The plumber’s choice”

OVERVIEWDamixa ApS was founded in 1932 in Odense, Denmark, as a producer of spare parts for motorbikes. Damixa introduced the single-lever mixer in Europe in 1966 and the company experienced sharp growth throughout the 1970s and 1980s, achieving great success in research and development. Exam-ples of innovations include the combined colour indicator and a new horseshoe system for mixer taps – now the industry standard. FM Mattsson Mora Group acquired the Damixa ApS Group in 2014. Damixa is the market leader in Denmark and is well represented in the other Nordic countries, the Benelux countries, Germany and Singapore. In the project market, in addition to design, the water and energy-saving features of Damixa products are particularly appreciated. The brand is associated with the well-known Danish tradition of design combined with high quality.
Damixa’s share of the Group’s sales was 22 percent in 2015, while its market share in Denmark, its home market, was 19 percent in 2014.
RANGE The Damixa brand has a broad range, with complete lines for bathrooms and kitchens. The brand stands for design ranging from minimalist to more traditional, and covers all price segments from economy to premium. The breadth of the product range also means that the brand is available in most of the market’s sales channels, from premium stores with integrated kitchen and bathroom solutions to DIY and e-commerce stores. This breadth in terms of range and sales channel presence is a conscious choice, and has proven a suc-cessful strategy for being able to supply the competitive Danish market with a mixer tap for every need – in other words, having an appropriate product mix for each sales channel. The Damixa ApS Group’s rate of innovation is high, with frequent product launches. In January 2015, the popular Clover line was complemented with an eco-friendly range with water-saving features to meet demand from the project market. In February 2015, the new Fern line was launched – mixer taps offering water savings of 30 to 40 percent compared with the products replaced, without compromising on comfort. Consumers can choose how much water they want to use each time with a simple and user-friendly twist-and-save feature, the first of its kind on the market. The Pine product line was also launched in September 2015. Pine is a line of mixer taps that offers advanced technological and environmental functionality, mainly aimed at the economy segment.
DESIGN PHILOSOPHY n understand customers’ behaviour n understand customers’ needs n focus on function n keep it simple n develop, when it makes a difference
DAMIXA
“When design makes sense”
THE BENEFIT FOR CUSTOMERS User-friendliness, a broad product range with a mixer tap for every need. Functional design where form and function go hand in hand.
OUR OFFERING “When design makes sense”. Danish design with innova-tive solutions where form and function are important.
FOR WHOM? Everyone can find the product they need from Damixa.
16
OPERATIONS

Over the Christmas period in 2011, four rental properties in Umeå’s Ålidhem district were destroyed by a fire. FM Mattsson Mora Group contacted the property owner AB Bostaden, which was in charge of building four new rental properties, and offered to carry out an evaluation of how new water fixtures could affect the consumption of hot water, cold water and energy. FM Mattsson Mora Group also contacted Umeå University to ask them to undertake an independent evaluation.
One of the four newly constructed rental properties was designated as a test property, while the other three were reference properties. First, an earlier generation of FM Mattsson’s fittings (9000) was installed in the test property. These fittings had no flow-limiting devices or any other energy or water-saving features. After one year, the fixtures in the test property were replaced with fixtures from FM Mattsson’s 9000E line with built-in Ecoflow flow modulators and cold start features. No other changes were made to the reference properties. The aim was to evaluate the resulting savings both in relation to the reference properties and with respect to consumption in the test property before the fixtures were replaced.
In October 2015, Umeå University published the results of the comparison, which showed savings of about 30 percent for hot water consumption and 15 percent for cold water consumption in the group with modern FM Mattsson mixer taps, compared with the reference group. These results were extremely positive, and AB Bostaden will gradually replace its old mixer taps with new ones thanks to the project.
The Ecoflow built-in flow modulator generates major savings
CASE STUDY
DESIGNDesign is becoming an increasingly significant factor in end custom-ers’ decision-making and therefore plays a key role in FM Mattsson Mora Group’s brand strategy. Aesthetics, colour, functionality and user interaction are important parts of the process of clarifying each brand’s position.
The company primarily develops its designs in-house, but exter-nal expertise has gradually become a more important element in the design process and led to intriguing new partnerships for the Mora Armatur and FM Mattsson brands. The Damixa brand has long been associated with cutting-edge design, and in recent years, the company’s products have enjoyed considerable acclaim and received many international prizes and awards.
PURCHASINGThe Group’s purchasing operations are coordinated by a cen-tral purchasing unit in Mora that manages the purchasing of raw materials, components and goods for resale, as well as most of the company’s other purchasing for the Mora Armatur and FM Mattsson brands. Damixa currently has its own purchasing organisation, which primarily manages the purchasing of components for the assembly operations in Odense. The Group is actively working to reduce the number of suppliers of direct materials, including brass, plastic parts, seals and fasteners.
PRODUCTION FM Mattsson Mora Group strives to continuously improve the com-pany’s production efficiency by applying Lean Production principles. The Group’s objective is to have a lean manufacturing organisation focused on value-added activities, in which waste is minimised and the level of quality is maximised.
Mora Armatur and FM Mattsson brand products are manu-factured in a company-owned factory in Östnor outside Mora. The production facility in Odense, Denmark, primarily focuses on assembly of a large share of Damixa’s product range.
The Mora production facility is highly automated with around 80 industrial robots, but final assembly of the finished products is largely performed manually. The company has one of the most modern brass foundries in Europe. The state-of-the-art foundry provides high capacity with limited staffing, enabling low quality-control costs
and energy consumption. This high degree of automation and effi-ciency was a key contributing factor in FM Mattsson Mora Group’s decision in 2012 to begin reclaiming the production operations that had previously been outsourced to China. Reclaiming production has proven highly successful, since the close relationship between production and R&D has helped to strengthen the company’s rate of innovation and launching precision for new products. It has also improved the efficiency of the logistics chain and reduced time from order to delivery. Components for the Damixa brand are mainly manufactured by external suppliers, but since the merger, the company has been conducting a review to determine which areas of component production could be relocated to the production facility in Mora. FM Mattsson Mora Group also outsources – albeit to a lesser extent – the production of certain products, especially products under the Damixa brand.
The mix of permanent employees in relation to temporary staffing in the production facility is adapted to order intake and forecasts. The objective is for about 85 percent of personnel in the production facility to be permanently employed under normal conditions, and for the remaining 15 percent to comprise temporary employees through staffing agencies.
LOGISTICS FM Mattsson Mora Group aims to create an optimised sales pro-cess with short lead times, efficient component flows and effective warehousing. The logistics unit aims to promote the development of a rational and profitable flow of materials, with a focus on value creation for end customers. In order to maintain and improve service levels to customers, wholesalers and business partners in terms of both delivery times and reliability, FM Mattsson Mora Group is working to reduce lead times.
One of the Group’s goals is to further reduce throughput times from raw material to finished product by means of smaller batches, meaning the number of manufactured items in each run, as well as through shorter production cycles.
FM Mattsson Mora Group’s warehousing of products under the Mora Armatur and FM Mattsson brands is centralised in Mora, while Damixa has a separate product warehouse in Odense.
QUALITY AT EVERY STAGE
The engine of the Group’s operations is located in the Swedish province of Dalarna, where FM Mattsson Mora Group has its roots. The entire operation is managed from the region, with strong teams throughout the value chain – from design and purchasing to production and development.
18 FM MATTSSON MORA GROUP ANNUAL REPORT 2015
QUALITY AT EVERY STAGE

DESIGN AWARDS
• Red Dot Award 2015
• German Design Award 2015
• Interior innovation Award 2014
• iF Product Design Award 2006
SALES AND MARKETING The company’s sales organisation is decentralised to geographic regions, and sales are conducted through the Parent Company in Sweden and sales subsidiaries in Norway, Finland, Belgium, the Netherlands, Hong Kong, China, Singapore and Germany. In Den-mark, sales are conducted via FM Mattsson Mora Group Denmark, which also owns a production facility. The company has about 50 sales representatives in the Nordic region, mainly in key account management, which focuses on support to wholesalers and other supply chain players. Outside the Nordic region, the company has strategically located salespeople who focus on specific customer segments. In addition, the company’s strategy is primarily to work with local distributors in countries where it does not have its own sales company.
Alongside sales through wholesalers and external distributors, FM Mattsson Mora Group also continuously works to strengthen its direct communication with consumers. Digital communication is becoming an increasingly important means to both strengthen the brand and drive sales. Accordingly, the company is investing in informative websites and digital tools that drive sales, for both trade customers and consumers.
RESEARCH AND DEVELOPMENT FM Mattsson Mora Group is making large investments in its R&D department in order to stay at the forefront of technological devel-opment. In Mora, the operations have adopted the Lean Production approach in order to achieve fast and efficient product develop-ment with economies of scale. Employees from the production, marketing and R&D departments are involved to ensure that the strict requirements for functionality, technology, design and man-ufacturability are met. The goal of the development process is to supply the brands with new products, and develop new features and properties that can be used in new products. The starting point for the development process is to continue creating products with advanced technology, high quality and sought-after design that meet customer needs. The Odense production facility applies a separate R&D model based on visual management/open innovation.
The company’s R&D activities are focused on the areas of design, electronics, materials, energy and water efficiency.
19FM MATTSSON MORA GROUP ANNUAL REPORT 2015

This philosophy is ingrained throughout the company, which works systematically and methodically on sustainability issues – in terms of its own operational impact, and by developing products and solutions that contribute to sustainability when they are used. Com-bined with the company’s strong stakeholder relationships, a stable and profitable business creates the conditions for corporate social responsibility from a financial, social and environmental perspective. FM Mattsson Mora Group has identified five main stakeholder groups for the company: customers and consumers, employees, suppliers and other business partners, shareholders and investors, and society. Good relationships and ongoing dialogue with these stakeholders is essential to ensure that the company focuses on the appropriate issues in the area of sustainability. FM Mattsson Mora Group maintains close contact with the market in order to understand needs and preferences, with the aim of continuously improving and developing products and working practices. Dialogue with wholesalers and retailers mainly takes the form of personal meetings, while consumer dialogue mainly takes place through electronic means and various user surveys. FM Mattsson Mora Group is one of the largest employers in the Municipality of Mora, and a major employer in Odense. The Group’s operations have a significant impact on the local community. The company com-plies with laws, regulations and standards, and participates actively in social development through dialogue with municipalities and authorities, and by networking with other local businesses. One example of community involvement is Mora Armatur’s corporate partnership with the international aid organisation WaterAid. FM Mattsson Mora Group’s vision is to deliver clean water – which is essential to human health and livelihood, and something to which a large proportion of the world’s population does not have access. As the leading manufacturer of mixer taps in the Nordic region, it is only natural that FM Mattsson Mora Group should help more people gain access to clean water.
FM Mattsson Mora Group’s suppliers are continuously moni-tored and evaluated. Suppliers of direct materials undergo audits that are mainly focused on quality and technical capabilities, in which sustainability aspects play a key role. Key factors in procure-ment processes include transparency, a willingness to collaborate and environmental ambitions. FM Mattsson Mora Group’s most significant purchases are the raw materials for production, such
as brass, zinc castings and plastic components. Ongoing efforts to improve purchasing coordination will also lead to a gradual decline in the number of suppliers. In turn, this will lead to more frequent dialogue and closer collaboration with fewer suppliers, which is expected to yield mutual benefits and increase transparency in the area of sustainability.
ENVIRONMENTAL RESPONSIBILITY FM Mattsson Mora Group promotes corporate social responsibility (CSR) and has the stated goal of being perceived as the industry leader in environmentally and health-friendly solutions. This philos-ophy is ingrained throughout the company, which works systemat-ically and methodically on sustainability issues – in terms of its own operational impact, and by developing products and solutions that contribute to sustainability when they are used.
FM Mattsson Mora Group’s environmental impact mainly arises from manufacturing, surface treatment and transport. The aim is to conduct these activities with the smallest-possible environmental impact. Areas with the highest priority from an environmental perspective are resource-efficiency and the reduction of hazardous substances. Use of the end products is also a key focus area, in which FM Mattsson Mora Group intends to develop eco-efficient products. A clear trend in the industry is the growing demand for water and energy-saving features, as well as eco-friendly materials. This trend is being driven by increased customer awareness and new EU regulations. FM Mattsson Mora Group aims to take a leading position in the technological shift to reduce and phase out the high-risk substances contained in its products. In 2014, a major step was taken when a new lead-free brass was introduced into the production process at Mora. Environmental activities at FM Mattsson Mora Group have been delegated to each production unit, while targets, focus areas and priorities are determined at the Group level.
ECOSAFEThe EcoSafe concept, which is central to the marketing of the com-pany’s products, is based on environmental awareness throughout the entire product chain. It ranges from reducing the environmental impact of the facility, to smart materials and energy-efficient features that save resources when the product is used.
FM Mattsson Mora Group promotes corporate social responsibility (CSR) and has the stated goal of being perceived as the industry leader in environmentally and health-friendly solutions.
SUSTAINABILITY AND CORPORATE SOCIAL RESPONSIBILITY
20 FM MATTSSON MORA GROUP ANNUAL REPORT 2015
SUSTAINABILITY AND CORPORATE SOCIAL RESPONSIBILITY


FM Mattsson Mora Group’s Performance Leadership Standard summarises the vision and approach that should characterise its operations. These efforts are a top priority and regular measure-ments provide the basis for continued leadership development at both the individual and team level.
Performance Leadership explores several aspects of leadership, including communication, decision-making, accessibility and improve-ment, as well as health, safety and the environment. Leaders at FM Mattsson Mora Group are expected to be accessible and visible, to promote dialogue and ensure that everyone feels confident enough to express their views, to see and hear each individual, and to work actively with the team.
The company also seeks to be an attractive employer, as well as a professional and exciting company where employees can grow both in their professional field and as individuals. The company aims to be recognised for its strong leadership and employee engage-ment. Structured competency mapping and evaluation ensures the availability of resources and expertise in all units.
A key element of being able to recruit and retain talented employees is competitive conditions, including attractive employee benefits and opportunities for further training and professional development. The Lean Production approach is ingrained in nearly all aspects of the Group’s work and is intended to involve the employees in the company’s continuous improvement efforts and efficiency processes. The goal is for all employees to have an indi-vidual development plan.
Similarly, FM Mattsson Mora Group considers differences and diversity an asset, and respect for these is an important part of our core values. The company works to ensure a safe physical working environment and has therefore introduced a policy, as well as action and contingency plans, to deal with harassment and discrimination.
CORE VALUES Having a clear set of core values that guide that company and its employees in all of their relationships with stakeholders and the rest of the world is fundamental to FM Mattsson Mora Group’s operations and corporate culture. The company has formulated the following core values:n Customer value: We serve our customers, and their customers.
We produce, market and sell products and solutions that are attractive to both users and our business partners. We listen to our customers’ requests and always respond to their needs. The more value we can generate for our customers, the more likely we are to achieve our pricing vision.
n Commitment: Job commitment is important for everyone. We want every employee to use and fully develop their talent, and feel that FM Mattsson Mora Group is an interesting and stim-ulating workplace.
n Respect: Everyone is different. This is an asset. We value different opinions. We respect the integrity and circumstances of others. We treat our colleagues, customers and shareholders as we would expect them to treat us.
ORGANISATION FM Mattsson Mora Group’s operations are decentralised, but the marketing, sales and accounting and finance functions are managed centrally.
In 2015, the average number of employees was 545 (553) in ten countries. Most of the company’s employees were in Sweden, with an average number of 415 employees. The average number of employees in Denmark was 72.
Committed and talented employees who enjoy their work are essential to the deve-lopment of successful companies. Creating an innovative corporate culture and me-eting business targets requires clear, inspiring and effective leadership.
LEADERSHIP AND EMPLOYEES
GENDER BALANCE
Men 69%
Women 31%
AVERAGE NUMBER OF EMPLOYEES BY COUNTRY
Netherlands 6China 4Belgium 2Singapore 2
Sweden 415
Denmark 72
Norway 13Finland 13
Germany 18
22 FM MATTSSON MORA GROUP ANNUAL REPORT 2015
LEADERSHIP AND EMPLOYEES

New taps with new technology and energy-saving functionality from FM Mattsson Mora Group could save Herlev Hospital a great deal of money while also helping the environment. Test results show that every tap would be able to save over EUR 140 per year by reducing water and energy consumption by 37 percent and 63 percent, respectively. Today, Herlev Hospital has about 4,600 taps, and its operations are expanding.
“We want to show the world our efforts to help create a greener and healthier environment. Now we can also doc-ument the economic advantages and show the multiple benefits that come from replacing water taps”, said Michael Olsen, Technical Manager at Herlev Hospital.
In 2014/2015, a test was performed in two bathrooms close to an extremely busy ward of the hospital. First, water meters were installed on the unit’s existing fixtures. After two months, the taps were replaced with Mora Cera and measurements continued for two more months. The results of the first tests were surprisingly positive – so positive that the managers decided to continue the tests for a while longer. When the results were presented to the hospital’s senior management and energy consultants, they showed great interest in following and expanding the project – including adding the results to the hospital’s environmental objectives. Since then, the major challenge has been to find financing to complete the project. The financial calculations do not allow the hospital to replace all of its taps at the same time, so while they hunt for additional financing they are replacing old taps that need to be changed with Mora Cera taps.
Herlev Hospital turns around its water consumption and sees large savings
CASE STUDY
FACTS• Area 250,000 m2 + 60,000 m2 under construction• About 150,000 patients per year• Water consumption: about 150,000 m3 per year• = about EUR 871,000 per year
Expected savings:• EUR 140 per year per tap• Potential savings of EUR 644,000 per year
(if 4,600 taps are replaced)

REGULATIONSUltimately, corporate governance is intended to satisfy shareholders’ requirements for returns, and to give all stakeholders satisfactory and accurate information on the company and its development. Internal and external regulations form the foundation of the gov-ernance of FM Mattsson Mora Group AB (publ), referred to as the company below.
Because the company is not listed on Nasdaq Stockholm or any other regulated market, it is not subject to the Swedish Corporate Governance Code (the Code), although the company applies most of the Code’s rules.
EXTERNAL REGULATIONS The Swedish Companies Act, the Swedish Annual Accounts Act, other relevant legislation and the Code form part of the external governance system, which comprises the framework for the com-pany’s corporate governance.
INTERNAL REGULATIONS The most important internal governance documents include the Articles of Association established by the Annual General Meeting (AGM). The next most important documents are the Rules of Procedure for the Board of Directors and the Board of Direc-tors’ instructions for the CEO. The Board of Directors has also established a number of policies, guidelines and instructions with binding rules for the Group’s operations. All policies are revised annually. In addition, the company promotes its core values for all employees of the Group.
SHAREHOLDERSThe total number of shares in the company is 11,445,100, of which 2,045,900 are Class A shares that confer the right to ten votes and 9,399,200 are Class B shares with one vote each. At 31 December 2015, the company had 167 shareholders. The company has been a so-called CSD-registered company since autumn 2003, which means that its share register is maintained by Euroclear. The com-pany has also been a public limited company since the 2011 AGM. The company’s largest shareholders, which represent at least one tenth of the number of votes for all of the company’s shares, are stated on page 31 of the Annual Report.
ANNUAL GENERAL MEETING Shareholders exercise their rights to make decisions concerning the company’s affairs at the General Shareholder Meeting, which is the company’s highest decision-making body. The Annual General Meeting is held every year within six months of the end of the fiscal year. The company’s Board of Directors and Auditors are elected at the Meeting. The AGM also adopts the company’s income statement and balance sheet and discusses matters regarding div-idends, discharge from liability for Board members and the CEO and the determining of fees for Directors and Auditors. The AGM also considers other matters that are mandatory according to the Swedish Companies Act and the Articles of Association.
The company’s ambition is for the AGM to be a satisfactory body for the shareholders, and its objective is thus for the whole Board, representatives of the Nomination Committee, the CEO and other members of management, as well as the Auditor, to always attend the AGM.
Extraordinary general meetings (EGM) are convened when the Board of Directors or Auditors consider them necessary.
NOMINATION COMMITTEEThe Nomination Committee is the AGM’s body for consulting on AGM resolutions in matters of elections and fees with the aim of creating solid supporting data for the Meeting to consider these matters. The duty of the Nomination Committee is to submit proposals to the AGM on:• The Chairman of the AGM• Number of Board members• Fees to be paid to the Board and the Auditors• Chairman of the Board and other members• Auditor• Proposals for amendments to guidelines for appointing a Nom-
ination CommitteeAs part of its work, the Nomination Committee is to participate
in the annual evaluation of the Board’s work, which is presented by the Chairman of the Board. The evaluation of the Board’s work and the company-specific requirements form the basis of the Nomina-tion Committee’s work. The Nomination Committee’s proposals are presented in the notice of the AGM.
Corporate governance refers to the regulations and structure in place to govern and manage the operations of a limited company in an effective and controlled manner. FM Mattsson Mora Group’s corporate governance relates to how the operations are governed, managed and controlled with the aim of creating value for the company’s shareholders and other stakeholders.
CORPORATE GOVERNANCE
24 FM MATTSSON MORA GROUP ANNUAL REPORT 2015
CORPORATE GOVERNANCE

The company has not adopted any specific age limit for Board members, nor any time limit specifying how long a member can serve on the Board. The Auditor’s appointment is a matter sub-mitted to the AGM annually.
All shareholders are entitled to submit proposals concerning prospective Board members to the Nomination Committee, and should do so by e-mail to the Chairman of the Nomination Com-mittee at [email protected].
BOARD OF DIRECTORS Size and compositionAccording to the Articles of Association, the Board of Directors should consist of between four and seven members. Otherwise, the Articles of Association stipulate no limitation regarding the appointment and dismissal of Board members or amendments to the Articles of Association. The Board of Directors is elected annually at the AGM.
Chairman of the BoardThe Chairman of the Board should ensure that the Board of Direc-tors’ work is conducted in accordance with the stipulations of the Articles of Association, the Swedish Companies Act, rules and ordinances, and the Rules of Procedure of the Board of Directors. The Chairman maintains ongoing contact with the CEO to mon-itor the company’s operations and is responsible for other Board members receiving the information and documentation necessary to enable them to conduct their duties on the Board. The Chairman is responsible for evaluating the work of the Board of Directors, participates in the evaluation of the Group’s senior executives and represents the company on ownership issues.
The work of the Board of DirectorsThe Board of Directors bears ultimate responsibility for the com-pany’s organization and administration and is also responsible for making decisions on strategic issues. The ambition of the Board of Directors has been to devote particular attention to establishing the overarching targets of the operations and decide on strategies to achieve them. In addition, the Board continuously evaluates Group Management to ensure the company’s governance, management and control. The Board of Directors is to work towards putting a system for monitoring and controlling its financial position in place, and is to verify compliance with laws and other regulations.
The Board’s work is regulated by annually established Rules of Procedure that concern the internal division of responsibility, decision-making processes in the company, company signatories, the agenda of Board meetings and the Chairman’s duties. Written instructions regulate the division of duties between the Board of Directors and the CEO. These instructions are evaluated annually. Directors’ fees are decided by the AGM.
Audit CommitteeIn accordance with Chapter 8, Section 49a of the Swedish Companies Act, the Board has appointed an Audit Committee that makes pro-posals to the Board for its approval. The Committee works according to an annually established agenda and is tasked with monitoring the company’s financial reporting and the efficiency of the company’s internal control and risk management activities. The Audit Committee is also to keep itself informed about the audit of the annual report and consolidated financial statements. The Committee is also respon-sible for reviewing and monitoring the Auditor’s independence and
objectivity, paying particular attention to whether the Auditor provides services other than auditing. The Committee also assists by making proposals to the AGM regarding the appointment of an Auditor.
Remuneration CommitteeThe Board of Directors has appointed a Remuneration Committee that is to consist of the Chairman and two members elected by the AGM. Its task involves consulting on the CEO’s salary and other employment terms for decision by the Board of Directors. The AGM resolution regarding the guidelines for remuneration of senior exec-utives is the basis of this work. The Committee should receive and approve agreements that the CEO makes with senior executives of the company. Minutes are kept at all Remuneration Committee meetings and the minutes are sent to the Board together with an oral report of the Board’s decision-making.
AUDITORS Auditors are appointed by the AGM following proposals from the Nomination Committee and elected for a period of one year. In the case of additional services provided by the accounting firm alongside the audit, such services are solely provided to the extent consistent with the regulations in the Swedish Auditing Act and the Swedish Institute of Authorised Public Accountants’ (FAR) rules of professional conduct pertaining to the objectivity and independ-ence of auditors.
CEO AND MANAGEMENT CEO’s dutiesThe Chief Executive Officer is appointed and dismissed by the Board and his work is evaluated continuously by the Board of Directors. The Board of Directors approved the instructions for the CEO, which have now been adopted, at its meeting on 12 May 2015, which included the following main areas:• Preparing a business plan• Monitoring compliance with the objectives, policies and strategic
plans the Board of Directors has adopted• Ensuring that financial reporting reflects the Group’s overall
financial position and earnings, as well as other circumstances of material significance
• Ensuring that Group Management has the appropriate skills and composition to manage the operations in the way the Board of Directors has decided
The companies in FM Mattsson Mora Group are managed by internal Boards where the majority of Board members are part of Group Management.
EXTRAORDINARY GENERAL MEETING An extraordinary general meeting took place in Mora on 10 August 2015. 71 shareholders and proxies were present at the meeting. These shareholders represented 7,620,618 shares, corresponding to 67 percent of the number of shares in the company and 71 percent of the voting rights.
In connection with the Board’s proposal to change the com-pany’s name and amend Article 1 in the Articles of Association, the meeting resolved the following: “The registered name of the company is FM Mattsson Mora Group AB (publ).”
The complete minutes of the AGM are available from the com-pany’s website.
25FM MATTSSON MORA GROUP ANNUAL REPORT 2015
CORPORATE GOVERNANCE

NOMINATION COMMITTEE PRIOR TO THE 2016 AGM In accordance with the principles governing the appointment of the Nomination Committee adopted by the 2013 AGM, three shareholders’ representatives have been appointed.• Hans Karlsson, Chairman (nominated by the largest share-
holder Tibia Konsult)• Peter Hermansson (nominated by former largest shareholder
of Mora Armatur)• Agneta Eriksson (nominated by former largest shareholder of
FM Mattsson)The Nomination Committee held six meetings prior to the AGM. No remuneration has been paid for work in the Nomination Committee.
BOARD OF DIRECTORS The 2015 AGM resolved that the Board of Directors should consist of seven Board members with no deputies elected by the AGM. This number has been constant since 2006. Two members and one deputy are appointed by the employees. FM Mattsson Mora Group’s CEO is not a member of the Board, but does participate in Board meetings to present reports. The composition of the Board is presented in the table below. A more detailed presentation of the Board members can be found on page 73.
Attendance at Total fees Remuneration Audit Board meetings Remuneration Audit Name (SEK 000s) Committee Committee out of a possible 11 Committee Committee**
Johnny Alvarsson 183 Yes No 11 Lars Erik Blom 145 Yes Yes 11 1/1 1/1Erik Eriksson 145 Yes No 11 1/1Christer Lenner 222 No No 11 1/1Lotta Lundén 145 No Yes 11 1/1Hans Åke Norås 145 No Yes 11 1/1Anna Maria Rylander* 133 No No 10 Staffan Gryting – No No 11 Ellinor Sparby – No No 11
* Board member Anna Maria Rylander stepped down at an extraordinary Board meeting on 17 November 2015.** The Audit Committee held its first meeting on 24 November 2015.
Resolutions passed at the 2015 AGMThe AGM 2015 was held on 12 May 2015 in Mora, Sweden. 96 shareholders and proxies were present at the Meeting. These holders represented 10,066,408 shares, corresponding to 88 percent of the number of shares in the company and 88 percent of the voting rights. The resolutions passed at the AGM 2015 included the following:
n To pay a dividend of SEK 3.00 per share to the shareholders in accord-ance with the Board of Directors’ proposaln To leave the Board of Directors unchanged with seven members without deputiesn To pay a total of SEK 1,080,000 in fees to the Board in line with the Nomination Committee’s proposal.The fees are to be distributed as follows:– SEK 210,000 to the Chairman– SEK 145,000 to each of the other
elected members
n Election of the Chairman of the Board and Board members in line with the Nomination Committee’s proposal:– New election of Johnny Alvarsson as Chairman of the Board– Re-election of Lars Erik Blom, Erik Eriksson, Christer Lenner, Lotta Lundén, Hans Åke Norås and Anna Maria Rylander.n To elect accounting firm KPMG as the company’s Auditor, with Author-ised Public Accountant Helena Arvidsson Älgne as Head Auditor
n To decide on principles regarding remuneration of senior executives in line with the Board’s proposal.n To authorise the Board of Direc-tors on one or more occasions up to the next AGM to decide on the new issue of a maximum of 3,000,000 Class B shares.
The complete minutes of the AGM are available from the company’s website.
CORPORATE GOVERNANCE 2015
26 FM MATTSSON MORA GROUP ANNUAL REPORT 2015
CORPORATE GOVERNANCE

The work of the Board of DirectorsIn 2015, the Board of Directors held 11 meetings, one of which was a statutory meeting. Minutes were taken by the secretary of the Board of Directors at these meetings, who is also the compa-ny’s Chief Financial Officer. Documentation for the meetings was sent to all members prior to each meeting, which were then held in accordance with the approved agenda for the meeting. Other executives participate at Board meetings to submit reports. At its meetings during the financial year, the Board of Directors consid-ered the fixed items on its agenda for each Board meeting such as business conditions, financial reporting and investments. Other issues discussed in 2015 included strategy, market trends, product development, stock-exchange listing, establishment of a separate Audit Committee, acquisitions and the appointment of a new CEO. In addition, matters regarding the annual financial accounts, interim reports, budgets and forecasts are considered at designated Board meetings.
Chairman of the Board Johnny Alvarsson is not an employee of the company and does not have any assignments for the company apart from his Chairmanship of the company
REMUNERATION COMMITTEE As of 12 May 2015, the Remuneration Committee comprises Johnny Alvarsson (Chairman), Lars Erik Blom and Erik Eriksson. During the year, the Committee discussed conditions and results regarding variable remuneration to senior executives at the Group and proposals for principles governing variable remuneration. The Remuneration Committee had one meeting during the year at which all members were present. No remuneration has been paid for work in the Remuneration Committee.
AUDIT COMMITTEE The Audit Committee comprises Lars Erik Blom (Chairman), Lotta Lundén and Hans Åke Norås. Lotta Lundén and Hans Åke Norås are independent of both the company’s management and major shareholders. On 24 November 2015, the Audit Committee held an initial meeting at which the Committee’s Rules of Procedure were discussed prior to a decision by the Board as a whole.
AUDITORSAt the 2015 AGM, KPMG was appointed the company’s Auditor, with Authorised Public Accountant Helena Arvidsson Älgne as Head Auditor. In addition to the audit, the company appointed KPMG to handle tax matters, the stock-exchange listing and various accounting issues. Information on fees to the audit firm is provided in Note 8. Auditors’ fees to other Auditors primarily consist of statutory audits of minor Group subsidiaries. Remuneration of auditors is presented in Note 8.
GROUP MANAGEMENT In 2015, FM Mattsson Mora Group’s Group Management comprised the CEO, the five heads of Group functions and one CEO of a subsidiary. A more detailed presentation of Group Management can be found on page 72. Claes Seldeby was appointed CEO on 25 May 2012 but announced on 27 November 2015 that he intended to leave the Group. Mr. Seldeby had no shareholdings or partnerships in entities with which the company has significant business relationships. On 14 December, the Board appointed Fredrik Skarp as the new CEO, who took over on 14 March 2016.
GUIDELINES FOR REMUNERATION OF SENIOR EXECUTIVES It is very important that there is a clear correlation between remu-neration and the Group’s financial targets in the short and long term. The company should be able to offer competitive market terms that enable the company to recruit and retain the right senior executives. The criteria for establishing remuneration should be based on the significance of duties and the employee’s competence, experience and performance. Remuneration is to consist of the following components:• basic salary• variable remuneration• pension benefits• other benefits and conditions on termination of employment
Independence of the BoardAccording to the Code, a majority of the members elected by the AGM are to be independent in relation to the company and its management. At least two of these are also to be independent in relation to the company’s major shareholders. FM Mattsson Mora Group’s Board has been deemed to fulfil such independence requirements. Independence in relation to:Name Position Member since company major shareholders
Johnny Alvarsson Member of the Board (Chairman) 2012 (ordf. från 2015) Yes YesLars Erik Blom Member of the Board 2013 Yes NoErik Eriksson Member of the Board 2003 Yes NoChrister Lenner Member of the Board 2009 (ordf. 2009-2015) Yes YesLotta Lundén Member of the Board 2014 Yes YesHans Åke Norås Member of the Board 2009 Yes YesAnna Maria Rylander Member of the Board 2014* No NoStaffan Gryting Member of the Board (empl. representative) 2005 No YesEllinor Sparby Member of the Board (empl. representative) 2014 No Yes
* Board member Anna Maria Rylander stepped down at an extraordinary Board meeting on 17 November 2015
27FM MATTSSON MORA GROUP ANNUAL REPORT 2015
CORPORATE GOVERNANCE

Other senior executives are defined as the six people plus the CEO who comprise Group Management. The 2015 AGM adopted guidelines stating that variable remuneration should be based on operating income for the 2015 financial year. Variable remuneration should be capped at 50 percent of basic salary for the CEO and at 35 percent of basic salary for other senior executives.
Pensions should be defined contribution to create predictability. For the CEO, the premium is 30 percent of basic salary. For other senior executives, there are customary pension obligations within the framework of the general pension plan. Further pension pre-miums are also provisioned at 5 percent of basic salary.
Members of Group Management have the customary benefits for people in an equivalent position, such as car and healthcare benefits. There is a notice period of 12 months between the com-pany and the CEO of the Parent Company for termination by the company and six months for termination by the CEO. In the event of termination by the company, the CEO is entitled to salary and other employment benefits for 12 months, as well as severance pay equal to 12 monthly salaries.
THE BOARD’S PROPOSAL FOR NEW GUIDELINES GOVERNING REMUNERATION OF GROUP MANAGEMENT There are no proposals to change the principles governing remu-neration and other employment conditions for Group Management ahead of the 2016 AGM.
INTERNAL AUDIT The Group has a simple legal and operational structure and estab-lished governance and internal control systems. In light of this, the Board has decided against conducting a dedicated internal audit.
THE BOARD’S REPORT ON INTERNAL CONTROL OVER FINANCIAL REPORTING The Board of Directors’ responsibility for internal controls and governance is formalised by the Swedish Companies Act and the Swedish Annual Accounts Act. The Swedish Corporate Governance Code is also applied.
FM Mattsson Mora Group endeavours to conduct its operations as efficiently as possible. Financial reporting should be reliable and reflect the company’s operations accurately and be prepared in accordance with applicable laws and ordinances.
The company has chosen to adopt the COSO definition of internal controls as the basis of its work on internal controls. COSO stipulates that internal control has five components: control envi-ronment, risk assessment, control activities, information and com-munication, and monitoring.
Control environmentThe basis of internal control over financial reporting is the control environment, which includes the culture within which the Board and management communicate and work. The control environment primarily consists of an organisational structure, responsibilities and authorisations, management philosophy, ethical guidelines and the company’s policies, guidelines and processes. Decision paths, authorisations and responsibilities that are clearly defined and com-municated between different levels of the organisation, control documents in the form of policies and guidelines covering all sig-nificant segments, and offering guidance to senior executives of the Group, are an important component of the control environment.
An important part of the Board’s work is to formulate and approve a number of fundamental policies, guidelines and frameworks. These include the Board of Directors’ Rules of Procedure, instructions for the CEO, communications, environmental and financial policy. The purpose of these policies is to create a foundation for efficient internal controls. All policies are revised annually and are adopted by either the company’s management or the Board. The Board also endeavours to provide clear roles, responsibilities and processes via its organisational structure that enable effective management of operational risks and the achievement of targets.
Risk assessmentThrough its operations, the company is exposed to various types of risk. Structured risk assessment enables identification of the material risks that affect the internal control of financial reporting. The company works continuously on risk analysis, where an analy-sis of the risks of misstatement in financial reporting of significant income statement and balance sheet items is performed. Other risks relating to financial reporting include the risk of fraud, losses or misappropriation of assets. The Board of Directors continuously evaluates Group Management’s risk management process. This work includes judging which preventative measures should be taken to reduce the company’s risks.
Control activitiesThe risk of misstatements in financial reporting is reduced through good internal control over financial reporting, with a particular focus on critical segments defined by the Board of Directors. The purpose of control activities is to discover, prevent and correct inaccuracies and discrepancies in the reporting.
Information and communication The company has a communication policy that includes guidelines for internal and external communication from the company. The purpose of this policy is to ensure compliance with all external and internal communication obligations, and to maintain good commu-nication with staff.
MonitoringThere is monthly monitoring of all profit centres, companies and at Group level. Monitoring is usually conducted against the budget, the previous year and the most recent forecast. Forecasts are prepared three times a year for internal use. The results are analysed by the accounting and finance function along with managers responsible for profit centres. The CFO reports to the CEO, who submits monthly financial reports to the Board of Directors. The Board of Directors continuously evaluates the information provided by Group Management.
28 FM MATTSSON MORA GROUP ANNUAL REPORT 2015
CORPORATE GOVERNANCE

The Board is responsible for the Corporate Governance Report for 2015 on pages 24-28 and for ensuring that it is produced in accordance with the Swedish Annual Accounts Act.
We have read the Corporate Governance Report, and based on this reading and our knowledge of the company and the Group, we believe that we have sufficient grounds for our statement. This means that our legally required review of the Corporate Governance Report has a different focus and is substantially less in scope than an audit conducted in accordance with International Standards on Auditing (ISA) and other generally accepted auditing practices in Sweden.
We believe that a Corporate Governance Report has been pro-duced and that its legally required information is consistent with the Annual Report and consolidated financial statements.
Mora, 23 March 2016 KPMG AB
Helena Arvidsson Älgne Authorised Public Accountant
To the Annual General Meeting of FM Mattsson Mora Group AB (publ.), Corporate Registration Number 556051-0207
AUDITOR’S STATEMENT ON THE CORPORATE GOVERNANCE REPORT
29FM MATTSSON MORA GROUP ANNUAL REPORT 2015
AUDITOR’S STATEMENT ON THE CORPORATE GOVERNANCE REPORT

SHAREHOLDERThe total number of shares in the company is 11,445,100, of which 2,045,900 are Class A shares that confer the right to ten votes and 9,399,200 are Class B shares with one vote each. At 31 Decem-ber 2015, the company had 167 shareholders, principally from its founding families.
DIVIDEND POLICY AND DIVIDEND PROPOSALIn accordance with the dividend policy adopted by FM Mattsson Mora Group’s Board of Directors, dividends are to correspond to approximately 50 percent of FM Mattsson Mora Group’s earn-ings for the preceding financial year, on condition that the equity/assets ratio after payment of the dividend amounts to at least 30 percent. Exceptions may be made in special circumstances, such as acquisitions. Consideration is also to be given to FM Mattsson Mora Group’s capital requirements, earnings, financial position, capital adequacy requirements and the prevailing economic conditions.
FM Mattsson Mora Group paid a dividend to the shareholders of SEK 3 per share for both the 2014 financial year (a total of SEK 34.3 million) and 2013 (a total of SEK 34.3 million).
The Board proposes a dividend of SEK 3.00 per share (a total of SEK 34.4 million) for the financial year 2015 and an extra dividend of SEK 5.00 per share (a total of SEK 57.2 million).
CONVERTIBLES, WARRANTS, AUTHORISATION TO ISSUE SECURITIES, ETC.FM Mattsson Mora Group has no outstanding warrants, convertibles or other share-based financial instruments.
On 12 May 2015, FM Mattsson Mora Group’s AGM authorised the Board of Directors on one or more occasions up to the next AGM to decide on the new issue of a maximum of 3,000,000 Class B shares disapplying the preferential rights of the company’s shareholders. The resolution was subject to the condition that payment for the subscribed shares could take the form of the offsetting of debt or cash-in-kind. The authorisation was to be exercisable for the new issue of a maximum of 2,000,000 Class B shares for implementation of the listing of the company’s shares and for the new issue of a maximum of 1,000,000 Class B shares for the acquisition of companies.
FM Mattsson Mora Group has been a CSD-registered company since autumn 2003, which means that its share register is maintained by Euroclear. A decision was also taken at the 2011 AGM to make the company a public company.
SHARE AND OWNERSHIP INFORMATION
30 FM MATTSSON MORA GROUP ANNUAL REPORT 2015
SHARE AND OWNERSHIP INFORMATION

TEN LARGEST SHAREHOLDERS AT 31 DECEMBER 2015 Total number Number of Number of Proportion of Proportion ofName/company of shares Class A shares Class B shares share capital, % votes, %Tibia Konsult AB 1 710 500 229 000 1 481 500 14,95 12,63LK Finans AB 1 163 510 228 900 934 610 10,17 10,80Mats Mattsson 674 500 134 900 539 600 5,89 6,33Anna Mattson-Svensson 594 000 118 800 475 200 5,19 5,57Jan Söderberg Förvaltning AB 565 990 0 565 990 4,95 1,90Allba Holding AB 400 032 0 400 032 3,50 1,34Ulla Hermansson 356 400 0 356 400 3,11 1,19Rosebo Kapital AB 342 000 0 342 000 2,99 1,15Gunnar Eriksson 251 200 50 300 200 900 2,19 2,36Rolf Eriksson 240 300 48 100 192 200 2,10 2,25Other 5 146 668 1 235 900 3 910 768 44,97 54,49 Total 11 445 100 2 045 900 9 399 200 100,00 100,00
SHARE CAPITAL TREND AT 31 DECEMBER 2015 Number of shares Share capital (SEK)Registration date Event Change Total Change Total27 Nov 2012 New share issue 457 900 11 445 100 457 900,00 11 445 100,0027 Nov 20121) Decrease –457 900 10 987 200 –457 900,00 10 987 200,003 Jun 2011 Share split 100:1 11 330 649 11 445 100 – 11 445 100,0021 Feb 2003 New share issue 34 335 114 451 3 433 500,00 11 445 100,0021 Feb 2003 Decrease 97 920 80 116 9 792 000,00 8 011 600,0028 Jan 2003 New share issue 80 116 178 036 8 011 600,00 17 803 600,0023 Oct 1998 Bonus issue 48 960 97 920 4 896 000,00 9 792 000,00
1) An extraordinary general meeting (EGM) on 15 November 2012 resolved, at the request of the previous principal owner Priveq Investment II KB, to convert 228,800 Class A shares to Class B shares and to redeem Priveq’s remaining Class A shares, which resulted in a reduction in the share capital by SEK 457,900, through redemption (after conversion). The resolution was conditional on issue of 457,900 Class A shares through a private placement. The EGM resolved on the issue of 457,900 new shares. The shares were subscribed for at the EGM by Tibia Konsult AB (229,000 shares) and LK Finans AB (228,900 shares).
31FM MATTSSON MORA GROUP ANNUAL REPORT 2015
SHARE AND OWNERSHIP INFORMATION

ADMINISTRATION REPORT
2015
Q1In February, FM Mattsson Mora Group launched Fern – a new, flexible tap that reduces water consumption by 40-50 percent. The inno-vative Twist & Save feature allows the user to select either full or half-flow as needed. The tap, which was designed in Denmark, is the first of its kind in the market.
•The year-end report for 2014 was published in February. The Group posted growth, mainly through acquisitions, of 17.6 percent, corresponding to sales of SEK 969 million and operating income of SEK 48.3 million.
Q2In May, the AGM resolved to authorise the Board of Directors on one or more occasions up to the next AGM to decide on the new issue of a maximum of 3,000,000 Class B shares disapplying the preferential rights of the company’s shareholders. The authorisation was to be exercisable for the new issue of a maximum of 2,000,000 shares for implementation of the listing of the company’s shares and for the new issue of a maximum of 1,000,000 shares for the acquisition of companies.
Q3In August, Ostnor Finland Oy took over sales responsibility for the Damixa brand in the Finnish market, which was previously managed by an external supplier.
•It was decided at an extraordi-nary general meeting that the name of the company would be changed to FM Mattsson Mora Group AB (publ).
•The Group celebrated its 150th anniversary in Sep-tember with the launch of a jubilee tap and the new Siljan signature line, an innovative line of kitchen and bathroom products also available in a lead-free design, under FM Mattsson name. The third quarter also marked the launch of the Pine product line by Damixa.
Q4Aki Helminen took over as the new President of Ostnor Finland Oy on 1 October.
•Mora Armatur launched Mora Cera Duo in December.
•On 3 November 2015, the Board of FM Mattsson Mora Group announced its plans to apply for a listing on Nasdaq Stockholm. On 9 November, the company was informed that the requirements for approval by Nasdaq Stock-holm had not been fulfilled at the time, resulting in a delay to the previous plan to list the Group in 2015. An Audit Committee was established and Anna Maria Rylander stepped down from the Board.
•In November, CEO Claes Sel-deby announced his intention to step down from his posi-tion. In December, the Board appointed Fredrik Skarp as the new President and CEO. Prior to Fredrik Skarp assuming the role in March 2016, Marketing Director Peter Wennerstein served as acting CEO of the Group.
SIGNIFICANT EVENTS DURING THE FINANCIAL YEAR
FM Mattsson Mora Group AB (publ)
Corporate Registration Number 556051-0207
32

GROUPThe Board of Directors and CEO of FM Mattsson Mora Group (publ), Corporate Registration Number 556051-0207, with its reg-istered office in Mora, Sweden, hereby present the annual accounts and consolidated accounts for the 2015 financial year.
OPERATIONSFM Mattsson Mora Group is the leading manufacturer of fixtures such as water taps and thermostatic mixers in the Nordic region. The Group’s prominent position has been established through a strong focus on leading technology, high quality, attractive design and environmental friendliness. The Group’s products are mar-keted under the strong and firmly established product brands of Mora Armatur, FM Mattsson and Damixa. To optimally leverage the strength of the Group’s brands, work is under way to more clearly differentiate the position of the three brands in the various price segments of the market.
Thanks to the company’s long-standing history, combined with an innovative and qualitative product portfolio, FM Mattsson Mora Group has developed firm relationships with wholesalers, installa-tion companies, specifiers and clients over time.
FM Mattsson Mora Group has a solid Nordic platform through its own sales companies in Sweden, Norway, Denmark and Finland, and an international presence for future expansion through its own sales companies in Belgium, Hong Kong, China, the Netherlands, Singapore and Germany. The Group’s head office is located in Mora, Sweden.
BUSINESS CONCEPT, CORE VALUES AND FINANCIAL TARGETSBusiness conceptThe Group’s business concept is to develop, manufacture and provide solutions for kitchens and bathrooms, and offer high-value customer service. The offering to the market and customers is based on attractive design, environmentally and health-friendly products, high quality and innovation.
Core values• Customer value: We serve our customers, and their customers.
We produce, market and sell products and solutions that are attractive to both users and our business partners. We listen to our customers’ requests and always respond to their needs. The more value we can generate for our customers, the more likely we are to achieve our pricing vision.
• Commitment: Being committed to your work is important to everyone. We want every employee to use and fully develop their talent, and feel that FM Mattsson Mora Group is an interesting and stimulating workplace.
• Respect: Everyone is different. This is an asset. We value different opinions. We respect the integrity and circumstances of others. We treat our colleagues, customers and shareholders as we would expect them to treat us.
VisionFM Mattsson Mora Group aims to be a global premium supplier and to deliver clean water in an energy-efficient way, using sustainable, modern design with Scandinavian roots.
Financial targets• Annual organic growth of at least 3 percent in net sales over a
business cycle, excluding acquisition effects.• Operating margin (EBIT) of at least 10 percent over a
business cycle.• Annual dividend of approximately 50 percent of profit after tax,
provided that the equity/assets ratio is not lower than 30 per-cent after payment of the dividend.
• An equity/assets ratio of more than 40 percent.
Overall objectiveTo achieve its financial targets, FM Mattsson Mora Group has defined four strategic areas in order to create value for its cus-tomers, to be an attractive employer and to ultimately achieve the vision of delivering clean water:• Growth and profitability• Efficiency• Technology and design• Leadership and employees
Strengths and competitive advantagesThe Group’s main strengths can be summarised as follows:• The Nordic market leader, with well-known brands and 150
years of experience• Strong product portfolio and high rate of innovation• Unique and strong position among business partners• Leader in design, technology and environmentally friendly solutions• Flexible and efficient production• Driver of the industry’s restructuring process• Solid platform for continued growth
150 YEARS OF EXPERIENCEFM Mattsson was founded in 1865 and the first water tap was moulded in 1876. Mora Armatur AB was founded in 1927. The two tap companies were developed in parallel until 2003, when they merged to form FM Mattsson Mora Group. Damixa ApS was acquired in May 2014. Damixa was founded in 1932 and water taps with a Danish design are still manufactured in the company’s factory in Odense, Denmark. The company is the leading supplier in the Danish market for thermostatic mixers and satisfies most of the requirements of homes and public-sector buildings. In 2015, the name of the Parent Company was changed from Ostnor AB to FM Mattsson Mora Group AB.
MARKETFM Mattsson Mora Group’s products command a market-leading position in Sweden, Denmark and Iceland, and a strong position in the rest of the Nordic region. In markets outside the Nordics, the Mora Armatur, FM Mattsson and Damixa brands are primarily niched in specific market segments. Market growth is driven by new construction, as well as refurbishment, maintenance and overhaul, referred to as the RMO sector. The RMO sector is accountable for the majority of sales and is primarily driven by the price trend for residential units. While the market is divided into geographic areas, it can also be divided into customer segments, such as private homes, property companies, industry and the public sector.
33FM MATTSSON MORA GROUP ANNUAL REPORT 2015
ADMINISTRATION REPORT 2015

In Sweden, FM Mattsson Mora Group commands such a large market share that its sales naturally cover all segments. In markets outside Sweden, it is more important, considering the unique char-acteristics of each market and FM Mattsson Mora Group’s strengths, to identify the most attractive customer segments.
RESEARCH AND DEVELOPMENTThe Group and the Parent Company conduct ongoing product development related to technology and design. Product develop-ment is carried out in both Mora, Sweden and Odense, Denmark, by the Group’s own personnel and in cooperation with business partners. The scope of the Group’s development work is deter-mined in the company’s business plan and annual budgets. Costs for product development are recognised directly in profit or loss for the Group and the Parent Company.
Over time, customers – and subsequently FM Mattsson Mora Group – have become more focused on design. The development of products that are not only technologically advanced, but also aesthetically pleasing, is a key focus area for FM Mattsson Mora Group. The Group has both in-house design expertise and external partnerships with design consultants and well-known designers.
PRODUCTIONFM Mattsson Mora Group’s production takes place in its own facility in Östnor, a few kilometres north-west of Mora. Approximately 750,000 mixer taps are produced at the factory each year. The production facility is highly automated, with a total of 80 industrial robots. The final assembly of finished products is largely performed manually. The factory is home to one of the most modern brass foundries in Europe, with two fully automated casting cells. The total product range includes some 6,000 sales items made from moulded, turned and bent components, as well as purchased items.
In addition to the facility in Mora, FM Mattsson Mora Group also leases a production facility in Odense, Denmark, where several of the products in the Damixa brand are assembled. This modern facility is fully focused on the final assembly of finished products.
The distribution of permanent employees in relation to tempo-rary staffing is adapted to order intake and forecasts.
NET SALES AND PROFITKey performance indicatorsSEK million 2015 2014
Net sales 1,112.6 969.0Operating income 85.7 48.3Operating margin, % 7.7 5.0 Profit after financial items 80.7 42.8Cash flow after investments 83.4 –67.8Return on equity, %* 18.4 9.5Earnings per share, SEK* 5.38 2.72* Restated compared with previous financial statements due to a correction.
Net sales amounted to SEK 1,112.6 million (969.0), up 14.8 percent compared with the preceding year. This increase corresponds to organic growth of 6.2 percent. Exchange-rate changes had a positive impact of SEK 4.8 million on net sales.
Operating income totalled SEK 85.7 million (48.3), corresponding to an operating margin of 7.7 percent (5.0). The total improvement in earnings was attributable to the Group’s ongoing efforts to achieve cost savings and to the activities carried out in 2014 in
connection with the integration of the acquired Damixa Group. Profit for the year was charged with costs of SEK 2.7 million for the Group’s 150th anniversary, negative exchange-rate differences of SEK 13.8 million and costs for the stock-exchange listing of SEK 4.9 million. Adjusted for items affecting comparability poster related to the stock-exchange listing, operating income amounted to SEK 90.6 million and the adjusted operating margin to 8.1 percent.
The Group’s depreciation and amortisation totalled SEK 36.9 million (45.5), of which amortisation of intangible assets accounted for SEK 10.6 million (17.7). The decrease in amortisation compared with the preceding year was attributable to the full amortisation of a development project at 31 December 2014.
Net financial items amounted to an expense of SEK 5.0 million (expense: 5.5). Profit before tax amounted to SEK 80.7 million (42.8). The tax expense for 2015 totalled SEK 19.1 million (11.6).
FINANCIAL POSITIONSEK million 2015 2014*
Cash flow from operating activities 117.4 67.2Cash flow from investing activities –34.0 –135.0Cash flow from financing activities –63.8 –19.8Total cash flow 19.7 –87.6Cash and cash equivalents at end of the period 46.1 26.4Equity/assets ratio, % 44.0 42.4Net debt 84.7 135.9Debt/equity ratio, % 24.3 42.3* Restated compared with previous financial statements due to a correction.
Cash flow from operating activities amounted to SEK 117.4 million (67.2). Tax paid totalled SEK 11.9 million (28.6). Net investments had a negative impact of SEK 34.0 million (neg: 135.0) on cash flow. Group cash and cash equivalents, including short-term investments, totalled SEK 46.1 million (26.4) at year-end. Utilised overdraft facil-ities amounted to SEK 0 million (25.7). Interest-bearing net debt totalled SEK 84.7 million at year-end, compared with SEK 135.9 million in December 2014. Loan repayments, including finance leases, were made according to plan in an amount of SEK 3.7 million (11.2). Dividends of SEK 34.3 million (34.3) were paid. Total assets at year-end amounted to SEK 791.5 million (757.4) and inventories totalled SEK 185.8 million (182.3). Current receivables amounted to SEK 198.5 million (183.2), of which accounts receivable accounted for SEK 176.3 million (156.3).
The equity/assets ratio was 44.0 percent (42.4). Equity at the end of the period totalled SEK 348.4 million (321.3), corresponding to SEK 30.44 per share (28.07). The return on equity was 18.4 percent (9.5).
FINANCIAL INSTRUMENTS – BRASS DERIVATIVESDerivatives were measured at fair value (Level 2) according to quoted prices on the London Metal Exchange (LME) and quoted exchange rates at year-end. Derivatives were recognised as other receivables in an amount of SEK 0.0 million (0.6) and as other liabilities in a negative amount of SEK 0.8 million (0.0). Realised hedges had an impact of SEK 0.1 million (neg: 0.3) on operating income. Refer also to Note 3.
INVESTMENTSThe Group’s total investments in property, plant and equipment amounted to SEK 16.5 million (24.4). Excluding business combi-
34 FM MATTSSON MORA GROUP ANNUAL REPORT 2015
ADMINISTRATION REPORT 2015
nations, the Group’s investments in intangible assets amounted to SEK 17.6 million (15.0) and mainly pertained to the capitalisation of development expenditure.
EMPLOYEESThe average number of employees during the year was 545 (553).
RISKS AND UNCERTAINTIESThrough its operations, FM Mattsson Mora Group is exposed to operational and strategic risks, as well as financial risks. Opera-tional and strategic risks include business and liability risk, while financial risks include liquidity, interest-rate and currency risk. FM Mattsson Mora Group continuously seeks to identify and assess the risks to which it is exposed. One of the key operational risks that FM Mattsson Mora Group has identified is its risk exposure to the metals copper and zinc, which are raw materials for the alloy brass. Approximately one-third of FM Mattsson Mora Group’s total expenses for direct materials comprises the brass metal used in the manufacture of proprietary and purchased components. When it comes to commodity prices, the Group’s risk management focuses on avoiding speculation risks and establishing predictability. With respect to FM Mattsson Mora Group’s own brass requirements, this is achieved through short-term agreements and ongoing financial hedges. For purchased components, FM Mattsson Mora Group aims to secure agreements with a low frequency of price changes.
SEASONAL VARIATIONSFM Mattsson Mora Group generally reports a higher proportion of invoicing during the first half of the year. The lower proportion of invoicing in the second half of the financial year is attributable to the fact that July, August and December are normally weak sales months.
ENVIRONMENTAL IMPACT AND SUSTAINABLE DEVELOPMENTFM Mattsson Mora Group promotes corporate social responsibility and has the stated goal of being perceived as the industry leader in environmentally and health-friendly solutions. This philosophy can be found throughout the company, which works systematically and methodically on sustainability issues – in terms of its own operational impact, and by developing products and solutions that contribute to sustainability when they are used.
FM Mattsson Mora Group conduct operations that require permits under the Swedish Environmental Code. FM Mattsson Mora Group’s environmental impact mainly arises from manufacturing, finishing and transport. The aim is to conduct these activities with the smallest pos-sible environmental impact. Areas with the highest priority from an environmental perspective are resource-efficiency and the reduction of hazardous substances. Use of the end products is also a key focus area, in which FM Mattsson Mora Group intends to develop eco-effi-cient products. The company monitors it’s product development and prioritises climate and environmental aspects in order to minimise risks and take a proactive approach to meeting new requirements.
GUIDELINES FOR REMUNERATION OF SENIOR EXECUTIVESThe 2015 AGM decided on guidelines for the remuneration of senior executives. These guidelines are presented in Note 36. There are no proposals to change the principles governing remuneration and other employment conditions for Group Management ahead of the AGM 2016.
CORPORATE GOVERNANCESince FM Mattsson Mora Group is not a listed company, there are no regulatory requirements to apply the Swedish Corporate Gov-ernance Code. FM Mattsson Mora Group has chosen to voluntarily apply several elements of the Swedish Corporate Governance Code. Refer to pages 24-29.
SIGNIFICANT EVENTSNo significant events occurred after the balance-sheet date.
RESEARCH AND DEVELOPMENTThe Group and the Parent Company conduct ongoing product development related to technology and design. Product develop-ment is carried out in both Mora, Sweden and Odense, Denmark, by the Group’s own personnel and in cooperation with business partners. The scope of the Group’s development work is deter-mined in the company’s business plan and annual budgets. Costs for product development are recognised directly in profit or loss for the Group and the Parent Company.
FUTURE OUTLOOKAccording to the Group’s assessment, the market is expected to continue to grow in the coming years. The Group will continue its efforts to realise further synergies following the acquisition of Damixa, as well as its ongoing work to achieve cost savings. FM Mattson Mora Group has not submitted a forecast for 2016.
PARENT COMPANYThe majority of FM Mattsson Mora Group’s operations are conducted in the Swedish Parent Company. Accordingly, the comments presented for the Group also largely apply to the Parent Company. In addition to production, research and development, and sales in the Swedish market, in certain foreign markets and to subsidiaries, the Parent Company also provides management, administrative and IT services for the subsidiaries in the Group.
Net sales in the Parent company amounted to SEK 813.9 million (754.2), of which goods exports accounted for SEK 140.2 million (126.0). Operating income totalled SEK 66.1 million (34.9).
The Parent Company’s investments in property, plant and equip-ment amounted to SEK 13.6 million (23.0). Investments in intangible assets amounted to SEK 5.2 million (0.2).
APPROPRIATION OF PROFITS PROPOSED APPROPRIATION OF PROFITSThe Board of Directors proposes that an ordinary dividend of SEK 3.00 (3.00) per share and an extra dividend of SEK 5.00 per share be paid to the shareholders registered on the record date of 17 May 2016 and that the remaining non-restricted equity be carried forward.
Amount to be paid as dividend to shareholders, SEK 91,560,800.00 Amount to be carried forward, SEK* 1,639,867.18Total non-restricted equity in the Parent Company, SEK 93,200,667.18
* Of which, negative SEK 538,295 to the fair value reserve.
35FM MATTSSON MORA GROUP ANNUAL REPORT 2015
ADMINISTRATION REPORT 2015
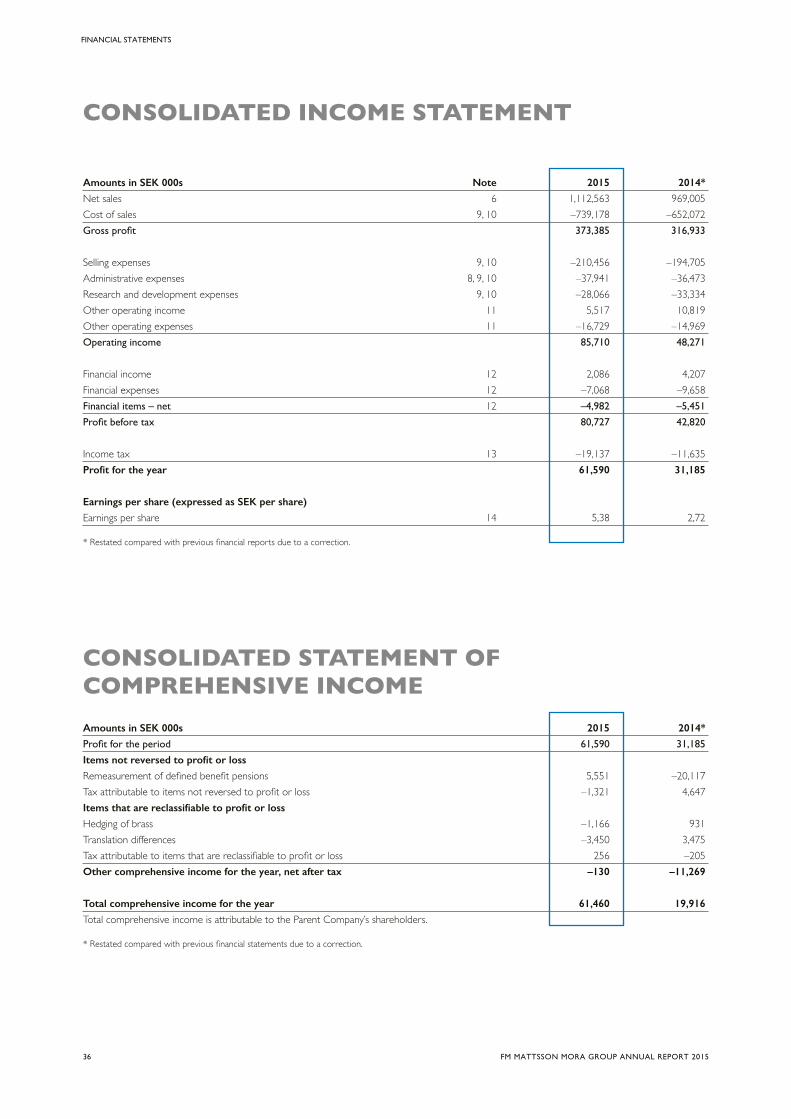
CONSOLIDATED INCOME STATEMENT
Amounts in SEK 000s Note 2015 2014*
Net sales 6 1,112,563 969,005Cost of sales 9, 10 –739,178 –652,072Gross profit 373,385 316,933
Selling expenses 9, 10 –210,456 –194,705Administrative expenses 8, 9, 10 –37,941 –36,473Research and development expenses 9, 10 –28,066 –33,334Other operating income 11 5,517 10,819Other operating expenses 11 –16,729 –14,969Operating income 85,710 48,271
Financial income 12 2,086 4,207Financial expenses 12 –7,068 –9,658Financial items – net 12 –4,982 –5,451
Profit before tax 80,727 42,820
Income tax 13 –19,137 –11,635Profit for the year 61,590 31,185
Earnings per share (expressed as SEK per share)
Earnings per share 14 5,38 2,72
* Restated compared with previous financial reports due to a correction.
CONSOLIDATED STATEMENT OF COMPREHENSIVE INCOMEAmounts in SEK 000s 2015 2014*
Profit for the period 61,590 31,185
Items not reversed to profit or loss
Remeasurement of defined benefit pensions 5,551 –20,117Tax attributable to items not reversed to profit or loss –1,321 4,647Items that are reclassifiable to profit or loss
Hedging of brass –1,166 931Translation differences –3,450 3,475Tax attributable to items that are reclassifiable to profit or loss 256 –205Other comprehensive income for the year, net after tax –130 –11,269
Total comprehensive income for the year 61,460 19,916
Total comprehensive income is attributable to the Parent Company’s shareholders.
* Restated compared with previous financial statements due to a correction.
36 FM MATTSSON MORA GROUP ANNUAL REPORT 2015
FINANCIAL STATEMENTS

CONSOLIDATED BALANCE SHEET
Amounts in SEK 000s Note 31 Dec 2015 31 Dec 2014*
ASSETS
Non-current assets
Intangible assets 15
Goodwill 5 116,299 114,592Capitalised development expenditure 54,272 53,155Other intangible assets – IT 5,820 819Brands 5 34,880 34,583Total intangible assets 211,271 203,149
Property, plant and equipment 16
Buildings and land 45,531 48,073Plant and machinery 50,583 48,151Equipment, tools and installations 22,456 24,421Construction in progress 10,935 18,354Total property, plant and equipment 129,506 138,999
Financial assets
Other receivables 20 2,747 2,729Deferred tax assets 17 17,650 20,686Total financial assets 20,397 23,415
Total non-current assets 361,173 365,563
Current assets
Inventories
Raw materials and consumables 18,704 22,656Goods in progress 93,796 91,415Finished goods and goods for resale 73,284 68,247Total inventories 185,784 182,319
Accounts receivable 20, 22 176,331 156,289Tax assets 3,951 11,235Other receivables 20 5,924 6,031Prepaid expenses and accrued income 12,306 9,029Derivative instruments 20, 21 8 572Cash and cash equivalents 20, 23 46,060 26,403Total current assets 430,366 391,878
TOTAL ASSETS 791,539 757,441
* Restated compared with previous financial statements due to a correction.
37FM MATTSSON MORA GROUP ANNUAL REPORT 2015
FINANCIAL STATEMENTS
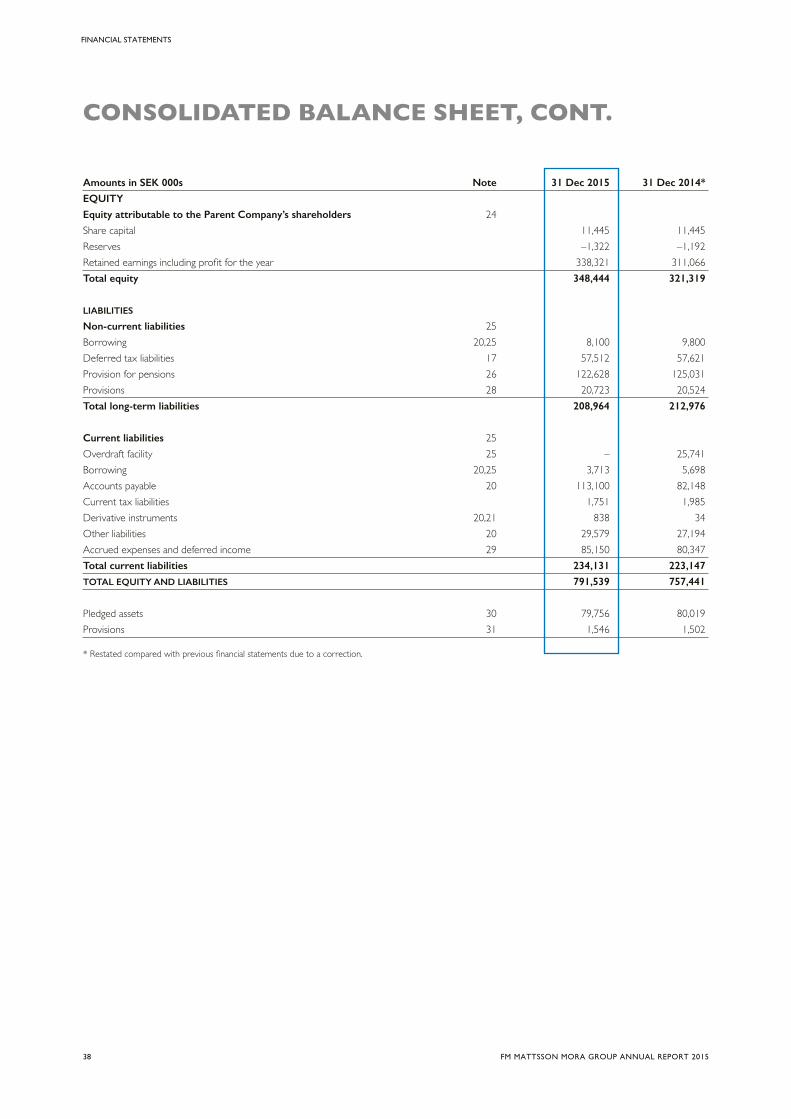
CONSOLIDATED BALANCE SHEET, CONT.
Amounts in SEK 000s Note 31 Dec 2015 31 Dec 2014*
EQUITY
Equity attributable to the Parent Company’s shareholders 24
Share capital 11,445 11,445Reserves –1,322 –1,192Retained earnings including profit for the year 338,321 311,066Total equity 348,444 321,319
LIABILITIES
Non-current liabilities 25
Borrowing 20,25 8,100 9,800Deferred tax liabilities 17 57,512 57,621Provision for pensions 26 122,628 125,031Provisions 28 20,723 20,524Total long-term liabilities 208,964 212,976
Current liabilities 25
Overdraft facility 25 – 25,741Borrowing 20,25 3,713 5,698Accounts payable 20 113,100 82,148Current tax liabilities 1,751 1,985Derivative instruments 20,21 838 34 Other liabilities 20 29,579 27,194Accrued expenses and deferred income 29 85,150 80,347Total current liabilities 234,131 223,147
TOTAL EQUITY AND LIABILITIES 791,539 757,441
Pledged assets 30 79,756 80,019Provisions 31 1,546 1,502
* Restated compared with previous financial statements due to a correction.
38 FM MATTSSON MORA GROUP ANNUAL REPORT 2015
FINANCIAL STATEMENTS

CONSOLIDATED STATEMENT OF CHANGES IN EQUITY Remeasurement of defined Translation Hedging benefit RetainedAmounts in SEK 000s Share capital reserve reserve pension plans earnings Total
Opening balance as of 1 January 2014 11,445 1,030 –355 9,402 314,216 335,738
Comprehensive income
Profit for the year – – – – 31,185 31,185Other comprehensive income – 3,475 726 –15,470 – –11,269Total comprehensive income – 3,475 726 –15,470 31,185 19,916
Transactions with shareholders
Dividends – – – – –34,335 –34,335Closing balance as of per 1 December 2014* 11,445 4,505 371 –6,068 311,066 321,319
Opening balance as of 1 January 2015 11,445 4,505 371 –6,068 311,066 321,319
Comprehensive income
Profit for the year – – – – 61,590 61,590Other comprehensive income – –3,450 –909 4,230 – –130Total comprehensive income – –3,450 –909 4,230 61,590 61,460
Transactions with shareholders
Dividends – – – – –34,335 –34,335Closing balance as of 31 December 2015 11,445 1,055 –538 –1,838 338,321 348,444
* Restated compared with previous financial statements due to a correction.
39FM MATTSSON MORA GROUP ANNUAL REPORT 2015
FINANCIAL STATEMENTS

CONSOLIDATED STATEMENT OF CASH FLOW
Amounts in SEK 000s Note 2015 2014*
Cash flow from operating activities 36
Profit before tax 80,727 42,820Depreciation/amortisation 10 36,895 45,451Other non-cash items –6,233 32,382Income taxes paid –11,878 –28,634Cash flow from operating activities before changes in working capital 99,511 92,019
Cash flow from changes in working capital
Increase/decrease in inventories –3,465 2,356Increase/decrease in operating receivables –17,580 –9,264Increase/decrease in operating liabilities 38,946 –17,913Total changes in working capital 17,901 –24,821
Cash flow from operating activities 117,412 67,198
Cash flow from investing activities
Investments in intangible assets 15 –17,672 –15,013Investments in property, plant and equipment 16 –16,533 –24,398Sales of property, plant and equipment 16 229 92Other financial assets –18 0Acquisitions of subsidiaries 0 –95,704Cash flow from investing activities –33,944 –135,023
Cash flow after investing activities 83,417 –67,825
Cash flow from financing activities
Change in bank overdraft facility –25,741 25,741Repayment of debt –3,685 –11,184Dividends paid –34,335 –34,335Cash flow from financing activities –63,761 –19,778
Decrease/increase in cash and cash equivalents 20,482 –86,194
Cash and cash equivalents at beginning of the year 23 26,403 114,006Exchange-rate differences in cash and cash equivalents –826 –1,409Cash and cash equivalents at year-end 23 46,060 26,403
* Restated compared with previous financial statements due to a correction.
40 FM MATTSSON MORA GROUP ANNUAL REPORT 2015
FINANCIAL STATEMENTS

PARENT COMPANY INCOME STATEMENT
Amounts in SEK 000s Note 2015 2014*
Net sales 6, 7 813,890 754,231Cost of sales 9, 10 –583,340 –553,559Gross profit 230,550 200,672
Selling expenses 9, 10 –97,902 –102,420Administrative expenses 8, 9, 10 –36,095 –37,712Research and development expenses 9, 10 –19,562 –21,808Other operating income 11 5,505 10,775Other operating expenses 11 –16,366 –14,634Operating income 66,130 34,873
Profit/loss from financial items
Profit/loss from participations in Group companies 34 –5,863 0Profit/loss from other securities and receivables accounted for as non-current assets 34 –347 1,318Other interest income and similar income 12 1,579 2,109Interest expenses and similar expenses 12 –4,967 –7,728Total loss from financial items –9,598 –4,301
Profit after financial items 56,532 30,572
Appropriations 35 –6,950 –3,381Tax on profit for the year 13 –15,557 –8,469Profit for the year 34,025 18,722
* Restated compared with previous financial statements due to a correction.
PARENT COMPANY STATEMENT OF COMPREHENSIVE INCOME
Amounts in SEK 000s 2015 2014
Profit for the year 34,025 18,722
Items that are reclassifiable to profit or loss
Hedging of brass –1,166 931Tax attributable to other comprehensive income 256 –205Total comprehensive income 33,115 19,448
41FM MATTSSON MORA GROUP ANNUAL REPORT 2015
FINANCIAL STATEMENTS

PARENT COMPANY BALANCE SHEET
Amounts in SEK 000s Note 31 Dec 2015 31 Dec 2014
ASSETS
Non-current assets
Intangible assets 15
Goodwill 46,306 52,920Intangible assets 5,675 223Total intangible assets 51,981 53,143
Property, plant and equipment 16
Buildings and land 44,909 47,233Plant and machinery 31,884 25,060Equipment, tools and installations 19,986 21,232Construction in progress and advance payments 9,407 17,990Total property, plant and equipment 106,186 111,515
Financial assets
Participations in Group companies 18 110,974 110,977Receivables from Group companies 19 14,840 21,273Deferred tax assets 17 952 1,223Other non-current receivables 19 3,500 3,764Total financial assets 130,266 137,237
Total non-current assets 288,433 301,895
Current assets
Inventories
Raw materials and consumables 18,704 19,130Goods in progress 73,283 76,450Finished goods and goods for resale 33,058 40,945Total inventories 125,045 136,525
Current receivables
Accounts receivable 99,577 83,718Receivables from Group companies 9,775 8,636Tax assets 3,907 11,222Other receivables including derivatives 21 2,735 4,027Prepaid expenses and accrued income 7,376 6,080Total current receivables 123,370 113,683
Cash and cash equivalents 23 25,176 0
Total current assets 273,591 250,208
TOTAL ASSETS 562,024 552,103
42 FM MATTSSON MORA GROUP ANNUAL REPORT 2015
FINANCIAL STATEMENTS

PARENT COMPANY BALANCE SHEET
Amounts in SEK 000s Note 31 Dec 2015 31 Dec 2014*
Equity and liabilities
Equity 24
Restricted equity Share capital 11,445 11,445Statutory reserve 45,844 45,844Total restricted equity 57,289 57,289
Non-restricted equity
Fair value reserve –538 371 Retained earnings 59,713 75,327Profit for the year 34,025 18,722Total non-restricted equity 93,200 94,420
Total equity 150,489 151,709
Untaxed reserves 33 132,592 125,642
Provisions
Provisions for pensions and similar obligations 27, 28 80,988 79,056Guarantee commitments 28 17,700 16,100Deferred taxes 17, 28 3,763 4,349Other provisions 28 914 2,100Total provisions 103,365 101,605
Current liabilities
Bank overdraft facility (agreed credit 120,000 (120,000)) 25 0 25,741Accounts payable 78,223 56,275Liabilities to Group companies 4,594 9,177Other liabilities including derivatives 21 12,878 10,123Accrued expenses and deferred income 29 79,883 71,831Total current liabilities 175,578 173,147
TOTAL EQUITY AND LIABILITIES 562,024 552,103
Pledged assets 30 79,756 80,020Contingent liabilities 31 10,310 22,015
* Restated compared with previous financial statements due to a correction.
43FM MATTSSON MORA GROUP ANNUAL REPORT 2015
FINANCIAL STATEMENTS

PARENT COMPANY STATEMENT OF CHANGES IN EQUITY RESTRICTED EQUITY NON-RESTRICTED EQUITY
Fair value Share Restricted hedging Retained Profit for TotalAmounts in SEK 000s capital reserves reserve earnings the year equity
Opening balance as of 1 January 2014 11,445 45,844 –355 93,724 – 150,658
Adjust due to correction – – – 15,938 * – 15,938*Adjusted opening balance 11,445 45,844 –355 109,662 – 166,596
Comprehensive income
Profit for the year – – – – 18,722 * 18,722*Other comprehensive income – – 726 – – 726Total comprehensive income – – 726 – 18,722 19,448
Transactions with shareholders
Dividends – – – –34,335 – –34,335Closing balance as of 31 December 2014 11,445 45,844 371 75,327 18,722 151,709
Opening balance as of 1 January 2015 11,445 45,844 371 94,049 – 151,709
Comprehensive income
Profit for the year – – – – 34,025 34,025Other comprehensive income – – –909 – – –909Total comprehensive income – – –909 – 34,025 33,116
Transactions with shareholders
Dividends – – – –34,335 – –34,335Closing balance as of 31 December 2015 11,445 45,844 –538 59,714 34,025 150,490
* Restated compared with previous financial statements due to a correction.
44 FM MATTSSON MORA GROUP ANNUAL REPORT 2015
FINANCIAL STATEMENTS

PARENT COMPANY STATEMENT OF CASH FLOW
Amounts in SEK 000s Note 2015 2014
Cash flow from operating activities 36
Profit after financial items 56,532 30,573Adjustment for non-cash items 36 9,099 7,299Depreciation/amortisation 10 25,269 25,022Income tax paid –8,300 –8,941Cash flow from operating activities before change in working capital 82,600 53,953
Cash flow from changes in working capital Increase/decrease in inventories 11,480 –3,755Increase/decrease in operating receivables –17,002 –1,918Increase/decrease in operating liabilities 27,005 3,779Cash flow from operating activities 104,083 52,059
Investing activities
Acquisitions of intangible assets 15 –5,221 –223Acquisitions of property, plant and equipment 16 –13,592 –22,920Divestment of property, plant and equipment 16 9 92Acquisitions of subsidiaries 0 –102,714Divestment of financial assets 834 –18,528Cash flow from investing activities –17,967 –144,293
Financing activities
Change in bank overdraft facility 25 –25,741 25,741Dividends paid –34,335 –34,335Cash flow from financing activities –60,076 –8,594
Cash flow for the year 26,040 –100,828
Cash and cash equivalents at beginning of the year 23 0 102,237
Exchange-rate differences in cash and cash equivalents –864 –1,409Cash and cash equivalents at year-end 23 25,176 0
45FM MATTSSON MORA GROUP ANNUAL REPORT 2015
FINANCIAL STATEMENTS

NOTE 1ACCOUNTING AND MEASUREMENT POLICIES
The consolidated financial statements have been prepared in accordance with the International Financial Reporting Standards (IFRS) issued by the Interna-tional Accounting Standards Board (IASB) and the interpretations issued by the International Financial Reporting Interpretations Committee (IFRIC), as approved by the European Commission for application within the EU. Rec-ommendation RFR 1 Supplementary Accounting Rules for Groups, issued by the Swedish Financial Reporting Board, has also been applied.
The Parent Company applies the same accounting policies as the Group except in the cases listed below under “Parent Company accounting policies.”
The annual accounts and consolidated financial statements were approved for issue by the Board and CEO on 23 March 2016. The consolidated statement of comprehensive income, the consolidated statement of financial position, the Parent Company income statement and the Parent Company balance sheet will be subject to the approval of the AGM on 12 May 2016.
Basis for preparation of the Parent Company and consolidated financial statementsMeasurement policies used when preparing the financial statements Assets and liabilities are recognised at historical cost with the exception of certain financial assets and liabilities, which are measured at fair value. Financial assets and liabilities measured at fair value consist of derivative instruments and available-for-sale financial assets.
Functional currency and reporting currencyThe Parent Company’s functional currency is Swedish kronor (SEK), which is also the presentation currency for the Parent Company and for the Group. This means that the financial statements are presented in Swedish kronor (SEK). All amounts are rounded off and recognised in thousands of kronor (SEK 000s) unless otherwise indicated. Figures in parentheses refer to the preceding year.
Assessments and estimates in the financial statementsThe preparation of financial statements in accordance with IFRS requires that the Board and executive management make estimates and assumptions that affect the company’s earnings and position, as well as the other information pro-vided. These assessments and assumptions are based on historical experience and are reviewed regularly. Assessments made by executive management in the application of IFRS that have a material impact on the financial statements and estimates made and that could entail significant adjustments of the financial statements of subsequent years are described in Note 4.
Amended accounting policies 2015The amended accounting policies applied by the Group as of 1 January 2015 are described below. Other amendments to IFRS with application as of 2015 have had no significant impact on the consolidated financial statements.
In addition, a number of changes have been implemented within the framework of the IASB’s annual improvement project. None of these changes have impacted the consolidated financial statements.
Amended accounting policies 2016 and forward A number of new or amended accounting standards and interpretations will become effective in 2016. These have not been applied prospectively when preparing these financial statements. There are no plans to prospectively apply new standards or amendments that become applicable in the 2017 financial year or subsequent years. In cases where the anticipated effects of application on the financial statements are not described below, FM Mattsson Mora Group has deemed that the standards will not have a material impact on the consolidated financial statements.
IFRS 15 Revenue from Contracts with Customers, the new standard for revenue recognition which is to become effective in 2018, will impact the consolidated financial statements. The initial analysis is that the impact will not be material.
IFRS 9 replaces IAS 39 Financial Instruments and will become effective in 2018. IFRS 16 Leases, the new standard for recognition of leases, will become effective in 2019. An analysis of the impact of the standards on FM Mattsson Mora Group’s consolidated financial statements will be performed in 2016 and subsequent years.
Classification of current and non-current itemsIn FM Mattsson Mora Group, assets and liabilities are divided into current and non-current items. In all significant respects, non-current receivables and liabilities consist of amounts that are expected to fall due for payment after one year, counted from the end of the reporting period. Current receivables and liabilities fall due for payment within one year of the end of the reporting period.
Operating segment reportingThe Group’s operations are divided into operating segments based on the parts of the organisation monitored by the company’s chief operating deci-sion maker. Since Group Management monitors the operations’ earnings and decides on resource allocation on the basis of countries, these constitute the Group’s operating segments. Accordingly, the Group’s internal reporting is structured to enable Group Management to monitor the countries’ perfor-mances and earnings.
Refer to Note 6 on page 54 for an additional description of the division into operating segments and a presentation of the operating segments.
Consolidated financial statements (principles of consolidation)A controlling influence exists if the Parent Company has an influence over the investment object, is exposed or entitled to a variable return on its obligation and can use its influence over the investment to influence this return. The purchase method was used in preparing the consolidated financial statements. The acquisition of subsidiaries is considered a transaction through which the Group indirectly acquires the assets of the subsidiary and assumes its liabilities. An acquisition analysis is conducted to determine the fair value on the acqui-sition date of acquired identifiable assets and assumed liabilities. Transaction fees that arise are recognised directly in profit or loss. Conditional/additional purchase considerations are measured at fair value on the acquisition date. Conditional purchase considerations are remeasured on every reporting occasion with the change recognised in profit or loss. Should the subsidiary’s accounting policies differ from the Group’s, adjustments have been made to the Group’s accounting policies.
Goodwill is not amortised but instead is subject to annual impairment testing. Refer to Note 15.
The financial statements of subsidiaries are included in the consolidated financial statements as of the acquisition date until the time that the controlling influence ceases.
Intra-Group assets and liabilities, revenue and costs are eliminated, as are unrealised gains and losses between Group companies.
Translation of foreign Group companiesThe earnings and financial position of all Group companies that have a functional currency that differs from the reporting currency are translated to the Group’s reporting currency. Assets and liabilities, including goodwill and other con-solidated surplus values and undervalues, for each of the balance sheets are translated from the functional currency of the foreign operation to the Group’s reporting currency, SEK, at the exchange rate prevailing on the balance-sheet date. Revenue and expenses for each of the income statements are translated to SEK at an average exchange rate representing an approximation of the exchange rates in effect at the time of each transaction. Translation differences arising from the translation of foreign operations are recognised in other comprehensive income.
NOTES
46 FM MATTSSON MORA GROUP ANNUAL REPORT 2015
NOTES

RevenueNet salesNet sales are recognised net after VAT and discounts. Revenue from sale of goods is recognised in profit or loss when significant risks and benefits have been transferred to the buyer.
Insurance compensationIn the event of theft or damage to any of the Group’s assets, insurance compensation may be payable, normally minus the deductible. Insurance compensation is recognised as other operating income and the deductible as other administrative expenses in profit and loss. Insurance compensation that has been decided but not paid out at the end of the reporting period is recognised as accrued income in the balance sheet.
Receivables and liabilities in foreign currenciesTransactions in foreign currency are translated to the functional currency at the exchange rate prevailing on the transaction date. The functional currency is the currency in the primary economic environment in which the companies operate. Monetary assets and liabilities in foreign currency are translated to the functional currency at the exchange rate prevailing on the balance-sheet date. Exchange-rate differences arising upon translation are recognised in profit or loss. Non-monetary assets and liabilities recognised at historical cost are translated at the exchange rate prevailing on the transaction date.
LeasingOperating leasesLeases whereby a significant share of the risks and benefits is retained by the lessor are classified as operating leases. Payments made during the leasing period are expensed on a straight line basis over the leasing period. Benefits obtained in connection with the signing of an agreement are recog-nised in profit for the year as a decrease in leasing fees on a straight line basis over the leasing period. Variable fees are expensed in the periods during which they arise.
Finance leasesLeases under which the Group is subject to essentially all economic risks and advantages associated with ownership are classified as finance leases. At the beginning of the leasing period, finance leases are recognised in the balance sheet at the lower of the leased object’s fair value and the present value of minimum leasing fees. The agreements in the Group that have been clas-sified as finance leases pertain to machinery and cars. The minimum leasing fees are divided between interest expenses and repayment of the outstanding debt. Interest expenses are distributed over the leasing period so that each reporting period is charged with an amount corre-sponding to a fixed interest rate for the debt recognised in the particu-lar period. Non-current assets held under financial leases are depreciated using the same period of use as that of owned assets of a similar type.
Financial income and expensesFinancial income comprises interest income on financial investments, dividend income and gains on sales of financial assets. Interest income on financial instru-ments is recognised according to the effective-interest-rate method. Dividend income is recognised when the right to receive dividends has been established. Capital gains from the sale of financial instruments are recognised when the risks and benefits associated with ownership of the instrument have been trans-ferred to the buyer and the Group no longer has control over the instrument.
Financial expenses comprise interest expenses on borrowing, pension liabili-ties and accounts payable, as well as bank fees and other financial expenses. Bor-rowing expenses are recognised in profit or loss applying the effective-interest-rate method, apart from the portion that is directly attributable to purchasing, construction or production of a qualifying asset, since this is included in the cost of the asset. Exchange-rate gains and exchange-rate losses are recognised net.
The effective interest rate is the interest rate that discounts the estimated future cash flow over the expected term of a financial instrument to the recognised net value of the financial asset or liability.
TaxThe Group’s total tax comprises current tax and deferred tax. Tax is recognised in profit for the year except for when the underlying transaction is recognised in other comprehensive income or in equity, in which case the associated tax effect is recognised in other comprehensive income or in equity.
The current tax expense is calculated on the basis of the tax regulations that have been decided or essentially decided on the balance-sheet date in those countries where the Parent Company and its subsidiaries are active and generate taxable revenue. This also includes adjustments of current tax attributable to prior periods.
Deferred tax is recognised, in accordance with the balance sheet method, on all temporary differences arising between the taxable value of assets and liabilities and their carrying amounts in the consolidated financial statements. However, the deferred tax is not recognised if it arises due to a transaction that constitutes first-time recognition of an asset or liability that is not a business combination and that, at the transaction date, affected neither recognised profit nor profit for tax purposes. Deferred tax is calculated applying tax rates that have been decided or announced on the balance-sheet date and that are expected to apply when the particular deferred tax asset is sold or the deferred liability has been settled.
Deferred tax assets on loss carryforwards are recognised insofar as it is probable that future taxable surpluses will be available to offset them against.
Deferred tax assets and liabilities are offset against each other when there is a legal right of offset for the particular tax receivables and tax liabilities and when the deferred tax assets and tax liabilities pertain to taxes lev-ied by one and the same tax authority and pertain to either the same tax subject or different tax subjects, in cases where there is an intention to settle the balances by means of net payment.
Intangible assetsResearch and developmentExpenditure that has arisen during the research phase is expensed as it arises. Expenditure concerning development projects attributable to design and testing of new or improved products, as well as projects for technological and platform development, is recognised as an intangible asset when it satisfies the following criteria: • it is technically possible to complete the product so that it can be used,• the company’s intention is to complete the product and to use or sell it,• the potential to use or sell the product exists,• how the product will generate probable future financial benefits can be demonstrated,
• adequate technical, financial and other resources are available for completing the development and for using or selling the product, and
• the expenditure that is attributable to the product and its development can be reliably calculated.
Intangible assets are recognised at cost less accumulated amortisation. Cost is the sum total of direct and indirect expenditure arising as of the date when the intangible asset satisfies the above criteria. Capitalised costs are primarily generated internally and include direct costs for work performed and directly attributable portions of indirect costs. Amortisation commences when use of the asset can start and it is installed at the place and in the condition intended by executive management, meaning the time when commercial production can commence. The period of use is assessed on the basis of the period during which the anticipated benefits are expected to accrue to the company, meaning the period when production is expected to occur. As a rule, the period of use is not assessed to exceed five years and amortisation occurs on a straight-line basis over this period.
Research and development expenses are included in amortisation. Expend-iture for development and research that do not satisfy the above criteria is expensed as incurred. Expenditure for development that has previously been expensed is not recognised as an asset in subsequent periods.
NOTE 1 CONTINUED
47FM MATTSSON MORA GROUP ANNUAL REPORT 2015
NOTES

Intangible assets – ITAcquired software licenses, with a term exceeding one year, and expenditure for the development of software that is estimated to generate future financial benefits for the Group, are capitalised and amortised over the estimated period of use. Software licenses are capitalised on the basis of the costs that had arisen when the particular software was acquired, placed in operation and adapted to the Group’s operations. The estimated period of use is assessed not to exceed five years and amortisation is applied straight-line over this period. Expenditure for maintenance of software is expensed as it arises.
GoodwillGoodwill constitutes the amount by which the purchase consideration exceeds the fair value of the Group’s percentage of the acquired subsidiary’s identifiable net assets on the date of acquisition. Goodwill arising in connection with the acquisition of subsidiaries is recognised as an intangible asset. Since goodwill is always considered to have an indefinite period of use, it is impairment tested annually to identify any impairment requirement rather than being amortised continuously. Goodwill is recognised at cost less any accumulated impairment losses. Goodwill is allocated among cash-generating units when testing any impairment requirement.
TrademarksExpenditure for acquired trademarks is capitalised and tested on an annual basis to identify potential impairment requirements, rather than being amor-tised continuously. Trademarks are recognised at cost less any accumulated impairment losses.
It is expected that the current trademark can be used for many years and its useful cannot be reliably determined.
Property, plant and equipmentProperty, plant and equipment are recognised as an asset in the balance sheet if it is probable that future financial benefits will accrue to the company and the cost of the asset can be reliably calculated.
Property, plant and equipment are recognised at cost less accumulated depreciation and any impairment losses. Cost includes expenditure that can be directly attributed to the acquisition of the asset, as well as the company’s own time for manufacturing tools.
Additional expenditure is added to the asset’s carrying amount or recog-nised as a separate asset, depending on what is appropriate, only when it is probable that the future financial benefits associated with the asset will accrue to FM Mattsson Mora Group and the cost of the asset can be reliably calculated.
The carrying amount of a replaced part is derecognised from the balance sheet. All other forms of repairs and maintenance are recognised as costs in profit or loss during the period in which they arise.
Each part of property, plant and equipment whose cost is material in relation to the asset’s aggregate cost is depreciated separately. Land is not depreciated.
Depreciation of other assets is applied straight-line as follows:Industrial buildings 25 yearsOther buildings 25 – 50 yearsLand improvements 20 – 26 yearsPlant and machinery 5 – 10 yearsEquipment, tools and installations 3 – 10 yearsOther non-current assets 20 years
The assets’ residual value and period of use are tested at the end of each reporting period and adjusted if necessary. The assets’ carrying amount is immediately impaired to its recoverable amount if the asset’s carrying amount exceeds its estimated recoverable amount. The recoverable amount is the higher of an asset’s fair value less selling expenses and its value in use.
Gains and losses on the sale of property, plant and equipment are deter-mined by means of a comparison between the sales revenue and the carrying amount and are recognised in other operating income or other operating expenses in profit or loss.
Financial instrumentsClassificationThe Group classifies its financial assets and liabilities in the following categories: financial assets and liabilities measured at fair value through profit or loss, loans and receivables, and other financial liabilities. The classification is dependent on the objective for which the financial asset or liability was acquired.
Financial assets and liabilities measured at fair value through profit or lossFinancial assets and liabilities measured at fair value through profit or loss are financial instruments held for resale or identified as an item measured at fair value through profit or loss upon initial recognition. Derivative instruments (currency forward contracts and interest-rate swaps) are classified as being held for resale if they are not identified as hedges. FM Mattsson Mora Group applies hedge accounting in respect of commodity derivatives.
Loans and receivablesLoans and receivables are financial assets that are not derivative instruments, that have fixed or fixable payments and that are not traded on an active market. They are included in current assets with the exception of items that fall due for payment more than 12 months after the balance-sheet date, which are classified as non-current assets. The Group’s “loans and receivables” comprise accounts receivable, cash and cash equivalents and the financial instruments that are recognised among other receivables.
Other financial liabilitiesThe Group’s borrowing, accounts payable and the portion of other current liabilities pertaining to financial instruments are classified as other financial liabilities.
Recognition and measurement Purchases and sales of financial assets are recognised on the transaction date, meaning the date upon which the Group undertakes to buy or sell the asset. Financial instruments are initially recognised at fair value plus transaction costs, which applies to all financial instruments that are not measured at fair value through profit or loss. Financial assets and liabilities measured at fair value through profit or loss are initially measured at fair value in the balance sheet, while attributable transaction costs are recognised in profit or loss. Financial assets are derecognised from the balance sheet when the right to receive cash flows from the instrument has expired or been transferred and the Group has transferred essentially all risks and benefits associated with ownership. Finan-cial liabilities are derecognised from the balance sheet when the contractual obligation has been fulfilled or otherwise extinguished.
Following the acquisition date, financial assets measured at fair value through profit or loss are measured at fair value. Following the acquisition date, loans and receivables and other financial liabilities are recognised at amortised cost, applying the effective-interest-rate method.
Gains and losses deriving from changes in fair value concerning the cate-gory financial assets and liabilities measured at fair value through profit or loss (derivative instruments and endowment policies) are recognised in profit or loss during the period when they arise and are included in operating income or net financial items in profit or loss depending on the character of the item that has been hedged. Hedging of interest payments is recognised in net financial items and hedging of business transactions in operating income. See below concerning recognition when hedge accounting under IAS 39 is applied for hedging of commodity prices.
Offsetting of financial instruments Financial assets and liabilities are offset against each other and the net amount is recognised in the balance sheet when there is a legal right to offset the recognised amounts and there is an intention to settle the items by a net amount or to simultaneously realise the asset and settle the liability.
NOTE 1 CONTINUED
48 FM MATTSSON MORA GROUP ANNUAL REPORT 2015
NOTES

Assets recognised at amortised costs (loans and receivables)At the end of each reporting period, the Group assesses whether there is objective evidence that a financial asset or group of financial assets requires impairment. A financial asset or group of financial assets becomes subject to impairment and is impaired only if there is objective evidence of an impair-ment requirement due to one or more events occurring after the asset was initially recognised and that such events have had an impact on the estimated future cash flows of the financial asset or group of financial assets that can be reliably calculated.
The impairment loss is calculated as the difference between the asset’s car-rying amount and the present value of estimated future cash flows discounted using the financial asset’s original effective interest rate. The asset’s carrying amount is impaired and the impairment amount is recognised in consolidated profit or loss. If the impairment requirement is reduced in a subsequent period and the decrease can be objectively attributed to an event that occurred after recognition of the impairment loss, a reversal of the previously recognised impairment loss is recognised in consolidated profit or loss.
Derivative instruments Derivative instruments are recognised in the balance sheet on the transaction date and are measured at fair value, both initially and in connection with subsequent remeasurement. The profit or loss arising from remeasurement is recognised in operating income when the requirements for hedge accounting have not been met. The entire fair value of a derivative instrument is classified as a non-current asset or a non-current liability when the remaining period to maturity of the hedged item exceeds 12 months and as a current asset or current liability when the remaining period to maturity of the hedged item is less than 12 months.
Hedging of commodity pricesThe Group purchases brass (comprising copper and zinc) for its own produc-tion. A portion of the commodity price of brass is hedged through forward contracts on copper and zinc. The effective portion of changes in the fair value of the forward contracts that meet the requirements for hedge accounting is recognised in other comprehensive income. The profit or loss attributable to the ineffective portion is recognised immediately in profit or loss within operating income.
When the hedged forecast purchase of brass is recognised in inventories, the gains or losses that were previously recognised in other comprehensive income and were thus accumulated in equity are reversed from equity and other comprehensive income. The realised value of the hedge is included in the cost of the brass. These amounts recognised as assets will subsequently be recognised in “cost of sales”.
Hedging of variable interest payments FM Mattsson Mora Group is able to hedge interest payments through inter-est-rate swaps whereby variable interest payments are replaced by fixed interest payments. Since the Group does not meet the requirements for hedge accounting, any changes in fair value are recognised among net financial items in profit or loss.
Hedging of transactions in foreign currency Transactions in EUR, USD, DKK and NOK can be hedged financially through currency forward contracts. FM Mattsson Mora Group does not meet the requirements for hedge accounting. Changes in fair value are recognised in the items “Other operating income” and “Other operating expenses” in profit or loss within operating income.
InventoriesInventories comprise raw materials and consumables, goods in progress and finished products. All goods are recognised at the lower of cost and net real-isable value. The cost of finished products and goods in progress comprises the cost of raw materials, direct labour costs, other direct costs and attrib-utable indirect production costs (based on normal manufacturing capacity) adjusted for effects of hedge accounting. Borrowing costs are not included. Cost is determined using the first-in, first-out (FIFO) method. Net realisable value is the estimated selling price in operating activities less applicable selling expenses. Raw materials, components and other consumables held for use in the manufacture of goods are not impaired to less than cost, assuming that the end product that they are part of is expected to be sold at a price that corresponds to or exceeds cost.
Accounts receivableAccounts receivable are amounts that are to be paid by customers for products sold in operating activities. If payment is expected within one year or earlier, they are classified as current assets. If not, they are recognised as non-current assets.
Accounts receivable are initially measured at fair value and thereafter at amortised cost applying the effective-interest-rate method, less any provision for value depletion.
Cash and cash equivalentsIn both the balance sheet and the statement of cash flows, cash and cash equivalents include cash, bank balances and any short-term investments.
Impairment losses on assetsGoodwill and other assets that have an indefinite period of use, for example goodwill and trademarks, or assets that are not yet ready for use, are not amortised but subject to annual impairment testing. Assets that are depreci-ated/amortised are assessed to determine any value decline whenever events or changes in circumstances indicate that the carrying amount is possibly not recoverable. An impairment loss is determined in the amount by which the asset’s carrying amount exceeds its recoverable amount. The recoverable amount is the higher of an asset’s fair value less selling expenses and its value in use.
When determining impairment requirements, assets are grouped down to the lowest level where separate identifiable cash flows (cash-generating units) exist.
Earnings per shareEarnings per share are calculated based on consolidated profit for the year attributable to the Parent Company’s shareholders and on the weighted average number of shares outstanding during the year.
ProvisionsProvisions differ from other liabilities in that there is a degree of uncertainty concerning when payment will occur or concerning the size of the amount required to settle the provision. Provisions are recognised in the balance sheet when the Group has a legal or informal undertaking due to the occurrence of previous events, it is probable that an outflow of resources will be required to settle the undertaking and a reliable estimate can be made of the amount. Provisions are made in an amount corresponding to the most reliable estimate of the amount required to settle the commitment.
When the outflow of resources is estimated to occur in the distant future, the anticipated future cash flow is discounted and the provision is recognised at present value.
The discount interest rate used before tax reflects a current market assess-ment of the time-dependent value of money and the risks associated with the provision. The increase in the provision that is due to the passing of time is recognised as an interest expense.
Provisions are recognised in the balance sheet under other current and non-current liabilities.
NOTE 1 CONTINUED
49FM MATTSSON MORA GROUP ANNUAL REPORT 2015
NOTES

BorrowingBorrowing is measured initially at fair value, net after transaction costs. Borrow-ing is subsequently recognised at amortised cost and any differences between the amount received (net after transaction costs) and the repayment amount are recognised in profit or loss distributed over the term of the loan applying the effective-interest-rate method.
Accounts payableAccounts payable are obligations to pay for goods and services that have been acquired from suppliers in operating activities. Accounts payable are classified as current liabilities if they become due for payment within one year or earlier. If not, they are recognised as non-current liabilities.
Accounts payable are recognised in nominal amounts. The carrying amount for accounts payable is assumed to correspond to their fair value, since this item is current by nature.
Employee benefitsPension obligationsThe Group has both defined-benefit and defined-contribution pension plans. A defined-contribution pension plan is a pension plan under which the Group pays fixed contributions to a separate legal entity. The Group has no legal or informal obligations to pay additional contributions if this legal entity does not have sufficient assets to pay all benefits to employees that relate to the employees’ service during current or prior periods. A defined-benefit pen-sion plan is a pension plan that is not a defined-contribution plan. A defining characteristic of defined-benefit plans is that they specify an amount for the post-service pension benefit, usually based on one or a number of factors, such as age, period of service and salary.
The liability recognised in the balance sheet for defined-benefit pension plans is the present value of the defined-benefit obligations at the end of the reporting period less the fair value of the plan assets. Defined-benefit pension obligations exist in the Parent Company in Sweden and the subsid-iary in Norway and is calculated annually by independent actuaries applying the projected unit credit method. The present value of the defined-benefit obligation in Sweden is determined by discounting the estimated future cash flows, using the interest rate on housing bonds issued in the currency in which the benefits will be paid, and maturities comparable with the current pension obligation. In Norway, the interest rate for corporate bonds with preferential rights (OMF rate) is used.
Changes in the present value of the obligation that are due to changed actuarial assumptions and differences between the anticipated and actual return on the plan assets are treated as actuarial gains or losses.
For defined-contribution pension plans, the Group pays contributions to publicly or privately administered pension insurance plans on a compulsory, contractual or voluntary basis. The Group has no other payment obligations once these contributions have been paid. The contributions are recognised as personnel costs when they fall due for payment. Prepaid contributions are recognised as an asset insofar as a cash repayment or a decrease in future payments could accrue to the Group.
Remuneration upon notice of terminationRemuneration payments in connection with employment termination are made when an employee has received notice of employment termination from the Group prior to the normal retirement age or when an employee accepts voluntary employment termination in exchange for such payments. A cost for remuneration upon termination of employment is recognised at the earliest date on which the company can no longer rescind the offer to the employee or when the company recognises restructuring costs. Remuneration payments expected to be settled after 12 months are recognised at their present value. Remuneration payments not expected to be fully settled within 12 months are recognised as non-current remuneration.
Bonus plansThe Group recognises a liability and an expense for bonus payments. The Group recognises a provision when there is a legal obligation or an informal obligation due to previous practice.
Current remunerationCurrent remuneration to employees is calculated undiscounted and recognised as an expense when the related services are received.
Statement of Cash FlowsThe Statement of Cash Flows has been prepared according to the indirect method. This means that operating income is adjusted for transactions that have not resulted in cash payments during the period and for any revenue and expenses attributable to the cash flow from investing or financing activities.
Contingent liabilitiesA contingent liability is recognised when there is a possible obligation arising from previously occurring events that are confirmed only by one or more uncertain future events or when there is an obligation that is not recognised as a liability or provision since it is not probable that an outflow of resources will be required.
CorrectionAs indicated in previously published interim reports, a correction has been made in accordance with the regulations of IAS 8.
Deferred tax income was recognised for the third quarter of 2014. Since then, it has been established that this transaction was attributable to an event in Damixa that took place prior to the acquisition. This correction had a negative impact of SEK 18.3 million on equity and profit for the year for 2014, as well as a corresponding impact on goodwill. The correction had an impact of SEK 1.59 on earnings per share for full-year 2014.
NOTE 2PARENT COMPANY ACCOUNTING POLICIES
The Parent Company has prepared its annual accounts in accordance with the Swedish Annual Accounts Act and the Swedish Financial Reporting Board’s recommendation RFR 2 Accounting for Legal Entities. Statements issued by the Swedish Financial Reporting Board for listed companies have also been applied. RFR 2 stipulates that the Parent Company, in the annual accounts for the legal entity, must apply all EU-approved IFRS and statements whenever possible within the scope of the Swedish Annual Accounts Act and the Swed-ish Pension Obligations Vesting Act and taking into account the relationship between accounting and taxation.
Classification and presentation methodsThe income statement and balance sheet are prepared according to the presentation format stipulated by the Annual Accounts Act. The statement of changes in equity follows the Group’s presentation format, but also contains the columns stated in the Annual Accounts Act. The presentation format for the Parent Company has differences in designations, compared with the consolidated financial statements, primarily relating to financial income and expenses, provisions, and items within equity.
Participations in subsidiariesParticipations in subsidiaries are recognised at cost after deduction of any impairment. The cost includes acquisition-related costs and any contingent considerations and changes to these. When there is an indication that partic-ipations in subsidiaries have decreased in value, an estimate of the recoverable amount is made. Impairment is recognised if this amount is lower than the carrying amount. These impairment losses are recognised in the item “Profit/loss from participations in Group companies.”
Leased assetsAll lease arrangements, whether finance or operating leases, are classified as operating leases.
50 FM MATTSSON MORA GROUP ANNUAL REPORT 2015
NOTES
NOTE 1 CONTINUED

NOTE 2 CONTINUED
Intangible assets All product development expenses are expensed in the Parent Company. Major projects for adaptation and installation of software licences are capitalised.
GoodwillGoodwill in the Parent Company refers to the acquisition of goodwill after the merger between FM Mattsson AB and Mora Armatur AB. The estimated period of use is deemed to be 20 years given the established and strong trademarks of both of the companies. Goodwill is amortised on a straight-line basis over the estimated period of use.
Guarantee commitments/Financial guaranteesSome of the Parent Company has signed guarantee commitments for the benefit of subsidiaries. Such an obligation is classified in accordance with IFRS as a financial guarantee agreement. For these agreements, the Parent Company applies the relief rule in RFR 2 (IAS 39, p. 2), and, consequently, recognises the guarantee commitment as a contingent liability. A provision is made when the Parent Company deems it likely that a payment will be required to settle an obligation.
Pension obligationsSome of the Parent Company’s pension obligations are covered through insurance taken out with insurance companies. Other pension obligations are financed through liability accounting in the balance sheet and are not secured through insurance. The capital value of these consists of the present value of future liabilities and is calculated in accordance with actuarial principles. The capital value is recognised as a provision in the balance sheet. The interest portion of the pension liability’s change is recognised as a financial expense. Other pension costs are charged to operating income.
The Parent Company applies other principles for calculating defined-benefit plans financed by liability accounting in the balance sheet, known as unfunded plans, than those stipulated in IAS 19. The Parent Company follows the Swed-ish Pension Obligations Vesting Act and the Swedish Financial Supervisory Authority’s regulations since this is a requirement for making tax deductions. The most significant differences compared with the rules in IAS 19 are how the discount rate is determined, the calculation of defined-benefit obligations taking place based on current salary levels with no assumptions for future salary increases, and actuarial gains and losses being recognised in profit or loss.
Deferred taxAmounts allocated to untaxed reserves constitute taxable temporary differ-ences. However, due to the relationship between accounting and taxation, deferred tax liabilities on untaxed reserves are recognised in a legal entity as part of the untaxed reserves. Also, appropriations in the income statement are recognised including the deferred tax.
CorrectionAn untaxed reserve attributable to buildings was previously recognised in the Parent Company’s balance sheet. This untaxed reserve will now be distributed between deferred tax liability and non-restricted equity. As a result of this correction, untaxed reserves decreased SEK 19.1 million, while deferred tax increased SEK 4.2 million and non-restricted equity rose SEK 14.9 million. The corresponding adjustments to the comparative year were SEK 20.4 million, SEK 4.5 million and SEK 15.9 million, respectively. The correction had a negative impact of SEK 1.3 million on profit before tax in the 2014 income statement and generated a tax effect of SEK 0.3 million. This correction in the Parent Company has not impacted the consolidated financial statements.
NOTE 3FINANCIAL RISK MANAGEMENT
Financial risk factorsThrough its operations, the Group is exposed to a variety of different financial risks: market risk (including currency risk, interest-rate risk and commodity-price risk), credit risk and liquidity risk. All of these risks are managed in accordance with FM Mattsson Mora Group’s financial policy. The Group’s overall strategy focuses on reducing potential unfavourable effects on the Group’s financial earnings. The Group has an opportunity to utilise derivative instruments to reduce certain risk exposure.
Market riskCurrency riskCurrency risk can be divided into translation risk and transaction risk. Trans-lation risk is the risk that the value in SEK in respect of net investments denominated in foreign currencies will fluctuate due to changes in exchange rates. Currency exposure arising from net assets in the Group’s foreign oper-ations is not hedged.
Transaction risk pertains to the impact on net earnings and cash flow due to the value of operating flows in foreign currencies changing in the event of changes in exchange rates.
FM Mattsson Mora Group’s currency policy is to minimise the impact on the Group’s earnings from changes in exchange rates in relation to SEK by concentrating currency exposure to the Parent Company and, to a cer-tain extent, by financially hedging purchases and sales in foreign currency through currency forward contracts. FM Mattsson Mora Group primarily has an inflow of NOK and DKK and a net outflow of EUR and USD. This means that the Group is continuously exposed to transaction risk. 50 percent of contractual flows and/or forecast flows in the Parent Company over a rolling 12-month period are hedged financially per currency. In accordance with policy, the financial exposure of currency accounts in FM Mattsson Mora Group AB may not exceed the value of SEK 5 million per currency and total net exposure may not exceed SEK 10 million.
Exchange-rate differences that have been recognised in profit or loss amount to:SEK 000s 2015 2014
Other operating income/expenses –12,103 –5,958Net financial items –1,699 –2,580Comprehensive income (translation difference) –3,450 3,475Total –17,252 –5,063
The Group has the following translation exposure for accounts receivable and other receivables:SEK 000s 2015 2014
NOK 8,576 8,952DKK 44,877 38,167EUR 29,724 26,713USD 23 632Other currencies 2,020 1,930Total 85,220 76,394
The Group has the following balance-sheet exposure for accounts payable and other liabilities:SEK 000s 2015 2014
NOK 2,717 2,383DKK 21,324 20,574EUR 34,365 26,773USD 5,534 4,738Other currencies 7,203 4,503Total 71,143 58,971
51FM MATTSSON MORA GROUP ANNUAL REPORT 2015
NOTES

52 FM MATTSSON MORA GROUP ANNUAL REPORT 2015
NOTES
NOTE 3 CONTINUED
The Group has the following balance-sheet exposure for cash and cash equivalents and overdraft facilities:SEK 000s 31 Dec 2015 31 Dec 2014
NOK 8,991 8,077DKK 12,476 18,100EUR –1,500 527USD –3,149 –3,668Other currencies 949 2,656Total 17,767 25,692
Sensitivity analysis of operating income: Impact on profit/loss of 10%Local currency, Total change in relation to SEKamounts in SEK 000s net flows without hedging
EUR 3,732 2,822USD –5,064 5,620NOK 37,262 –6,260DKK 13,296 –1,515
* Revaluation of the SEK
Interest-rate riskThe Group has interest-bearing financial assets and liabilities, changes in which linked to market interest rates impact earnings and cash flow from operating activities. Interest-rate risk is defined as the risk that changes in the general interest-rate scenario will have an adverse impact on net earnings. The Group’s interest-rate risk arises through long-term borrowing. Borrowing raised at var-iable interest rates exposes the Group to interest-rate risk in respect of cash flow, which is partly neutralised by cash assets subject to variable interest rates.
FM Mattsson Mora Group’s interest-rate risk policy is designed to reduce the adverse impact of interest-rate changes on the Group’s earnings. Invest-ments may be made with fixed-rate periods of not more than one year. For new borrowing, the Board makes decisions on the management of interest-rate risk. The interest-rate risk associated with borrowing and leasing at variable interest rates is monitored. According to FM Mattsson Mora Group’s policy, interest-rate risk is to be restricted so that the adverse impact on earnings does not exceed SEK 1 million.
The Group can manage the interest-rate risk associated with cash flow by using interest-rate swaps whose financial implication entails that borrowing is converted from variable to fixed interest for a certain part of the bor-rowing. The Group usually raises long-term loans at a variable interest rate and converts these loans through interest-rate swaps to fixed interest rates, which are lower than if the borrowing was raised directly at fixed interest. The interest-rate swaps entail that the Group agrees with other parties, at specified intervals, to swap the difference between interest amounts at fixed contractual interest rates and the variable interest amount, calculated on the contractual nominal amount.
The Group has analysed its sensitivity to interest-rate changes. An imple-mented analysis shows that the impact on earnings of an increase in interest rates by 1.0 percentage point would not be significantly adverse.
Interest attributable to the pension provision has not been taken to account.
Commodity-price riskThe metal raw material used in the self-manufactured and purchased com-ponents accounts for about one-third of FM Mattsson Mora Group’s total costs for direct materials.
In all significant respects, copper accounts for 60 percent and zinc for 40 percent of the cost of metal raw material related to the alloy brass. Accordingly, FM Mattsson Mora Group has considerable risk exposure to changes in the prices of these metal. The consumption of brass amounts to approximately 1,900 tonnes per year. Of this, the recycling of dust and scrap metals from the Group’s own manufacturing accounts for 700 tonnes. The remaining 1,200 tonnes is purchased at market price.
When it comes to commodity prices, risk management focuses on avoiding speculation risks and establishing predictability. This is done through short supply agreements and continuous financial hedges of approximately 25 percent of the following year’s requirement. The policy was amended at the end of 2015 to the effect that hedging is to be made at 50 percent of the following year’s requirement. The hedges made in 2015 remain in place.
For the forthcoming year, FM Mattsson Mora Group requires about 900 tonnes of brass that is not covered by financial hedges, entailing that a change in the price of copper by USD 100 per tonne corresponds to a change in operating income of some SEK 450,000 per year. The corresponding value for zinc would be slightly more than SEK 300,000 per year. In recent years, FM Mattsson Mora Group has seen an increased movement in the market price of brass; over a longer term than one year, FM Mattsson Mora Group is thus exposed to a price risk for brass that it has to manage. FM Mattsson Mora Group’s entire consumption of 1,200 tonnes purchased at market price, as well as, to some extent, the approximately 800 tonnes of brass that is included in components purchased externally thus becomes exposed to the trend in the metal market.
Credit riskCredit risk or counterparty risk is the risk that a counterparty in a financial transaction will not be able to fulfil its obligations on the due date. FM Matts-son Mora Group’s credit risk includes bank balances, financial investments and accounts receivable. FM Mattsson Mora Group’s investment policy is to minimise credit risk by only investing in approved liquid instruments, choosing counterparties with a high credit rating and using highly liquid instruments. Investments can be made in the short term in Swedish treasury bills or com-mercial paper with a rating of K1 or A1 from state-owned companies, Swedish banks and Swedish municipalities.
The counterparty risk concerning bank deposits and derivative instruments is very low because the major Nordic commercial banks are used.
By far the largest financial risk in the Group is the credit risk associated with outstanding accounts receivable. The Group always undertakes a credit check prior to granting credit. For repeat customers, their current and historical payment situa-tion is analysed. In cases where the credit information or payment situation reveals shortcomings, the Group offers delivery after receiving payment in advance.
For the Group’s loan losses, see Note 22. The Group has historically incurred small loan losses.
Liquidity riskLiquidity risk is the risk that the Group lacks cash and cash equivalents for the payment of its undertakings concerning financial liabilities. In order to secure good access to funds for operational activities, the Parent Company is to ensure that sufficient liquid funds are available. The liquidity requirement is calculated in liquidity forecasts. FM Mattsson Mora Group’s strategy is to reduce external borrowing, minimise working capital and create liquidity reserves. The Group’s liquidity reserve can, for example, be created through committed lines of credit which are to amount to at least 10 percent of sales and be sufficient to cover the liquidity requirement for at least 12 months ahead.
At 31 December 2015, the Group had cash and cash equivalents of SEK 46,060,000 (26,403,000). The Group has credit facilities and external borrowing. In other respects, the future strain on liquidity involves accounts payable and other current liabilities. The future strain on liquidity is followed up by means of continuous forecasts:
The Group has the following unutilised credit facilities:SEK 000s 2015 2014
Variable interest rate: – expires within one year 125,579 111,148– expires after more than one year – –Fixed interest rate: – expires within one year – – 125,579 111,148
SEK 000s 2015 2014
Total credit scope 127,294 138,535Utilised credit scope –1,715 –27,387Unutilised credit scope 125,579 111,148

53FM MATTSSON MORA GROUP ANNUAL REPORT 2015
NOTES
NOTE 3 CONTINUED
The table below shows the contractual undiscounted cash flows from the Group’s financial liabilities and net-settled derivative instruments, which com-prise financial liabilities, broken down according to the time, as of the bal-ance-sheet date, remaining until the contractual due date.
SEK 000s Less Between More thanAt 31 December 2014 than 1 year 1 – 5 years 5 years
Liabilities concerning finance leases 6,385 11,084 108Derivative instruments 572 – –Accounts payable and other liabilities 82,148 – – 89,105 11,084 108
SEK 000s Less Between More thanAt 31 December 2015 than 1 year 1 – 5 years 5 years
Liabilities concerning finance leases 3,713 8,100 0Derivative instruments 838 – –Accounts payable and other liabilities 113,100 – – 117,651 8,100 0
Management of capital riskThe Group’s objective concerning the capital structure is to safeguard the Group’s ability to continue its operations, so that it can continue to generate a return to shareholders and value for other stakeholders and maintain an optimal capital structure in order to minimise the cost of capital.
The Group assesses capital on the basis of the debt/equity ratio. This KPI is defined as net indebtedness divided by equity. Net indebtedness is defined as total borrowing (comprising the items short-term borrowing and long-term borrowing in the consolidated balance sheet) less cash and cash equivalents.
SEK 000s 31 Dec 2015 31 Dec 2014
Total borrowing (Note 25) 11,813 41,239Pension liabilities 118,952 121,090Less: Cash and cash equivalents (Note 23) –46,060 –26,403Net debt 84,705 135,926
Equity 348,444 321,319
Debt/equity ratio, % 24 42
* Restated compared with previous financial statements due to a correction.
Calculation of fair valueThe carrying amount, after potential impairment losses, of accounts receivable and other receivables plus accounts payable and other liabilities, is assumed to match these items’ fair value, since they are current by nature.
The financial assets and liabilities measured at fair value in the Group consist of derivative instruments. These instruments are found in Level 2 of the fair value hierarchy, meaning that there is observable data for the asset or the liability either directly through, for example, quoted prices, or indirectly through, for example, derived quoted prices in cases where there are no quoted prices on active markets for identical assets and liabilities.
NOTE 4SIGNIFICANT ESTIMATES AND ASSESSMENTS
Estimates of the value of balance-sheet items and assessments made in the application of accounting policies are evaluated continuously and based on historical experience and other factors, including expectations concerning future events that are considered reasonable under prevailing circumstances.
Significant estimates and assessments for accounting purposesThe Group makes estimates and assumptions regarding the future. The esti-mates for accounting purposes that result from these will rarely, by means of definition, correspond to the actual outcome. The estimates and assumptions that entail a material risk that significant adjustments will be made in the carrying amounts of assets and liabilities during the following financial year are outlined below.
Impairment testing of goodwillOn an annual basis, the Group tests whether any impairment requirement exists for goodwill, in accordance with the accounting policy described in Note 1. Recoverable amounts for cash-generating units have been determined through calculations of value in use. Value in use is based on the cash flows after tax that are estimated to be generated during the units’ remaining life based on the assumption of an eternal life. Certain estimations must be made for these calculations.
At 31 December 2015, goodwill impairment testing gave no indication of an impairment loss. The discount rate is based on the company’s average capital cost. A change in the discount interest rate by 3 percentage points or a decrease in the operating margin by 3 percentage points would not change the outcome of the testing.
Pension benefitsThe present value of pension obligations depends on a number of factors determined on an actuarial basis with the aid of a number of assumptions. The assumptions used to determine the net expenditure (revenue) for pensions include the discount rate. Each change in these assumptions will impact the carrying amount of the pension obligations.
The Group establishes an appropriate discount rate at the end of every year. This is the interest rate used for determining the present value of esti-mated future payments that are expected to be required to settle the pen-sion obligations. When determining an appropriate discount interest rate, the Group takes into account the yields on government and housing bonds that are denominated in the currency in which the remuneration will be paid, and that have maturities corresponding to assessments made for the particular pension obligation.
Other important assumptions concerning pension obligations that man-agement has to make in connection with the actuarial calculation of pension obligations and pension costs depend on the annual rate of increase in labour costs, anticipated employee turnover, anticipated mortality and anticipated annual indexing of pensions.
Valuation of loss carryforwardsOn an annual basis, the Group tests whether any impairment requirement prevails for deferred tax assets pertaining to loss carryforwards. The Group also tests whether it is appropriate to capitalise new deferred tax assets pertaining to the current year’s loss carryforwards. Deferred tax liabilities are recognised only for loss carryforwards that will probably be used to offset future taxable surpluses and taxable temporary differences.
Guarantee reservesThe Group continuously tests the value of guarantee reserves in relation to the calculated requirement. The reserves are posted on the basis of historical statistics on defective products. The guarantee reserve at 31 December 2015 represented 2.0 percent (1.9) of net sales.
*

54 FM MATTSSON MORA GROUP ANNUAL REPORT 2015
NOTES
NOTE 5BUSINESS COMBINATIONS
On 1 May 2014, the Group acquired 100 percent of the shares in Damixa ApS, Denmark’s leading company in the market for kitchen, bathroom and shower fittings, for SEK 103.9 million. Damixa ApS has operations in five countries. The revenue from the Damixa ApS Group, which is included consolidated profit or loss starting from May 2014, amounted to SEK 146.8 million. The Damixa ApS Group also contributed profit of SEK 5.4 million for the same period.
Acquisition-related costs of SEK 2.8 million are included in other external costs in consolidated profit or loss for the 2014 financial year.
The goodwill amount includes the value of synergy effects and employee expertise.
No component of recognised goodwill is expected to be deductible in connection with income taxation. The table below presents a summary of the purchase consideration paid for Damixa ApS and the fair value of acquired assets and assumed liabilities. The acquisition agreement does not contain any condi-tions regarding additional purchase consideration. The acquisition analysis is final.
The Group’s net sales would have been SEK 83.4 million higher and operating income SEK 9.6 million higher if the acquisition had been conducted on 1 January 2014.
SEK 000s
Purchase consideration Cash and cash equivalents 103,875 Total purchase consideration paid 103,875
Carrying amount of identifiable acquired assets and assumed liabilitiesCash and cash equivalents 8,171 Intangible assets 312 Property, plant and equipment 7,965 Inventories 46,701 Accounts receivable and other receivables 55,673 Accounts payable and other liabilities –62,872 Trademarks 34,583 Net deferred tax liability –8,646 Total identifiable net assets 81,887
Goodwill* 21,988
103,875* Restated compared with previous financial statements due to a correction.
NOTE 6OPERATING SEGMENT REPORTING
The Group’s operations are divided into operating segments based on the parts of the organisation monitored by the company’s chief operating deci-sion maker. Since Group Management monitors the operations’ earnings and decides on resource allocation on the basis of countries, these constitute the Group’s operating segments.
Accordingly, the Group’s internal reporting is structured to enable Group Management to monitor the countries’ performances and earnings. The fol-lowing operating segments have been identified:
Nordic region operating segmentThe Nordic region operating segment constitutes a segment since sales in the five countries have similar financial characteristics.• The Nordic markets resemble each other in that the sector known as RMO
accounts for the majority of sales and new construction for a minor propor-tion of sales. Minor variations may be seen between the various countries but they are highly homogeneous on the whole.
• Most of the sales in the particular country are channelled through wholesalers and, in Sweden and Finland, resellers account for only a minor proportion of sales.
• The Group sells all of its three brands in the Nordic region, which is not the case in countries outside the Nordic region.
• The competitive situation is similar in the Nordic markets.• There are a number of macroeconomic and geographical similarities and
considerable integration between the Nordic countries, which distinguish them from the rest of the world.
International operating segmentThe International operating segment constitutes a merger of the sales of the subsidiaries in Germany, the Netherlands, Belgium, Singapore, Hong Kong and China, as well as other export sales, for example, in Australia, the Baltic countries and the UK. The segment has similar financial characteristics since sales are mainly channelled directly to resellers and not via wholesalers.
Nordic regionThis segment includes sales in the following markets: Sweden, Norway, Den-mark, Finland and Iceland. Sales of the company’s products occur through the Parent Company in Sweden, wholly owned subsidiaries in Norway, Denmark and Finland, and a distributor in Iceland. Sales in this segment represented 88 percent of the Group’s total sales during 2015.
Net sales for 2015 amounted to SEK 977,792 thousand (858,165) and operating income to SEK 85,736 thousand (51,403).
InternationalThis segment includes sales in the German, Dutch, Belgian, Chinese, Hong Kong and Singapore markets, where sales are conducted through wholly owned subsidiaries, as well as other markets where sales take place through local distributors. This segment represented 12 percent of the Group’s total sales in 2015.
Net sales for 2015 amounted to SEK 134,771 thousand (110,840) and an operating loss to SEK 26,000 (loss: 3,132 thousand) was reported.
2015 Nordic International Total 2015
Net sales 977,792 134,771 1,112,563Depreciation/amortisation –36,858 –127 –36,895Operating income/loss 85,736 –26 85,710Net financial items –4,983Profit before tax 80,727
2014 Nordic International Total 2014
Net sales 858,165 110,840 969,005Depreciation/amortisation –45,225 –226 –45,451Operating income/loss 51,403 –3,132 48,271Net financial items –5,451Profit before tax 42,820
Net sales are broken down by type of revenue as follows:GROUP 2015 2014
Sale of goods 1,105,169 964,554Sale of services 866 776Other revenue 6,528 3,675Group total 1,112,563 969,005
PARENT COMPANY 2015 2014
Sale of goods 803,114 746,257Sale of services 3,622 763Other revenue 7,153 7,211Parent Company total 813,889 754,231
Net sales Non-current assets
GROUP 2015 2014 2015 2014
Distribution Sweden 693,158 638,355 333,022 334,472Other 419,405 330,650 7,755 7,676Total 1,112,563 969,005 340,777 342,148
Net sales to the Group’s three largest customers corresponds to 60 percent. Total non-current assets other than financial instruments and deferred tax assets that are now located in Sweden amount to SEK 333,022 thousand (334 ,472) and the sum total of such non-current assets located in other countries amounts to SEK 7,755 thousand (7,676).
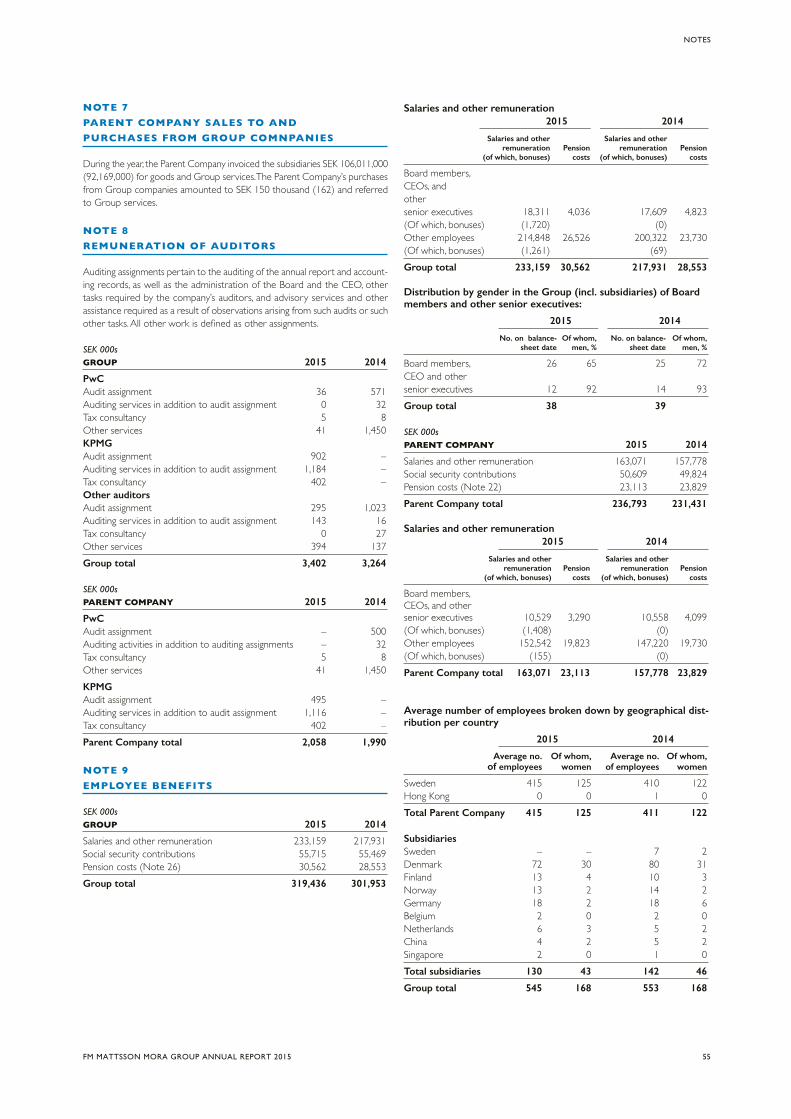
55FM MATTSSON MORA GROUP ANNUAL REPORT 2015
NOTES
NOTE 7PARENT COMPANY SALES TO AND PURCHASES FROM GROUP COMNPANIES
During the year, the Parent Company invoiced the subsidiaries SEK 106,011,000 (92,169,000) for goods and Group services. The Parent Company’s purchases from Group companies amounted to SEK 150 thousand (162) and referred to Group services.
NOTE 8REMUNERATION OF AUDITORS
Auditing assignments pertain to the auditing of the annual report and account-ing records, as well as the administration of the Board and the CEO, other tasks required by the company’s auditors, and advisory services and other assistance required as a result of observations arising from such audits or such other tasks. All other work is defined as other assignments.
SEK 000s GROUP 2015 2014
PwC Audit assignment 36 571Auditing services in addition to audit assignment 0 32Tax consultancy 5 8Other services 41 1,450KPMG Audit assignment 902 –Auditing services in addition to audit assignment 1,184 –Tax consultancy 402 –Other auditors Audit assignment 295 1,023Auditing services in addition to audit assignment 143 16Tax consultancy 0 27Other services 394 137Group total 3,402 3,264
SEK 000s PARENT COMPANY 2015 2014
PwC Audit assignment – 500Auditing activities in addition to auditing assignments – 32Tax consultancy 5 8Other services 41 1,450KPMG Audit assignment 495 –Auditing services in addition to audit assignment 1,116 –Tax consultancy 402 –Parent Company total 2,058 1,990
NOTE 9EMPLOYEE BENEFITS
SEK 000sGROUP 2015 2014
Salaries and other remuneration 233,159 217,931Social security contributions 55,715 55,469Pension costs (Note 26) 30,562 28,553Group total 319,436 301,953
Salaries and other remuneration 2015 2014
Salaries and other Salaries and other remuneration Pension remuneration Pension (of which, bonuses) costs (of which, bonuses) costs
Board members, CEOs, andother senior executives 18,311 4,036 17,609 4,823(Of which, bonuses) (1,720) (0) Other employees 214,848 26,526 200,322 23,730(Of which, bonuses) (1,261) (69) Group total 233,159 30,562 217,931 28,553
Distribution by gender in the Group (incl. subsidiaries) of Board members and other senior executives:
2015 2014
No. on balance- Of whom, No. on balance- Of whom, sheet date men, % sheet date men, %
Board members, 26 65 25 72CEO and other senior executives 12 92 14 93Group total 38 39
SEK 000s PARENT COMPANY 2015 2014
Salaries and other remuneration 163,071 157,778Social security contributions 50,609 49,824Pension costs (Note 22) 23,113 23,829Parent Company total 236,793 231,431
Salaries and other remuneration 2015 2014
Salaries and other Salaries and other remuneration Pension remuneration Pension (of which, bonuses) costs (of which, bonuses) costs
Board members, CEOs, and other senior executives 10,529 3,290 10,558 4,099(Of which, bonuses) (1,408) (0) Other employees 152,542 19,823 147,220 19,730(Of which, bonuses) (155) (0) Parent Company total 163,071 23,113 157,778 23,829
Average number of employees broken down by geographical dist-ribution per country
2015 2014
Average no. Of whom, Average no. Of whom, of employees women of employees women
Sweden 415 125 410 122Hong Kong 0 0 1 0Total Parent Company 415 125 411 122
SubsidiariesSweden – – 7 2Denmark 72 30 80 31Finland 13 4 10 3Norway 13 2 14 2Germany 18 2 18 6Belgium 2 0 2 0Netherlands 6 3 5 2China 4 2 5 2Singapore 2 0 1 0Total subsidiaries 130 43 142 46
Group total 545 168 553 168
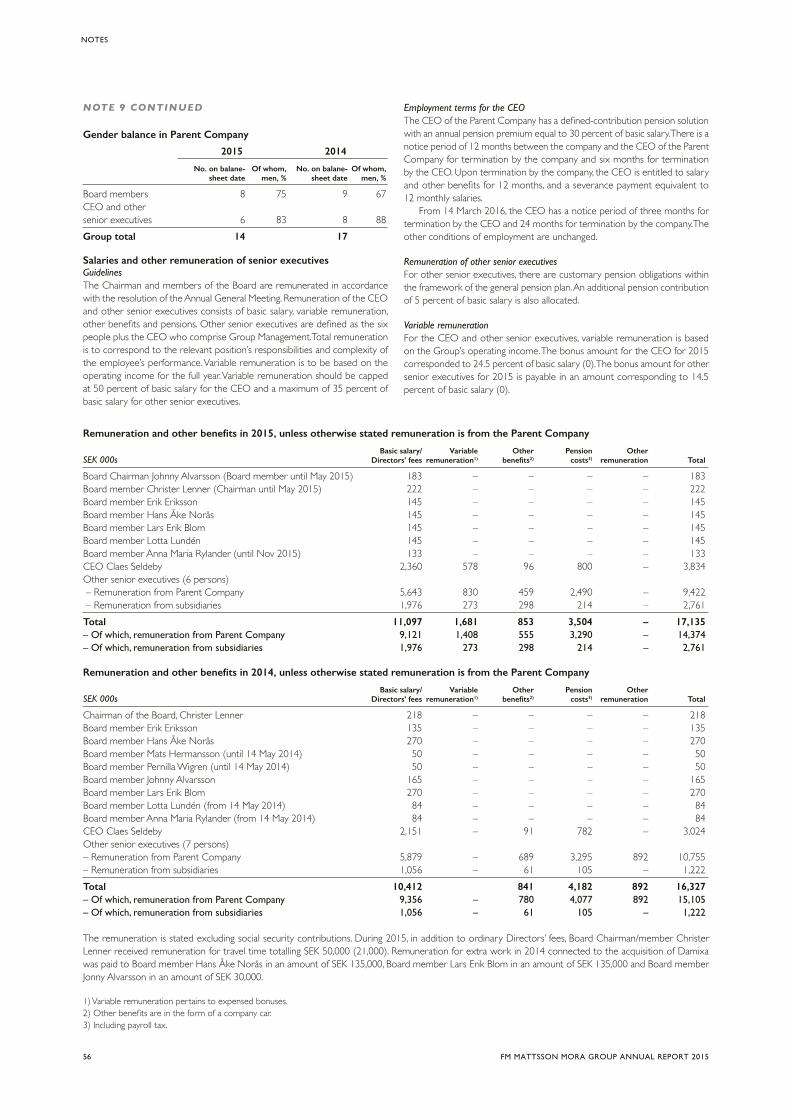
56 FM MATTSSON MORA GROUP ANNUAL REPORT 2015
NOTES
NOTE 9 CONTINUED
Gender balance in Parent Company
2015 2014
No. on balane- Of whom, No. on balane- Of whom, sheet date men, % sheet date men, %
Board members 8 75 9 67CEO and other senior executives 6 83 8 88Group total 14 17
Salaries and other remuneration of senior executives Guidelines The Chairman and members of the Board are remunerated in accordance with the resolution of the Annual General Meeting. Remuneration of the CEO and other senior executives consists of basic salary, variable remuneration, other benefits and pensions. Other senior executives are defined as the six people plus the CEO who comprise Group Management. Total remuneration is to correspond to the relevant position’s responsibilities and complexity of the employee’s performance. Variable remuneration is to be based on the operating income for the full year. Variable remuneration should be capped at 50 percent of basic salary for the CEO and a maximum of 35 percent of basic salary for other senior executives.
Employment terms for the CEOThe CEO of the Parent Company has a defined-contribution pension solution with an annual pension premium equal to 30 percent of basic salary. There is a notice period of 12 months between the company and the CEO of the Parent Company for termination by the company and six months for termination by the CEO. Upon termination by the company, the CEO is entitled to salary and other benefits for 12 months, and a severance payment equivalent to 12 monthly salaries.
From 14 March 2016, the CEO has a notice period of three months for termination by the CEO and 24 months for termination by the company. The other conditions of employment are unchanged.
Remuneration of other senior executivesFor other senior executives, there are customary pension obligations within the framework of the general pension plan. An additional pension contribution of 5 percent of basic salary is also allocated.
Variable remunerationFor the CEO and other senior executives, variable remuneration is based on the Group’s operating income. The bonus amount for the CEO for 2015 corresponded to 24.5 percent of basic salary (0). The bonus amount for other senior executives for 2015 is payable in an amount corresponding to 14.5 percent of basic salary (0).
Remuneration and other benefits in 2015, unless otherwise stated remuneration is from the Parent Company
Basic salary/ Variable Other Pension Other SEK 000s Directors’ fees remuneration1) benefits2) costs3) remuneration Total
Board Chairman Johnny Alvarsson (Board member until May 2015) 183 – – – – 183Board member Christer Lenner (Chairman until May 2015) 222 – – – – 222Board member Erik Eriksson 145 – – – – 145Board member Hans Åke Norås 145 – – – – 145Board member Lars Erik Blom 145 – – – – 145Board member Lotta Lundén 145 – – – – 145Board member Anna Maria Rylander (until Nov 2015) 133 – – – – 133CEO Claes Seldeby 2,360 578 96 800 – 3,834Other senior executives (6 persons) – Remuneration from Parent Company 5,643 830 459 2,490 – 9,422 – Remuneration from subsidiaries 1,976 273 298 214 – 2,761Total 11,097 1,681 853 3,504 – 17,135– Of which, remuneration from Parent Company 9,121 1,408 555 3,290 – 14,374– Of which, remuneration from subsidiaries 1,976 273 298 214 – 2,761
Remuneration and other benefits in 2014, unless otherwise stated remuneration is from the Parent Company
Basic salary/ Variable Other Pension Other SEK 000s Directors’ fees remuneration1) benefits2) costs3) remuneration Total
Chairman of the Board, Christer Lenner 218 – – – – 218Board member Erik Eriksson 135 – – – – 135Board member Hans Åke Norås 270 – – – – 270Board member Mats Hermansson (until 14 May 2014) 50 – – – – 50Board member Pernilla Wigren (until 14 May 2014) 50 – – – – 50Board member Johnny Alvarsson 165 – – – – 165Board member Lars Erik Blom 270 – – – – 270Board member Lotta Lundén (from 14 May 2014) 84 – – – – 84Board member Anna Maria Rylander (from 14 May 2014) 84 – – – – 84CEO Claes Seldeby 2,151 – 91 782 – 3,024Other senior executives (7 persons)– Remuneration from Parent Company 5,879 – 689 3,295 892 10,755– Remuneration from subsidiaries 1,056 – 61 105 – 1,222Total 10,412 841 4,182 892 16,327– Of which, remuneration from Parent Company 9,356 – 780 4,077 892 15,105– Of which, remuneration from subsidiaries 1,056 – 61 105 – 1,222
The remuneration is stated excluding social security contributions. During 2015, in addition to ordinary Directors’ fees, Board Chairman/member Christer Lenner received remuneration for travel time totalling SEK 50,000 (21,000). Remuneration for extra work in 2014 connected to the acquisition of Damixa was paid to Board member Hans Åke Norås in an amount of SEK 135,000, Board member Lars Erik Blom in an amount of SEK 135,000 and Board member Jonny Alvarsson in an amount of SEK 30,000.
1) Variable remuneration pertains to expensed bonuses.2) Other benefits are in the form of a company car.3) Including payroll tax.

57FM MATTSSON MORA GROUP ANNUAL REPORT 2015
NOTES
NOTE 10DEPRECIATION/AMORTISATION BY FUNCTION AND OPERATING EXPENSES SPECIFIED BY TYPE OF COST
GROUP PARENT COMPANY
SEK 000s 2015 2014 2015 2014
Cost of sales 22,013 22,990 14,772 14,098Selling expenses 700 445 119 161Administrative expenses 3,888 4,286 9,926 10,268Research and development expenses 10,620 17,730 453 495Total depreciation/amortisation 36,895 45,451 25,270 25,022
Operating expenses specified by type of cost GROUP
SEK 000s 2015 2014
Cost of sales –548,155 –467,996Employee benefits –311,533 –298,452Depreciation/amortisation –36,895 –45,451Other expenses –130,270 –108,835Total operating expenses –1,026,853 –920,734
NOTE 11OTHER OPERATING INCOME/OTHER OPERATING EXPENSES
GROUP PARENT COMPANY
SEK 000s 2015 2014 2015 2014
Other operating income Gain on acquisition of property, plant and equipment 9 92 9 92Exchange-rate differences 3,954 9,004 3,954 9,001Government assistance – 30 – 30Hedges – 184 – 184Other operating income 1,554 1,509 1,542 1,468Other operating income 5,517 10,819 5,505 10,775
Other operating expenses Loss on divestment of property, plant and equipment –33 –7 –33 –5Exchange-rate differences –16,057 –14,962 –15,916 –14,629Hedges –417 0 –417 0Other operating expenses –222 0 0 0Other operating expenses –16,729 –14,969 –16,366 –14,634
NOTE 12FINANCIAL INCOME / FINANCIAL EXPENSES
GROUP PARENT COMPANY
SEK 000s 2015 2014 2015 2014
Financial income Interest income on bank balances 458 165 47 149Interest income, Group companies – – 25 61Exchange-rate gains 974 1,715 972 1,714Fair value gain on interest-rate swaps – 17 – –Other financial income 654 2,310 536 185Financial income 2,086 4,207 1,580 2,109
Financial expenses Interest expenses on borrowing –3,044 –4,407 –2,923 –4,388Interest expenses on finance leases –166 –95 – –Exchange-rate losses –2,673 –4,295 –1,836 –3,123Other financial expenses –1,185 –861 –208 –217Financial expenses –7,068 –9,658 –4,967 –7,728
All interest income and expenses are attributable to items that are not measured at fair value through profit or loss.

58 FM MATTSSON MORA GROUP ANNUAL REPORT 2015
NOTES
NOTE 13INCOME TAX/TAX ON PROFIT FOR THE YEAR
GROUP PARENT COMPANY
SEK 000s 2015 2014* 2015 2014*
Current tax: Current tax on profit for the year –16,412 –10,984 –14,975 –8,398Adjustments concerning prior years –641 –280 –641 –280Total current tax –17,053 –11,264 –15,616 –8,678
Deferred tax (see Note 17) –2,083 –371 58 210
Income tax –19,136 –11,635 –15,558 –8,469
Income tax on profit differs from the theoretical amount that would have arisen from the use of the weighted average tax rate for the profit of consolidated companies, as follows:
GROUP PARENT COMPANY
% 2015 2014* 2015 2014*
Profit before tax, SEK 000s 80,727 42,819 49,582 28,464Income tax estimated in accordance with national tax rates applying for profit in the particular country 22.7 22.7 22 22Tax effects of: – Non-taxable revenue –1.3 –0.4 –0.3 –0.5– Non-deductible expenses 3.0 3.7 8.4 7.8Effect of changed tax rate –1.2 – – –Tax loss carryforwards for which no deferred tax asset has been recognised 0.5 1.3 – –Tax expense attributable to prior years 0.8 0.3 1.3 1.4Other –0.8 –0.4 – –Effective tax 23.7 27.2 31.4 30.7
* Restated compared with previous financial statements due to a correction.
The weighted average tax rate for the Group is 22.7 percent (22.7). The tax rate for the Parent Company is 22 percent (22).
NOTE 14EARNINGS PER SHARE
Earnings per share are calculated by dividing profit/loss attributable to the Parent Company shareholders by a weighted average of the number of common shares outstanding during the period.
2015 2014*
Attributable to Parent Company shareholders, SEK 000s 61,590 31,185Weighted average number of shares outstanding 11,445,100 11,445,100Earnings per share (SEK) 5.38 2.72
* Restated compared with previous financial statements due to a correction.
NOTE 15INTANGIBLE ASSETS
Intangible OtherSEK 000s assets intangible GROUP under development assets – IT Goodwill* Trademarks Total
2014 financial year Opening carrying amount 55,225 1,146 92,604 – 148,975Purchases/accrual 15,102 223 – – 15,325Acquisition of operations – – 21,988 34,583 56,751Impairment – – – – –Amortisation –17,172 –550 – – –17,722Closing carrying amount 53,155 819 114,592 34,583 203,149

59FM MATTSSON MORA GROUP ANNUAL REPORT 2015
NOTES
Capitalised Other development intangibleNote 15 cont. expenditure assets – IT Goodwill* Trademarks Total
At 31 December 2014 Cost 132,627 15,803 154,276 34,583 337,289Accumulated amortisation –79,472 –14,984 –39,684 – –134,140Carrying amount 53,155 819 114,592 34,583 203,149 2015 financial year Opening carrying amount 53,155 819 114,592 34,583 203,149Purchases/accrual 11,284 5,451 937 – 17,672Acquisition of operations – – – – –Impairment – – – – –Amortisation –10,167 –450 – – –10,617Exchange-rate differences – – 770 297 1,067Closing carrying amount 54,272 5,820 116,299 34,880 211,271
At 31 December 2015 Cost 143,911 21,254 155,984 34,880 356,028Accumulated amortisation –89,639 –15,434 –39,684 – –144,757Carrying amount 54,272 5,820 116,299 34,880 211,271
* Restated compared with previous financial statements due to a correction. OtherSEK 000s intangiblePARENT COMPANY assets – IT Goodwill Total
2014 financial year Opening carrying amount – 59,534 59,534Purchases/accrual 223 – 223Impairment – – –Amortisation – –6,614 –6,614Closing carrying amount 223 52,920 53,143
At 31 December 2014 Cost 223 105,832 106,055Accumulated amortisation – –52,912 –52,912Carrying amount 223 52,920 53,143 2015 financial year Opening carrying amount 223 52,920 53,143Purchases/accrual 5,221 – 5,221Reclassifications 230 – 230Amortisation – –6,614 –6,614Closing carrying amount 5,674 46,306 51,980
At 31 December 2015 Cost 5,674 105,832 111,506Accumulated amortisation – –59,526 – 59,526Carrying amount 5,674 46,306 51,980
Impairment testing of goodwill and trademarksThe value of the Group’s goodwill items and trademarks is calculated exclusively based on the value in use of the cash-generating units (CGU). Value in use is based on the cash flows after tax that are estimated to be generated during the units’ remaining life based on the assumption of an eternal life. The future cash flows used in the calculation of the value in use of each unit are based on the first five years of the 2016 business plan. The calculation of value in use is based on sales growth and gross margin. Assumptions are based on historical experience and assessments regarding the future. Cash flows are subsequently based on an assumption of annual growth of 2 percent (2). The present value of the forecast cash flows has been calculated by applying a discount rate of 9.5 percent after tax (9.2), corresponding to a discount rate before tax of 12.2 percent (11.9). The tested units display the same risk and thus have the same discount rate.
The values in use exceed the carrying amount for all tested units by a discount factor of 9.5 percent. Accordingly, no impairment was required on 31 December 2015.
The future cash flows of all units are based on the same assumptions. Group Management believes that reasonable potential changes in these variables (assumptions) in the calculations would not have such a significant impact that, individually, they would reduce the recoverable amount to an amount lower than the carrying amount.
Goodwill (SEK million) specified by cash-generating unit
Sweden 92.6Denmark 23.7
Trademarks specified by cash-generating unit
Denmark 34.9

60 FM MATTSSON MORA GROUP ANNUAL REPORT 2015
NOTES
NOTE 16PROPERTY, PLANT AND EQUIPMENT
Equipment, SEK 000s Plant and tools, fixtures ConstructionGROUP Buildings machinery and fittings in progress Total
2014 financial year Opening carrying amount 48,490 53,152 24,092 8,971 134,705Purchases 229 3,745 4,581 15,945 24,500Acquisition of operations 169 3,468 2,907 1,382 7,926Sales and disposals – –4,717 –1,872 – –6,589Reclassifications 1,745 2,929 3,167 –7,944 –103Translation differences 4 170 105 – 279Depreciation –2,564 –15,313 –9,852 – –27,729Impairment – – –579 – –579Sales and disposals – 4,717 1,872 – 6,589Closing carrying amount 48,073 48,151 24,421 18,354 138,999
At 31 December 2014 Cost 124,068 466,460 134,448 18,354 748,025Accumulated depreciation –75,995 –418,309 –110,027 – –609,025Carrying amount 48,073 48,151 24,421 18,354 138,999 2015 financial year Opening carrying amount 48,073 48,151 24,421 18,354 138,999Purchases – 5,056 3,878 9,572 18,506Sales and disposals – –1,727 –4,604 – –6,331Reclassifications – 13,236 3,509 –16,975 –230Translation difference –31 –140 –210 –15 –396Depreciation –2,511 –15,012 –8,755 – –26,278Impairment – – –321 – –321Sales and disposals – 1,019 4,538 – 5,557Closing carrying amount 45,531 50,583 22,456 10,936 129,506
At 31 December 2015 Cost 124,038 483,904 141,238 10,936 760,115Accumulated depreciation –78,507 –433,321 –118,782 0 –630,610Carrying amount 45,531 50,583 22,456 10,936 129,506
Plant Equipment, SEK 000s Land and tools, fixtures ConstructionPARENT COMPANY and buildings machinery and fittings in progress Total
2014 financial year Opening carrying amount 48,490 26,402 23,145 8,971 107,008Purchases 229 3,745 3,309 15,739 23,022Sales and disposals – –4,717 –1,872 – –6,589Reclassifications 925 2,929 2,764 –6,721 –103Depreciation –2,411 –8,016 –7,981 – –18,408Sales and disposals – 4,717 1,867 – 6,584Closing carrying amount 47,233 25,060 21,232 17,989 111,514
At 31 December 2014 Cost 123,075 391,347 119,619 17,989 652,030Accumulated depreciation –75,842 –366,287 –98,387 – –540,516Carrying amount 47,233 25,060 21,232 17,989 111,514
2015 financial year Opening carrying amount 47,233 25,060 21,232 17,989 111,514Purchases – 3,086 3,460 7,046 13,592Sales and disposals – –1,019 –463 – –1,482Reclassifications – 12,725 2,672 –15,627 –230Depreciation –2,324 –8,987 –7,345 – –18,656Sales and disposals – 1,019 430 – 1,449Closing carrying amount 44,909 31,884 19,986 9,408 106,187
At 31 December 2015 Cost 123,075 406,139 125,288 9,408 663,910Accumulated depreciation –78,166 –374,255 –105,302 0 –557,723Carrying amount 44,909 31,884 19,986 9,408 106,187

61FM MATTSSON MORA GROUP ANNUAL REPORT 2015
NOTES
The item “Plant and machinery” includes leased objects held by the Group under finance leases in the following amounts: 31 Dec 2015 31 Dec 2014
Cost – finance leases 61,852 61,012Accumulated depreciation –46,291 –40,382Carrying amount 15,561 20,630
The Group leases a number of items of machinery and cars under non-cancellable leases. The leasing periods are between three and seven years. (See also Note 32 Leases).
NOTE 17DEFERRED TAX
GROUP PARENT COMPANY
SEK 000s 2015 2014* 2015 2014*
Deferred tax expenses pertaining to temporary differences – 2,303 –5,763 – –71Deferred tax revenue pertaining to temporary differences 220 5,544 58 –Total deferred tax recognised in profit or loss –2,083 –219 58 –71
* Restated compared with previous financial statements due to a correction.
The change in deferred tax assets and deferred tax liabilities during the year, which has been recognised in profit or loss, without taking into account offsetting implemented within the same tax jurisdiction, is presented below:SEK 000sGROUP Intangible Untaxed InventoriesDeferred tax liabilities Leases assets reserves and other Receivables Total
At 1 January 2014 1,044 12,400 31,398 122 – 44,964Business combinations – 8,646 – – 4,112 12,758Recognised in profit or loss 22 –576 464 –115 – –205Recognised in other comprehensive income – – – 104 – 104At 31 December 2014* 1,066 20,470 31,862 111 4,112 57,621
Recognised in profit or loss –210 –826 1,076 –272 18 –214Recognised in other comprehensive income – – – 105 – 105At 31 December 2015 856 19,644 32,938 –56 4,130 57,512
* Restated compared with previous financial statements due to a correction.
Pension Loss Derivative Inventories Deferred tax assets Buildings obligations Provisions carryforwards instruments and other Total
At 1 January 2014 396 6,645 0 23 103 208 7,375Business combinations 4,787 – 256 2,388 – 2,422 9,853Recognised in profit or loss –1,892 –179 –44 1,264 –3 –236 –1,090Recognised in other comprehensive income – 4,648 – – –100 – 4,548At 31 December 2014 3,291 11,114 212 3,675 0 2,394 20,686 Recognised in profit or loss –1,165 175 188 – 1,108 31 11 –1,868Recognised in other comprehensive income – –1,320 – – 152 – –1,168At 31 December 2015 2,126 9,969 400 2,567 183 2,405 17,650
NOTE 16 CONTINUED
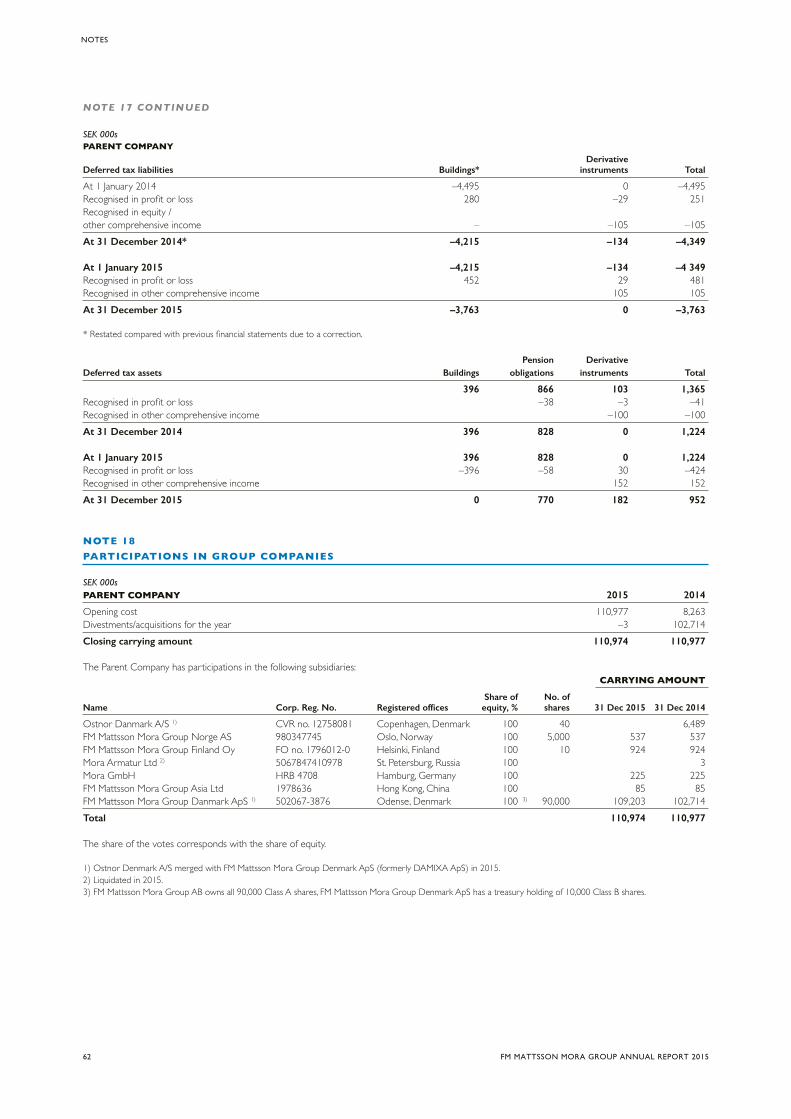
62 FM MATTSSON MORA GROUP ANNUAL REPORT 2015
NOTES
SEK 000sPARENT COMPANY Derivative Deferred tax liabilities Buildings* instruments Total
At 1 January 2014 –4,495 0 –4,495Recognised in profit or loss 280 –29 251Recognised in equity / other comprehensive income – –105 –105At 31 December 2014* –4,215 –134 –4,349 At 1 January 2015 –4,215 –134 –4 349Recognised in profit or loss 452 29 481Recognised in other comprehensive income 105 105At 31 December 2015 –3,763 0 –3,763
* Restated compared with previous financial statements due to a correction.
Pension Derivative Deferred tax assets Buildings obligations instruments Total
396 866 103 1,365Recognised in profit or loss –38 –3 –41Recognised in other comprehensive income –100 –100At 31 December 2014 396 828 0 1,224
At 1 January 2015 396 828 0 1,224Recognised in profit or loss –396 –58 30 –424Recognised in other comprehensive income 152 152At 31 December 2015 0 770 182 952
NOTE 18PARTICIPATIONS IN GROUP COMPANIES
SEK 000sPARENT COMPANY 2015 2014
Opening cost 110,977 8,263Divestments/acquisitions for the year –3 102,714Closing carrying amount 110,974 110,977
The Parent Company has participations in the following subsidiaries: CARRYING AMOUNT
Share of No. ofName Corp. Reg. No. Registered offices equity, % shares 31 Dec 2015 31 Dec 2014
Ostnor Danmark A/S 1) CVR no. 12758081 Copenhagen, Denmark 100 40 6,489FM Mattsson Mora Group Norge AS 980347745 Oslo, Norway 100 5,000 537 537FM Mattsson Mora Group Finland Oy FO no. 1796012-0 Helsinki, Finland 100 10 924 924Mora Armatur Ltd 2) 5067847410978 St. Petersburg, Russia 100 3Mora GmbH HRB 4708 Hamburg, Germany 100 225 225FM Mattsson Mora Group Asia Ltd 1978636 Hong Kong, China 100 85 85FM Mattsson Mora Group Danmark ApS 1) 502067-3876 Odense, Denmark 100 3) 90,000 109,203 102,714Total 110,974 110,977
The share of the votes corresponds with the share of equity.
1) Ostnor Denmark A/S merged with FM Mattsson Mora Group Denmark ApS (formerly DAMIXA ApS) in 2015.2) Liquidated in 2015.3) FM Mattsson Mora Group AB owns all 90,000 Class A shares, FM Mattsson Mora Group Denmark ApS has a treasury holding of 10,000 Class B shares.
NOTE 17 CONTINUED

63FM MATTSSON MORA GROUP ANNUAL REPORT 2015
NOTES
NOTE 19OTHER NON-CURRENT ASSETS
SEK 000sPARENT COMPANY Receivables Group companies Other non-current receivables
At 1 January 2014 Opening carrying amount 2,570 3,939Additional 18,400 Impairment / payment –1,015 Impairment / change in value –175Currency translation 1,318 At 31 December 2014 21,273 3,764
At 1 January 2015 Opening carrying amount 21,273 3,764Additional 976 Impairment / payment –1,081 Impairment / remeasurement –5,981 Impairment / change in value –264Currency translation –347 At 31 December 2015 14,840 3,500 NOTE 20FINANCIAL INSTRUMENTS BY CATEGORY
SEK 000s Financial assets Hedging Loans andGROUP available for sale instruments receivables Total
Balance sheet assets, 31 Dec 2014Accounts receivable 156,289 156,289Other receivables 5 6,154 9,919Derivative instruments 572 572Cash and cash equivalents 26,403 26,403Total 5 572 188,846 193,183
Balance sheet assets, 31 Dec 2015 Accounts receivable 176,331 176,331Other receivables 5 4,454 7,954Derivative instruments 8 8Cash and cash equivalents 46,060 46,060Total 5 8 226,845 230,353
Endowment policies have been measured at fair value at Level 2 using quoted markets prices traded on active markets.
SEK 000s Hedging Other financialGROUP instruments liabilities Total
Balance sheet liabilities, 31 Dec 2014Borrowing (excluding finance leases) 25,741 25,741Liabilities concerning finance leases 15,498 15,498Accounts payable 82,148 82,148Other liabilities 0 0Derivative instruments 34 34Total 34 123,387 123,421
Balance sheet liabilities, 31 Dec 2015 Borrowing (excluding finance leases) 0 0Liabilities concerning finance leases 11,813 11,813Accounts payable 113,100 113,100Other liabilities 19 19Derivative instruments 838 838Total 838 124,932 125,770
The carrying amount of accounts receivable, other receivables, cash and cash equivalents, borrowing, liabilities attributable to finance leases, accounts payable and other liabilities is deemed to be a reasonable approximation of the fair value.

64 FM MATTSSON MORA GROUP ANNUAL REPORT 2015
NOTES
NOTE 21DERIVATIVE INSTRUMENTS
31 Dec 2015 31 Dec 2014
GROUP AND PARENT COMPANY Assets Liabilities Assets Liabilities
Hedging of raw materials on forward contracts 8 838 572 34Total 8 838 572 34
Short-term component 8 838 572 34
Derivative instruments are classified as current assets or current liabilities when the term of the derivative instruments is less than 12 months.
(b) Hedging of raw materials on forward contracts 2015 2014 Nominal amount Market value, Nominal amount Market value, of outstanding SEK 000s of outstanding SEK 000s Tonnes derivatives, SEK 000s 31 Dec 2015 Tonnes derivatives, SEK 000s 31 Dec 2014
Copper 113 4,907 4,439 132 6,160 6,474Zinc 80 1,230 1,086 94 1,437 1,604Total 193 6,137 5,525 227 7,597 8,078
Change in value –612 481Gain/loss on realised hedges 99 –293Impact on profit for the year of hedge accounting: Other operating income 184Other operating expenses –417
NOTE 22ACCOUNTS RECEIVABLE
SEK 000s GROUP 31 Dec 2015 31 Dec 2014
Accounts receivable 176,777 156,880Less: provision for doubtful receivables –446 –591Accounts receivable – net 176,331 156,289
At 31 December 2015, taking the provision for doubtful receivables into account, accounts receivable of SEK 37,640,000 (28,598,000) were past due. The past due receivables pertain to a number of customers who have not shown any payment difficulties to date.
The age analysis of past due but not impaired accounts receivable was as follows:SEK 000s 31 Dec 2015 31 Dec 2014
1–30 days 36,291 26,18331–60 days 689 1,337> 61 days 660 1,078Total past due accounts receivable 37,640 28,598
Changes in the provision for doubtful receivables were as follows:SEK 000s 2015 2014
At 1 January 591 155Provision in acquired companies – 944Provision for doubtful receivables 1 –Receivables written off during the year that are not enforceable –20 –90Reversed unutilised amount –126 –418At 31 December 446 591
Allocations to the particular reversals of provisions for doubtful receivables are included in the item selling expenses in profit or loss. The maximum exposure to credit risk on the balance-sheet date is the carrying amount of accounts receivable shown above. On the balance-sheet date, no collateral or other guarantees had been provided for outstanding accounts receivable.
NOTE 23CASH AND CASH EQUIVALENTS/CASH AND BANK BALANCES
Cash and cash equivalents in the balance sheet and cash flow statement include the following items: SEK 000s GROUP 31 Dec 2015 31 Dec 2014
Cash and bank balances 46,060 26,403Group total 46,060 26,403
PARENT COMPANY 31 Dec 2015 31 Dec 2014
Cash and bank balances 25,176 –Parent Company total 25,176 0
NOTE 24EQUITY
Translation reserveThe translation reserve encompasses all exchange-rate differences that arise on translation of the financial statements of foreign operations that prepare their financial statements in a different currency than the currency in which the consolidated financial statements are presented. The Parent Company and Group present their financial statements in Swedish kronor (SEK).
Hedge reserveThe hedge reserve encompasses the effective portion of the accumulated net change in the fair value of a cash-flow instrument attributable to hedging transactions that have not yet occurred.

65FM MATTSSON MORA GROUP ANNUAL REPORT 2015
NOTES
Share capital and other contributed capitalSEK 000sPARENT COMPANY Class A shares Class B shares No. of shares Share capital
At 31 December 2010 22,890 91,561 114,451 11,445At 31 December 2011 2,289,000 9,156,100 11,445,100 11,445Conversion –228,800 228,800 11,445,100 Redemption –457,900 –457,900 –458Issue 457,900 457,900 458At 31 December 2012 2,060,200 9,384,900 11,445,100 11,445Conversion –14,300 14,300 11,445,100 At 31 December 2013 2,045,900 9,399,200 11,445,100 11,445At 31 December 2014 2,045,900 9,399,200 11,445,100 11,445At 31 December 2015 2,045,900 9,399,200 11,445,100 11,445
The Class A shares carry voting rights of ten votes per share and the Class B shares carry voting rights of one vote per share. All of the shares that have been issued by the Parent Company are fully paid. In accordance with the dividend policy adopted by FM Mattsson Mora Group’s Board of Directors, ordinary div-idends to shareholders are to correspond to approximately 50 percent of profit for the year after tax, on condition that the equity/assets ratio after payment of the dividend amounts to at least 30 percent. Exceptions may be made in special circumstances, such as acquisitions. Consideration is also to be given to FM Mattsson Mora Group’s capital requirements, earnings, financial position, capital adequacy requirements and the prevailing economic conditions. For the 2015 financial year, the Board proposed an ordinary dividend of SEK 3 per share, totalling SEK 34.3 million, and an extra dividend of SEK 5 per share, totalling SEK 57.2 million. A dividend of SEK 3 per share was paid for the 2013 and 2014 financial years. No changes in the Group’s capital management took place during the year.
NOTE 25BORROWING
SEK 000sGROUP 31 Dec 2015 31 Dec 2014
Long-termLiabilities concerning finance leases (See Note 32) 8,100 9,800Short-term Overdraft facilities (agreed credit 127,294 (138,535)) – 25,741Liabilities concerning finance leases (See Note 32) 3,713 5,698Total borrowing 11,813 41,239
Covenants have been provided concerning the Group’s equity/assets ratio, which must not fall below 25 percent.
PARENT COMPANY 31 Dec 2015 31 Dec 2014
Short-term Overdraft facilities (agreed credit 120,000 (120,000)) 0 25,741Total borrowing 0 25,741
The overdraft facilities were extended on 8 February 2016 to amount to a maximum of SEK 200 million.
NOTE 26PENSION PROVISIONS
SEK 000sGROUP 31 Dec 2015 31 Dec 2014
Obligations in the balance sheet for :Pension benefits, defined-benefit plans(incl. special payroll tax), net 118,952 121,090Other pension obligations, insured 3,676 3,941Total pension obligations (incl. special payroll tax) 122,628 125,031 Recognition in profit or loss concerning: Costs for defined-benefit pension plans (incl. special payroll tax) 8,982 9,048Costs for defined-contribution pension plans (incl. special payroll tax) 21,580 19,505Total pension costs 30,562 28,553
The pension obligations have been secured through provisions in the balance sheet in combination with pension credit insurance.
Defined-benefit pension plansWithin the Group, there are defined-benefit pension plans in Sweden and Norway under which the employees are entitled to post-service benefits based on final pay and period of service.
GROUP 31 Dec 2015 31 Dec 2014
Present value of funded obligations 12,569 13,089Fair value of plan assets –11,887 –10,600Employer’s contribution 96 351Net debt pertaining to funded obligations 778 2,841
Present value of unfunded obligations 110,197 109,828Net debt pertaining to unfunded obligations 110,197 109,828
Special payroll tax 7,978 8,421
The change in the defined-benefit obligation during the year was as follows:
GROUP 2015 2014
At beginning of the year 122,917 101,342Current-year service cost 4,789 4,075Other corrections – move to ITPK – –15Interest expenses 3,421 4,151Actuarial losses(+)/gains(–)– changed financial assumptions –3,232 18,611– experience-based adjustments –376 –2,262Exchange-rate differences –1,275 –71Benefits paid –3,478 –2,914At year-end 122,766 122,917
The change in the fair value of plan assets during the year was as follows:GROUP 2015 2014
At beginning of the year 10,600 9,446Return according to discount rate 315 411Pensions paid and administrative expenses –257 –275Return on plan assets excluding interest income 814 –154Exchange-rate differences –968 –57Contributions from employer 1,383 1,229At year-end 11,887 10,600
NOTE 24 CONTINUED

66 FM MATTSSON MORA GROUP ANNUAL REPORT 2015
NOTES
NOTE 26 CONTINUED
The collective funding ratio comprises the market value of Alecta’s assets as a percentage of the insurance undertakings calculated in accordance with Alecta’s actuarial methods and assumptions, which do not correspond with IAS 19. At year-end 2015, Alecta’s surplus in the form of the collective funding ratio amounted to 153 percent (2014: 143).
The plan assets comprise the following:GROUP 31 Dec 2015 31 Dec 2014
Shares 1,081 1,049Interest-bearing securities 8,835 7,738Property 1,639 1,590Other 332 223Total 11,887 10,600
% 2015 2014
The actual return on plan assets amounted to: 3,3 3,0
The expected long-term return for 2015 is recognised for 2015.
The amounts recognised in profit or loss in respect of defined-benefit plans are as follows:GROUP 2015 2014
Current-year service cost 4,789 4,075Interest expenses 3,421 4,151Expected return on plan assets –315 –411Employers’ contributions and administrative expenses 202 147Special payroll tax 885 1,086Total (included in personnel costs, Note 9) 8,982 9,048
The total cost of SEK 8,982,000 (9,048,000) is included in the items “Cost of sales”, “Selling expenses”, “Administrative expenses” and “Research and development expenses”.
MortalityAssumptions concerning mortality are based on public statistics and experience in each country (for Sweden since Norway represents such a small amount).On the balance-sheet date, the anticipated number of years of life remaining at retirement at 65 years of age were as follows: 2015 2014
Men 23 23Women 25 25
At 31 December 2015, the average term of the obligation was 16 years (25).
The principal current assumptions used were as follows: 2015 2014
Discount rate, % 2.9 2.75Expected return on plan assets, % 3.3 4.1Future salary increases, % 3.0 3.0Future pension increases, % 1.5 1.5
Sensitivity analysisThe table describes the effect of potential changes in actuarial assumptions on the recognised defined-benefit plan at year-end, all other assumptions remaining unchanged. Decrease Increase
Discount rate, (0.5 percent change) 10,130 –8,904Salary (0.5 percent change) –4,535 5,924Inflation (0.5 percent change) –6,365 6,966Life expectancy (1 year change) –3,802 3,798
The defined-benefit pension obligations for old-age and family pensions for salaried employees in Sweden under the IPT2 plan are secured through insurance with Alecta. For the 2015 financial year, the company did not have access to sufficient information to recognise the plan as a defined-benefit plan. Accordingly, the ITP 2 pension plan secured though insurance with Alecta is recognised as a defined-contribution plan. Expected contributions in the next reporting period for ITP 2 insurance secured with Alecta amount to SEK 658,000 (2015: 645,000).
NOTE 27PENSION PROVISIONS AND SIMILAROBLIGATIONS IN THE PARENT COMPANY
The company’s pension plans are stated in the description provided in Note 3 for the Group. Pension provisions were as follows:SEK 000s 31 Dec 2015 31 Dec 2014
Provisions according to the PensionObligations Vesting Act – FPG/PRI pensions 77,312 75,115Provisions outside the rules of the Pension Obligations Vesting Act 3,676 3,941Total pension provisions 80,988 79,056
Specification of changes in the balance sheet relating to proprietary pensions: 2015 2014
Net liabilities at beginning of year attributable to pension obligations 75,115 70,747Own proprietary pension costs recognised in profit or loss 5,533 7,231Pension payments –3,336 –2,863Net liabilities at year-end 77,312 75,115
Net liabilities according to the above are recognised in their entirety under the item “Pension provisions and similar obligations” in the balance sheet. Specification of pension expenses and revenue for the period:SEK 000s 2015 2014
Proprietary pensions Expenses for earning pensions, etc. 2,713 3,001Interest expense (estimated discount effect) 2,820 4,230Profit effect of redemption of obligations, etc. 0 0Proprietary pension costs excluding taxes 5,533 7,231Other pension costs 13,592 12,549Special payroll tax on pension costs 3,988 4,049Total pension costs 23,113 23,829
Recognised net expense is distributed as follows between the income statement items: 2015 2014
Cost of sales 5,866 5,132Selling expenses 7,396 6,105Administrative and research and development expenses 7,031 8,362Financial items 2,820 4,230Recognised net expense 23,113 23,829
The principal actuarial assumptions used were as follows:Gross discount rate, 4.0 percent (4.0). The undertakings were calculated based on salary levels applicable on every balance-sheet date. The expected payments of defined-benefit pension plans for the next year amount to SEK 3,595,000.

67FM MATTSSON MORA GROUP ANNUAL REPORT 2015
NOTES
NOTE 28PROVISIONS
Removal andSEK 000s restorationGROUP Guarantees of land Total
At 1 January 2014 16,300 100 16,400Recognised in profit or loss: – additional provisions 3,124 2,000 5,124– reversed unutilised amount –200 – –200Utilised during the year –800 – –800At 31 December 2014 18,424 2,100 20,524 At 1 January 2015 18,424 2,100 20,524Recognised in profit or loss – – –– additional provisions 1,600 – 1,600– reversed unutilised amount – – –Utilised during the year –215 –1,186 –1,401At 31 December 2015 19,809 914 20,723
SEK 000sGROUP 2015 2014
Provisions comprise:Short-term component 1,971 3,639Long-term component 18,752 16,885Total 20,723 20,524
SEK 000s Deferred Restoration PensionPARENT COMPANY tax Guarantees of land obligations Other Total
At 1 January 2014 – 16,300 100 74,881 0 91,281Recognised in profit or loss: – additional provisions 134 – 1,700 4,175 300 6,309– reversed unutilised amount – –200 – – – –200Utilised during the year – – – – – –At 31 December 2014 134 16,100 1,800 79,056 300 97,390 At 1 January 2015 134 16,100 1,800 79,056 300 97,390Recognised in profit or loss: – additional provisions 3,763 1,600 – 2,197 – 7,560– reversed unutilised amount – – – – – –Utilised during the year –134 – –886 –265 –300 –1,585At 31 December 2015 3,763 17,700 914 80,988 0 103,365
SEK 000sPARENT COMPANY 2015 2014
Provisions comprise:Short-term component 914 2,234Long-term component 102,451 95,156Total 103,365 97,390
GuaranteesThe Group continuously tests the value of provisions in relation to the calculated requirement. The reserves are posted on the basis of historical statistics on defective products. The guarantee reserve at 31 December 2015 accounted for 1.6 percent (1.9) of net sales. The guarantee period is two to five years.

68 FM MATTSSON MORA GROUP ANNUAL REPORT 2015
NOTES
NOTE 29ACCRUED EXPENSES AND DEFERRED INCOME
SEK 000sGROUP 31 Dec 2015 31 Dec 2014
Accrued salaries 7,281 5,049Accrued holiday pay 20,660 20,612Accrued social security contributions 8,365 9,571Other items incl. customer bonuses and discounts 48,844 45,116Group total 85,150 80,347
SEK 000sPARENT COMPANY 31 Dec 2015 31 Dec 2014
Accrued salaries 7,042 4,919Accrued holiday pay 18,683 18,498Accrued social security contributions 7,968 9,054Other items incl. customer bonuses and discounts 46,190 39,360Parent Company total 79,883 71,831
NOTE 30PLEDGED ASSETS
SEK 000sGROUP AND PARENT COMPANY 31 Dec 2015 31 Dec 2014
Concerning pension provisions and similar commitments – Other non-current receivables 3,496 3,760Concerning liabilities to credit institutions – Property mortgages 17,750 17,750– Floating charges 58,510 58,510Group and Parent Company total 79,756 80,020
NOTE 31CONTINGENT LIABILITIES
SEK 000sGROUP 31 Dec 2015 31 Dec 2014
Other contingent liabilities 1,546 1,502Group total 1,546 1,502
In connection with the extension of the company’s credit insurance with Försäkringsbolaget PRI Pensionsgaranti for the company’s pension liability, collateral was pledged for the insurance. The collateral comprises excess col-lateral in chattel mortgage deeds and excess collateral in property mortgages on fixed property.
SEK 000sPARENT COMPANY 31 Dec 2015 31 Dec 2014
Contingent liabilities for the benefit of other Group companies 8,764 20,513Other contingent liabilities 1,546 1,502Parent Company total 10,310 22,015
NOTE 32LEASES
Finance leasesThe Group’s finance lease arrangements are for machinery and cars. The leasing periods for machinery are between five and seven years. The lease can be prematurely redeemed or redeemed at an established residual value at the end of the leasing period. Vehicles are normally leased for three years. Leased vehicles can be prematurely redeemed during the leasing period. Leases for vehicles are extended unless the rules for serving notice are applied. There is no subleasing.
Obligations to pay future finance leasing fees are recognised as non-current and current liabilities. The minimum leasing fees are divided between interest expenses and repayment of the outstanding debt. Variable fees are expensed in the periods during which they arise. The interest rates vary according to STIBOR one month and STIBOR three months.
Future minimum leasing fees in accordance with non-cancellable finance leases concerning amounts falling due for payment at the end of the reporting period were as follows:SEK 000sGROUP 2015 2014
Within one year 3,996 6,101Later than one year but within five years 8,406 10,391Later than five years – –Group total 12,402 16,492
Finance lease liabilities fall due for payment as follows: Minimum GROUP leasing fees Interest Principal
2015Within one year 3,996 283 3,713Between one and five years 8,406 306 8,100Later than five years – – –
2014Within one year 6,101 403 5,698Between one and five years 10,390 590 9,800Later than five years – – –
Operating leasesThe Group and the Parent Company’s operating leases mainly refer to fork-lifts, vehicles, office premises, servers and telephone exchanges. There is no subleasing. Forklifts are leased for five or six years. Leases for office premises, servers and telephone exchanges are extended unless the rules for serving notice are applied.
Future minimum leasing fees in accordance with non-cancellable operating leases concerning amounts falling due for payment at the end of the reporting period were as follows:SEK 000sGROUP 2015 2014
Within one year 11,295 9,735Later than one year but within five years 20,644 14,566Later than five years 8,647 –Group total 40,586 24,302
During the financial year, costs for operating leases in the Group amounted to SEK 19,388,000 (17,541,000).SEK 000sPARENT COMPANY 2015 2014
Within one year 5,719 3,834Later than one year but within five years 14,189 3,645Later than five years 8,647 –Parent Company total 28,556 7,479
During the financial year, costs for operating leases in the Parent Company amounted to SEK 4,371,000 (7,317,000).
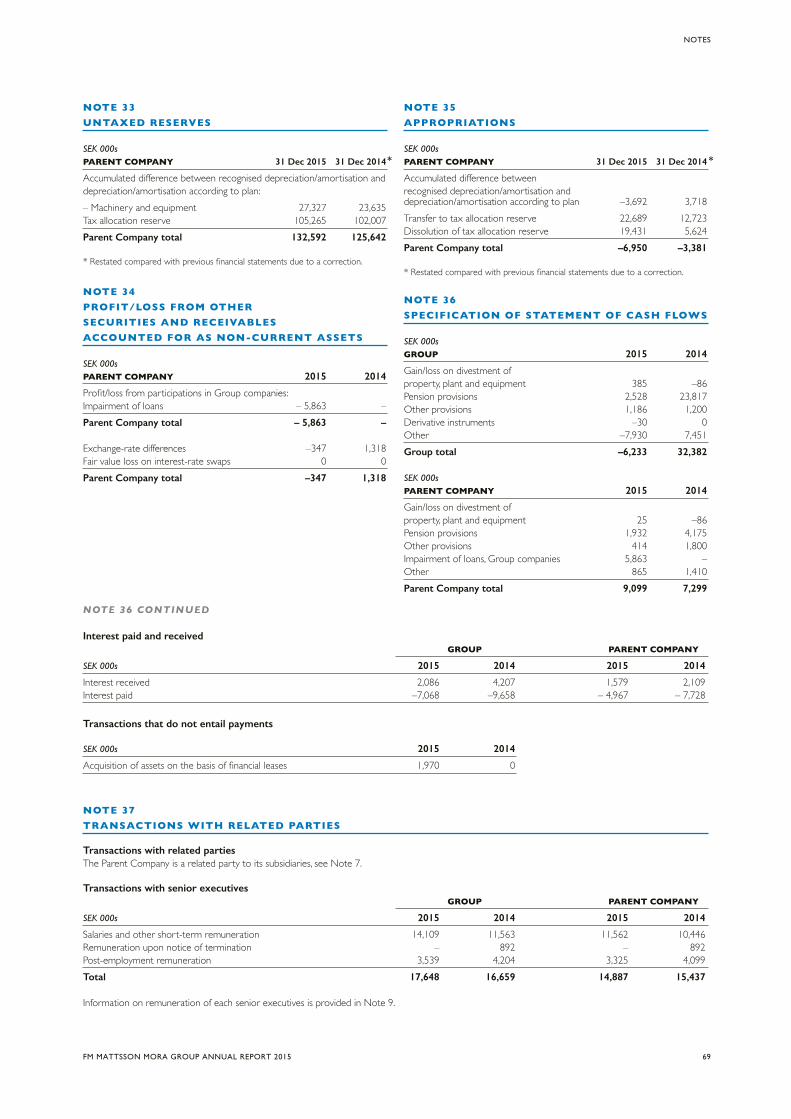
69FM MATTSSON MORA GROUP ANNUAL REPORT 2015
NOTES
NOTE 33UNTAXED RESERVES
SEK 000sPARENT COMPANY 31 Dec 2015 31 Dec 2014
Accumulated difference between recognised depreciation/amortisation and depreciation/amortisation according to plan: – Machinery and equipment 27,327 23,635Tax allocation reserve 105,265 102,007Parent Company total 132,592 125,642
* Restated compared with previous financial statements due to a correction.
NOTE 34 PROFIT/LOSS FROM OTHER SECURITIES AND RECEIVABLESACCOUNTED FOR AS NON-CURRENT ASSETS
SEK 000sPARENT COMPANY 2015 2014
Profit/loss from participations in Group companies: Impairment of loans – 5,863 –Parent Company total – 5,863 –
Exchange-rate differences –347 1,318Fair value loss on interest-rate swaps 0 0Parent Company total –347 1,318
NOTE 35APPROPRIATIONS
SEK 000sPARENT COMPANY 31 Dec 2015 31 Dec 2014
Accumulated difference between recognised depreciation/amortisation and depreciation/amortisation according to plan –3,692 3,718Transfer to tax allocation reserve 22,689 12,723Dissolution of tax allocation reserve 19,431 5,624Parent Company total –6,950 –3,381
* Restated compared with previous financial statements due to a correction.
NOTE 36SPECIFICATION OF STATEMENT OF CASH FLOWS
SEK 000sGROUP 2015 2014
Gain/loss on divestment of property, plant and equipment 385 –86Pension provisions 2,528 23,817Other provisions 1,186 1,200Derivative instruments –30 0Other –7,930 7,451Group total –6,233 32,382
SEK 000sPARENT COMPANY 2015 2014
Gain/loss on divestment of property, plant and equipment 25 –86Pension provisions 1,932 4,175Other provisions 414 1,800Impairment of loans, Group companies 5,863 –Other 865 1,410Parent Company total 9,099 7,299
Interest paid and received GROUP PARENT COMPANY
SEK 000s 2015 2014 2015 2014
Interest received 2,086 4,207 1,579 2,109 Interest paid –7,068 –9,658 – 4,967 – 7,728
Transactions that do not entail payments
SEK 000s 2015 2014
Acquisition of assets on the basis of financial leases 1,970 0
NOTE 37TRANSACTIONS WITH RELATED PARTIES
Transactions with related partiesThe Parent Company is a related party to its subsidiaries, see Note 7.
Transactions with senior executives GROUP PARENT COMPANY
SEK 000s 2015 2014 2015 2014
Salaries and other short-term remuneration 14,109 11,563 11,562 10,446Remuneration upon notice of termination – 892 – 892Post-employment remuneration 3,539 4,204 3,325 4,099Total 17,648 16,659 14,887 15,437
Information on remuneration of each senior executives is provided in Note 9.
NOTE 36 CONTINUED
**

70 FM MATTSSON MORA GROUP ANNUAL REPORT 2015
The consolidated income statement and balance sheet will be presented for adoption at the Annual General Meeting on 12 May 2016. The Board of Directors and the CEO confirm that the consolidated financial statements have been prepared in accordance with International Financial Reporting Standards, IFRS, as adopted by the EU and provide a true and fair view of the Group’s financial position and results of operations. The Annual Report has been prepared in accordance with generally accepted accounting policies and gives a true and fair view of the Parent Company’s financial position and results of operations.
The Administration Report for the Group and the Parent Company gives a true and fair view of the progress of the Group’s and Parent Company’s operations, financial position and results of operations and also describes material risks and uncertainties faced by the Parent Company and the com-panies included in the Group.
Mora, 23 March 2016
Johnny AlvarssonChairman of the Board
Fredrik Skarp CEO
Lars Erik BlomBoard member
Erik ErikssonBoard member
Christer LennerBoard member
Lotta LundénBoard member
Hans Åke Norås Board member
Staffan GrytingEmployee representative
Ellinor SparbyEmployee representative
Our audit report was submitted on 23 March 2016
KPMG AB
Helena Arvidsson ÄlgneAuthorised Public Accountant

71FM MATTSSON MORA GROUP ANNUAL REPORT 2015
AUDIT REPORT
To the Annual General Meeting of FM Mattsson Mora Group AB (publ), Corporate Registration Number 556051-0207
AUDIT REPORT
STATEMENT ON THE ANNUAL ACCOUNTS AND CONSOLIDATED ACCOUNTS We have audited the annual accounts and consolidated accounts of FM Mattsson Mora Group (publ) for the year 2015. The annual accounts and consolidated accounts of the company are included in the printed version of this document on pages 32–70.
Responsibilities of the Board of Directors and the CEO for the annual accounts and consolidated accounts The Board of Directors and the CEO are responsible for the preparation and fair presentation of these annual accounts in accordance with the Annual Accounts Act and of the consolidated accounts in accordance with Interna-tional Financial Reporting Standards, as adopted by the EU, and the Annual Accounts Act, and for such internal control as the Board of Directors and the CEO determine is necessary to enable the preparation of annual accounts and consolidated accounts that are free from material misstatement, whether due to fraud or error.
Auditors’ responsibilityOur responsibility is to express an opinion on these annual accounts and consolidated accounts based on our audit. We conducted our audit in accord-ance with International Standards on Auditing and generally accepted auditing standards in Sweden. These standards require that we comply with ethical requirements and plan and perform the audit to obtain reasonable assurance that the annual accounts are free from material misstatement.
An audit involves performing procedures to obtain audit evidence about the amounts and disclosures in the annual accounts and consolidated accounts. The procedures selected depend on the auditor’s judgement, including the assessment of the risks of material misstatement of the annual accounts and consolidated accounts, whether due to fraud or error. In making those risk assessments, the auditor considers internal control relevant to the company’s preparation and fair presentation of the annual accounts and consolidated accounts in order to design audit procedures that are appropriate in the circum-stances, but not for the purpose of expressing an opinion on the effectiveness of the company’s internal control. An audit also includes evaluating the appro-priateness of accounting policies used and the reasonableness of accounting estimates made by the Board of Directors and the CEO, as well as evaluating the overall presentation of the annual accounts and consolidated accounts.
We believe that the audit evidence we have obtained is sufficient and appropriate to provide a basis for our audit opinions.
OpinionsIn our opinion, the annual accounts have been prepared in accordance with the Annual Accounts Act and present fairly, in all material respects, the financial position of the Parent Company as of 31 December 2015 and of its financial performance and its cash flows for the year then ended in accordance with the Annual Accounts Act. The consolidated accounts have been prepared in accordance with the Annual Accounts Act and present fairly, in all material respects, the financial position of the Group as of 31 December 2015 and of their financial performance and cash flows for the year then ended in accord-ance with International Financial Reporting Standards, as adopted by the EU, and the Annual Accounts Act. The statutory Administration Report is con-sistent with the other parts of the annual accounts and consolidated accounts.
We therefore recommend that the annual general meeting of share-holders adopt the income statement and balance sheet for the Parent Company and the Group.
Other disclosuresThe audit of the annual accounts and consolidated accounts for 2014 was performed by a different auditor, which submitted an Audit Report dated 25 February 2015 with unmodified opinions in the Statement on the annual accounts and consolidated accounts.
REPORT ON OTHER LEGAL AND REGULATORY REQUIREMENTSIn addition to our audit of the annual accounts and consolidated accounts, we have also audited the proposed appropriations of the company’s profit or loss and the administration of the Board of Directors and the CEO of FM Mattsson Mora Group (publ) for the year 2015.
Responsibilities of the Board of Directors and the CEOThe Board of Directors is responsible for the proposal for appropriations of the company’s profit or loss, and the Board of Directors and the CEO are responsible for administration under the Companies Act.
Auditors’ responsibilityOur responsibility is to express an opinion with reasonable assurance on the proposed appropriations of the company’s profit or loss and on the administration based on our audit. We conducted the audit in accordance with generally accepted auditing standards in Sweden.
As a basis for our opinion on the Board of Directors’ proposed appropri-ations of the company’s profit or loss, we examined the Board of Directors’ reasoned statement and a selection of supporting evidence in order to be able to assess whether the proposal is in accordance with the Companies Act.
As a basis for our opinion concerning discharge from liability, in addition to our audit of the annual accounts and consolidated accounts, we examined significant decisions, actions taken and circumstances of the company in order to determine whether any member of the Board of Directors or the CEO is liable to the company. We also examined whether any member of the Board of Directors or the CEO has, in any other way, acted in contravention of the Companies Act, the Annual Accounts Act or the Articles of Association.
We believe that the audit evidence we have obtained is sufficient and appropriate to provide a basis for our audit opinions.
OpinionsWe recommend to the annual general meeting of shareholders that the profit be appropriated in accordance with the proposal in the statutory Administra-tion Report and that the members of the Board of Directors and the CEO be discharged from liability for the financial year.
Mora, 23 March 2016KPMG AB
Helena Arvidsson ÄlgneAuthorised Public Accountant

MANAGEMENT TEAM
FREDRIK SKARPBorn 1975
CEO since March 2016
Education/background: Fredrik has a PhD in Industrial Marketing and Purchasing from Chalmers University of Technology and a B.Sc. in Industry Economics from Dalarna University. He most recently served as the CEO of Scanmast, and prior to that was the CEO of Morakniv AB for many years. He previously worked for ten years in senior positions at SSAB in Sweden and abroad.
Current assignments: Board member of Mora of Sweden AB, Swerea Mefos AB and Siljan Turism AB.
Shareholding: 0
ANNA-CARIN BJELKEBYBorn 1966
CFO since 2013
Education/background: Anna-Carin is a graduate in Business Administration from Umeå School of Economics. She also studied commercial law at the Stockholm School of Economics. Anna-Carin has previously worked as an authorised public accountant at PwC and was a partner in the agency (2003–2013).
Current assignments: –
Shareholding: 3,500 Class B shares
NICLAS BRANDSHAGEBorn 1967
Sales Director since 2012 and employed since 1999
Education/background: Niclas is a graduate in Business Administration from the Gothenburg School of Economics. He was previously Acting CEO of Ostnor Norge AS and has also been Nordic Sales Manager and Sweden Head of Ostnor Sverige AB.
Current assignments: –
Shareholding: 4,200 Class B shares
MIKAEL HANSSONBorn 1959
Director of Research and Development since 2003 and employed since 2000
Education/background: Mikael holds a degree in engineering (mechanical techno-logy) from the Institute of Technology in Linköping. During the period 2000-2003, he was Director of Technology at Mora Armatur AB.
Current assignments: Mikael is Chairman of the Valves & Fittings of Sweden trade association.
Shareholding: 8,000 Class B shares
OLE SANDERBorn 1963
CEO of FM Mattsson Mora Group Danmark ApS since June 2014 and employed since 2013
Education/background: Ole holds a degree in engineering from Copenhagen University College of Engineering. He has also com-pleted the Executive Management Programme at INSEAD.
Current assignments: Ole is a Board member of Veltek AVA Group.
Shareholding: 4,000 Class B shares
PETER WENNERSTEINBorn 1974
Acting CEO between 2015 and March 2016 and Marketing Director since 2014
Education/background: Peter is a graduate in Business Administration from the Stockholm School of Economics. He has also completed Harvard Business School’s High Potentials Leadership Program. Peter Wennerstein was previously Senior Consultant at Navigate and Global Brand Manager at DeLaval.
Current assignments:–
Shareholding: 6,000 Class B shares
MATS WESTMANBorn 1957
Acting Production Director since 2014 and employed since 2008
Education/background: Mats has completed a two-year electrical/telecommunication programme as well as a one-year training programme at ASEA. Before Mats became Production Director, he worked as a production manager during the 2008 to 2013 period.
Current assignments:–
Shareholding: 13,500 Class B shares
AUDITORSKPMG
Auditor in Charge Helena Arvidsson Älgne, born 1962.
Auditor in Charge of FM Mattsson Mora Group since the 2015 Annual General Meeting.
Helena is an authorised public accountant and member of FAR.
Helena’s other audit assignments include Seco Tools, Sandvik Heating Technology, and Cybercom Group.
Shareholding on 31 December 2015
72 FM MATTSSON MORA GROUP ANNUAL REPORT 2015
MANAGEMENT TEAM

BOARD OF DIRECTORS
JOHNNY ALVARSSONBorn 1950
Chairman of the Board since 2015 and Board member since 2012
Education/background: Johnny has a Master of Science in Engineering. Since 2004, Johnny has been CEO of Indutrade Aktiebolag, a company listed on Nasdaq Stockholm. Johnny was previously CEO of the listed companies Zeteco Aktiebolag (1998–2000) and Elektronikgruppen BK Aktiebolag (2000–2004).
Current assignments: Johnny is CEO and a Board member of Indutrade Aktiebolag. He is also Chairman of a number of subsidiaries in the Indutrade Group and a Board member of VBG Group AB.
Shareholding: 25,000 Class B shares
Independent in relation to the company, company management and major share-holders.
LARS ERIK BLOMBorn 1960
Board member since 2013
Education/background: Lars Erik has a degree in Business Administration from Stock-holm University. He has experience from LK Finans AB, where he is currently CEO.
Current assignments: Lars Erik is CEO and a Board member of LK Finans Aktiebolag. He is also Chairman of LK Systems AB, Lagerstedt & Krantz AB, LK PEX Aktie-bolag, Deltra Delgivning AB, TSS Holding AB and D-K Intressenter AB, and a Board member of Temperature Sensitive Solutions Systems Sweden AB, Järntorget Byggintres-senter Aktiebolag, its nordic AB, Connecting Capital Holding AB and Norvatek Invest AB. Projektengagemang i Stockholm AB.
Shareholding: Lars Erik holds 9.91 percent of the company LK Finans AB, which in turn holds 228,900 Class A shares and 934,610 Class B shares.
Independent in relation to the company and company management, but not in relation to major shareholders.
ERIK ERIKSSONBorn 1959
Board member since 2003
Education/background: Erik has high school engineering diplomas from schools in Borlänge and Mora. Since 2007, Erik Eriksson has been CEO of Mattsson Metal AB. Prior to that, he worked in project management at Ostnor Production Aktiebolag from 2003 until 2007 and as Production Manager at FM Mattsson AB from 1997 until 2003.
Current assignments: Erik is CEO of Mattsson Metal AB.
Shareholding: 41,200 Class A shares and 28,900 Class B shares
Independent in relation to the company and company management, but not in relation to major shareholders.
CHRISTER LENNERBorn 1947
Board member since 2009, serving as Chairman between 2009 and 2015
Education/background: Christer has a tech-nical college degree from Borlänge. From March 2009 and up to May 2013, he was employed as CEO of the Siljan Group. Christer has more than 25 years of expe-rience from the international engineering industry. He was previously CEO of Gunnebo Industrier from 2002 until 2009.
Current assignments: Christer is Chairman of Mattsson Metal AB, Aktiebolaget Nybrogrus and Quttabo Recycling AB and a Board member of Siljan Timber AB, Bly-berg Timber AB, Mora Trading Christer Lenner Aktiebolag, Siljan Wood Products AB, Siljan Skog AB, Stenbåkkan Konsult AB, iCell AB (publ), Siljan Group AB and Gunnebo Industrier Aktiebolag.
Shareholding: 40,600 Class B shares
Independent in relation to the company, company management and major share-holders.
LOTTA LUNDÉN Born 1957
Board member since 2014
Education/background: Lotta Lundén holds a bachelor’s degree in economics from Linköping University. She is a founder and partner of Konceptverkstan and has more than 20 years of experience of senior po-sitions in both Swedish and international companies, primarily within IKEA but also as Managing Director of Guldfynd Sverige AB and General Manager of Coop Forum.
Current assignments: Lotta Lundén is a Board member of Bergendahl o Son AB, Twilfit AB, Karl-Adam Bonnier Founda-tion and Boozt AB.
Shareholding: 0
Independent in relation to the company, company management and major share-holders.
HANS ÅKE NORÅS Born 1944
Board member since 2009
Education/background: Hans Åke is a graduate in Business Administration from the Gothenburg School of Economics. He has 25 years of experience as CEO and Chairman of companies active in the indu-strial and retail sectors. From 2002 until 2009, he was CEO of Atle Industrial AB.
Current assignments: Hans Åke is CEO of CNN Clarhäll Norås & Norås Consulting AB. He is also a Board member of CNN Clarhäll Norås & Norås Consulting AB and Norped AB as well as a deputy Board member of Brännholmen Capital Aktiebolag.
Shareholding: 77,000 Class B shares
Independent in relation to the company, company management and major share-holders.
STAFFAN GRYTING Born 1968
Employee representative (IF Metall) on the Board since 2005
Current assignments: 0
Shareholding: 0
Independent in relation to company management and major shareholders.
ELLINOR SPARBY Born 1971
Employee representative (Unionen) on the Board since 2014
Current assignments: 0
Shareholding: 0
Independent in relation to company management and major shareholders.
Shareholding on 31 December 2015
73FM MATTSSON MORA GROUP ANNUAL REPORT 2015
BOARD OF DIRECTORS

DEFINITIONS
THE COMPANY FM MATTSSON MORA GROUP ABFM Mattsson Mora Group (publ), Corporate Registration Number 556051-0207, or the Group in which FM Mattsson Mora Group AB (publ) is the Parent Company.
MIXER MARKETThe market for kitchen, washbasin, bathtub and shower mixers, garden taps, pipe systems and accessories
GDPGross domestic product.
DAMIXAThe Damixa brand.
DAMIXA APS / DAMIXAApS GroupPertains to the company Damixa ApS and its subsidiaries.
ECOSAFEA turnkey concept for the entire product lifecycle that has been developed by FM Matts-son Mora Group, involving the selection of materials and processes that minimise environ-mental impact.
THE ACQUISITIONThe company’s acquisition of the Damixa ApS Group, which occurred in May 2014.
DIYDo-it-yourself.
IFRSInternational Financial Reporting Standards.
SPECIFIERS Specifiers include architects and HVAC con-sultants, and can impact sales of mixer taps by specifying or recommending the type of mixer tap to be installed in a construction project. Specifiers are sub-contracted by a client, such as a construction company.
THE CODEThe Swedish Corporate Governance Code.
GROUPThe Group in which the company is the Parent Company.
LEAN PRODUCTIONPhilosophy concerning the efficient allocation of resources, whereby the principle is that all factors in the production process that do not generate added value for the customer are to be eliminated.
OEMOriginal equipment manufacturers. They sell total solutions, including mixer taps, to kitchen stores, DIY stores, modular-home builders or end consumers. OEMs purchase either from manufacturers or via wholesalers and sell under their own brand.
PRIVATE LABELProducts acquired from external manufacturers but sold under another company’s brand.
RMO / RMO SECTOR/SEGMENTRenovation, maintenance and overhaul / The segment of the construction market focusing on renovation, maintenance and overhaul.
OTHER CURRENCIES
DKKDanish kroner
EUREuro
NOKNorwegian kroner
SEKSwedish kronor
USDUS dollar
DEFINITIONS OF KEY RATIOSEQUITY/ASSETS RATIOEquity in relation to total assets.
RETURN ON EQUITYProfit/loss after tax in relation to average equity.
RETURN ON CAPITAL EMPLOYEDOperating income plus interest income in relation to average capital employed (total assets less non interest-bearing liabilities and provisions).
NET DEBTThe total of interest-bearing liabilities and interest-bearing provisions less cash and cash equivalents.
WORKING CAPITALThe total of inventories including work in pro-gress and operating receivables less operating liabilities.
OPERATING MARGINOperating income in relation to net sales.
PROFIT MARGINProfit before tax in relation to net sales.
CAPITAL EMPLOYEDTotal assets less non interest-bearing liabilities and non interest-bearing provisions. Aver-age capital employed is calculated as capital employed at the beginning of the year plus capital employed at year-end divided by two.
EARNINGS PER SHARECalculated based on consolidated profit for the year attributable to Parent Company shareholders divided by the weighted average number of shares.
CASH FLOW PER SHARECash flow for the year divided by the average number of shares.
EQUITY PER SHAREClosing equity divided by the average number of shares.
ITEMS AFFECTING COMPARABILITYItems in the balance sheet from events in the operations that affect comparability with other periods.
74 FM MATTSSON MORA GROUP ANNUAL REPORT 2015
DEFINITIONS

FINANCIAL SUMMARY
75FM MATTSSON MORA GROUP ANNUAL REPORT 2015
FINANCIAL SUMMARY
FIVE-YEAR SUMMARY 2011–2015The following table shows a summary of the Group’s financial performance.
SEK million unless otherwise indicatedGROUP
Income statement 2015 2014* 2013 2012 2011
Net sales 1,112.6 969 823.7 860.5 918.6Operating income (EBIT) 1) 85.7 48.3 70.0 38.3 69.6Profit after financial items 1) 80.7 42.8 67.5 34.7 64.9Profit for the year 61.6 31.2 51.7 32.6 45.7Operating margin, % 7.7 5.0 8.5 4.5 7.6Profit margin, % 7.3 4.4 8.2 4.0 7.1
Cash flow 2015 2014 2013 2012 2011
Cash flow from operating activities 117.4 67.2 93.3 88.6 108.3Cash flow from investing activities –34.0 –135.0 –39.6 –21.6 –23.0Cash flow after investments 83.4 –67.8 53.7 67.0 85.3Cash flow from financing activities –63.8 –19.8 –41.7 –63.8 –64.2Cash flow for the year 19.7 –87.6 12.0 3.2 21.1
Profitability data 2015 2014 2013 2012 2011
Return on equity, % 2) 18 10 16 10 14Return on capital employed, % 2) 18 10 16 9 16
Financial data at the end of the period 2015 2014 2013 2012 2011
Equity/assets ratio, % 2) 44 42 50 45 49Equity at year-end 2) 348.4 321.3 335.7 301.7 336.3Net debt 2) 84.7 135.9 5.7 40.4 17.6Working capital 151.7 164.5 101.8 96.4 110.9Capital employed 2) 479.2 483.6 455.4 436.4 452.7Investments 34.1 39.4 36.8 22.5 23.9Total assets 2) 791.5 757.4 673.7 669.4 692.3
Share data per share, SEK 2015 2014 2013 2012 2011
Earnings per share 5.38 2.72 4.51 2.85 4.00Cash flow per share 7.69 5.92 4.69 5.86 7.46Dividend per share 8.00 3) 3.00 3.00 2.50 4.00Equity per share 2) 30.44 28.07 29.33 26.36 29.39
Employees 2015 2014 2013 2012 2011
Average number of employees 545 553 452 459 504
1) Non-recurring costs of SEK 18.1 million are included in 2012. See Note 5 on page 52 of the 2012 Annual Report.2) The comparative figures for 2012 have been restated as a result of amended accounting policies relating to defined-benefit pensions.3) Proposed.
* Restated compared with previous financial statements due to a correction.

FINANCIAL CALENDARAnnual General Meeting 12 May 2016Interim report for the period January – March 2016 12 May 2016Interim report for the period April – June 2016 18 August 2016Interim report for the period July – September 2016 27 October 2016Year-end report 2016 February 2017
IR CONTACTAnna-Carin BjelkebyCFOTel +46 705 806 [email protected]
SWEDENFM Mattsson Mora Group ABPO Box 480SE-792 27 MoraTel: +46 250 59 60 00Fax: +46 250 159 60
Norra Stationsgatan 61SE-113 43 Stockholm
DENMARKFM Mattsson Mora Group Danmark ApSØstbirkvej 2DK-5240 Odense NØ Tel +45 63 10 22 10Fax +45 63 10 22 09
Abildager 26 ADK-2605 BrøndbyCopenhagen
NORWAYFM Mattsson Mora Group Norge ASSinsenveien 53DNO-0585 OsloTel +47 22 09 19 00Fax +47 22 09 19 01
FINLANDFM Mattsson Mora Group Finland OYPL 266 (postal address)Sahaajankatu 24 (street address)FI-00811 HelsinkiTel +358 207 411 960Fax +358 97 55 52 48
GERMANYMora GmbHBiedenkamp 3CDE-21509 GlindeTel +49 405 357 080Fax +49 405 357 08 30
NETHERLANDSDamixa Nederland BVRietveldenweg 86NL-5222 AS Den BoschTel +31 85 401 87 80Fax +31 85 401 87 89
BELGIUMDamixa NVPegasuslaan 5BE-1831 DiegemTel +32 02 523 30 60Fax +32 02 523 96 19
HONG KONGOstnor (Asia) Ltd.Room S, 5/F Valiant Ind. Centre2-12 Au Pui Wan StreetFo Tan Nt, Hong KongTel +852 372 70 434
CHINAGuangzhou Ostnor Sanitary Ware LimitedRm B1003 -1/F, JSWB Home Furnishings Centre1000 Xingangdong RoadHAIZHU GUANGZHOUChina 510308Tel +86 20 3432 9822
SINGAPOREDamixa Pte Ltd161, Lavender Place, #02-19Lavender StreetSingapore 338750Tel: +65 987 861 08
Production: FM Mattsson Mora Group AB together with Vero and Soformia. Photo: Mora Armatur, FM Mattsson, Damixa and Peter Nerström. Print: Åtta45, 2016.
INFORMATION ANDCONTACT DETAILS
INFORMATION TO SHAREHOLDERSShareholders of FM Mattsson Mora Group AB (publ) are hereby notified of the Annual General Meeting to be held in Mora, Sweden, on Thursday, 12 May 2016 at 5:30 p.m.
Registration in share register and notification of attendanceShareholders wishing to par ticipate in the Annual Gen-eral Meeting must be entered in the share register main-tained by Euroclear Sweden AB by 6 May 2016 and notify the company of their attendance (and any assistants) to Alexandra Andersson not later than 6 May 2016 by 4:00 p.m., by post to FM Mattsson Mora Group AB, PO Box 480, SE-792 27 Mora, Sweden or by e-mail to [email protected].
Shareholders who have their shares registered with a nominee must temporarily register the shares in their own name with Euroclear Sweden AB in order to be entitled to vote at the Annual General Meeting. Such re-registration must have been completed by 6 May 2016. This means that shareholders must inform their nominee in good time prior to the Meeting. Power of attorney forms will be available not later than 21 April 2016 on the company’s website www.fmm-mora.com and from the company’s office, and will also be sent to the postal addresses of shareholders who request such forms.
CONTACT DETAILS
76 FM MATTSSON MORA GROUP ANNUAL REPORT 2015
INFORMATION AND CONTACT DETAILS

IR CONTACTAnna-Carin BjelkebyCFOTel +46 705 806 [email protected]

www.fmm-mora.se