Embed Size (px)
Citation preview

1
Innovative Products Survey Report 2011
Team Members: Karen Manley Timothy Rose Timothy Bodisco Deborah Messer Stephen Kajewski Rachel Parker Keith Hampson Jane Marceau
September 2011
i
Table of Contents List of Figures .....................................................................................................................................................................iii
List of Tables ................................................................................................................................................................ ....... iv
1. Executive Summary ................................................................................................................................................. 1
1.1 Main Results ..................................................................................................................................................... 1
1.1.1 Product Innovation Activity ............................................................................................................. 1
1.1.2 Product Innovation Difficulty .......................................................................................................... 2
1.1.3 Product Innovation Obstacles.......................................................................................................... 2
1.1.4 Product Innovation Capacities ........................................................................................................ 3
1.2 Analytical Results ........................................................................................................................................... 4
2. Introduction ............................................................................................................................................................... 6
2.1 Conceptual Framework ................................................................................................................................ 7
2.2 Methodology ..................................................................................................................................................... 9
2.2.1 Data Validity and Integrity ............................................................................................................. 14
3. Main Results and Discussion ............................................................................................................................ 15
3.1 Product Innovation Activity .................................................................................................................... 15
3.2 Product Innovation Difficulty ................................................................................................................. 16
3.3 Product Innovation Obstacles ................................................................................................................ 17
3.4 Learning Capacity ........................................................................................................................................ 26
3.5 Relationship Capacity ................................................................................................................................ 30
4. Analytical Results and Discussion .................................................................................................................. 35
4.1 Correlations between Learning Capacity and Innovation Outcomes .................................... 35
4.1.1 Learning Capacity and Innovation Activity ............................................................................. 35
4.1.2 Learning Capacity and Innovation Difficulty .......................................................................... 36
4.1.3 Learning Capacity and Innovation Obstacles ......................................................................... 36
4.2 Correlations between Relationship Capacity and Innovation Outcomes ............................. 37
4.2.1 Relationship Capacity and Innovation Activity ..................................................................... 37
4.2.2 Relationship Capacity and Innovation Difficulty .................................................................. 39
4.2.3 Relationship Capacity and Innovation Obstacles ................................................................. 39
5. Conclusions .............................................................................................................................................................. 41
APPENDICES ................................................................................................................................................................ ..... 43
6. Appendix A: Innovation Obstacles ................................................................................................................. 43
7. Appendix B: Introduction of New Product Ideas ..................................................................................... 45
8. Appendix C: Survey Questionnaire ................................................................................................................ 50
ii
9. Appendix D: Data Integrity and Reliability ................................................................................................. 53
10. Appendix E: Learning Capacity Measures Replicability ........................................................................ 55
10.1 Learning Capacity Replicability ............................................................................................................. 55
10.2 Learning Capacity Reliability .................................................................................................................. 57
11. Appendix F: Index and Measure Development ......................................................................................... 60
11.1 Learning Capacity Index Development .............................................................................................. 60
11.1.1 Learning Capacity Index Measure ............................................................................................... 60
11.1.2 Learning Capacity Index Sensitivity Analysis ........................................................................ 60
11.2 Relationship Capacity Measure Development ................................................................................. 61
11.3 Innovative Obstacles Measure Development ................................................................................... 61
Bibliography ................................................................................................................................................................ ...... 62
iii
List of Figures Figure 2.1 – Conceptual Framework .......................................................................................................................... 7 Figure 2.2 – Survey Response Rates, by Sector, Australian Road and Bridge Industry, 2011 ........ 13 Figure 3.1 – Product Innovation Activity, by % Respondents, by Sector, Australian Road and Bridge Industry, 2011 ................................................................................................................................................... 16 Figure 3.2 – Product Innovation Difficulty, by % Respondents, All Sectors, Australian Road and Bridge Industry, 2011 ................................................................................................................................................... 17 Figure 3.3 – Distribution of Learning Capacity, All Sectors, Australian Road and Bridge Industry, 2011................................................................................................................................................................ ...................... 28 Figure 3.4 – Distribution of Learning Capacity, by Sector, Australian Road and Bridge Industry, 2011................................................................................................................................................................ ...................... 29 Figure 3.5 – Distribution of Relationship Capacity, All Sectors, Australian Road and Bridge Industry, 2011 ................................................................................................................................................................ .. 31 Figure 3.6 – Distribution of Experience with Alliance Contracts, All Sectors, Australian Road and Bridge Industry, 2011 ................................................................................................................................................... 32 Figure 3.7 – Distribution of Experience with Early Contractor Involvement Type Contracts, All Sectors, Australian Road and Bridge Industry, 2011 ....................................................................................... 33 Figure 3.8 – Distribution of Relationship Capacity, by Sector, Australian Road and Bridge Industry, 2011 ................................................................................................................................................................ .. 34 Figure 4.1 – Innovation Activity with respect to Learning Capacity, All Sectors, Australian Road and Bridge Industry, 2011 .......................................................................................................................................... 35 Figure 4.2 – Product Innovation Activity with respect to Relationship Capacity, All Sectors, Australian Road and Bridge Industry, 2011 ........................................................................................................ 38 Figure 7.1 – ‘Who typically introduces New Product Ideas?’ All Sectors, Australian Road and Bridge Industry, 2011 ................................................................................................................................................... 45 Figure 7.2 – ‘Who typically introduces New Product Ideas?’ Supplier Sector, Australian Road and Bridge Industry, 2011 ................................................................................................................................................... 46 Figure 7.3 – ‘Who typically introduces New Product Ideas?’ Consultant Sector, Australian Road and Bridge Industry, 2011 .......................................................................................................................................... 47 Figure 7.4 – ‘Who typically introduces New Product Ideas?’ Contractor Sector, Australian Road and Bridge Industry, 2011 .......................................................................................................................................... 48 Figure 7.5 – ‘Who typically introduces New Product Ideas?’ Client Sector, Australian Road and Bridge Industry, 2011 ................................................................................................................................................... 49 Figure 9.1 – Estimates of the Margin of Error for Multiple Response Rates .......................................... 54
iv
List of Tables Table 2.1 – Survey Summary Schedule .................................................................................................................. 12 Table 2.2 – Survey Sector Representation ............................................................................................................ 14 Table 3.1 – Top Ten Product Innovation Obstacles, by Average Score on a 7 Point Scale, Australian Road and Bridge Industry, 2011 ........................................................................................................ 18 Table 3.2 – Top Three Product Innovation Obstacles, by Average Score on a 7 Point Scale, Supplier Sector, Australian Road and Bridge Industry, 2011 ...................................................................... 22 Table 3.3 – Top Three Product Innovation Obstacles, by Average Score on a 7 Point Scale, Consultant Sector, Australian Road and Bridge Industry, 2011.................................................................. 23 Table 3.4 – Top Three Product Innovation Obstacles, by Average Score on a 7 Point Scale, Contractor Sector, Australian Road and Bridge Industry, 2011 .................................................................. 24 Table 3.5 – Top Three Product Innovation Obstacles, by Average Score on a 7 Point Scale, Client Sector, Australian Road and Bridge Industry, 2011 ......................................................................................... 25 Table 3.6 – Average Learning Capacity, by the Four Phases, based on a 7 point scale, All Sectors, Australian Road and Bridge Industry, 2011 ........................................................................................................ 29 Table 6.1 – Exhaustive List of Product Innovation Obstacles, Ranked by the Importance attached to Resolution, Average Importance Score based on a 7-Point Scale, Australian Road and Bridge Industry, 2011 ................................................................................................................................................................ .. 44 Table 9.1 – Survey Estimates of the Margin of Error ....................................................................................... 53 Table 10.1 – Four Factor Analysis of Learning Capacity Items .................................................................... 56 Table 10.2 – Two Factor Analysis of Learning Capacity Items .................................................................... 57 Table 10.3 – Internal Consistency of the Acquisition Phase ......................................................................... 58 Table 10.4 – Internal Consistency of the Assimilation Phase ....................................................................... 58 Table 10.5 – Internal Consistency of the Transformation Phase ................................................................ 58 Table 10.6 – Internal Consistency of the Exploitation Phase ....................................................................... 58 Table 10.7 – Internal Consistency of the Potential Learning Capacity Phase ........................................ 59 Table 10.8 – Internal Consistency of the Realised Learning Capacity Phase ......................................... 59
1
1. Executive Summary This report presents the results of the 2011 Australian road and bridge product innovation survey, the largest survey of its kind ever undertaken. The research team comprised Queensland University of Technology, Queensland Department of Transport and Main Roads, Construction Industry Institute Australia and the University of New South Wales. The research project was supported by these organisations and the Australian Research Council. The research employed the OECD’s definition of an ’innovative product’ as a ‘new product that differs significantly compared with previous products in the industry, in its intended use, performance characteristics, attributes, design properties or use of materials and components’ (OECD 1993, p.116).
The survey sample was defined as key organisations involved in the Australian road and bridge construction industry. The survey focused on four sectors across the road and bridge product supply chain: suppliers (comprising manufacturers and distributors), consultants (primarily engineering consultant firms), contractors (comprising head and trade contractors and subcontractors) and clients (state government road agencies). The sample comprised the four sectors in Queensland, New South Wales and Victoria (the study was not resourced to cover the remaining Australian states and territories). In total, 865 questionnaires were distributed to senior managers representing their respective organisations across the survey population. Following this, 212 usable responses were received, providing a response rate of approximately 25%. This response rate corresponded to an approximate 5% margin of error, indicating a valid representation of the survey population.
The survey collected information about respondents’ perceptions in relation to two key sets of data. The first was innovation outcomes, measured through three variables: (1) product innovation activity, (2) product innovation difficulty and (3) product innovation obstacles. The second set of data was about innovation capacities, measured through two variables: (1) learning capacity and (2) relationship capacity. Both these capacities have been shown to support the innovation efforts of organisations (Forés and Camisón 2011, Manley 2006). Cross-tabulations were undertaken to identify the nature of relationships between innovation outcomes and innovation capacities.
Survey results were split into two key sections in the report: the main results and analytical results.
1.1 Main Results
The main results for the industry as a whole and for the four sectors are presented. These results cover innovation activity, innovation difficulty, innovation obstacles and innovation capacity.
1.1.1 Product Innovation Activity Approximately two-thirds (66%) of survey respondents have introduced, or facilitated the introduction of, new products over the last three years (2009-2011). The overall result was reflective of the sector results: 73% of the supplier respondents, 71% of the client respondents, 63% of the consultant respondents, and 62% of the contractor respondents introduced, or
2
facilitated the introduction of, new products over the last three years. Suppliers had the highest rate of innovation and contractors had the lowest. Given the roles played by the different sectors, this result was expected.
The survey question about innovation activity (Appendix C) combines those who had directly introduced a new product and those who had facilitated new product introduction, as innovation is a group effort in a construction team environment. The latest Australian Bureau of Statistics data shows a construction product innovation rate of only 13.5% (ABS 2011). Our result shows a higher rate of innovation because it includes innovation facilitators. The extent to which our innovation rate exceeds the ABS rate is a reflection of the extent to which innovation in the construction industry is a team effort (although the two rates are strictly not directly comparable due to slightly different time periods and industry definitions).
1.1.2 Product Innovation Difficulty Overall, 77% of survey respondents found the introduction of new products ‘somewhat hard’, ‘hard’ or ‘very hard’. The result for each sector showed very little variation in perception of difficulty: contractors 79%, clients 79%, suppliers 78% and consultants 72%. These figures suggest it is generally challenging to introduce new products to projects despite high levels of product innovation activity, supporting the need for ongoing process improvement to ease the adoption of new products, including addressing obstacles to product uptake. Product innovation ‘difficulty’ indicates inefficiency in current processes, providing the opportunity for productivity gains.
1.1.3 Product Innovation Obstacles The survey explored 22 key product innovation obstacles, identified in our pilot study, by asking respondents to rate the importance of each obstacle. The objective was to rank the obstacles and identify the most important to be addressed by the industry to improve product adoption rates. The five most important obstacles were:
(1) Restrictive tender assessments focusing on price-only criteria, resulting in less flexibility for the contractor and consultant to experiment with new products.
(2) Disagreement between industry participants over who carries the risk of new product failure, arising from the risk aversion of both the client road agency and the party proposing the new product and concern over liability should the product fail.
(3) Adversarial contract relations that inhibit the adoption of new products, negatively impacting how new products are assessed and approved under the project relationship.
(4) Contractor time pressure inhibiting their ability to consider new product ideas from the consultants, subcontractors and suppliers, predominantly during the tender submission stage, leading to conservative product selection, particularly when risks are not easily quantifiable.
(5) Client road agency time pressure inhibiting their ability to effectively assess and approve new products for use, resulting in a more risk averse stance when product performance cannot be easily quantified within the time constraints.
The most important innovation obstacle identified by each of the four sectors were as follows:
(1) Suppliers were most concerned about restrictive price-only tender assessment. Although suppliers are not directly involved in the project tender process, this result implies that they
3
have close relationships with contractors and understand the extent to which their new product placement is disadvantaged by price-only contracting.
(2) Consultants were most concerned about clients preferring new product ideas that save direct project cost over ideas that offer greater savings over the life of the asset. This emphasis on short-term gain can reduce long-run efficiency.
(3) Contractors were most concerned about price-only tender assessment and selection. As expected, addressing this obstacle is of the highest importance to contractors in comparison with other sectors because of contractors’ key role in the tender process. This obstacle can cause the contractor to pursue a defensive self-interest position, potentially leading to adversarial relationships.
(4) Client road agencies were most concerned about the difficulty in getting suppliers to conduct sufficient testing prior to presenting a new product for consideration. The submission of poorly tested product ideas ties up client resources, leaving less time for the consideration of robust ideas.
1.1.4 Product Innovation Capacities The survey investigated the organisation’s capacity for innovation by reviewing two key drivers of this capacity: learning capacity (Lane et al. 2006, Zahra and George 2002) and relationship capacity (Dubois and Gadde 2002, Miozzo and Dewick 2002).
1.1.4.1 Learning Capacity Learning capacity refers to the external learning process of an organisation in its ability to acquire, assimilate, transform and exploit knowledge from its environment. The survey analysis classified 18% of organisations in the industry as having low learning capacity, 65% as having medium learning capacity and 17% as having high learning capacity. The data showed that nearly one in five construction organisations had low learning capacity and thus poor learning processes. Contractors did slightly better than this (16% low), while suppliers did a lot better (11% low), and clients (22% low) and consultants (26% low) did worse. Suppliers were the most effective adopters of ideas from outside the organisation and consultants were the least effective.
1.1.4.2 Relationship Capacity Relationship capacity is important because effective, collaborative inter-organisational relationships have a significant positive impact on innovation in construction projects. As an indicator of an organisation’s capacity to positively contribute to a collaborative relationship, the survey asked respondents to indicate how experienced they were across two types of relationship contracts: (1) Alliance contracts and (2) Early Contractor Involvement (ECI) type contracts. More than half the respondents (57%) had experience with at least one relationship contract. Client respondents had the most experience with relationship contracts (78%), followed by contractors (60%) and suppliers (54%), while the consultant respondents had the least experience (40%).
4
1.2 Analytical Results
The two innovation capacity variables (learning capacity and relationship capacity) were correlated with the three innovation outcome variables (innovation activity, innovation difficulty and innovation obstacles).
For ‘innovation activity’, a positive correlation with the two types of innovation capacities was expected (Forés and Camisón 2011).
(1) Learning Capacity: No significant relationship was found in relation to learning capacity. An organisation was not significantly more likely to be innovative if it had strong learning capacities. This unusual finding can be explained by the way in which the survey measured innovation activity. An organisation was counted as an ‘innovator’ if it merely facilitated the introduction of innovation. This was because we wanted to capture the team-based nature of innovation on construction projects. Comparison with the ABS construction innovation rate indicated that our ‘innovation activity’ measure was dominated by ‘facilitators’. Thus, the result suggests that innovation facilitators need much lower learning capacity than innovation initiators to be successful. This makes sense given the leading role that initiators play.
(2) Relationship Capacity: It was not possible to design a test of statistical significance for the relationship capacity variables; however, a strong positive trend was observed. Respondents with high relationship capacity were more likely to be innovative. This is to be expected, as innovation facilitators are likely to be active on relationship contracts. Thus, the countervailing impact of facilitators was less pronounced, and the expected strong correlation between relationship capacity and innovation was confirmed.
For ‘innovation difficulty’, a negative correlation with each of the two types of innovation capacities was expected. This relationship was supported in relation to relationship capacity. A strong negative relationship was found between innovation difficulty and relationship capacity. An organisation with a high level of relationship contracting experience was significantly more likely than an organisation with lower levels of experience to have low innovation difficulty. This is firm evidence that relationship contracts make innovation on road projects easier. On the other hand, the correlation of innovation difficulty with learning capacity yielded no relationship. Again, the inclusion of innovation facilitators among the innovators that completed this question cancelled out the expected relationship. The different results suggest that relationship capacity may be more important to innovation success than learning capacity.
For ‘innovation obstacles’, it was expected that organisations with greater innovation capacities would rank the resolution of innovation obstacles as more important. Highly innovative organisations were expected to encounter the obstacles more frequently and be more inconvenienced by them, compared with less innovative organisations. Highly innovative organisations would think it was more important that such obstacles were addressed. The strongest results obtained in this study supported this relationship. Organisations with higher learning capacity were significantly more likely than organisations with lower learning capacity to rank the resolution of obstacles as very important. Organisations with greater relationship contract experience were also significantly more likely than organisations with less relationship contracting experience to rank the resolution of obstacles as very important. This suggests that the obstacles identified in the study are central to unlocking the industry’s innovation capacity.

5
The potentially different needs of innovation initiators versus innovation facilitators were not relevant to this correlation, so did not weaken the results.
6
2. Introduction In 2011, the Innovative Products Research Team based at the Queensland University of Technology (QUT) undertook a major study of innovative product adoption in the Australian road and bridge industry. This was the largest innovation survey of the road and bridge industry ever undertaken in Australia. The QUT research team undertook this study in partnership with the Queensland Department of Transport and Main Roads, the Construction Industry Institute of Australia and the University of New South Wales. The research project was supported by these organisations and the Australian Research Council.
The survey collected information about respondent perceptions of key outcomes relating to innovative product adoption, namely product innovation activity1, product innovation difficulty and product innovation obstacles that inhibit new product uptake. The survey also gathered data relating to two key innovation capacity variables: learning capacity and relationship capacity. Tests were undertaken to identify the nature of the relationships between the innovation capacity variables (learning capacity and relationship capacity) and innovation outcomes (innovation activity, innovation difficulty and innovation obstacles). An ‘innovative product’ was defined as a new product that ‘differs significantly compared with previous products in the industry, in its intended use, performance characteristics, attributes, design properties or use of materials and components’ (OECD 1993, p.116).
The study’s population was defined as key organisations involved in Australian road and bridge construction projects within four key sectors in the product supply chain: suppliers (comprising manufacturers and distributors), consultants (primarily engineering consultant firms), contractors (comprising head and trade contractors and subcontractors) and road agency clients.
The development of the innovative products questionnaire (Appendix B) was based on the findings from an earlier background study. That study comprised an international literature review on antecedents of new product innovation and identified preliminary product adoption obstacles. The survey drew on the findings of this earlier study and was designed to address the requirements of project partners, with particular emphasis on the ranking and discussion of product innovation obstacles.
The innovative products survey responds to an identified need within the Australian road and bridge industry to assess the nature of product innovation adoption, to inform
1 The study also collected data about the type of stakeholders who typically introduce product innovation ideas. This question did not perform well because of self-interest biased results. The data does, however, show the opinions of the different industry sectors concerning who is most innovative. The results are shown in Appendix B.
7
the development of strategies to address obstacles and to increase product innovation rates. It is anticipated that these survey findings, followed up with our planned Australia-wide focus group discussions on solutions to product innovation obstacles in 2012, will inform public policy targeting improved product adoption rates. Indeed, the research team plans to further disseminate the survey results presented in this report to encourage the need for ongoing strategies to address product uptake obstacles.
2.1 Conceptual Framework
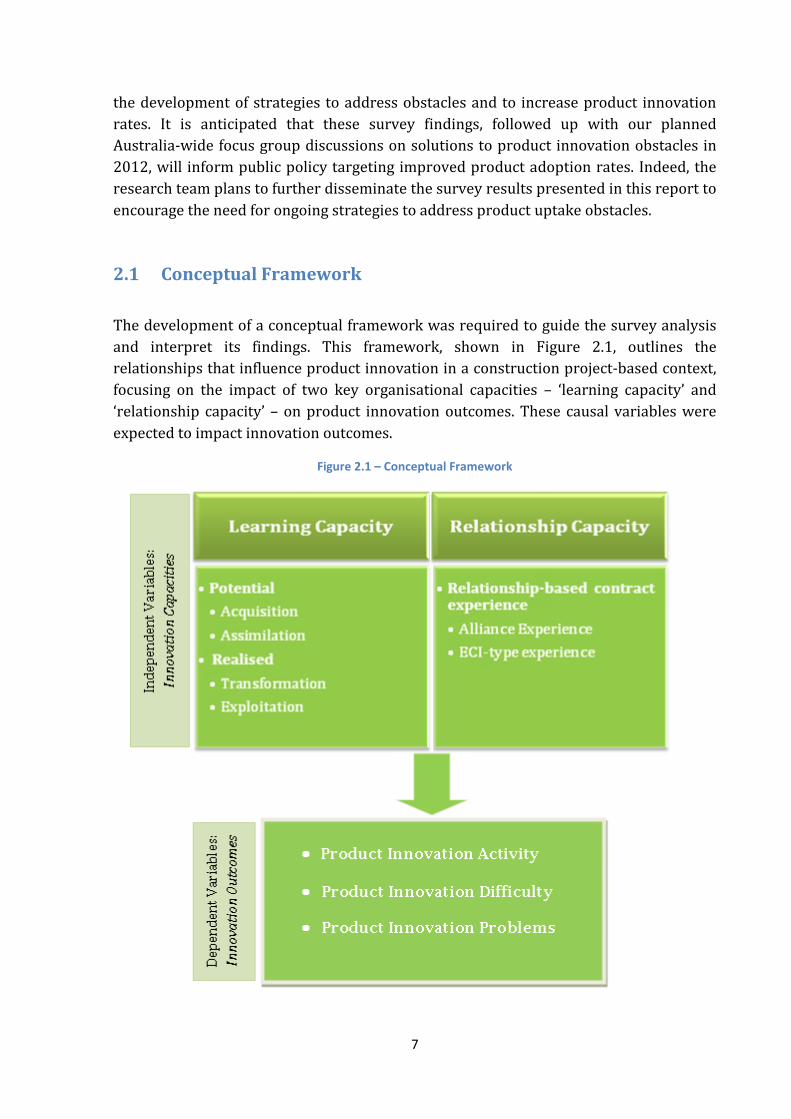
The development of a conceptual framework was required to guide the survey analysis and interpret its findings. This framework, shown in Figure 2.1, outlines the relationships that influence product innovation in a construction project-based context, focusing on the impact of two key organisational capacities – ‘learning capacity’ and ‘relationship capacity’ – on product innovation outcomes. These causal variables were expected to impact innovation outcomes.
Figure 2.1 – Conceptual Framework
8
The term ‘learning capacity’2 refers to the fundamental learning process of a firm and its ability to acquire, assimilate, transform and exploit knowledge from its environment (Zahra and George 2002). Learning capacity is thought to increase the ‘speed, frequency and magnitude’ of innovation, producing knowledge that further increases an organisation’s learning capacity (Lane et al. 2006). Our conceptual framework shows the four phases of learning capacity defined by Zahra and George (2002): acquisition, assimilation, transformation and exploitation. Each phase can be aggregated to examine both potential (acquisition and assimilation) and realised (transformation and exploitation) learning capacity (Jansen et al. 2005). We applied the empirically tested items used by Jiménez-Barrionuevo et al. (2010) to measure learning capacity. Replicability tests comparing our survey results with those of Jiménez-Barrionuevo et al. are presented in Appendix D, demonstrating successful replication. Further discussion of the learning capacity measures used in the present survey can be found in Section 3.4.
Relationship capacity was the other innovation capacity examined in the survey. This causal variable measures an organisation’s experience with relationship contracts and hence its capacity to positively contribute to a collaborative inter-organisational relationship. Efficient inter-organisational relationships are argued to have a significant positive impact on the uptake of innovation in construction projects (Dubois and Gadde 2002, Miozzo and Dewick 2002). An organisation’s relationship capacity is indicated by its experience in relationship-based contracts. Thus, the research design assumed that organisations with experience in relationship-based contracts would have a higher capacity than organisations without such experience to positively contribute to a collaborative project relationship and thus improved innovation outcomes.
The conceptual framework also highlights three innovation outcomes that were explored in the survey: innovation activity, innovation difficulty and innovation obstacles. Innovation outcomes are discussed in Sections 3 and 4. The relationships between innovation capacities and innovation outcomes are examined in detail; however, the study was not set up to examine the relationships between different innovation capacities or between different innovation outcomes.
2 The term ‘learning capacity’ in this report is known by the term ‘absorptive capacity’ in the literature and refers to an organisation’s external learning capacity. We have changed the name to make it more accessible to a general audience.
9
2.2 Methodology
The research questions driving the survey were:
• What is the rate of introducing, or facilitating the introduction of, new products? • What is the perceived difficulty in introducing, or facilitating the introduction of,
new products? • What are the obstacles impeding the adoption of new products? • What is the relationship between learning capacity and innovation outcomes? • What is the relationship between relationship capacity and innovation outcomes?
These questions arose from the background study findings and consideration of the literature on innovation systems, learning capacity and project governance arrangements and the needs of industry partners on the project. The survey findings will be used to inform the next stage of the project that will focus on identifying solutions to obstacles impeding innovation in the road and bridge industry by Australia-wide industry focus group discussions. It is anticipated that the answers to the research questions presented here will inform public policy aimed at encouraging new product adoption on Australian road and bridge projects.
The research team decided that a large mail survey was the best method to gather the depth and breadth of data required to answer the research questions. The survey questionnaire, presented in Appendix C, was organised around six key question areas: core activity (to determine respondent sector – question 1), product innovation activity (questions 2 & 3), product innovation difficulty (question 4), relationship contracting experience (to determine relationship capacity – questions 5 & 6), product innovation obstacles (questions 7 & 9) and learning capacity (questions 8 & 10). The measures and indices used to assess the responses to these questions are presented in Appendices D, E and F.
The questionnaire design was informed by the 2010 background study, the first deliverable of the project. Questionnaire development also involved significant input from research partners and consideration of previous product innovation survey data. The questionnaire comprised ten ‘tick-box’ and Likert type (seven-point scale) questions that were designed to minimise the time required for completion. Respondents were not asked to provide their identity, were assured of confidentiality, and were informed that the survey was optional. These measures encouraged ‘buy-in’ and increased the survey response rate, while upholding ethical standards.
Initially, a pilot survey was conducted to test logistics and the effectiveness of survey questions. It covered two respondents from each of the four sectors of the identified population: suppliers, consultants, contractors and government clients. Key respondents from each sector were randomly selected and asked if they were willing to participate in the pilot study. Once the eight participants were selected and had agreed to participate,
10
the questionnaire was distributed. Participants were asked to comment on the time taken to complete the survey, its user-friendliness, correctness of technical terms, general understanding and readability of each question and perceived usefulness of the survey, and to provide any other general remarks. The pilot study was well received by respondents and adjustments were made in two questions in response: (1) to make the sector options plural to accommodate the possibility for industry associations to be recognised as product idea introducers (question 3), and (2) to separate the list of potential obstacles into two groups (questions 7 & 9) to improve respondent concentration and to prevent respondents from becoming overwhelmed by one long list of obstacles.
The study population was defined as key organisations involved in the Australian road and bridge construction industry. A total of 865 organisations were deemed to fit this category and a census was then undertaken. The sampling unit was at an organisational level. The survey focused on four key sectors across the road and bridge product supply chain: suppliers (comprising manufacturers and distributors), consultants (primarily engineering consultant firms), contractors (comprising head and trade contractors and subcontractors) and state government clients. To ensure the survey remained manageable, the research was confined to the eastern Australian states (Queensland, New South Wales and Victoria).
Key organisations were defined as those appearing in the government road agency prequalification lists in the three states and members of three selected industry associations with offices in one of the three states. The government road agency in each of the three states was also surveyed. The three industry associations comprised Cement Concrete and Aggregates Australia (CCAA), Australian Asphalt Pavement Association (AAPA) and Consult Australia. These associations were chosen for inclusion in consultation with the industry partners working with the researchers. They were considered to be the most important to road project innovation outcomes in Australia. CCAA and AAPA are the most significant product suppliers by value and volume on Australian road and bridge projects. Consult Australia covers most of Australia’s engineering consultancy firms. These firms play a major role in product innovation.
The survey was sent directly to the government road agencies and key industry associations working with the research team. These ‘survey senders’ agreed to endorse and distribute the survey on the researchers’ behalf. This included an endorsement cover letter to introduce the project and ask their members, prequalified contractors or staff to complete the survey. This approach probably resulted in a higher survey response rate than if the researchers had directly distributed the survey without endorsement or introduction. The survey was distributed primarily through the post rather than electronically due to problems that have been experienced in previous construction industry surveys, such as the difficulty some construction organisations have with access to email. However, the survey questionnaires in the client sector were distributed by email, filled in manually and faxed or emailed back. This was done
11
because the client survey senders preferred this method and assured the researchers that all potential client respondents could effectively receive and respond via this method.
In total, 865 questionnaires were distributed to senior managers representing their respective organisations across the research population and 212 usable responses were received, a response rate of approximately 25%. This was a very positive result for a construction industry survey considering previous innovation studies in the construction industry have had response rates as low as 6% (Ling 2003). Our 25% response rate corresponds to an approximate 5% margin of error, clearly indicating our rate of response provides a valid representation of the survey population. Section 2.2.1 and Appendix D discuss the survey data validity in detail.
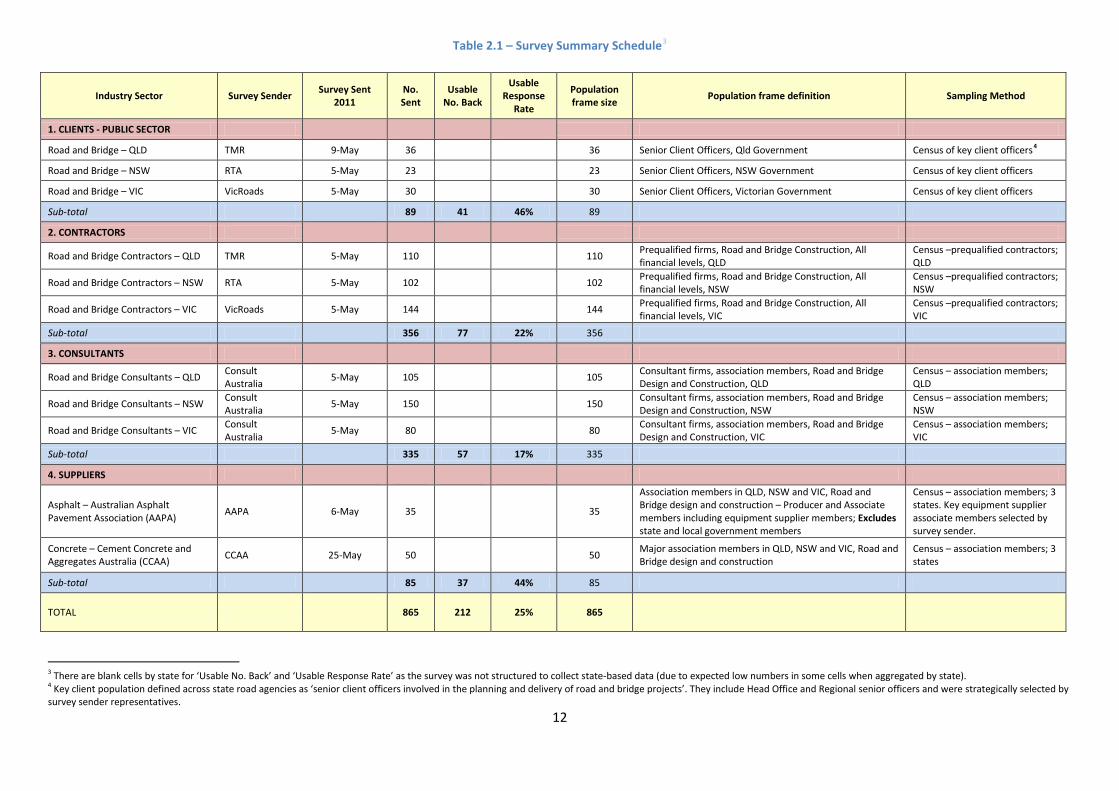
Table 2.1 overleaf summarises the industry sectors surveyed, providing detail of the survey senders, distribution numbers, response rates and population. The survey sampling method was a census of the population. All the key organisations in the sample were surveyed.
12
Table 2.1 – Survey Summary Schedule3
3 There are blank cells by state for ‘Usable No. Back’ and ‘Usable Response Rate’ as the survey was not structured to collect state-based data (due to expected low numbers in some cells when aggregated by state). 4 Key client population defined across state road agencies as ‘senior client officers involved in the planning and delivery of road and bridge projects’. They include Head Office and Regional senior officers and were strategically selected by survey sender representatives.
Industry Sector Survey Sender Survey Sent 2011
No. Sent
Usable No. Back
Usable Response
Rate
Population frame size Population frame definition Sampling Method
1. CLIENTS - PUBLIC SECTOR
Road and Bridge – QLD TMR 9-May 36 36 Senior Client Officers, Qld Government Census of key client officers4
Road and Bridge – NSW RTA 5-May 23 23 Senior Client Officers, NSW Government Census of key client officers
Road and Bridge – VIC VicRoads 5-May 30 30 Senior Client Officers, Victorian Government Census of key client officers
Sub-total 89 41 46% 89
2. CONTRACTORS
Road and Bridge Contractors – QLD TMR 5-May 110 110 Prequalified firms, Road and Bridge Construction, All financial levels, QLD
Census –prequalified contractors; QLD
Road and Bridge Contractors – NSW RTA 5-May 102 102 Prequalified firms, Road and Bridge Construction, All financial levels, NSW
Census –prequalified contractors; NSW
Road and Bridge Contractors – VIC VicRoads 5-May 144 144 Prequalified firms, Road and Bridge Construction, All financial levels, VIC
Census –prequalified contractors; VIC
Sub-total 356 77 22% 356
3. CONSULTANTS
Road and Bridge Consultants – QLD Consult Australia 5-May 105 105 Consultant firms, association members, Road and Bridge
Design and Construction, QLD Census – association members; QLD
Road and Bridge Consultants – NSW Consult Australia 5-May 150 150 Consultant firms, association members, Road and Bridge
Design and Construction, NSW Census – association members; NSW
Road and Bridge Consultants – VIC Consult Australia 5-May 80 80 Consultant firms, association members, Road and Bridge
Design and Construction, VIC Census – association members; VIC
Sub-total 335 57 17% 335
4. SUPPLIERS
Asphalt – Australian Asphalt Pavement Association (AAPA) AAPA 6-May 35 35
Association members in QLD, NSW and VIC, Road and Bridge design and construction – Producer and Associate members including equipment supplier members; Excludes state and local government members
Census – association members; 3 states. Key equipment supplier associate members selected by survey sender.
Concrete – Cement Concrete and Aggregates Australia (CCAA) CCAA 25-May 50 50 Major association members in QLD, NSW and VIC, Road and
Bridge design and construction Census – association members; 3 states
Sub-total 85 37 44% 85
TOTAL 865 212 25% 865
13
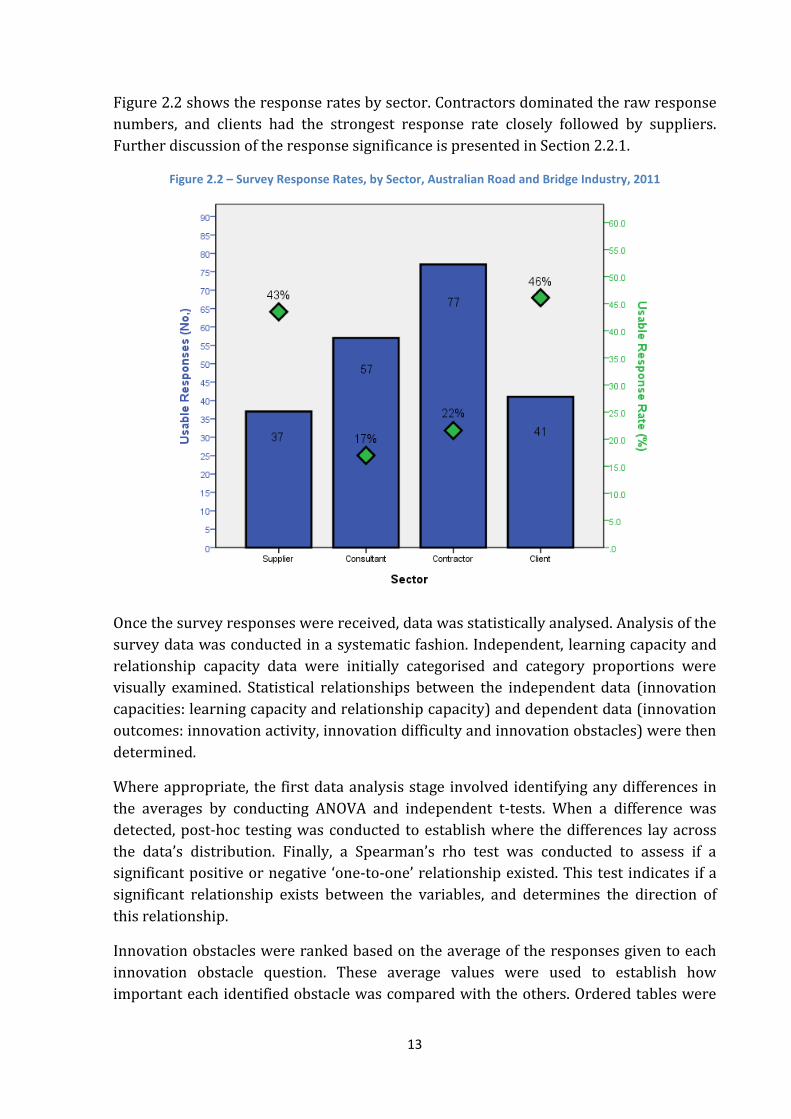
Figure 2.2 shows the response rates by sector. Contractors dominated the raw response numbers, and clients had the strongest response rate closely followed by suppliers. Further discussion of the response significance is presented in Section 2.2.1.
Figure 2.2 – Survey Response Rates, by Sector, Australian Road and Bridge Industry, 2011
Once the survey responses were received, data was statistically analysed. Analysis of the survey data was conducted in a systematic fashion. Independent, learning capacity and relationship capacity data were initially categorised and category proportions were visually examined. Statistical relationships between the independent data (innovation capacities: learning capacity and relationship capacity) and dependent data (innovation outcomes: innovation activity, innovation difficulty and innovation obstacles) were then determined.
Where appropriate, the first data analysis stage involved identifying any differences in the averages by conducting ANOVA and independent t-tests. When a difference was detected, post-hoc testing was conducted to establish where the differences lay across the data’s distribution. Finally, a Spearman’s rho test was conducted to assess if a significant positive or negative ‘one-to-one’ relationship existed. This test indicates if a significant relationship exists between the variables, and determines the direction of this relationship.
Innovation obstacles were ranked based on the average of the responses given to each innovation obstacle question. These average values were used to establish how important each identified obstacle was compared with the others. Ordered tables were
14
then generated to display the obstacles flagged as most important by the survey respondents. Further discussions of specific analytical approaches employed are presented in Sections 3 and 4.
2.2.1 Data Validity and Integrity Statistics enable us to generate estimates for population parameters based on survey data. Hence, it is important to understand how reliable these estimates are by calculating a margin of error. This margin of error refers to the extent to which a response is likely to apply to a true population. The literature indicates that for categorical data, the maximum acceptable margin of error is 5% (Bartlett et al. 2001), which was achieved in the current survey.
The internal reliability analysis, presented in Appendix D, indicates that non-sampling errors were minimal. Appendix D also shows that the usable response rate yielded an acceptable margin of error of approximately 5%. The non-response bias was also tested to ensure that there was no statistical difference between those that responded to the survey first and those that responded last. Consequently, results obtained from this survey can be deemed reliable.
Non-sampling error includes sample bias that occurs through self-selection, data entry errors and respondent misunderstanding of a survey question. In order to minimise non-sampling error, extreme care was taken during data entry. Also, survey question consistency and validity tests to check for inconsistent responses were employed. During data entry, 19 responses were identified as potentially erroneous and removed from the group of usable responses. Justification for removal included too many uncompleted responses across all questions and ‘Not Applicable’ responses, and an obvious lack of care when responding. As noted, a pilot study was conducted to minimise the potential for respondents to misunderstand the questions.
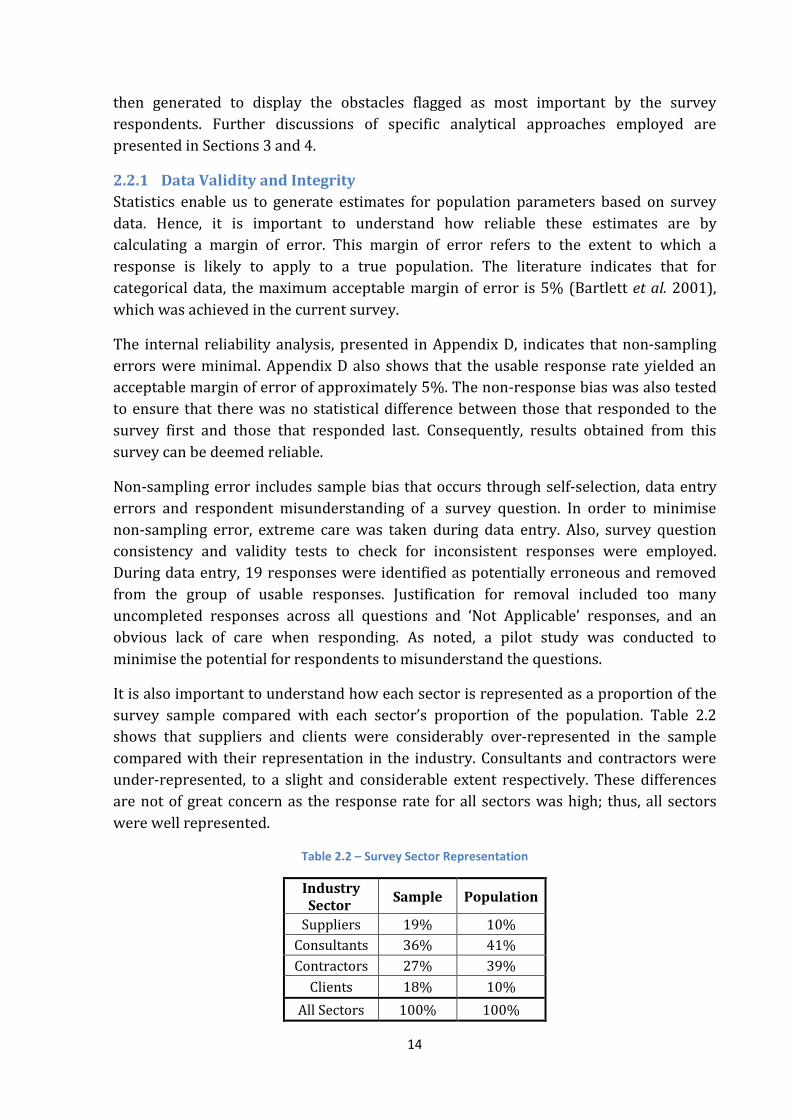
It is also important to understand how each sector is represented as a proportion of the survey sample compared with each sector’s proportion of the population. Table 2.2 shows that suppliers and clients were considerably over-represented in the sample compared with their representation in the industry. Consultants and contractors were under-represented, to a slight and considerable extent respectively. These differences are not of great concern as the response rate for all sectors was high; thus, all sectors were well represented.
Table 2.2 – Survey Sector Representation
Industry Sector Sample Population
Suppliers 19% 10% Consultants 36% 41% Contractors 27% 39%
Clients 18% 10% All Sectors 100% 100%
15
3. Main Results and Discussion This Section examines the overall responses to the survey and reports on significant results within five key areas: product innovation activity, product innovation difficulty product innovation obstacles, learning capacity and relationship capacity. Results are presented from an industry-wide perspective and across the four industry sectors surveyed: supplier, consultant, contractor and client. The objective of the discussion is to provide the road and bridge industry with practical knowledge on the constraints impeding innovative product adoption, as a key input in shaping the scope of the next stage of the project: identifying solutions to address these constraints.
3.1 Product Innovation Activity
The Innovative Product survey identified the number of organisations that have introduced, or facilitated the introduction of, any new products for use on a road or bridge project in the last three years. The survey defined an innovative product as a new product ‘that differs significantly compared with previous products in the industry, in its intended use, performance characteristics, attributes, design properties or use of materials and components’ (OECD 1993, p.116). Approximately two-thirds (66%) of the 212 respondents were involved in introducing, or facilitating the introduction of, a new product over the last three years (2009-2011). This result can be compared with the most recent Australian Bureau of Statistics (ABS) product innovation data. The 2009-2010 ABS Innovation Activity data shows that 13.5% of construction businesses (across both building and civil engineering sectors) introduced new or significantly improved products (goods or service), with an overall introduction of innovation rate (comprising product, process, marketing and managerial method) of approximately 30.9% (ABS 2011). The notable difference between the product innovation activity figures in our survey and the ABS statistics can be explained by the differences in how each of the relevant questions was phrased.
In our survey, the product innovation activity question identified organisations that had introduced or facilitated the introduction of any new product. This is in contrast to the focus of the ABS innovative product activity data on only the introducers of innovation, excluding facilitators (ABS 2011). In our survey, the phrasing of this question was intended to capture the team-based nature of construction project production (Dubois and Gadde 2002). We have succeeded in demonstrating this feature of construction innovation, with our high rate of innovation most likely deriving from the inclusion of innovation facilitators, in addition to innovation introducers.
16
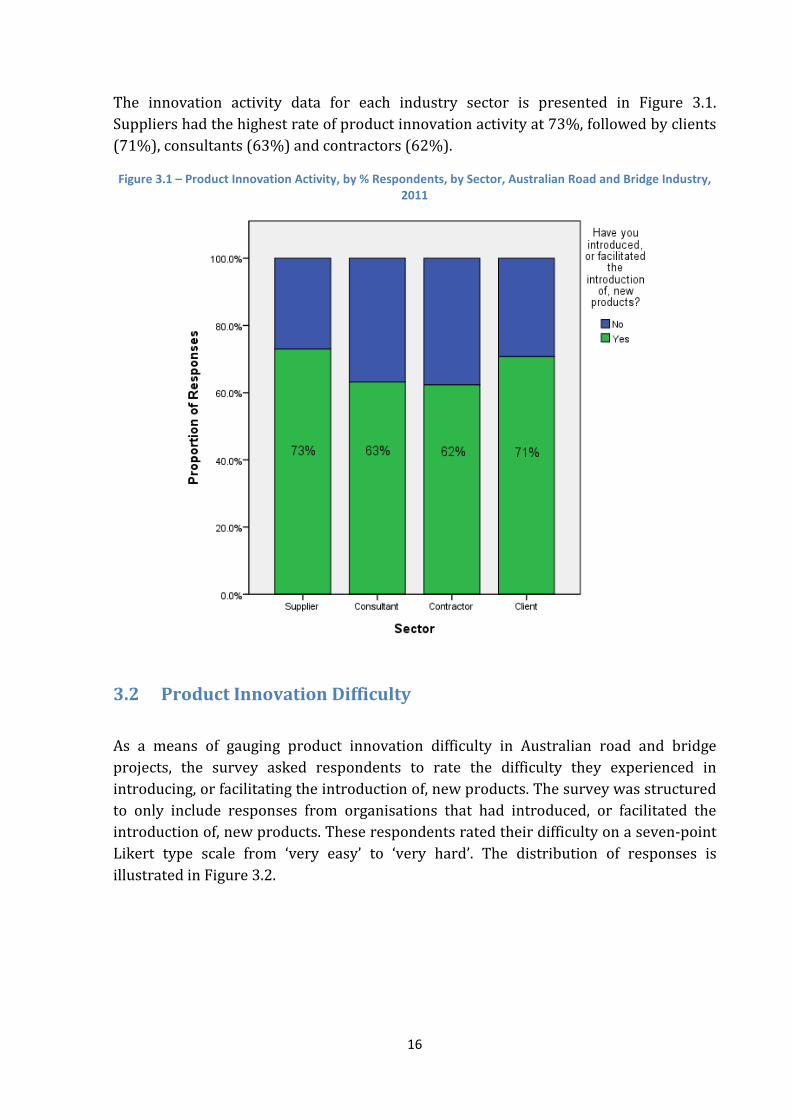
The innovation activity data for each industry sector is presented in Figure 3.1. Suppliers had the highest rate of product innovation activity at 73%, followed by clients (71%), consultants (63%) and contractors (62%).
Figure 3.1 – Product Innovation Activity, by % Respondents, by Sector, Australian Road and Bridge Industry, 2011
3.2 Product Innovation Difficulty
As a means of gauging product innovation difficulty in Australian road and bridge projects, the survey asked respondents to rate the difficulty they experienced in introducing, or facilitating the introduction of, new products. The survey was structured to only include responses from organisations that had introduced, or facilitated the introduction of, new products. These respondents rated their difficulty on a seven-point Likert type scale from ‘very easy’ to ‘very hard’. The distribution of responses is illustrated in Figure 3.2.

17
Figure 3.2 – Product Innovation Difficulty, by % Respondents, All Sectors, Australian Road and Bridge Industry, 2011
The survey data suggests that it is hard to introduce new products to projects, despite high levels of product innovation activity. Overall, 77% of survey respondents found the introduction of new products ‘somewhat hard’, ‘hard’ or ‘very hard’. The result per sector was as follows: suppliers 78%, consultants 72%, contractors 79% and clients 79%. This finding supports the need for ongoing process improvement in the industry to ease the adoption of new products, including addressing obstacles to product uptake. Of particular note, 8% of respondents found the introduction of new products ‘very hard’, while no respondent indicated that it was ‘very easy’.
3.3 Product Innovation Obstacles
In addition to assessing the difficulty of product innovation, respondents were asked to rate the importance of addressing 22 key product innovation obstacles identified in the innovative products project background study. The respondents on behalf of their organisation rated how important it was to address each obstacle on a seven-point Likert scale with 1 being ‘Highly Unimportant’ and 7 ’Highly Important’. The survey provided the option of a ‘Not Applicable’ response to each question to give the opportunity for respondents to opt out of rating a statement. These responses were treated as separate missing data to avoid introducing analyst opinion. In ranking the
18
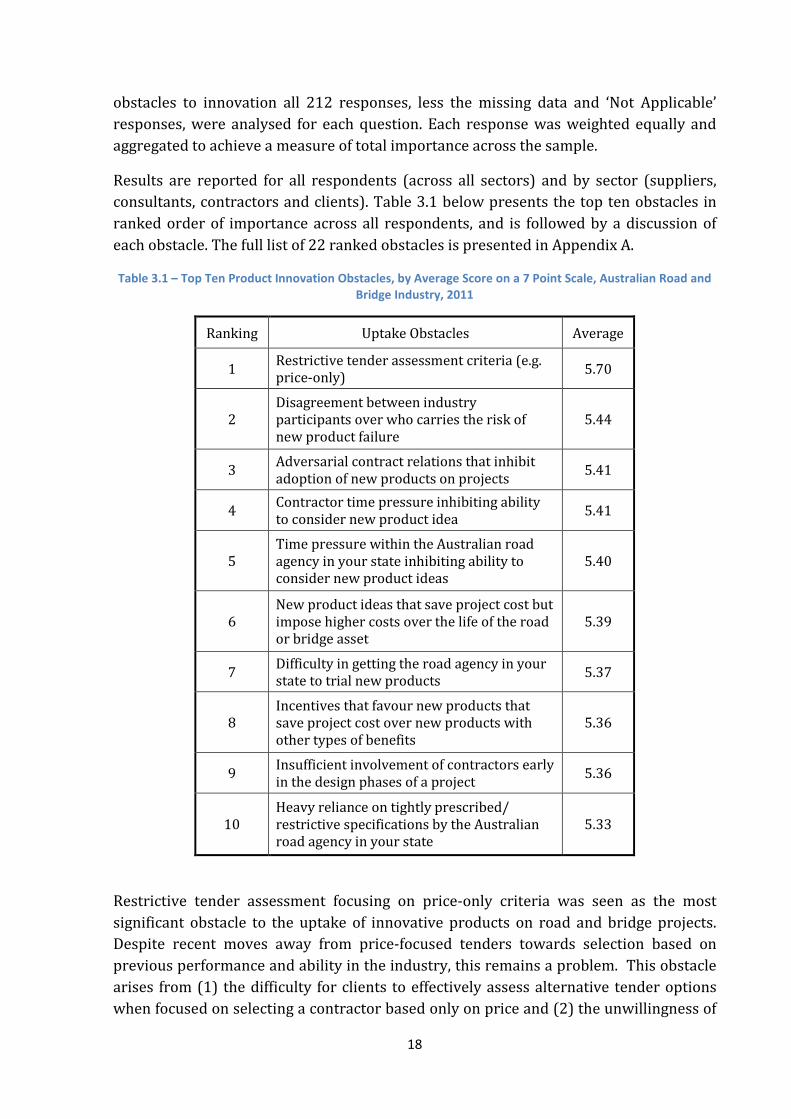
obstacles to innovation all 212 responses, less the missing data and ‘Not Applicable’ responses, were analysed for each question. Each response was weighted equally and aggregated to achieve a measure of total importance across the sample.
Results are reported for all respondents (across all sectors) and by sector (suppliers, consultants, contractors and clients). Table 3.1 below presents the top ten obstacles in ranked order of importance across all respondents, and is followed by a discussion of each obstacle. The full list of 22 ranked obstacles is presented in Appendix A.
Table 3.1 – Top Ten Product Innovation Obstacles, by Average Score on a 7 Point Scale, Australian Road and Bridge Industry, 2011
Ranking Uptake Obstacles Average
1 Restrictive tender assessment criteria (e.g. price-only) 5.70
2 Disagreement between industry participants over who carries the risk of new product failure
5.44
3 Adversarial contract relations that inhibit adoption of new products on projects 5.41
4 Contractor time pressure inhibiting ability to consider new product idea 5.41
5 Time pressure within the Australian road agency in your state inhibiting ability to consider new product ideas
5.40
6 New product ideas that save project cost but impose higher costs over the life of the road or bridge asset
5.39
7 Difficulty in getting the road agency in your state to trial new products 5.37
8 Incentives that favour new products that save project cost over new products with other types of benefits
5.36
9 Insufficient involvement of contractors early in the design phases of a project 5.36
10 Heavy reliance on tightly prescribed/ restrictive specifications by the Australian road agency in your state
5.33
Restrictive tender assessment focusing on price-only criteria was seen as the most significant obstacle to the uptake of innovative products on road and bridge projects. Despite recent moves away from price-focused tenders towards selection based on previous performance and ability in the industry, this remains a problem. This obstacle arises from (1) the difficulty for clients to effectively assess alternative tender options when focused on selecting a contractor based only on price and (2) the unwillingness of
19
the contractor (and their subcontractors and suppliers) to propose alternative product options during a potentially adversarial price-focused tender process, particularly in project priority areas outside cost-savings.
Contractors rarely develop in-house products; instead they generally ‘broker’ innovative product knowledge to be exploited for their competitive advantage during tender. Contractors’ willingness to exploit the knowledge of their suppliers and subcontractors and propose alternative products probably depends on their expectations. If they know they are being selected only on their competitive price, they are less motivated to seek or propose new products that may be more risky than standard products. Also, the need to be lean in their price submission under a cost-dominated competitive selection process may result in less flexibility for the contractor to experiment with new products. Price-only selection in large complex construction projects can result in less willingness to align with a ‘best-for-project culture’, and may induce an individualist protectionist stance (Walker and Hampson 2003), discouraging open dialogue about the potential use of innovative products.
The second ranked obstacle was disagreement between industry participants over who carries the risk of new product failure. Construction projects are synonymous with high risk associated with failure and heavy requirements for durability that leads to conservatism towards trial and error (Blayse and Manley 2004, Nam and Tatum 1989). The adoption of new products is impeded when experimentation is difficult due to the high consequences of failure. This obstacle generally arises from the risk averseness of both the client and the party proposing the new product, and concern about liability should the product fail. The perception that product applications can result in high exposure to liability can have a negative impact on innovation. Clients want contractors (and product suppliers) to adequately test and warrant the performance of proposed products to meet their expectations, while contractors (and suppliers) want clients to be more flexible in their expectations and share the risk of trialling new products.
The third ranked obstacle was adversarial contract relations that inhibit adoption of new products on projects. The construction industry has long been criticised for its highly fragmented and adversarial project relationships, resulting in poor project performance and low levels of innovation (Love et al. 2001). Contractual relations comprise the contractual terms within a governing relationship, generally encompassing the risk apportionment, allocation of responsibilities, reimbursement mechanisms and the relationships (Cox and Thompson 1997). Adversarial contract relations can have a direct impact on how new products are assessed and approved under the project relationship. If the project is plagued by mistrust and opportunistic behaviour (as opposed to a ‘best-for-project’ behaviour), contractors will be less inclined to propose new product options, and clients will be reluctant to reinterpret the project specifications to encourage the use of new products proposed by the contractor.
20
Clients ideally select the type of contract that most effectively aligns stakeholder motivation to the desired results, through appropriate structuring of the governing relationship (Zaghloul and Hartman 2003). This includes motivating the contractor and consultant to openly propose alternative products and the client to fairly assess them for the benefit of the project. The high ranking of this obstacle suggests it remains a problem within the industry and that further research into the impact of contractual terms on the governing relationship is required in the Australian road industry.
Time pressure on both the contractor and client agency that limit their capacity to consider new product ideas were the fourth and fifth ranked obstacles respectively. Contractors face significant time pressure during the preparation of tender submissions. This pressure restricts their ability to consider new products from within their organisations and from consultants, subcontractors and suppliers. This leads to conservative product selection, particularly when risks are not easily quantifiable. The client faces similar pressure in assessing and approving new products for use, resulting in a more risk averse stance when product performance cannot be easily quantified within the time constraints. This can lead to approving officers resorting to tried and true approaches that are less risky. This obstacle also applies when time constraints limit clients’ ability to effectively trial and approve a new product proposed directly by suppliers, particularly if it is not endorsed and warranted by a head contractor. Time shortages appear to be most acute during particular projects, but they seem to be similarly constraining when ideas are proposed outside project processes.
The sixth ranked obstacle was new product ideas that save project costs but impose higher costs over the life of a road or bridge asset. The obstacle arises when (1) contractors propose ideas that save costs but compromise quality in the long run or when (2) clients turn down good ideas that save cost over the longer-term, but increase the up-front cost. In both cases, the lack of weight attached to whole-of-life costs can result in an increase in those costs. If a client’s focus is on immediate cost saving, they may be reluctant to approve new product alternatives that provide better, proven long-term benefits than a standard cheaper option; and contractors and consultants will be less inclined to propose new products if they expect they will not be approved. On the other hand, if a contractor’s focus is on immediate cost saving, they may be tempted to propose ill-considered ideas. This obstacle not only increases the long-term financial costs of managing a road and bridge asset, but also impacts on the environmental life-cycle costs.
The construction sector accounts for a substantial proportion of Australia’s primary energy usage and energy-related greenhouse gas emissions (Treloar et al. 2000). The long-term environmental cost of road and bridge construction is therefore an important consideration during the procurement process. Although these considerations should begin at the manufacturing stage of a construction product, pollution from the manufacture of construction products is rarely considered (Treloar et al. 2000).
21
The results suggest there is an emphasis on direct costs, which can be (1) costly for clients if non-adoption sacrifices long-term positive effects on road and bridge assets and (2) beneficial for clients if non-adoption avoids reduction in quality. Unfortunately, the results indicate that neither clients nor contractors have sufficient time to fully investigate the impacts of new ideas. It is clear that whole-of-life costs are not getting enough attention.
Difficulty in getting the client road agency to trial new products was the seventh ranked obstacle, and arises from ambiguity concerning the responsible party for such trials. Government client agencies responsible for road projects are under increasing pressure to develop a uniform approach to the trialling and approval of new products which have not been proven in their jurisdiction and may not meet existing specifications. Such products might have a protracted pathway to use, despite their potential for innovation. Client agencies are faced with establishing independent methodologies to trial new products, while the industry needs a shared understanding of where responsibility lies for product testing and evaluation. The results suggest that non-client stakeholders believe client agencies should be playing a greater role in trialling new products.
The eighth ranked obstacle was incentives favouring new products that save project cost over new products with other types of benefits. This obstacle is strongly related to the sixth ranked obstacle of lack of attention to whole-of-life costs. Given the incentives provided by price-based selection criteria, a contractor might focus on cost savings for commercial advantage to the potential detriment of unmeasured areas such as workmanship (Rose 2008). This obstacle can result in an adversarial project environment that leads to excessive conservatism by clients in approving new products for use. It also results in unwillingness by non-client stakeholders to propose new product ideas that they know won’t result in any reward, because the benefits lie in areas outside immediate cost savings.
Insufficient involvement of contractors early in the design phases of a project was the ninth ranked obstacle. This obstacle involves insufficient participation of contractors in the design decisions, which inhibits the smooth integration of design and construction. Contractor lack of involvement in design can result in increased risk of constructability problems and reduce opportunities for the contractor to propose innovative products to address design issues. Client agencies ideally maximise the contractor’s design and constructability knowledge by promoting their involvement in design development, especially if the contractor is required to take a larger proportion of construction risk (Rose 2008). The ranking of this obstacle in the top ten by the survey respondents suggests that clients and their design consultants are currently missing the opportunity to capture the innovative product knowledge of contractors and suppliers, by not sufficiently involving them early in the design stages of a project.
The tenth ranked obstacle was heavy reliance on tightly prescribed and restrictive specifications. This obstacle involves insufficient flexibility by the client road agency in
22
specifying performance requirements of new products and new product combinations. Heavy reliance on tightly prescribed specifications, which require rigid and explicit interpretation of performance requirements, can restrict contractor, consultant and supplier opportunities to propose new products that may improve performance. Although prescriptive specifications do suit certain product types, the top ten ranking of this obstacle suggests road agency clients should further consider the opportunities for more flexible specification systems, such as the more wide-spread use of performance-based specifications.
This obstacle persists despite recent moves across Australian road agencies to provide greater opportunities for contractors and their suppliers to propose new products under more flexible specification and approval processes. For such moves to be effective, clients must have the skills to discern the performance characteristics appropriate to the intended use of an innovative product, and describe these valid performance characteristics in a clear, unambiguous and, in most cases, quantitative way so that performance can be easily assessed (Bickley et al. 2006).
This list of the industry’s top ten innovation obstacles covers many enduring topics, indicating that the industry’s steps towards improvement have had limited success.
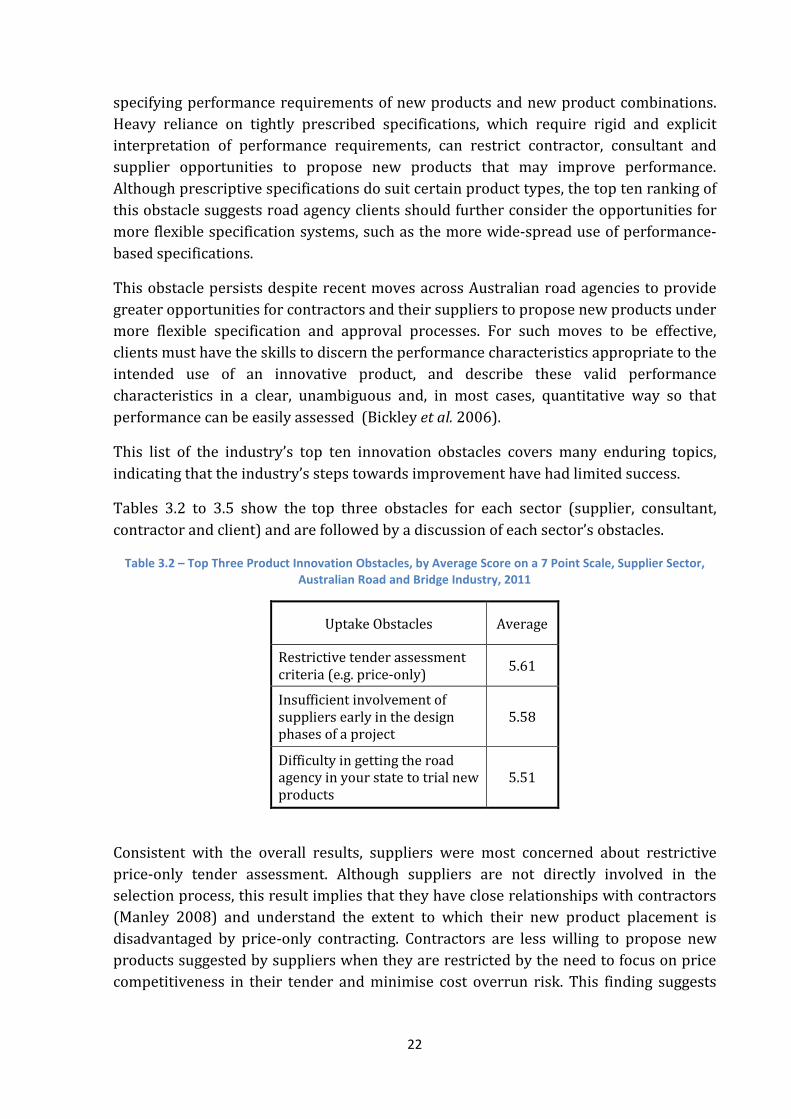
Tables 3.2 to 3.5 show the top three obstacles for each sector (supplier, consultant, contractor and client) and are followed by a discussion of each sector’s obstacles.
Table 3.2 – Top Three Product Innovation Obstacles, by Average Score on a 7 Point Scale, Supplier Sector, Australian Road and Bridge Industry, 2011
Uptake Obstacles Average
Restrictive tender assessment criteria (e.g. price-only) 5.61
Insufficient involvement of suppliers early in the design phases of a project
5.58
Difficulty in getting the road agency in your state to trial new products
5.51
Consistent with the overall results, suppliers were most concerned about restrictive price-only tender assessment. Although suppliers are not directly involved in the selection process, this result implies that they have close relationships with contractors (Manley 2008) and understand the extent to which their new product placement is disadvantaged by price-only contracting. Contractors are less willing to propose new products suggested by suppliers when they are restricted by the need to focus on price competitiveness in their tender and minimise cost overrun risk. This finding suggests
23
suppliers are very aware of the constraints on new product acceptance for use upstream in the supply chain.
In contrast with the overall results, suppliers were also concerned about their lack of involvement earlier in the design stage. Drawing from the product management literature on early supplier involvement, researchers have identified benefits of involving suppliers in product development, including (1) enhancement of expertise and information regarding new technology and ideas, (2) the early identification of potential problems, eliminating the need for rework, thus improving quality, (3) the improved integration of supplier components reducing supply fragmentation, (4) improved information exchange and communication reducing delays in delivery and (5) improved supplier-buyer relationships encouraging the supplier to internalise individual project concerns (McIvor and Humphreys 2004). The supplier sector results suggest such benefits in a construction project context are not being maximised where suppliers could play a greater role in contributing to design development.
Suppliers were also concerned about the difficulty in getting the client agencies to trial new products. This obstacle supports the notion that there is ambiguity over who is the responsible party for trialling new products. Here, suppliers were indicating that client agencies should be playing a greater role in trialling their new products for approval and use on projects.
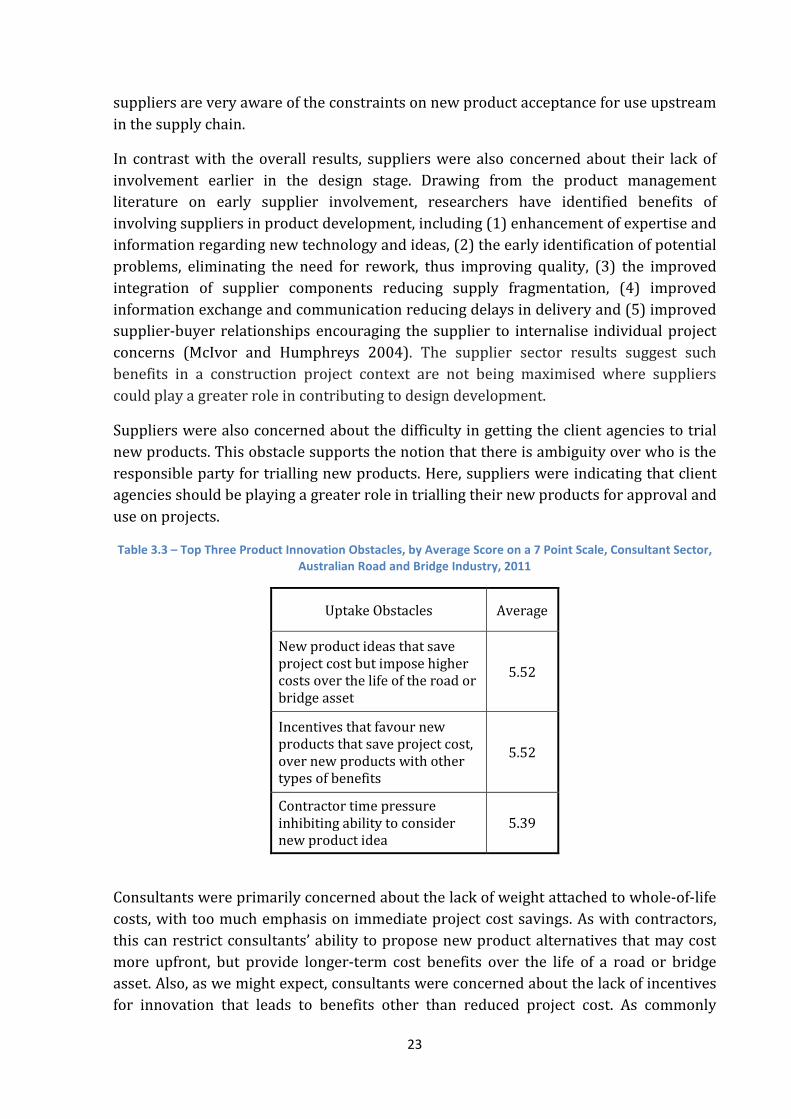
Table 3.3 – Top Three Product Innovation Obstacles, by Average Score on a 7 Point Scale, Consultant Sector, Australian Road and Bridge Industry, 2011
Uptake Obstacles Average
New product ideas that save project cost but impose higher costs over the life of the road or bridge asset
5.52
Incentives that favour new products that save project cost, over new products with other types of benefits
5.52
Contractor time pressure inhibiting ability to consider new product idea
5.39
Consultants were primarily concerned about the lack of weight attached to whole-of-life costs, with too much emphasis on immediate project cost savings. As with contractors, this can restrict consultants’ ability to propose new product alternatives that may cost more upfront, but provide longer-term cost benefits over the life of a road or bridge asset. Also, as we might expect, consultants were concerned about the lack of incentives for innovation that leads to benefits other than reduced project cost. As commonly
24
understood, and noted in the literature, consultants are key drivers of design innovation (Salter and Gann 2003). The survey results indicate clients may not be making the most of consultants’ potential contribution to innovation and their ability to broker new products from suppliers to be integrated into road and bridge design.
Consultants also considered that time pressure inhibits a contractor’s ability to consider their new product ideas. Such time constraints result in the contractor taking a conservative, risk-averse approach to product selection, discouraging new product ideas from consultants.
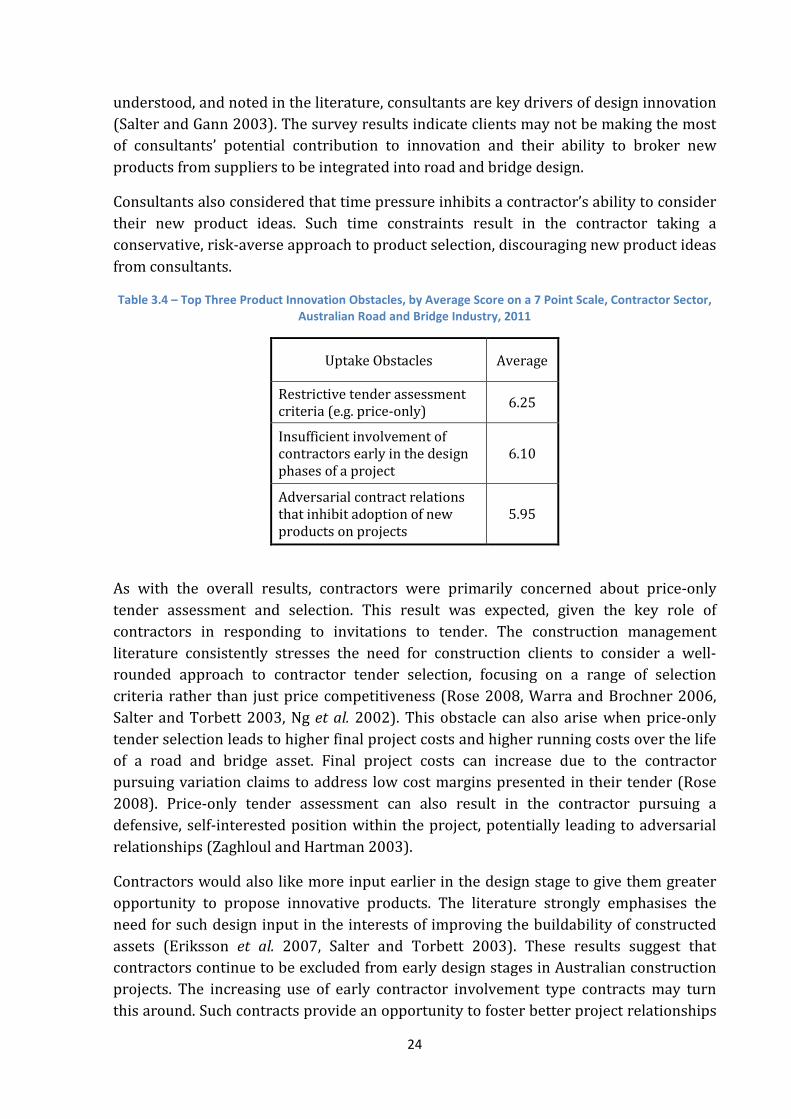
Table 3.4 – Top Three Product Innovation Obstacles, by Average Score on a 7 Point Scale, Contractor Sector, Australian Road and Bridge Industry, 2011
Uptake Obstacles Average
Restrictive tender assessment criteria (e.g. price-only) 6.25
Insufficient involvement of contractors early in the design phases of a project
6.10
Adversarial contract relations that inhibit adoption of new products on projects
5.95
As with the overall results, contractors were primarily concerned about price-only tender assessment and selection. This result was expected, given the key role of contractors in responding to invitations to tender. The construction management literature consistently stresses the need for construction clients to consider a well-rounded approach to contractor tender selection, focusing on a range of selection criteria rather than just price competitiveness (Rose 2008, Warra and Brochner 2006, Salter and Torbett 2003, Ng et al. 2002). This obstacle can also arise when price-only tender selection leads to higher final project costs and higher running costs over the life of a road and bridge asset. Final project costs can increase due to the contractor pursuing variation claims to address low cost margins presented in their tender (Rose 2008). Price-only tender assessment can also result in the contractor pursuing a defensive, self-interested position within the project, potentially leading to adversarial relationships (Zaghloul and Hartman 2003).
Contractors would also like more input earlier in the design stage to give them greater opportunity to propose innovative products. The literature strongly emphasises the need for such design input in the interests of improving the buildability of constructed assets (Eriksson et al. 2007, Salter and Torbett 2003). These results suggest that contractors continue to be excluded from early design stages in Australian construction projects. The increasing use of early contractor involvement type contracts may turn this around. Such contracts provide an opportunity to foster better project relationships
25
as the contractor gains ‘ownership’ over the design, reinforcing team commitment to positive project delivery outcomes.
Contractors also ranked adversarial relations as a high concern. This type of tension in the supply chain is a long standing problem, with demonstrably serious consequences for project performance (Khalfan and Mcdermott 2006, Andrews and Hahn 1998). Projects can suffer directly from adversarial contractual relations because clients can be reluctant to reinterpret project specifications to encourage innovative products proposed by the contractor, and contractors are less willing to propose innovative products under the threat of serious conflict.
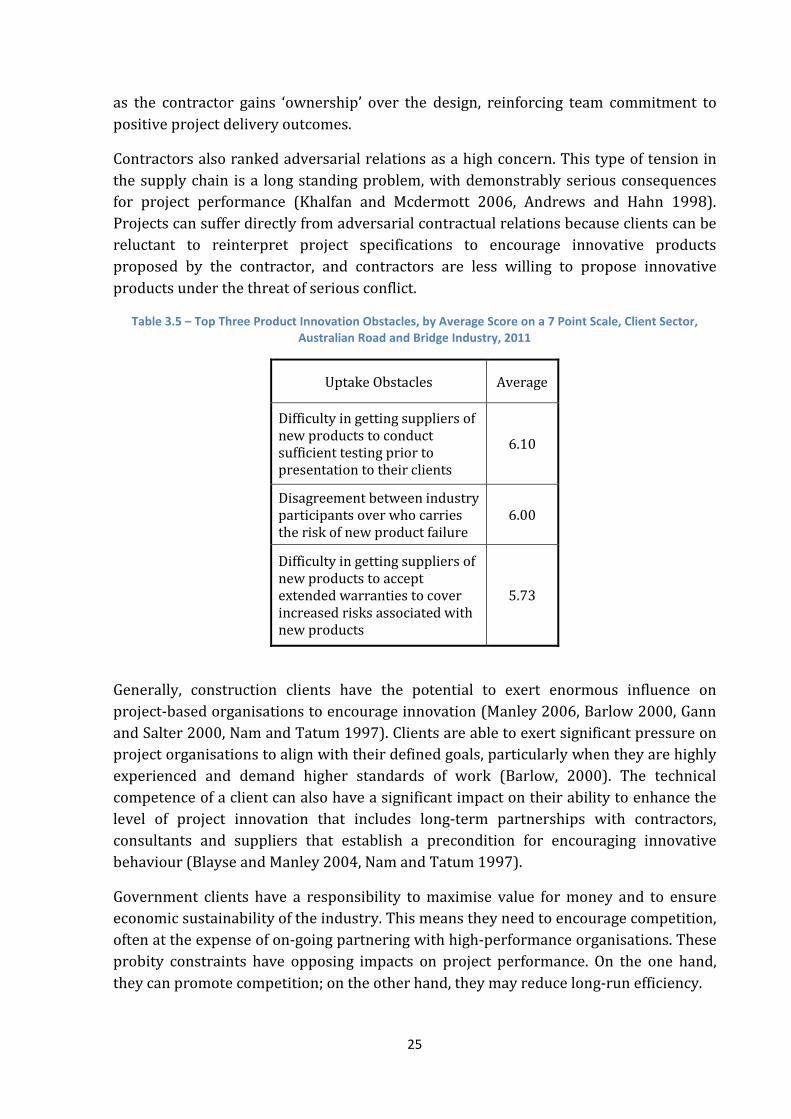
Table 3.5 – Top Three Product Innovation Obstacles, by Average Score on a 7 Point Scale, Client Sector, Australian Road and Bridge Industry, 2011
Uptake Obstacles Average
Difficulty in getting suppliers of new products to conduct sufficient testing prior to presentation to their clients
6.10
Disagreement between industry participants over who carries the risk of new product failure
6.00
Difficulty in getting suppliers of new products to accept extended warranties to cover increased risks associated with new products
5.73
Generally, construction clients have the potential to exert enormous influence on project-based organisations to encourage innovation (Manley 2006, Barlow 2000, Gann and Salter 2000, Nam and Tatum 1997). Clients are able to exert significant pressure on project organisations to align with their defined goals, particularly when they are highly experienced and demand higher standards of work (Barlow, 2000). The technical competence of a client can also have a significant impact on their ability to enhance the level of project innovation that includes long-term partnerships with contractors, consultants and suppliers that establish a precondition for encouraging innovative behaviour (Blayse and Manley 2004, Nam and Tatum 1997).
Government clients have a responsibility to maximise value for money and to ensure economic sustainability of the industry. This means they need to encourage competition, often at the expense of on-going partnering with high-performance organisations. These probity constraints have opposing impacts on project performance. On the one hand, they can promote competition; on the other hand, they may reduce long-run efficiency.
26
The client respondents clearly indicated that they believe the economic sustainability of the industry and project efficiency depends on suppliers effectively testing new products prior to proposing that clients adopt them. New product suppliers, such as those in our survey, are central players in promoting innovation in the construction industry (Blayse and Manley 2004, Slaughter 1993). Yet, it appears that project clients are dissatisfied with the level of testing conducted prior to the proposal of new products. The submission of poorly tested product ideas can tie up client resources, leaving less time for the consideration of robust ideas and encouraging client cynicism.
Clients also indicated there is disagreement within the industry over who should bear the risk for innovative product failure. The boundaries between supplier responsibility, contractor responsibility, consultant responsibility and client responsibility for new product performance are unclear. Who is best able to manage the risk of failure? Clearly, the results indicate greater clarity is required about who bears the risk and responsibility for new products that may not have been extensively tested in the field.
Clients consider that contractors and suppliers should be taking more responsibility for certifying the long-term performance of the new products they propose. Clients find it difficult to get suppliers to warrant the performance of their new products over the long term. Product liability litigation in civil construction, and a perception that new product applications can result in high exposure to liability, can make clients apprehensive about experimentation (Gittings and Bagby 1996). The survey results indicate client agencies require greater assurance of the long-term performance of new products through warranties to cover an increase in product failure risk. Alternatively, it may be that if suppliers conducted more robust product testing and verification, the need for extended product warranties would be lessened. Without such changes, clients are likely to be risk averse and unwilling to experiment with new products.
Overall, the sector results showed that the strongest views were held by contractors and clients. The highest scoring obstacle across all the sectors was contractors’ concern about restrictive tender assessment (score 6.25), followed by contractors’ concerns that they are excluded from design phases (6.10) and clients’ concerns about insufficient supplier testing of innovations (6.10).
3.4 Learning Capacity
Learning capacity is a key driver of innovation within organisations (Cohen and Levinthal 1990). Learning capacity refers to the fundamental learning process of an organisation and its ability to identify, assimilate and exploit knowledge from its external environment (Cohen and Levinthal 1990). Learning capacity is an essential survival trait for an organisation because it allows the organisation to complement, reinforce and refocus its knowledge base (Lane et al. 2006). A recent study has verified the existence of four phases that constitute learning capacity in two dimensions
27
(Jiménez-Barrionuevo et al. 2010). The same study developed and validated a set of survey questions to measure these components. The current study uses the same very robust measures. Such measures assess ‘the organisation’s relative ability to develop a set of organisational routines and strategic processes through which it acquires, assimilates, transforms and exploits knowledge acquired from outside the organisation in order to create value’ (Jiménez-Barrionuevo et al. 2010, p.3). This definition is based on the seminal work by Zahra and George (2002).
The current study examined the four phases constituting learning capacity: acquisition, assimilation, transformation and exploitation. Acquisition refers to an organisation’s ability to locate, identify, evaluate and acquire external relevant knowledge to aid in the internal development of its operations (Zahra and George 2002, Lane and Lubatkin 1998). Assimilation refers to an organisation’s ability to understand external knowledge, for instance the ability to classify and process external knowledge for internal use (Szulanski 1996, Cohen and Levinthal 1990). Transformation refers to an organisation’s ability to combine newly acquired or assimilated knowledge with existing knowledge and adapt existing knowledge for new purposes (Todorova and Durisin 2007, Jansen et al. 2005). Exploitation refers to an organisation’s capacity to take the knowledge that has been acquired, assimilated and transformed and incorporate it into its operations for use in the external improvement of goods, systems, and processes (Jiménez-Barrionuevo et al. 2010).
This survey explored these four learning capacity phases using validated questions developed by Jiménez-Barrionuevo et al. (2010). It contained questions about the ‘measured items’ associated with each phase. The acquisition phase questions were about interaction, trust, respect and reciprocity. The assimilation phase questions were about common language, complementarity, similarity and compatibility. The transformation phase questions covered communication, meetings, documentation, transmission, time and flow. Lastly, the exploitation phase comprised questions about responsibility and application. Further discussion of these items is presented in Appendix E.
In the current study, the measure of an organisation’s learning capacity was based on the average response to each phase, based on the questions around each of the items contained in that phase, aggregated across the four phases. Organisations were then arranged into ‘low’, ‘medium’ and ‘high’ groups by ranking them from highest to lowest based on their total learning capacity value, then dividing this range by three to arrive at the cut-off interval between groups. The highest value across the 212 respondents was 25 and the lowest value was 13. The total range in values was 12 and the interval separating the three groups was 4. Thus, the ‘low’ group had scores less than 17, the ‘medium’ group had scores between 17 and 21, and the ‘high’ group scored over 21.
Figure 3.3 presents the distribution of total learning capacity based on the number of organisations falling into each of the groups.
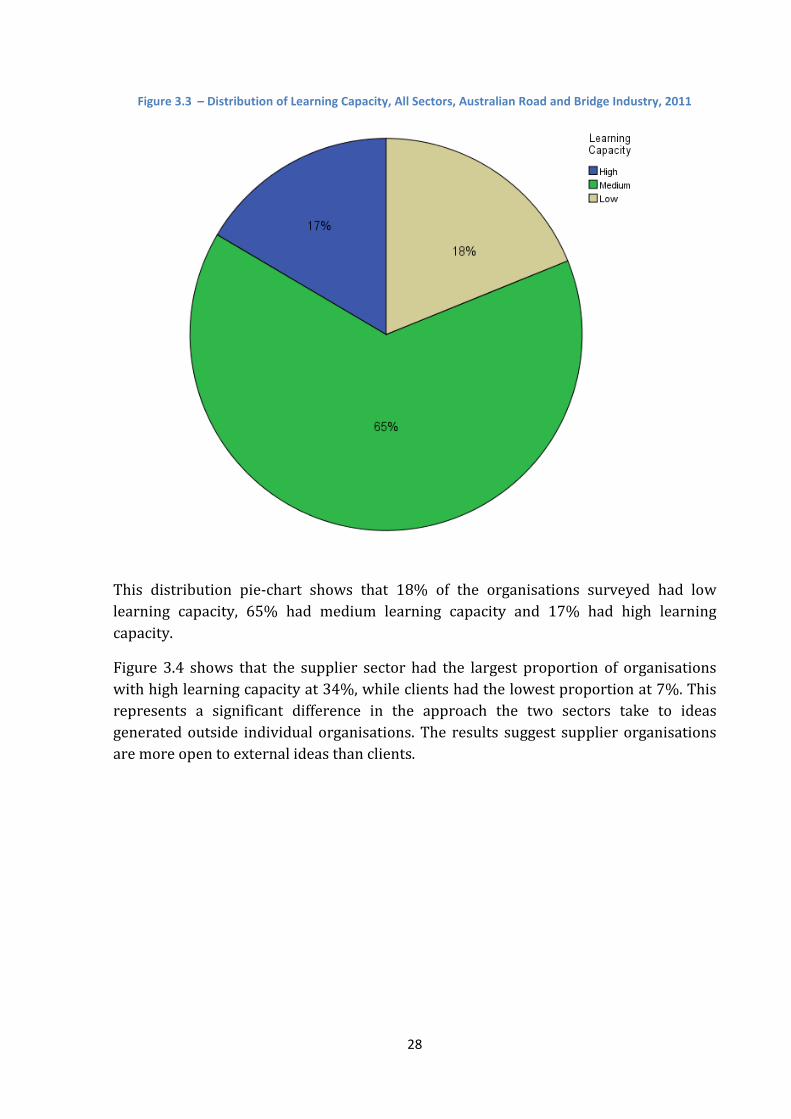
28
Figure 3.3 – Distribution of Learning Capacity, All Sectors, Australian Road and Bridge Industry, 2011
This distribution pie-chart shows that 18% of the organisations surveyed had low learning capacity, 65% had medium learning capacity and 17% had high learning capacity.
Figure 3.4 shows that the supplier sector had the largest proportion of organisations with high learning capacity at 34%, while clients had the lowest proportion at 7%. This represents a significant difference in the approach the two sectors take to ideas generated outside individual organisations. The results suggest supplier organisations are more open to external ideas than clients.
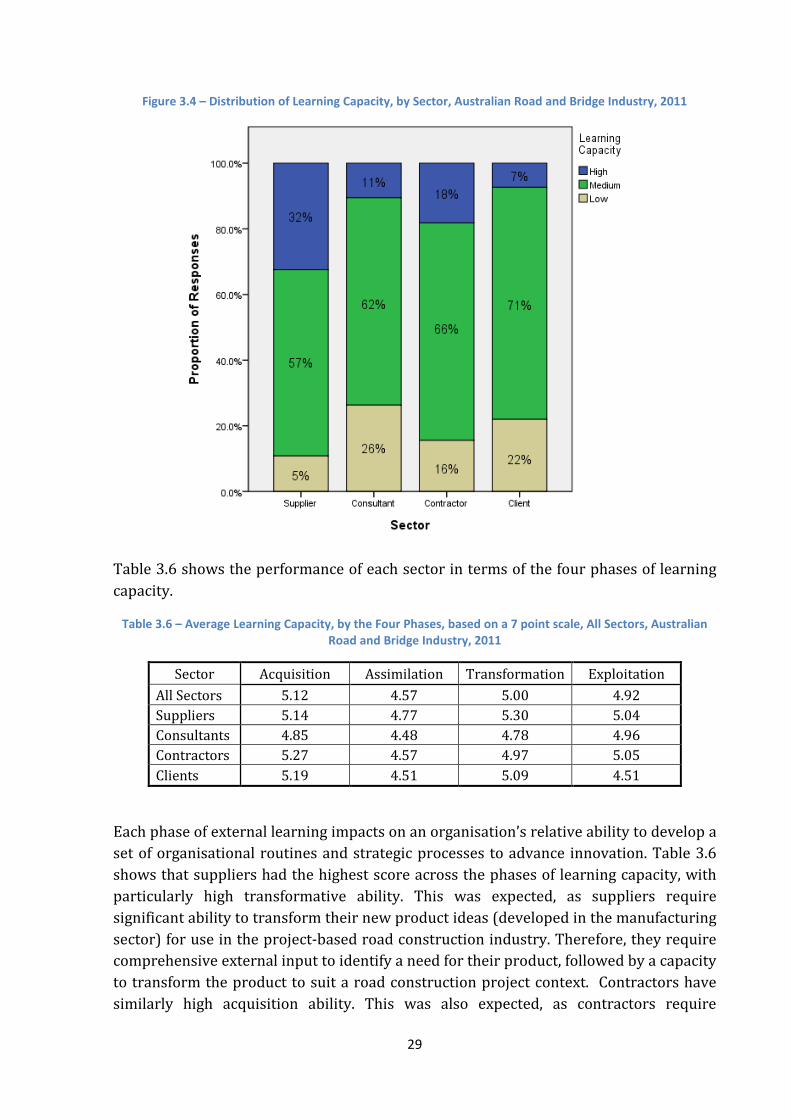
29
Figure 3.4 – Distribution of Learning Capacity, by Sector, Australian Road and Bridge Industry, 2011
Table 3.6 shows the performance of each sector in terms of the four phases of learning capacity.
Table 3.6 – Average Learning Capacity, by the Four Phases, based on a 7 point scale, All Sectors, Australian Road and Bridge Industry, 2011
Sector Acquisition Assimilation Transformation Exploitation All Sectors 5.12 4.57 5.00 4.92 Suppliers 5.14 4.77 5.30 5.04 Consultants 4.85 4.48 4.78 4.96 Contractors 5.27 4.57 4.97 5.05 Clients 5.19 4.51 5.09 4.51
Each phase of external learning impacts on an organisation’s relative ability to develop a set of organisational routines and strategic processes to advance innovation. Table 3.6 shows that suppliers had the highest score across the phases of learning capacity, with particularly high transformative ability. This was expected, as suppliers require significant ability to transform their new product ideas (developed in the manufacturing sector) for use in the project-based road construction industry. Therefore, they require comprehensive external input to identify a need for their product, followed by a capacity to transform the product to suit a road construction project context. Contractors have similarly high acquisition ability. This was also expected, as contractors require
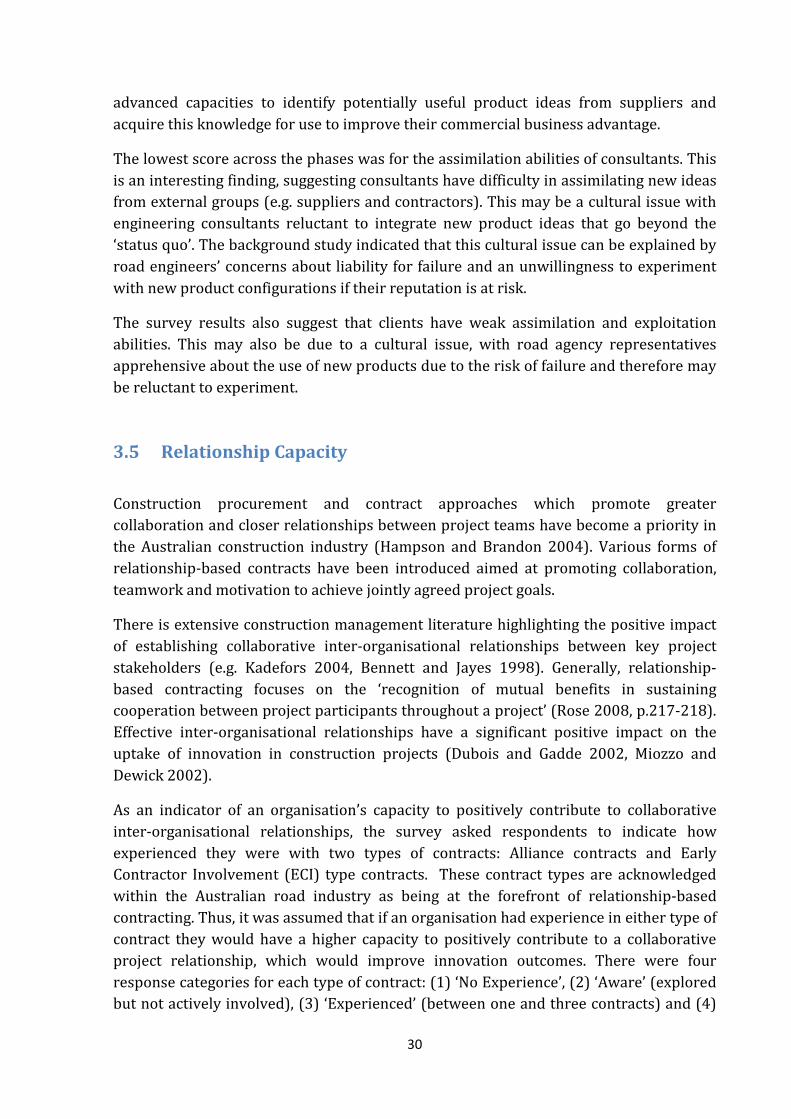
30
advanced capacities to identify potentially useful product ideas from suppliers and acquire this knowledge for use to improve their commercial business advantage.
The lowest score across the phases was for the assimilation abilities of consultants. This is an interesting finding, suggesting consultants have difficulty in assimilating new ideas from external groups (e.g. suppliers and contractors). This may be a cultural issue with engineering consultants reluctant to integrate new product ideas that go beyond the ‘status quo’. The background study indicated that this cultural issue can be explained by road engineers’ concerns about liability for failure and an unwillingness to experiment with new product configurations if their reputation is at risk.
The survey results also suggest that clients have weak assimilation and exploitation abilities. This may also be due to a cultural issue, with road agency representatives apprehensive about the use of new products due to the risk of failure and therefore may be reluctant to experiment.
3.5 Relationship Capacity
Construction procurement and contract approaches which promote greater collaboration and closer relationships between project teams have become a priority in the Australian construction industry (Hampson and Brandon 2004). Various forms of relationship-based contracts have been introduced aimed at promoting collaboration, teamwork and motivation to achieve jointly agreed project goals.
There is extensive construction management literature highlighting the positive impact of establishing collaborative inter-organisational relationships between key project stakeholders (e.g. Kadefors 2004, Bennett and Jayes 1998). Generally, relationship-based contracting focuses on the ‘recognition of mutual benefits in sustaining cooperation between project participants throughout a project’ (Rose 2008, p.217-218). Effective inter-organisational relationships have a significant positive impact on the uptake of innovation in construction projects (Dubois and Gadde 2002, Miozzo and Dewick 2002).
As an indicator of an organisation’s capacity to positively contribute to collaborative inter-organisational relationships, the survey asked respondents to indicate how experienced they were with two types of contracts: Alliance contracts and Early Contractor Involvement (ECI) type contracts. These contract types are acknowledged within the Australian road industry as being at the forefront of relationship-based contracting. Thus, it was assumed that if an organisation had experience in either type of contract they would have a higher capacity to positively contribute to a collaborative project relationship, which would improve innovation outcomes. There were four response categories for each type of contract: (1) ‘No Experience’, (2) ‘Aware’ (explored but not actively involved), (3) ‘Experienced’ (between one and three contracts) and (4)
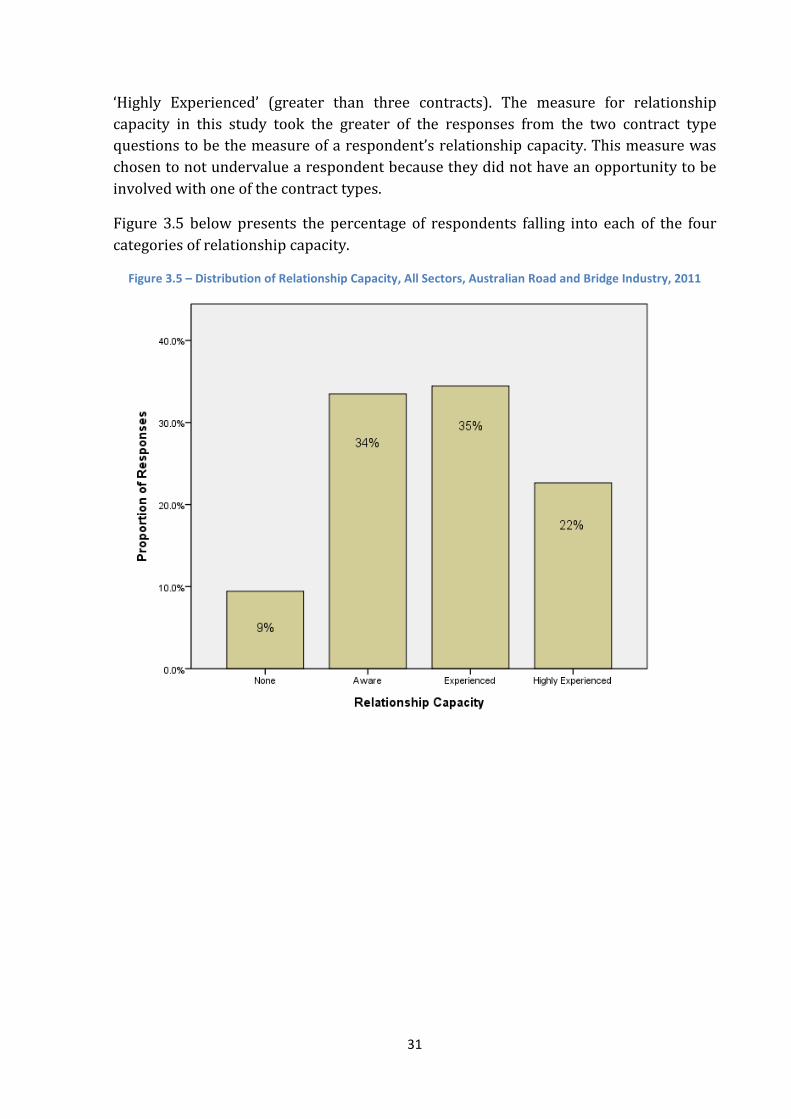
31
‘Highly Experienced’ (greater than three contracts). The measure for relationship capacity in this study took the greater of the responses from the two contract type questions to be the measure of a respondent’s relationship capacity. This measure was chosen to not undervalue a respondent because they did not have an opportunity to be involved with one of the contract types.
Figure 3.5 below presents the percentage of respondents falling into each of the four categories of relationship capacity.
Figure 3.5 – Distribution of Relationship Capacity, All Sectors, Australian Road and Bridge Industry, 2011
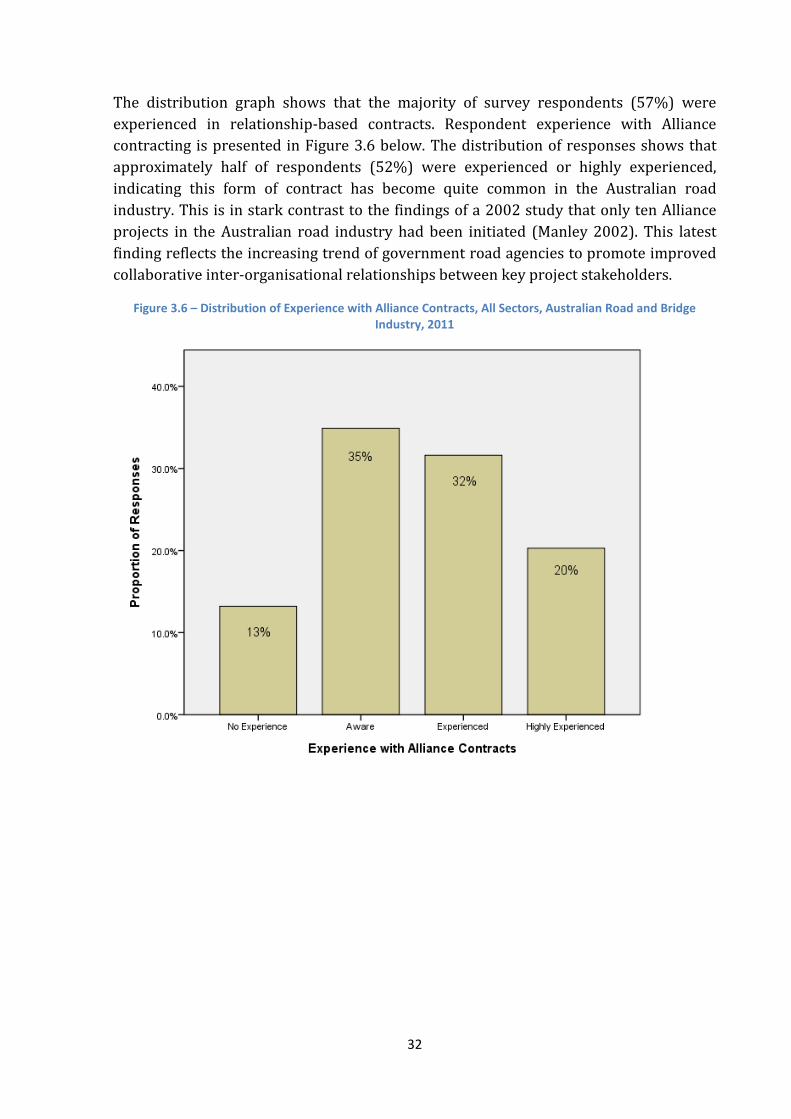
32
The distribution graph shows that the majority of survey respondents (57%) were experienced in relationship-based contracts. Respondent experience with Alliance contracting is presented in Figure 3.6 below. The distribution of responses shows that approximately half of respondents (52%) were experienced or highly experienced, indicating this form of contract has become quite common in the Australian road industry. This is in stark contrast to the findings of a 2002 study that only ten Alliance projects in the Australian road industry had been initiated (Manley 2002). This latest finding reflects the increasing trend of government road agencies to promote improved collaborative inter-organisational relationships between key project stakeholders.
Figure 3.6 – Distribution of Experience with Alliance Contracts, All Sectors, Australian Road and Bridge Industry, 2011
33
In contrast to the distribution of Alliancing experience, the majority of respondents (66%) had no experience or were aware of ECI-type contracts. This finding was expected, as the ECI-type contract is a relatively new form of contract in comparison with Alliancing. A positive finding was that 45% of respondents were aware of this form of contract (i.e. have explored it but have not been actively involved). This indicates a high level of awareness of this form of contract but limited exposure, in comparison with the more common Alliance contract. Despite the relative lack of exposure, 34% of respondents had some level of experience.
Figure 3.7 – Distribution of Experience with Early Contractor Involvement Type Contracts, All Sectors, Australian Road and Bridge Industry, 2011
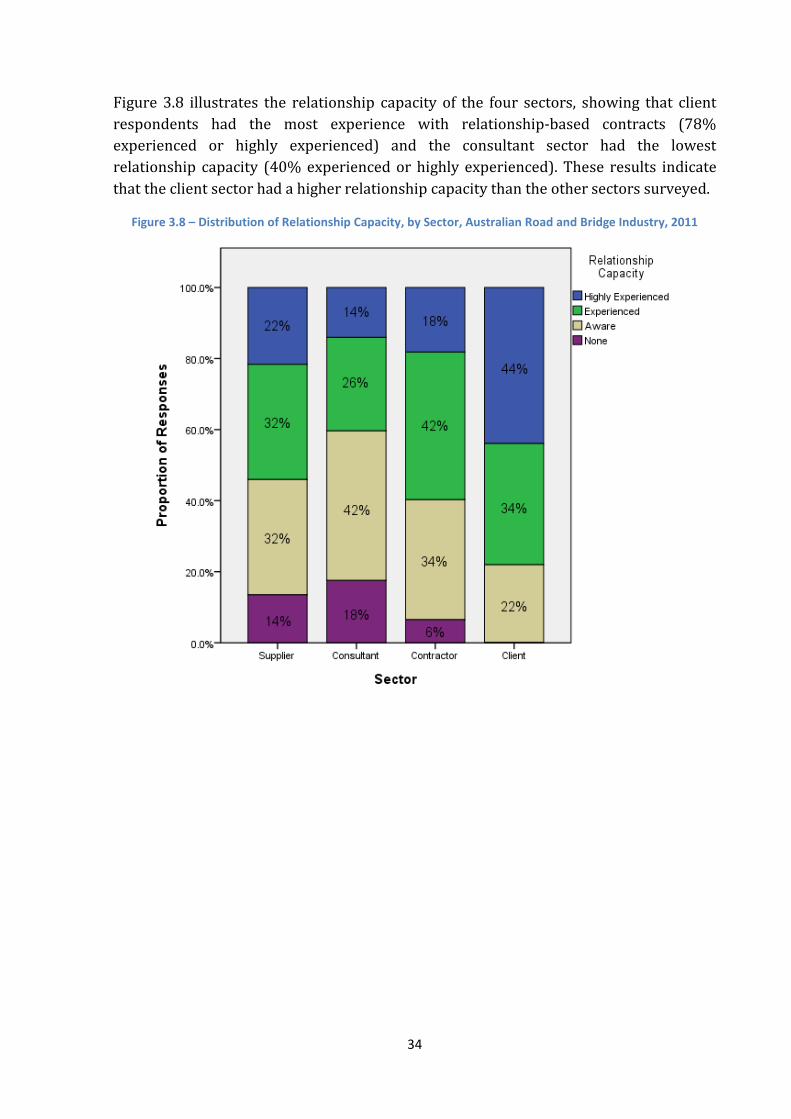
34
Figure 3.8 illustrates the relationship capacity of the four sectors, showing that client respondents had the most experience with relationship-based contracts (78% experienced or highly experienced) and the consultant sector had the lowest relationship capacity (40% experienced or highly experienced). These results indicate that the client sector had a higher relationship capacity than the other sectors surveyed.
Figure 3.8 – Distribution of Relationship Capacity, by Sector, Australian Road and Bridge Industry, 2011
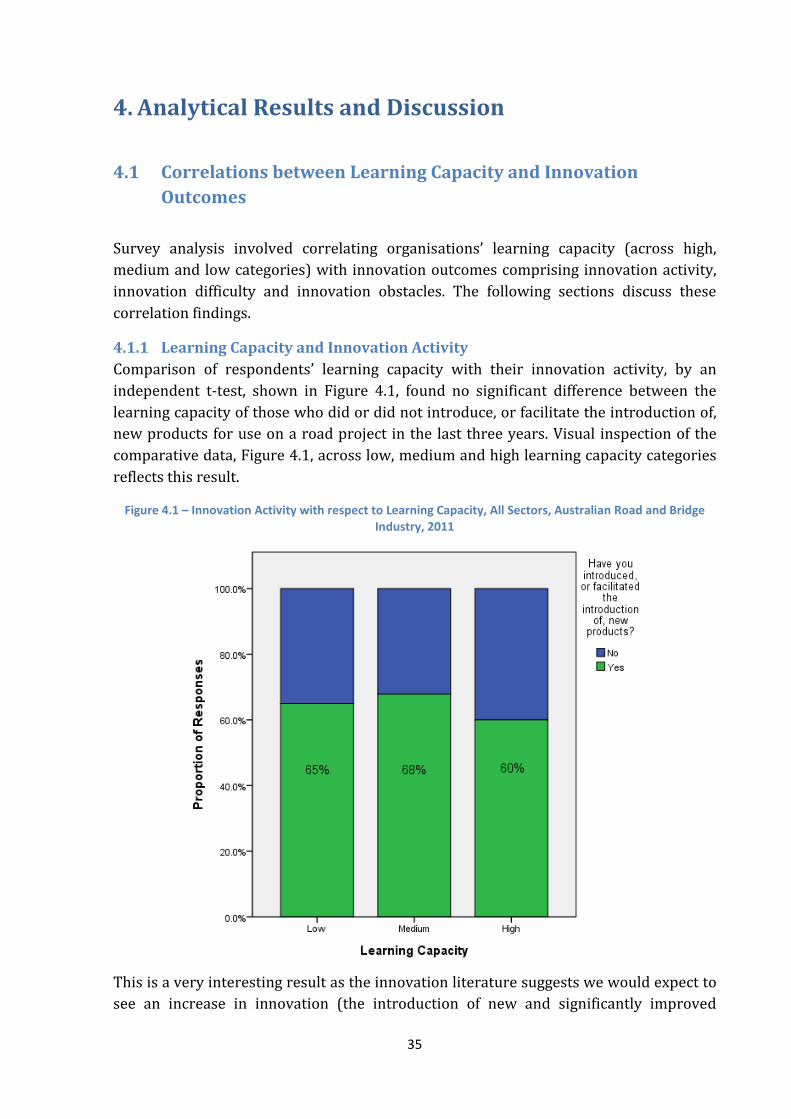
35
4. Analytical Results and Discussion
4.1 Correlations between Learning Capacity and Innovation Outcomes
Survey analysis involved correlating organisations’ learning capacity (across high, medium and low categories) with innovation outcomes comprising innovation activity, innovation difficulty and innovation obstacles. The following sections discuss these correlation findings.
4.1.1 Learning Capacity and Innovation Activity Comparison of respondents’ learning capacity with their innovation activity, by an independent t-test, shown in Figure 4.1, found no significant difference between the learning capacity of those who did or did not introduce, or facilitate the introduction of, new products for use on a road project in the last three years. Visual inspection of the comparative data, Figure 4.1, across low, medium and high learning capacity categories reflects this result.
Figure 4.1 – Innovation Activity with respect to Learning Capacity, All Sectors, Australian Road and Bridge Industry, 2011
This is a very interesting result as the innovation literature suggests we would expect to see an increase in innovation (the introduction of new and significantly improved
36
products) as an organisation’s learning capacity increases. According to Lane et al. (2006), absorptive capacity (learning capacity) ‘helps the speed, frequency and magnitude of innovation and that innovation produces knowledge that becomes part of the firm’s absorptive capacity’.
The reason for our finding was that the survey question for innovation activity (question 2) was purposefully written to capture not only respondents who have introduced a new product innovation, but also respondents who have facilitated the introduction of new products. The inclusion of both ‘initiators’ and ‘facilitators’ in the phrasing of the question was intended to capture the team-based nature of construction project production that requires loosely coupled organisations to effectively collaborate to successfully deliver a construction project (Dubois and Gadde 2002). The findings suggest the majority of organisations which responded to this question were facilitators and that facilitators don’t need the same high level of learning capacity as initiators. This high level of innovation facilitation is consistent with the team-based nature of construction innovation efforts, as documented in the extensive literature on the collaborative nature of construction innovation (Manley 2006).
4.1.2 Learning Capacity and Innovation Difficulty Analysis of the survey results identified no significant correlation between innovation difficulty and learning capacity. This is an unexpected finding considering the extensive innovation literature showing that difficulty in introducing innovation is reduced by improved learning capacity (Cohen and Levinthal 1990, Cohen and Levinthal 1989).
The explanation is that respondent organisations were rating their difficulty as either an introducer of new products (an ’initiator’) or as a facilitator of new product introduction (a ‘facilitator’). It seems that facilitators dominated the sample and that they did not experience the same levels of difficulty as the original initiator or require the same level of learning capacity to act in this role. This weakened the expected relationship between the two variables.
4.1.3 Learning Capacity and Innovation Obstacles We developed a single measure of the importance each respondent placed on addressing the 22 obstacles listed in the survey. We did this to facilitate the correlation of innovation obstacles with innovation capacities. We obtained the single measure by taking the average of all the innovation obstacle questions for each respondent. This value is representative of the overall importance a respondent placed on addressing the obstacles hindering innovation. The survey analysis identified a significant positive correlation (99% confidence level) using a Spearman’s rho test between learning capacity and innovation obstacles (i.e. importance placed addressing obstacles by respondent).
We expected that organisations with greater learning capacity would rank the resolution of innovation obstacles as more important. Given the strong links in the literature and practice between learning capacity and innovation, this is the same as saying that we
37
expected that highly innovative organisations would encounter the obstacles more frequently and be more inconvenienced by them, compared with less innovative organisations. Highly innovative organisations would consider it more important to address such obstacles. The strongest results in the study were found in support of this relationship. Organisations with higher learning capacity were more likely than organisations with lower learning capacity to rank the resolution of obstacles as very important.
Cohen and Levinthal (1990) argued that knowledge of innovation potential is based on cumulative learning capacity and this is supported by our survey findings. Thus, if an organisation is engaged in innovative activities, it is more likely to predict (and understand) the nature of any barriers they may face. On the other hand, if an organisation is not engaged in such activities, it is less likely to expect or understand the barriers.
Organisations that do not invest in their learning capacity in a fast-moving field face the prospect of being unable to assimilate and exploit new innovation information (Cohen and Levinthal 1990). Similarly, if an organisation does not pursue innovation (and is not aware of the barriers), it is less likely to invest in learning capacity.
4.2 Correlations between Relationship Capacity and Innovation Outcomes
Survey analysis involved correlating organisations’ relationship capacity across the four relationship-based contract experience levels (no experience, aware, experienced and highly experienced) with innovation outcomes comprising innovation activity, innovation difficulty and innovation obstacles. The following sections discuss these correlation findings.
4.2.1 Relationship Capacity and Innovation Activity The survey results showed that organisations with higher relationship capacity were more likely to have introduced, or facilitated the introduction of, new products. Similarly, innovators, whether ‘initiators’ or ‘facilitators’, were more likely than non-innovators to have relationship contract experience. This is shown in Figure 4.2. Only 35% of those with no relationship capacity had introduced, or facilitated the introduction of, new products while 56% who were aware of relationship based contracts had done so. This percentage jumped to 80% and 73% for those who were experienced and highly experienced respectively. Generally speaking, the likelihood of having introduced, or facilitated the introduction of, new products increases as a respondent’s relationship capacity increases. There is a clear distinction in innovative activity between those without relationship contract experience (‘none’ and ‘aware’) and those with contract experience (‘experienced’ and ‘highly experienced’). Approximately half of the respondents (52%) with no relationship contact experience
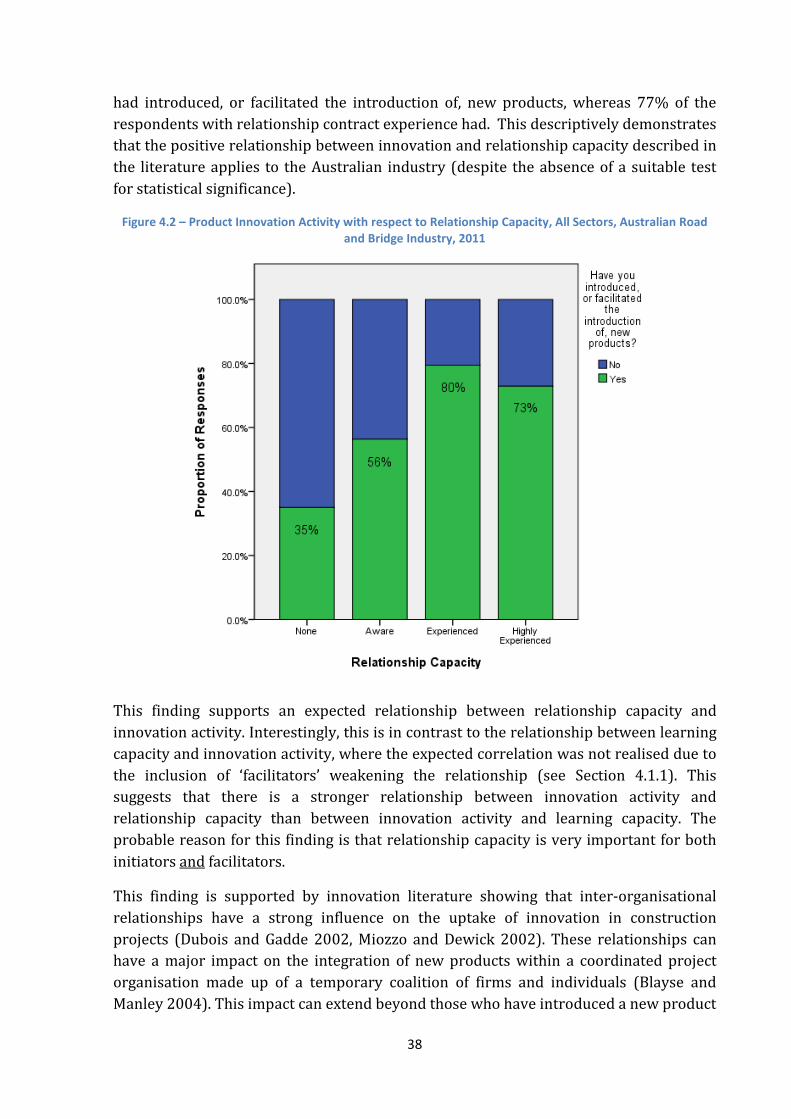
38
had introduced, or facilitated the introduction of, new products, whereas 77% of the respondents with relationship contract experience had. This descriptively demonstrates that the positive relationship between innovation and relationship capacity described in the literature applies to the Australian industry (despite the absence of a suitable test for statistical significance).
Figure 4.2 – Product Innovation Activity with respect to Relationship Capacity, All Sectors, Australian Road and Bridge Industry, 2011
This finding supports an expected relationship between relationship capacity and innovation activity. Interestingly, this is in contrast to the relationship between learning capacity and innovation activity, where the expected correlation was not realised due to the inclusion of ‘facilitators’ weakening the relationship (see Section 4.1.1). This suggests that there is a stronger relationship between innovation activity and relationship capacity than between innovation activity and learning capacity. The probable reason for this finding is that relationship capacity is very important for both initiators and facilitators.
This finding is supported by innovation literature showing that inter-organisational relationships have a strong influence on the uptake of innovation in construction projects (Dubois and Gadde 2002, Miozzo and Dewick 2002). These relationships can have a major impact on the integration of new products within a coordinated project organisation made up of a temporary coalition of firms and individuals (Blayse and Manley 2004). This impact can extend beyond those who have introduced a new product
39
to those who see themselves as facilitators in the use of a product on a project, especially those spanning manufacturing and construction industries. For example, complex reconfigurations of manufactured products in an architectural design creating innovative linkages with other components need considerable facilitation (Henderson and Clark 1990). Clearly, construction organisations’ ability to innovate depends to a degree on sustained co-operation across interacting organisations to advance products, processes and design (Miozzo and Dewick 2002).
Therefore, both initiators and facilitators see robust project relationships as important to promoting innovation activity through enhanced knowledge flows. Also, as innovative knowledge development is not sequential and requires multiple feedback loops across interrelated firms (Lichtenthaler and Lichtenthaler 2009), it is assumed successful innovation activity can encourage improved relationship capacity across interactive organisations.
4.2.2 Relationship Capacity and Innovation Difficulty There was a significant difference between organisations with relationship capacity experience and those with no experience in their ranking of innovation difficulty (ANOVA, 90% confidence level). A significant difference emerged when respondents’ relationship capacity was aggregated across those who have relationship contracting experience (experienced or highly experienced) and those who have no direct experience (no experience or aware). This finding was supported by an independent t-test (90% confidence level). Descriptive statistics yielded consistent results, showing, for instance, that 84% of non-experienced respondents found innovation ‘very hard’, ‘hard’, or ‘somewhat hard’, whereas only 73% of experienced respondents did so.
These findings support an expected relationship between innovation difficulty and relationship capacity. The inclusion of ‘facilitators’ as innovators (only innovators answered the ‘difficulty’ question) had little impact on the expected relationship. Relationship capacity is needed by both organisations that directly introduce new products and organisations that see themselves as facilitating the introduction of new products.
4.2.3 Relationship Capacity and Innovation Obstacles A significant difference was found between respondents with and without relationship capacity experience in the overall importance they placed on addressing product uptake obstacles (ANOVA, 99% confidence level). Those without relationship contracting experience rated the importance of addressing innovation obstacles significantly lower than those with experience. Descriptive statistics yielded consistent results. For instance, 72% of experienced respondents thought that, on average, it was ‘somewhat important’, ‘important’ or ‘very important’ to address innovation obstacles, while only 63% of non-experienced respondents did so.
This finding parallels the significant correlation identified between learning capacity and importance placed on addressing innovation obstacles. For both types of innovation
40
capacity – relationship capacity or learning capacity – the greater the capacity the greater the importance attached to addressing innovation obstacles.
The finding suggests that those with greater experience with collaborative project relationships are more aware of the obstacles they face in introducing, or facilitating the introduction of, new products. The nature of the construction product system involves significant challenges to the adoption of innovation that can be addressed through the development of robust industry relationships (Blayse and Manley 2004). Construction management literature proposes that repeat interactions between project team players within a complementary relationship-focused contractual approach increases the value of perusing mutual goals, promotes learning from relationship experience (promoting trust) and enhances the teams’ ability to recognise and address obstacles to achieving mutual goals (Pryke and Smyth 2006).
The survey finding supports this view, showing that organisations with greater capacity to embrace a collaborative team environment (under a complementary contract) had greater capacity to recognise and address obstacles impeding innovation. On the other hand, joint recognition of obstacles by a project team promotes shared learning, increasing an organisation’s relationship experience. The survey results indicated that greater relationship contracting experience leads to greater interest in overcoming the obstacles to adopting new products in projects.
41
5. Conclusions Construction product innovation can exert a positive influence on project and industry performance; however, effective construction innovation requires close collaboration across a complex cluster of project organisations (Dubois and Gadde, 2002). The survey results presented in this report suggest the adoption of product innovation across complex construction supply chains remains a challenging task. Although the majority of respondents have introduced, or facilitated the introduction of, new products, the extent of such activity was significantly compromised by several shortcomings. The main findings are as follows:
1. Although 66% of the industry participated in the introduction of new products between 2009 and 2011, 77% found the process difficult. This indicates substantial opportunity for efficiency improvements.
2. The obstacles that most need addressing were (1) too much focus on direct project costs during tender and idea assessment and (2) disagreement over who carries the risk of new product failure, with issues including insufficient testing, trialling and/or lack of warranty. These obstacles were the top two for the industry, and were also the top-ranked obstacles across the four sectors.
3. Contractors and suppliers ranked ‘restrictive tender assessment’ as their number one obstacle, while consultants thought there was too much emphasis on direct costs compared with whole-of-life costs, and clients thought suppliers should do more thorough testing prior to proposing a new product.
4. The supplier sector had the largest proportion (32%) of organisations with high learning capacity, while clients had the lowest proportion (7%) of organisations with high learning capacity. The client group was the least effective in absorbing ideas developed outside their own organisations. This considerably limits their growth potential compared with the other three sectors.
5. The client sector’s innovation capacity is shaped not only by their learning capacity, but also by their relationship capacity. Although clients had the lowest learning capacity across sectors, they had the best relationship capacity, with 78% having had experience with a relationship contract. Consultants had the lowest relationship capacity, with just 40% having been part of a relationship contract. Relationship capacity might be expected to enhance learning capacity, but this did not seem to be the case for clients. This lack of transference is cause for concern. Strong relationships should have had a bigger impact on learning and the ability to capitalise on knowledge generated by others.
6. Both learning capacity and relationship capacity had a significant positive influence on the importance to respondents of addressing product adoption obstacles. The greater the respondents’ learning capacity and/or relationship capacity, the greater was the importance to them of addressing innovation obstacles.
42
7. One of the strongest findings of the survey was that organisations with higher relationship capacities found it easier to innovate. The results demonstrate that relationship-based contracts enhance the likelihood of innovative activity.
The survey results provide valuable evidence of, firstly, the link between relationship contracts and innovation and, secondly, the type of obstacles to product innovation on road and bridge construction projects. They provide a strong base for future research to be carried out in 2012 to further define the critical relationships and actions required to promote product innovation on projects. This work will involve the development of action plans to address highly ranked product adoption obstacles identified in this survey. These obstacles are clearly of concern to stakeholders involved in new product adoption on Australian road and bridge projects.
Recommendations to improve innovation performance will be made in the next project report, following the national workshops scheduled for 2012, which are aimed at building consensus between sectors on the ideal path forward. These workshops will focus on the two key obstacles identified by this study: (1) too much focus on direct project costs during tender and idea assessment and (2) disagreement over who carries the risk of new product failure, with issues including insufficient testing, trialling and/or lack of warranty.
43
APPENDICES
6. Appendix A: Innovation Obstacles Table 6.1, overleaf, is an exhaustive list of the product innovation obstacles ranked in descending order by the importance attached to their resolution. The list of 22 obstacles was derived from the background study. Overall importance for each issue was determined by taking the average value across respondents. To improve understanding, the mean values have been rounded to two decimal places only; however, in some cases this resulted in seemingly identical means. In these instances, the values prior to rounding were used to determine the overall order.
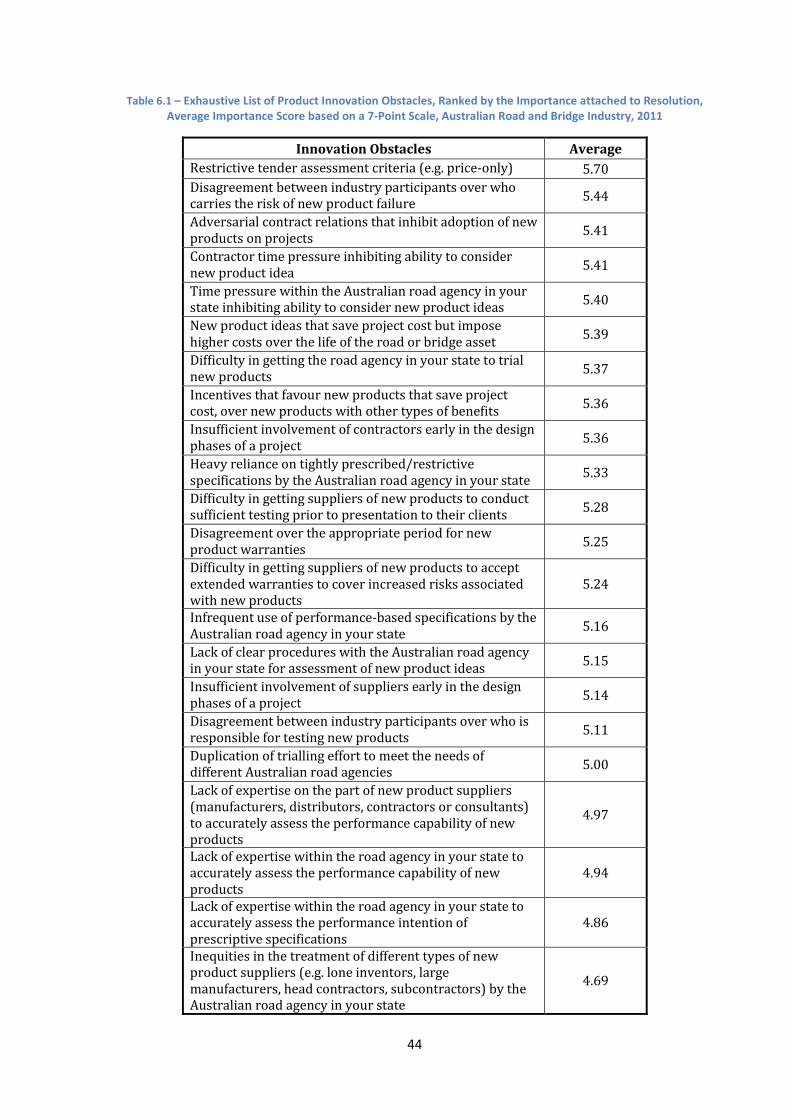
44
Table 6.1 – Exhaustive List of Product Innovation Obstacles, Ranked by the Importance attached to Resolution, Average Importance Score based on a 7-Point Scale, Australian Road and Bridge Industry, 2011
Innovation Obstacles Average Restrictive tender assessment criteria (e.g. price-only) 5.70 Disagreement between industry participants over who carries the risk of new product failure 5.44
Adversarial contract relations that inhibit adoption of new products on projects 5.41
Contractor time pressure inhibiting ability to consider new product idea 5.41
Time pressure within the Australian road agency in your state inhibiting ability to consider new product ideas 5.40
New product ideas that save project cost but impose higher costs over the life of the road or bridge asset 5.39
Difficulty in getting the road agency in your state to trial new products 5.37
Incentives that favour new products that save project cost, over new products with other types of benefits 5.36
Insufficient involvement of contractors early in the design phases of a project 5.36
Heavy reliance on tightly prescribed/restrictive specifications by the Australian road agency in your state 5.33
Difficulty in getting suppliers of new products to conduct sufficient testing prior to presentation to their clients 5.28
Disagreement over the appropriate period for new product warranties 5.25
Difficulty in getting suppliers of new products to accept extended warranties to cover increased risks associated with new products
5.24
Infrequent use of performance-based specifications by the Australian road agency in your state 5.16
Lack of clear procedures with the Australian road agency in your state for assessment of new product ideas 5.15
Insufficient involvement of suppliers early in the design phases of a project 5.14
Disagreement between industry participants over who is responsible for testing new products 5.11
Duplication of trialling effort to meet the needs of different Australian road agencies 5.00
Lack of expertise on the part of new product suppliers (manufacturers, distributors, contractors or consultants) to accurately assess the performance capability of new products
4.97
Lack of expertise within the road agency in your state to accurately assess the performance capability of new products
4.94
Lack of expertise within the road agency in your state to accurately assess the performance intention of prescriptive specifications
4.86
Inequities in the treatment of different types of new product suppliers (e.g. lone inventors, large manufacturers, head contractors, subcontractors) by the Australian road agency in your state
4.69
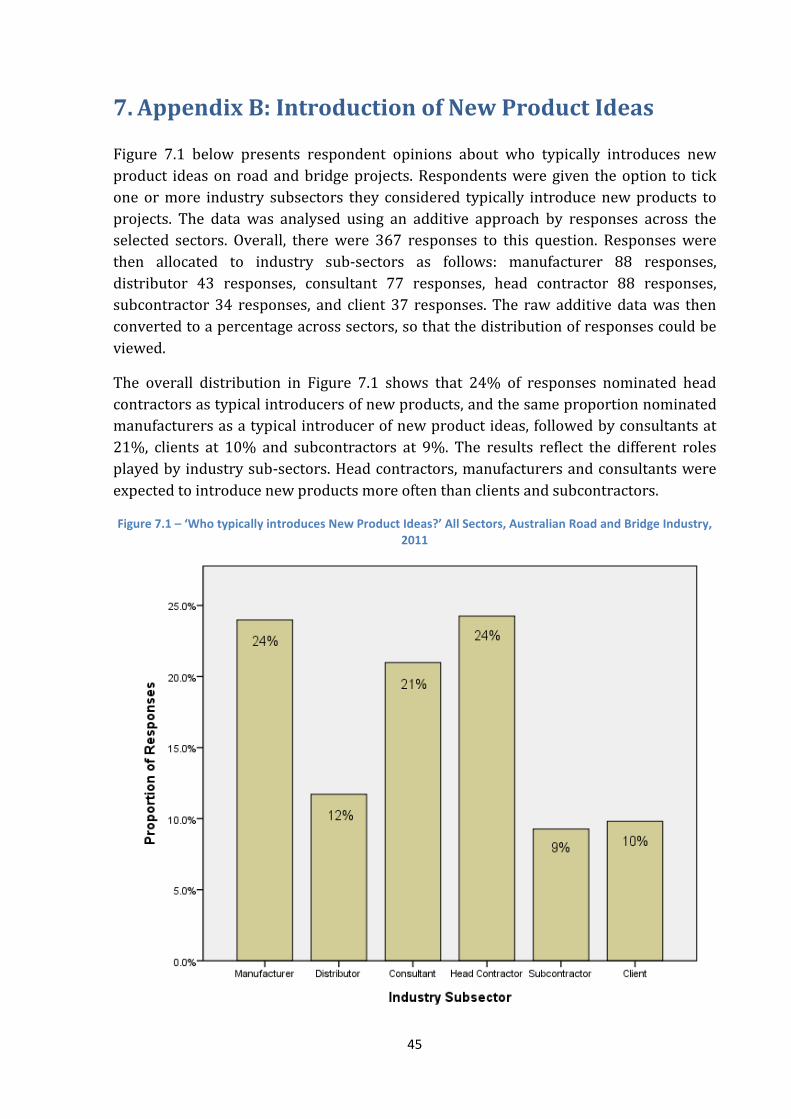
45
7. Appendix B: Introduction of New Product Ideas Figure 7.1 below presents respondent opinions about who typically introduces new product ideas on road and bridge projects. Respondents were given the option to tick one or more industry subsectors they considered typically introduce new products to projects. The data was analysed using an additive approach by responses across the selected sectors. Overall, there were 367 responses to this question. Responses were then allocated to industry sub-sectors as follows: manufacturer 88 responses, distributor 43 responses, consultant 77 responses, head contractor 88 responses, subcontractor 34 responses, and client 37 responses. The raw additive data was then converted to a percentage across sectors, so that the distribution of responses could be viewed.
The overall distribution in Figure 7.1 shows that 24% of responses nominated head contractors as typical introducers of new products, and the same proportion nominated manufacturers as a typical introducer of new product ideas, followed by consultants at 21%, clients at 10% and subcontractors at 9%. The results reflect the different roles played by industry sub-sectors. Head contractors, manufacturers and consultants were expected to introduce new products more often than clients and subcontractors.
Figure 7.1 – ‘Who typically introduces New Product Ideas?’ All Sectors, Australian Road and Bridge Industry, 2011
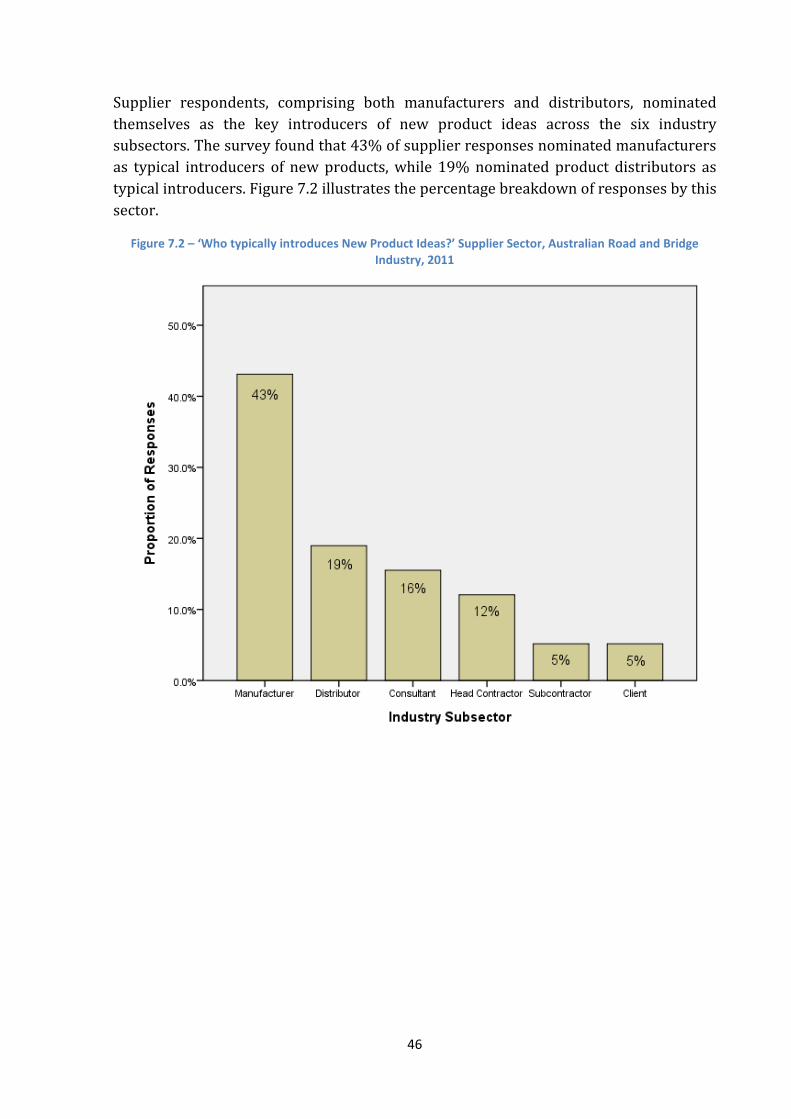
46
Supplier respondents, comprising both manufacturers and distributors, nominated themselves as the key introducers of new product ideas across the six industry subsectors. The survey found that 43% of supplier responses nominated manufacturers as typical introducers of new products, while 19% nominated product distributors as typical introducers. Figure 7.2 illustrates the percentage breakdown of responses by this sector.
Figure 7.2 – ‘Who typically introduces New Product Ideas?’ Supplier Sector, Australian Road and Bridge Industry, 2011
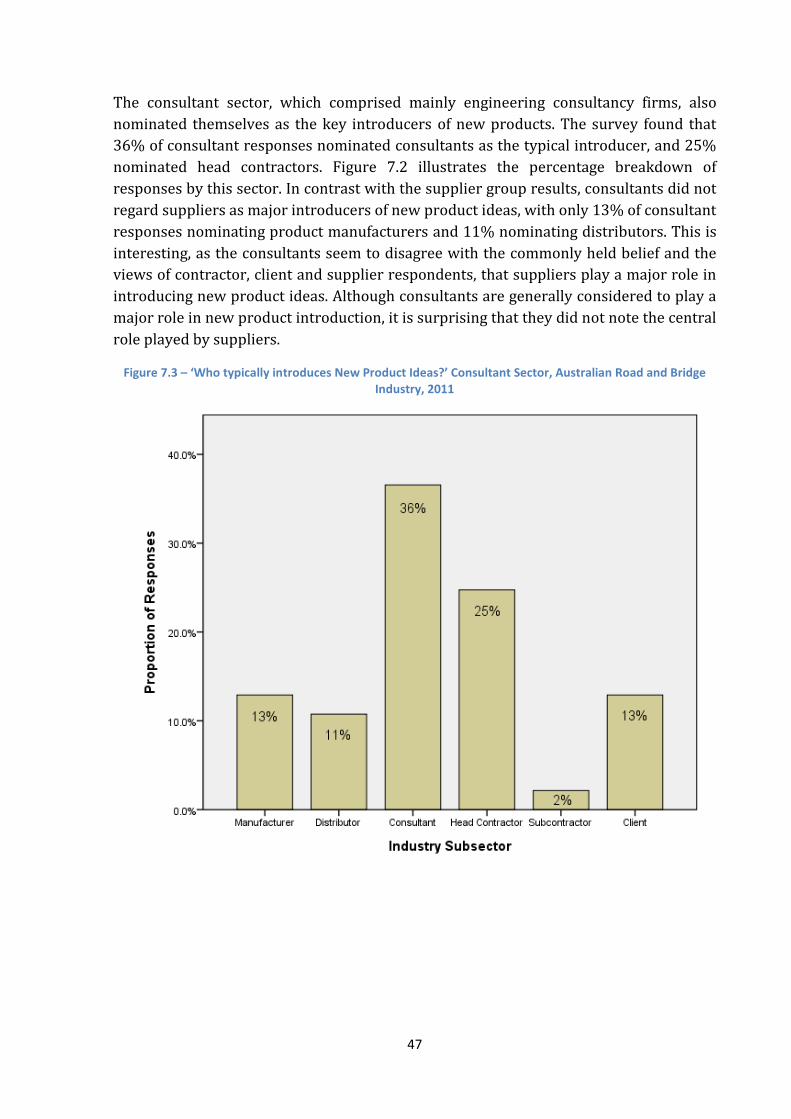
47
The consultant sector, which comprised mainly engineering consultancy firms, also nominated themselves as the key introducers of new products. The survey found that 36% of consultant responses nominated consultants as the typical introducer, and 25% nominated head contractors. Figure 7.2 illustrates the percentage breakdown of responses by this sector. In contrast with the supplier group results, consultants did not regard suppliers as major introducers of new product ideas, with only 13% of consultant responses nominating product manufacturers and 11% nominating distributors. This is interesting, as the consultants seem to disagree with the commonly held belief and the views of contractor, client and supplier respondents, that suppliers play a major role in introducing new product ideas. Although consultants are generally considered to play a major role in new product introduction, it is surprising that they did not note the central role played by suppliers.
Figure 7.3 – ‘Who typically introduces New Product Ideas?’ Consultant Sector, Australian Road and Bridge Industry, 2011
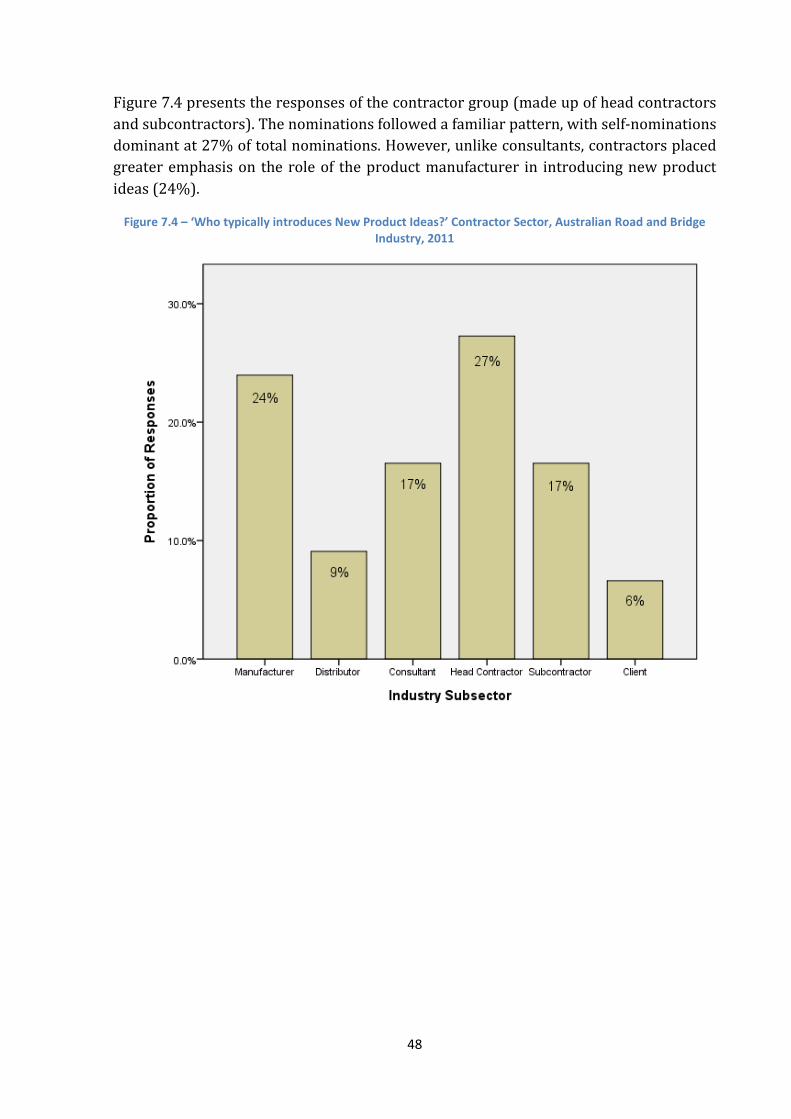
48
Figure 7.4 presents the responses of the contractor group (made up of head contractors and subcontractors). The nominations followed a familiar pattern, with self-nominations dominant at 27% of total nominations. However, unlike consultants, contractors placed greater emphasis on the role of the product manufacturer in introducing new product ideas (24%).
Figure 7.4 – ‘Who typically introduces New Product Ideas?’ Contractor Sector, Australian Road and Bridge Industry, 2011
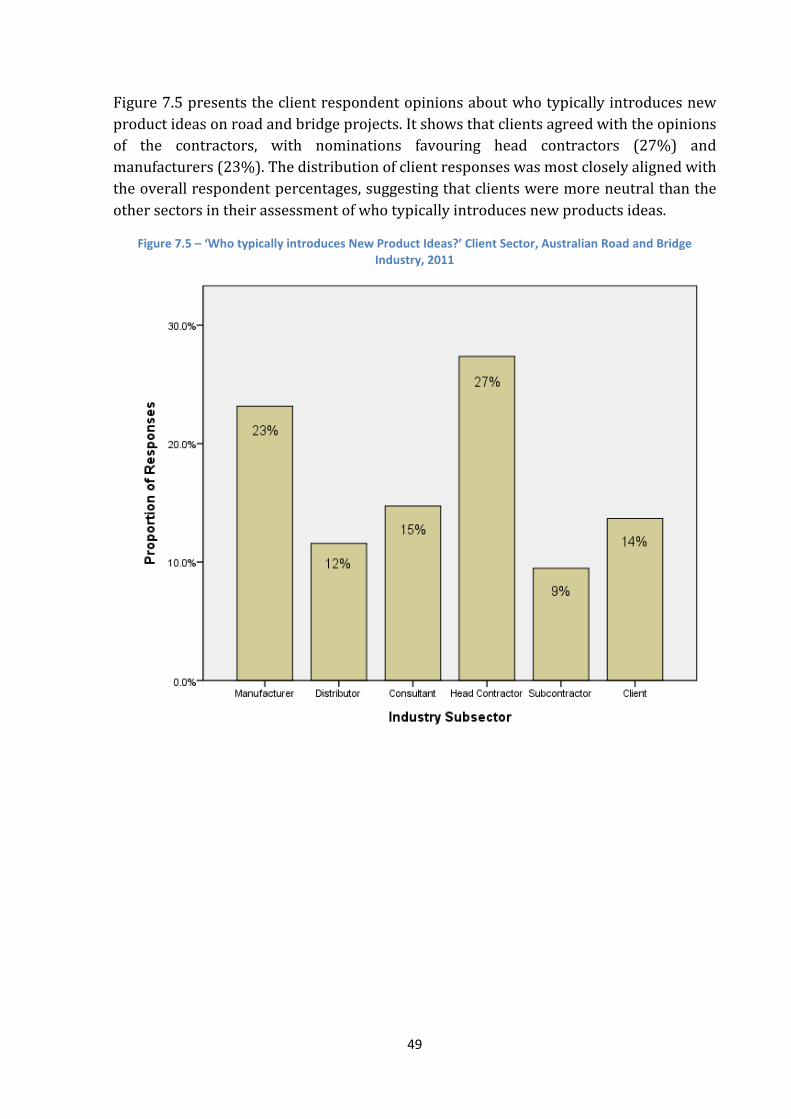
49
Figure 7.5 presents the client respondent opinions about who typically introduces new product ideas on road and bridge projects. It shows that clients agreed with the opinions of the contractors, with nominations favouring head contractors (27%) and manufacturers (23%). The distribution of client responses was most closely aligned with the overall respondent percentages, suggesting that clients were more neutral than the other sectors in their assessment of who typically introduces new products ideas.
Figure 7.5 – ‘Who typically introduces New Product Ideas?’ Client Sector, Australian Road and Bridge Industry, 2011
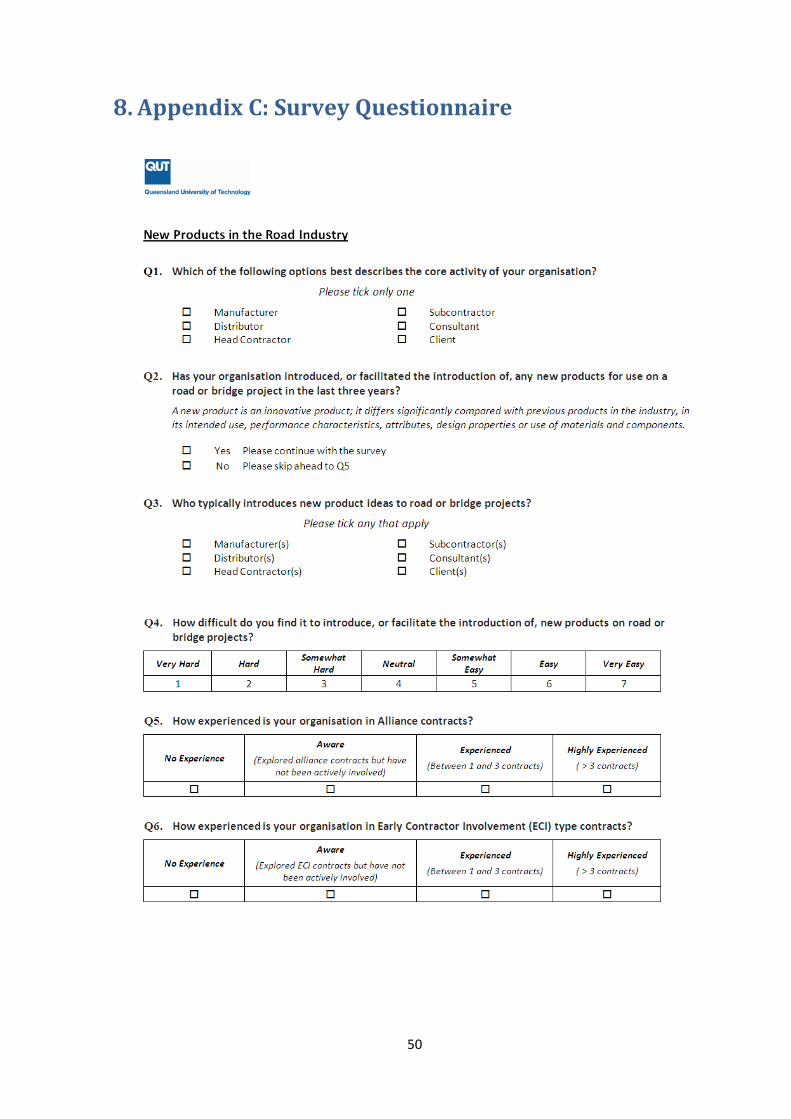
50
8. Appendix C: Survey Questionnaire
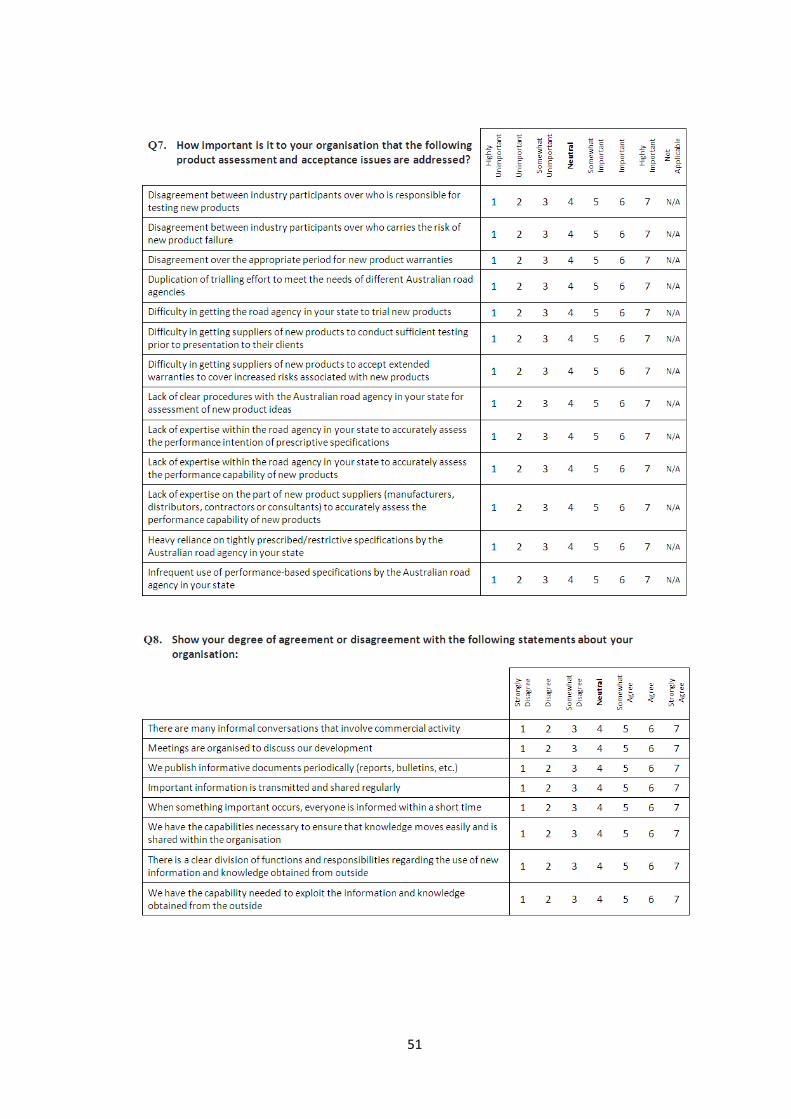
51
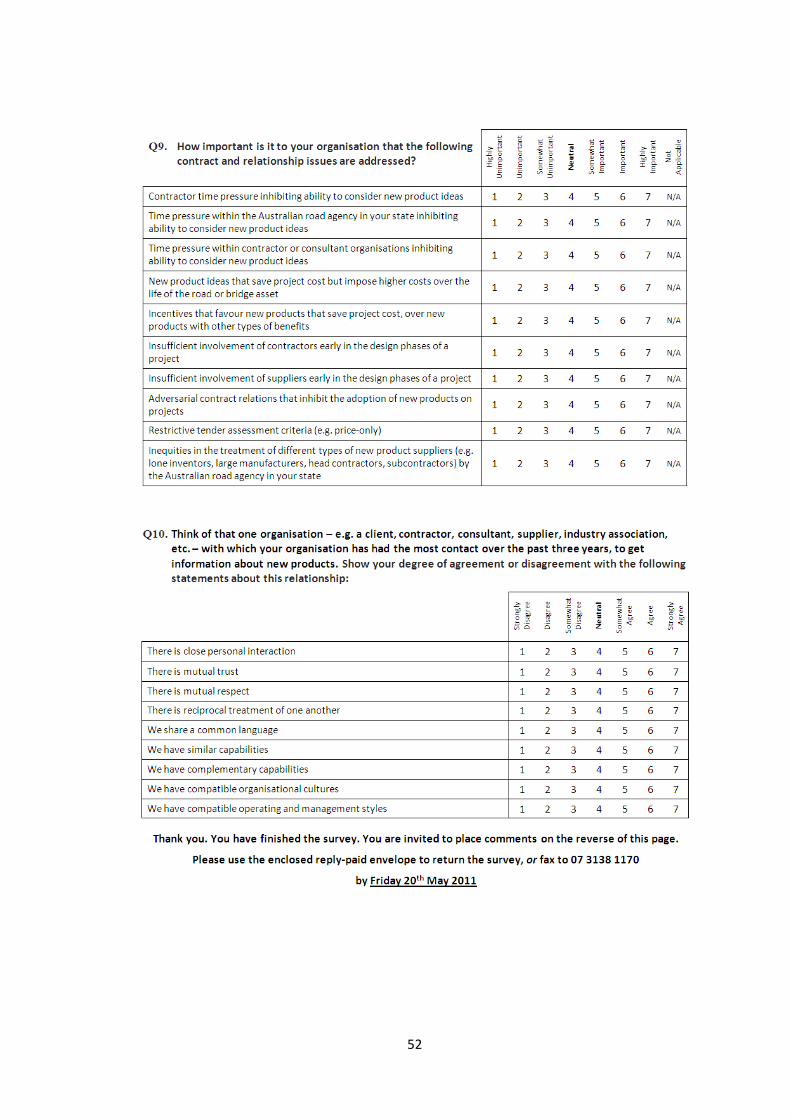
52
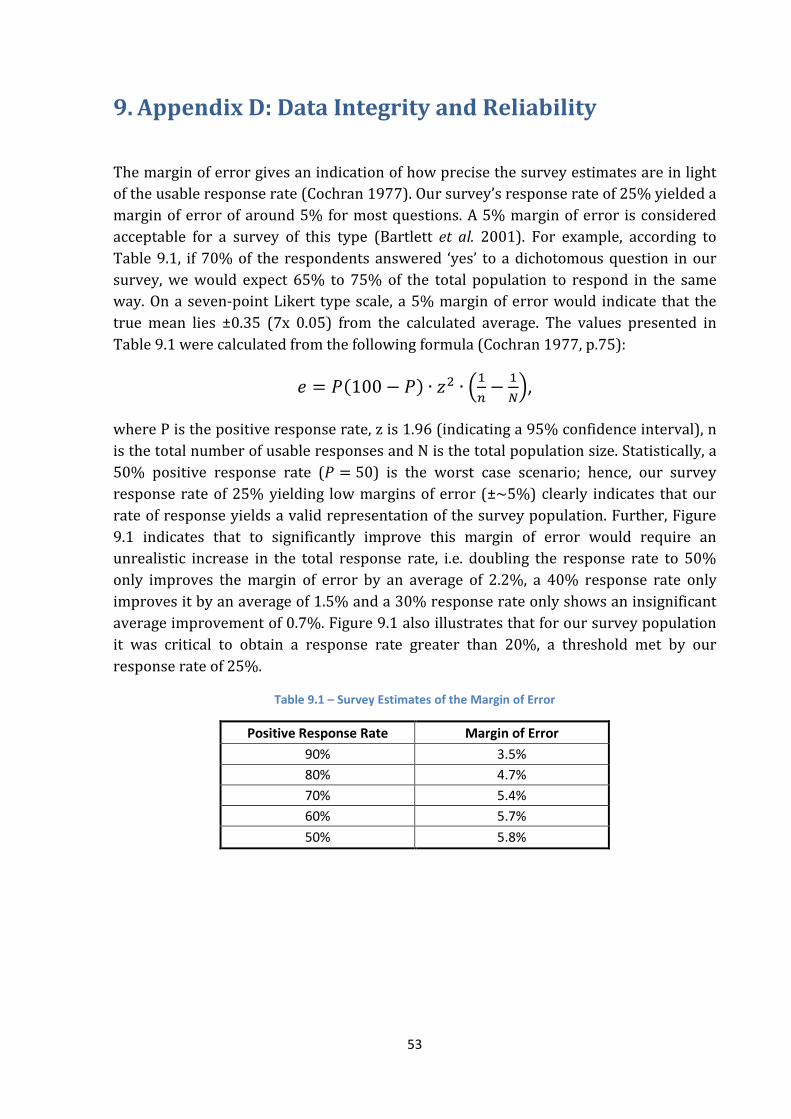
53
9. Appendix D: Data Integrity and Reliability The margin of error gives an indication of how precise the survey estimates are in light of the usable response rate (Cochran 1977). Our survey’s response rate of 25% yielded a margin of error of around 5% for most questions. A 5% margin of error is considered acceptable for a survey of this type (Bartlett et al. 2001). For example, according to Table 9.1, if 70% of the respondents answered ‘yes’ to a dichotomous question in our survey, we would expect 65% to 75% of the total population to respond in the same way. On a seven-point Likert type scale, a 5% margin of error would indicate that the true mean lies ±0.35 (7x 0.05) from the calculated average. The values presented in Table 9.1 were calculated from the following formula (Cochran 1977, p.75):
𝑒 = 𝑃(100 − 𝑃) ∙ 𝑧2 ∙ �1𝑛− 1
𝑁�,
where P is the positive response rate, z is 1.96 (indicating a 95% confidence interval), n is the total number of usable responses and N is the total population size. Statistically, a 50% positive response rate (𝑃 = 50) is the worst case scenario; hence, our survey response rate of 25% yielding low margins of error (±~5%) clearly indicates that our rate of response yields a valid representation of the survey population. Further, Figure 9.1 indicates that to significantly improve this margin of error would require an unrealistic increase in the total response rate, i.e. doubling the response rate to 50% only improves the margin of error by an average of 2.2%, a 40% response rate only improves it by an average of 1.5% and a 30% response rate only shows an insignificant average improvement of 0.7%. Figure 9.1 also illustrates that for our survey population it was critical to obtain a response rate greater than 20%, a threshold met by our response rate of 25%.
Table 9.1 – Survey Estimates of the Margin of Error
Positive Response Rate Margin of Error 90% 3.5% 80% 4.7% 70% 5.4% 60% 5.7% 50% 5.8%
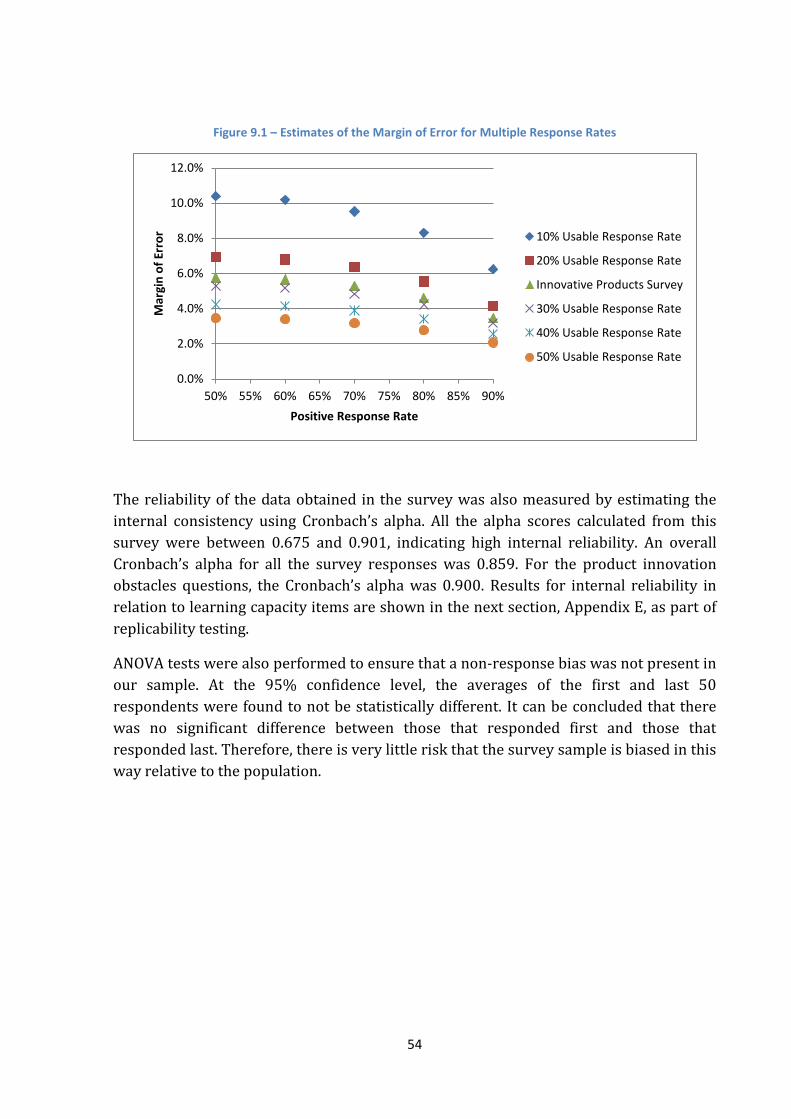
54
Figure 9.1 – Estimates of the Margin of Error for Multiple Response Rates
The reliability of the data obtained in the survey was also measured by estimating the internal consistency using Cronbach’s alpha. All the alpha scores calculated from this survey were between 0.675 and 0.901, indicating high internal reliability. An overall Cronbach’s alpha for all the survey responses was 0.859. For the product innovation obstacles questions, the Cronbach’s alpha was 0.900. Results for internal reliability in relation to learning capacity items are shown in the next section, Appendix E, as part of replicability testing.
ANOVA tests were also performed to ensure that a non-response bias was not present in our sample. At the 95% confidence level, the averages of the first and last 50 respondents were found to not be statistically different. It can be concluded that there was no significant difference between those that responded first and those that responded last. Therefore, there is very little risk that the survey sample is biased in this way relative to the population.
0.0%
2.0%
4.0%
6.0%
8.0%
10.0%
12.0%
50% 55% 60% 65% 70% 75% 80% 85% 90%
Mar
gin
of E
rror
Positive Response Rate
10% Usable Response Rate
20% Usable Response Rate
Innovative Products Survey
30% Usable Response Rate
40% Usable Response Rate
50% Usable Response Rate
55
10. Appendix E: Learning Capacity Measures Replicability
10.1 Learning Capacity Replicability
The survey used the definition of learning capacity in Jiménez-Barrionuevo et al. (2010) as an ‘organisation’s relative ability to develop a set of organisational routines and strategic processes through which it acquires, assimilates, transforms and exploits knowledge acquired from outside the organisation in order to create value’ (p.3). This definition comprises four phases, namely acquisition, assimilation, transformation and exploitation, and can be aggregated to examine both potential (acquisition and assimilation) and realised (transformation and exploitation) learning capacity (Jansen et al. 2005).
According to Jiménez-Barrionuevo et al. (2010), the acquisition phase consists of items relating to interaction, trust, respect, and reciprocity. The assimilation phase comprises common language, complementarily, similarity and compatibility. The transformation phase comprises communication, meetings, documents, transmission, time and flow. Lastly, the exploitation phase comprises items relating to responsibility and application of transformed knowledge. The following descriptions are based on Jiménez-Barrionuevo et al. (2010).
In the acquisition phase, ‘interaction’ is how closely the two organisations interact, ‘trust’ refers to how much mutual trust exists between two organisations, ‘respect’ refers to how much mutual respect exists between two organisations, and ‘reciprocity’ is about how well two organisations treat each other.
In the assimilation phase, ‘common language’ refers to the members of two organisations sharing their own language, ‘complementarily’ is the sharing of different resources and capabilities between two organisations to supplement each other, ‘similarity’ refers to how analogous the main capabilities of two organisations are, and ‘compatibility’ refers to how compatible the organisational, operational and management styles are across the two organisations.
In the transformation phase, ‘communication’ refers to the frequency of informal conversations involving commercial activity, ‘meetings’ refers to the frequency with which meetings are organised to discuss organisational development, ‘documents’ is concerned with the periodicity of publicising informative material e.g. reports and bulletins, ‘transmission’ is the regularity of important knowledge distribution, ‘time’ is in reference to the efficiency with which new important information is distributed, and ‘flow’ refers to the capability of an organisation to internally move knowledge between units.
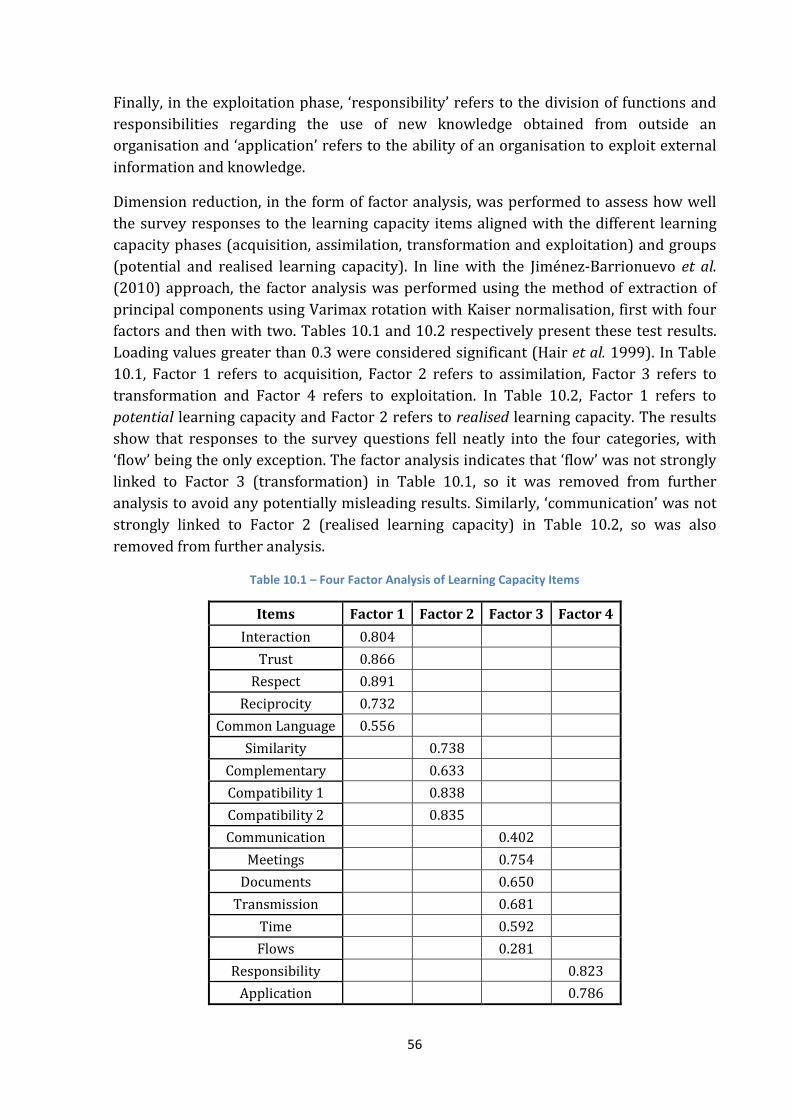
56
Finally, in the exploitation phase, ‘responsibility’ refers to the division of functions and responsibilities regarding the use of new knowledge obtained from outside an organisation and ‘application’ refers to the ability of an organisation to exploit external information and knowledge.
Dimension reduction, in the form of factor analysis, was performed to assess how well the survey responses to the learning capacity items aligned with the different learning capacity phases (acquisition, assimilation, transformation and exploitation) and groups (potential and realised learning capacity). In line with the Jiménez-Barrionuevo et al. (2010) approach, the factor analysis was performed using the method of extraction of principal components using Varimax rotation with Kaiser normalisation, first with four factors and then with two. Tables 10.1 and 10.2 respectively present these test results. Loading values greater than 0.3 were considered significant (Hair et al. 1999). In Table 10.1, Factor 1 refers to acquisition, Factor 2 refers to assimilation, Factor 3 refers to transformation and Factor 4 refers to exploitation. In Table 10.2, Factor 1 refers to potential learning capacity and Factor 2 refers to realised learning capacity. The results show that responses to the survey questions fell neatly into the four categories, with ‘flow’ being the only exception. The factor analysis indicates that ‘flow’ was not strongly linked to Factor 3 (transformation) in Table 10.1, so it was removed from further analysis to avoid any potentially misleading results. Similarly, ‘communication’ was not strongly linked to Factor 2 (realised learning capacity) in Table 10.2, so was also removed from further analysis.
Table 10.1 – Four Factor Analysis of Learning Capacity Items
Items Factor 1 Factor 2 Factor 3 Factor 4 Interaction 0.804
Trust 0.866 Respect 0.891
Reciprocity 0.732 Common Language 0.556
Similarity 0.738 Complementary 0.633 Compatibility 1 0.838 Compatibility 2 0.835 Communication 0.402
Meetings 0.754 Documents 0.650
Transmission 0.681 Time 0.592 Flows 0.281
Responsibility 0.823 Application 0.786
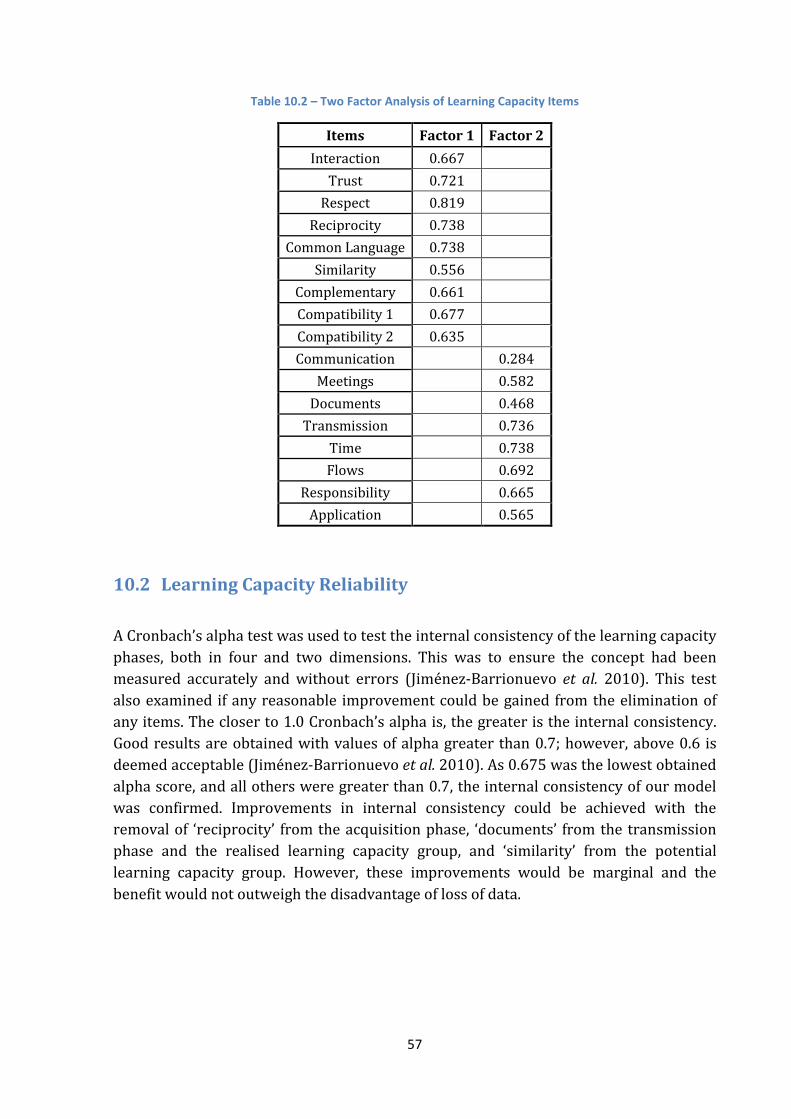
57
Table 10.2 – Two Factor Analysis of Learning Capacity Items
Items Factor 1 Factor 2 Interaction 0.667
Trust 0.721 Respect 0.819
Reciprocity 0.738 Common Language 0.738
Similarity 0.556 Complementary 0.661 Compatibility 1 0.677 Compatibility 2 0.635 Communication 0.284
Meetings 0.582 Documents 0.468
Transmission 0.736 Time 0.738 Flows 0.692
Responsibility 0.665 Application 0.565
10.2 Learning Capacity Reliability
A Cronbach’s alpha test was used to test the internal consistency of the learning capacity phases, both in four and two dimensions. This was to ensure the concept had been measured accurately and without errors (Jiménez-Barrionuevo et al. 2010). This test also examined if any reasonable improvement could be gained from the elimination of any items. The closer to 1.0 Cronbach’s alpha is, the greater is the internal consistency. Good results are obtained with values of alpha greater than 0.7; however, above 0.6 is deemed acceptable (Jiménez-Barrionuevo et al. 2010). As 0.675 was the lowest obtained alpha score, and all others were greater than 0.7, the internal consistency of our model was confirmed. Improvements in internal consistency could be achieved with the removal of ‘reciprocity’ from the acquisition phase, ‘documents’ from the transmission phase and the realised learning capacity group, and ‘similarity’ from the potential learning capacity group. However, these improvements would be marginal and the benefit would not outweigh the disadvantage of loss of data.
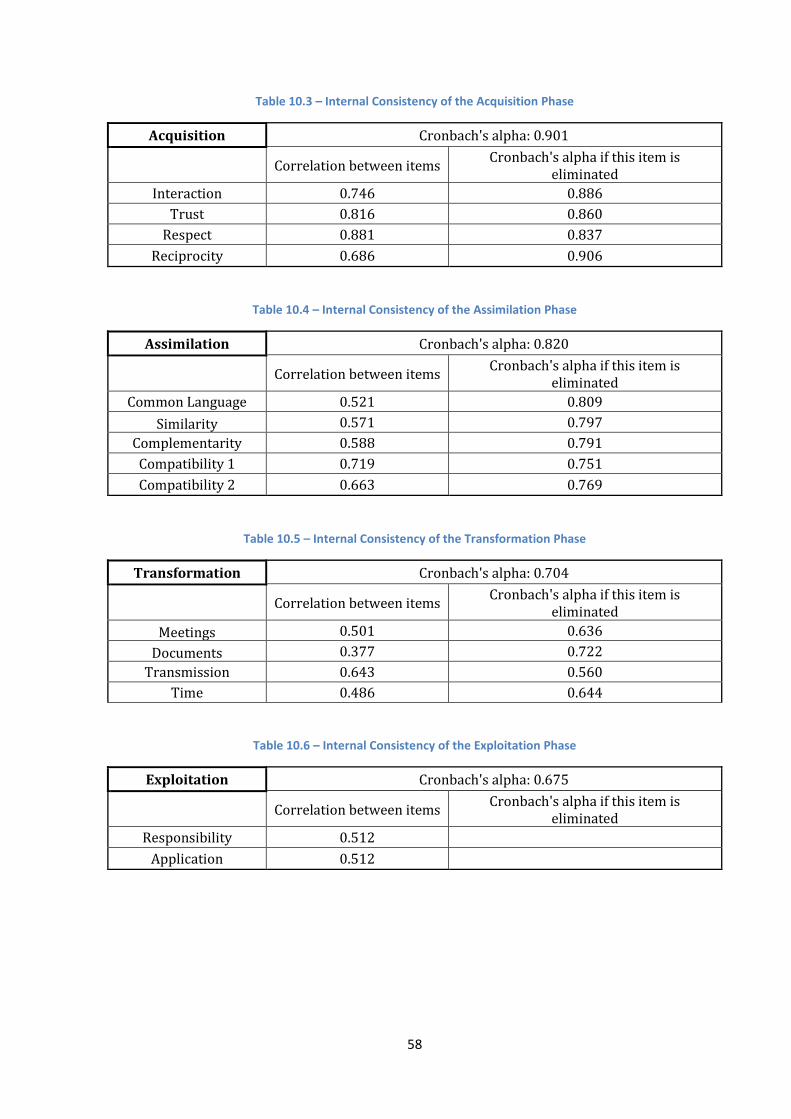
58
Table 10.3 – Internal Consistency of the Acquisition Phase
Acquisition Cronbach's alpha: 0.901
Correlation between items Cronbach's alpha if this item is eliminated
Interaction 0.746 0.886 Trust 0.816 0.860
Respect 0.881 0.837 Reciprocity 0.686 0.906
Table 10.4 – Internal Consistency of the Assimilation Phase
Assimilation Cronbach's alpha: 0.820
Correlation between items Cronbach's alpha if this item is eliminated
Common Language 0.521 0.809 Similarity 0.571 0.797
Complementarity 0.588 0.791 Compatibility 1 0.719 0.751 Compatibility 2 0.663 0.769
Table 10.5 – Internal Consistency of the Transformation Phase
Transformation Cronbach's alpha: 0.704
Correlation between items Cronbach's alpha if this item is eliminated
Meetings 0.501 0.636 Documents 0.377 0.722
Transmission 0.643 0.560 Time 0.486 0.644
Table 10.6 – Internal Consistency of the Exploitation Phase
Exploitation Cronbach's alpha: 0.675
Correlation between items Cronbach's alpha if this item is eliminated
Responsibility 0.512 Application 0.512
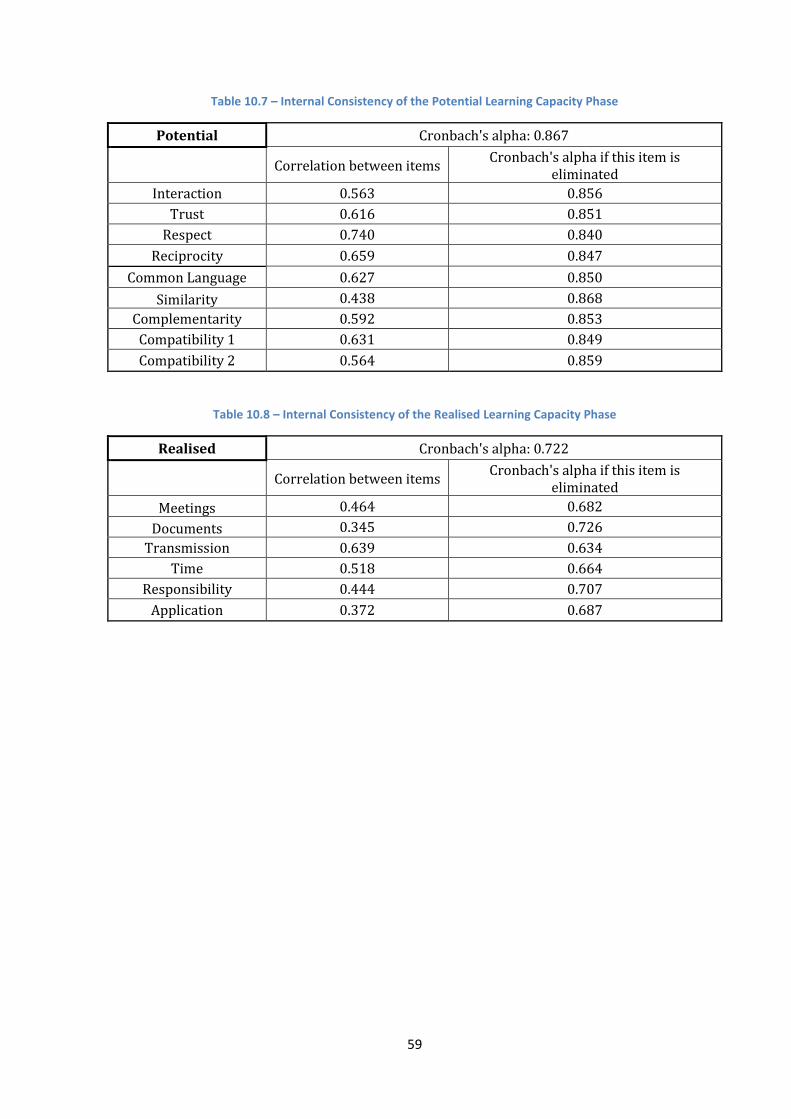
59
Table 10.7 – Internal Consistency of the Potential Learning Capacity Phase
Potential Cronbach's alpha: 0.867
Correlation between items Cronbach's alpha if this item is eliminated
Interaction 0.563 0.856 Trust 0.616 0.851
Respect 0.740 0.840 Reciprocity 0.659 0.847
Common Language 0.627 0.850 Similarity 0.438 0.868
Complementarity 0.592 0.853 Compatibility 1 0.631 0.849 Compatibility 2 0.564 0.859
Table 10.8 – Internal Consistency of the Realised Learning Capacity Phase
Realised Cronbach's alpha: 0.722
Correlation between items Cronbach's alpha if this item is eliminated
Meetings 0.464 0.682 Documents 0.345 0.726
Transmission 0.639 0.634 Time 0.518 0.664
Responsibility 0.444 0.707 Application 0.372 0.687
60
11. Appendix F: Index and Measure Development
11.1 Learning Capacity Index Development
11.1.1 Learning Capacity Index Measure An extensive literature review yielded no clear method for determining a single measure of total learning capacity. Hence, for the purpose of this survey analysis, a learning capacity index measure was developed. To ensure total learning capacity figures were robust, and to minimise the potential effect of having to drop any items as a result of factor analysis and internal consistency checks, the index measure was based on the four phases of learning capacity. A measure for each phase was obtained by taking the average of related items. From these values, the total learning capacity was then generated by taking the average of the four phases.
11.1.2 Learning Capacity Index Sensitivity Analysis As there was no supporting literature found on the measurement of total learning capacity for a survey of this kind, sensitivity analysis was performed to ensure that the method developed was reliable and did not significantly impact on the analysis results in an adverse way. Seven measures were trialled:
1. Average of the average of each learning capacity phase (acquisition, assimilation, transformation, and exploitation)
2. Multiplication of the average of each learning capacity phase 3. Average of each learning capacity item 4. Addition of each learning capacity item 5. Multiplication of each learning capacity item 6. Average of the average of each learning capacity group (potential and realised
learning capacity) 7. Multiplication of the average of each learning capacity group
All seven measures were very strongly correlated, with the lowest monotonic correlation being 0.959 (at a 99% confidence level). This result indicates that regardless of which method was chosen to rank the respondents’ learning capacity, the index rankings would be largely unaffected. For the purpose of this analysis ‘Measure 1’ (average of the average of each learning capacity phase) was utilised, as it was deemed to be the most robust measure.
61
11.2 Relationship Capacity Measure Development
The survey asked respondents to indicate how experienced they were with two types of relationship contracts: Alliance contracts and Early Contractor Involvement (ECI) type contracts. There were four response options: no experience, aware, experienced (1-3 projects), and highly experienced (more than 3 projects). The measure for relationship capacity for each respondent utilised in correlations was the greater of the responses from these two questions. Hence, only one response per respondent was considered across the two relationship contract questions. This was the response that showed the highest level of experience, whether that was in alliances or ECI-type contracts. This measure was chosen so as to not undervalue a respondent because they did not have an opportunity to be involved with one or the other type of contract.
11.3 Innovative Obstacles Measure Development
The relative importance to respondents of addressing the 22 product innovation obstacles was determined across two questions in the survey (question 7 and question 9). The two sets were about different types of obstacles. These questions were presented using a seven-point Likert type scale, from ‘Highly Unimportant’ to ‘Highly Important’, with the option of answering ‘Not Applicable’ to provide the option for respondents to not answer. For each respondent, the measure of the overall importance of addressing innovation obstacles was developed by taking the average of the individual respondent’s responses to the 22 obstacles, and treating ‘Not Applicable’ responses as missing data.
62
Bibliography
ABS (2011) Summary of IT use and innovation in Australian business 2009-10 Andrews, P and Hahn, J (1998) Transforming supply chains into value webs. Strategy &
Leadership, 26(3), 7-11. Barlow, J (2000) Innovation and learning in complex offshore construction projects.
Research Policy, 29(7-8), 973-87. Bartlett, J, Kotrlik, J and Higgins, C (2001) Organizational research: Determining
appropriate sample size in survey research. Information Technology, Learning, and Performance Journal, 19(1).
Bennett, J and Jayes, S (1998) The seven pillars of partnering. Reading Thomas Telford Publishing, London.
Bessant, J and Rush, H (1995) Building bridges for innovation: The role of consultants in technology transfer. Research Policy, 24(1), 97-114
Bickley, J, Hooton, R D and Hover, K C (2006) Preparation of a performance-based specification for cast-in-place concrete, Silver Spring, MD: RMC Research Foundation, National Ready Mixed Concrete Association (NRMCA).
Blayse, A M and Manley, K (2004) Key influences on construction innovation. Construction Innovation, 4(3), 143-54.
Cochran, W G (1977) Sampling techniques. 3 ed. John Wiley & Sons, New York. Cohen, W M and Levinthal, D A (1989) Innovation and learning: The two forces of r & d.
The Economic Journal, 99 (September), 569-96. Cohen, W M and Levinthal, D (1990) Absorptive capacity: A new perspective on learning
and innovation. Administrative Science Quarterly, 35(1), 128-52. Cox, A and Thompson, I (1997) ‘Fit for purpose’ contractual relations: Determining a
theoretical framework for construction projects. European Journal of Purchasing & Supply Management, 3(3), 127-35.
Dubois, A and Gadde, L (2002) The construction industry as a loosely coupled system: Implications for productivity and innovation. Construction Management and Economics, 20, 621-31.
Eriksson, P E, Dickinson, M and Khalfan, M M A (2007) The influence of partnering and procurement on subcontractor involvement and innovation. Facilities, 25(5), 203-14.
Forés, B and Camisón, C (2011) The complementary effect of internal learning capacity and absorptive capacity on performance: The mediating role of innovation capacity. International Journal of Technology Management, 55(1-2), 56-81.
Gann, D M and Salter, A J (2000) Innovation in project-based, service-enhanced firms: The construction of complex products and systems. Research Policy, 29(7-8), 955-72.
Gittings, G L and Bagby, J W (1996) Managing product liability to achieve highway innovations, Washington D.C: National Cooperative Highway Research Program.
63
Hair, J F, Anderson, R E, Tatham, R L and Black, W C (1999) Multivariate data analysis. Prentice Hall International, Inc. New Jersey.
Hampson, K D and Brandon, P S (2004) Construction 2020: A vision for australia's property and construction industry,
Henderson, R M and Clark, K B (1990) Architectural innovation: The reconfiguration of existing product technologies and the failure of established firms. Administrative Science Quarterly, 35(1), 9-30.
Jansen, J J P, Bosch, F A J V D and Volberda, H W (2005) Managing potential and realized absorptive capacity: How do organizational antecedents matter? The Academy of Management Journal, 48(6), 999-1015.
Jiménez-Barrionuevo, M M, Garcia-Morales, V J and Molilna, L M (2010) Validation of an instrument to measure absorptive capacity. Technovation, 31(5-6, May-June 2011), 190-202.
Kadefors, A (2004) Trust in project relationships - inside the black box. International Journal of Project Management, 22(3), 175-82.
Khalfan, M M A and McDermott, P (2006) Innovating for supply chain integration within construction. Journal of Construction Innovation, 6(3), 143-58.
Lane, P J and Lubatkin, M (1998) Relative absorptive capacity and interorganizational learning. Strategic Management Journal, 19(5), 461-77.
Lane, P J, Koka, B R and Pathak, S (2006) The rectification of absorptive capacity: A critical review and rejuvenation of the construct. Academy of Management Review, 31(4), 833–63.
Lichtenthaler, U and Lichtenthaler, E (2009) A capability-based framework for open innovation: Complementing absorptive capacity. Journal of Management Studies, 46(8), 1315-38.
Ling, F Y Y (2003) Managing the implementation of construction innovations. Construction Management and Economics, 21(6), 635-49.
Love, P E D, Irani, Z, Cheng, E and Li, H (2001) A model for supporting inter-organizational relations in the supply chain. Engineering, Construction and Architectural Management, 9(1), 2-15.
Manley, K (2002) Partnering and alliancing on road projects in australia and internationally. Road and Transport Research, 11(3), 46-60.
Manley, K (2006) The innovation competence of repeat public sector clients in the australian construction industry. Construction Management & Economics, 24(2), 1295-304.
Manley, K (2008) Implementation of innovation by manufacturers subcontracting to construction projects. Journal of Engineering, Construction and Architectural Management, 15(3), 230-45.
McIvor, R and Humphreys, P (2004) Early supplier involvement in the design process: Lessons from the electronics industry. Omega, 32(3), 179-99.
64
Miozzo, M and Dewick, P (2002) Building competitive advantage: Innovation and corporate governance in european construction. Research Policy, 31(6), 989-1008.
Nam, C H and Tatum, C B (1989) Toward understanding of product innovation process in construction. Journal of Construction Engineering & Management, 115(4), 259-70.
Nam, C H and Tatum, C B (1997) Leaders and champions for construction innovation. Construction Management and Economics, 15(3), 259-70.
Ng, S, Rose, T, Mak, M Y and Chen, S-E (2002) Problematic issues associated with project partnering : The contractor perspective. International Journal of Project Management, 20(6), 437-49.
OECD (1993) Frascati manual - the measurement of scientific and technological activities: Standard practice for surveys of research and experimental development,
Pryke, S and Smyth, H (2006) The management of complex projects: A relationship approach. Blackwell Publishing.
Rose, T (2008) The impact of financial incentive mechanisms on motivation in australian government large non-residual building projects, Faculty Built Environment and Engineering, Queensland University of Technology.
Salter, A and Torbett, R (2003) Innovation and performance in engineering design. Construction Management & Economics, 21(6), 573 - 80.
Salter, A and Gann, D (2003) Sources of ideas for innovation in engineering design. Research Policy, 32(8), 1309-24.
Slaughter, E S (1993) Innovation and learning during implementation: A comparison of user and manufacturer innovations. Research Policy, 22, 81-95.
Szulanski, G (1996) Exploring internal stickiness: Impediment to the transfer of best practice within firms. Strategic Management Journal, 17, 27-43.
Todorova, G and Durisin, B (2007) Absoprtive capacity: Valuing a reconceptualisation. Academy of Management Review, 32(3), 774-86.
Treloar, G J, Love, P E D, Iyer-Raniga, U and Faniran, O O (2000) A hybrid lca method for construction. Construction Management and Economics, 18, 5 -9.
Walker, D H T and Hampson, K D (2003) Procurement choices. In: Walker, D H T and Hampson, K D (Eds.), Procurement strategies. Oxford, UK: Blackwell.
Warra, F and Brochner, J (2006) Price and non-price criteria for contractor selection. Journal of Construction Engineering & Management, 132(8), 797-804.
Zaghloul, R and Hartman, F (2003) Construction contracts: The cost of mistrust. International Journal of Project Management, 21(6), 419-24.
Zahra, S and George, G (2002) Absorptive capacity: A review, reconceptualisation, and extension. Academy of Management Review, 27(2), 185-203.

![[2 Timothy] Leader’s Guide - Cru at UNCcruatunc.com/hp_wordpress/wp-content/uploads/2013/08/2-Timothy... · [2 Timothy] Leader’s Guide ... Timothy Introduction Welcome to](https://img.pdfslide.us/doc/110x75/5a7906cc7f8b9a9d218d1646/2-timothy-leaders-guide-cru-at-2-timothy-leaders-guide-timothy-introduction.jpg)