Embed Size (px)
Citation preview
Innovative Partnership for Public Health:
Ester R. FuchsSarah M. HollowayKimberly BayerAlexandra Feathers
JUNE 2014
An Evaluation of the New York City Green Cart Initiative to Expand Access to Healthy Produce in Low-Income Neighborhoods
Images: The Apple Pushers/50 Eggs
i
i
Innovative Partnership for Public Health:
AN EVALUATION OF THE NEW YORK CITY GREEN CART INITIATIVE TO EXPAND ACCESS TO HEALTHY PRODUCE IN LOW-INCOME NEIGHBORHOODS
Ester R. Fuchs Sarah M. Holloway Kimberly Bayer Alexandra Feathers
June 2014
Ester R. Fuchs is a Professor of International and Public Affairs and Political Science at Columbia University’s School of International and Public Affairs (SIPA). Sarah M. Holloway is a Lecturer in Discipline in International and Public Affairs at SIPA and the Director of SIPA’s Management Specialization. Kimberly Bayer is a Project Manager at SIPA. Alexandra Feathers received a dual Master’s in Public Administration and Public Health from SIPA and the Mailman School of Public Health (Mailman) in May 2014.
This case study was prepared with the assistance of student researchers (from SIPA, Mailman, Teachers College and Columbia College) Farah Ahmad, Aliya Ali, Jordan Brensinger, Catherine Dodge, Jesper Frant, Aaron Freedman, Joyeta Goswami, Sonya Rubin, Kalman Victor, Elizabeth Wyner, Stephanie Yagos and consultant Bonnie Rosenberg. Special thanks to Professor Robert Shapiro and Kevin Gully.
This evaluation was supported by a generous grant from the Laurie M. Tisch Illumination Fund. Special thanks to Laurie M. Tisch, President, and Rick Luftglass, Executive Director. Columbia University School of International and Public Affairs Case Study Series in Global Public Policy: 2014, Volume 2, Case 2
ii
ii
Table of Contents
Executive Summary ............................................................................................................................... 1
Part I: New York City Green Cart Initiative ................................................................................... 8
Introduction .............................................................................................................................................. 8
Program Overview ................................................................................................................................. 9
New York City Food Access Initiatives....................................................................................... 9
History and Program Evolution ................................................................................................. 11
Partner Development and Stakeholder Buy-In ................................................................... 13
Program Mission and Goals ............................................................................................................. 15
Mission ................................................................................................................................................ 15
Program Goals and Performance Indicators ........................................................................ 15
Expected Health Outcomes ......................................................................................................... 15
Expected Economic Outcomes ................................................................................................... 16
Program Model and Implementation ........................................................................................... 16
Initiative Overview ......................................................................................................................... 16
Vendor Permitting and Start-Up ............................................................................................... 16
Vendor Locations ............................................................................................................................ 17
Vendor Operating Model .............................................................................................................. 18
Financing the Business ................................................................................................................. 18
Vendor Support ................................................................................................................................ 19
Part II: NYC Green Carts’ Program Evaluation ......................................................................... 20
Overview ................................................................................................................................................. 20
Key Findings .......................................................................................................................................... 20
Demographic Characteristics: Who are the vendors?...................................................... 21
Neighborhood Characteristics: Where are they vending? ............................................. 21
Vendor Business Practices .......................................................................................................... 30
iii
iii
Economic Viability: What Makes a Successful Vendor? .................................................. 32
Green Carts is Providing Entrepreneurial Opportunities ................................................ 34
Who are the Customers? .............................................................................................................. 35
Did Green Carts Reach the Target population? ................................................................... 36
Changing Customer Behavior: Increased Access to Fresh Produce in Food Deserts ................................................................................................................................................................ 37
Vendor Support ................................................................................................................................ 37
Best Practices and Lessons Learned ............................................................................................. 38
Public-Private Partnership .......................................................................................................... 38
Support from City Hall for Innovation .................................................................................... 39
A City Agency with Sustained Interest and Capacity to Implement an Innovative Program .............................................................................................................................................. 39
Technical Assistance for Vendors ............................................................................................. 39
Promoting the Program Including a Green Cart Branding Campaign ........................ 39
Recommendations ............................................................................................................................... 40
Collect Periodic and Uniform Data on Vendors and Customers............................... 40
Create Unique Identification Number for Vendors ....................................................... 40
Create Target Number of Green Carts Based on Market Analysis ........................... 40
Ensure Maximum Utilization of Green Cart Permits .................................................... 41
Track Operational Green Carts by Location ..................................................................... 41
Provide Economic Incentives to Locate in Heart of Food Desert ............................ 41
Target Technical Assistance to Vendor Needs and Track Technical Assistance 41
Enhance Product Offerings to Include Other Healthy Food Items .......................... 42
Conclusion .............................................................................................................................................. 42
Appendix A: Research Design and Methodology ..................................................................... 44
Appendix B: Review of Previous Green Carts Studies .......................................................... 47
Appendix C: Vendor Survey ............................................................................................................ 50
iv
iv
Appendix D: Customer Survey ....................................................................................................... 63
Appendix E: Vendor Frequency Distributions ......................................................................... 69
Appendix F: Customer Frequency Distributions .................................................................... 78
Appendix G: List of Interviews ...................................................................................................... 85
Endnotes .................................................................................................................................................. 86
List of Tables
Table 1 Distribution of Vendors and Carts by Borough ....................................................... 22
Table 2 Vendor Cart Operations ................................................................................................... 30
Table 3 Vendor’s Produce Supply .................................................................................................. 31
Table 4 Cart Operation Logistics .................................................................................................... 32
Table 5 Indicators of Economic Viability ................................................................................... 33
Table 6 Vending in a Year by Length of Time Vending ........................................................ 33
Table 7 Comparison of Core and Periphery Customers ....................................................... 37
Table 8 Percent of Low-Income Customers in Core and Periphery ................................ 37
Table 9 Allocated Green Cart Permits Compared to Identified Green Cart Vendors by Borough ................................................................................................................................................... 41
Table of Figures
Figure 1 Green Cart Designated Areas ........................................................................................ 17
Figure 2 Vendor Country of Origin............................................................................................... 21
Figure 3 Reasons for Location Choice ......................................................................................... 22
Figure 4 Bronx Green Cart Distribution ..................................................................................... 23
Figure 5 Brooklyn Green Cart Distribution .............................................................................. 24
Figure 6 Manhattan Green Cart Distribution ........................................................................... 25
Figure 7 Queens Green Cart Distribution .................................................................................. 26
Figure 8 Density of Green Carts Relative to other Produce Outlets ................................ 28
Figure 9 Bronx and Manhattan Green Cart Locations Relative to NYCHA Developments........................................................................................................................................ 29
Figure 10 Brooklyn and Queens Green Cart Locations Relative to NYCHA Developments........................................................................................................................................ 30
Figure 11 Vendor Profitability ....................................................................................................... 34
Figure 12 Green Carts Providing Entrepreneurial Opportunities by Operate in Winter and Green Cart Owner and Employee .......................................................................... 34
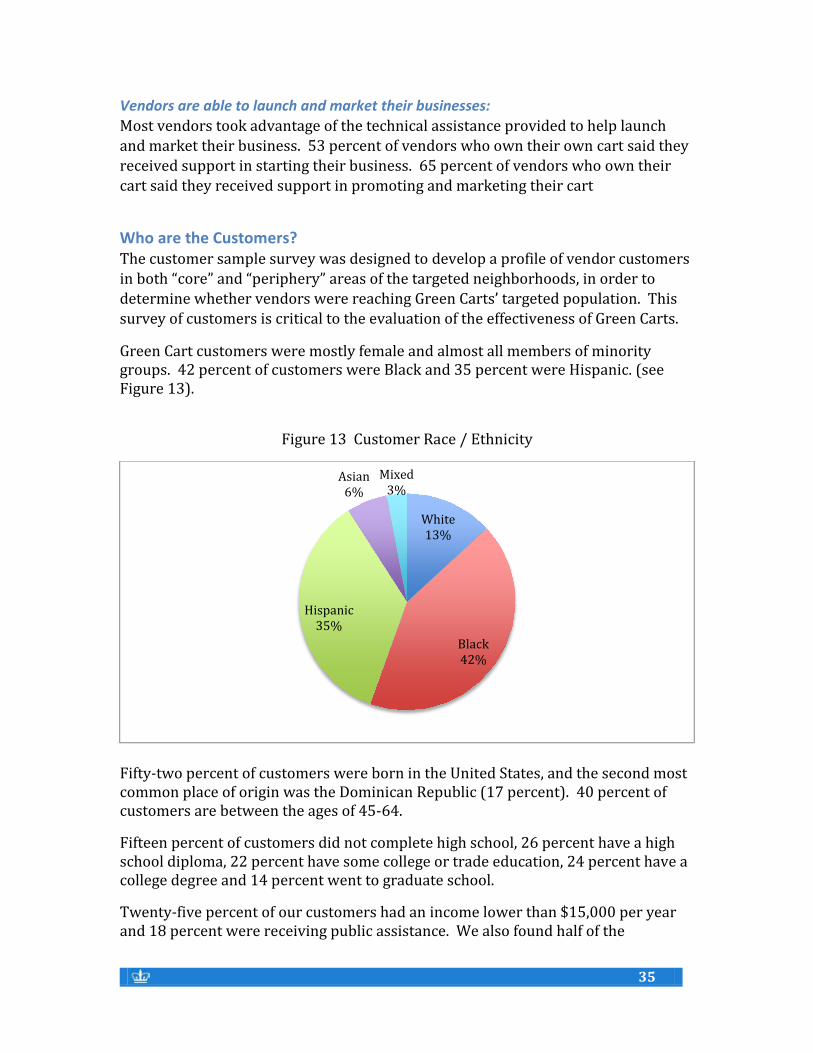
Figure 13 Customer Race / Ethnicity .......................................................................................... 35
1
1
Executive Summary The New York City Green Cart Initiative (Green Carts) was introduced in 2008 by the Mayor’s Office of Food Policy and the New York City Department of Health and Mental Hygiene (DOHMH) in partnership with the Laurie M. Tisch Illumination Fund (Illumination Fund). This innovative program offered 1,000 permits for a new street class of mobile fruit and vegetable vendors in underserved areas. Green Carts is part of a broader citywide food access strategy developed by the Bloomberg Administration to improve public health outcomes for low-income New Yorkers by increasing the availability of fresh produce in areas often referred to as “food deserts.” Food deserts are areas where access to fresh food outlets is limited and where consumption of fruits and vegetables is particularly low.
GOALS OF THE GREEN CART INITIATIVE
The goal of placing Green Carts in these neighborhoods was to increase the points of purchase of fruits and vegetables and, in turn, increase individual consumption. Green Carts was developed based on research that has consistently shown a significant relationship between the retail food environment, individual consumption of fruits and vegetables in a particular geographic area, and rates of obesity and diet-related diseases.
RESEARCH DESIGN
In mid-2013, the Illumination Fund engaged faculty at Columbia University’s School
of International and Public Affairs (SIPA) as an independent evaluator to analyze the effectiveness of Green Carts in improving access to fresh fruits and vegetables for low-income New Yorkers; to assess the economic viability of Green Carts as small businesses; to determine whether Green Carts is changing customer behavior; and to consider the role of philanthropy in promoting and supporting innovative public policy. The research group, led by Professors Ester Fuchs and Sarah Holloway, developed a conceptual model and research plan to determine whether Green Carts was meeting its goals. A lack of comprehensive and consistent data led us to develop its own evaluation model and research design and to collect extensive primary data on neighborhood characteristics, vendor locations and business practices, and customer behavior. 11 student researchers from Columbia College,
SIPA, the Mailman School of Public Health, and Teachers College spent three months locating and interviewing Green Carts vendors (July-September 2013). Interviews were conducted in English, Spanish and Bengali. A sample of customers was interviewed in November 2013. The customer sample survey was designed to capture any difference among Green Cart customers based on location in the core or periphery of the designated areas. Elite interviews were also conducted with key stakeholders.
2
2
KEY FINDINGS
Green Carts is Increasing Access to Fresh Produce in Targeted Neighborhoods
The SIPA researchers identified 142 Green Cart vendors operating in unique locations in four boroughs during peak vending season (July-October 2013). These vendors operate 166 Green Carts, as some vendors operate two and three carts simultaneously.
Green Carts are all located in the low-income neighborhoods targeted by the DOHMH, exhibiting characteristics associated with food deserts.
Most Green Carts are located in areas with relatively low produce store density, indicating that Green Carts is achieving its goal of reaching populations in high need neighborhoods.
Green Carts is Reaching its Targeted Low-Income Population
44 percent of customers earn less than $25,000 per year, close to the federal guideline for a family of four living at 100 percent of poverty.
68 percent of customers earn less than $50,000 per year, close to the federal guideline for a family of four living at 200 percent of poverty.
18 percent of customers acknowledge receiving public assistance. 50 percent of customers are “always” or “sometimes” worried about having
enough money to buy fresh fruits and vegetables. 92 percent of customers said location and prices are two main reasons for
shopping at Green Carts.
69 percent of customers live or work in the neighborhood. Regardless of where the cart is located, in the core or periphery of the
designated area, Green Carts is reaching a low-income population.
Green Carts is Changing Customer Behavior 71 percent of customers reported increased consumption of fresh fruits and
vegetables since shopping at the Green Cart. 63 percent of customers are regulars (shop at the Green Cart once a week or
more). 31 percent shop at the Green Cart two to three times per week. 64 percent of customers walk fewer than five blocks to get to their Green Cart.
Green Carts is Providing Entrepreneurial Opportunities to Vendors and is Economically Viable in the Long Term Vendors are successful and sustainable 80 percent of Green Cart vendors consider themselves “very profitable” or
“somewhat profitable.” 50 percent of vendors have been vending more than two years.
3
3
56 percent of vendors expect to be operating a year from now and another 31
percent may be operating. 75 percent of vendors believe their experience running a Green Cart will help
them open a larger business.
Vendors are able to launch and operate their own businesses 53 percent of vendors who own their cart said they received support in starting
their business. 65 percent of vendors who own their cart said they received support in
promoting and marketing their cart. 54 percent said it was “easy” or “very easy” to get produce. 48 percent of vendors said it was “easy” or “very easy” to transport cart.
81 percent were “satisfied” or “very satisfied” with cart storage.
Green Carts Are Not Distributed Evenly Throughout All High Need Targeted Areas
Vendors tend to co-locate with other vendors, creating clusters of carts. As a result, some neighborhoods have an abundance of carts, while some have no carts: - Of the 58 carts in the Bronx, there are three major clusters of carts – all of
which are located in main commercial zones. - In Queens, 21 carts are located within 14 blocks of one another; and 70
percent of Queens vendors are on Jamaica Avenue, a major commercial
corridor. The rest of the zone has no carts. Staten Island has no carts. The market-based approach, allowing vendors to locate anywhere within the
designated zone, and does not evenly distribute vendors across the designated high-need areas.
Green Carts are Locating Close to Public Housing in Only One of Four Boroughs
While not part of the initial research model, we mapped the Green Carts with New York City Public Housing Authority (NYCHA) projects. Public housing has a high concentration of low-income residents. In Northern Manhattan, the average distance of a Green Cart to public housing
is two blocks, effectively reaching the targeted population. In Brooklyn, where there are Green Carts, the average distance between a
Green Cart and public housing is 14 blocks. However, in Brownsville and East New York, two communities with large low-income populations, there are no carts.
In the Bronx, where there are Green Carts, the average distance of a Green Cart to public housing is approximately five city blocks. However, many of the largest public housing developments in the Bronx have no Green Carts nearby.
4
4
In Queens, Green Carts are located four blocks from public housing, but there
are no Green Carts in the Rockaways.
There is an Inadequate Tracking System for Operational Green Carts
Despite the large number of permits issued, only 166 operational Green Carts were located.
There is a waiting list to purchase a Green Cart permit, but this waiting list is not based on the number of permit holders who are actually operating.
Who are the Vendors?
83 percent are male 54 percent (includes owners and employees) are from Bangladesh
38 percent speak English At least 88 percent are foreign born
How do Vendors Operate their Business?
31 percent operate year round 96 percent operate full time (5 or more days/week) 51 percent own their own carts, 49 percent are employees 27 percent have an Electronic Benefits Transfer (EBT) machine and 3
percent accept credit cards 65 percent decide what produce to sell based on customer requests
Vendors tend to locate where there is easy access to mass transit and other shopping options.
95 percent are near a bus stop 55 percent are near a subway 42 percent operate near a shopping district 40 percent operate near another fruit and vegetable cart 29 percent operate near a supermarket 76 percent operate near a bodega
KEY ELEMENTS OF THE GREEN CARTS POLICY IMPLEMENTATION MODEL A Public-Private Partnership The success of Green Carts was clearly dependent upon an effective and
sustained collaboration between the City, first with the Mayor’s Office and
5
5
ultimately with its lead implementing agency, the DOHMH, and its private
partner and funder, the Illumination Fund.
Philanthropy Promoting and Supporting Policy Innovation
Philanthropy was able to promote innovation in food policy, which has not typically been high on local government’s funding agenda. The Illumination Fund’s initial $1.5 million grant enabled the City to implement an innovative program, and as the program progressed, provide additional supports that government was unable to fund.
The Illumination Fund helped to publicly position Green Carts as a New York City innovative, local food access initiative by ensuring the broad political
support needed to implement and maintain the program.
The Illumination Fund advocated for programmatic changes as needed and allowed the effort to shift more nimbly than if a public initiative alone.
Support from City Hall for Innovation
Innovative policy generally involves inter-agency coordination and negotiating consensus among conflicting political interests. Green Carts received strong early support from the Mayor’s Food Policy Coordinator who worked with City agencies and the City Council to pass the initial legislation that created the new class of vendor licenses.
A City Agency with the Sustained Interest and Capacity to Implement an Innovative Program
The DOHMH developed an operating plan, provided centralized support for Green Cart vendors and designated staff that focused on successfully
implementing the initiative.
Technical Assistance for Vendors
Vendors received start-up and ongoing operating technical assistance from Karp Resources, supported by the Illumination Fund. Technical assistance is a valuable aspect of any start-up program. On-going technical assistance can be
improved by tracking vendors who receive assistance and regularly surveying them to determine need. This analysis found that technical assistance should continue to focus on operational issues, especially business start-up, produce acquisition and cart transportation.

6
6
Promoting the Program Including a Green Cart Branding Campaign
The Illumination Fund initiated a marketing and communications campaign for Green Carts that helped create a unique brand and build awareness of the importance of fruit and vegetable consumption.
POLICY AND OPERATIONAL RECOMMENDATIONS
Green Carts has achieved unprecedented success, however there are several policy and operational recommendations that would enhance the program and ensure its long-term success.
Collect Periodic and Uniform Data on Vendors and Customers
The data collected in this study establishes the first valid Green Carts baseline data for vendor location and economic viability, as well as customer demographics and purchasing behavior. This data should be used going forward to regularly assess the progress of the program and make necessary changes in the model.
The original program model assumed that the way to provide access to fresh produce for low-income populations was by targeting neighborhoods where this population lives. This analysis found that Green Carts are clustered in areas of high pedestrian traffic where low-income customers live, work or shop. Vendors are already locating where they expect the most customers. Future evaluations must also consider where low-income customers shop and work, not just where they live.
Create Unique Identification Numbers for all Vendors
Since multiple agencies issue identification numbers to the Green Carts, there are different numbers for licenses, permits and health inspection decals. This makes it difficult to track the Green Carts. There should be one unique identifier for each Green Cart vendor that can be cross referenced with all other data currently collected by the City. This would greatly facilitate future data collection and policy analysis.
Create Target Number of Green Carts Based on Market Analysis
We currently do not know how many Green Carts would be optimum for each targeted neighborhood. A market analysis should be conducted so that the number of permits issued produces the needed number of Green Carts in each targeted neighborhood.
Ensure Maximum Utilization of Green Cart Permits
The cost of a permit is $75 for two years. In order to keep the cost low and to ensure maximum utilization of permits, the City needs to track whether a
7
7
permit-holder is actually operating a Green Cart. If a permit is unused within
six months, it should expire, giving others an opportunity to use these permits.
Track Operational Green Carts by Location
Due to the low cost of a permit, many vendors can easily purchase a permit, but do not actually operate a Green Cart. The initial program model issued 1,000 permits for Green Cart vendors. This analysis found 166 carts in operation. The City does not currently track operational Green Carts by location. The number of valid permits does not equal the number of Green Carts in operation. As a consequence, no one knows exactly where a Green Cart is on any given day or how many Green Carts are actually in operation.
Provide Economic Incentives to Locate in Heart of Food Desert
Green Carts was designed to give vendors the flexibility to find their own location within the assigned geographic area. Vendors tend to co-locate with other vendors in areas of high foot-traffic, creating clusters of Green Carts. As a result, some neighborhoods have an abundance of Green Carts, while some have none. If the program goal is to ensure that the heart of the food desert is also served, the City should provide economic incentives to locate in areas that have not yet been penetrated by the Green Carts.
Partner with the New York City Housing Authority (NYCHA)
Partner with NYCHA to operate a Green Cart on City property to provide residents with access to fresh produce.
Target Technical Assistance to Vendor Needs
The vendor survey identified several areas of assistance that should be targeted for future technical assistance such as training in produce acquisition and distribution and Green Cart transportation.
Enhance Product Offerings to Include Other Healthy Food Items
Since Green Carts increases consumption of fruits and vegetables, vendors should be allowed to expand their product offerings to include grains, nuts and other healthy items.
Green Carts Must be Part of a Broad set of Policies to Increase Access to Fresh Fruits and Vegetables in High Need Communities
Since 64 percent of Green Carts vendors operate seasonally, other complimentary programs must also be implemented.
Green Carts is a successful model for increasing access to healthy food in high-density underserved low-income neighborhoods and should be replicated in urban areas across the country.
8
8
Part I: New York City Green Cart Initiative
Introduction Diet-related diseases have reached epidemic levels across the United States, disproportionately affecting residents in low-income communities. According to a 2009 Robert Wood Johnson study, people living in poverty in the United States are more than three times as likely as those in the upper-middle class to suffer from chronic illnesses related to obesity, such as diabetes and heart disease.1
New York City has not fared much better than the nation. According to the New York City Department of Health and Mental Hygiene (DOHMH), over 1.1 million New Yorkers were obese, another 2 million were overweight2 and a staggering 43 percent of New York public elementary school students were overweight.3 The result has been an alarming growth in diet-related diseases in New York City. Diabetes rates in the city increased by 250 percent between 1997 and 2007.4 These trends are even more alarming in low-income neighborhoods. Deaths related to diabetes were 2.3 times higher in low-income neighborhoods than in wealthier neighborhoods.5
Among the many causes of the diet-related disease epidemic, the lack of access to healthy food in low-income neighborhoods has been identified as an important contributing factor.6 This research has made access to healthy food an important public policy issue, with every level of government, philanthropy, civil society and business focused on ways to combat the growing incidences of obesity, heart disease and diabetes. Residents in low-income areas of New York City have suffered disproportionately from obesity and diet-related disease, while these same neighborhoods lack sufficient access to retailers selling fresh fruits and vegetables. According to a 2008 study by the DOHMH and the New York City Department of Planning, approximately three million New Yorkers live in neighborhoods with few grocery stores and high rates of diabetes and obesity.7 An American Journal of Public Health study researched the availability of healthy foods recommended for diabetes patients in New York City. The study found that only 18 percent of stores in East Harlem carried these foods compared to 58 percent of stores on the Upper East Side.8 Most significantly, according to the DOHMH’s own 2004 Community Health Survey, in some of New York City’s most underserved communities, such as the South Bronx, as many as 1 in 4 adults (23 percent) reported that they did not eat a single fruit or vegetable on the previous day. The survey also found that only 10 percent of New Yorkers were eating the recommended five servings of fruits and vegetables per day, and in some low-income neighborhoods this figure was as low as 5 percent.9 These behavioral trends are negatively impacting individual quality of life and public health, and are incurring enormous economic costs to society.
9
9
One effort to address this growing epidemic and increase access to healthy foods in underserved neighborhoods is the New York City Green Cart Initiative (Green Carts). Green Carts was launched in 2008 by the Mayor’s Office of Food Policy in partnership with the DOHMH and the Laurie M. Tisch Illumination Fund (the Illumination Fund). Green Carts was created to:
Increase access to fresh, high quality produce in neighborhoods with low produce availability and where consumption is low;
Increase the number of New Yorkers consuming fresh produce; Provide entrepreneurial opportunities to Green Cart vendors; and Create an economically viable and sustainable program.
A critical part of Green Carts’ program design was the creation of a new class of mobile food carts that could sell fruits and vegetables exclusively in these designated neighborhoods. Launching the program required significant cross agency collaboration, drafting legislation for City Council approval, the development of a new class of vending permits, training for vendors - many of whom were first time food entrepreneurs - and a robust promotional campaign in the targeted neighborhoods.
This report provides a detailed account of Green Carts’ history; documents the program’s development; evaluates the program design and implementation; analyzes program challenges; and determines what factors contributed to its success. It also takes into account the broader implications of the model for New York City’s food policy agenda. Specifically, the report considers whether the model is economically viable and what incentives can be offered to expand its impact in the neighborhoods it is not reaching. Finally, the report identifies best practices and makes recommendations for how New York and other cities can build on the Green Cart model’s success.10
Program Overview
New York City Food Access Initiatives We now know that the consumption of healthy foods in low-income neighborhoods is a problem of both supply and demand. For decades, most public health programs and policies focused on the demand side of the healthy food consumption problem, as experts assumed that lack of awareness and knowledge of the benefits of healthy food were the greatest impediments to healthy choices. The expectation was that increasing education and awareness in low-income communities was the best way to improve healthier food choices. In New York City, government, community organizations, and foundations supported education and awareness programs through public service campaigns, and the development of curricula for local public schools and early childhood education programs targeting children, youth and their families, such as the Eat Well Play Hard program11 and New York State’s Activ8Kids! Campaign.12 More recent research has shown that education and awareness were
10
10
not the only problems in low-income communities, but that many low-income individuals reside in neighborhoods where the markets simply do not sell fresh fruits and vegetables. The problem of low consumption would not simply be solved by addressing demand; but supply would also have to be increased in these neighborhoods to increase the opportunity for low-income people to make healthier choices.
The City would develop several policies to address the supply side of the problem. The Green Cart initiative was designed to have the most far-reaching impact, but also presented complex implementation challenges. Since this program would involve small businesses locating in neighborhoods where demand for fresh fruits and vegetables was thought to be low, the challenges were both in reaching the underserved population and operating an economically viable business. Implementing this program would require strong government leadership, creative thinking, significant resources and a network of partners. The City would also have to begin coordinating its own operations and integrating its programs into a coherent policy that could be benchmarked and evaluated.
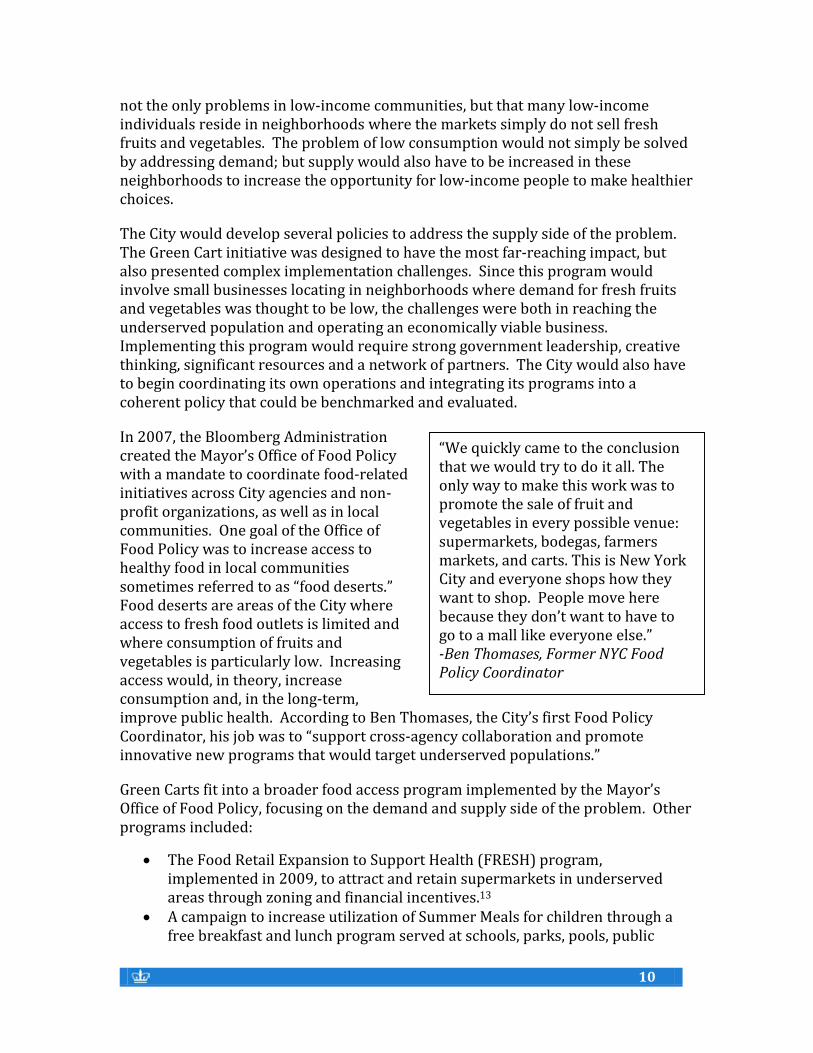
In 2007, the Bloomberg Administration created the Mayor’s Office of Food Policy with a mandate to coordinate food-related initiatives across City agencies and non-profit organizations, as well as in local communities. One goal of the Office of Food Policy was to increase access to healthy food in local communities sometimes referred to as “food deserts.” Food deserts are areas of the City where access to fresh food outlets is limited and where consumption of fruits and vegetables is particularly low. Increasing access would, in theory, increase consumption and, in the long-term, improve public health. According to Ben Thomases, the City’s first Food Policy Coordinator, his job was to “support cross-agency collaboration and promote innovative new programs that would target underserved populations.”
Green Carts fit into a broader food access program implemented by the Mayor’s Office of Food Policy, focusing on the demand and supply side of the problem. Other programs included:
The Food Retail Expansion to Support Health (FRESH) program, implemented in 2009, to attract and retain supermarkets in underserved areas through zoning and financial incentives.13
A campaign to increase utilization of Summer Meals for children through a free breakfast and lunch program served at schools, parks, pools, public
“We quickly came to the conclusion that we would try to do it all. The only way to make this work was to promote the sale of fruit and vegetables in every possible venue: supermarkets, bodegas, farmers markets, and carts. This is New York City and everyone shops how they want to shop. People move here because they don’t want to have to go to a mall like everyone else.” -Ben Thomases, Former NYC Food Policy Coordinator
11
11
libraries and other community locations throughout the City when school is out of session.
Healthy food programs to increase both the supply of - and demand for - fresh produce such as Health Bucks and Healthy Bodegas, started in 2005. Health Bucks distributes $2 coupons to purchase fresh produce at participating farmers markets and Healthy Bodegas works with communities to increase access to healthy foods at bodegas. Several public service health education campaigns were also launched.14
History and Program Evolution For policy initiatives to succeed, they need the support of a government agency that is willing to put together the political coalition, develop an implementation plan, and secure the resources necessary to support the program. Even with all those requisite conditions in place, there are no guarantees that a new policy initiative will actually achieve its stated goals. These challenges exist for any policy innovation, but are especially acute when government develops programs in policy areas that have not been part of its traditional responsibility. “Food” has not traditionally been viewed as a standalone policy area, such as economic development or education, or as an essential city service, like policing or sanitation.
When the Bloomberg Administration created the Office of Food Policy and hired its first coordinator, food policy moved from the periphery of discussions about improving public health and reducing poverty, to its own position on the City’s public policy agenda. The Mayor strategically placed the Office of Food Policy in City Hall to elevate the discussion and encourage innovation.
The concept of a Green Cart program was brought to the attention of Thomases and the Office of Food Policy by both the DOHMH and the Citizens’ Committee for Children (CCC).15 The idea was innovative and exciting but it also needed political support and resources before it could be implemented successfully. DOHMH approached the Illumination Fund early in the process, looking to establish a public/private partnership to support the program. The Illumination Fund provided a $1.5 million multi-year grant to support Green Carts.16 An important partnership developed between Ben Thomases, Laurie Tisch, President of the Illumination Fund and the Illumination Fund’s then Executive Director, Gail Nayowith that helped get the program off the ground and propel Green Carts forward. The willingness of both the City and the Illumination Fund to assume leadership roles in designing a new program with a bold goal – improving healthy food access in underserved communities – was critical to the success of the program. Green Carts had no track record in any other city, but the partners determined that as long as it was implemented well, the program could have significant health as well as economic benefits for low-income New Yorkers.
The Green Cart Program aims to increase availability of fresh fruit and vegetables in New York City neighborhoods, so that more New Yorkers can buy fresh fruit and vegetables close to home.
12
12
Thomases understood that Green Carts would provide an unprecedented opportunity to address healthy food access by increasing the supply in underserved neighborhoods. The City had existing infrastructure for licensing and monitoring mobile food vendors, and because the number of vending permits was capped, there was an ample list of food entrepreneurs waiting for mobile food vending permits. Food vending had the added potential of being economically self-sufficient, and could therefore be a sustainable model with a long-term role in reducing the number of food deserts in New York City.
Encouraging the sale of fresh produce through vendor carts, while a seemingly straightforward idea, proved very complex in planning and implementation. It involved working with multiple city agencies, competing political constituencies, and logistical challenges that emerged during the design of Green Carts. An unprecedented level of coordination was provided by the Mayor’s Office of Food Policy and vendor supports were provided through private funding from the Illumination Fund.
In the fall of 2008, Mayor Bloomberg and City Council Speaker Christine Quinn jointly introduced legislation in the New York City Council to establish the Green Carts program. The legislation was introduced as an amendment to the City Street Vending Code. Despite strong support from City leadership, there was significant political opposition to the Green Carts. Local merchants including the Korean Grocers Association, bodega owners, Business Improvement Districts, as well as powerful lobbying forces such as the National Supermarket Association, opposed mobile vending expansion, fearing competition for their businesses.17
The DOHMH was surprised by the opposition to the carts, as Peggy Leggat, former Green Cart Coordinator noted: “the more carts on the street, the better. There is no such thing as ‘too many’ even if they are on top of each other. Green Carts are part of a ‘quilt of solutions’ to the food desert issue. Their presence will spur more and more availability through other outlets (local stores selling more produce). The more that fresh fruits and vegetables are available, the more normalized they will become as an option- and hopefully this will encourage an increase in consumption.”18 In the end, the bill passed, but the negotiations reduced the number of allowed permits and the number of precincts where the Green Carts could operate.
Green Carts officially launched in 2008. The City agreed to provide low-cost permits specifically for vendors willing to operate in designated underserved neighborhoods such as the South Bronx, Harlem, Washington Heights, Bedford Stuyvesant, Brownsville, Jamaica, St. George and the Rockaways.19 Neighborhoods were selected where at least 14 percent of residents stated that they had not eaten any fruits or vegetables the previous day; there was a lack of healthy, affordable produce option; and residents had disproportionately high rates of obesity, diabetes and heart disease (see Figure 1 for map of selected neighborhoods).20
13
13
The DOHMH was designated the lead administrative agency and worked with the Illumination Fund, their official private sector partner. The Illumination Fund’s grant supported the program launch, including technical assistance for vendors interested in obtaining permits, vendor training and marketing support. ACCION NYC, a local non-profit small business support organization, was contracted to provide low-interest loans to vendors for startup costs. The program was designed to provide a fast and relatively simple way for vendors to launch a food business.
Partner Development and Stakeholder Buy-In Green Carts was implemented as a partnership between two City agencies – the Mayor’s Office and DOHMH – and the private and non-profit sector – the Illumination Fund and, beginning in 2008, Karp Resources and several community-based organizations (CBOs). Executive and legislative leadership was essential for designing the initiative, passing the necessary legislation, and coordinating implementation with public and private partners. This leadership was also instrumental in outreach to local community boards, bodega owners, and existing food cart vendors to allay their concerns about competition, especially at the initial stages of program development.21 The success of Green Carts was ultimately dependent upon an effective and sustained collaboration between the City, first with the Mayor’s Office and ultimately with its lead implementing agency the DOHMH, and its private partner and funder, the Illumination Fund.
The City’s partners included:
The Mayor’s Fund to Advance New York City (Mayor’s Fund). A non-profit established by Mayor Bloomberg to facilitate public-private partnerships. It served as the legal and fiscal conduit between the Illumination Fund and the City.
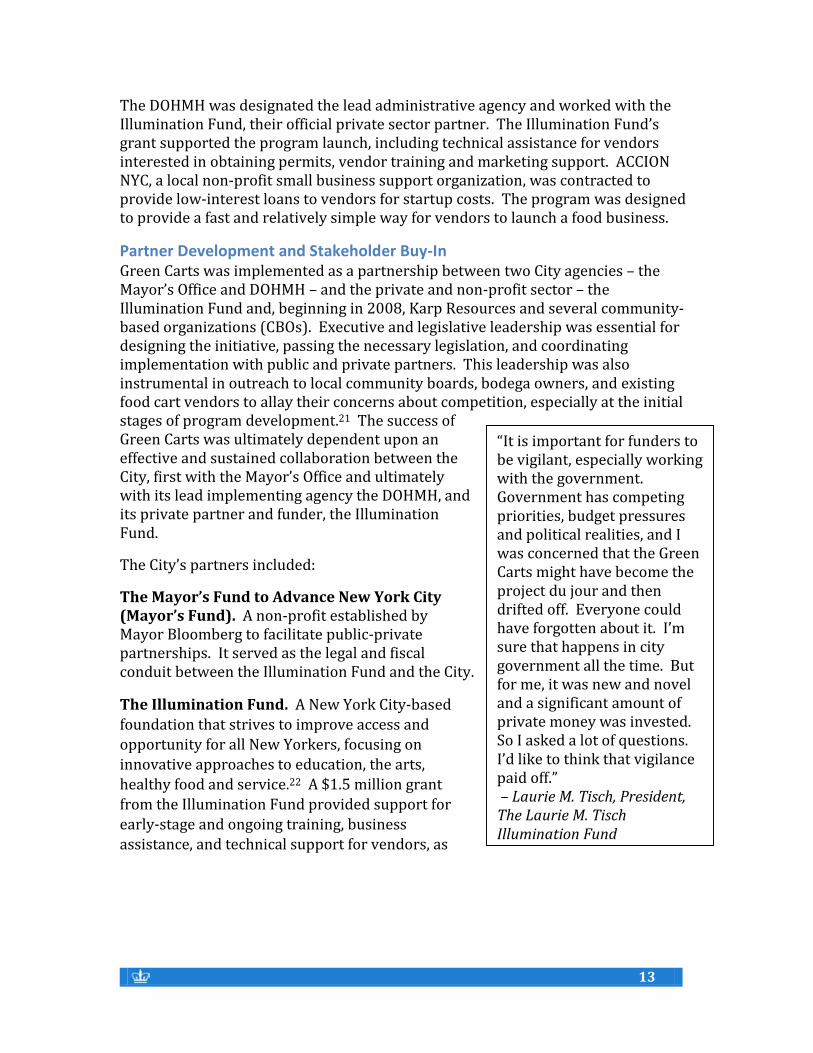
The Illumination Fund. A New York City-based foundation that strives to improve access and opportunity for all New Yorkers, focusing on innovative approaches to education, the arts, healthy food and service.22 A $1.5 million grant
from the Illumination Fund provided support for early-stage and ongoing training, business assistance, and technical support for vendors, as
“It is important for funders to be vigilant, especially working with the government. Government has competing priorities, budget pressures and political realities, and I was concerned that the Green Carts might have become the project du jour and then drifted off. Everyone could have forgotten about it. I’m sure that happens in city government all the time. But for me, it was new and novel and a significant amount of private money was invested. So I asked a lot of questions. I’d like to think that vigilance paid off.” – Laurie M. Tisch, President, The Laurie M. Tisch Illumination Fund
14
14
well as marketing and advertising
costs. Program promotion and community education was especially critical in Green Carts’ early days and helped draw vendors as well as customers to the Initiative.
The Illumination Fund also helped to publicly position Green Carts as one of a small number of New York City innovative local food access initiatives, ensuring the broad political support needed to implement and maintain the
program. The Illumination Fund was also able to respond quickly to programmatic challenges when the City bureaucracy could not. As a result, it played a critical role in getting the program rapidly off the ground and making early-stage program modifications when needed. For example, when ticketing and fines became a challenge to vendors staying in business, the Illumination Fund helped expedite the creation of posters with tips for vendors on how to reduce their chances of getting ticketed and fined – leveraging its role as private funder to pressure government to move. In order to build public awareness for Green Carts and the food access issue in low-income communities, the Illumination Fund also developed a cookbook and produced a
documentary, “The Apple Pushers.”23
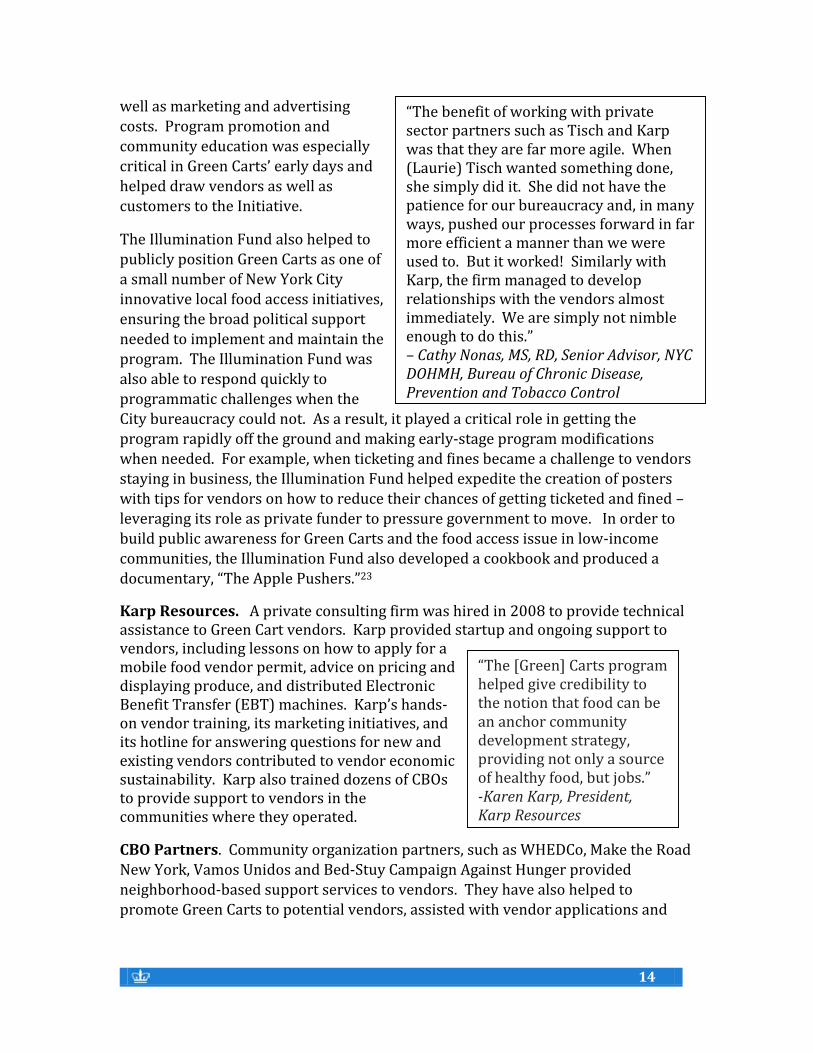
Karp Resources. A private consulting firm was hired in 2008 to provide technical assistance to Green Cart vendors. Karp provided startup and ongoing support to vendors, including lessons on how to apply for a mobile food vendor permit, advice on pricing and displaying produce, and distributed Electronic Benefit Transfer (EBT) machines. Karp’s hands-on vendor training, its marketing initiatives, and its hotline for answering questions for new and existing vendors contributed to vendor economic sustainability. Karp also trained dozens of CBOs to provide support to vendors in the communities where they operated.
CBO Partners. Community organization partners, such as WHEDCo, Make the Road New York, Vamos Unidos and Bed-Stuy Campaign Against Hunger provided neighborhood-based support services to vendors. They have also helped to promote Green Carts to potential vendors, assisted with vendor applications and
“The [Green] Carts program helped give credibility to the notion that food can be an anchor community development strategy, providing not only a source of healthy food, but jobs.” -Karen Karp, President, Karp Resources
“The benefit of working with private sector partners such as Tisch and Karp was that they are far more agile. When (Laurie) Tisch wanted something done, she simply did it. She did not have the patience for our bureaucracy and, in many ways, pushed our processes forward in far more efficient a manner than we were used to. But it worked! Similarly with Karp, the firm managed to develop relationships with the vendors almost immediately. We are simply not nimble enough to do this.” – Cathy Nonas, MS, RD, Senior Advisor, NYC DOHMH, Bureau of Chronic Disease, Prevention and Tobacco Control
15
15
provided ongoing technical assistance addressing challenges such as cart storage,
vendor ticketing and fines.
Program Mission and Goals
Mission The mission of Green Carts, as originally presented by the DOHMH in testimony before the City Council, was to improve public health by introducing affordable, high quality produce to underserved low-income communities through a targeted street vending program. The program was designed to increase access to healthy food and expected to improve the health of New Yorkers.24
Program Goals and Performance Indicators Green Carts’ short -to medium-term goals:
Increase access to fresh, high quality produce in neighborhoods with low access to produce and where consumption is low;
Increase the number of New Yorkers consuming fresh produce; Provide entrepreneurial opportunities to Green Cart vendors; and Create an economically viable and sustainable program.
Green Carts’ long-term goals: Increase demand for healthy foods in underserved neighborhoods, a majority
of which are low-income; and Decrease the incidence of diet-related diseases in the City’s low-income
population.
Expected Health Outcomes Green Carts’ expected health outcomes focused on nutrition awareness and consumption of fresh produce. The expectation was that people living near Green Carts would become more aware of the benefits of incorporating fresh produce into their diets, and then change their behavior by purchasing and consuming more fresh fruit and vegetables. At the outset, no distinction was made between purchases for “snacks” and higher volume grocery shopping for home.
The ultimate goal of the program was to decrease the public health problem coming from diet-related diseases, by increasing the consumption of fresh fruits and vegetables. The City estimated that the program would improve the health of 75,000 New Yorkers and save at least 50 lives a year over the long-term. This estimate was based on the consumption habits in the Green Cart areas and purchasing patterns at fruit and vegetable carts.25 It soon became clear that assessing the direct impact of the Green Carts on disease incidence would be too difficult to measure. Consequently, this quickly became a less important aspect in the overall justification for the program.
16
16
Expected Economic Outcomes As Green Carts evolved, there was recognition that the program also needed to be profitable for vendors to have a positive and long term impact. Simply put, if the vendors cannot make a living, then they go out of business. If the Green Carts are economically unsustainable over time then the program would not be a viable way to increase access to healthy foods in low-income communities. Since Green Carts’ success is dependent on the profitability of its individual vendors, the viability of the vendor business model must also be evaluated. This concept was not considered explicitly when Green Carts was developed, but is included in this study’s analysis. The Illumination Fund understood this implicitly, as they chose to invest in vendor business supports, which we now know have been critical to Green Carts’ overall success.
Program Model and Implementation
Initiative Overview The launch of Green Carts in 2008 included the following elements:
Legislation to support the start-up of 1,000 Green Cart small businesses through special permits for vendors interested in selling quality fresh produce in underserved New York City neighborhoods;
Start-up support for vendors, including workshops and training on permit application and starting a small business;
A non-profit wholesale supplier for sourcing quality produce; A microloan fund dedicated to serving cart operators; Uniquely branded Green Carts; Coordinated marketing and community outreach efforts to support vendors
and increase community awareness of fresh produce availability in their neighborhoods.
Vendor Permitting and Start-Up Individuals interested in becoming Green Cart vendors were required to first obtain a Mobile Food Vending License through DOHMH. Mobile Food Vending License holders then submitted an application to be placed on the Green Cart Waiting List. Individuals selected from the waiting list were sent an application from DOHMH that was to be completed and submitted within 30 days along with a $75 fee. They then had six months to purchase a mobile cart and present it to DOHMH for inspection. Upon passing inspection, DOHMH affixed a permanent decal to the cart, and provided the vendor with an official Green Cart umbrella.26 This process allowed DOHMH to adapt its existing infrastructure and policies to support the addition of dedicated Green Carts, minimizing vendors’ administrative costs and start-up time.
The cost of operating a Green Cart includes the cost of a food vending license ($103 for two years) for each operator plus the cost of a permit for the Green Cart ($75 for
17
17
two years). While these costs are similar to that of other vending licenses and permits, Green Carts are the only new food vending permits presently available. No other food vending permits – for example, hot dogs or produce cart permits in “non-food deserts” – are currently being issued in New York City. Keeping the cost of the license and permits low and being the only vending opportunity available in the City were both important factors in attracting new vendors to the program.
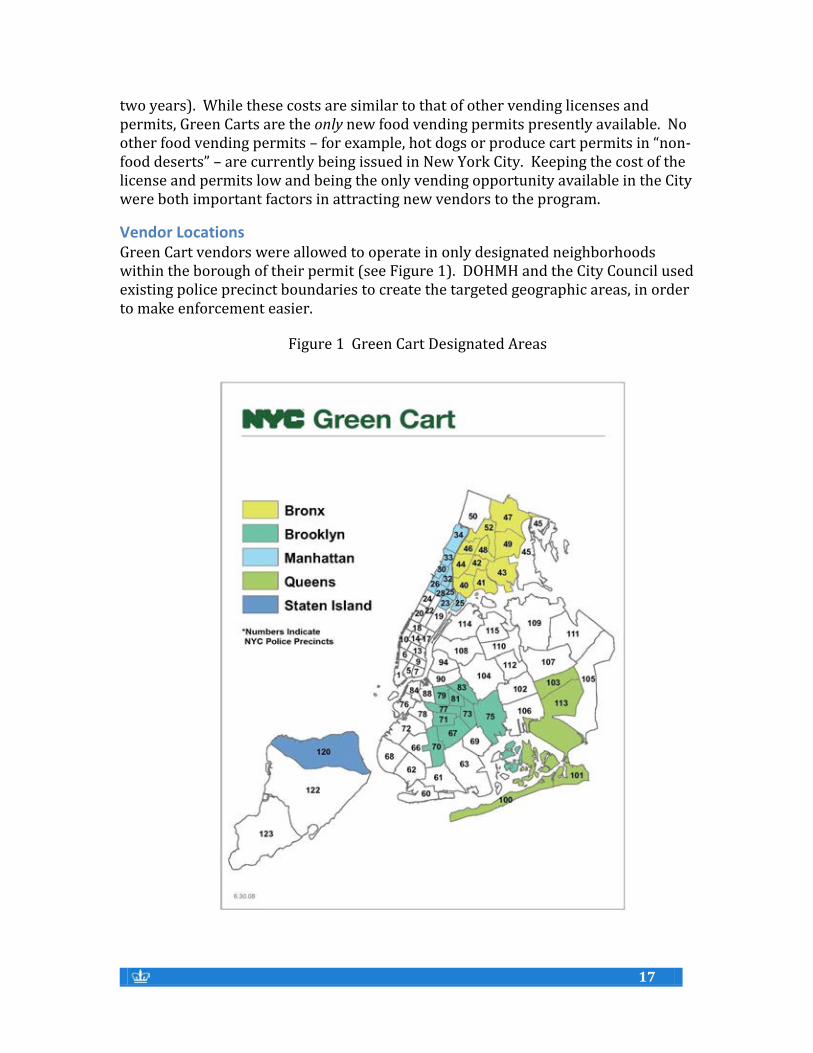
Vendor Locations Green Cart vendors were allowed to operate in only designated neighborhoods within the borough of their permit (see Figure 1). DOHMH and the City Council used existing police precinct boundaries to create the targeted geographic areas, in order to make enforcement easier.
Figure 1 Green Cart Designated Areas
18
18
Geographic areas were selected by the DOHMH based on four characteristics
associated with food deserts: (1) median income of up to 200 percent of the federal poverty level;27 (2) low concentrations of grocery stores; (3) low consumption of fresh fruits and vegetables; (4) high incidences of food-related health issues such as obesity, diabetes and heart disease. There is a correlation between communities with low access and consumption and low-income. Green Carts, therefore, primarily targets New York’s neighborhoods with high concentrations of poverty.
Vendor Operating Model Each vendor was given the opportunity to source their own produce. Many chose to travel to the Hunts Point Market in the Bronx each day to select their produce. Others contracted with delivery companies who bring fruits and vegetables directly to the vendors. The initial Green Carts proposal called for the development of a single wholesale distributor to provide produce at a lower cost to vendors. The idea was to develop a non-profit social-purpose business that would sell produce at or below market rates, sustaining losses in the first year that would be covered by the project plan.28 In 2009, the first year of Green Carts operation, DOHMH determined that the logistics of establishing a single wholesale distributor were too difficult, and decided to reallocate the budgeted grant funds to a private company, Karp Resources, to provide additional vendor technical assistance and training.
Financing the Business To facilitate Green Carts start-up, the Mayor’s Office of Food Policy and DOHMH selected the micro-lending agency ACCION New York to provide low-cost financing to Green Cart vendors.29 ACCION New York had a strong history of successful lending in low-income communities, having lent over $76 million to individuals and businesses from 1991 to 2008.30 Funds from the Illumination Fund were budgeted to provide $5,000 loans to 100 entrepreneurs at an interest rate capped at 10 percent, lower than the standard rate for this type of small business loan.31 In addition to the startup capital, ACCION also provided one-on-one financial counseling for its borrowers to help them establish a positive credit history and grow their businesses.32 While the loan program ACCION was offering vendors made sense in the planning phase of the initiative, as it turned out, there was little vendor interest during the first years of the program. ACCION only processed 12 loans, as most vendors preferred to borrow from friends and family or find their own sources of funding.33 In August 2010, DOHMH and the Mayor’s Fund terminated ACCION’s loan program, due to lack of vendor interest.
To make it easier for low-income customers to purchase from the Green Carts, the New York State Office of Temporary and Disability Assistance (OTDA) gave permission for Green Cart vendors to accept Supplemental Nutrition Assistance Program (SNAP) benefits (formerly known as Food Stamps), using the Electronic Benefits Transfer (EBT) system. The Farmers Market Federation of New York provided wireless EBT machines that could be used on the street, and Karp

19
19
Resources was responsible for training vendors interested in obtaining EBT machines for use at their carts.34
Vendor Support Karp was initially retained in 2008 through an Illumination Fund grant to the Mayor’s Fund to provide technical assistance and support services to Green Cart vendors. In 2013 Karp was funded directly by the Illumination Fund. The model for assistance was designed by Karp specifically for Green Cart vendors in mind and was provided in English, Spanish and Bengali.35
Once hired, Karp identified a number of problems vendors were continuing to have. Karp assisted vendors who were unfamiliar with the neighborhoods where they were working, had little or no vending experience, or who had trouble understanding the program. Karp also looked into and addressed vendor logistical issues, such as the lack of commissaries for vendors to store their carts and helped advocate for changes to the Commissary Code. Karp assisted in getting Green Cart vendors free access to the Hunts Point Market, as well as helping vendors identify alternative distribution systems for buying produce.36
The initial Green Carts proposal included designs for a coordinated marketing campaign, which promoted the general value of eating fruits and vegetables. It included information about the Green Carts as a convenient and reliable source of produce. The campaign also funded umbrellas, posters, billboards, promotional bags, and street teams distributing flyers.37 The purpose of the campaign was to assist vendors in business development and customer acquisition.
In April 2012, the Illumination Fund awarded $7,500 grants to ten CBOs,38 following earlier support from the Deutsche Bank Americas Foundation,39 to recruit and educate Green Cart permit applicants, and to provide workshops and individualized assistance to improve the business skills of operating vendors. This work was also developed and implemented by Karp and the DOHMH.40 In addition, lists of more than a dozen community partners were made available to Green Cart vendors for neighborhood-based support services, ranging from marketing and promotion opportunities to nutrition education to cart storage.
20
20
Part II: NYC Green Carts’ Program Evaluation
Overview In mid-2013, the Illumination Fund engaged faculty at Columbia University’s School of International and Public Affairs (SIPA) as an independent evaluator to analyze the effectiveness of Green Carts in improving access to fresh fruits and vegetables for low-income New Yorkers; to assess the economic viability of Green Carts as small businesses; and to consider the role of philanthropy in promoting and supporting innovative public policy. The research group, led by Professors Ester Fuchs and Sarah Holloway, developed a conceptual model and research plan to determine whether Green Carts was meeting its goals.
A review of existing research and data from sources including the DOHMH, Karp and the New York Academy of Medicine was undertaken. Data collected by the DOHMH was important, but did not focus on the questions of the study, so could not be used to assess the impact of the Green Carts program. Karp, Green Carts’ technical assistance provider, did not collect economic viability data that could be used in an evaluation. Most significant for the purposes of this study, there was no comprehensive valid data on vendor location, economic viability or customer behavior. A census of the first cohort of vendors was not undertaken, and no one was tracking exact vendor location, or which vendors are actually operating their carts. Data from other studies was not methodologically valid, consistent or comprehensive. See Appendix B for an extensive discussion of the findings and
limitations of these reports and studies.
While we relied on earlier research when possible, our evaluation model and research design led to the collection of extensive primary data on neighborhood characteristics, vendor locations and business practices (see Appendix C for Vendor Survey), and customer behavior (see Appendix D for Customer Survey). The result is a comprehensive report on Green Carts’ implementation, impact, and long-term viability.
Key Findings In order to understand how the Green Carts program was operating, we first collected data on vendor demographic characteristics and business practices and neighborhood characteristics of vendor location. To further understand the program’s impact on the targeted population, we then collected data on customer demographics and behavior.
The evaluation research was informed by four key questions:
21
21
1. Is Green Carts increasing access to fresh produce in food deserts by locating in targeted geographic areas?
2. Are Green Cart vendors economically viable in the long-term? 3. Is Green Carts reaching the targeted low-income population? 4. Is Green Carts changing customer behavior?
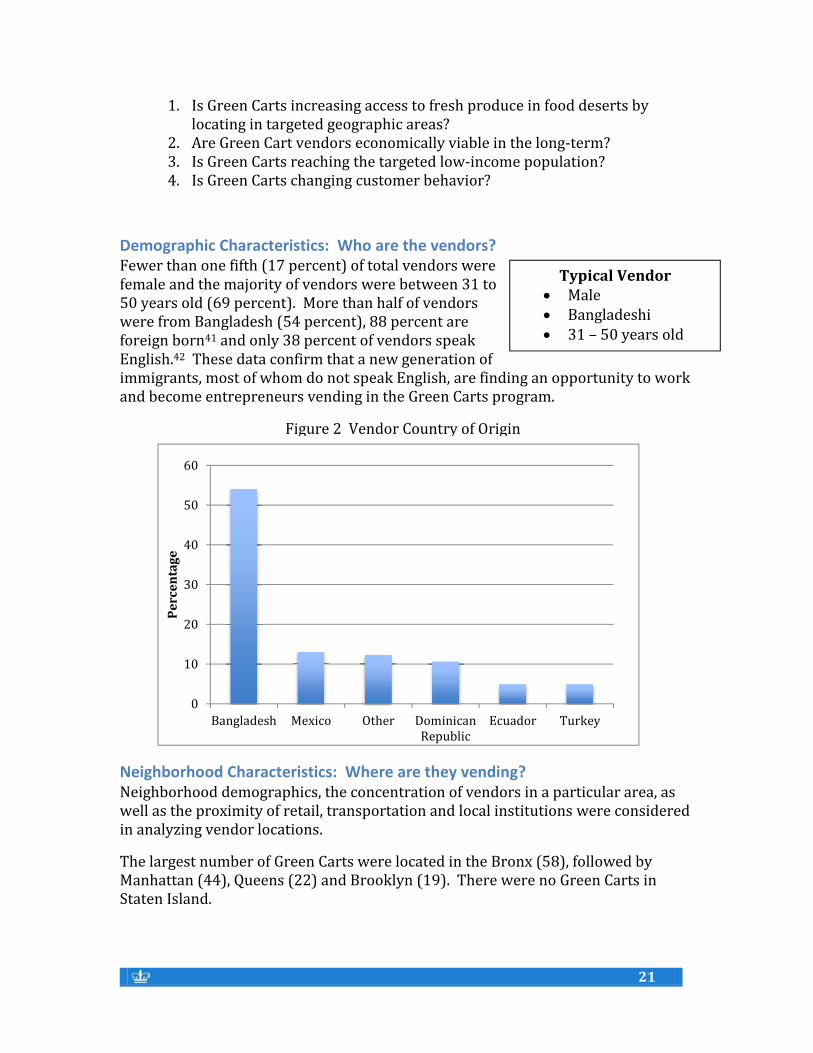
Demographic Characteristics: Who are the vendors? Fewer than one fifth (17 percent) of total vendors were female and the majority of vendors were between 31 to 50 years old (69 percent). More than half of vendors were from Bangladesh (54 percent), 88 percent are foreign born41 and only 38 percent of vendors speak English.42 These data confirm that a new generation of immigrants, most of whom do not speak English, are finding an opportunity to work and become entrepreneurs vending in the Green Carts program.
Neighborhood Characteristics: Where are they vending? Neighborhood demographics, the concentration of vendors in a particular area, as well as the proximity of retail, transportation and local institutions were considered in analyzing vendor locations.
The largest number of Green Carts were located in the Bronx (58), followed by Manhattan (44), Queens (22) and Brooklyn (19). There were no Green Carts in Staten Island.
0
10
20
30
40
50
60
Bangladesh Mexico Other DominicanRepublic
Ecuador Turkey
Pe
rce
nta
ge
Figure 2 Vendor Country of Origin
Typical Vendor Male Bangladeshi 31 – 50 years old
22
22
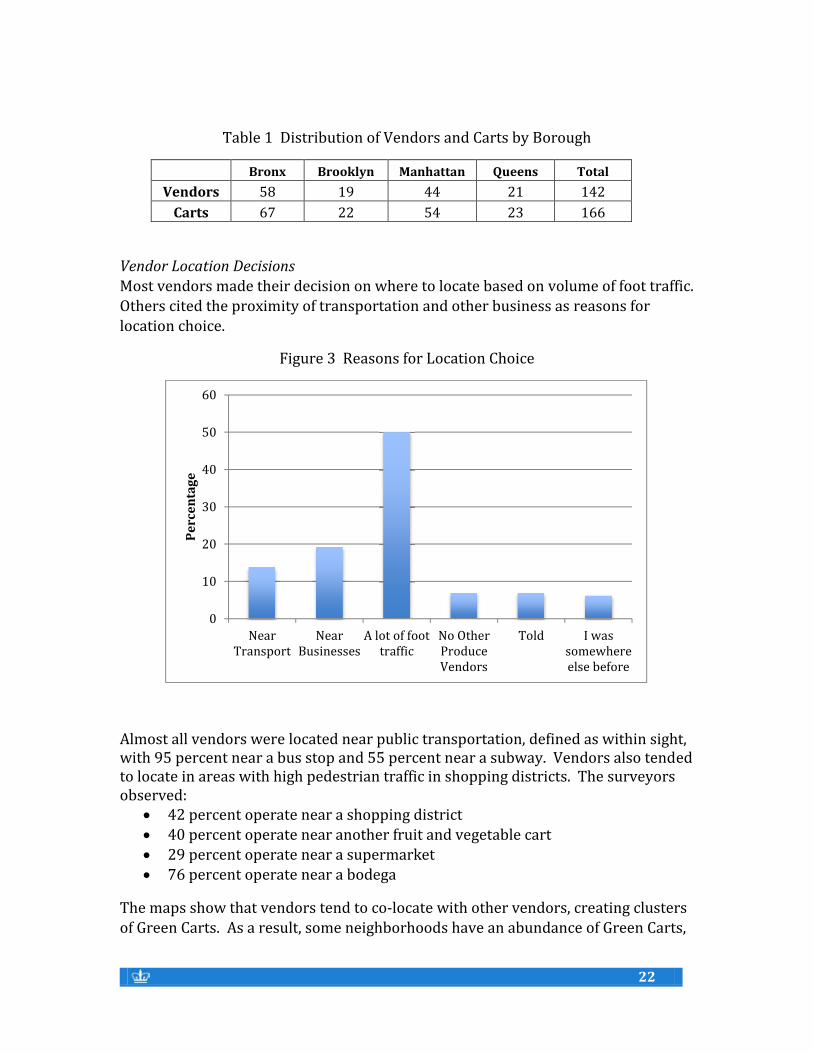
Table 1 Distribution of Vendors and Carts by Borough
Bronx Brooklyn Manhattan Queens Total
Vendors 58 19 44 21 142
Carts 67 22 54 23 166
Vendor Location Decisions Most vendors made their decision on where to locate based on volume of foot traffic. Others cited the proximity of transportation and other business as reasons for location choice.
Figure 3 Reasons for Location Choice
Almost all vendors were located near public transportation, defined as within sight, with 95 percent near a bus stop and 55 percent near a subway. Vendors also tended to locate in areas with high pedestrian traffic in shopping districts. The surveyors observed:
42 percent operate near a shopping district 40 percent operate near another fruit and vegetable cart 29 percent operate near a supermarket 76 percent operate near a bodega
The maps show that vendors tend to co-locate with other vendors, creating clusters of Green Carts. As a result, some neighborhoods have an abundance of Green Carts,
0
10
20
30
40
50
60
NearTransport
NearBusinesses
A lot of foottraffic
No OtherProduceVendors
Told I wassomewhereelse before
Pe
rce
nta
ge
23
23
while some have none. Vendor locations were analyzed by borough and mapped to
determine where the clusters occurred.
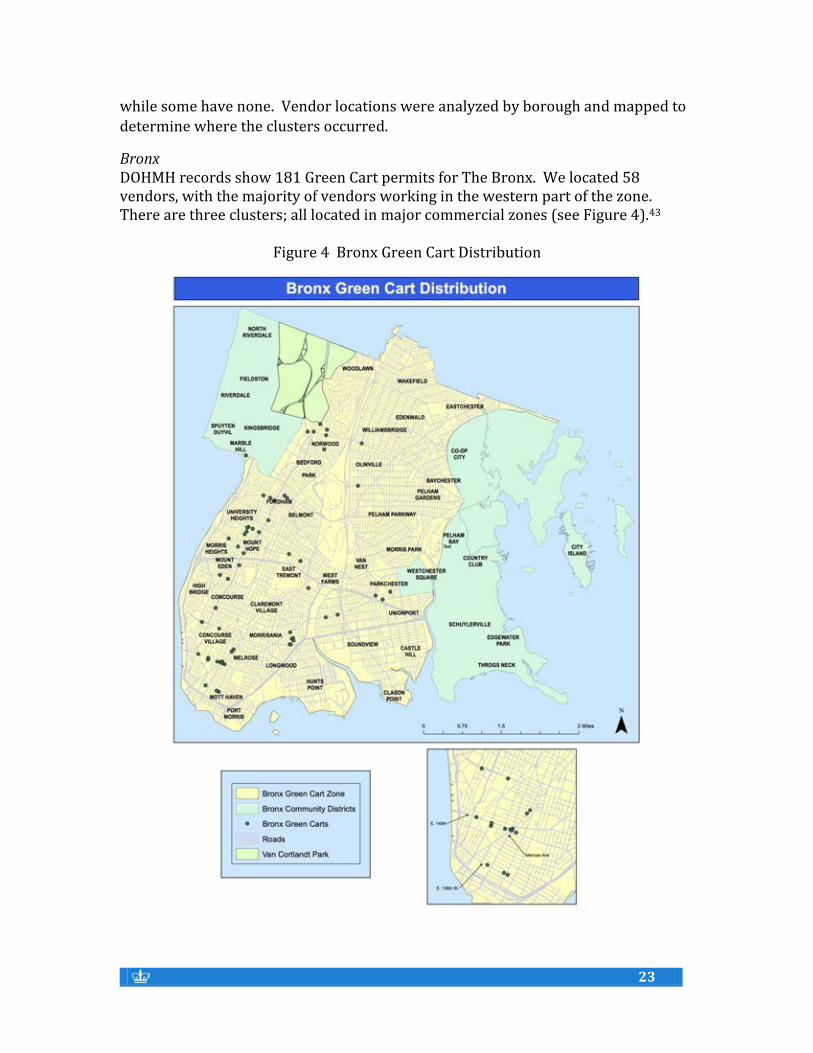
Bronx DOHMH records show 181 Green Cart permits for The Bronx. We located 58 vendors, with the majority of vendors working in the western part of the zone. There are three clusters; all located in major commercial zones (see Figure 4).43
Figure 4 Bronx Green Cart Distribution
24
24
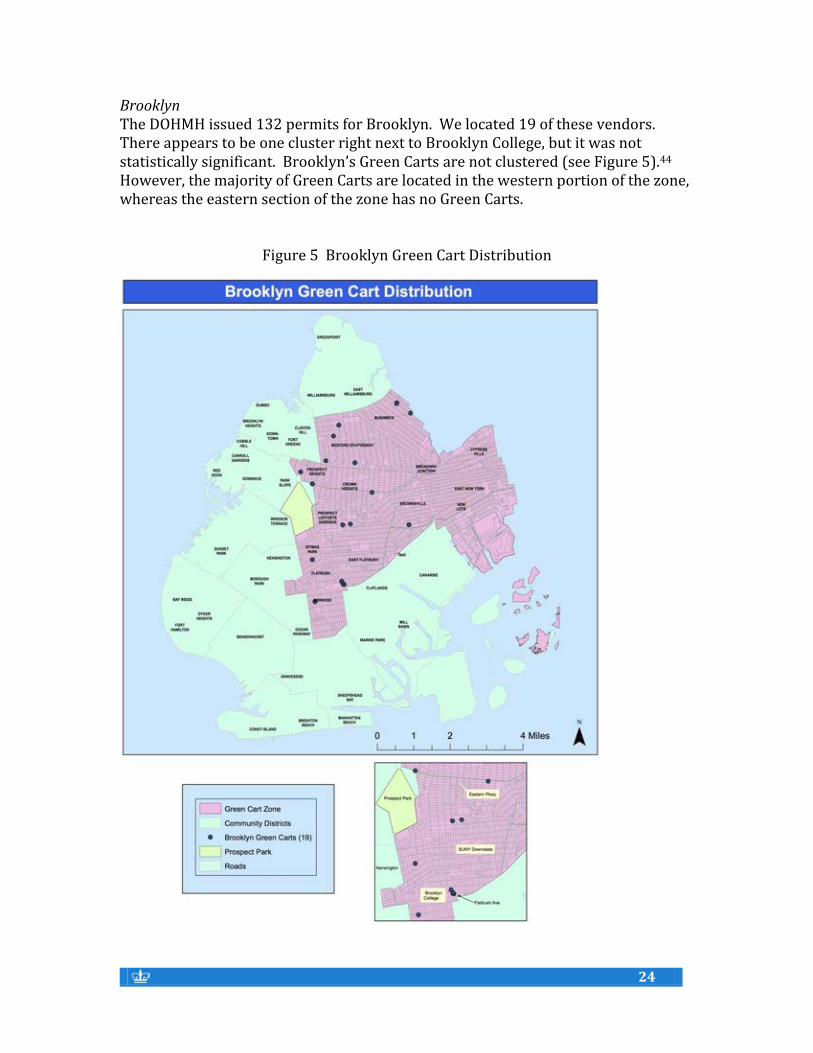
Brooklyn The DOHMH issued 132 permits for Brooklyn. We located 19 of these vendors. There appears to be one cluster right next to Brooklyn College, but it was not statistically significant. Brooklyn’s Green Carts are not clustered (see Figure 5).44 However, the majority of Green Carts are located in the western portion of the zone, whereas the eastern section of the zone has no Green Carts.
Figure 5 Brooklyn Green Cart Distribution
25
25
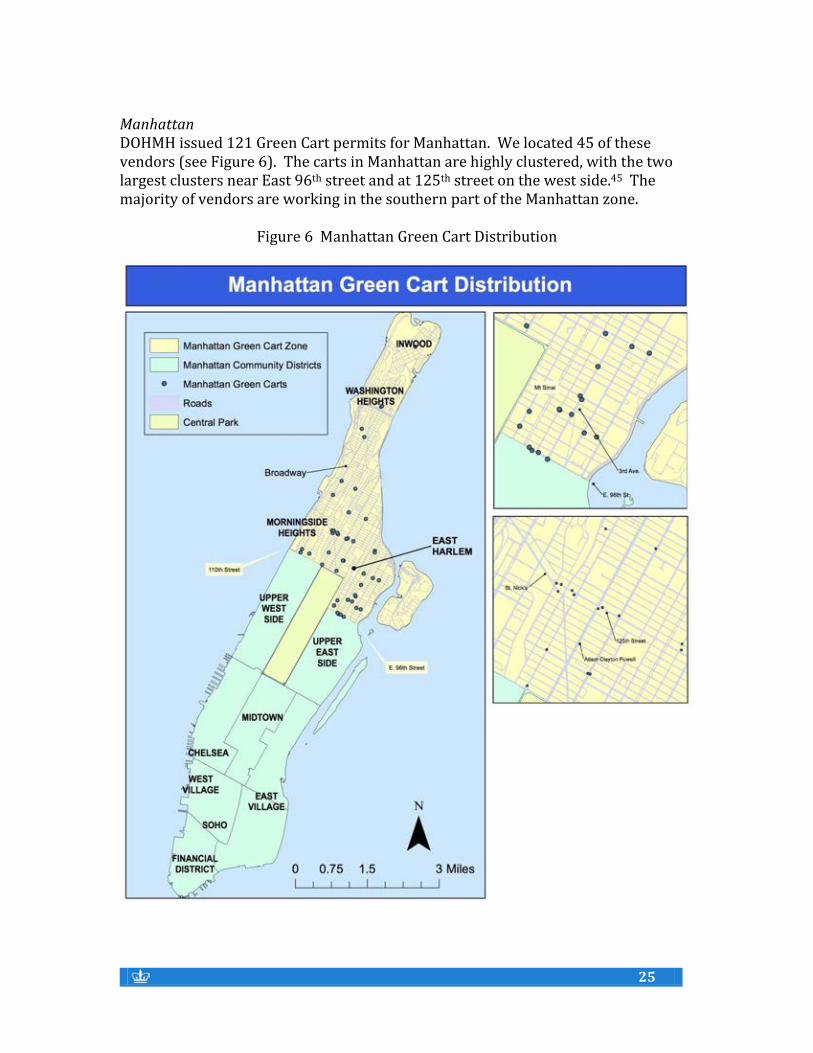
Manhattan DOHMH issued 121 Green Cart permits for Manhattan. We located 45 of these vendors (see Figure 6). The carts in Manhattan are highly clustered, with the two largest clusters near East 96th street and at 125th street on the west side.45 The majority of vendors are working in the southern part of the Manhattan zone.
Figure 6 Manhattan Green Cart Distribution
26
26
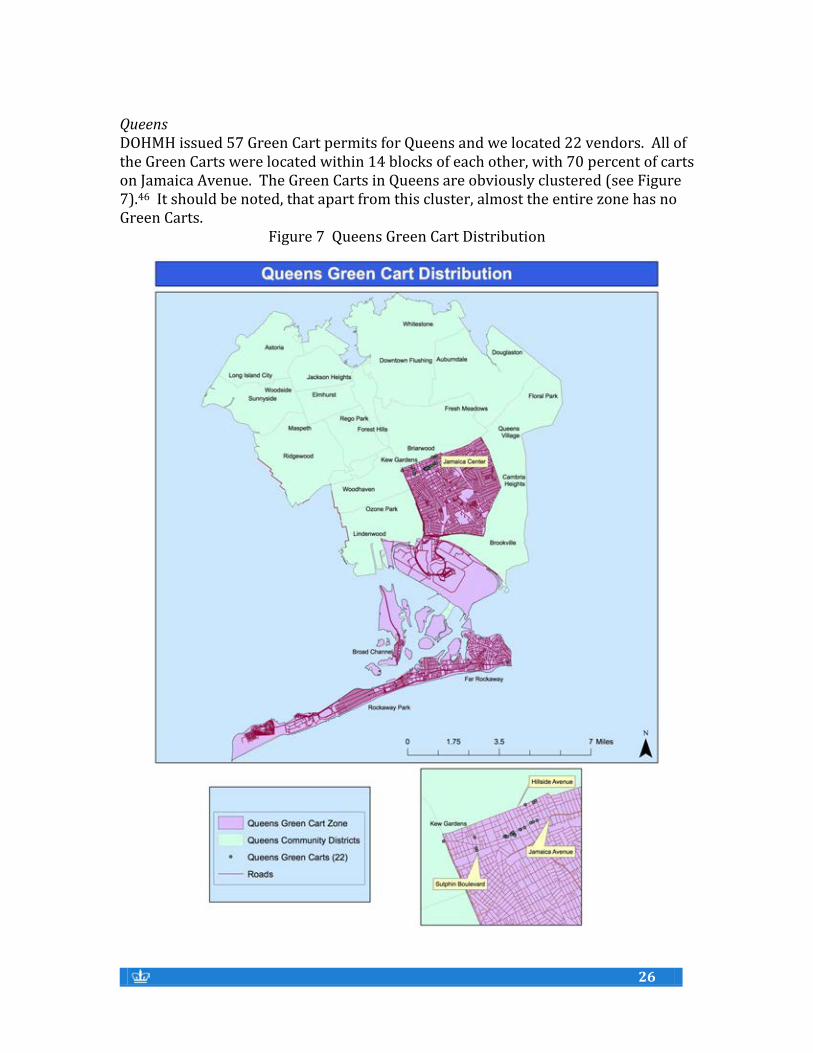
Queens DOHMH issued 57 Green Cart permits for Queens and we located 22 vendors. All of the Green Carts were located within 14 blocks of each other, with 70 percent of carts on Jamaica Avenue. The Green Carts in Queens are obviously clustered (see Figure 7).46 It should be noted, that apart from this cluster, almost the entire zone has no Green Carts.
Figure 7 Queens Green Cart Distribution
27
27
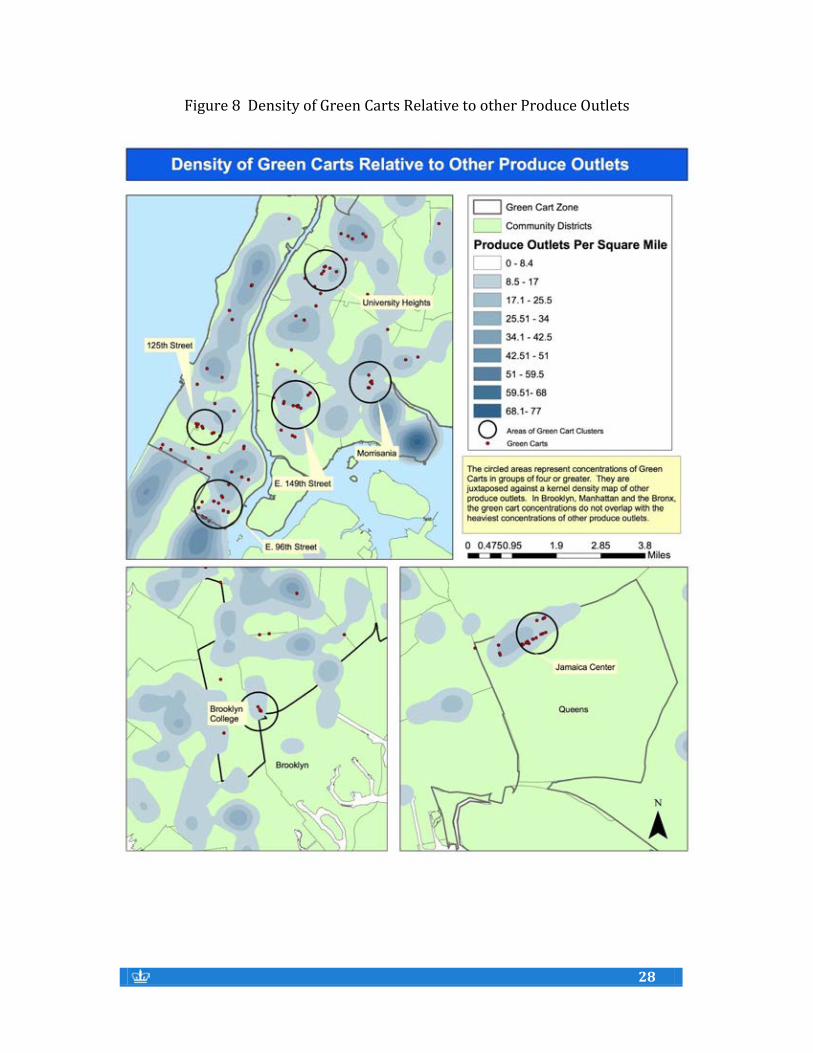
Green Cart Proximity to Areas of High Fruit-Vegetable Density In the Bronx, Manhattan and Brooklyn, Green Carts did not overlap with the areas that had the greatest concentrations of existing produce stores. Several Green Carts were located on the periphery of higher density produce areas, but none were found clustered within them. Queens was the only borough where the Green Carts cluster overlapped with the highly concentrated produce area (see Figure 8).47 This finding, that most Green Carts are located in areas with relatively low produce store density, indicates that Green Carts is achieving its goal of reaching populations in high need neighborhoods. This would dispute some of the earlier research.48 At the same time, more operating carts would be necessary to reach other high need areas in the Green Carts zones.
28
28
Figure 8 Density of Green Carts Relative to other Produce Outlets
29
29
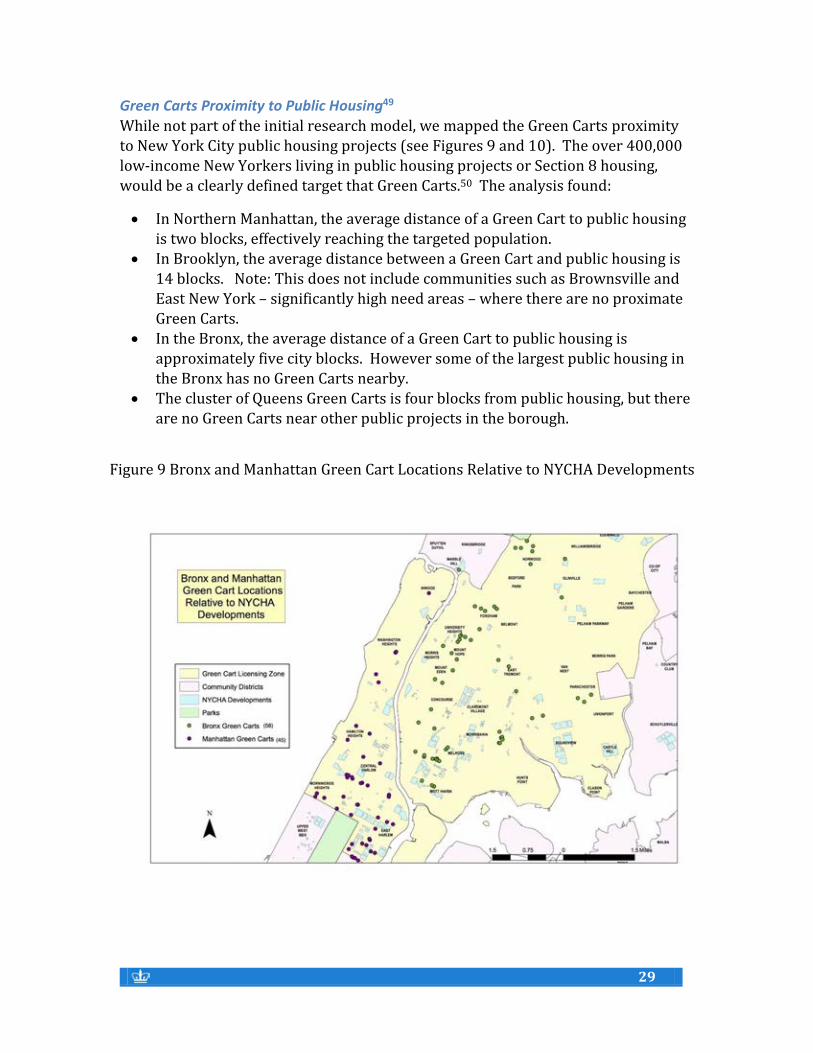
Green Carts Proximity to Public Housing49
While not part of the initial research model, we mapped the Green Carts proximity to New York City public housing projects (see Figures 9 and 10). The over 400,000 low-income New Yorkers living in public housing projects or Section 8 housing, would be a clearly defined target that Green Carts.50 The analysis found:
In Northern Manhattan, the average distance of a Green Cart to public housing is two blocks, effectively reaching the targeted population.
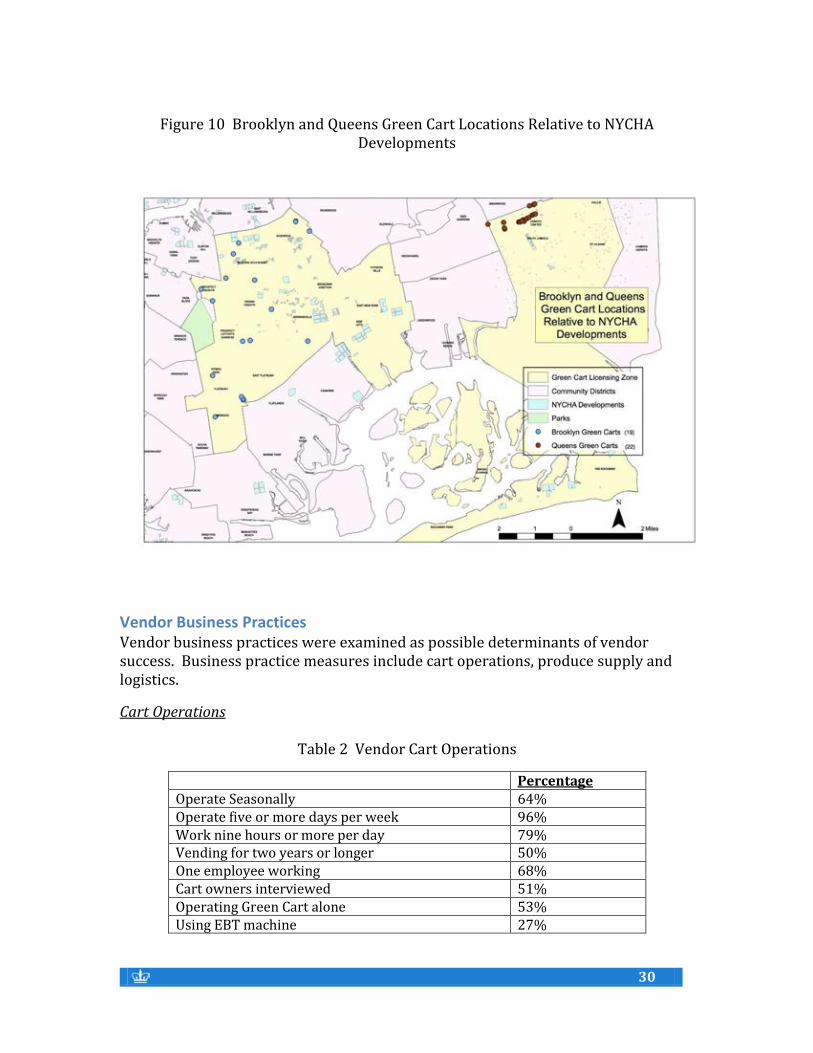
In Brooklyn, the average distance between a Green Cart and public housing is 14 blocks. Note: This does not include communities such as Brownsville and East New York – significantly high need areas – where there are no proximate Green Carts.
In the Bronx, the average distance of a Green Cart to public housing is
approximately five city blocks. However some of the largest public housing in the Bronx has no Green Carts nearby.
The cluster of Queens Green Carts is four blocks from public housing, but there are no Green Carts near other public projects in the borough.
Figure 9 Bronx and Manhattan Green Cart Locations Relative to NYCHA Developments
30
30
Figure 10 Brooklyn and Queens Green Cart Locations Relative to NYCHA
Developments
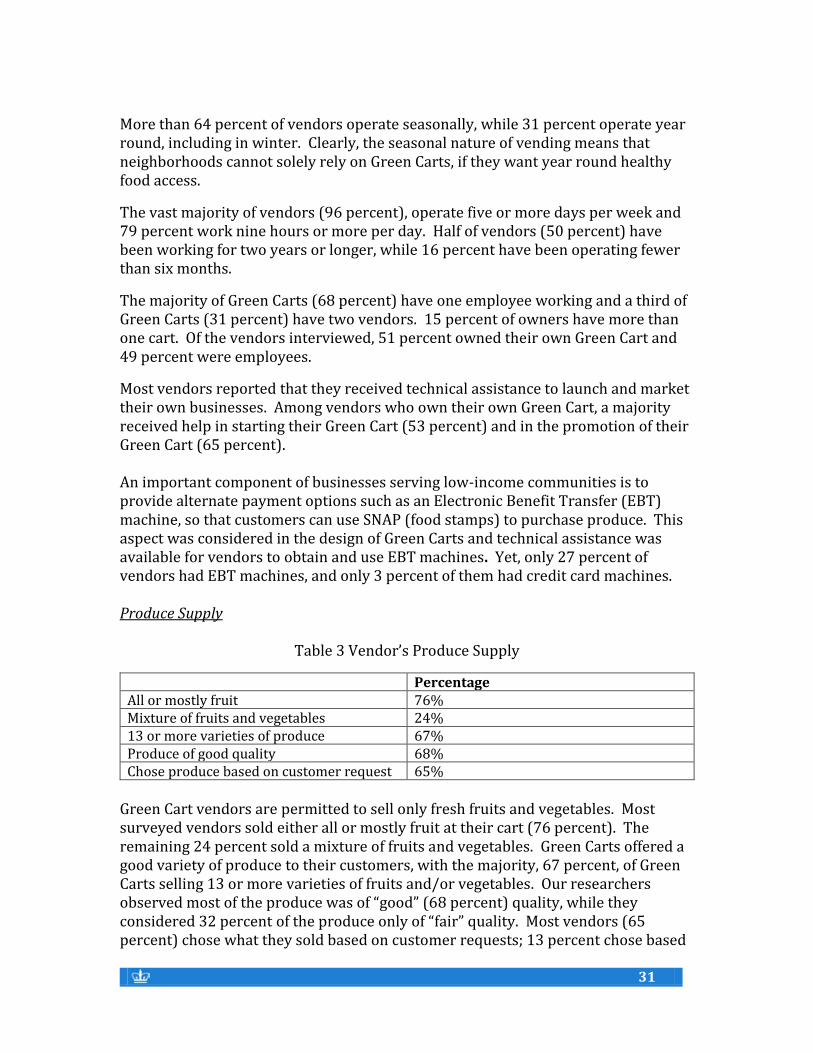
Vendor Business Practices Vendor business practices were examined as possible determinants of vendor success. Business practice measures include cart operations, produce supply and logistics.
Cart Operations
Table 2 Vendor Cart Operations
Percentage Operate Seasonally 64% Operate five or more days per week 96% Work nine hours or more per day 79% Vending for two years or longer 50% One employee working 68% Cart owners interviewed 51% Operating Green Cart alone 53% Using EBT machine 27%
31
31
More than 64 percent of vendors operate seasonally, while 31 percent operate year round, including in winter. Clearly, the seasonal nature of vending means that neighborhoods cannot solely rely on Green Carts, if they want year round healthy food access.
The vast majority of vendors (96 percent), operate five or more days per week and 79 percent work nine hours or more per day. Half of vendors (50 percent) have been working for two years or longer, while 16 percent have been operating fewer than six months.
The majority of Green Carts (68 percent) have one employee working and a third of Green Carts (31 percent) have two vendors. 15 percent of owners have more than one cart. Of the vendors interviewed, 51 percent owned their own Green Cart and 49 percent were employees.
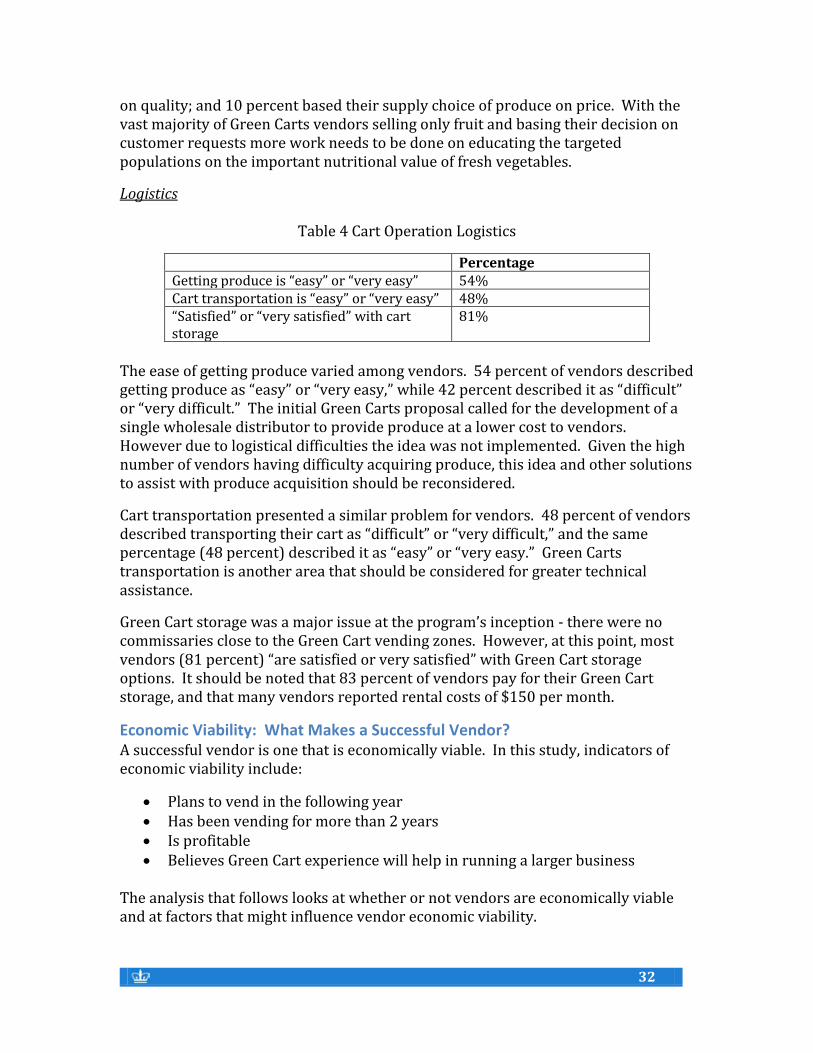
Most vendors reported that they received technical assistance to launch and market their own businesses. Among vendors who own their own Green Cart, a majority received help in starting their Green Cart (53 percent) and in the promotion of their Green Cart (65 percent). An important component of businesses serving low-income communities is to provide alternate payment options such as an Electronic Benefit Transfer (EBT) machine, so that customers can use SNAP (food stamps) to purchase produce. This aspect was considered in the design of Green Carts and technical assistance was available for vendors to obtain and use EBT machines. Yet, only 27 percent of vendors had EBT machines, and only 3 percent of them had credit card machines. Produce Supply
Table 3 Vendor’s Produce Supply
Percentage All or mostly fruit 76% Mixture of fruits and vegetables 24% 13 or more varieties of produce 67% Produce of good quality 68% Chose produce based on customer request 65%
Green Cart vendors are permitted to sell only fresh fruits and vegetables. Most surveyed vendors sold either all or mostly fruit at their cart (76 percent). The remaining 24 percent sold a mixture of fruits and vegetables. Green Carts offered a good variety of produce to their customers, with the majority, 67 percent, of Green Carts selling 13 or more varieties of fruits and/or vegetables. Our researchers observed most of the produce was of “good” (68 percent) quality, while they considered 32 percent of the produce only of “fair” quality. Most vendors (65 percent) chose what they sold based on customer requests; 13 percent chose based
32
32
on quality; and 10 percent based their supply choice of produce on price. With the vast majority of Green Carts vendors selling only fruit and basing their decision on customer requests more work needs to be done on educating the targeted populations on the important nutritional value of fresh vegetables.
Logistics
Table 4 Cart Operation Logistics
Percentage Getting produce is “easy” or “very easy” 54% Cart transportation is “easy” or “very easy” 48% “Satisfied” or “very satisfied” with cart storage
81%
The ease of getting produce varied among vendors. 54 percent of vendors described getting produce as “easy” or “very easy,” while 42 percent described it as “difficult” or “very difficult.” The initial Green Carts proposal called for the development of a single wholesale distributor to provide produce at a lower cost to vendors. However due to logistical difficulties the idea was not implemented. Given the high number of vendors having difficulty acquiring produce, this idea and other solutions to assist with produce acquisition should be reconsidered.
Cart transportation presented a similar problem for vendors. 48 percent of vendors described transporting their cart as “difficult” or “very difficult,” and the same percentage (48 percent) described it as “easy” or “very easy.” Green Carts transportation is another area that should be considered for greater technical assistance.
Green Cart storage was a major issue at the program’s inception - there were no commissaries close to the Green Cart vending zones. However, at this point, most vendors (81 percent) “are satisfied or very satisfied” with Green Cart storage options. It should be noted that 83 percent of vendors pay for their Green Cart storage, and that many vendors reported rental costs of $150 per month.
Economic Viability: What Makes a Successful Vendor? A successful vendor is one that is economically viable. In this study, indicators of economic viability include:
Plans to vend in the following year Has been vending for more than 2 years Is profitable Believes Green Cart experience will help in running a larger business
The analysis that follows looks at whether or not vendors are economically viable and at factors that might influence vendor economic viability.
33
33
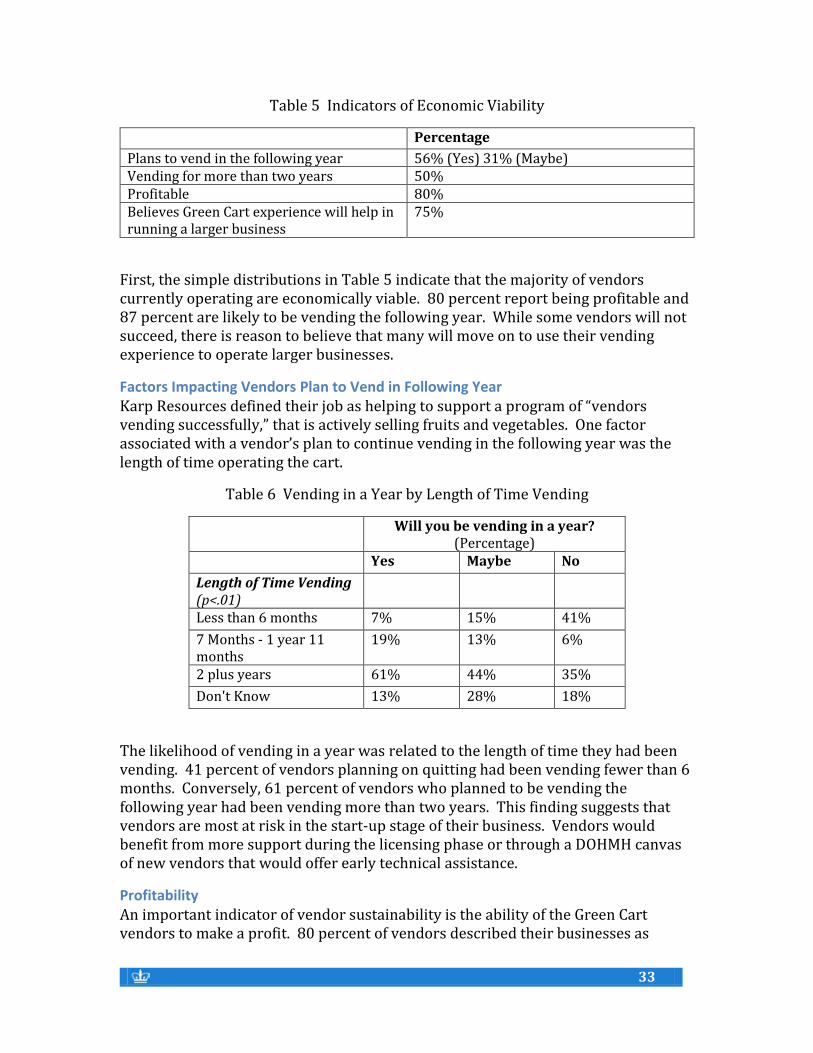
Table 5 Indicators of Economic Viability
Percentage
Plans to vend in the following year 56% (Yes) 31% (Maybe) Vending for more than two years 50% Profitable 80% Believes Green Cart experience will help in running a larger business
75%
First, the simple distributions in Table 5 indicate that the majority of vendors currently operating are economically viable. 80 percent report being profitable and 87 percent are likely to be vending the following year. While some vendors will not succeed, there is reason to believe that many will move on to use their vending experience to operate larger businesses.
Factors Impacting Vendors Plan to Vend in Following Year Karp Resources defined their job as helping to support a program of “vendors vending successfully,” that is actively selling fruits and vegetables. One factor associated with a vendor’s plan to continue vending in the following year was the length of time operating the cart.
Table 6 Vending in a Year by Length of Time Vending
Will you be vending in a year? (Percentage)
Yes Maybe No
Length of Time Vending (p<.01)
Less than 6 months 7% 15% 41%
7 Months - 1 year 11 months
19% 13% 6%
2 plus years 61% 44% 35%
Don't Know 13% 28% 18%
The likelihood of vending in a year was related to the length of time they had been vending. 41 percent of vendors planning on quitting had been vending fewer than 6 months. Conversely, 61 percent of vendors who planned to be vending the following year had been vending more than two years. This finding suggests that vendors are most at risk in the start-up stage of their business. Vendors would benefit from more support during the licensing phase or through a DOHMH canvas of new vendors that would offer early technical assistance.
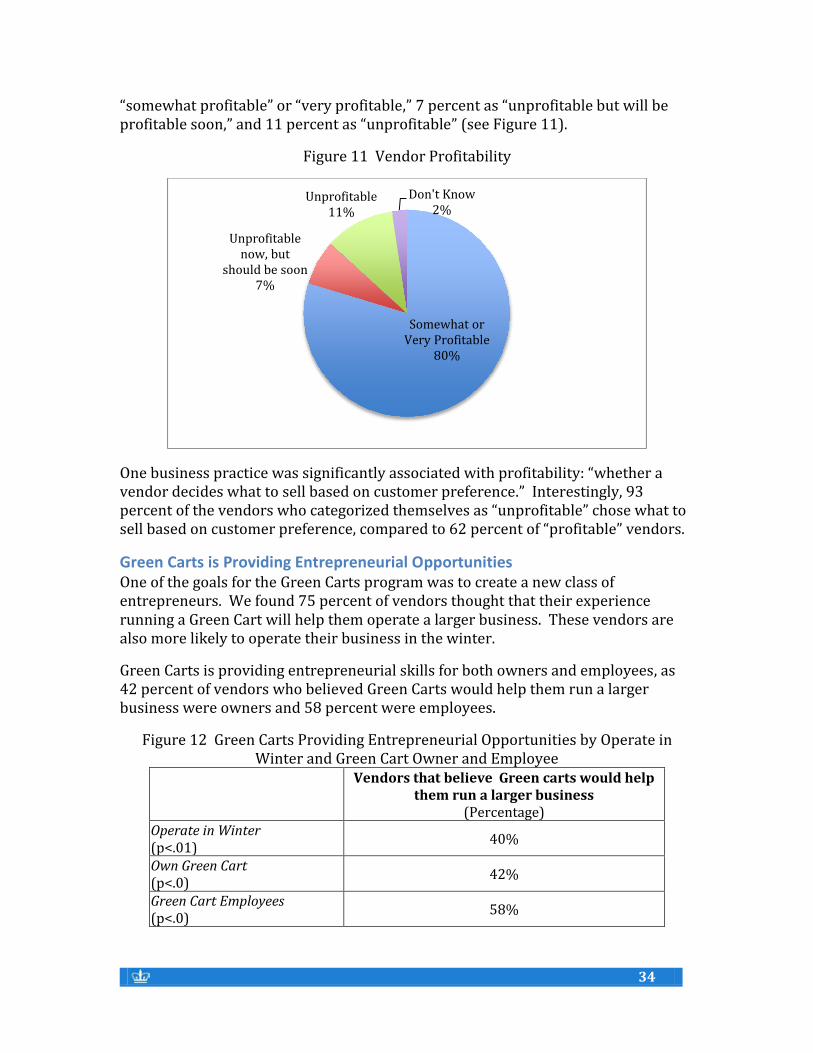
Profitability An important indicator of vendor sustainability is the ability of the Green Cart vendors to make a profit. 80 percent of vendors described their businesses as
34
34
“somewhat profitable” or “very profitable,” 7 percent as “unprofitable but will be profitable soon,” and 11 percent as “unprofitable” (see Figure 11).
Figure 11 Vendor Profitability
One business practice was significantly associated with profitability: “whether a vendor decides what to sell based on customer preference.” Interestingly, 93 percent of the vendors who categorized themselves as “unprofitable” chose what to sell based on customer preference, compared to 62 percent of “profitable” vendors.
Green Carts is Providing Entrepreneurial Opportunities One of the goals for the Green Carts program was to create a new class of entrepreneurs. We found 75 percent of vendors thought that their experience running a Green Cart will help them operate a larger business. These vendors are also more likely to operate their business in the winter.
Green Carts is providing entrepreneurial skills for both owners and employees, as 42 percent of vendors who believed Green Carts would help them run a larger business were owners and 58 percent were employees.
Figure 12 Green Carts Providing Entrepreneurial Opportunities by Operate in Winter and Green Cart Owner and Employee
Vendors that believe Green carts would help them run a larger business
(Percentage) Operate in Winter (p<.01)
40%
Own Green Cart (p<.0)
42%
Green Cart Employees (p<.0) 58%
Somewhat or Very Profitable
80%
Unprofitable now, but
should be soon7%
Unprofitable11%
Don't Know2%
35
35
Vendors are able to launch and market their businesses: Most vendors took advantage of the technical assistance provided to help launch and market their business. 53 percent of vendors who own their own cart said they received support in starting their business. 65 percent of vendors who own their cart said they received support in promoting and marketing their cart
Who are the Customers? The customer sample survey was designed to develop a profile of vendor customers in both “core” and “periphery” areas of the targeted neighborhoods, in order to determine whether vendors were reaching Green Carts’ targeted population. This survey of customers is critical to the evaluation of the effectiveness of Green Carts.
Green Cart customers were mostly female and almost all members of minority groups. 42 percent of customers were Black and 35 percent were Hispanic. (see Figure 13).
Figure 13 Customer Race / Ethnicity
Fifty-two percent of customers were born in the United States, and the second most common place of origin was the Dominican Republic (17 percent). 40 percent of customers are between the ages of 45-64.
Fifteen percent of customers did not complete high school, 26 percent have a high school diploma, 22 percent have some college or trade education, 24 percent have a college degree and 14 percent went to graduate school.
Twenty-five percent of our customers had an income lower than $15,000 per year and 18 percent were receiving public assistance. We also found half of the
White 13%
Black 42%
Hispanic 35%
Asian 6%
Mixed 3%
36
36
customers worried about being able to afford produce and 11 percent were always worried.
More than half of all customers lived in the Green Cart neighborhood where they shopped. 69 percent of customers lived or worked in the neighborhood. The majority of customers, 64 percent, walked fewer than five blocks (approximately a quarter of a mile) to get to the Green Cart.
The most popular reasons for shopping at the Green Cart included: location, prices, and quality. Customers most commonly bought their produce from the supermarket or the farmer’s market, with less than 1 percent citing the Green Cart as their number one or two produce source. 63 percent of customers are regular customers (shop at the Green Cart once a week or more). 31 percent shop at the Green Cart two to three times per week. Almost half of Green Cart customers take their produce home to eat it and only 15 percent use Green Cart produce only for snacking.
Thirty-four percent of customers believe that Green Carts could be improved citing price, variety, bad weather, availability and quality as areas where Green Carts fell short.
Did Green Carts Reach the Target population? Green Carts are serving low-income customers as well as customers living in the core food desert neighborhoods. Most customers earn less than $50,000, and many lived in the same neighborhood as the Green Carts, more so in the core residential areas. 44 percent of customers live at or below 100 percent of the poverty line,51 however only 18 percent reported receiving public assistance. 68 percent live at or below 200 percent of the poverty.52 50 percent of customers are “always” or “sometimes” worried about having enough money to buy fresh fruits and vegetables
While most of the customers were low-income and residents of food deserts, the mapping analysis shows that vendors were not evenly dispersed, especially in core neighborhoods. Given that close to 1,000 Green Cart permits were issued, but only 166 were found in this study’s census, it appears that the existing business model may not be profitable or sustainable in less densely populated low-income residential neighborhoods.
Comparing customers in the core versus periphery areas also helps answer the question of whether or not the program was reaching the intended target population. Core and periphery customers differed in four statistically significant ways (see Table 7). Core customers were more likely to live in the neighborhood (70 percent as compared to 47 percent). Core customers were more likely to worry about having money to buy produce (58 percent as compared to 42 percent). Lastly,
Half of Green Cart customers are “always” or “sometimes” worried about having enough money to buy fresh fruits and vegetables.
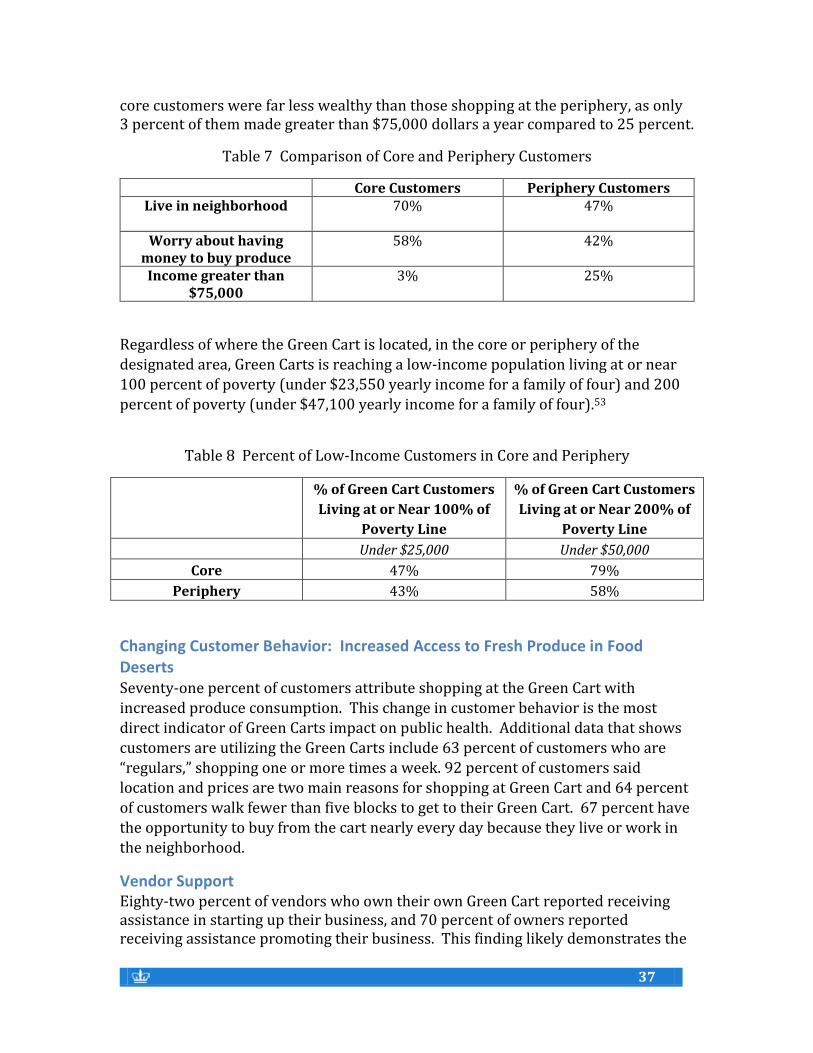
37
37
core customers were far less wealthy than those shopping at the periphery, as only 3 percent of them made greater than $75,000 dollars a year compared to 25 percent.
Table 7 Comparison of Core and Periphery Customers
Core Customers Periphery Customers Live in neighborhood
70% 47%
Worry about having money to buy produce
58% 42%
Income greater than $75,000
3% 25%
Regardless of where the Green Cart is located, in the core or periphery of the designated area, Green Carts is reaching a low-income population living at or near 100 percent of poverty (under $23,550 yearly income for a family of four) and 200 percent of poverty (under $47,100 yearly income for a family of four).53
Table 8 Percent of Low-Income Customers in Core and Periphery
% of Green Cart Customers
Living at or Near 100% of
Poverty Line
% of Green Cart Customers
Living at or Near 200% of
Poverty Line
Under $25,000 Under $50,000
Core 47% 79%
Periphery 43% 58%
Changing Customer Behavior: Increased Access to Fresh Produce in Food Deserts Seventy-one percent of customers attribute shopping at the Green Cart with increased produce consumption. This change in customer behavior is the most direct indicator of Green Carts impact on public health. Additional data that shows customers are utilizing the Green Carts include 63 percent of customers who are “regulars,” shopping one or more times a week. 92 percent of customers said location and prices are two main reasons for shopping at Green Cart and 64 percent
of customers walk fewer than five blocks to get to their Green Cart. 67 percent have the opportunity to buy from the cart nearly every day because they live or work in the neighborhood.
Vendor Support Eighty-two percent of vendors who own their own Green Cart reported receiving assistance in starting up their business, and 70 percent of owners reported receiving assistance promoting their business. This finding likely demonstrates the
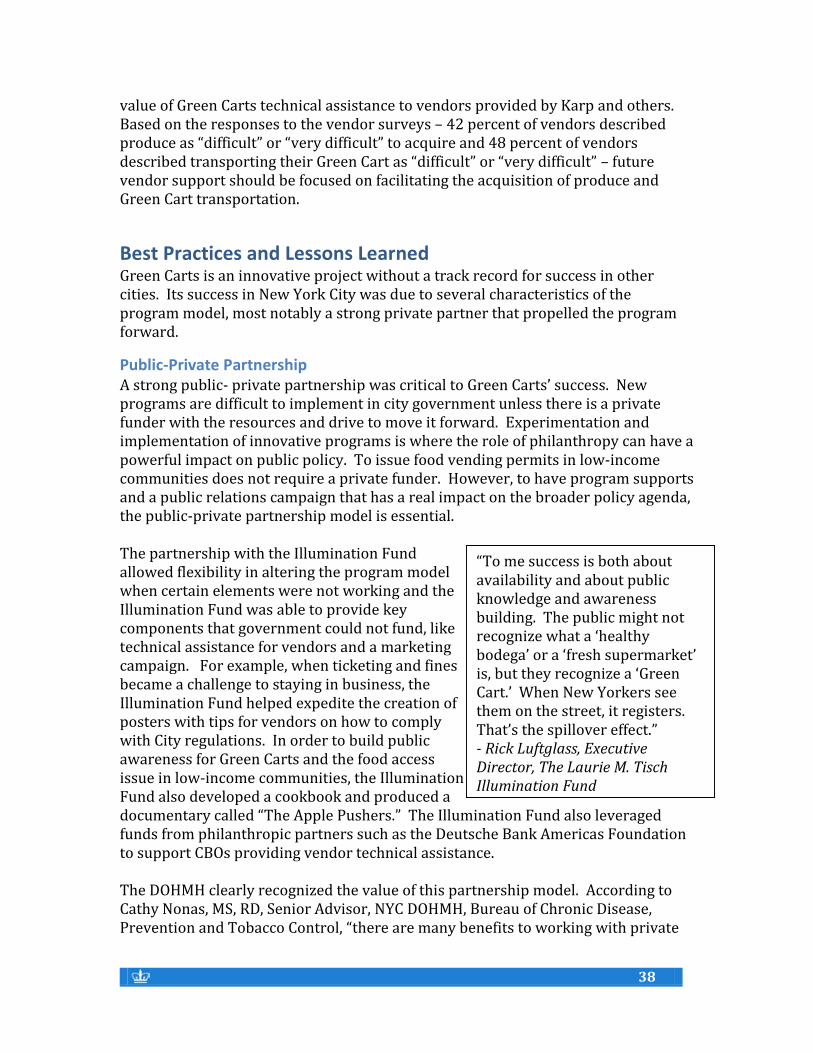
38
38
value of Green Carts technical assistance to vendors provided by Karp and others. Based on the responses to the vendor surveys – 42 percent of vendors described produce as “difficult” or “very difficult” to acquire and 48 percent of vendors described transporting their Green Cart as “difficult” or “very difficult” – future vendor support should be focused on facilitating the acquisition of produce and Green Cart transportation.
Best Practices and Lessons Learned Green Carts is an innovative project without a track record for success in other cities. Its success in New York City was due to several characteristics of the program model, most notably a strong private partner that propelled the program forward.
Public-Private Partnership A strong public- private partnership was critical to Green Carts’ success. New programs are difficult to implement in city government unless there is a private funder with the resources and drive to move it forward. Experimentation and implementation of innovative programs is where the role of philanthropy can have a powerful impact on public policy. To issue food vending permits in low-income communities does not require a private funder. However, to have program supports and a public relations campaign that has a real impact on the broader policy agenda, the public-private partnership model is essential. The partnership with the Illumination Fund allowed flexibility in altering the program model when certain elements were not working and the Illumination Fund was able to provide key components that government could not fund, like technical assistance for vendors and a marketing campaign. For example, when ticketing and fines became a challenge to staying in business, the Illumination Fund helped expedite the creation of posters with tips for vendors on how to comply with City regulations. In order to build public awareness for Green Carts and the food access issue in low-income communities, the Illumination Fund also developed a cookbook and produced a documentary called “The Apple Pushers.” The Illumination Fund also leveraged funds from philanthropic partners such as the Deutsche Bank Americas Foundation to support CBOs providing vendor technical assistance. The DOHMH clearly recognized the value of this partnership model. According to Cathy Nonas, MS, RD, Senior Advisor, NYC DOHMH, Bureau of Chronic Disease, Prevention and Tobacco Control, “there are many benefits to working with private
“To me success is both about availability and about public knowledge and awareness building. The public might not recognize what a ‘healthy bodega’ or a ‘fresh supermarket’ is, but they recognize a ‘Green Cart.’ When New Yorkers see them on the street, it registers. That’s the spillover effect.” - Rick Luftglass, Executive Director, The Laurie M. Tisch Illumination Fund
39
39
sector partners such as the Illumination Fund. First and foremost, when funders such as Laurie Tisch have the courage and the vision to take a chance on a new kind of initiative like Green Carts, it gives us the freedom to experiment. Because of this openness, we were able to learn what worked and didn't work and revamp accordingly. In this way, the model had the best chance for success.”
Support from City Hall for Innovation Innovative policy generally involves inter-agency coordination and negotiating consensus among conflicting political interests. Green Carts received strong early support from the Mayor’s Food Policy Coordinator who worked with City agencies and the City Council to pass the initial legislation that created the new class of vendor licenses.
A City Agency with Sustained Interest and Capacity to Implement an Innovative Program The DOHMH must continue providing centralized support for the Green Cart initiative and develop capacity to monitor and evaluate the program.
Technical Assistance for Vendors Green Carts must be economically sustainable for the vendors in order for the program to succeed. As such, the program model included technical support for vendors in operating their Green Cart, as well as marketing and promotion of the Green Cart brand. The use of a neutral partner, such as an outside consultant or community-based organization, is critical to this aspect of the program. The lead agency for this program was also the regulatory agency, thus the vendors may have viewed the City in an adversarial role. Providing technical support for vendors was crucial, but also critical was for an independent entity to provide this support. The model was flexible enough to eliminate certain vendor supports that were not utilized and to add new supports when necessary. This analysis showed several areas where additional vendor support is needed such as acquisition of produce and cart transportation. Ongoing technical assistance can be improved by tracking vendors who receive assistance and regularly surveying them to determine need.
Promoting the Program Including a Green Cart Branding Campaign The Illumination Fund’s campaign to brand the Green Carts was an important aspect of the program. It was essential for customers to know that this new Green Cart selling fruits and vegetables was a legitimate means to buy produce. Creating a brand that customers recognize through a unique Green Cart logo appearing on Green Cart umbrellas and marketing materials contributed to a sense of familiarity and reliability. Providing visibility for the program also contributed to the broader awareness of the importance of eating healthy foods.
40
40
Recommendations Green Carts has achieved positive short and medium term outcomes, and there is potential for long term success by addressing some operational challenges. The following recommendations address both operational improvements to the program and policy recommendations that can build upon the program’s successes.
Collect Periodic and Uniform Data on Vendors and Customers Periodic collection of data is important in order to monitor progress of vendor economic viability, technical assistance impact, and customer behavioral change or to evaluate the impact of future Green Carts program modifications. The data collected in this study establishes the first valid Green Carts baseline data for vendor location and economic viability as well as customer demographic profile and purchasing behavior. The City should use this data to regularly measure the progress of the program.
The original program model assumed that the way to provide access to fresh produce for low-income populations was by targeting neighborhoods in which they live. This analysis found that Green Carts are clustered in areas of high pedestrian traffic where low-income customers live, work or shop. Vendors are already locating where they expect the most customers. Future evaluations must also consider where low-income customers shop and work, not just where they live.
Create Unique Identification Number for Vendors
Green Carts are assigned several identification numbers based on their permit, mobile food license and health department inspections. However, these numbers
are not correlated, making it difficult to track data for a particular Green Cart. Each Green Cart should have one unique identifier that is linked to other City data collected on that particular cart. This identification system would greatly facilitate data collection and evaluation and ensure that the carts are optimally distributed in each borough.
Create Target Number of Green Carts Based on Market Analysis The Green Cart legislation allowed for the distribution of 1,000 permits in targeted geographic locations, with specific permits allocated per borough. It is unclear how this number was calculated. It is clear that the number of operational carts documented is significantly less, with 142 vendors operating 166 carts. A market analysis should be conducted to target an appropriate number of Green Carts. With five years of experience, data is available to develop new targets reflecting the density of produce outlets, neighborhood population, and size of the area to be served. The analysis should take into account the low-income population of the core and periphery areas, keeping in mind that vendors will cluster in areas with more economic activity.
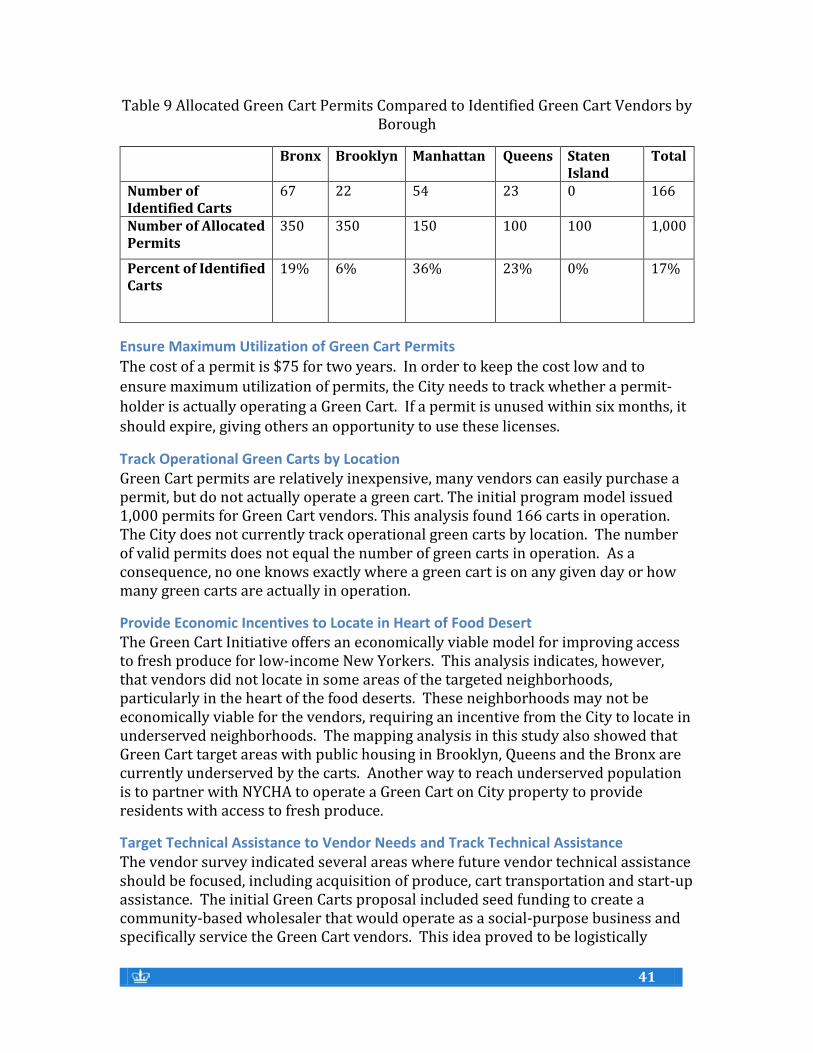
41
41
Table 9 Allocated Green Cart Permits Compared to Identified Green Cart Vendors by Borough
Bronx Brooklyn Manhattan Queens Staten Island
Total
Number of Identified Carts
67 22 54 23 0 166
Number of Allocated Permits
350 350 150 100 100 1,000
Percent of Identified Carts
19% 6% 36% 23% 0% 17%
Ensure Maximum Utilization of Green Cart Permits
The cost of a permit is $75 for two years. In order to keep the cost low and to ensure maximum utilization of permits, the City needs to track whether a permit-holder is actually operating a Green Cart. If a permit is unused within six months, it should expire, giving others an opportunity to use these licenses.
Track Operational Green Carts by Location Green Cart permits are relatively inexpensive, many vendors can easily purchase a permit, but do not actually operate a green cart. The initial program model issued 1,000 permits for Green Cart vendors. This analysis found 166 carts in operation. The City does not currently track operational green carts by location. The number of valid permits does not equal the number of green carts in operation. As a consequence, no one knows exactly where a green cart is on any given day or how many green carts are actually in operation.
Provide Economic Incentives to Locate in Heart of Food Desert The Green Cart Initiative offers an economically viable model for improving access to fresh produce for low-income New Yorkers. This analysis indicates, however, that vendors did not locate in some areas of the targeted neighborhoods, particularly in the heart of the food deserts. These neighborhoods may not be economically viable for the vendors, requiring an incentive from the City to locate in underserved neighborhoods. The mapping analysis in this study also showed that Green Cart target areas with public housing in Brooklyn, Queens and the Bronx are currently underserved by the carts. Another way to reach underserved population is to partner with NYCHA to operate a Green Cart on City property to provide residents with access to fresh produce.
Target Technical Assistance to Vendor Needs and Track Technical Assistance The vendor survey indicated several areas where future vendor technical assistance should be focused, including acquisition of produce, cart transportation and start-up assistance. The initial Green Carts proposal included seed funding to create a community-based wholesaler that would operate as a social-purpose business and specifically service the Green Cart vendors. This idea proved to be logistically
42
42
challenging and the funding was instead used for vendor technical assistance. The data collected indicate 42 percent of vendors are still having trouble acquiring produce. The City should explore alternate models to facilitate acquisition and distribution of produce.
The vendor survey also indicated that cart transportation was still an issue, with 48 percent describing it as difficult or very difficult. The City should explore various solutions, such as centralized storage in each borough. The longer the vendor has been operating, the more likely they are to be successful. Conversely, half of vendors planning on quitting had been vending less than 6 months. In the early months of vending, start-up technical assistance would help vendors overcome the initial operational challenges.
Karp Resources provided an array of training opportunities to vendors, yet it is unknown if this training directly impacted the vendor’s success, though large numbers of vendors did take advantage of this training. Vendors who receive technical assistance should be tracked and their progress should be measured periodically to determine the impact of the technical assistance.
Enhance Product Offerings to Include Other Healthy Food Items Green Cart vendors have been restricted to selling only whole fruits and vegetables. This study found that Green Carts is having an impact on increased consumption of fresh produce in low-income neighborhoods; therefore, this model should be expanded to offer additional healthy food items such as nuts and whole grains. These products also have a longer shelf-life than fresh fruits and vegetables.
Conclusion This study concluded that the Green Carts program is successful based on the positive answer to the four research questions:
1. Is Green Carts increasing access to fresh produce in food deserts by locating in targeted geographic areas?
2. Are Green Cart vendors economically viable in the long-term? 3. Is Green Carts reaching the targeted low-income population? 4. Is Green Carts changing customer behavior?
Green Carts has increased access to produce in the targeted geographic areas. The spatial analysis shows that the Green Carts in the Bronx, Manhattan and Brooklyn are locating in areas with low produce density. Queens is the only borough where Green Carts are located near other produce outlets. The program is also increasing consumption of fresh produce in low-income neighborhoods, as evidenced by the responses in the customer survey. Seventy-one percent of customers reported increased consumption of fresh fruits and vegetables since shopping at the Green Cart. Most of these customers were earning under $50,000, or near 200 percent of the poverty line. Finally, Green Carts is providing an economically viable business

43
43
model for immigrant entrepreneurs, with the vast majority of vendors earning a profit from their Green Cart business.
The success of the Green Cart program is clear and this report provides a road map for other cities interested in replicating this model. The next phase of the program should include regular data collection and evaluation, technical assistance targeted towards the identified needs of the vendors and economic incentives for vendors to locate in the heart of the core of the food deserts.

44
44
Appendix A: Research Design and Methodology 11 student researchers from Columbia College, SIPA, the Mailman School of Public Health, and Teachers College spent three months locating and interviewing Green Carts vendors (July-September 2013). Interviews were conducted in English, Spanish and Bengali. A sample of customers was interviewed in November 2013. The customer sample survey was designed to capture any difference among Green Cart customers based on location in the core or periphery of the designated areas. Elite interviews were also conducted with key stakeholders (see Appendix G for list of stakeholders interviewed).
Research Design The evaluation research was informed by four key questions:
1. Is Green Carts increasing access to fresh produce in food deserts by locating in targeted geographic areas?
2. Is Green Carts reaching the targeted low-income population? 3. Is Green Carts changing customer behavior? 4. Are Green Cart vendors economically viable in the long-term?
Two survey instruments (see Appendix C and D) were designed and fielded. One survey focused on interviewing all active Green Cart vendors. The other survey conducted interviews of a stratified sample of Green Cart customers at four Manhattan cart locations.
Before interviews could be conducted, the Green Carts had to be found. Green Cart vendors are allowed to move anywhere within their designated region and their specific location is not specified on their vending license. Approximations of some Green Carts locations from 2010 to 2012 were maintained and updated by Karp, but without vendor license numbers we could not determine whether the same vendor was at the identified locations. Since there is also academic research showing that Green Carts move yearly, we could not combine data from different years to create a map of current locations.54 In order to have accurate and reliable data we chose to locate the active Green Carts and create a current map of their locations.
Data Collection and Methodology Vendor Census and Survey According to the DOHMH, 978 permits have been issued to vendors since 2008.
There were 492 “active vendors,” in June 2013. An “active vendor” indicates that the vendor’s Green Cart has an up to date permit and health inspection decal. Both are necessary to legally vend, but it does not mean that a cart is actually in use by the vendor.55
In 2011, Sean Lucan and William Jordan of Einstein School of Medicine conducted a census of Green Carts in the Bronx. They found that when searching for Green Carts in the Bronx, travelling the bus routes yielded almost the same number of carts as
45
45
driving block by block.56 Following this model, pairs of student researchers rode every bus line within the Green Cart licensing zones of Manhattan, Queens, Brooklyn and the Bronx to conduct an accurate census of operating Green Carts. This field research was done during the months of July, August and September 2013 and during fair weather – the most likely time for locating the largest percentage of Green Carts.
The SIPA researchers identified 142 vendors operating in four boroughs, during peak vending season (July-October 2013). These vendors operate 166 carts, as some vendors operate two and three carts simultaneously. This census of vendors represents the minimum number of active vendors operating. We think it is very likely a significant percentage of all active vendors, as we used Jordon’s methodology for locating vendors and conducted interviews during peak vending
season and good weather conditions (maximizing the chance that a vendor would be out doing business).57 Once a Green Cart was located, one researcher conducted the 20-minute vendor interview, while the second recorded information about the Green Cart itself. Due to the high number of Spanish and Bengali speaking vendors, the vendor survey instrument was translated into both Spanish and Bengali. All research pairs included at least one Spanish speaker. If a Bengali speaker was not present at the initial time of the interview, one was sent back at a later time to conduct the interview.
In order to determine if the Green Cart vendors were economically viable, the vendor survey was designed to identify predictors of vendor success. Success was defined as a vendor who felt that their Green Cart was profitable and planned to be vending in a year. Data was also collected to ascertain if the vendors saw running a Green Cart as a step towards owning a larger business. If predictors of success could be determined, then vendor trainings or support programs could be tailored accordingly, thus increasing the sustainability of the program. Furthermore, this information could be used to identify specific subsets of successful vendors that could be used in vendor recruitment. Observed information was also collected at the time of the vendor interviews to determine how specific Green Cart locational characteristics may have contributed to vendor success.
Of the 142 vendors identified, 131 were interviewed, yielding a 92 percent response rate. This extremely high response rate also contributes to the accuracy of our data.
All bi-variate relationships using vendor data are statistically significant at the p=.05 level or better.
Customer Sample Survey We also conducted a 24 question survey of Green Cart customers in two locations in Manhattan to determine if the initiative was reaching the intended population. The customer survey was designed to collect information on customer demographics,
46
46
their income and where they lived, their reasons for being in the neighborhood, their produce purchasing habits , and whether shopping at Green Carts was increasing their consumption of fruits and vegetables.
For the sample design, Green Carts were categorized by location and then divided into “periphery carts” and “core carts.” Using 2011 Census data we determined the median income of each census tract within the Green Cart zones. A “periphery cart” was defined as a Green Cart that was located in a census tract with a median income of greater than $47,100 per year. This number was chosen because it is 200% of the poverty line for a family of four, and is the cut off for eligibility for federal assistance programs. A “core cart” was located in a census tract with a median income of less than $47,100 per year (thereby reaching the intended low-income population).
After stratifying carts by “core” and “periphery,” two carts from each group were randomly sampled using ArcGIS, a system for geographic analysis. All customer interviews took place at these four carts. Interviews took place between 10:00am - 6:00pm, peak vending hours. Surveyors interviewed every third customer after they left the vendor, to ensure a random sample. 151 customers were approached and 103 customers responded, yielding a response rate of 68 percent.58 The margin of sampling error is ±10. All bi-variate relationships using customer data are statistically significant at the p=.05 level or better.
Spatial Analysis Researchers plotted the location data collected from the vendor census using ArcGIS. Spatial analysis was conducted to determine if the carts were clustered and where the carts were located relative to other produce outlets and low-income housing.
To determine if the Green Carts were clustered we used the same methodology as Lucan’s study, “Average Nearest Neighbor” analysis in ArcGIS. This analysis creates a ratio between the average distance between all of the chosen spatial features, and the average distance that would be expected if the chosen spatial features were randomly distributed. If this ratio is less than 1 with a p value that is significant at the .05 level or better, then the features are considered to be clustered. If the ratio is greater than 1, then they are considered dispersed.
To determine the extent to which Green Carts penetrated the food deserts, the researchers mapped all of the potential places to buy produce in New York City including: large grocery stores (with gross sales exceeding $2 million annually), produce stores, and health food stores.59 All data was downloaded from Reference USA, a business and consumer research database that includes residential information.60 Using the “Kernel Density” tool in ArcGIS, the density of produce outlets in New York City was calculated. Then, Green Cart locations were plotted to determine where they were in relationship to the other produce outlets. Using the “Select by Location” function of ArcGIS we calculated the average number of produce stores relative to each Green Cart within a five-block radius.
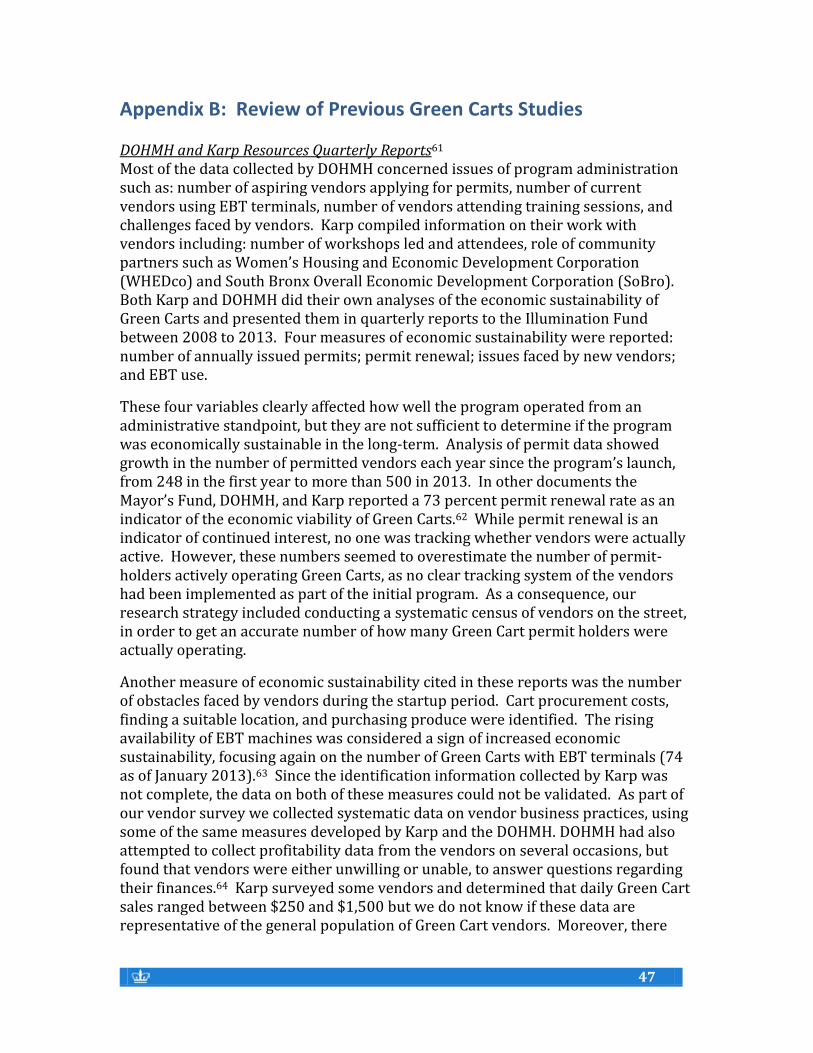
47
47
Appendix B: Review of Previous Green Carts Studies DOHMH and Karp Resources Quarterly Reports61 Most of the data collected by DOHMH concerned issues of program administration such as: number of aspiring vendors applying for permits, number of current vendors using EBT terminals, number of vendors attending training sessions, and challenges faced by vendors. Karp compiled information on their work with vendors including: number of workshops led and attendees, role of community partners such as Women’s Housing and Economic Development Corporation (WHEDco) and South Bronx Overall Economic Development Corporation (SoBro). Both Karp and DOHMH did their own analyses of the economic sustainability of Green Carts and presented them in quarterly reports to the Illumination Fund between 2008 to 2013. Four measures of economic sustainability were reported: number of annually issued permits; permit renewal; issues faced by new vendors; and EBT use.
These four variables clearly affected how well the program operated from an administrative standpoint, but they are not sufficient to determine if the program was economically sustainable in the long-term. Analysis of permit data showed growth in the number of permitted vendors each year since the program’s launch, from 248 in the first year to more than 500 in 2013. In other documents the Mayor’s Fund, DOHMH, and Karp reported a 73 percent permit renewal rate as an indicator of the economic viability of Green Carts.62 While permit renewal is an indicator of continued interest, no one was tracking whether vendors were actually active. However, these numbers seemed to overestimate the number of permit-holders actively operating Green Carts, as no clear tracking system of the vendors had been implemented as part of the initial program. As a consequence, our research strategy included conducting a systematic census of vendors on the street, in order to get an accurate number of how many Green Cart permit holders were actually operating.
Another measure of economic sustainability cited in these reports was the number of obstacles faced by vendors during the startup period. Cart procurement costs, finding a suitable location, and purchasing produce were identified. The rising availability of EBT machines was considered a sign of increased economic sustainability, focusing again on the number of Green Carts with EBT terminals (74 as of January 2013).63 Since the identification information collected by Karp was not complete, the data on both of these measures could not be validated. As part of our vendor survey we collected systematic data on vendor business practices, using some of the same measures developed by Karp and the DOHMH. DOHMH had also attempted to collect profitability data from the vendors on several occasions, but found that vendors were either unwilling or unable, to answer questions regarding their finances.64 Karp surveyed some vendors and determined that daily Green Cart sales ranged between $250 and $1,500 but we do not know if these data are representative of the general population of Green Cart vendors. Moreover, there
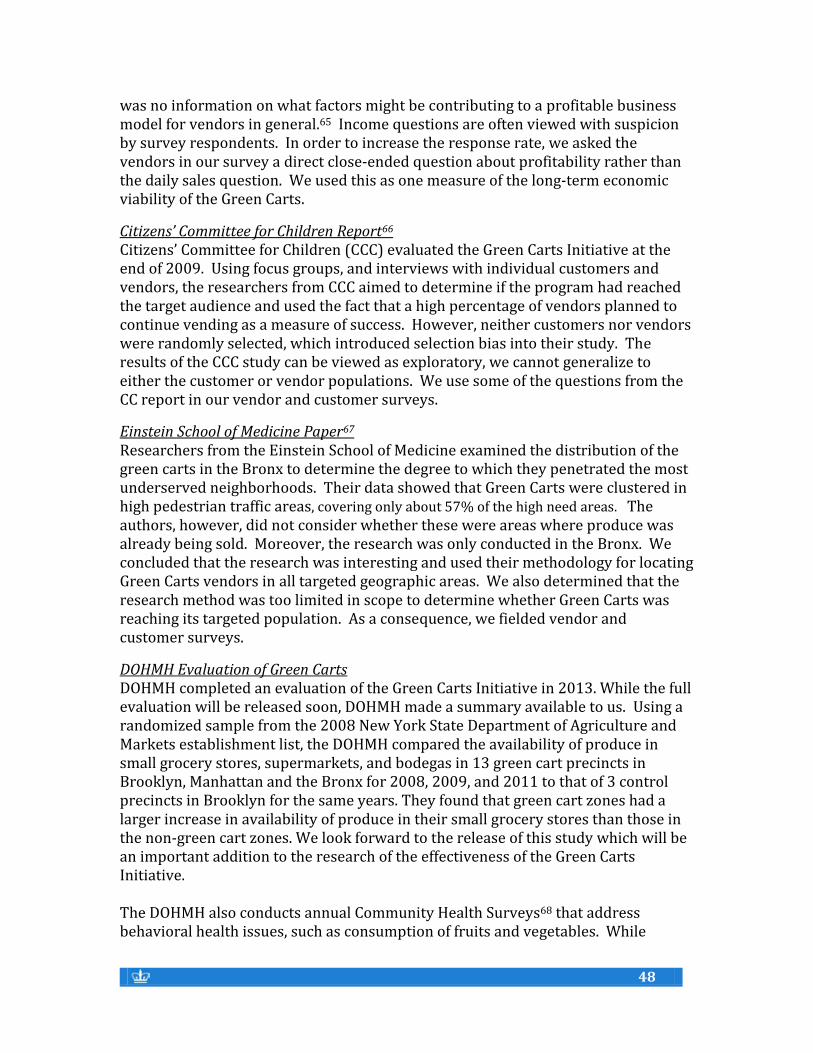
48
48
was no information on what factors might be contributing to a profitable business model for vendors in general.65 Income questions are often viewed with suspicion by survey respondents. In order to increase the response rate, we asked the vendors in our survey a direct close-ended question about profitability rather than the daily sales question. We used this as one measure of the long-term economic viability of the Green Carts.
Citizens’ Committee for Children Report66 Citizens’ Committee for Children (CCC) evaluated the Green Carts Initiative at the end of 2009. Using focus groups, and interviews with individual customers and vendors, the researchers from CCC aimed to determine if the program had reached the target audience and used the fact that a high percentage of vendors planned to continue vending as a measure of success. However, neither customers nor vendors were randomly selected, which introduced selection bias into their study. The results of the CCC study can be viewed as exploratory, we cannot generalize to either the customer or vendor populations. We use some of the questions from the CC report in our vendor and customer surveys.
Einstein School of Medicine Paper67 Researchers from the Einstein School of Medicine examined the distribution of the green carts in the Bronx to determine the degree to which they penetrated the most underserved neighborhoods. Their data showed that Green Carts were clustered in high pedestrian traffic areas, covering only about 57% of the high need areas. The authors, however, did not consider whether these were areas where produce was already being sold. Moreover, the research was only conducted in the Bronx. We concluded that the research was interesting and used their methodology for locating Green Carts vendors in all targeted geographic areas. We also determined that the research method was too limited in scope to determine whether Green Carts was reaching its targeted population. As a consequence, we fielded vendor and customer surveys.
DOHMH Evaluation of Green Carts DOHMH completed an evaluation of the Green Carts Initiative in 2013. While the full evaluation will be released soon, DOHMH made a summary available to us. Using a randomized sample from the 2008 New York State Department of Agriculture and Markets establishment list, the DOHMH compared the availability of produce in small grocery stores, supermarkets, and bodegas in 13 green cart precincts in Brooklyn, Manhattan and the Bronx for 2008, 2009, and 2011 to that of 3 control precincts in Brooklyn for the same years. They found that green cart zones had a larger increase in availability of produce in their small grocery stores than those in the non-green cart zones. We look forward to the release of this study which will be an important addition to the research of the effectiveness of the Green Carts Initiative. The DOHMH also conducts annual Community Health Surveys68 that address behavioral health issues, such as consumption of fruits and vegetables. While

49
49
respondents to the 2012 Community Health Survey from high-poverty neighborhoods such as the South Bronx reported an increased consumption in fruits or vegetables from the 2004 survey prior to Green Carts inception, it is difficult to attribute what specific factors account for this increase. We used a sample survey of customer to determine if the Green Carts were reaching the targeted population.

50
50
Appendix C: Vendor Survey
Introduction
Hi, I’m _______________, a student at Columbia. We are trying to understand whether the Green Cart vending program is working well for you. Do you have few minutes to talk?
Do you speak English?
1. English
Yes No
What is your native language?
2. Spanish
Yes No
3. French
Yes No
4. Haitian Creole
Yes No
5. Bengali
Yes No
6. Arabic
Yes No
Country of Origin?
__________________________________

51
51
7. Don't know / Not sure
Yes No
8. Other (please specify)
_____________________________
[If there’s more than one vendor, talk to the owner or the senior vendor]
9. What is the most popular fruit or vegetable that you sell?
10. How do you decide what to sell at your cart? [no prompt] Customer requests
Prices/profits
What looks good/fresh - seasonal
Other
I don’t decide
Don’t Know
No Response
11. So, do you work for someone else, or are you the cart owner?
I own the cart
Someone else owns cart
No Response
12. Who else, if anyone, operates this cart? [prompt]
Just you
Friends
Relatives
Employees

52
52
Owner
Other
Don’t Know
No Response
13. Do you operate all year around or seasonally?
Year Round,
Seasonally
Don’t Know
No Response
[If seasonally, ask about which seasons.]
14. Summer
Yes No No Response
15. Fall
Yes No No Response
16. Winter
Yes No No Response
17. Spring
Yes No No Response
18. How many days a week is the cart operating, not just when you are here?

53
53
Don’t Know No Response
19. On average, how many hours a day does the cart operate?
Don’t Know No Response
20. Is this your only job, or do you also work someplace else?
Only job
Has other employment
No Response
21. Do you operate any other carts?
Yes No No Response
22. How long has this cart been in operation? [prompt]
0 – 6 months 7-11 months 1 year to 1 year 11 months
2 or more years
Don’t Know
No Response
23. Why did you choose this location? [no prompt, fish for quotes]
Near transportation
Near businesses/institution
A lot of foot traffic
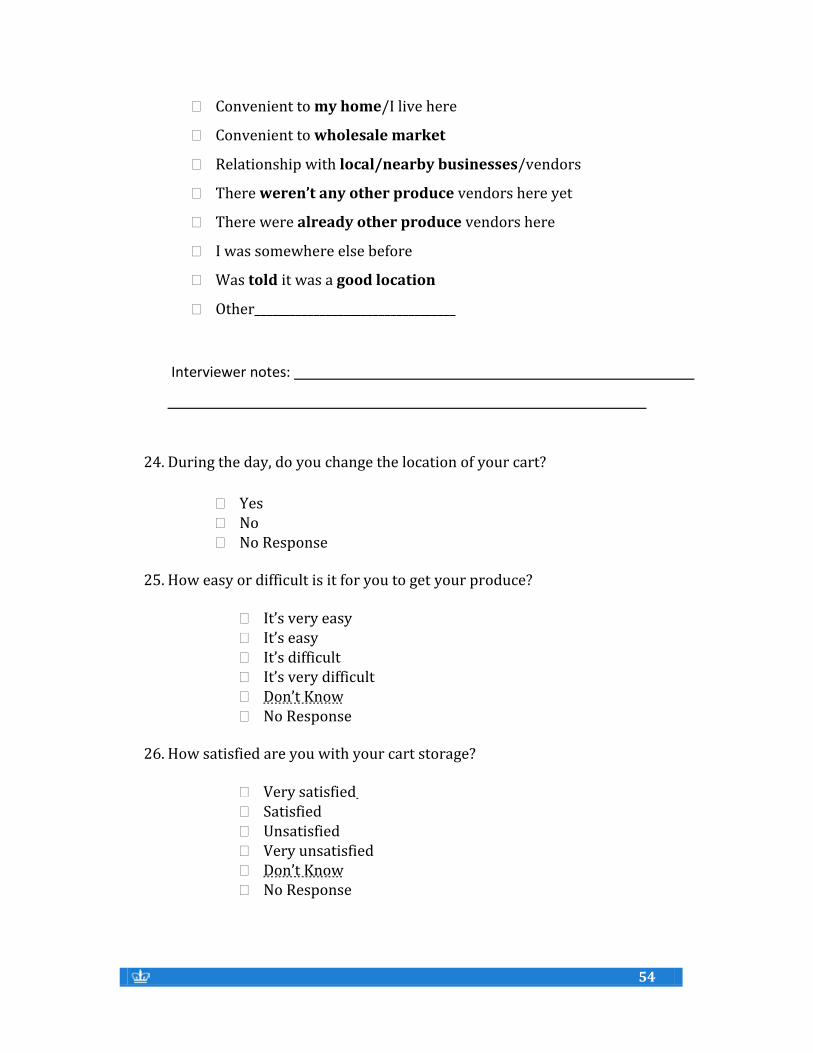
54
54
Convenient to my home/I live here
Convenient to wholesale market
Relationship with local/nearby businesses/vendors
There weren’t any other produce vendors here yet
There were already other produce vendors here
I was somewhere else before
Was told it was a good location
Other__________________________________
Interviewer notes:
24. During the day, do you change the location of your cart?
Yes No No Response
25. How easy or difficult is it for you to get your produce?
It’s very easy It’s easy It’s difficult It’s very difficult Don’t Know No Response
26. How satisfied are you with your cart storage?
Very satisfied Satisfied Unsatisfied Very unsatisfied Don’t Know No Response

55
55
27. How easy or difficult is it to get your cart to your location?
It’s very easy It’s easy It’s difficult It’s very difficult Don’t Know No Response
28. How easy or difficult is it to store your produce?
It’s very easy It’s easy It’s difficult It’s very difficult Don’t Know No Response
29. Do you pay to store your cart?
Yes No Don’t Know No Response
30. What did you do before operating a Green Cart? Interviewer notes:
31. Did you have any training or experience that was helpful in preparing you for
operating the Green Cart? Interviewer notes:

56
56
32. Did you get any assistance in starting the Green Cart? [no prompt]
Community organizations
The City Government
Friends/family
No one
Other
Don’t Know
No Response
Interviewer notes:
33. Did you get any assistance in promoting the Green Cart in the
neighborhood?[ no prompt]
Community organizations
The City Government
Friends/family
No one
Other
Don’t Know
No Response
Interviewer notes:
34. Do you think you’ll still be operating in a year?
Interviewer notes:

57
57
35. What has been hard for you about running a green cart?
Interviewer notes:
36. What support could you use to be more successful? Interviewer notes:
37. Do you think your experience running the green cart would help you open a
larger business?
Yes No No Response
Interviewer notes:
38. Would you say that you consider your business to be:
Very profitable
Somewhat profitable
Unprofitable now but should be profitable soon
Unprofitable
Don’t know
No Response

58
58
Interviewer notes:
Vendor Observed Information [One person will begin the interview, the second person will report the observed information]
Date___________________________ Time of Day_____________________
1. Permit number
2. Permit expiration date
m m y y
3. EBT machine
Yes
No
4. Accepts Credit Cards
Yes
No
5. How many vendors are working at the cart?
One
Two
G

59
59
Three
6. Gender (senior vendor/owner)
Male
Female
7. Age (senior vendor/owner)
Under 30
31-50 years old
51+
8. Borough
Manhattan
Brooklyn
Queens
Cart Location If there is a store or building with an address, write down the address. If not, indicate closest avenue or street and whether it’s on the north or south side of the street
9. Building Number
10. Street Name ______________________________________________________
11. Cross Street ___________________________________________________________

60
60
12. Other geographic information
____________________________________________________________
13. Number of carts
1 cart
2 carts
3 or more carts Block characteristics visible from the cart
14. Shopping district
Yes
No
15. Small Retail
Yes
No
16. Warehouse
Yes
No
17. Residential
Yes
No
18. Park
Yes
No
19. Hospital
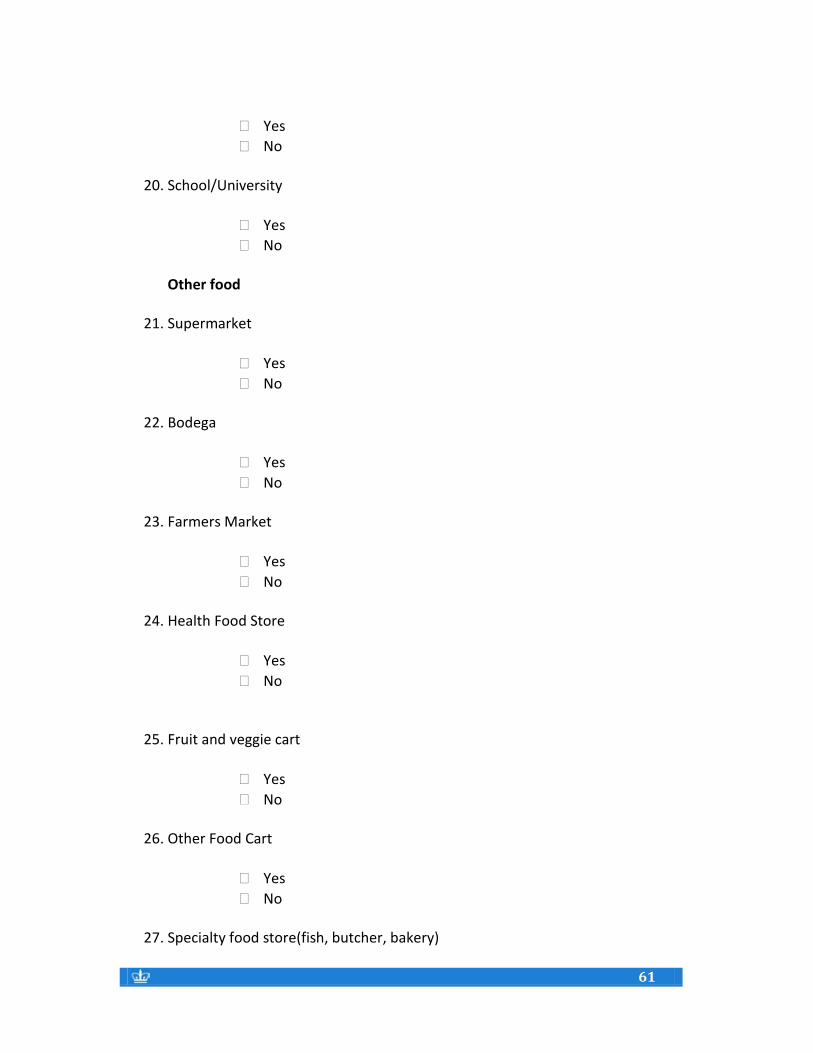
61
61
Yes
No
20. School/University
Yes
No Other food
21. Supermarket
Yes
No
22. Bodega
Yes
No
23. Farmers Market
Yes
No
24. Health Food Store
Yes
No
25. Fruit and veggie cart
Yes
No
26. Other Food Cart
Yes
No
27. Specialty food store(fish, butcher, bakery)
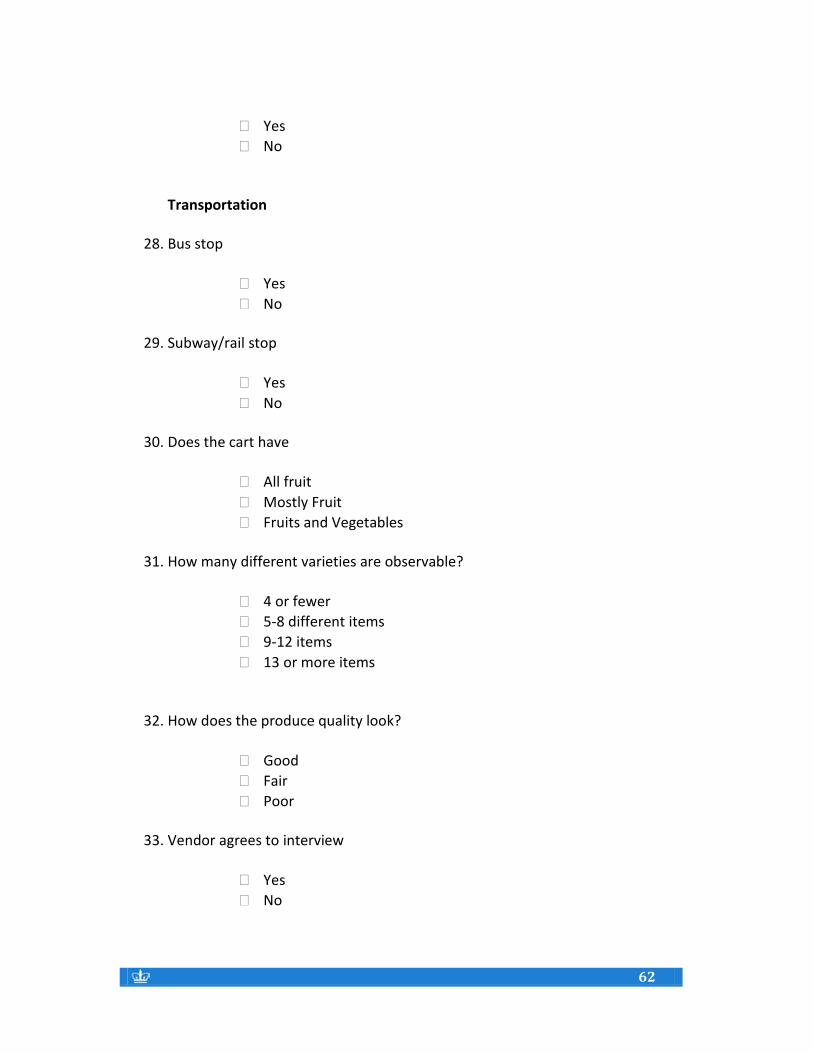
62
62
Yes
No Transportation
28. Bus stop
Yes
No
29. Subway/rail stop
Yes
No
30. Does the cart have
All fruit
Mostly Fruit
Fruits and Vegetables
31. How many different varieties are observable?
4 or fewer
5-8 different items
9-12 items
13 or more items
32. How does the produce quality look?
Good
Fair
Poor
33. Vendor agrees to interview
Yes
No

63
63
Appendix D: Customer Survey
Introduction
Hi, my name is __________ and I am a student at Columbia University. I am currently doing research on fruit and vegetable carts like this one and would like to talk to you about shopping for fruits and vegetables at the carts. Do you mind answering a few questions? (If no, record as refusal in a tally on a separate blank sheet.)
Fill in Question: (Fill in gender upon seeing the person.)
1. Gender:
Male Female
2. What group do you consider yourself to be a part of? (Fill in.)
White
Black
Hispanic
Asian
Mixed
Don’t Know
No Response
Interview Questions:
3. Do you speak English?
Yes No
If not what is your native language?
(If they answer Spanish, move to Spanish questionnaire)
4. Where were you born? Please tell me the country. US Other Specify________________ Don’t Know
No Response
5. Are you . . . (Prompt.)

64
64
Married Divorced/Separated Single Children If yes, How many? ___________________
Don’t Know
No Response
6. How old are you? Are you . . . (Prompt.)
18-24 25-29 30-44 45-64 65+ Don’t Know
No Response
7. Do you live in the neighbourhood?
Yes No
[If no, ask Questions8-11 below]
8. Do you work in the neighbourhood?
Yes No
9. Are you in the neighbourhood to visit friends/family?
Yes No
10. Is there another reason you’re here?
Yes No Specify:_________________
11. What neighbourhood do you live in?

65
65
12. Do you mind giving us your zip code?
_______________________ Refused
13. How often do you come to this neighborhood? (Prompt.)
Daily Weekly Rarely
Don’t Know
No Response
14. If you walk to the cart, how many blocks do you walk to shop at this cart?
(Prompt.)
Less than 5 blocks More than 5 blocks
I don’t walk
Don’t Know
No Response
15. Since you have been shopping at the cart, have you and your family been eating
more fruits and vegetables? (Prompt.) No
More vegetables
More fruit
More fruit and vegetables
Don’t Know
No Response
16. I am going to read you a list of places you might be buying your fruits and
vegetables. Could you tell me which two places you buy most of your fruits and
vegetables? (Prompt.)
Green Cart
Supermarket Bodega Small grocery store Farmer’s Market
Other
o Specify__________________________________

66
66
Don’t Know
No Response
17. Do you usually buy only fruits, only vegetables or both when you shop at the
cart?
Only Fruit
Only Vegetables
Both Fruit and Vegetables
Don’t Know
No Response
18. How often do you shop at this fruit and vegetable cart? (Prompt.)
1st time shopping here Less than 1 time a week 1 time a week
2-3 times a week
4-5 times a week
Everyday Don’t Know
No Response
19. When you shop at the cart, is your purchase for snacking during the day or for
taking home for later?
Snacking during the day
Taking home
Both
Don’t Know
No Response
20. Which of the following factors influence your decision to shop at green carts? (Prompt.)
Convenient location
Yes
No
Don’t Know
No Response
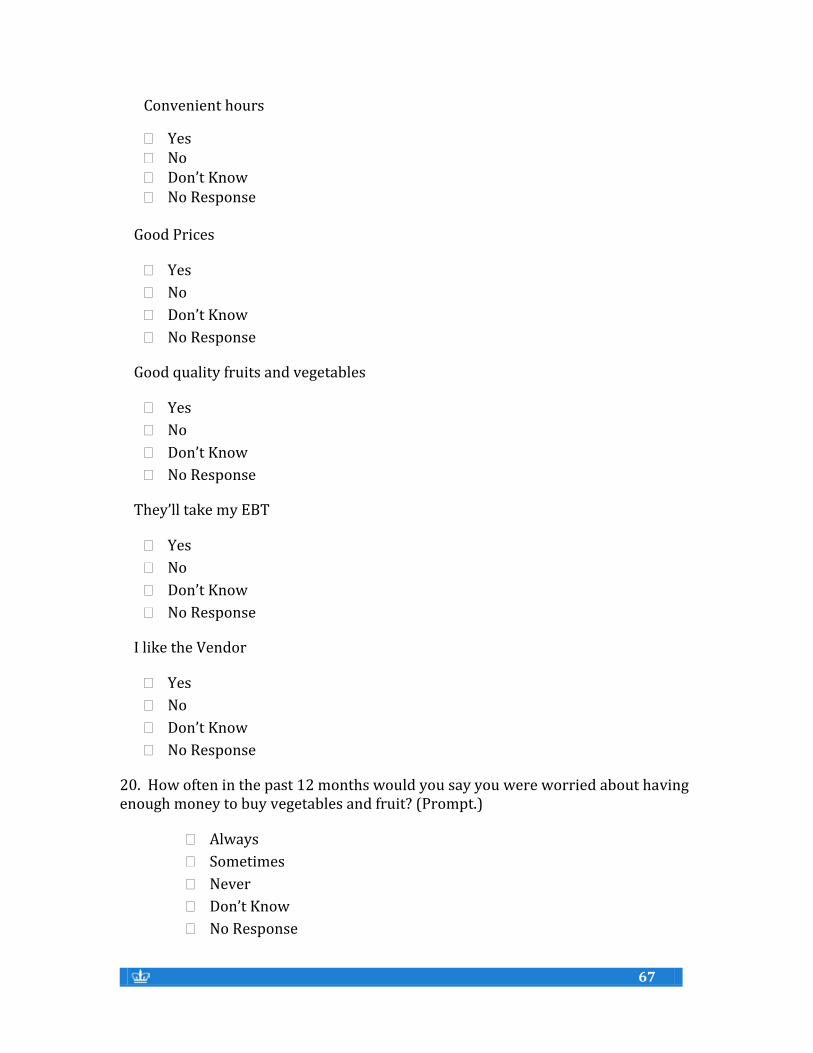
67
67
Convenient hours
Yes No Don’t Know No Response
Good Prices
Yes
No
Don’t Know
No Response
Good quality fruits and vegetables
Yes
No
Don’t Know
No Response
They’ll take my EBT
Yes
No
Don’t Know
No Response
I like the Vendor
Yes
No
Don’t Know
No Response
20. How often in the past 12 months would you say you were worried about having enough money to buy vegetables and fruit? (Prompt.)
Always
Sometimes
Never
Don’t Know
No Response
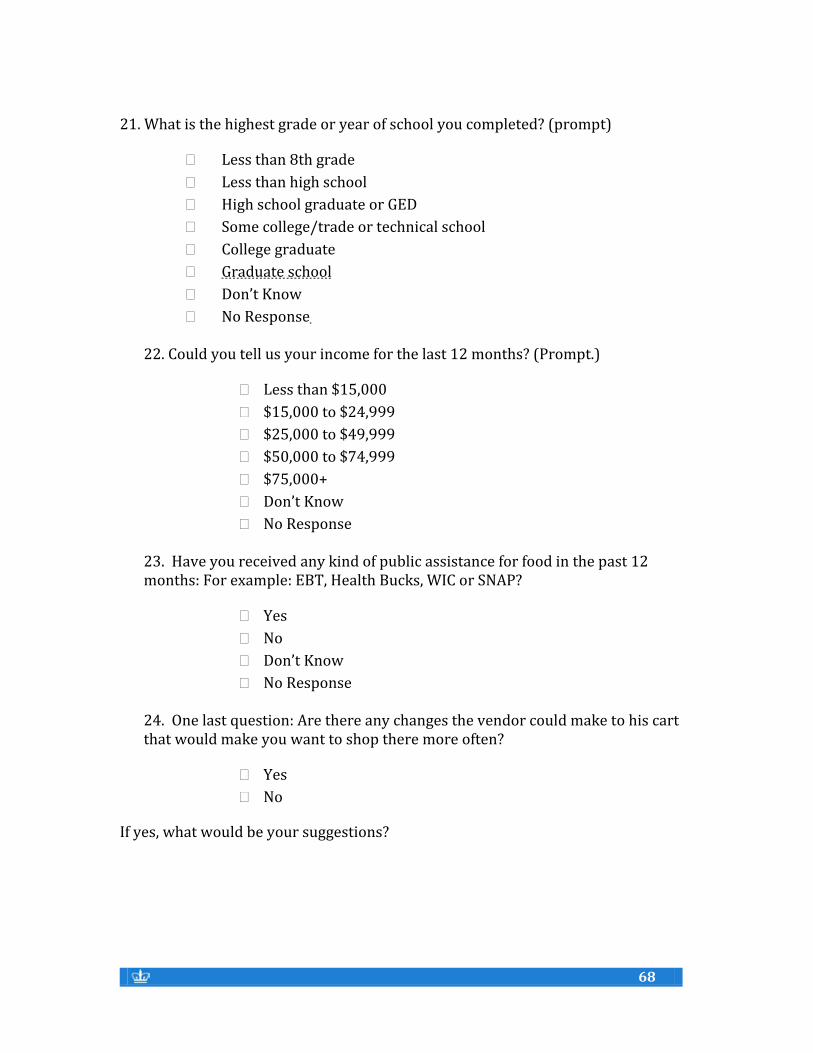
68
68
21. What is the highest grade or year of school you completed? (prompt)
Less than 8th grade
Less than high school
High school graduate or GED
Some college/trade or technical school
College graduate
Graduate school
Don’t Know
No Response
22. Could you tell us your income for the last 12 months? (Prompt.)
Less than $15,000
$15,000 to $24,999
$25,000 to $49,999
$50,000 to $74,999
$75,000+
Don’t Know
No Response
23. Have you received any kind of public assistance for food in the past 12 months: For example: EBT, Health Bucks, WIC or SNAP?
Yes
No
Don’t Know
No Response
24. One last question: Are there any changes the vendor could make to his cart that would make you want to shop there more often?
Yes
No
If yes, what would be your suggestions?
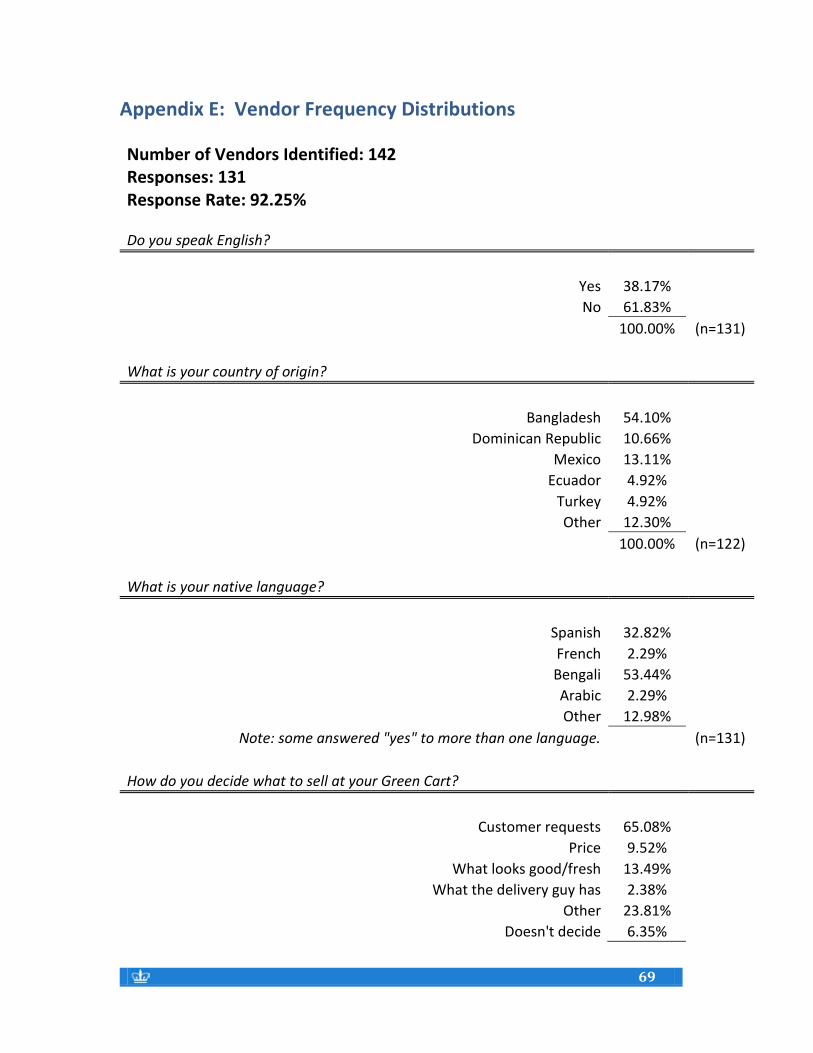
69
69
Appendix E: Vendor Frequency Distributions
Number of Vendors Identified: 142 Responses: 131
Response Rate: 92.25% Do you speak English?
Yes 38.17%
No 61.83%
100.00% (n=131)
What is your country of origin?
Bangladesh 54.10%
Dominican Republic 10.66%
Mexico 13.11%
Ecuador 4.92%
Turkey 4.92%
Other 12.30%
100.00% (n=122)
What is your native language?
Spanish 32.82%
French 2.29%
Bengali 53.44%
Arabic 2.29%
Other 12.98%
Note: some answered "yes" to more than one language. (n=131)
How do you decide what to sell at your Green Cart?
Customer requests 65.08%
Price 9.52%
What looks good/fresh 13.49%
What the delivery guy has 2.38%
Other 23.81%
Doesn't decide 6.35%
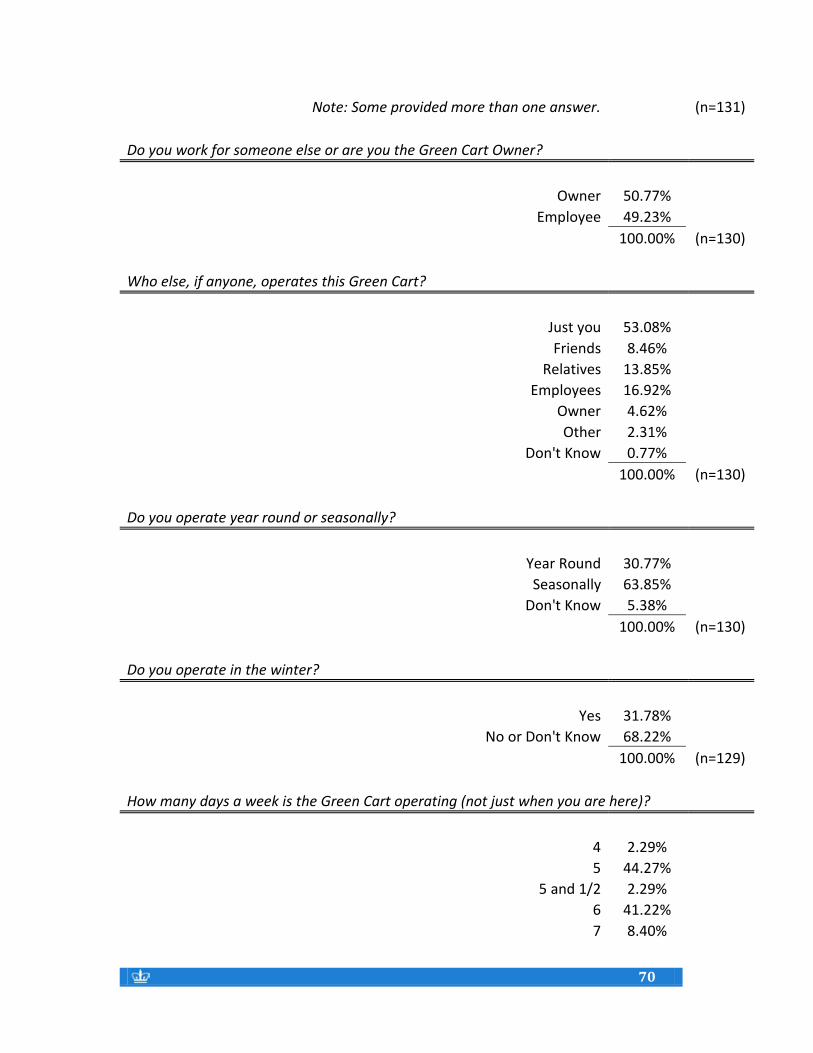
70
70
Note: Some provided more than one answer. (n=131)
Do you work for someone else or are you the Green Cart Owner?
Owner 50.77%
Employee 49.23%
100.00% (n=130)
Who else, if anyone, operates this Green Cart?
Just you 53.08%
Friends 8.46%
Relatives 13.85%
Employees 16.92%
Owner 4.62%
Other 2.31%
Don't Know 0.77%
100.00% (n=130)
Do you operate year round or seasonally?
Year Round 30.77%
Seasonally 63.85%
Don't Know 5.38%
100.00% (n=130)
Do you operate in the winter?
Yes 31.78%
No or Don't Know 68.22%
100.00% (n=129)
How many days a week is the Green Cart operating (not just when you are here)?
4 2.29%
5 44.27%
5 and 1/2 2.29%
6 41.22%
7 8.40%
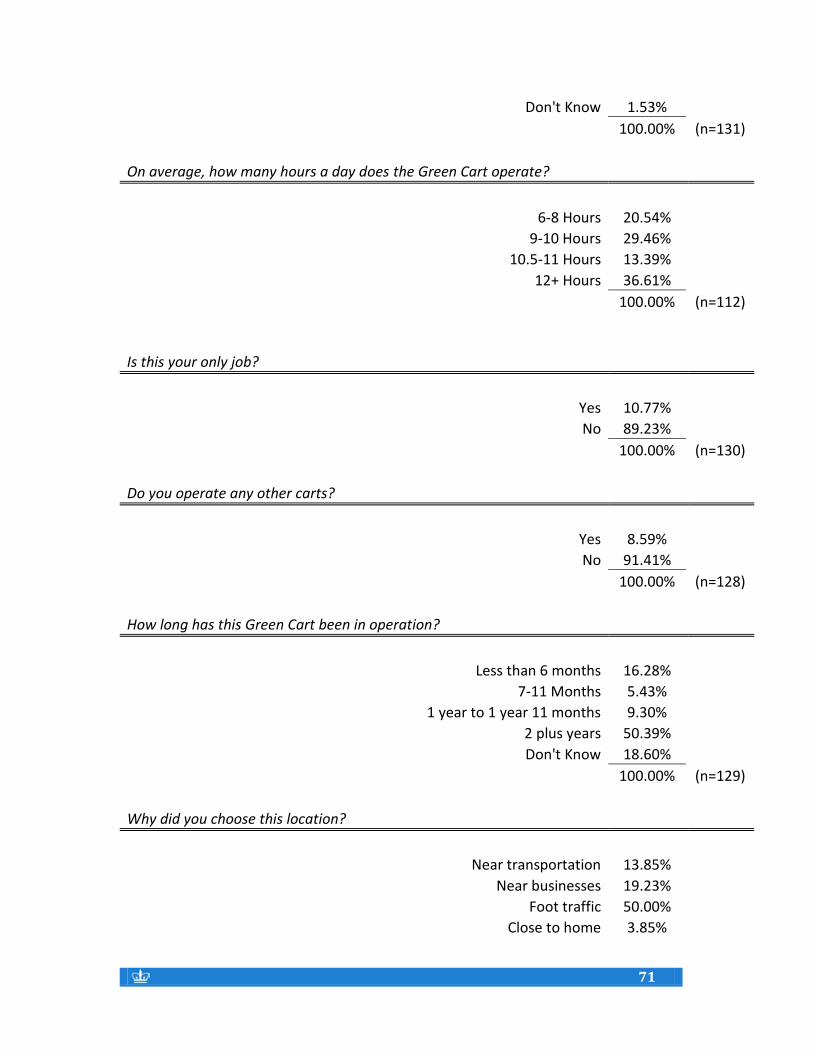
71
71
Don't Know 1.53%
100.00% (n=131)
On average, how many hours a day does the Green Cart operate?
6-8 Hours 20.54%
9-10 Hours 29.46%
10.5-11 Hours 13.39%
12+ Hours 36.61%
100.00% (n=112)
Is this your only job?
Yes 10.77%
No 89.23%
100.00% (n=130)
Do you operate any other carts?
Yes 8.59%
No 91.41%
100.00% (n=128)
How long has this Green Cart been in operation?
Less than 6 months 16.28%
7-11 Months 5.43%
1 year to 1 year 11 months 9.30%
2 plus years 50.39%
Don't Know 18.60%
100.00% (n=129)
Why did you choose this location?
Near transportation 13.85%
Near businesses 19.23%
Foot traffic 50.00%
Close to home 3.85%
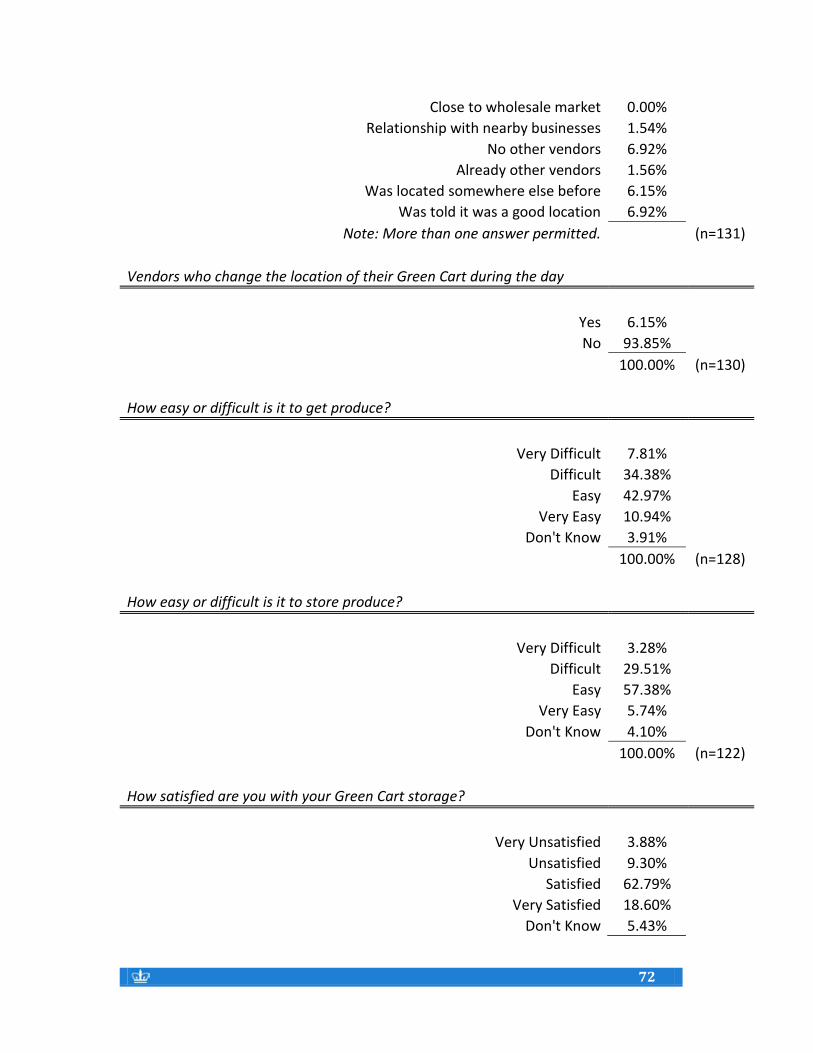
72
72
Close to wholesale market 0.00%
Relationship with nearby businesses 1.54%
No other vendors 6.92%
Already other vendors 1.56%
Was located somewhere else before 6.15%
Was told it was a good location 6.92%
Note: More than one answer permitted. (n=131)
Vendors who change the location of their Green Cart during the day
Yes 6.15%
No 93.85%
100.00% (n=130)
How easy or difficult is it to get produce?
Very Difficult 7.81%
Difficult 34.38%
Easy 42.97%
Very Easy 10.94%
Don't Know 3.91%
100.00% (n=128)
How easy or difficult is it to store produce?
Very Difficult 3.28%
Difficult 29.51%
Easy 57.38%
Very Easy 5.74%
Don't Know 4.10%
100.00% (n=122)
How satisfied are you with your Green Cart storage?
Very Unsatisfied 3.88%
Unsatisfied 9.30%
Satisfied 62.79%
Very Satisfied 18.60%
Don't Know 5.43%
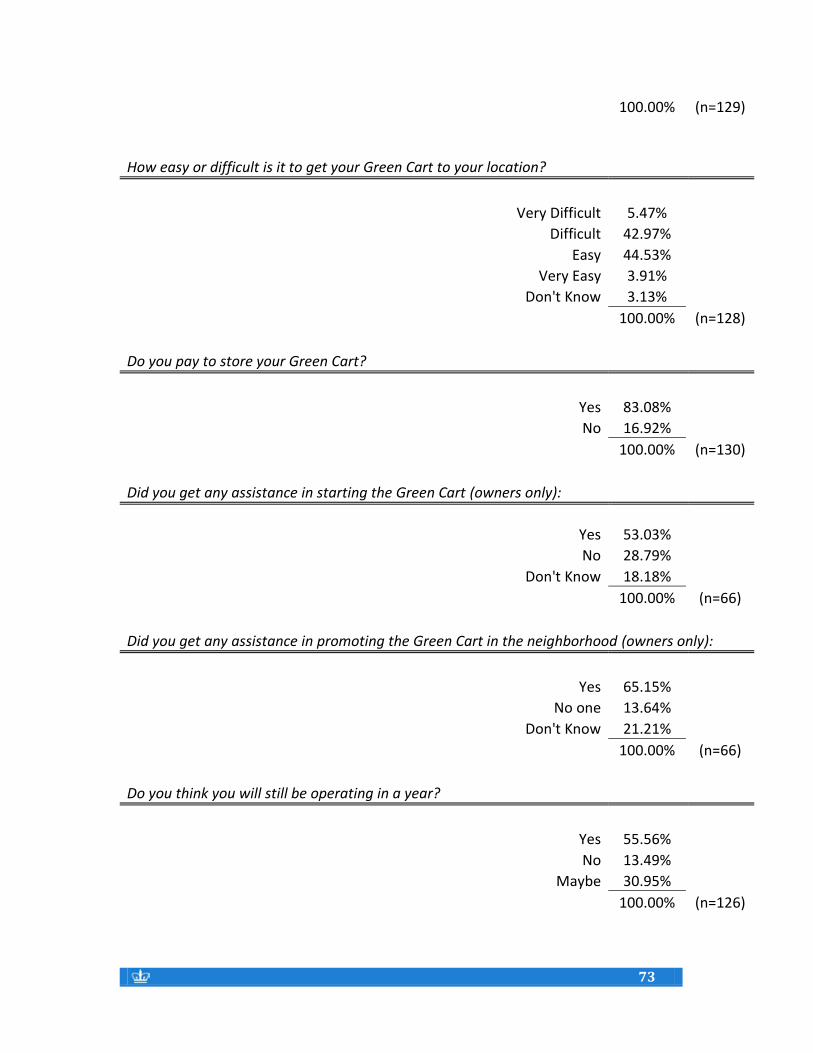
73
73
100.00% (n=129)
How easy or difficult is it to get your Green Cart to your location?
Very Difficult 5.47%
Difficult 42.97%
Easy 44.53%
Very Easy 3.91%
Don't Know 3.13%
100.00% (n=128)
Do you pay to store your Green Cart?
Yes 83.08%
No 16.92%
100.00% (n=130)
Did you get any assistance in starting the Green Cart (owners only):
Yes 53.03%
No 28.79%
Don't Know 18.18%
100.00% (n=66)
Did you get any assistance in promoting the Green Cart in the neighborhood (owners only):
Yes 65.15%
No one 13.64%
Don't Know 21.21%
100.00% (n=66)
Do you think you will still be operating in a year?
Yes 55.56%
No 13.49%
Maybe 30.95%
100.00% (n=126)
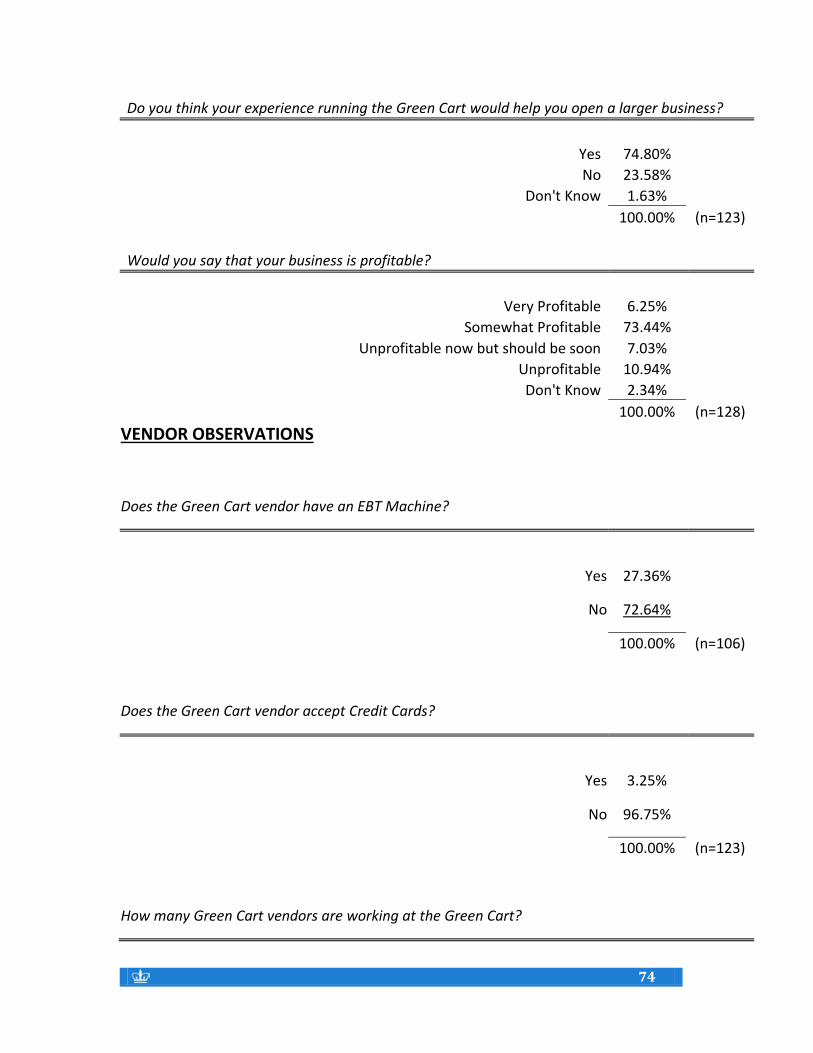
74
74
Do you think your experience running the Green Cart would help you open a larger business?
Yes 74.80%
No 23.58%
Don't Know 1.63%
100.00% (n=123)
Would you say that your business is profitable?
Very Profitable 6.25%
Somewhat Profitable 73.44%
Unprofitable now but should be soon 7.03%
Unprofitable 10.94%
Don't Know 2.34%
100.00% (n=128)
VENDOR OBSERVATIONS
Does the Green Cart vendor have an EBT Machine?
Yes 27.36%
No 72.64%
100.00% (n=106)
Does the Green Cart vendor accept Credit Cards?
Yes 3.25%
No 96.75%
100.00% (n=123)
How many Green Cart vendors are working at the Green Cart?
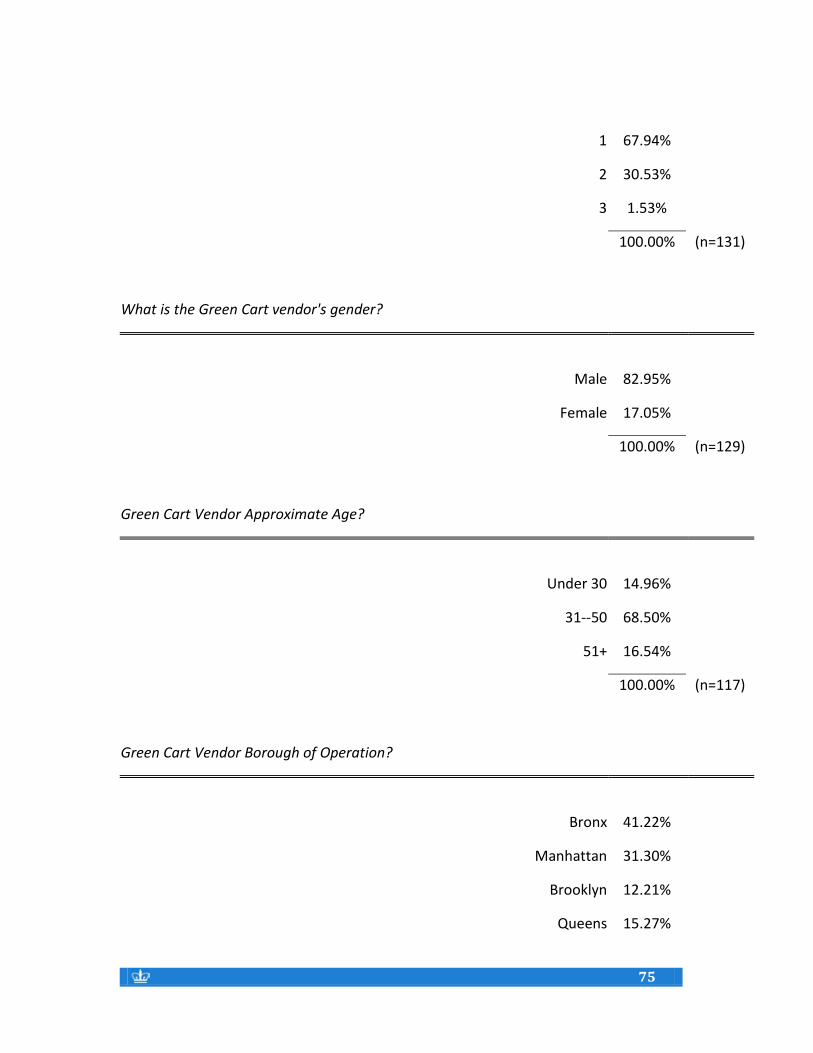
75
75
1 67.94%
2 30.53%
3 1.53%
100.00% (n=131)
What is the Green Cart vendor's gender?
Male 82.95%
Female 17.05%
100.00% (n=129)
Green Cart Vendor Approximate Age?
Under 30 14.96%
31--50 68.50%
51+ 16.54%
100.00% (n=117)
Green Cart Vendor Borough of Operation?
Bronx 41.22%
Manhattan 31.30%
Brooklyn 12.21%
Queens 15.27%
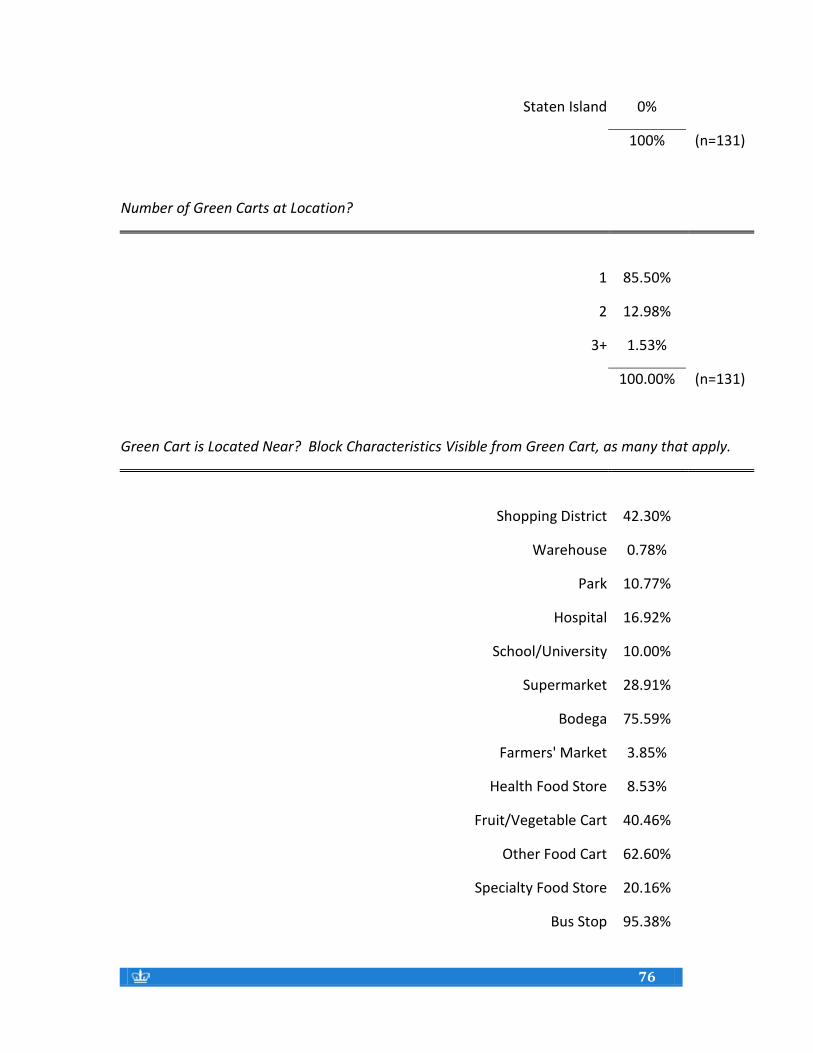
76
76
Staten Island 0%
100% (n=131)
Number of Green Carts at Location?
1 85.50%
2 12.98%
3+ 1.53%
100.00% (n=131)
Green Cart is Located Near? Block Characteristics Visible from Green Cart, as many that apply.
Shopping District 42.30%
Warehouse 0.78%
Park 10.77%
Hospital 16.92%
School/University 10.00%
Supermarket 28.91%
Bodega 75.59%
Farmers' Market 3.85%
Health Food Store 8.53%
Fruit/Vegetable Cart 40.46%
Other Food Cart 62.60%
Specialty Food Store 20.16%
Bus Stop 95.38%
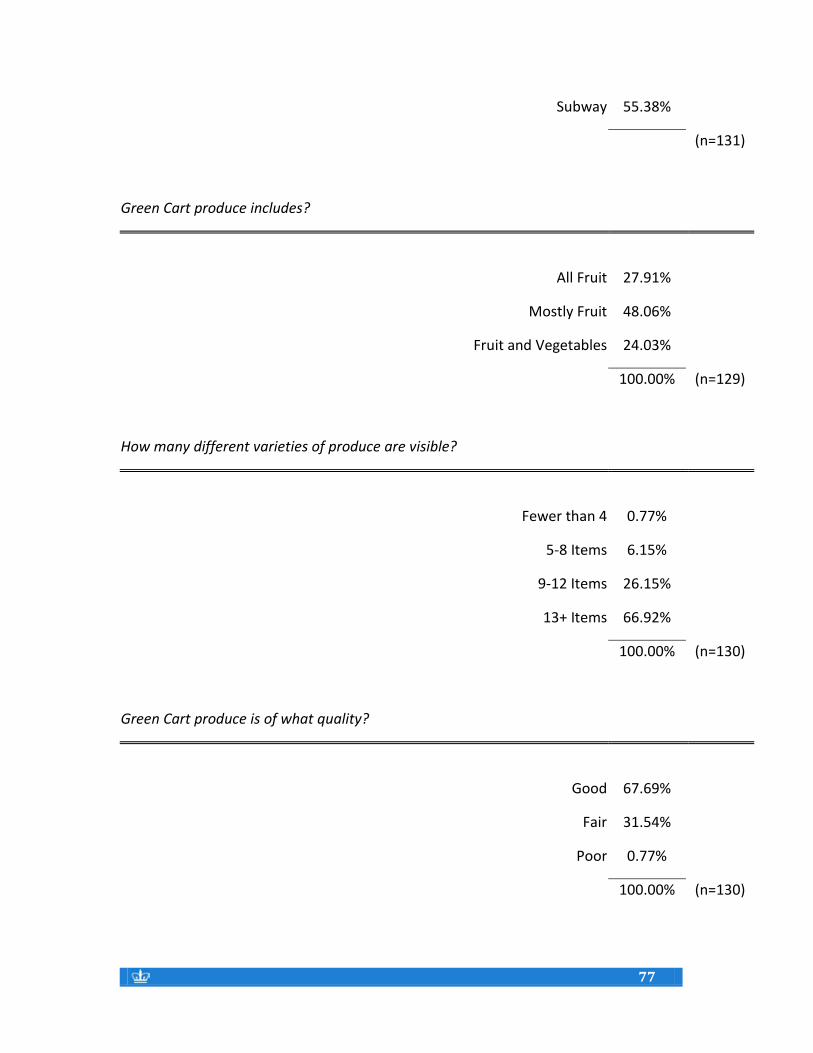
77
77
Subway 55.38%
(n=131)
Green Cart produce includes?
All Fruit 27.91%
Mostly Fruit 48.06%
Fruit and Vegetables 24.03%
100.00% (n=129)
How many different varieties of produce are visible?
Fewer than 4 0.77%
5-8 Items 6.15%
9-12 Items 26.15%
13+ Items 66.92%
100.00% (n=130)
Green Cart produce is of what quality?
Good 67.69%
Fair 31.54%
Poor 0.77%
100.00% (n=130)
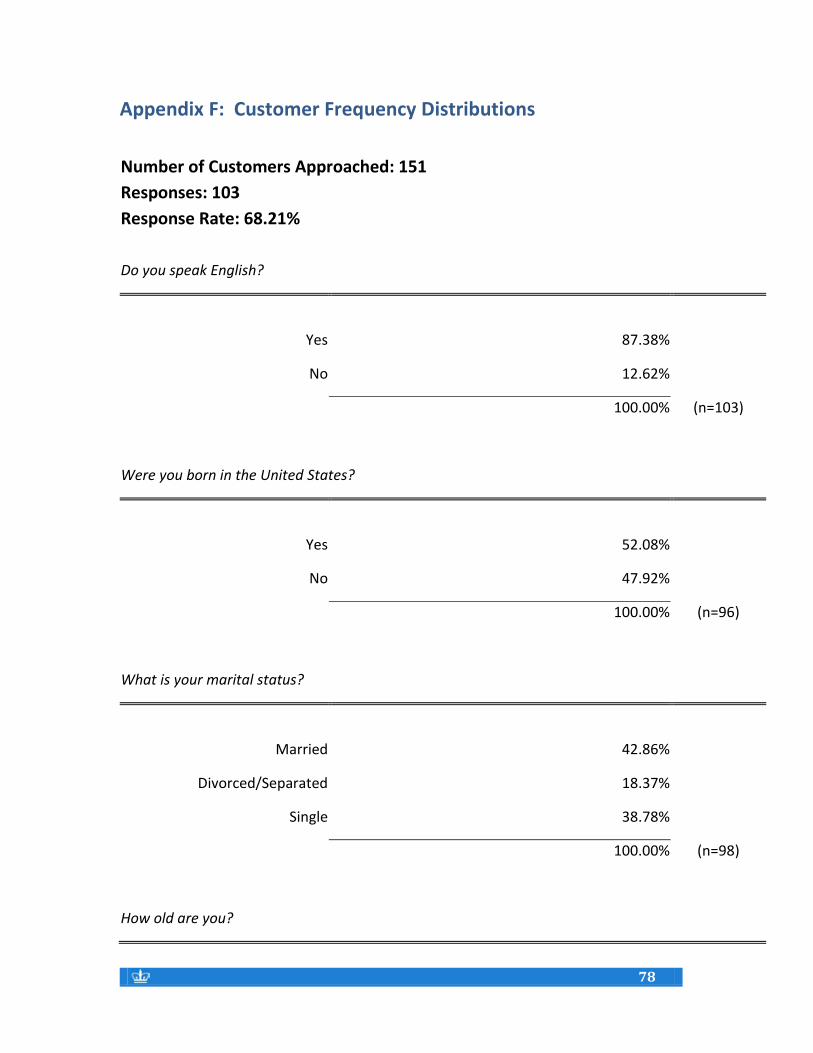
78
78
Appendix F: Customer Frequency Distributions
Number of Customers Approached: 151
Responses: 103
Response Rate: 68.21%
Do you speak English?
Yes 87.38%
No 12.62%
100.00% (n=103)
Were you born in the United States?
Yes 52.08%
No 47.92%
100.00% (n=96)
What is your marital status?
Married 42.86%
Divorced/Separated 18.37%
Single 38.78%
100.00% (n=98)
How old are you?
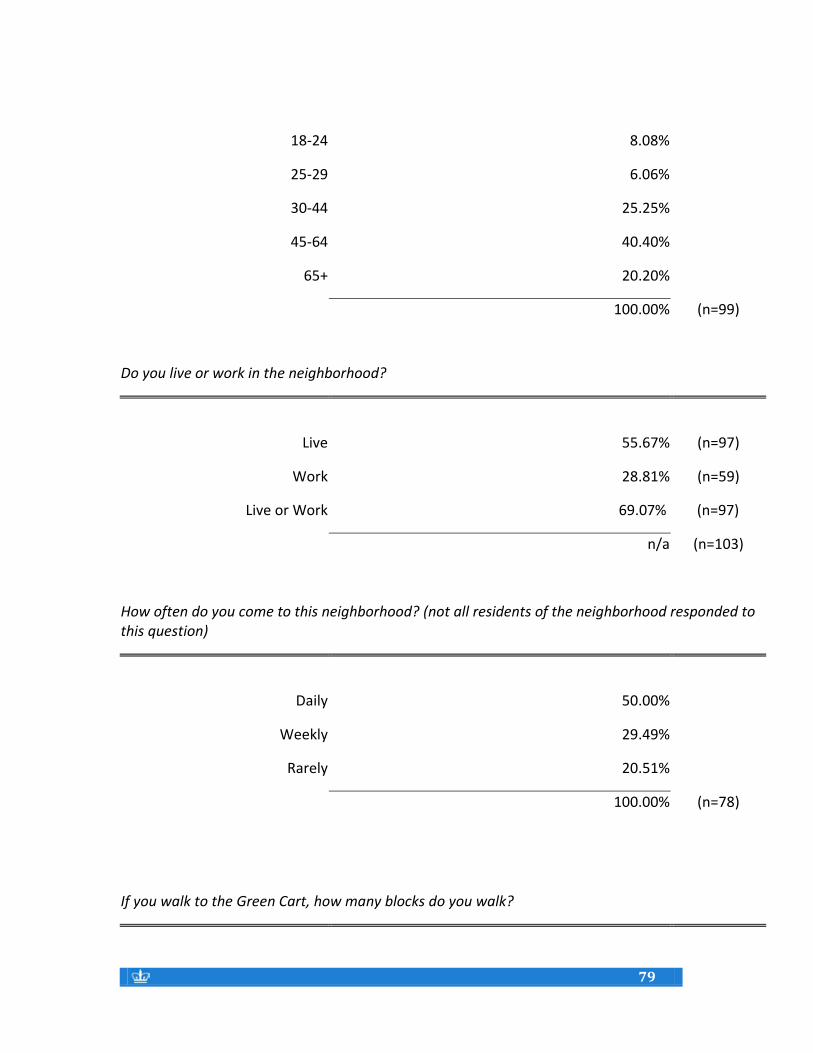
79
79
18-24 8.08%
25-29 6.06%
30-44 25.25%
45-64 40.40%
65+ 20.20%
100.00% (n=99)
Do you live or work in the neighborhood?
Live 55.67% (n=97)
Work 28.81% (n=59)
Live or Work 69.07% (n=97)
n/a (n=103)
How often do you come to this neighborhood? (not all residents of the neighborhood responded to this question)
Daily 50.00%
Weekly 29.49%
Rarely 20.51%
100.00% (n=78)
If you walk to the Green Cart, how many blocks do you walk?
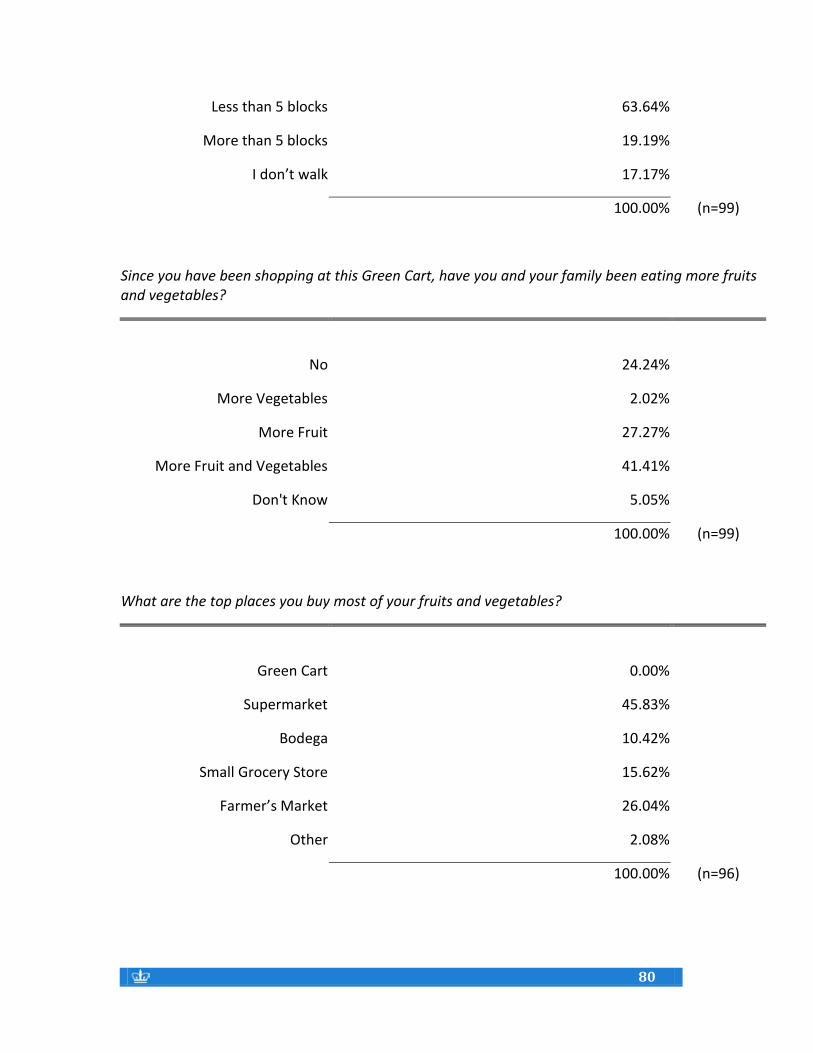
80
80
Less than 5 blocks 63.64%
More than 5 blocks 19.19%
I don’t walk 17.17%
100.00% (n=99)
Since you have been shopping at this Green Cart, have you and your family been eating more fruits and vegetables?
No 24.24%
More Vegetables 2.02%
More Fruit 27.27%
More Fruit and Vegetables 41.41%
Don't Know 5.05%
100.00% (n=99)
What are the top places you buy most of your fruits and vegetables?
Green Cart 0.00%
Supermarket 45.83%
Bodega 10.42%
Small Grocery Store 15.62%
Farmer’s Market 26.04%
Other 2.08%
100.00% (n=96)
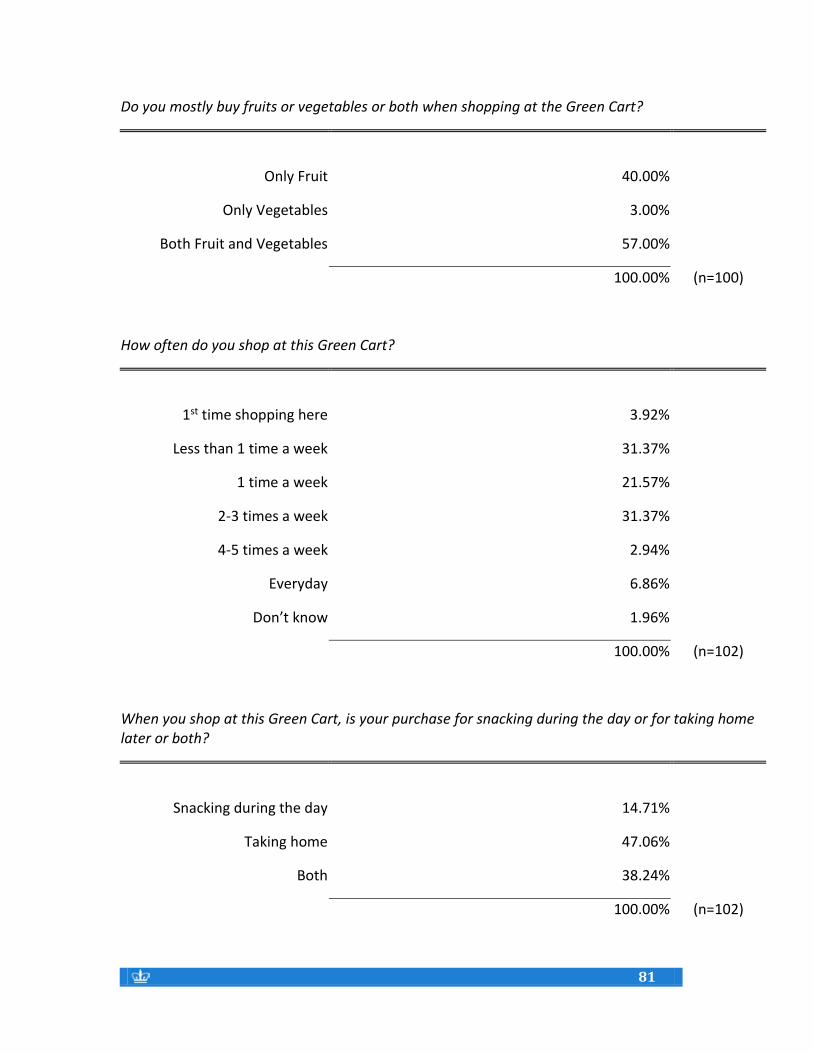
81
81
Do you mostly buy fruits or vegetables or both when shopping at the Green Cart?
Only Fruit 40.00%
Only Vegetables 3.00%
Both Fruit and Vegetables 57.00%
100.00% (n=100)
How often do you shop at this Green Cart?
1st time shopping here 3.92%
Less than 1 time a week 31.37%
1 time a week 21.57%
2-3 times a week 31.37%
4-5 times a week 2.94%
Everyday 6.86%
Don’t know 1.96%
100.00% (n=102)
When you shop at this Green Cart, is your purchase for snacking during the day or for taking home later or both?
Snacking during the day 14.71%
Taking home 47.06%
Both 38.24%
100.00% (n=102)
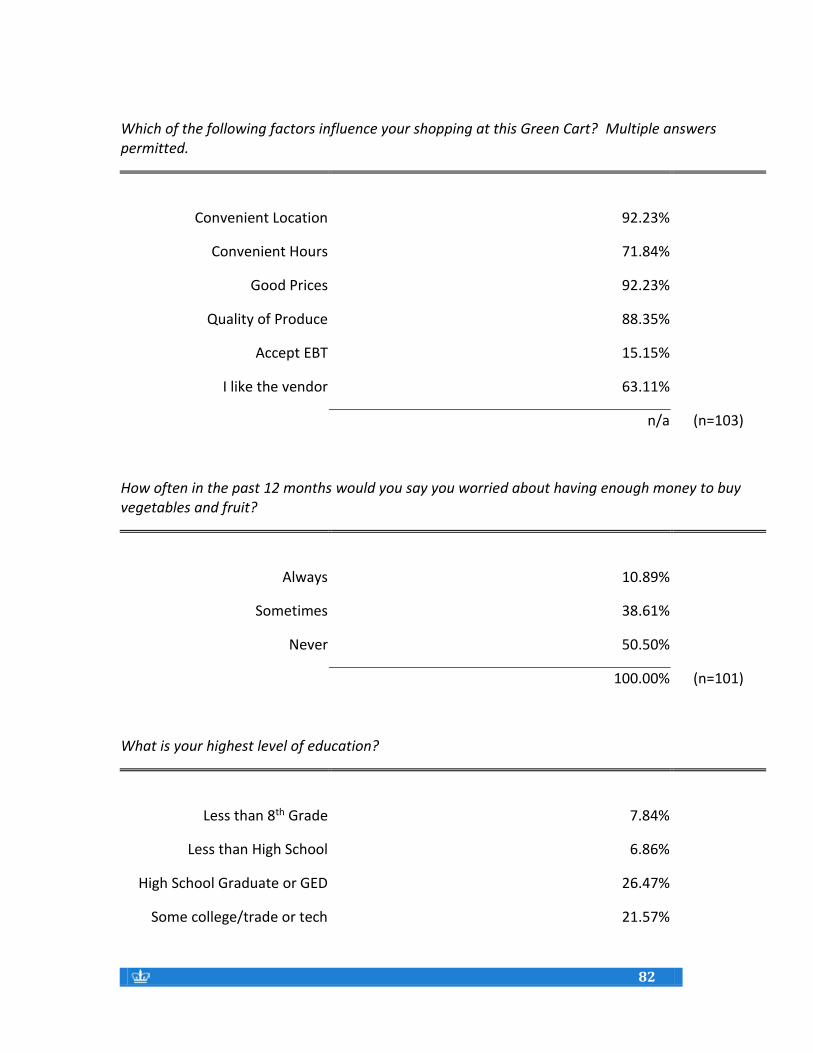
82
82
Which of the following factors influence your shopping at this Green Cart? Multiple answers permitted.
Convenient Location 92.23%
Convenient Hours 71.84%
Good Prices 92.23%
Quality of Produce 88.35%
Accept EBT 15.15%
I like the vendor 63.11%
n/a (n=103)
How often in the past 12 months would you say you worried about having enough money to buy vegetables and fruit?
Always 10.89%
Sometimes 38.61%
Never 50.50%
100.00% (n=101)
What is your highest level of education?
Less than 8th Grade 7.84%
Less than High School 6.86%
High School Graduate or GED 26.47%
Some college/trade or tech 21.57%
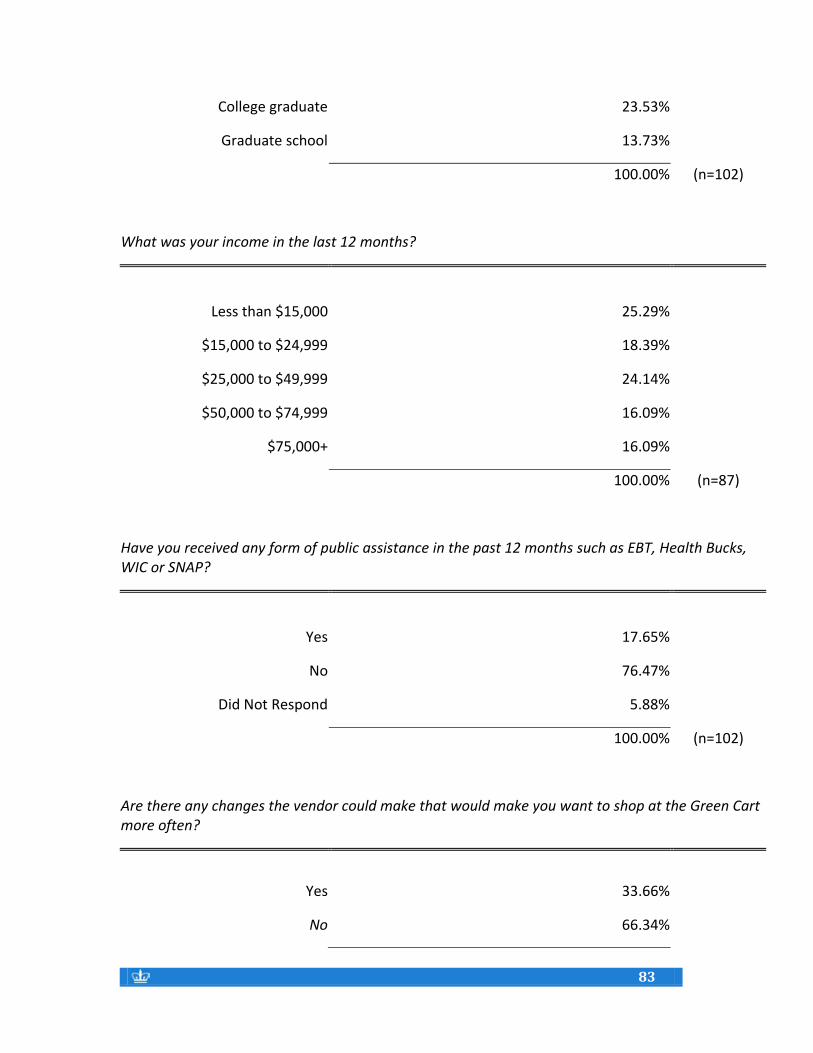
83
83
College graduate 23.53%
Graduate school 13.73%
100.00% (n=102)
What was your income in the last 12 months?
Less than $15,000 25.29%
$15,000 to $24,999 18.39%
$25,000 to $49,999 24.14%
$50,000 to $74,999 16.09%
$75,000+ 16.09%
100.00% (n=87)
Have you received any form of public assistance in the past 12 months such as EBT, Health Bucks, WIC or SNAP?
Yes 17.65%
No 76.47%
Did Not Respond 5.88%
100.00% (n=102)
Are there any changes the vendor could make that would make you want to shop at the Green Cart more often?
Yes 33.66%
No 66.34%
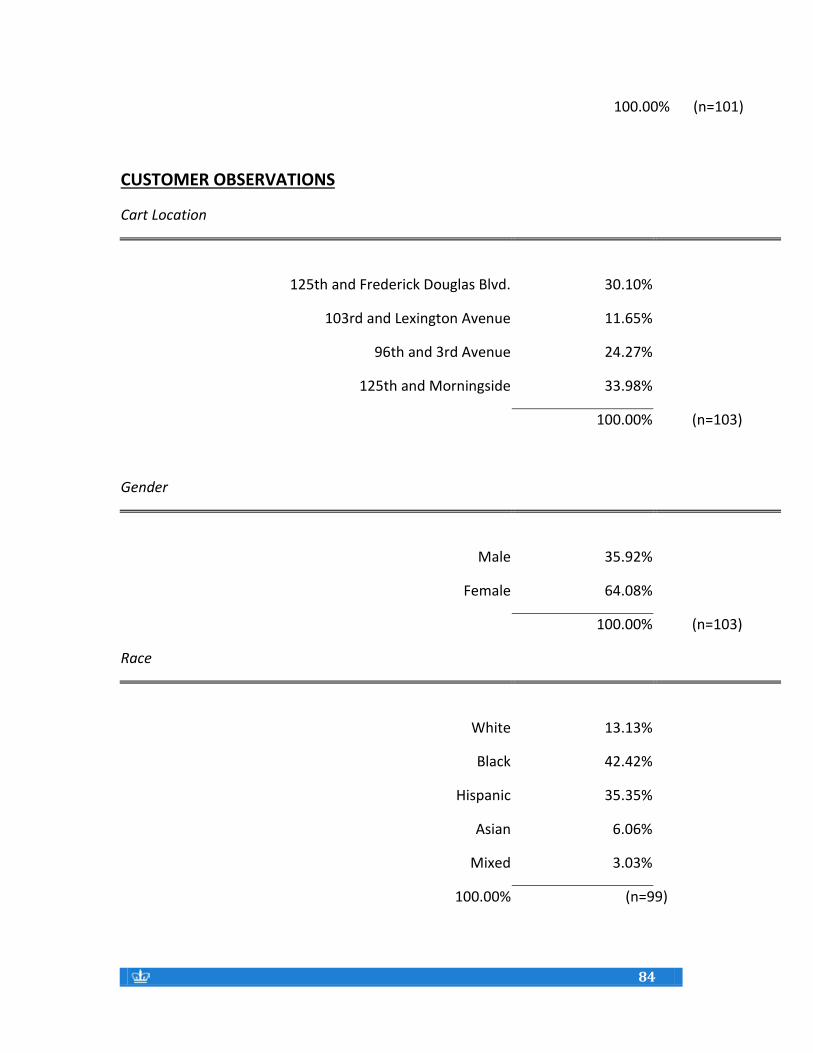
84
84
CUSTOMER OBSERVATIONS
Cart Location
125th and Frederick Douglas Blvd. 30.10%
103rd and Lexington Avenue 11.65%
96th and 3rd Avenue 24.27%
125th and Morningside 33.98%
100.00% (n=103)
Gender
Male 35.92%
Female 64.08%
100.00% (n=103)
Race
White 13.13%
Black 42.42%
Hispanic 35.35%
Asian 6.06%
Mixed 3.03%
100.00% (n=99)
100.00% (n=101)
85
85
Appendix G: List of Interviews
Melissa Berman, President, Rockefeller Philanthropy Advisors
Cassandra Flechsig, Green Cart Program Manager, Karp Resources
Karen Karp, President, Karp Resources
Rick Luftglass, Executive Director, The Laurie M. Tisch Illumination Fund
Cathy Nonas, MS, RD, Senior Advisor, NYC Department of Health and Mental Hygiene, Bureau of Chronic Disease, Prevention and Tobacco Control
Dr. William Jordan, Co-Director of Medical Student Education in the Department of Family and Social Medicine, Montefiore Hospital / Albert Einstein College of Medicine
Peggy Leggat, Green Cart Coordinator, NYC Department of Health and Mental Hygiene, Bureau of Chronic Disease, Prevention and Tobacco Control
Ben Thomases, Food Policy Coordinator, City of New York, Office of the Mayor (2007–2010)
Laurie M. Tisch, President, The Laurie M. Tisch Illumination Fund
86
86
Endnotes
1 McClellan, Mark B., et al. “Beyond Health Care: New Directions to a Healthier America.” The RobertWood Johnson Foundation’s Commission to Build a Healthier America: April 2009. 2 http://www.nyc.gov/html/doh/downloads/pdf/cdp/green_carts_presentation.pdf 3 New York City Department of Health and Mental Hygiene, "NYC Vital Signs," June 2003. 4 Libman, Kimberly and Nicholas Freudenberg. “Reversing the Diabetes and Obesity Epidemics in New York City.” City University of New York Campaign Against Diabetes and the Public Health Association of New York City: September 2007. 5 M. Kim, D. Berger, and T. Matte, “Diabetes in New York City: Public Health Burden and Disparities,” NYC Department of Health and Mental Hygiene, 2006. 6 See Bell, Judith et al. for a review of the research “Access to Healthy Food and Why it Matters: A Review of the Research.” Policy Link and The Food Trust. 2013 http://thefoodtrust.org/uploads/media_items/access-to-healthy-food.original.pdf 7 “Going to Market: NYC’s Grocery Store and Supermarket Shortage. New York City Department of Planning. 2008. http://www.nyc.gov/html/dcp/pdf/supermarket_access/presentation_2008_10_29.pdf 8 Diabetes: Evidence of Environmental Disparities”. American Journal of Public Health (2004), 94(9), 544. 9 The DOHMH conducts Community Health Surveys each year. Subsequent surveys have shown an increase in fruit and vegetable consumption in high poverty neighborhoods. However, it is difficult to attribute any single factor to this trend. 10 The report was informed by progress reports, field research, interviews with stakeholders (including vendors, customers, community partners, funders, and government agencies), and relevant literature. Original data was generated from a vendor survey and customer sample survey designed and fielded by a Columbia University’s School of International and Public Affairs (SIPA) research group, led by Professors Ester Fuchs and Sarah Holloway between June – December 2013. 11 http://www.nyc.gov/html/doh/html/living/school-nutrition.shtml 12 http://www.health.ny.gov/press/releases/2005/2005-10-19_activ8kids_campaign.htm and http://www.nyc.gov/html/doh/html/living/school-nutrition.shtml 13 http://www.nyc.gov/html/misc/pdf/fresh_zoning_text_amendment.pdf 14 http://www.nyc.gov/html/nycfood/html/shop/shop.shtml 15 http://www.cccnewyork.org 16 http://www.lmtilluminationfund.org/grants/food/nyc-green-cart 17 Interview with Ben Thomases, NYC Food Policy Coordinator, August 2013 18 Interview with Peggy Leggat, Green Cart Coordinator, NYC Department of Health and Mental Hygiene, August 2013 19 M. Kim, D. Berger, and T. Matte, “Diabetes in New York City: Public Health Burden and Disparities,” NYC Department of Health and Mental Hygiene, 2006. 20 Leggat, Margaret, Bonnie Kerker, Cathy Nonas, and Elliott Marcus. “Pushing Produce: NYC Green Carts Initiative.” Journal of Urban Health: Bulletin of the New York Academy of Medicine. June 9, 2012. 21 Interviews with Ben Thomases, NYC Food Policy Coordinator and Laurie M. Tisch, President, Laurie M. Tisch Illumination Fund August 2013 22 http://www.lmtilluminationfund.org/who-we-are/our-mission/ 23 http://www.applepushers.com + http://www.lmtilluminationfund.org/impact/green-carts 24 DOHMH Testimony before the City Council, February 27, 2008.
87
87
25 DOHMH Testimony before the City Council, February 27, 2008. 26 http://www.nyc.gov/html/doh/html/diseases/green-carts-apply.shtml 27 200% of the federal poverty level is $47,100 for a family of four. Families USA Poverty Guidelines 2013: http://www.familiesusa.org/resources/tools-for-advocates/guides/federal-poverty-guidelines.html 28 NYC Mayor’s Office Green Cart proposal and budget presented to the Laurie M. Tisch Illumination Fund, February 26, 2008. 29 Ibid. 30 Ibid. 31 According to Accion’s website typical interest rates for small business loans range from 10.99% - 15.99%. http://www.accioneast.org/home/small-business-loans/about-our-loans/loan-amounts-interest-rates-and-fees.aspx 32 NYC Mayor’s Office Green Cart proposal and budget presented to the Laurie M. Tisch Illumination Fund, February 26, 2008. 33 Third Annual Green Carts Report submitted to the Illumination Fund by the Mayors Fund to Advance NYC on behalf of the DOHMH and Karp Resources. January 2011. 34 Ibid. 35 http://www.karpresources.com/projects 36 Interview with Karen Karp, President, Karp Resources, September 2013. 37 NYC Mayor’s Office Green Cart proposal and budget presented to the Laurie M. Tisch Illumination Fund, February 26, 2008. 38 The Community Based Organizations were WHEDco (Bronx), Mary Mitchell Center (Bronx), Vamos Unidos (Bronx), Bed-Stuy Campaign Against Hunger (Brooklyn), Cypress Hills Local Development Corporation (Brooklyn), Bon Secours (Manhattan/Washington Heights), DRUM (Queens), Make the Road (Queens, Staten Island and Brooklyn), El Centro de Hospitalidad (Staten Island), or Project Hospitality, Street Vendor Project (All boroughs). 39 E-mail from Sam Marks, Vice President, Deutsche Bank Americas Foundation. June 2014. 40 Illumination Fund Press Release “Laurie M. Tisch Illumination Fund and the Mayor’s Fund to Advance NYC Announce Ten NYC Green Cart Community Grants to Organizations Citywide,” New York, NY April 13, 2012. 41 Foreign-born may be greater than 88 percent, as 12 percent of respondents answered “other”. 42 See Appendix E and F for complete frequency distributions. 43 The Bronx had an average nearest neighbor ratio of .64, (significant at the .003 level) 44 Brooklyn had an average nearest neighbor ratio of .94 (significant at the .05 level). 45 Manhattan had an average nearest neighbor ratio of .64 (significant at the .001 level) 46 Queens had an average nearest neighbor ratio of.74 (significant at the .05level) 47 The proximity to produce ranges from 0 to 5. The mean was 3.12 (S.D.=1.33). 1% had 0 outlets within 5 blocks and 1% had 4 outlets within 5 blocks. 48 See for example, Lucan, Sean C., Andrew Maroko, Renee Shanker, and William B. Jordan. “Green Carts in the Bronx—Optimally Positioned to Meet Neighborhood Fruit-and-Vegetable Needs?”Journal of Urban Health: Bulletin of the New York Academy of Medicine, Vol. 88, No. 5 2011. http://www.ncbi.nlm.nih.gov/pmc/articles/PMC3191209/ 49 Proximity to public housing represents dense areas of low-income New Yorkers. 50 NYCHA fact sheet http://www.nyc.gov/html/nycha/html/about/factsheet.shtml 51 Defined as making less than $23,850 a year for a family of four. 52 Defined as making less than $47,700 a year for a family of four.
88
88
53 Families USA 2013 Federal Poverty Guidelines: http://www.familiesusa.org/resources/tools-for-advocates/guides/federal-poverty-guidelines.html 54 Interview with Dr. William Jordan, Co-Director of Medical Student Education in the Department of Family and Social Medicine, Montefiore Hospital / Albert Einstein College of Medicine June 2013. 55 An active permit means that the cart has passed inspection OR, if the permit is older than two years, has passed re-inspection. Green Cart vendors have to renew cart permits every two years. 56 Lucan, Sean C., Andrew Maroko, Renee Shanker, and William B. Jordan. “Green Carts in the Bronx—Optimally Positioned to Meet Neighborhood Fruit-and-Vegetable Needs?”Journal of Urban Health: Bulletin of the New York Academy of Medicine, Vol. 88, No. 5 2011. http://www.ncbi.nlm.nih.gov/pmc/articles/PMC3191209/ 57 Each neighborhood was visited only once. More than one visit might have yielded a greater number of vendors and Green Carts. 58 The response rate would have been higher but for one extremely cold day where the response rate was 53 percent. 59 Rundle, A. K., M. Neckerman, L. Freeman, G.S. Lovasi, M. Purciel, M., J. Quinn, C. Weiss,. Neighborhood food environment and walkability predict obesity in New York City. Environmental Health Perspective, 117, 442–447. 2009. 60 http://www.referenceusa.com 61 Reports to the NYC City Council on Green Carts FY2008-2009, FY2010, FY 2011. Submitted by the NYC DOHMH; NYC Green Cart reports to the Illumination Fund submitted by the Mayor’s Fund to Advance NYC on behalf of DOHMH and Karp Resources 2008-2013. 62 NYC Green Carts 2012 Proposal submitted by the Mayor’s Fund to Advance NYC on behalf of the DOHMH and Karp Resources to the Illumination Fund to extend grant funding. 63 NYC Green Cart Report January 2013 report submitted to the Illumination Fund by the Mayors Fund to Advance NYC on behalf of the DOHMH and Karp Resources. 64 DOHMH Green Carts Report and Evaluation Questionnaire response to Illumination Fund, January 26, 2011. 65 NYC Green Carts 2012 Proposal submitted by the Mayor’s Fund to Advance NYC on behalf of the DOHMH and Karp Resources to the Illumination Fund to extend grant funding. 66 “Green Cart Implementation: Year One”. Citizens Committee for Children. September 2010. 67 Lucan, Sean C., Andrew Maroko, Renee Shanker, and William B. Jordan. “Green Carts in the Bronx—Optimally Positioned to Meet Neighborhood Fruit-and-Vegetable Needs? ”Journal of Urban Health: Bulletin of the New York Academy of Medicine, Vol. 88, No. 5 2011. 68 http://www.nyc.gov/html/doh/html/data/survey.shtml

420 West 118th Street New York, NY 10027
www.sipa.columbia.edu