Embed Size (px)
Citation preview

ABSTRACT
This article has been adapted from the paper that was published in the proceedings of IX PIANC-COPEDEC conference in October 2016. It is reprinted here with permission.
Located in an inlet between Bages-Sigean lagoon and Mediterranean coast, Port-La Nouvelle harbour is home to a very complex hydro-sedimentary dynamics. In order to study it accurately, a package of five interacting hydro-sedimentary numerical models was developed. The package consisted of: a wave transformation model; a tridimensional hydrodynamic model; a model for the siltation of cohesive sediments within the harbour; a model for morphodynamic calculation of sandy sea bed in the short (1 year) and medium (10 years) terms; and a coastline evolution model. This article presents the methodology that combines the five models in order to handle the hydro-sedimentary issues and assess the impacts of a major port extension project.
INTRODUCTION
There are numerous examples across the globe that attest to environmental damages and detrimental economic consequences that
coastal developments can potentially cause if they are not carefully designed.
In order to ensure the sustainability of a development project, Environmental and Social Impact Assessments (EISA) are carried out. These assessments aim at reducing project impacts on hydrodynamics, sedimentary dynamics, sea bed and coastline evolutions at different stages of the project. During construction phase there is an assessment of dredging work impact. In the short-term following construction an assessment of impacts on hydrodynamics, maintenance dredging, bed evolution in vicinity of the project are carried out. In the long-term the assessment is aimed at bed evolution in a larger geographic scale and coastline evolution within a radius of several kilometres around the project.
To achieve such goals, engineering studies use numerical modelling as a key tool. Indeed, recent informatics improvement and increasing knowledge thanks to applied coastal research make numerical modelling more and more efficient.
Various numerical tools have been and are being developed for the need of different studied purposes and scales. Even if the tools are becoming increasingly sophisticated, the accuracy and reliability of modelling strongly depend on available data for calibration and the good knowledge of their limits and their validity domain. Furthermore, a user’s awareness is the guarantee of a successful numerical study.
This article highlights the strong and proven methodology based on numerical models that fulfilled requirements of the impact study carried out regarding a major port extension project in the French Mediterranean coast – Port-La Nouvelle harbour .
CONTEXT AND OBJECTIVES Port-La Nouvelle harbour is located (Figures 1 and 2) at the mouth of an inlet that links a lagoon system (Bages-Sigean lagoon) to the French Mediterranean Sea. It is a micro tidal environment exposed to waves and is home to a very complex hydro-sedimentary dynamics conditioning a highly tenuous ecosystem balance. An extention development project of the present harbour is currently under consideration (Figure 3).
Thus, the harbour’s owner, Languedoc Roussillon Midi Pyrenees region, entrusted ARTELIA with a hydro-sedimentary impact
INNOVATIVE MODELLING: A TOOL FOR COASTAL DEVELOPMENTS
Above: An illustration of the new expansion project in
Port-La Nouvelle harbour. A new numerical hydro-
sedimentary modelling package was developed to
assess project impacts.
Innovative Modelling: A Tool for Coastal Developments 21
AURELIE LE DISSEZ, ERIC LAGROY DE CROUTTE AND RÉGIS WALTHER

study. In order to assess the project’s impact on its environment and to optimise the design so as not to jeopardise the natural hydro-sedimentary balance in the area, ARTELIA developed an efficient methodology based on a system of interacting models. This included a wave transformation model; tridimensional (3D) numerical models for hydrodynamic; sediment transport and morphodynamic calculations; a unidirectional (1D) coastline evolution model; and a comprehensive six-month measurement campaign that enabled a satisfying calibration of the numerical tools and ensured their high-quality. This article presents this methodology, particularly relevant for studying development projects in such complex coastal areas.
There were multiple objectives for the impact study. They were: • studying the present hydro-sedimentary
dynamics and recent coastline evolutions would give a better understanding of the local processes;
• forecasting this dynamics in the close future considering harbour extension and assessing short-term impacts on hydraulic exchanges between the lagoon and the sea, on mud deposit within harbour basins and on dredging operations; and
• forecasting short- and mid-term project impacts on offshore morphodynamics (seaward from the surf zone) and mid- and long-term impacts on coastline evolution (ashore of the surf zone).
PHYSICAL CONTEXT OF A COMPLEX SITESite conditionsThe Port-La Nouvelle harbour is home to a very complex hydro-sedimentary dynamics conditioned by the following natural forcings of equal importance.
• Semi-diurnal tides (two high tides each day), which range reaches 0.3m during spring tide. Sea levels strongly depend on atmospheric conditions. Languedoc shoreline experiences surges due to a combination of low pressure and strong wind: sea level can reach 0.4m Chart Datum (CD) during annual storms and 0.8m CD during 100-year storms.
• In the maritime domain: global and tidal currents are slight within the Languedoc
22 Terra et Aqua | Number 147 | June 2017
Figure 1. Localisation of the study
area in Mediterranean coast, France
Figure 2. (a) The port entrance and (b) the
Bages-Sigean lagoon.
Figure 3. (a) The current harbour and (b) the development project.
b
a
Innovative Modelling: A Tool for Coastal Developments 23
coastline. Surface currents when generated by well-settled winds can reach 2 to 3% of the mean wind intensity (about 0.2 to 0.3 m/s during strong wind period). Littoral drift, generated by waves within the surf zone only affects shallow waters where water depth is less than 5m. Depending on wave obliquity, oscillating around the normal to the shoreline, wave currents alternatively go northward or southward. Current measurements at 10m depth within maritime domain shows that: velocities barely exceed 0.2 m/s; and maximum velocities are comprised between 0.5 and 1 m/s.
• In port channel: currents are alternative but tend to go seaward due to terrestrial runoff drained into the lagoon (Fremer, 2012). During the measurement campaign (2012-13 in the project study), a phenomenon of lagoon emptying was recorded, simultaneously to tramontane period, which was preceded by lagoon filling concomitant with the beginning of eastern wind events. These exchanges between Bages lagoon and the sea are carefully observed by scientists that study the highly tenuous ecosystem balance of the lagoon in order to prevent its deterioration.
• Globally within the Gulf of Lion, rough sea occurs about 50 days per year, usually in October/November and from January to April. In front of Port-La Nouvelle, the obliquity of incident wave is small. Sea states for wave height (Hs>0.5m) indicate two main directional sectors: Eastern E sector (from 80 to 110°N) and South-Eastern SE sector (from 170 to 130°N) ; strongest sea states (Hs>2.5m) essentially come from East (from 80 to 110°N) ; wave climate indicates a frequency of wave height exceeding 2m that equals to 4% over a year.
• Winds over Languedoc littoral are characterised by two predominant regimes: Tramontane wind, coming from NW to W sector (that can be particularly strong); and Marin wind, coming from E to SE.
• Recorded rainfall is mean annual cumulating of 600mm and an interannual variation of +/- 200mm (CATALIOTTI, 1982). The Languedoc region is prone to short and intense bouts of rainfall. Per day it can receive the equivalent of half the annual rainfall – such events strongly affect hydraulic exchanges between Bages lagoon and the sea.
Bages inlet, where Port-La Nouvelle harbour is settled, is a unique connection to the sea of the Bages-Sigean lagoon (average area of 3 700 ha, mean water depth of -1.5 m). It experiences possibly important oscillating water discharges during storm event. Tide generates twice a day oscillating discharges from -75 to +75 m3/s. Net balance tends slightly seaward.
On each side of Port-La-Nouvelle, the littoral is marked by port developments and inlets (natural or artificialised). Outside port areas, coastline and sea bed morphology are quite uniform over the littoral, i.e.:
• relatively wide sandy beach, bordered by small dune ridges;
• seabeds are relatively cylindrical in front of Port-La-Nouvelle, characterised by gentle slope (mean slope less than 1%) in shallow water to depths of up to 12 or 13m. For depths greater than 13m, slope reaches 2.5%; and
• two off-shore bar systems, the first one settled by 2 to 4m depth, the second one by 5 to 7m depth.
The sedimentary cover is made of silt in lagoon (D50 of 20 to 50µm) with more than 50% of mud. Within port basins, the content of mud reaches 70%, decreasing seaward along the inlet to become negligible in entrance channel. Within the marine domain, granulometry distribution shows a decreasing gradient from the band between beach and 20m depth where seabed surface is compounded of fine to medium sands, to the offshore where seabed becomes very muddy beyond 30m water depth.
Potential impacts of the projectAs seen on Figure 3, the project plans to create a new port basin that requires the construction of two breakwaters. The roundhead of the main breakwater will be 1km further offshore than the current one, reaching the depth of -13m CD. The current breakwater is settled by 9m depth.
The potential impacts of such a project, which needed evaluating were the following:• the modification of the exchanges between
the lagoon and the marine domain that could consequently jeopardise the precarious lagoon balance ;
• the modification of the interception of the littoral drift, with consequences on shoreline position around the project, causing possibly shoreline erosion and/or accretion phenomena;
• an increase of maintenance dredging needs; and
• the disturbance of the seabed located further offshore from the closure depth.
METHODOLOGY BASED ON COMBINED NUMERICAL MODELSIn order to reproduce current local complex hydro-sedimentary dynamics to predict the environmental impacts of the project, five interacting hydro-sedimentary numerical models were developed using TELEMAC modelling system and UNIBEST-CL+ software:
• a two-tridimensional (2D) wave transformation model;
• a three-tridimensional (3D) hydrodynamic model;
• a 3D model for the siltation of cohesive sediments within the inlet and harbour basins;
• a 3D model for morphodynamic evolution of sandy sea bed in short (1 year) and medium (10 years) terms; and
• a 1D model for long-term coastline evolution.
Each one of the five numerical tools has its own goals and validity domain. The combination of the five models allowed for the possibility to handle all the issues that were raised by the project needs and to assess potential impacts. This powerful integrated modelling package as well as the modelling softwares used for the development of the various interacting models will be presented in the following subsection.
The five numerical tools comprising the integrated package will be presented in more details: their goals, their calibration/validation phase ensuring model reliability and accuracy, their contributions to a better understanding of the local complex hydrodynamics and to the impact study.
Presentation of the methodology Figure 4 shows the five numerical models; forcings; expected outcomes and time scales;

24 Terra et Aqua | Number 147 | June 2017
and the modelling system used for their implementations. It is also shows how the models are linked together. It is complemented by the next scheme presented on Figure 5 that defines application domain of each model.
The first model of wave transformation aims at performing a 4D wave database for the need of the next modelling.
The second is the 3D hydrodynamic model, which uses TELEMAC modelling system. This model aims at reproducing the complex hydrodynamics all over the study area. It takes into account: sea level variations due to tide and weather conditions, global currents, waves’ radiation stresses that are introduced to hydrodynamics calculation, wind, rainfall and evaporation. This model not only allows for a better understanding of the local phenomena but also enables to assess future port impacts on sea-lagoon hydraulic exchanges and on navigation conditions in entrance channel (short-term predictions).
Furthermore, it provides crucial inputs for the three other models.
The 3D siltation model (hydrodynamics calculated by the 3D hydrodynamic model) is imposed at its limits – the port entrance channel seaward and the lagoon entrance
landward. The siltation model using TELEMAC modelling system aims at reproducing mud deposition equal to mean annual dredged volumes by considering measured ambient turbidities within the marine domain at one side and within the lagoon at the other side. Once calibrated, the model assesses future port impacts on maintenance dredging needs in the future port and gives short-term predictions.
The 3D multi-class morphodynamic model is fully coupled with the 3D hydrodynamic model. Undercurrent and waves actions, sand transport and seabed evolutions are computed and transposed in hydrodynamic model to calculate consecutively modified currents and waves on the next iteration. The morphodynamic model uses TELEMAC modelling system. It considers non-cohesive sediments (four classes of sand), its application domain is the marine domain for water depths greater than 5m, i.e. outside the surf zone. In addition, this model is expected to assess project impact(s) on the seabed in short- and mid-term.
The evolutions of the shallower area in the marine domain are assessed by the coastline evolution model using UNIBEST-CL+ software. Wave climates propagated by TOMAWAC for the needs of the 3D hydrodynamic model provide inputs at closure depth.
The 1D coastline model aims at reproducing historical shoreline positions for predicting the future evolutions of coastline by taking or not taking the project into consideration. Thus, the model can assess the potential project impacts on shoreline in mid- and long-term.
What is the TELEMAC system? The TELEMAC-MASCARET system is a powerful integrated modelling tool for use in the field of free-surface flows. Having been used in the context of several hundred studies to date throughout the world, it has become one of the major standards in its field.
TELEMAC has numerous applications in both river and maritime hydraulics. The system was developed by the Laboratoire National d’Hydraulique, a department of Electricité de France’s Research and Development Division. It is now available as open source, and is developed by the Open Telemac-Mascaret Consortium, of which ARTELIA is a member.
The various simulation modules use high-capacity algorithms based on the finite-element method. Space is discretized in the form of an unstructured grid of triangular elements, which means that it can be refined particularly in areas of special interest. This avoids the need for systematic use of embedded models, as is the case with the finite-difference method.
For the needs of the present study, the three following modules were used:
• TELEMAC-3D module is carried out for simulating the dynamics of free-surface three-dimensional flows. It calculates velocity fields, pressures and the scalar quantities transported (temperature, salinity, sediment, etc.) on a non-structured mesh. The module solves the three-dimensional hydrodynamics equations (hydrostatic and non-hydrostatic Navier-Stokes equations in laminar or turbulent conditions) and the transport-diffusion equations for tracers and sediment, using finite element or finite volume-type methods (Hervouet, 2003). It can be used to study the dynamics of numerous physical phenomena that includes propagation of long waves (tides, tsunamis, etc.); river or torrential flows; foreshores and flood-prone areas; Coriolis force; and point sources of
Figure 4. The five numerical models; their forcings; expected outcomes and time scales; the modelling system used
for their implementations; and the linkages.

momentum. Furthermore, the model offers a set of subroutines that are easy to modify in line with the specific requirements of each
study such as imposing baseline conditions or complex boundary conditions; introducing new processes or coupling with other modelling systems.
• Wave propagation within the computational domain for inputs in 3D hydrodynamic model is performed by TOMAWAC module (Benoit, 1996). TOMAWAC models the generation of sea states and their propagation from the deep sea to the coastal zone. It calculates spatial and temporal variations in the frequency and direction of wave propagation. It can also process a wide range of complex conditions from ocean swell to wind seas. It is a comprehensive resource available for modelling coastal sea states with a view to optimizing and ensuring the safety of coastal and maritime developments. TOMAWAC provides a detailed description of the spectral and angular distribution of wave energy and solves the conservation equations on a non-structured grid. On the basis of the directional wave energy spectrum, TOMAWAC calculates the characteristics of the sea state: spectral significant wave height, mean direction of origin, mean and peak frequencies, radiation stresses that are provided to TELEMAC-3D module for wave-induced current calculation;
• SISYPHE module is carried out to handle seabed evolution issues. It is used to
compute suspended sediment and bed-load transport under the action of currents and/or waves. The software calculates bed and sediment concentration variations at each point of the grid. SISYPHE solves the bed variation equation (Eckner equation) on a non-structured grid. Suspended and bed-load sediment transport is calculated using various formulations; for the study the Soulsby-Van Rijn equation (Soulsby, 1997) was used. Sediment may consist of sand (wide particle size range), mud or a sand/mud mixture. The software is especially well-suited to studies regarding some of the following topics: morphological bed variations; sediment transport; dispersal of dumped sediment under wave or current action; and management of approach channels to river or maritime facilities. Based on the coupled sedimentology principle, SISYPHE can directly process the hydrodynamic results obtained with TELEMAC-3D (internal or external coupling). It can also use wave transformation data obtained with the TOMAWAC module. For the current study, SISYPHE enabled to study the following phenomena: wide particle size ranges (several sediment classes), spatial distribution of erodible and non-erodible beds, factors that lengthen sedimentary
AURELIE LE DISSEZ
is specialised in complex marine and
river modelling, with a PhD in numerical
coastal hydrodynamics. Aurélie has
developed experience and knowledge at
theoretical, numerical and field levels. She
has worked on a diverse range of industrial
and research projects. Notably, she has
experience in in modelling hydrodynamics
in shallow bays, sedimentology and
modelling of dredging plume dispersion.
She contributed to the TELEMAC-
MASCARET module development.
RÉGIS WALTHER
is specialised in the fields of hydraulics
and complex modelling. He works
on hydraulic, water quality and
sedimentological studies in maritime,
estuarine and fluvial environments. He has
expertise in national and internationally
renowned hydro-sedimentological
processes, most notably in an estuarine
context. He brings his considerable
experience to bear on the implementation
and monitoring of measurement
campaigns and complex modelling studies.
He also acts as an advisor to project
managers and owners, and oversees
associated research and development
projects.
ERIC LAGROY DE CROUTTE
Is specialised in harbour development
and coastal protection schemes. Eric has
a high-level of expertise in studies of
longshore drift, erosion phenomena and
sedimentation. He has carried out in-situ
assignments, collection and analysis
of natural data; coastal ecosystem
rehabilitation; coastal expert appraisals
(harbours and beaches); impact
assessments; and hydro-sedimentary
studies of estuaries, lagoons and bays
and studies using physical scale and
numerical models.
Innovative Modelling: A Tool for Coastal Developments 25
Figure 5 shows the application domains of the five numerical modules. The blue area represents the application
domain of the wave transformation model and the 3D hydrodynamic model. The green area represents the siltation
model. The orange area represents the application domain of the morphodynamic module for sandy seabed deeper
than -5 m IGN69. The yellow area shows the shoreline evolution module.

26 Terra et Aqua | Number 147 | June 2017
processes for long-term simulations, influence of waves, and sediment slippage due to slope effects.
The UNIBEST-CL+ softwareThe numerical simulation module UNIBEST-CL+ used in the present study belongs to the UNIBEST software (Uniform Beach Sediment Transport) suite. The Longshore Transport sub-module (LT-module) computes tide and wave induced longshore currents and resulting sediment transport for a specific cross-shore beach profile assuming that the beach profile is uniform in alongshore direction. The CoastLine module (CL-module) simulates coastline changes due to longshore sediment transport gradients of an alongshore (nearly) uniform coast. Along the modelled coastline, sediment sources and sinks may be defined at any location. In addition, morphological impacts of various coastal engineering developments such as breakwater, groynes, coastal revetments and seawalls, artificial sand by-pass systems and beach nourishments can be studied.
WAVE TRANSFORMATION MODEL: REQUIREMENTS AND CONTRIBUTIONSThe method chosen for integrating longshore currents in the 3D hydrodynamic model consisted of first establishing a database of wave propagation fields. This database provided radiation stresses that enable the computation of longshore current in the surf zone.
The database was performed with preliminary 3,159 simulations using TOMAWAC module by considering the following conditions.
• Sea level varying from -0 to +1.6m CD considering a step of 0.2m.
• Wave directions: 60, 75, 90, 105, 120, 135, 150, 165, 180 °N
• Couple period Tp - height Hs as below :- Tp = 3s with Hs = 0.5, 1.0, 1.5 and 2.0m- Tp =5s with Hs= 0.5, 1.0, 1.5, 2.0 and
3.0m- Tp =7s with Hs= 0.5, 1.0, 1.5, 2.0, 3.0, 4.0
and 6.0m- Tp =9s with Hs= 0.5, 1.0, 1.5, 2.0, 3.0, 4.0
and 6.0m- Tp =11s with Hs= 0.5, 1.0, 1.5, 2.0, 3.0,
4.0, 6.0 and 8.0m- Tp =13s with Hs= 0.5, 1.0, 1.5, 2.0, 3.0,
4.0, 6.0 and 8.0m
According to the sea level and the wave condition considered at the offshore limit of the hydrodynamic model, the 4D wave database provides wave characteristics and radiation stresses at each calculation node of the 3D hydrodynamic model.
Due to comparisons of TOMAWAC results with wave measurements carried out during six months in 2013 at different locations of the calculation domain (Figure 8), the wave transformation model was validated. The comprehensive database was then used by:
• the 3D hydrodynamic model for longshore current integration;
• the multiclass morphodynamic model for shear stress calculation due to the combined action of currents and waves; and
• the coastline evolution model for implementation of input conditions.
3D HYDRODYNAMIC MODEL: REQUIREMENTS AND CONTRIBUTIONSThe first objective of the 3D hydrodynamic model was to accurately reproduce the complex hydrodynamics described in the previous section to enable a better knowledge of the circulation in vicinity of the current port. Hydrodynamic measurements were carried out for six months, which allowed for a good calibration of the model. Subsequently, the model utilised the project configurations to chart the current fields that occur over the studied area under five characteristic scenarios of hydro-meteocean conditions.
Model methodologyFigure 6 presents the modelling methodology that led to the model implementation and exploitation. It also summarises the inputs and outputs of each stage of the modelling process.
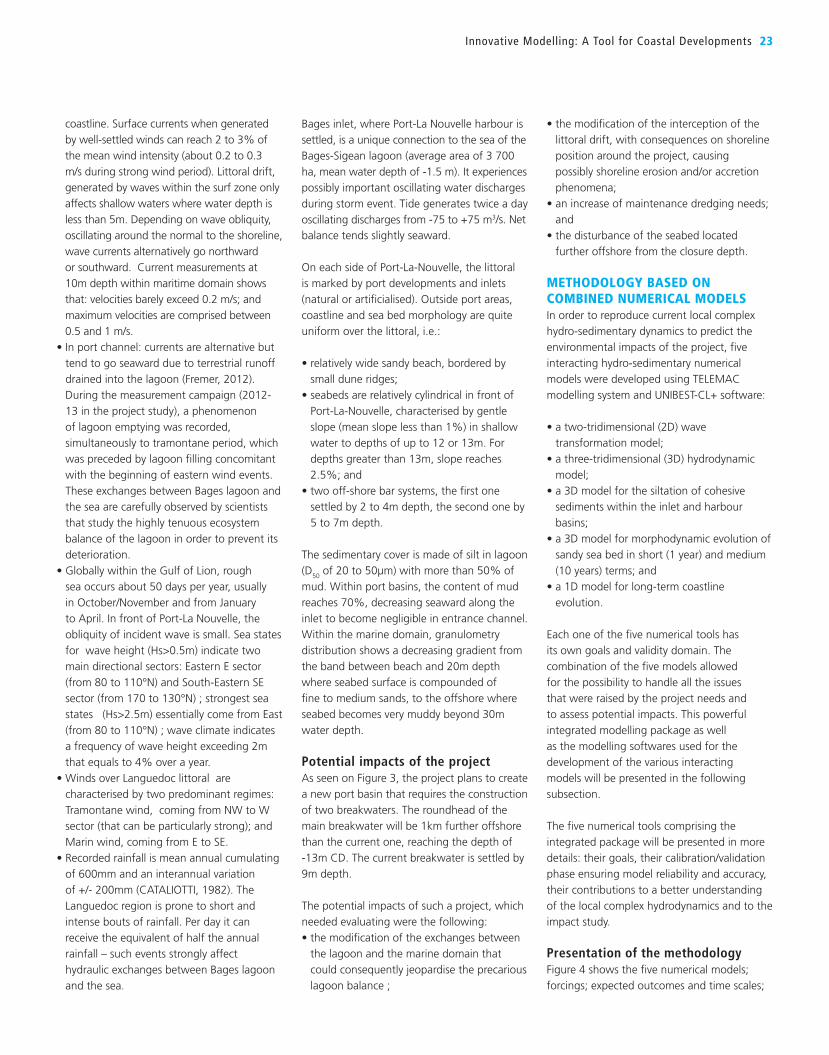
Model constructionThe marine domain for the model was 30km long and 10km wide that included the Bages-Sigean Lagoon and its linking inlet. The model’s extent was chosen in order to take into account the following: respective contributions of waves; meso-scale water circulations; wind effect on free surface slopes; rainfall intakes; and evaporation to local dynamics. Mesh was refined within the inlet and surf zone so as to accurately calculate hydraulic sea-lagoon exchanges and wave-induced current. Figure 7 shows the extent, the mesh and the digital elevation model for the current port configuration.
Model calibrationIn order to provide relevant data set for its calibration, a major field campaign of hydrodynamic measurements was conducted by Creocean (Waeles, 2015). Six acoustic Doppler current profilers were deployed for six months to measure waves and currents and characterise circulation patterns of the water masses of the area from the offshore
Figure 6. Methodology of 3D hydrodynamic modelling
Innovative Modelling: A Tool for Coastal Developments 27
to shallow depths. Water exchanges between the sea and Bages-Sigean lagoon were also measured with a current profiler located within the inlet. Pressure sensors measured the water levels slopes between the inlet and the sea. Various metocean conditions were recorded and all these data were used to calibrate and validate wave and current models of the area. Due to a wide range of forcings, the hydrodynamic model results were in concordance with measurements in terms of wave propagation, offshore currents, littoral drift, and hydraulic exchanges between the lagoon and the sea for calm weather conditions and for stormy events.
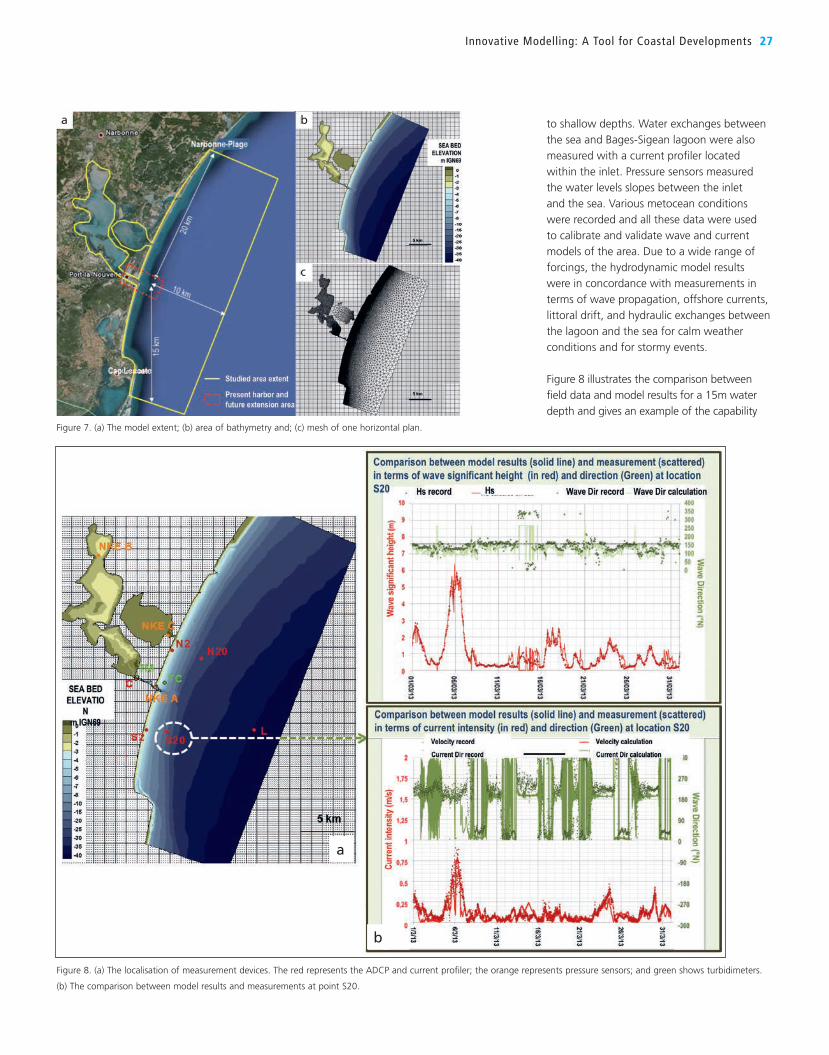
Figure 8 illustrates the comparison between field data and model results for a 15m water depth and gives an example of the capability
Figure 7. (a) The model extent; (b) area of bathymetry and; (c) mesh of one horizontal plan.
a b
c
Figure 8. (a) The localisation of measurement devices. The red represents the ADCP and current profiler; the orange represents pressure sensors; and green shows turbidimeters.
(b) The comparison between model results and measurements at point S20.
b
a
28 Terra et Aqua | Number 147 | June 2017
of the model to reproduce wave and current fields for a wide range of hydro-metocean conditions. The average deviation between sea level calculations and measurements is less than 4cm except for an exceptional event, and average deviation for nearshore currents is less than 0.02 cm/s except during a 10-year
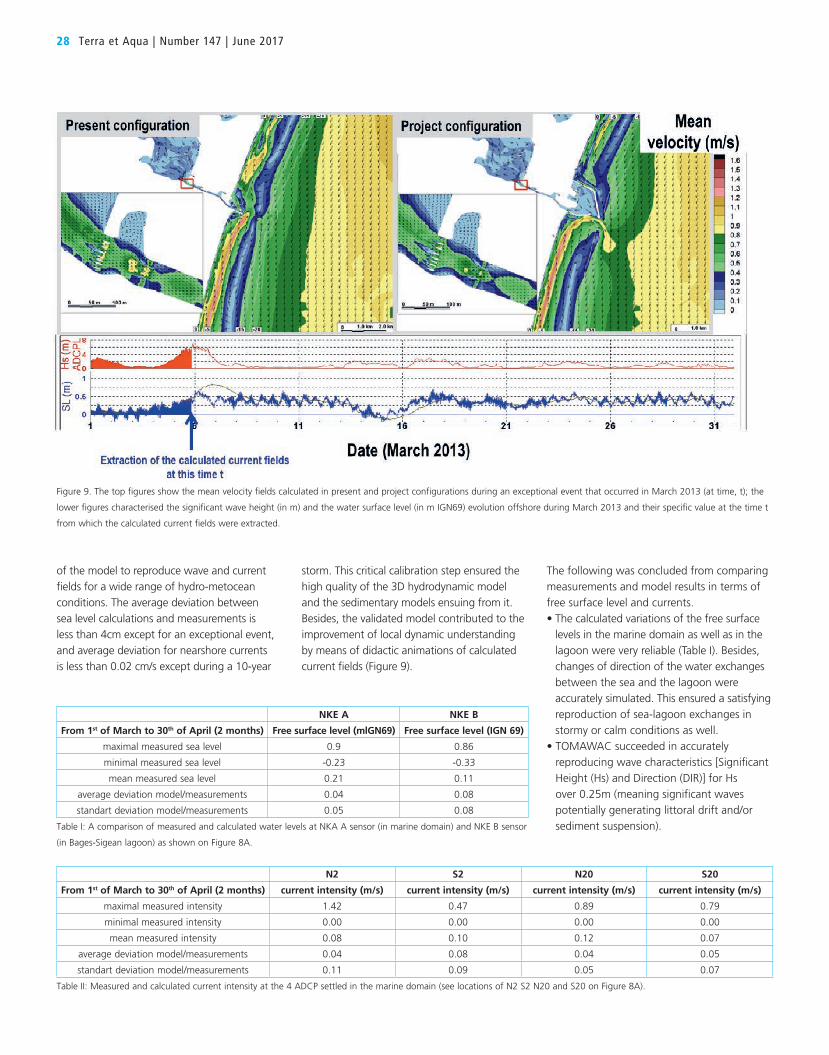
storm. This critical calibration step ensured the high quality of the 3D hydrodynamic model and the sedimentary models ensuing from it. Besides, the validated model contributed to the improvement of local dynamic understanding by means of didactic animations of calculated current fields (Figure 9).
The following was concluded from comparing measurements and model results in terms of free surface level and currents.• The calculated variations of the free surface
levels in the marine domain as well as in the lagoon were very reliable (Table I). Besides, changes of direction of the water exchanges between the sea and the lagoon were accurately simulated. This ensured a satisfying reproduction of sea-lagoon exchanges in stormy or calm conditions as well.
• TOMAWAC succeeded in accurately reproducing wave characteristics [Significant Height (Hs) and Direction (DIR)] for Hs over 0.25m (meaning significant waves potentially generating littoral drift and/or sediment suspension).
Figure 9. The top figures show the mean velocity fields calculated in present and project configurations during an exceptional event that occurred in March 2013 (at time, t); the
lower figures characterised the significant wave height (in m) and the water surface level (in m IGN69) evolution offshore during March 2013 and their specific value at the time t
from which the calculated current fields were extracted.
Table I: A comparison of measured and calculated water levels at NKA A sensor (in marine domain) and NKE B sensor
(in Bages-Sigean lagoon) as shown on Figure 8A.
Table II: Measured and calculated current intensity at the 4 ADCP settled in the marine domain (see locations of N2 S2 N20 and S20 on Figure 8A).
NKE A NKE B
From 1st of March to 30th of April (2 months) Free surface level (mlGN69) Free surface level (IGN 69)
maximal measured sea level 0.9 0.86
minimal measured sea level -0.23 -0.33
mean measured sea level 0.21 0.11
average deviation model/measurements 0.04 0.08
standart deviation model/measurements 0.05 0.08
N2 S2 N20 S20
From 1st of March to 30th of April (2 months) current intensity (m/s) current intensity (m/s) current intensity (m/s) current intensity (m/s)
maximal measured intensity 1.42 0.47 0.89 0.79
minimal measured intensity 0.00 0.00 0.00 0.00
mean measured intensity 0.08 0.10 0.12 0.07
average deviation model/measurements 0.04 0.08 0.04 0.05
standart deviation model/measurements 0.11 0.09 0.05 0.07

Innovative Modelling: A Tool for Coastal Developments 29
• In the marine domain, the T3D model succeeded in accurately reproducing the currents at intermediate depth of 20m (Table II). In shallow water depth (within the surf zone), the hydrodynamic trend was reproduced quite well, especially the alternative directions of the longshore current that was accurately reproduced despite the complexity of the area. But the average deviation on current intensity remained high in the surf zone as the 3D hydrodynamic model considered a hard bottom for the calibration phase (no morphodynamic coupling at this stage). This is a strong assumption in the surf zone during a storm event when the seabed is easily modified. This was actually not prejudicial, as the consecutive calculated morphodynamics was calibrated during a second time.
Model exploitationThe next step consisted of defining five representative hydro-meteorological conditions and their annual occurrences, in order to calculate corresponding hydrodynamics under current and future configuration (with harbour extension). For each scenario, cartographies of instantaneous, maximal, residual currents were provided in present and project configurations. They allowed for understanding the hydrodynamics processes within the inlet, surf zone and offshore depending on wind, sea level, wave, rainfall conditions. The cartographies also helped to quantify transverse currents in the future port entrance channel.
Project impact on hydrodynamicsThe results from the comparisons between present and future configurations gave a look into the potential project impacts on hydraulics and coastal hydrodynamics. One could imagine that the hydraulic exchanges between the lagoon and the sea might be jeopardised by the major port extension. The model concluded that project will have a very slight impact on the hydraulic exchange and only during stormy events (ten-year event). It showed that during such events the sea level remains greater than the level of the lagoon surface during few consecutive days. This situation generates unilateral flows from the sea to the lagoon whereas in normal weather conditions, direction of flows
Figure 10. Methodology of 3D siltation modelling
Figure 11. Results of calibration phase of 3D siltation model.

30 Terra et Aqua | Number 147 | June 2017
Model constructionThe model extent was limited to the inlet and port basin area. The previous mesh was cut and bathymetry within the port was adapted to take into account the dredging ceiling provided by port authorities in charge with maintenance dredging.
Model calibrationThe calibration consisted of calculating deposit volumes of a close approximation of measured average annual dredged volumes for one year. The six-month 3D hydrodynamics calculated by the previous model and corresponding Suspended Solid Concentration (SSC) rates recorded during the measurement campaign were taken into account while setting limit conditions. Figure 11 shows the comparison made between mean mud volumes dredged and deposit volumes calculated during a six-month period. Considering Partheniades coefficient = 2.10-3 (kg/m2/s) (Partheniades, 1965), threshold shear stress for motion of fine particle = 0.5 Pa, fall velocity = 0.00085 m/s, suspended matter concentration in marine domain = 0.012g/l, the deposit volume resulting from the six-month simulation represented 97% of the mean volume of dredged mud in half a year.
Model methodologyFigure 10 presents the modelling methodology that shows model implementation and exploitation, and summarises inputs and outputs of each stage of the modelling process.
switches according to the tide, twice a day. In the project configuration, the presence of the new large port basin tended to slightly slow down the lagoon filling as shown on Figure 9.
In the nearshore domain, as expected, wave-induced currents will be modified by the future breakwaters, but the impact will be very local, as shown by the model results. In order to reduce transverse currents that appear within entrance channel for rough sea conditions, its design was slightly modified.
As a conclusion, the efficient 3D hydrodynamic model succeeded in demonstrating the very slight impact of the extension project on the lagoon, the inlet and the coastal hydrodynamics. This was done by assessing its extent and characterising its return period. As a consequence, the results already indicated that the impacts on sedimentary dynamics will also be limited.
3D SILTATION MODEL FOR COHESIVE SEDIMENTS: REQUIREMENTS AND CONTRIBUTIONSThen 3D model for deposit calculation of cohesive sediments was developed by solving suspended transport for one cohesive sediment class (mud) directly in TELEMAC3D.
Figure 12. Methodology of morphodynamic modelling
Figure 13. Results of exploitation phase of the morphodynamic model in present configuration.

Innovative Modelling: A Tool for Coastal Developments 31
graded granulometry in marine domain of the model.
The six-month hydrodynamic forcings recorded from 21/02/2013 to 15/08/2013 were imposed as boundary conditions (sea levels, currents, wave, wind, rainfall). In order to make these forcings representative of in situ long-term conditions, simulated evolutions were weighted by statistics on in situ wave data.Practically, evolutions which were calculated at each iteration, were multiplied by a morphodynamic factor defined thus: Morphodynamic factor = Occurrence of wave forcing for the period that has to be simulated (1 or 10 years) / Occurrence of the wave forcing really simulated (the 6 month-measurement campaign) x Length of the period that has to be simulated / Length of the period that is really simulated
Model calibrationThe calibration was based on average annual volumes of sand dredged within the present entrance channel (short-term) and the analysis of natural bathymetric evolutions observed during two periods of 30 years and three years (medium-term). Morphodynamic factors of 1.8 and 18 were used in this calibration exercise.
250 µm; between 250 µm and 500 µm; and greater than 500 µm.
This analysis led to the definition of a mean rate of each class. The mean mixture was composed of 15% of 94 µm-diameter grain D1, 63% of 190 µm-diameter grain D2, 20% of 375 µm-diameter grain D3, 2% of 900 µm-diameter grain D4. Then a preliminary calculation was undertaken in order to initialise spatial distribution of
Model exploitationOnce calibrated, this model contributed to increased sediment dynamic understanding within the inlet and present harbour basins. Furthermore, the model helped to assess the impact(s) of the extension project on maintenance dredging operations.
Project impact on dredging maintenance needsThe project will have a slight influence on deposition within the upstream part of the inlet, from the lagoon to the oil basin – the future dredged volume will be slightly lesser than what is current. Within the new basin, deposition was assessed, in coherence with current deposition rates within stilling basin.
MULTICLASS SEDIMENT MODEL FOR MORPHODYNAMIC CALCULATION OF SANDY SEA BED: REQUIREMENTS AND CONTRIBUTIONSThis third model coupled 3D hydrodynamic model with sedimentary module SISYPHE (TELEMAC system) that solved sediment transport for graded granulometry (Figure 12).
Model constructionSamples of sandy sea bed collected from marine domain in vicinity of the current port were analysed. They provided spatial variation of granulometric compositions in terms of volumetric percentage of the four following sediment classes: grain diameter between 63 µm and 125 µm; between 125 µm and
Figure 14. Methodology of coastline evolution modelling.
Figure 15. (a) Extent of the coastline evolution model (from Cap Leucate to Port Saint Pierre Sur Mer) and location of
the wave conditions inputs; (b) A detailed look at the spatial discretisation of coastline evolution model at Port-La
Nouvelle: accretion or recession of the shoreline was calculated at each blue point.
a b

32 Terra et Aqua | Number 147 | June 2017
Model exploitationOnce calibrated, this model was used to calculate 1-year and 10-year seabed evolutions consecutively in present and project configurations with morphodynamic factors of 0.6 and 6 respectively (Figure 13).
There are two things to note regarding the integrated model – it is not adapted to reproduce scour that potentially occurs at foot of the breakwaters. Anti-scouring protections have to be designed using empirical abacus or physical modelling. In addition, it is not suitable for very shallow sea bed and shoreline evolution. That is why the integrated model was completed with a shoreline evolution model dedicated for the coastal line, calculating the littoral drift generated by the waves and its mid- and long-term consequences on the shoreline.
Conclusion in terms of project impact on offshore seabed morphodynamicsThe comparisons between results in present and project configurations allowed for the assessment of the impact(s) of the extension project on sandy sea bed in vicinity of future harbour facilities and nearby conservation areas.
The following were concluded:• except in the proximity of the harbour,
simulated morphodynamic patterns were very similar in current and project configurations;
• 1-year impacts of the project were not significant on the marine sea bed further than 3km from the port development; and
• 10-year impacts of the project were not significant on the marine sea bed further than 5km from the port development.
This minimal impact was in line with expectations after analysing the results of the hydrodynamic modelling.
COASTLINE EVOLUTION MODEL: REQUIREMENTS AND CONTRIBUTIONSThis model’s aim was to compare calculated evolution trends for the next 20 years and future trends up to year 2100 taking into or not into account the new
development in order to determine project impacts on the shoreline. This enabled to:
• assess the extent of impacted area; • predict the nature of the impacts (erosion,
accretion); and• and quantify the impacts (evolution rate).
Model methodologyFigure 14 shows the modelling methodology that leads model implementation and exploitation, and summarises inputs and outputs of each stage of the modelling process.
Model constructionThe model covered 30km of coastline from Cap Leucate at the South-West to Narbonne Plage at the North-East. The mesh size was 100m and time step was one day (Figure 15).
For the model, beach profiles and their associate active heights were defined. Wave climates were provided at the level of the closure depth of each profile. One grain size was considered and the CERC formula was chosen for longshore transport calculation. Positions and geometries of the existing coastal structures were taken into account in addition to any anthropic interventions such as beach nourishment and gravel extractions to name a few.
Model calibrationThe model calibration consisted of parameter setting to obtain good concordance between past evolutions predicted by the model and past evolutions observed in nature during the period from 1992 to 2011 (Table III). There following trends were validated.
• Calculated sediment longshore transport evolutions were suitable with criteria of longshore transport orientation and magnitude.
• Evolution trends that were observed in nature were well-reproduced by modelling:- almost stable shoreline south of Port-La
Nouvelle - local erosions on both sides of Port-La
Nouvelle breakwaters - mean trend of recession North of Port-La
Nouvelle: about -1 m/year.
SectorEvolution rate
(m/year)
From North of Cap Leucate to Port-La Nouvelle
+ 0,1
From Port-La Nouvelle to Gruissan
- 0,9
From Gruissan to Port de St Pierre sur Mer
- 1,1
Table III: Observed and modelled shoreline evolutions
from 1992 to 2011.
Model exploitationOnce model calibration was completed, two calculations were carried out to analyse the current shoreline position with the present port. One calculation predicted coastline evolutions in the next 20 years and the second predicted coastline evolutions in the next 100 years taking into account the additional shoreline recession caused by the sea level rise due to climate change. Subsequently, two other calculations were carried out considering the current shoreline position with the project. The first one simulated coastline evolutions in the next 20 years following the project construction. The second calculation simulated coastline evolutions in the next 100 years following the project construction, taking into account the additional shoreline recession caused by the sea level rise due to climate change.
Project impact on coastline evolutionA comparison between the model results helped to assess the impact of the project on the coastline position for mid- and long-term. For the 20-year term, development impacts only concern the 2 km-long area located at the immediate north of the new main breakwater – the maximum annual recession rate is about -1,5 m/year in present configuration, and about -2,5 m/year in project configuration.
For the 100-year term, considering climate change effects, the maximum recession rate would be 220m in present port configuration and about 245m in project configuration. The impact would be limited to the 2 km-long area located at the immediate north. Outside of this area, evolutions were very similar for the two configurations (present and project configurations).
As mitigation measure for the limited area concerned by erosion due to the extension,

CONCLUSIONS
This case study perfectly highlights the efficiency of the integrated package of the five numerical hydro-sedimentary models for understanding a complex coastal site and assessing potential impacts caused by coastal development. This developed methodology for studying a project in such a complex coastal area was significant achievement which included a comprehensive field campaign that ensured the high quality of each modelling. A great source of satisfaction is the possibility given to calibrate and validate the hydrodynamic tool on such a rich database (in time and space). This ensured a good understanding and reproduction of the complex in situ hydro sedimentary. However, the modelers were aware of the model’s limits in terms of morphodynamics. Depending on historical data (which was
not good for this case study) for a good calibration, the morphodynamic module is more likely to be used in a comparative than in a quantitative manner. Yet, it is a very useful tool to assess the future trends that have to be expected in project configuration and to judge of their acceptabilities or not according to the local environmental and economic constraints
Furthermore, since the first 3D hydrodynamic results, the model already indicated that the impacts on sedimentary dynamics will be limited. But with the new modelling package presented here, evidence of such impacts was brought to decision-makers – maps provided that showed the extent of expected impacts. As such, it highlights the major didactic role of such a technical tool in addition to its undeniable scientific one.
REFERENCES
Fremer, I. (2012). Estimation method for river discharges within the Bages-Sigean lagoon. Technical report, 35p. (in French).
CataliottI D., Aldina V. (1982): Evolution of the water turbidity within the lagoon of Bages-Sigean. Océanologica Acta, Vol. 5 N°4. (in French).
Hervouet J.M. (2003). Hydrodynamics of Free Surface Flows: Modelling With the Finite Element Method. Presse des Ponts et Chaussées.
Benoit, M., Marcos, F., Becq, F., Thellier, P. (1996). Tomawac v1.0 - validation note. Technical report., EDF R&D - LNHE, Chatou, France (in French).
Waeles, B., Ouriqua, J., Le dissez, A., Walther, R., Claverie, G., Schwartz, T., Palud, C., Davignon,
Davignon, J., Sourisseau, H. (2015). Measument campaign for the need of the hydro-sedimentary dynamic study in the vicinity of Port-La Nouvelle. 33rd Meeting of the AUGC, RUGC, Anglet, 27-29 May, 2015.
Delinares, M., Walther, R., Schaguene, J., Cayrol, C. and Hamm, L. (2015). Development of an hydro-sedimentary 3D model with sand-mud mixture - Calibration and validation on 6 years evolution in the Seine Estuary. 13th International Conference on Cohesive Sediment Transport Processes (INTERCOH), Leuven, 7-11 September, 2015.
Walther, R., Cayrol, C., Hamm, L., Delouis, A., Lehay, D. (2014). Assessment of an offshore disposal site in the Loire estuary through filed monitoring and 3D numerical modelling. ICCE 2014, Seoul 16-20 June, 2014.
Delinares M., Walther, R., Le Dissez, A., Cancel, P., Desguee, R. (2012). Restoration of the maritime nature of Mont-Saint-Michel – Design and use of a numerical hydrosedimentary model. 6th International Conference on Scour and Engineering, 27-31 August, 2012.
Walther, R., Schaguene, J., Hamm, L., David, E. (2012). Coupled 3D modelling of turbidity maximum dynamics in the Loire estuary. ICCE 2012, Santander. Coastal Engineering Proceedings, 1(33), sediment.22. doi:10.9753 /icce.v33.sediment.22.
Hamm, L., Walther, R. (2008). Morphodynamic coupling of bottom roughness and fluid mud for modelling tidal propagation in the Loire estuary. ICCE 2008, Hamburg. Proceedings 31st International Conference on Coastal Engineering, Hamburg, World scientific, Vol. 3, 2832-2841
Walther, R., Guilbaud, C., and Gandilhon, F. (2005). Sand transport and morphology in the Gironde mouth, France. Sand Transport and Morphology of Offshore Mining Pits – SANDPIT – European project. Eds. Van Rijn, L.C., Soulsby, R.L.,Hoekstra, P., Davies, A.G. June 2005.
Gandilhon, F., Walther, R., Guilbaud, C.(2005). Sand Morphological modelling using 2DH and 3D models”, Transport and Morphology of Offshore Mining Pits – SANDPIT – European project. Eds. Van Rijn, L.C., Soulsby, R.L., Hoekstra, P., Davies, A.G.
J., Sourisseau, H. (2015). Measurement campaign for the need of the hydro-sedimentary dynamic study in the vicinity of Port-La Nouvelle. 33rd AUGC meetings, ISABTP/UPPA, Anglet, 27 - 29 may 2015 (in French).
Soulsby R. (1997). Dynamics of marine sands. Editions. HR Wallingford.
Partheniades, E., (1965). Erosion and Deposition of Cohesive Soils. J Hydraulics Division, Vol 91, p.105-139.
Le Dissez, A., Walther, R., Lagroy de Croutte, E., Waeles, B., Ouriqua, J. (2015). Between lagoon and Mediterranean Sea: hydro-sedimentary study of the exchanges within the inlet of Port-La Nouvelle. 33rd Meeting of the AUGC, RUGC, Anglet, 27-29 May, 2015.
Waeles, B., Ouriqua, J., Le Dissez, A., Walther, R., Claverie, G., Schwartz, T., Palud, C.,
Innovative Modelling: A Tool for Coastal Developments 33
beach nourishment was proposed that will use some of the materials dredged during the construction phase. However, as the impact of the project would be local and there would not be socio-economical issues
at stake by the predicted shoreline recession, the Environmental Services of the State judged the impact on the shoreline acceptable and did not recommend beach nourishment as a mitigation measure.