Embed Size (px)
Citation preview
Innovative Behavior Based Energy Efficiency Pilot
Home Energy Reporting + Advanced Digital Feedback and Communication Campaign
Eugene Rosolie
May 8, 2012

Why this Program? • I-937 • Consistent savings • Low cost savings • Ability to touch hard to reach markets • Positive customer experience with smart grid • Learning Opportunity • Positive image for Cowlitz PUD locally and
regionally

Pilot Program Goals
Scientifically measure the incremental value of an Advanced Digital Campaign in delivering energy savings through the Home Energy Report (HER) Program Help Cowlitz PUD provide its residential end-users with an energy saving, and cost-saving Behavior Based Energy Efficiency (BBEE) program that has been proven to help utility customers save energy and save money
Identify best practices that will enhance future HER Program deployments across the Pacific Northwest

Pilot Program Partnership • BPA
– Provide oversight through weekly conference call updates, receipt of quarterly reports, and Measurement &Verification (M&V)
• Opower – Vendor providing platform including marketing,
reports, alerts, M&V, etc. • Cowlitz
– Providing up to 25,000 customers and data, oversight on marketing and other program material

Innovation in Energy Efficiency

Digital Communication Channels

Program Measurement and Verification

Estimated Program Impact (Assumes Participation of 25,000)
Year 1 Year 2 Year 3 TotalMWh saved 8,825 13,498 13,420 35,743
kWh saved / HH 353 540 537 477 Savings Rate 1.57% 2.40% 2.38% 2.12%
Cost/kWh saved 0.030$ 0.020$ 0.020$ 0.024$

Questions?

Behavioral Based Energy Efficiency:
Home Energy Reports, Web Portal and Social Media Pilot
BPA Energy Efficiency Summit
Concurrent Panel: Session 2 Can we change Behavior? Innovation in the Region
May 8, 2012
Presented by Larry Blaufus Senior manager of Energy Technologies & Services

Why a Social Media Pilot?
• Clark Public Utilities has already established an online social community using Facebook—with plans to extend that presence to Twitter and YouTube in 2012.
• Through this project, Clark Public Utilities seeks to leverage and focus its burgeoning social presence and measurably increase energy savings through behavioral science and normative comparisons between customers.
• OPOWER, Facebook, & the Natural Resources Defense Council Team Up on a new Energy Efficiency Application
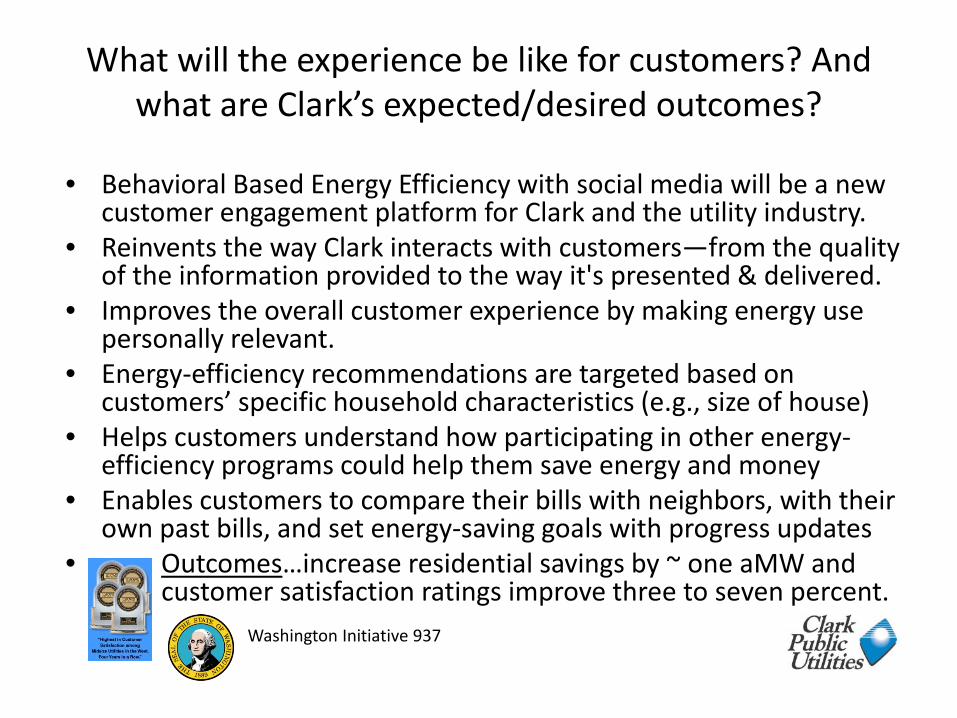
What will the experience be like for customers? And
what are Clark’s expected/desired outcomes?
• Behavioral Based Energy Efficiency with social media will be a new customer engagement platform for Clark and the utility industry.
• Reinvents the way Clark interacts with customers—from the quality of the information provided to the way it's presented & delivered.
• Improves the overall customer experience by making energy use personally relevant.
• Energy-efficiency recommendations are targeted based on customers’ specific household characteristics (e.g., size of house)
• Helps customers understand how participating in other energy-efficiency programs could help them save energy and money
• Enables customers to compare their bills with neighbors, with their own past bills, and set energy-saving goals with progress updates
• Outcomes…increase residential savings by ~ one aMW and customer satisfaction ratings improve three to seven percent.
Washington Initiative 937

Home Energy Reports Opower is probably best known for pioneering the Home Energy Report. One way to think of it
is as a more interesting presentation of the customers electric bill. More than 3 million homes receive Opower reports today, and they’re on track to save hundreds of millions of dollars on their
energy bills. * We will be trying to change the behavior of 20,000 Clark Customers who will receive home energy reports bimonthly… seven reports during the first year…one every other month in years 2 & 3.

BPA Pilot Home Energy Reporting Program + Social Energy (Energy Efficiency Social Networking)
Compare their energy use to a group of their choosing—either friends or a national average of similar homes—helping customers benchmark their usage against friends, communities, peers and fostering a healthy competition

Facebook, Web Portal & Facebook App Offer Customers an Interactive Deep Dive into Energy Consumption
Customer Web Portal
Facebook social energy app

How is the energy savings calculated?

BPA, CPU & OPOWER BBEE Pilot Program Whose behavior are we trying to change? and How?
How the pilot will work:
GROUP SIZES:COMPARISONS: Target 30,000
A to B-1 A 10,000A to B-2 B 20,000
B-1 to B-2 B-1 10,000B-2 10,000
Notes:*"Social Media" will be promoted to 10,000 participants but the number opting in is unknown**CPU will also promote "Social Media" to our Facebook connections, which will create an additional group that is not included in the original proposal.
HER + Social MediaGroup B-2HER Only
TARGET HOUSEHOLDS
Control Group (A) Test Group (B)No Home Energy Report Home Energy Reports
Group B-1

Home Energy Reports (HERS) is a Cost
Effective Energy Resource
Behavioral Based Energy Efficiency - Home Energy Reports 20,000 Households
Year 1 Year 2 Year 3 Total MWh Savings 7,124 9,040 9,169 25,333
kWh/Household 356 452 458 1.67 Total Resource Cost 1.17 2.03 2.06

19
In Partnership with Starbucks, PSE, PECI, and Lucid Design
Effecting Behavior Change in the Small Commercial Sector
BPA 2012 Energy Efficiency Utility Summit Laura McCrae, Principal Utility Analyst, Snohomish PUD
May 8, 2012

20
Pilot Program Goals
1. Demonstrate employee behavior change driven energy savings in the small commercial environment
2. Identify key program components and drivers for persistence
3. Develop a replicable, scalable program design
4. Pilot M&V approach for behavior based efficiency in small commercial buildings

21
Overview of Approach
1. Leverage existing infrastructure where possible
2. Give store employees access to real-time information
3. Motivate behavior change through competition
4. Calculate savings using a whole building approach, including water and natural gas impacts
5. Quantify competition benefits and results
6. Aid and monitor persistence
7. Evaluate process and savings

22
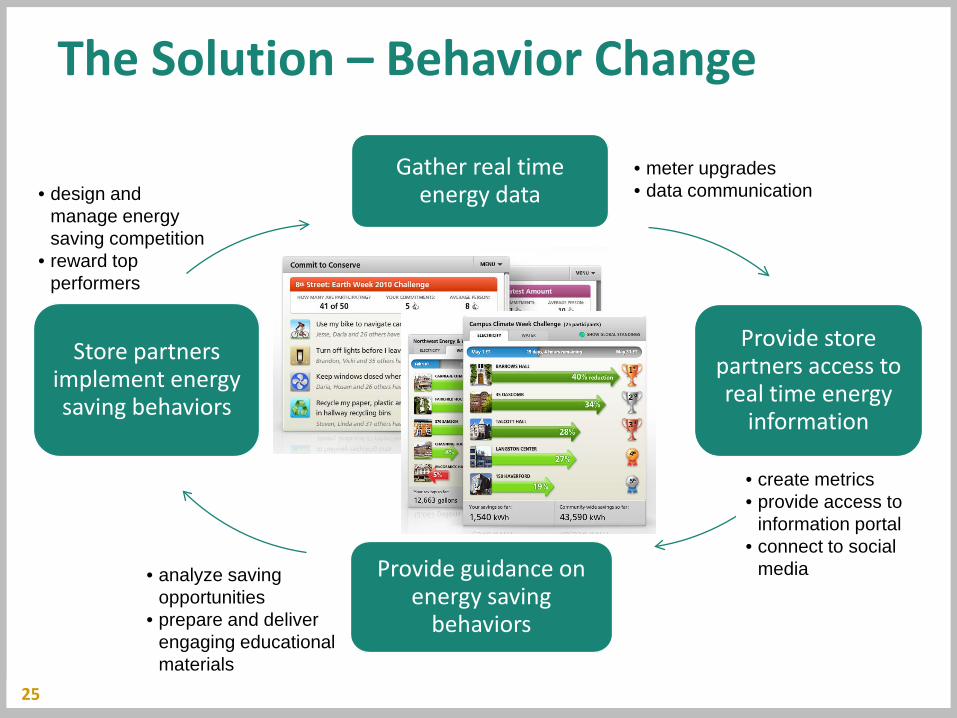
Gather real time energy data
Data Manager
Gateway
Pulse Output
Server
Electric Meter
• meter upgrades • data communication
The Solution – Gather Real Time Data
Pulse Output Water Meter
Natural Gas Usage

23
The Solution – Push Real Time Data
Gather real time energy data
Provide store partners access to real time energy
information
• create metrics • provide access to
information portal • connect to social
media
• meter upgrades • data communication

24
Gather real time energy data
Provide store partners access to real time energy
information
Provide guidance on energy saving
behaviors
• create metrics • provide access to
information portal • connect to social
media
• meter upgrades • data communication
The Solution – Provide Guidance
• analyze saving opportunities
• prepare and deliver engaging educational materials
25
Gather real time energy data
Provide store partners access to real time energy
information
Provide guidance on energy saving
behaviors
Store partners implement energy saving behaviors
• analyze saving opportunities
• prepare and deliver engaging educational materials
• create metrics • provide access to
information portal • connect to social
media
• meter upgrades • data communication • design and
manage energy saving competition
• reward top performers
The Solution – Behavior Change

26
Gather real time energy data
Provide store partners access to real time energy
information
Provide guidance on energy saving
behaviors
Store partners implement energy saving behaviors
Aid & Monitor Persistence

27
Pilot Timeline
Spring 2012
• Planning & Design • Metering Upgrades and data integration • Pre-intervention data collection
Summer 2012
• Contest roll-out and implementation • Data collection • Contest winners!
Fall – Winter 2012
• Light touch persistence monitoring • M&V and Third-party EM&V

28
Thank you
Laura McCrae Principal Utility Analyst, Planning & Evaluation
Snohomish PUD
425-783-8033

B O N N E V I L L E P O W E R A D M I N I S T R A T I O N
ESI Behavioral Change Pilot
Presented by: Steve Martin
Energy Smart Industrial

B O N N E V I L L E P O W E R A D M I N I S T R A T I O N
ESI Energy Management Pilot
30

B O N N E V I L L E P O W E R A D M I N I S T R A T I O N
Industrial Behavioral Change in the Pacific Northwest
31

B O N N E V I L L E P O W E R A D M I N I S T R A T I O N
Why Pursue Behavioral Change?
Utility Perspective – 33% of industrial sector potential – Cost-effective resource acquisition
End User Perspective
– Capital constrained, or limited capital projects – Provides mechanism to engage the broader
organization
32

B O N N E V I L L E P O W E R A D M I N I S T R A T I O N
Who manages the use of energy?
Track and Tune and HPEM empower employees to control and reduce energy usage
33
or

B O N N E V I L L E P O W E R A D M I N I S T R A T I O N
Phase I: The Foundation of SEM Executive Sponsorship Energy Champion and Team Measurement and Monitoring
34

B O N N E V I L L E P O W E R A D M I N I S T R A T I O N
Phase II: Identifying and Inspiring Action
Where is energy used?
Identify low-cost/no-cost behavioral improvement ideas and technical opportunities
Equip end users with implementation strategies
35

B O N N E V I L L E P O W E R A D M I N I S T R A T I O N
Importance of Early Wins
Key Characteristics – Highly visible to organization – Unambiguous – Clearly related to the HPEM or T&T effort
Helps Energy Team address skeptics Momentum builders
36

B O N N E V I L L E P O W E R A D M I N I S T R A T I O N
Examples of Behavioral Change Use most advantageous equipment first
– Requires engineering calculations followed up by a sound training and communication plan.
Modify daily maintenance procedures – Includes items to keep equipment operating at peak
performance, and staging for startup/shutdown.
Adapt set-points to match the load – Rely on control systems where possible, but don’t be
constrained to areas that employ automation.
37

B O N N E V I L L E P O W E R A D M I N I S T R A T I O N
Monitoring, Targeting and Reporting
38

B O N N E V I L L E P O W E R A D M I N I S T R A T I O N
Phase III: Anchoring the Change
“Shallow roots need constant watering” Keys to Persistence
– Continuity in executive sponsorship – Importance of alignment to corporate goal – Ongoing measurement and monitoring – Implementation of an Energy Management Plan
39

B O N N E V I L L E P O W E R A D M I N I S T R A T I O N
Energy Management Pilot: Building a Pipeline of Low-Cost Acquisition
40
Pilot Projects
Program Maturity
FY2011 booked savings – FY2012 and FY2013 projected savings

B O N N E V I L L E P O W E R A D M I N I S T R A T I O N
Contact
For more information, contact:
Steve Martin ESI Energy Management Manager [email protected] 971.244.8589
41