Embed Size (px)
Citation preview

Innovations in Clinical Trials Survey Report SCORR Marketing and Applied Clinical Trials

Overview
Burdened by rising costs, many involved in drug development
consider innovation to be a solution that will help keep budgets in
line and improve e�ciency in clinical trials. However, these advances
require change that can be both disruptive and costly. This raises the
question: “How do companies proceed with innovation in the face of
potentially disruptive change?”
SCORR Marketing, in partnership with Applied Clinical Trials, recently
conducted a survey to gain a better sense of the extent to which
organizations adopt innovative processes and technology for their
clinical trials and the resulting impact.
The survey respondents are from pharmaceutical companies, contract
research organizations (CROs), academic institutions, service providers,
consultancies, research sites, medical device companies and site
management organizations (SMOs). Their job titles or departments
include positions in, or as, research and development (R&D), clinical
directors, strategy/planning, corporate management, regulatory,
business development/sales, quality assurance/quality control
(QA/QC), clinical research, medical a�airs and project management.
Most respondents work for companies with headquarters in North
America or Europe, though a small number work for companies based
in Asia, Australia or South America.
In this survey, we gathered information on:
• E�cacy of innovative practices
• Attitudes toward implementation
• Stakeholders most accepting or resistant to innovation
• The presence of innovations departments or infrastructure
• Potential areas of benefit
• Hindrances to adoption
• Predictions on future company and industry adoption of innovative processes

Rate the following stakeholders in terms of their resistance or acceptance of innovative processes for clinical trials.
Responses based on a 5-point scale, with 1 representing major resistance and 5 representing major acceptance
Does your company have a formalized innovations department or infrastructure to initiate and execute innovative pilot programs?
Yes = FORMALIZED INNOVATORS
No = INFORMAL INNOVATORS
Unsure
Did not answer
13%
43%
43%
1%
THROUGHOUT THIS REPORT, RESPONDENTS FROM
COMPANIES WITH FORMALIZED INNOVATION
INFRASTRUCTURE ARE "FORMALIZED INNOVATORS."THOSE WITHOUT A FORMAL
INFRASTRUCTURE ARE "INFORMAL INNOVATORS."
No Response • Major Resistance • Minor Resistance • Neutral • Minor Acceptance • Major Acceptance
3.60
3.48
3.46
3.41
3.32
3.24
0% 10% 20% 30% 40% 50% 60% 70% 80% 90% 100%
Clinical sites
Laboratories
Third-party service providers
Patients
Pharmaceutical companies
CROs
Averagerating

FORMALIZED INNOVATORS
INFORMAL INNOVATORS
Risk-based monitoring 60% 33%
eSource and direct data entry solutions 51% 35%
Data sharing and collaboration with other
companies47% 28%
Patient engagement 44% 28%
Site selection 42% 23%
Patient recruitment 42% 33%
Other 16% 5%
In the past two years, in which areas has your company
implemented innovations or technological advances
regarding clinical trials?
What has most hindered your company's adoption of
innovative processes and technological advances as applied to clinical trials?
FORMALIZED INNOVATORS
INFORMAL INNOVATORS
Cost of technology 12% 28%
Fear of change 14% 14%
Lack of internal support/training 12% 14%
Lack of interest/low priority 9% 9%
Regulatory requirements 14% 9%
Adoption of innovative processes hasn’t been
hindered12% 9%
Unsure 16% 12%
Other 12% 5%
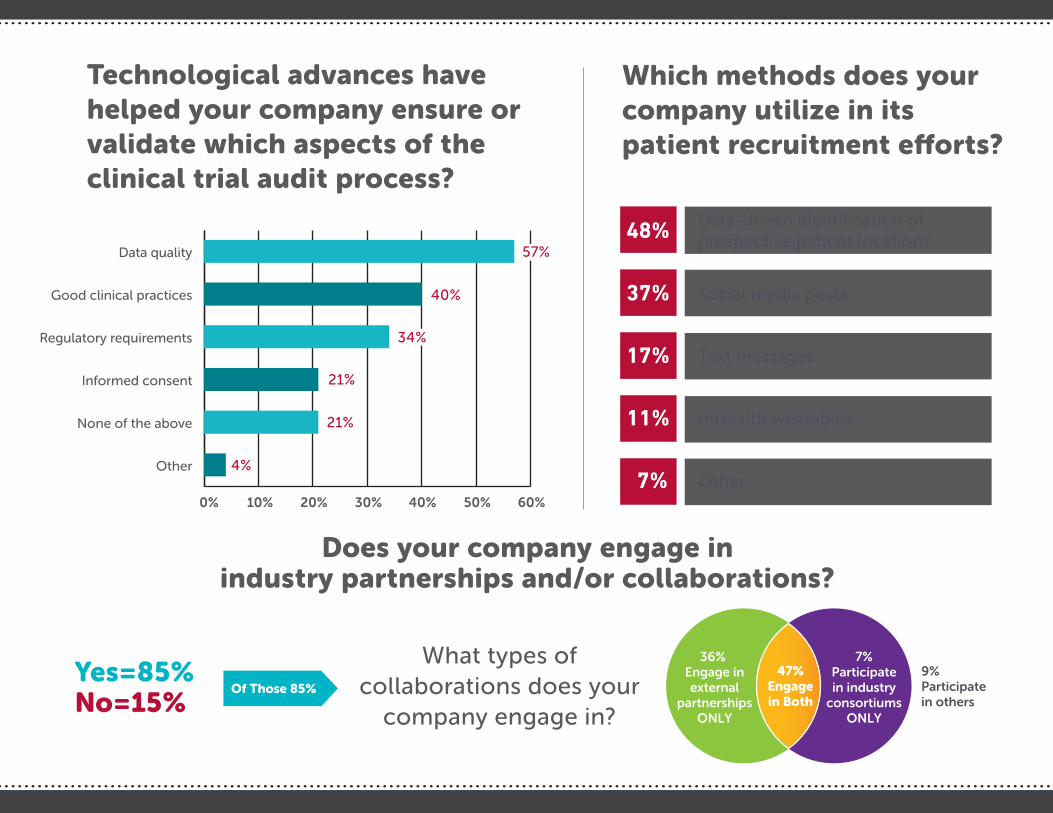
Technological advances have helped your company ensure or validate which aspects of the clinical trial audit process?
Data-driven identification of prospective patient locations
Social media posts
Text messages
mHealth wearables
Other
48%
37%
17%
11%
7%
Which methods does your company utilize in its patient recruitment e�orts?
Does your company engage inindustry partnerships and/or collaborations?
0% 10% 20% 30% 40% 50% 60%
Other
None of the above
Informed consent
Regulatory requirements
Good clinical practices
Data quality 57%
40%
34%
21%
4%
21%
What types ofcollaborations does your
company engage in?Of Those 85%
Yes=85%No=15%
47% Engage in Both
7% Participate in Industry
ConsortiumsONLY
9% Participate in others
36% Engage inexternal
partnershipsONLY
7%Participatein industry
consortiumsONLY
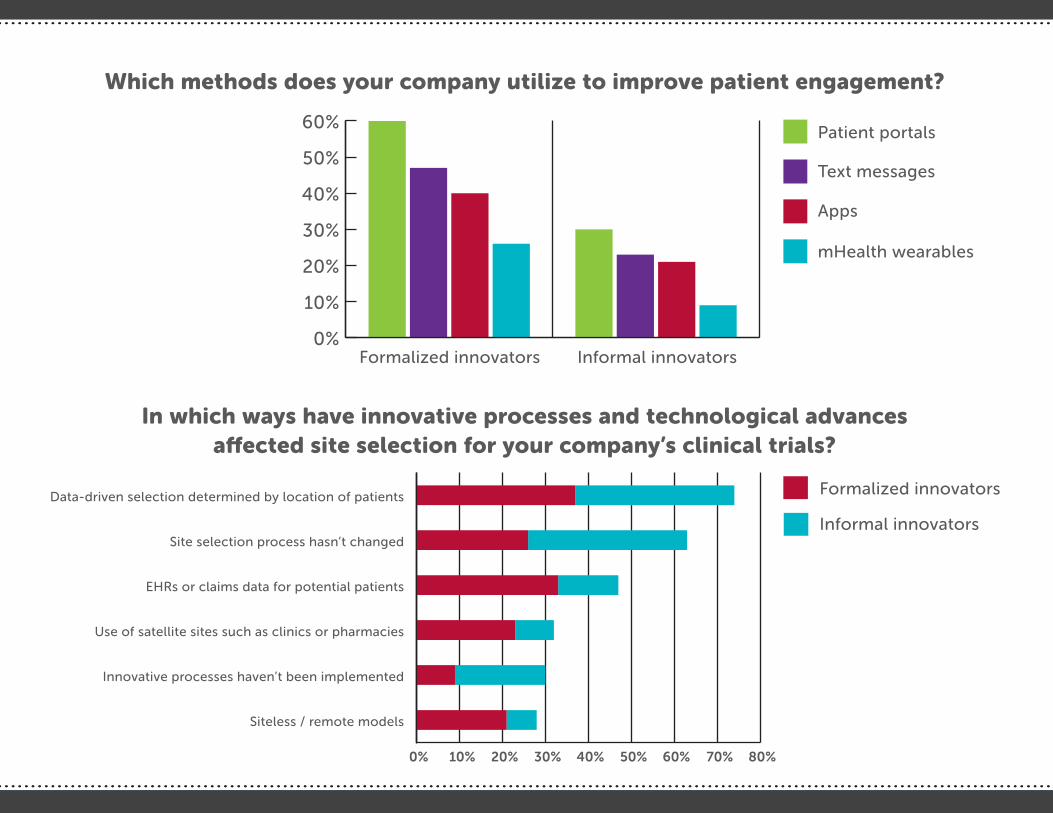
Formalized innovators
Patient portals
Text messages
Apps
mHealth wearables
Formalized innovators
Informal innovators
Informal innovators
0% 10% 20% 30% 40% 50% 60% 70% 80%
Siteless / remote models
Innovative processes haven’t been implemented
Use of satellite sites such as clinics or pharmacies
EHRs or claims data for potential patients
Site selection process hasn’t changed
Data-driven selection determined by location of patients
Which methods does your company utilize to improve patient engagement?
In which ways have innovative processes and technological advances a�ected site selection for your company’s clinical trials?
0%
10%
20%
30%
40%
50%
60%

Risk-based monitoring hasn’t been implemented
eSource data sharing and collaboration with other companies
52%43%
Risk-based monitoring43%27%
Site selection43%
25%
15%
Patient engagement39%
23%
Patient recruitment47%40%
Risk-based monitoring hasn’t helped
Data quality
Patient safety
Site support
43%
Protocol compliance
Implementing risk-based monitoring has helpedyour company redirectmore resources towhich areas?
In the next two years, which innovative practices would you expect your company to implement?

Three Main Points:
1.) Respondents believe that innovative practices will improve trial e�ciency in the long term. When respondents rated their level of agreement to whether innovative practices improve trial e�ciency on a 5-point scale (with 5 being strongly agree and 1 being strongly disagree), the average level of agreement for the long term was 4.29, while for the short term it was just 3.56.
Though the 3.56 rating indicates some optimism in the short-term outlook, these average ratings signify there is more work to be done and that respondents are confident that progress will be made over time. This relative optimism for the longer time period was universal across company types, job titles and company headquarter locations. This is especially true among respondents in strategy and planning positions; here, the average level of agreement for the long term was 4.31, while for the shorter time period, it was a full point lower at 3.31.
Respondents are more positive toward innovation than they believe their companies are. On a 5-point scale (with 5 being very positive and 1 being very negative), the respondents’ personal attitude rating averaged 4.29; they rated their company’s attitudes lower at an average rating of 3.78. This di�erence held true across company types, job titles and headquarter locations. In particular, the pharmaceutical company responses demonstrate this di�erence: The average personal attitude rating was 4.21 while the average company attitude rating was much lower at 3.35.
Companies based in North America (NA) are much more inclined to apply technological advances to site selection than are European-based companies (Eur). Similarly, North American companies are:
• Almost eight times more likely to utilize electronic health records or claims data to locate potential patients (NA: 31% vs. Eur: 4%)
• About three times more likely to use satellite sites (NA: 22% vs. Eur: 7%)
• More than three times more likely to utilize siteless or remote models (NA: 14% vs. Eur: 4%)
• Twice as likely to indicate that their companies have implemented innovative processes to site selection (NA: 42% vs. Eur: 21%)
Regarding patient engagement, those with North American headquarters use some patient engagement tactics more often than the European companies, namely, patient portals (NA: 55% vs. Eur: 36%) and text messaging (NA: 45% vs. Eur: 18%). On the other hand, 39 percent of European-based companies utilize apps (compared to 28 percent of companies with headquarters in North America).
When asked which clinical trial elements that technological advances have helped ensure or validate, respondents from North American companies were more inclined to indicate good clinical practice (NA: 42% vs. Eur: 29%), regulatory requirements (NA: 37% vs. Eur: 21%) and informed consent (NA: 26% vs. Eur: 7%).
Other Key Takeaways:
• Pharmaceutical company respondents tend to be pessimistic toward their companies’ innovation practices. Both their short-term and long-term outlook, perception of their company’s attitude, and how they see their company in relation to its competitors are less positive than the collective view of academics or CROs.
• Though CROs were identified as the stakeholders most accepting of innovative processes, this view is not universally shared. Pharmaceutical company respondents identified pharmaceutical companies, as did academics and individuals who work in R&D.
• CROs were more than twice as likely as academics to have implemented RBM in the past two years. On the other hand, academics were five times more likely than CROs to have implemented innovations pertaining to patient engagement in the same time frame.
• Clinical directors were especially inclined to see technology costs as the primary hindrance to innovation. Academics were more likely to point to regulatory requirements, and those in strategy and planning stressed the lack of internal support and training.
• More than half of all respondents expect to implement eSource data sharing and to collaborate with other companies in the next two years. CRO respondents and people who work in R&D are especially bullish about this.
• Respondents say biomarkers, CDx and personalized medicine have more potential to change the future of clinical trials than the areas of regulatory harmonization, real-world data and long-term surveillance, patient involvement and electronic health records.
continued on next page >
When asked to rate their company’s e�orts at implementing innovative processes in comparison to competitors on a 5-point scale (with 5 being very favorably and 1 being very unfavorably), respondents tended to view their own company’s e�orts neutrally; the average rating was 3.33. Those in academia were inclined to view their organization’s e�orts a little more favorably (with an average rating of 3.69). Those from pharmaceutical companies were less inclined; their average rating was 2.81.
2.) Companies with innovations departments or infrastructure are much more likely to have implemented risk-based monitoring (RBM) and much less likely to consider technology costs as an obstacle. Companies that have a recognized infrastructure to encourage innovation (formalized innovators) are more likely to have implemented technological advances than those companies without a formal innovations infrastructure (informal innovators). This is the case across the board: eSource and direct data entry solutions, patient recruitment, data sharing and collaboration, patient engagement and site selection — and is especially true for risk-based monitoring (RBM). Sixty percent of formal innovators have implemented RBM; just 33 percent of companies with informal innovations practices have done so.
More than a quarter (28%) of informal innovators identify technology costs as the most notable hindrance to their company’s adoption of innovative processes, while just 12 percent of formalized innovators do. Fourteen percent of both groups identify fear of change as a hindrance.
Whether a company has an innovations department or infrastructure signals the types of collaborations it engages in. Formalized innovators are about three times more likely to both partner with other companies and join industry consortiums (58% vs. just 19% of companies without formal innovation practices).
3.) Respondents from companies headquartered in North America view innovative processes more favorably than those working for European companies. When asked to compare their company’s implementation of innovative processes to those of their competitors on a 5-point scale (with 5 being very positive and 1 being very negative), respondents from North American-headquartered companies tended to view their company’s innovative processes at least somewhat favorably (with an average rating of 3.62). In contrast, employees of European companies tended to view their organization’s processes in a less positive light (with an average rating of 2.79).
Three Main Points:
1.) Respondents believe that innovative practices will improve trial e�ciency in the long term. When respondents rated their level of agreement to whether innovative practices improve trial e�ciency on a 5-point scale (with 5 being strongly agree and 1 being strongly disagree), the average level of agreement for the long term was 4.29, while for the short term it was just 3.56.
Though the 3.56 rating indicates some optimism in the short-term outlook, these average ratings signify there is more work to be done and that respondents are confident that progress will be made over time. This relative optimism for the longer time period was universal across company types, job titles and company headquarter locations. This is especially true among respondents in strategy and planning positions; here, the average level of agreement for the long term was 4.31, while for the shorter time period, it was a full point lower at 3.31.
Respondents are more positive toward innovation than they believe their companies are. On a 5-point scale (with 5 being very positive and 1 being very negative), the respondents’ personal attitude rating averaged 4.29; they rated their company’s attitudes lower at an average rating of 3.78. This di�erence held true across company types, job titles and headquarter locations. In particular, the pharmaceutical company responses demonstrate this di�erence: The average personal attitude rating was 4.21 while the average company attitude rating was much lower at 3.35.
Companies based in North America (NA) are much more inclined to apply technological advances to site selection than are European-based companies (Eur). Similarly, North American companies are:
• Almost eight times more likely to utilize electronic health records or claims data to locate potential patients (NA: 31% vs. Eur: 4%)
• About three times more likely to use satellite sites (NA: 22% vs. Eur: 7%)
• More than three times more likely to utilize siteless or remote models (NA: 14% vs. Eur: 4%)
• Twice as likely to indicate that their companies have implemented innovative processes to site selection (NA: 42% vs. Eur: 21%)
Regarding patient engagement, those with North American headquarters use some patient engagement tactics more often than the European companies, namely, patient portals (NA: 55% vs. Eur: 36%) and text messaging (NA: 45% vs. Eur: 18%). On the other hand, 39 percent of European-based companies utilize apps (compared to 28 percent of companies with headquarters in North America).
When asked which clinical trial elements that technological advances have helped ensure or validate, respondents from North American companies were more inclined to indicate good clinical practice (NA: 42% vs. Eur: 29%), regulatory requirements (NA: 37% vs. Eur: 21%) and informed consent (NA: 26% vs. Eur: 7%).
Other Key Takeaways:
• Pharmaceutical company respondents tend to be pessimistic toward their companies’ innovation practices. Both their short-term and long-term outlook, perception of their company’s attitude, and how they see their company in relation to its competitors are less positive than the collective view of academics or CROs.
• Though CROs were identified as the stakeholders most accepting of innovative processes, this view is not universally shared. Pharmaceutical company respondents identified pharmaceutical companies, as did academics and individuals who work in R&D.
• CROs were more than twice as likely as academics to have implemented RBM in the past two years. On the other hand, academics were five times more likely than CROs to have implemented innovations pertaining to patient engagement in the same time frame.
• Clinical directors were especially inclined to see technology costs as the primary hindrance to innovation. Academics were more likely to point to regulatory requirements, and those in strategy and planning stressed the lack of internal support and training.
• More than half of all respondents expect to implement eSource data sharing and to collaborate with other companies in the next two years. CRO respondents and people who work in R&D are especially bullish about this.
• Respondents say biomarkers, CDx and personalized medicine have more potential to change the future of clinical trials than the areas of regulatory harmonization, real-world data and long-term surveillance, patient involvement and electronic health records.
When asked to rate their company’s e�orts at implementing innovative processes in comparison to competitors on a 5-point scale (with 5 being very favorably and 1 being very unfavorably), respondents tended to view their own company’s e�orts neutrally; the average rating was 3.33. Those in academia were inclined to view their organization’s e�orts a little more favorably (with an average rating of 3.69). Those from pharmaceutical companies were less inclined; their average rating was 2.81.
2.) Companies with innovations departments or infrastructure are much more likely to have implemented risk-based monitoring (RBM) and much less likely to consider technology costs as an obstacle. Companies that have a recognized infrastructure to encourage innovation (formalized innovators) are more likely to have implemented technological advances than those companies without a formal innovations infrastructure (informal innovators). This is the case across the board: eSource and direct data entry solutions, patient recruitment, data sharing and collaboration, patient engagement and site selection — and is especially true for risk-based monitoring (RBM). Sixty percent of formal innovators have implemented RBM; just 33 percent of companies with informal innovations practices have done so.
More than a quarter (28%) of informal innovators identify technology costs as the most notable hindrance to their company’s adoption of innovative processes, while just 12 percent of formalized innovators do. Fourteen percent of both groups identify fear of change as a hindrance.
Whether a company has an innovations department or infrastructure signals the types of collaborations it engages in. Formalized innovators are about three times more likely to both partner with other companies and join industry consortiums (58% vs. just 19% of companies without formal innovation practices).
3.) Respondents from companies headquartered in North America view innovative processes more favorably than those working for European companies. When asked to compare their company’s implementation of innovative processes to those of their competitors on a 5-point scale (with 5 being very positive and 1 being very negative), respondents from North American-headquartered companies tended to view their company’s innovative processes at least somewhat favorably (with an average rating of 3.62). In contrast, employees of European companies tended to view their organization’s processes in a less positive light (with an average rating of 2.79).
Three Main Points (cont):

Three Main Points:
1.) Respondents believe that innovative practices will improve trial e�ciency in the long term. When respondents rated their level of agreement to whether innovative practices improve trial e�ciency on a 5-point scale (with 5 being strongly agree and 1 being strongly disagree), the average level of agreement for the long term was 4.29, while for the short term it was just 3.56.
Though the 3.56 rating indicates some optimism in the short-term outlook, these average ratings signify there is more work to be done and that respondents are confident that progress will be made over time. This relative optimism for the longer time period was universal across company types, job titles and company headquarter locations. This is especially true among respondents in strategy and planning positions; here, the average level of agreement for the long term was 4.31, while for the shorter time period, it was a full point lower at 3.31.
Respondents are more positive toward innovation than they believe their companies are. On a 5-point scale (with 5 being very positive and 1 being very negative), the respondents’ personal attitude rating averaged 4.29; they rated their company’s attitudes lower at an average rating of 3.78. This di�erence held true across company types, job titles and headquarter locations. In particular, the pharmaceutical company responses demonstrate this di�erence: The average personal attitude rating was 4.21 while the average company attitude rating was much lower at 3.35.
Companies based in North America (NA) are much more inclined to apply technological advances to site selection than are European-based companies (Eur). Similarly, North American companies are:
• Almost eight times more likely to utilize electronic health records or claims data to locate potential patients (NA: 31% vs. Eur: 4%)
• About three times more likely to use satellite sites (NA: 22% vs. Eur: 7%)
• More than three times more likely to utilize siteless or remote models (NA: 14% vs. Eur: 4%)
• Twice as likely to indicate that their companies have implemented innovative processes to site selection (NA: 42% vs. Eur: 21%)
Regarding patient engagement, those with North American headquarters use some patient engagement tactics more often than the European companies, namely, patient portals (NA: 55% vs. Eur: 36%) and text messaging (NA: 45% vs. Eur: 18%). On the other hand, 39 percent of European-based companies utilize apps (compared to 28 percent of companies with headquarters in North America).
When asked which clinical trial elements that technological advances have helped ensure or validate, respondents from North American companies were more inclined to indicate good clinical practice (NA: 42% vs. Eur: 29%), regulatory requirements (NA: 37% vs. Eur: 21%) and informed consent (NA: 26% vs. Eur: 7%).
Other Key Takeaways:
• Pharmaceutical company respondents tend to be pessimistic toward their companies’ innovation practices. Both their short-term and long-term outlook, perception of their company’s attitude, and how they see their company in relation to its competitors are less positive than the collective view of academics or CROs.
• Though CROs were identified as the stakeholders most accepting of innovative processes, this view is not universally shared. Pharmaceutical company respondents identified pharmaceutical companies, as did academics and individuals who work in R&D.
• CROs were more than twice as likely as academics to have implemented RBM in the past two years. On the other hand, academics were five times more likely than CROs to have implemented innovations pertaining to patient engagement in the same time frame.
• Clinical directors were especially inclined to see technology costs as the primary hindrance to innovation. Academics were more likely to point to regulatory requirements, and those in strategy and planning stressed the lack of internal support and training.
• More than half of all respondents expect to implement eSource data sharing and to collaborate with other companies in the next two years. CRO respondents and people who work in R&D are especially bullish about this.
• Respondents say biomarkers, CDx and personalized medicine have more potential to change the future of clinical trials than the areas of regulatory harmonization, real-world data and long-term surveillance, patient involvement and electronic health records.
When asked to rate their company’s e�orts at implementing innovative processes in comparison to competitors on a 5-point scale (with 5 being very favorably and 1 being very unfavorably), respondents tended to view their own company’s e�orts neutrally; the average rating was 3.33. Those in academia were inclined to view their organization’s e�orts a little more favorably (with an average rating of 3.69). Those from pharmaceutical companies were less inclined; their average rating was 2.81.
2.) Companies with innovations departments or infrastructure are much more likely to have implemented risk-based monitoring (RBM) and much less likely to consider technology costs as an obstacle. Companies that have a recognized infrastructure to encourage innovation (formalized innovators) are more likely to have implemented technological advances than those companies without a formal innovations infrastructure (informal innovators). This is the case across the board: eSource and direct data entry solutions, patient recruitment, data sharing and collaboration, patient engagement and site selection — and is especially true for risk-based monitoring (RBM). Sixty percent of formal innovators have implemented RBM; just 33 percent of companies with informal innovations practices have done so.
More than a quarter (28%) of informal innovators identify technology costs as the most notable hindrance to their company’s adoption of innovative processes, while just 12 percent of formalized innovators do. Fourteen percent of both groups identify fear of change as a hindrance.
Whether a company has an innovations department or infrastructure signals the types of collaborations it engages in. Formalized innovators are about three times more likely to both partner with other companies and join industry consortiums (58% vs. just 19% of companies without formal innovation practices).
3.) Respondents from companies headquartered in North America view innovative processes more favorably than those working for European companies. When asked to compare their company’s implementation of innovative processes to those of their competitors on a 5-point scale (with 5 being very positive and 1 being very negative), respondents from North American-headquartered companies tended to view their company’s innovative processes at least somewhat favorably (with an average rating of 3.62). In contrast, employees of European companies tended to view their organization’s processes in a less positive light (with an average rating of 2.79).