Embed Size (px)
Citation preview

Innovation Strategy MAPI Council Survey | December 2016
Manufacturers Alliance for Productivity and Innovation
1600 Wilson Blvd., Suite 1100, Arlington, VA 22209 | 703.841.9000 | mapi.net

1600 Wilson Blvd., Suite 1100, Arlington, VA 22209 | mapi.net MAPI Council Survey | 1
Authors and Contributors
Authors John R. Miller
Council Director
Erika Ruiz
Research Analyst
About this publication The Manufacturers Alliance for Productivity and Innovation (“MAPI”) and its affiliated Manufacturers Alliance Foundation (“MAPI Foundation”) provide this publication and the information contained herein “as is” and for general guidance only. None of the information, data, analysis, or other materials included in this publication is intended to serve as business, legal, tax, or other professional advice or services. Although we strive to provide accurate and useful information, nothing contained herein is intended to be nor should it be used in lieu of professional advice or services. As such, MAPI shall not be responsible for any loss whatsoever sustained by any organization or person who relies on this publication or the information herein. In addition, the views and opinions expressed in any survey findings are those of the survey respondents and do not necessarily represent the views and opinions of MAPI.
About MAPI By leveraging the experiences of their peers and global market data, members use MAPI to make their enterprises more competitive and to increase their personal effectiveness.
www.mapi.net

1600 Wilson Blvd., Suite 1100, Arlington, VA 22209 | mapi.net MAPI Council Survey | 2
Innovation Strategy
Table of Contents
Introduction .................................................................................................... 3
Key Survey Results .......................................................................................... 3
Business Drivers for Innovation ......................................................................... 4
Organization and Team Building ........................................................................ 6
Training and Engagement ............................................................................... 11
Strategy Deployment ..................................................................................... 13
Appendix ...................................................................................................... 14

1600 Wilson Blvd., Suite 1100, Arlington, VA 22209 | mapi.net MAPI Council Survey | 3
Introduction Innovation is a driving force at many manufacturers as they try to compete in today’s markets.
Companies are starting or expanding innovation programs and processes that in some cases involve
every employee. In this study, we looked at many aspects of the innovation process, including
targets, the people involved, and keys to success.
MAPI’s survey was completed by 90 member companies; 71% indicated that they have a formal
innovation strategy. Responses came from members of MAPI’s Manufacturing Council, Engineering
R&D Council, and Information Systems Management Council.
Key Survey Results
Most key business drivers for developing innovation strategies are centered around the
manufacturer’s growth function; common goals include achieving growth (97%), developing new
products (85%), and generating sales (65%). Other goals include saving money through process
improvement (41%) and saving costs (56%).
To support the growth and cost savings goals, innovation strategies are applied to products
and/or services (71%), partnership models (65%), business models (62%), and business
processes (59%). This is achieved through engagement with engineering, R&D, sales, marketing,
and manufacturing. Common indicators of success are revenue generation (65%), increased
number of new products (59%), new business generated (47%), and cost savings (44%).
Training is an integral part of a successful innovation strategy. The growth functions of
engineering and product development (65%), R&D (59%), marketing (59%), and general
management (50%) are often involved in the process. Employees tend to be responsible for
conducting training, often with help from consultants.
Some manufacturers provide incentives in the form of awards, recognition, and advancement for
those involved in the innovation process.
78% of companies surveyed think their innovation strategies are an effective means of achieving
their stated goals.

1600 Wilson Blvd., Suite 1100, Arlington, VA 22209 | mapi.net MAPI Council Survey | 4
Business Drivers for Innovation
Many companies are deploying innovation strategies to help generate growth, improve processes, and
reduce costs. Products and services are the business activity most commonly targeted for innovation
(71%). All of the top business activities focus on growth and model development and most also
involve revenue generation and cost savings.
Figure 1: Key Business Activities Considered for Innovation
Response percentage (n=43)
Innovation strategies can be applied to many aspects of the business. MAPI’s survey found that the
strategy is most likely applied to products and processes that affect company revenue, with 100% of
respondents saying it is important or very important in the success of their businesses.
Almost all (97%) indicated that growth is a key goal for their strategies. The three next most common
goals are also centered around growth—product development (85%), new business opportunities
(79%), and sales growth (65%).
71%65%
62%59%
21%
3%
Products
and/or services
Partnership
models
Business
models
Business
processes
Organizational
structures
Other
1600 Wilson Blvd., Suite 1100, Arlington, VA 22209 | mapi.net MAPI Council Survey | 5
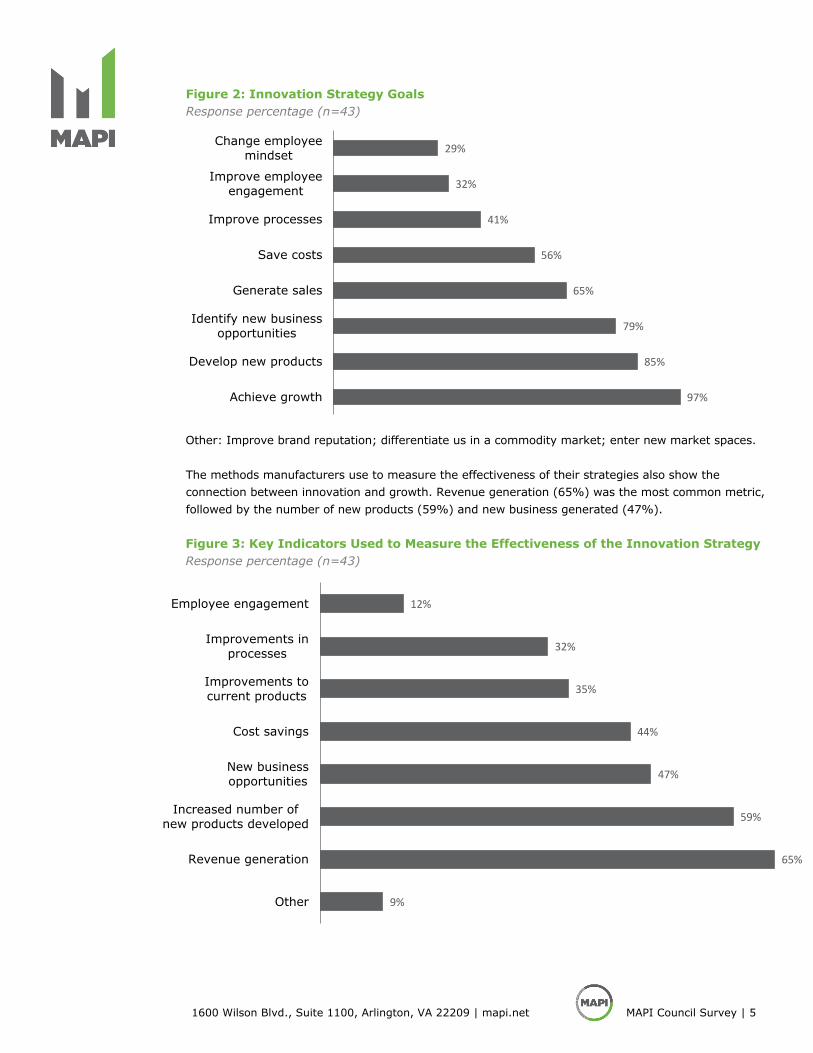
Figure 2: Innovation Strategy Goals
Response percentage (n=43)
Other: Improve brand reputation; differentiate us in a commodity market; enter new market spaces.
The methods manufacturers use to measure the effectiveness of their strategies also show the
connection between innovation and growth. Revenue generation (65%) was the most common metric,
followed by the number of new products (59%) and new business generated (47%).
Figure 3: Key Indicators Used to Measure the Effectiveness of the Innovation Strategy
Response percentage (n=43)
97%
85%
79%
65%
56%
41%
32%
29%
Achieve growth
Develop new products
Identify new business
opportunities
Generate sales
Save costs
Improve processes
Improve employee
engagement
Change employee
mindset
9%
65%
59%
47%
44%
35%
32%
12%
Other
Revenue generation
Increased number of
new products developed
New business
opportunities
Cost savings
Improvements to
current products
Improvements in
processes
Employee engagement

1600 Wilson Blvd., Suite 1100, Arlington, VA 22209 | mapi.net MAPI Council Survey | 6
Other: Sales of products less than five years old; customer satisfaction feedback; vitality and core
growth; increased market share; new products as a percentage of sales; formal funnel and tracking
system.
Innovation programs help employees think differently about how they do their jobs. While less than
50% of ideas become projects, innovation strategies get employees thinking more creatively.
Figure 4: Percentage of Ideas From the Innovation Strategy That Become Projects
Response percentage (n=43)
Many companies measure the effectiveness of their innovation programs against the increase in
growth, product development, and cost savings targets; 78% consider their programs to be effective
or very effective.
Figure 5: Effectiveness of the Innovation Strategy in Achieving Stated Goals
Response percentage (n=43)
Organization and Team Building
With manufacturers’ focus on growth and cost savings through process improvement, it’s
understandable that engineering and product development (68%) most often leads or co-leads the
innovation strategy. Dedicated teams (53%) and other growth functions such as R&D (41%) and
marketing (26%) are also key leaders. These functions are essential in the innovation team process
and the most likely to be on innovation teams.
14%
23% 23% 23%
9% 9%
<5% 5%-10% 11%-20% 21%-30% 31%-40% 41%-50%
5%
73%
18%
5%
Very effective Effective Neither effective nor
ineffective
Ineffective

1600 Wilson Blvd., Suite 1100, Arlington, VA 22209 | mapi.net MAPI Council Survey | 7
Figure 6: Functions That Lead Innovation
Response percentage (n=43)
Other: Three individuals from the businesses and a team focused on engineering and technology;
everyone; product management.
Common roles within the innovation strategy are customers (97%), engineering (94%), R&D (88%),
marketing (88%), manufacturing (74%), and sales (71%). It is clear that working in teams and
closely with customers is key to success.
Figure 7: Roles Involved in the Innovation Strategy
Response percentage (n=43)
Other: Consultants; all.
12%
6%
6%
6%
9%
9%
21%
26%
41%
53%
68%
Other
Quality
Finance
Purchasing
Sales
IT
Manufacturing
Marketing
R&D
A dedicated
innovation team
Engineering and
product development
3%
18%
38%
38%
41%
44%
47%
71%
74%
88%
88%
94%
97%
Other
HR
Suppliers
Quality
Purchasing
IT
Finance
Sales
Manufacturing
R&D
Marketing
Engineering and product development
Customers

1600 Wilson Blvd., Suite 1100, Arlington, VA 22209 | mapi.net MAPI Council Survey | 8
Most innovation teams are housed within the engineering and product development function (88%).
Engineering is a central function for growth through R&D, new product development, and design, and
therefore this structure makes sense.
Figure 8: Functions Where Innovation Teams Reside
Response percentage of companies with dedicated innovation teams (n=36)
Other: Dedicated innovation team reporting to director of innovation; all divisions; they are
multidisciplinary teams; independent department at corporate headquarters; corporate—innovation
leader reports to CEO; cross-functional in the business; innovation center—reporting to the CMO,
innovation center composed of product managers and development engineers; multiple locations—
decentralized in the business units; the teams are cross-regional and cross-functional in a virtual
environment.
29%
3%
6%
9%
12%
24%
26%
44%
88%
Other
Purchasing
Quality
Sales
IT
Marketing
Manufacturing
R&D
Engineering and
product development

1600 Wilson Blvd., Suite 1100, Arlington, VA 22209 | mapi.net MAPI Council Survey | 9
Almost half of the surveyed companies have dedicated innovation teams.
Figure 9: When Innovation Teams Are Formed
Response percentage of companies with dedicated innovation teams (n=36)
Other: No comments.
Figure 10: Description of the Innovation Team
Response percentage of companies with dedicated innovation teams (n=36)
Of our surveyed manufacturers, 38% say engineering and product development employees have time
set aside specifically for innovation, compared with 24% for R&D. This dedicated time may bring new
thoughts or products into the portfolio that may not otherwise have been initiated by customers,
sales, or marketing.
45%
32%
14%
9%
Permanent teams
exist ideas and/or
projects when
they arise
When ideas are
identified
When projects are
started
Other
Cross-functional innovation teams
pursue ideas/projects
68%
Innovation teams within functions
pursue
ideas/projects32%

1600 Wilson Blvd., Suite 1100, Arlington, VA 22209 | mapi.net MAPI Council Survey | 10
Figure 11: Employees with Designated Time for Innovation
Response percentage of employees with designated time for innovation only (n=17)
Other: Lean Rangers for process improvement, three individuals from the businesses and a team
focused on engineering and technology, have a team at our innovation center that supports
innovation projects, product management.
Figure 12: Correlation Between Innovation and Employee Engagement
Response percentage (n=43)
9%
3%
3%
15%
24%
38%
Other
IT
Manufacturing
Marketing
R&D
Engineering and
product
development
68%
23%
9%
Yes, it has positively affected
employee engagement
We aren’t able to make a correlation between
innovation and employee engagement
No influence on employee
engagement

1600 Wilson Blvd., Suite 1100, Arlington, VA 22209 | mapi.net MAPI Council Survey | 11
Training and Engagement
Training and engagement are two critical pieces of innovation strategy. Engineering and product
development is the most likely group to be included in training (65%), as are other growth groups
such as R&D (59%) and marketing (59%). Other functions included in the training process are general
management, sales, finance, IT, and HR.
Figure 13: Groups Included in Innovation Training
Response percentage of companies providing training (n=26)
Some manufacturers (41%) rely solely on employees to facilitate training; it’s more common to use a
combination of staff and consultants (50%). Very few (5%) use only consultants for training.
Figure 14: Facilitators of Innovation Training
Response percentage of companies providing training (n=26)
Other: Dedicated innovation team; internal training program with employees.
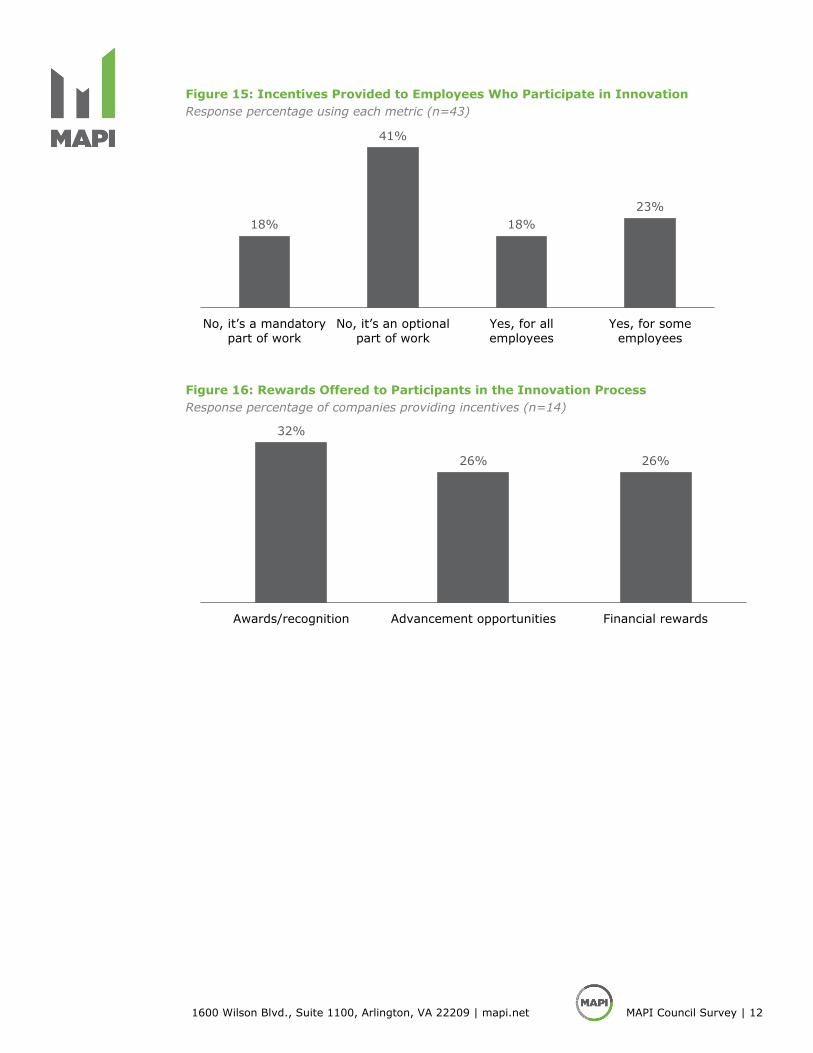
Surprisingly, 41% of surveyed companies say they provide incentives to at least some of the
employees participating in the innovation strategy. Rewards take the form of awards, recognition,
advancement opportunities, and money.
24%
24%
26%
26%
29%
32%
38%
50%
59%
59%
65%
Purchasing
HR
Quality
IT
Finance
Sales
Manufacturing
General management
R&D
Marketing
Engineering and product development
41%
5%
50%
5%
Employees Consultants Both Other (please specify)
1600 Wilson Blvd., Suite 1100, Arlington, VA 22209 | mapi.net MAPI Council Survey | 12
Figure 15: Incentives Provided to Employees Who Participate in Innovation
Response percentage using each metric (n=43)
Figure 16: Rewards Offered to Participants in the Innovation Process
Response percentage of companies providing incentives (n=14)
18%
41%
18%
23%
No, it’s a mandatory part of work
No, it’s an optional part of work
Yes, for all
employees
Yes, for some
employees
32%
26% 26%
Awards/recognition Advancement opportunities Financial rewards
1600 Wilson Blvd., Suite 1100, Arlington, VA 22209 | mapi.net MAPI Council Survey | 13
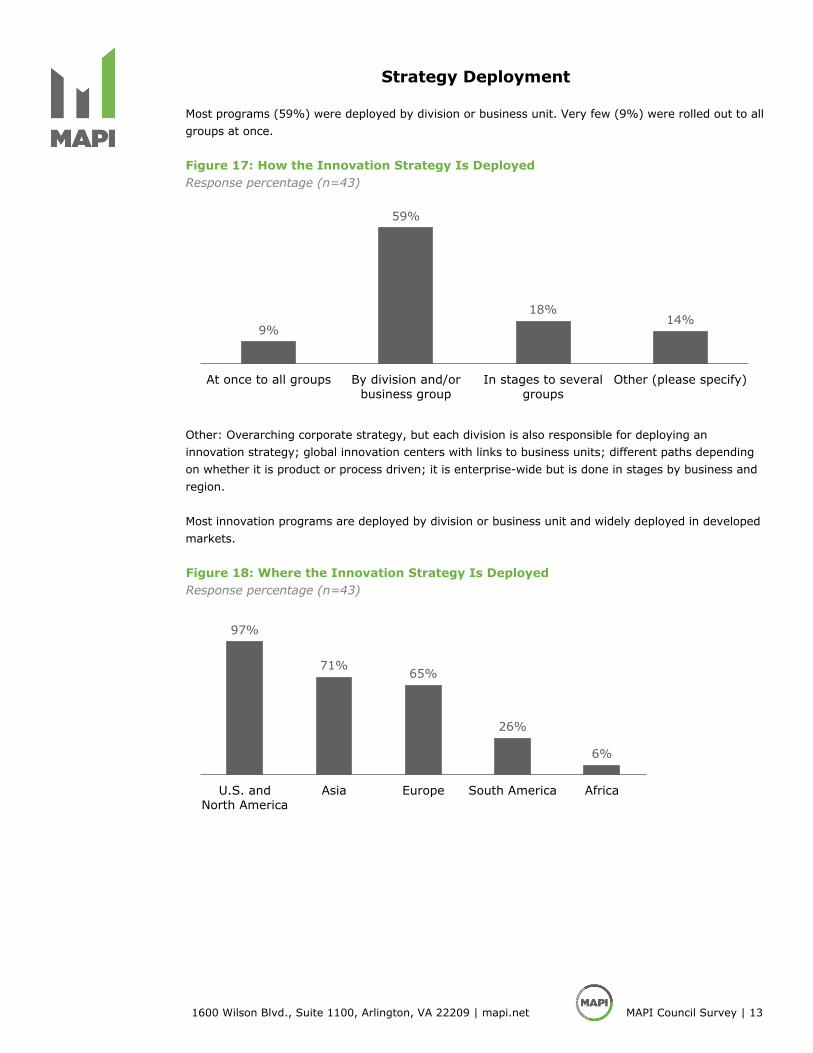
Strategy Deployment
Most programs (59%) were deployed by division or business unit. Very few (9%) were rolled out to all
groups at once.
Figure 17: How the Innovation Strategy Is Deployed
Response percentage (n=43)
Other: Overarching corporate strategy, but each division is also responsible for deploying an
innovation strategy; global innovation centers with links to business units; different paths depending
on whether it is product or process driven; it is enterprise-wide but is done in stages by business and
region.
Most innovation programs are deployed by division or business unit and widely deployed in developed
markets.
Figure 18: Where the Innovation Strategy Is Deployed
Response percentage (n=43)
9%
59%
18%14%
At once to all groups By division and/or
business group
In stages to several
groups
Other (please specify)
97%
71%65%
26%
6%
U.S. and
North America
Asia Europe South America Africa

1600 Wilson Blvd., Suite 1100, Arlington, VA 22209 | mapi.net MAPI Council Survey | 14
Appendix
Figure A1: How the Innovation Strategy Is Organized
Response percentage using each metric (n=43)
Figure A2: Barriers to Progress on Innovation Objectives
Response percentage using each metric (n=43)
Other: Risk aversion, particularly from finance; talent; getting people to think that they are
innovative—stopping the idea that innovation is about R&D, projects, products, etc.
5%
41%
50%
5%
Creative (design
thinking, etc.)
Traditional (i.e., stage
gates, six sigma, etc.)
Both traditional and
creative
Other (please specify)
6%
9%
12%
21%
21%
24%
35%
53%
56%
74%
74%
Employee buy-in
Other progress (please specify)
Costs associated with managing innovation
Executive buy-in
Middle management buy-in
Clearly defining the scope of innovation
Time limitations
Selecting the most impactful innovations
Challenges showing quick results
Competing priorities)
Resource limitations
![Welcome [gismob.tauranga.govt.nz]gismob.tauranga.govt.nz/Html5/UserGuide.pdf · Welcome Welcome to the New Mapi, ... Mapi is now computer as well as Mobile and Tablet friendly. A](https://img.pdfslide.us/doc/110x75/5b51a3d57f8b9ac4368c7627/welcome-welcome-welcome-to-the-new-mapi-mapi-is-now-computer-as-well.jpg)