Embed Size (px)
Citation preview
Innovation Portfolio Management (IPM)
Practitioner Foundations PALISADE
Regional Risk Conference
Crowne Plaza Amsterdam
Nieuwezijds Voorburgwal 5
Amsterdam, The Netherlands Thursday, April 3rd, 2014
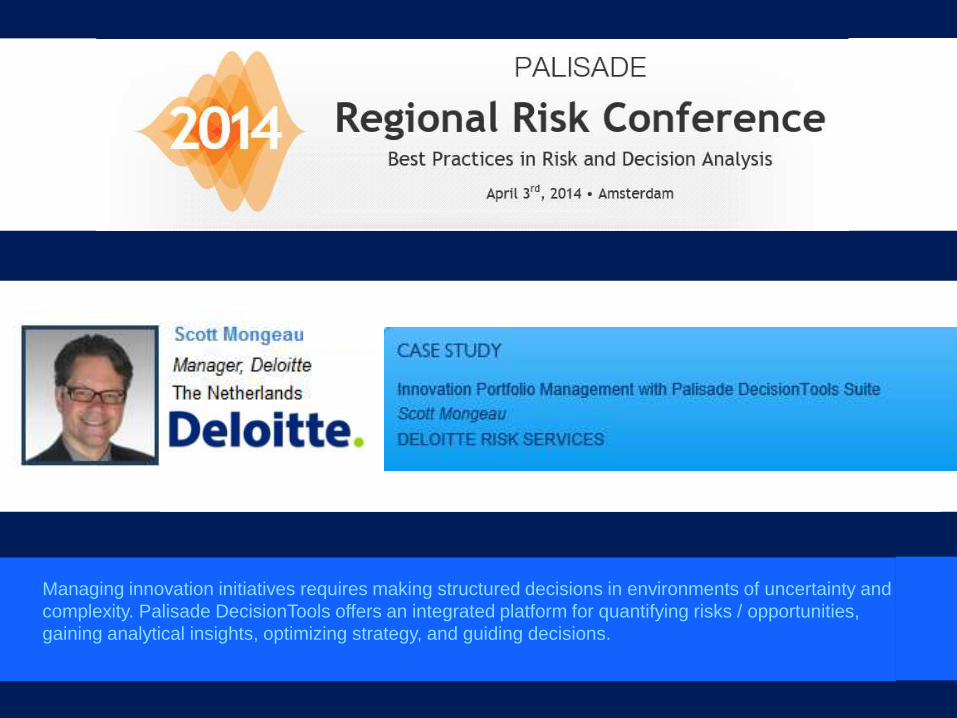
Managing innovation initiatives requires making structured decisions in environments of uncertainty and
complexity. Palisade DecisionTools offers an integrated platform for quantifying risks / opportunities,
gaining analytical insights, optimizing strategy, and guiding decisions.

2
Speaker Background
Education
• PhD (ABD) Nyenrode
• MBA Erasmus
RSM
• MA Financial Management Erasmus RSM
• Certificate Finance University of California Berkeley
• Grad Degree Info Sys Mgmt Royal Melbourne Institute of Tech (RMIT)
• MA Communications University of Texas
• B Phil Miami University of Ohio
Experience
• Deloitte Nederland Manager Analytics
• Nyenrode Lecturer, Business Decision Making
• SARK7 Owner / Principal Consultant
• Genentech Inc. Manager / Financial Analyst / Enterprise Architect
• Atradius Web Analytics Manager
• CFSI CIO
• Consulting Programmer
Scott Mongeau
Analytics Manager
Risk Services
+31 68 201 9225
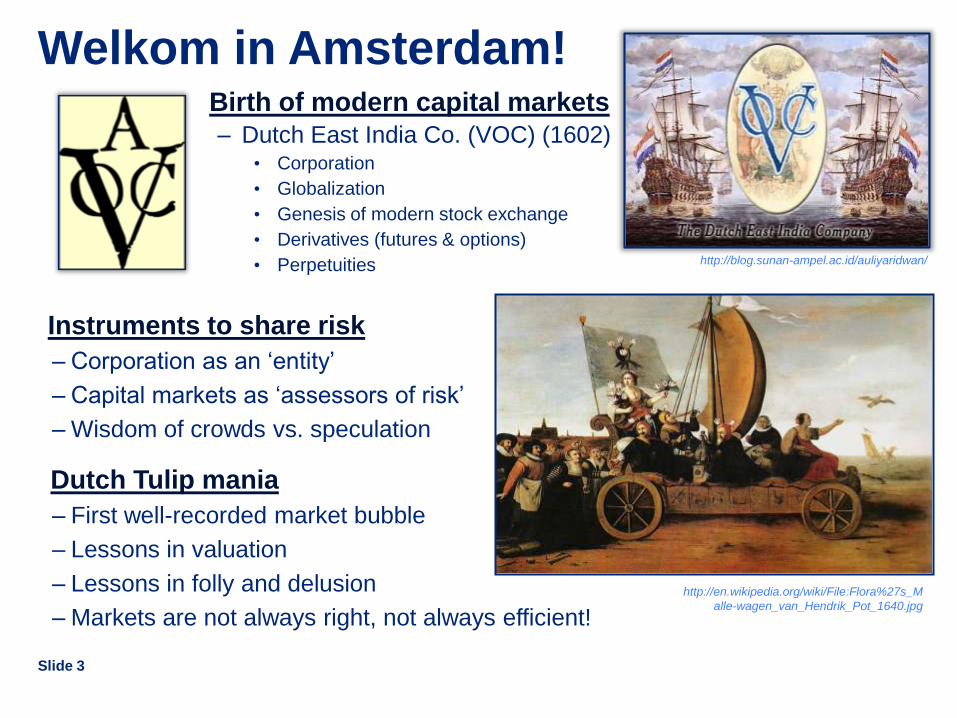
Welkom in Amsterdam!
Instruments to share risk
– Corporation as an ‘entity’
– Capital markets as ‘assessors of risk’
– Wisdom of crowds vs. speculation
Dutch Tulip mania
– First well-recorded market bubble
– Lessons in valuation
– Lessons in folly and delusion
– Markets are not always right, not always efficient!
Slide 3
Birth of modern capital markets
– Dutch East India Co. (VOC) (1602) • Corporation
• Globalization
• Genesis of modern stock exchange
• Derivatives (futures & options)
• Perpetuities http://blog.sunan-ampel.ac.id/auliyaridwan/
http://en.wikipedia.org/wiki/File:Flora%27s_M
alle-wagen_van_Hendrik_Pot_1640.jpg
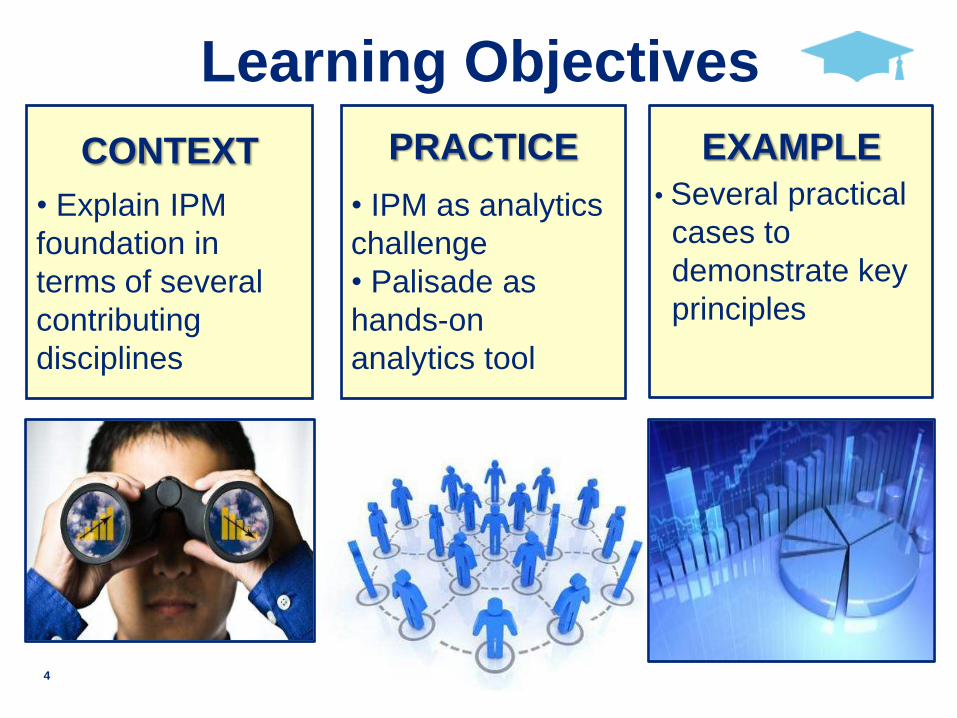
Learning Objectives
EXAMPLE
• Several practical
cases to
demonstrate key
principles
CONTEXT
• Explain IPM
foundation in
terms of several
contributing
disciplines
PRACTICE
• IPM as analytics
challenge
• Palisade as
hands-on
analytics tool
4

5
IPM CONTEXT
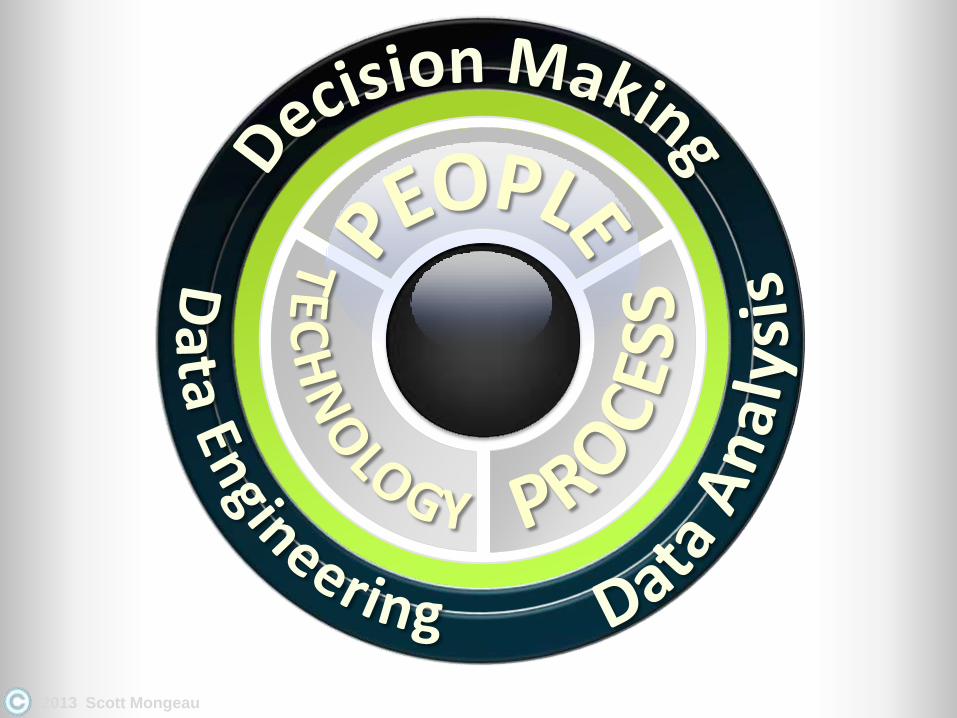
Innovation Management
Powerful solutions for
innovation management
through state-of-the-art
approaches integrating people,
processes, and technology
perspectives.
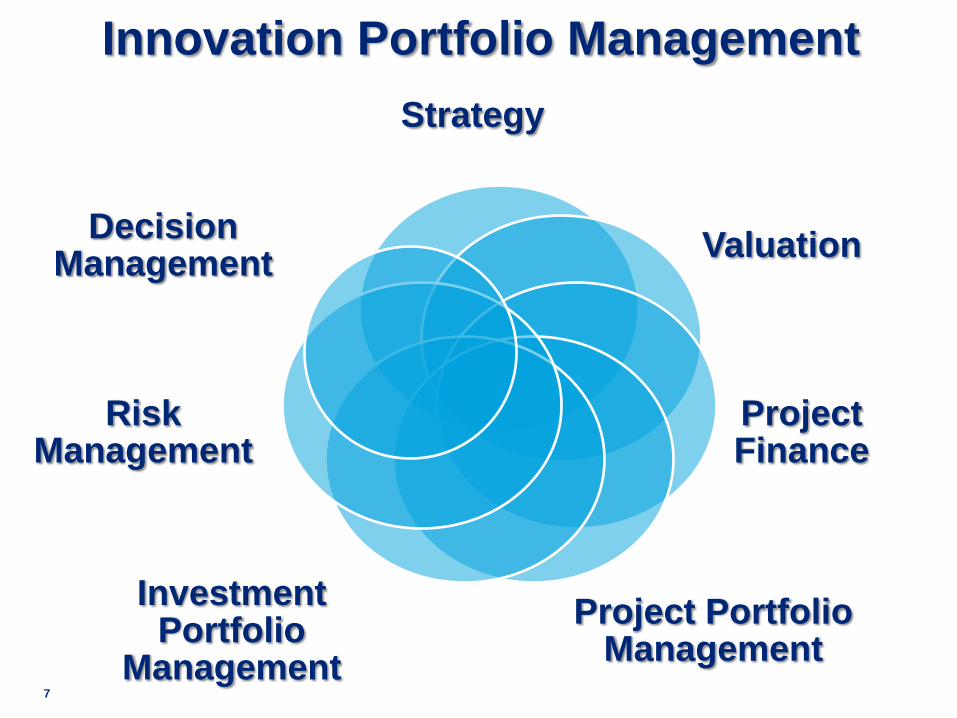
Innovation Portfolio Management
7
Strategy
Valuation
Project Finance
Project Portfolio Management
Investment Portfolio
Management
Risk Management
Decision Management
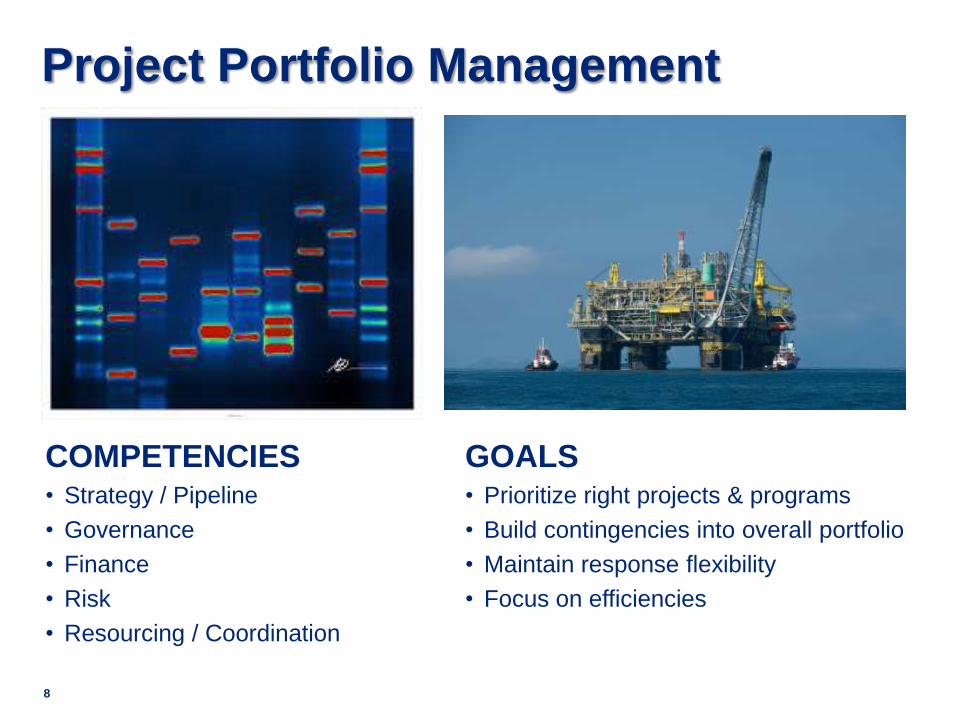
Project Portfolio Management
8
COMPETENCIES • Strategy / Pipeline
• Governance
• Finance
• Risk
• Resourcing / Coordination
GOALS • Prioritize right projects & programs
• Build contingencies into overall portfolio
• Maintain response flexibility
• Focus on efficiencies
011,25$
249,290000,320907.2
238,95000,100952.1
000,170000,1700.10
Value
Present
Flow
Cash
Factor
DiscountPeriod
205.1
1
05.11
TotalNPV9
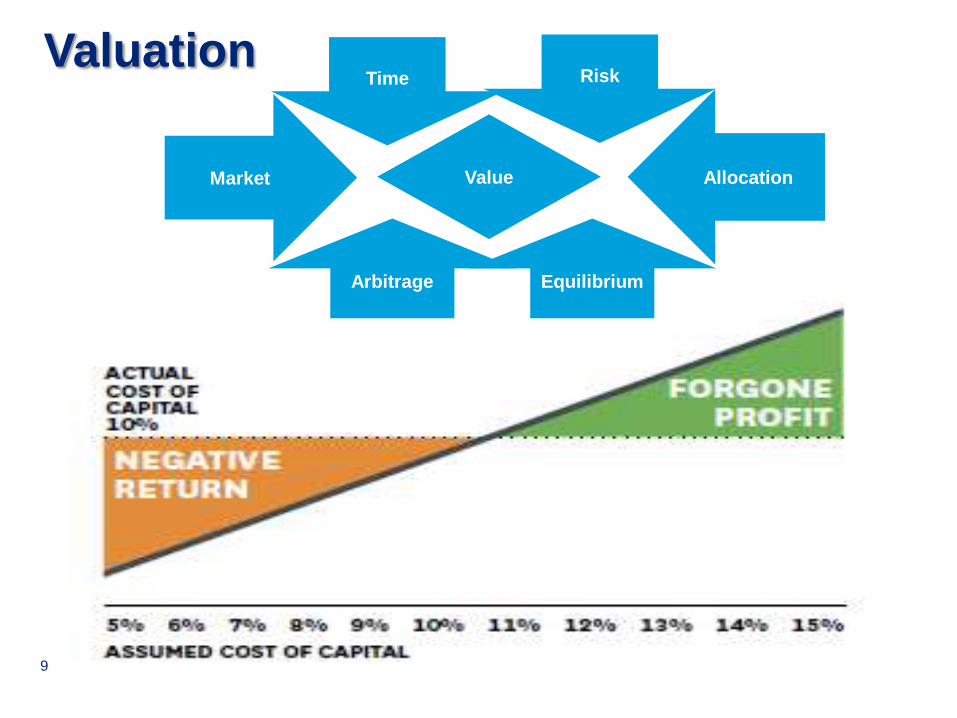
Arbitrage Equilibrium
Time Risk
Market Allocation Value
Valuation
10
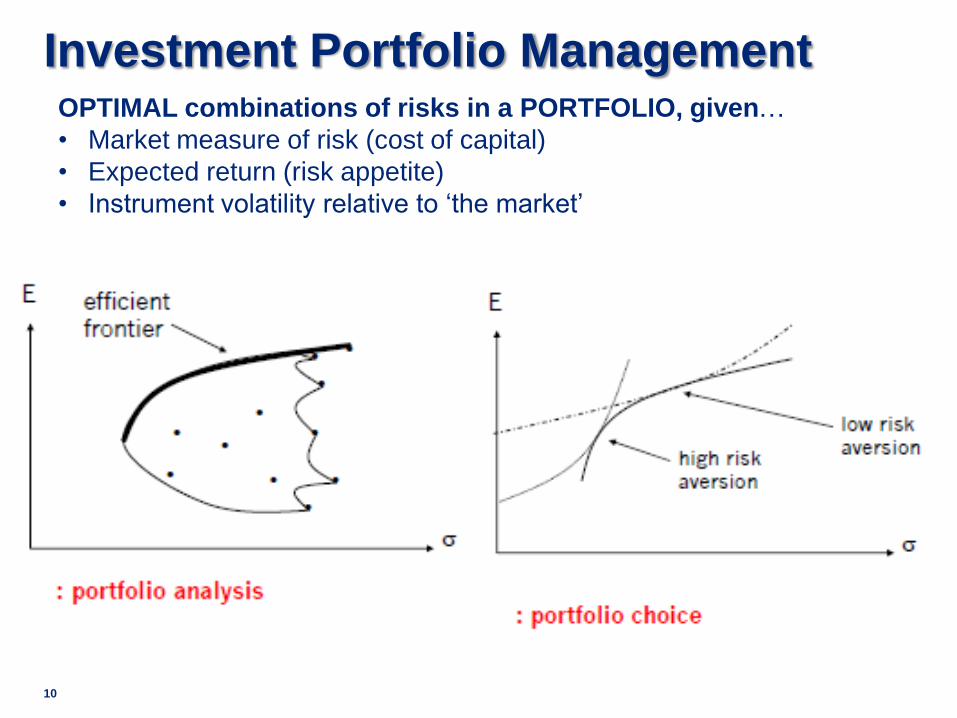
Investment Portfolio Management OPTIMAL combinations of risks in a PORTFOLIO, given…
• Market measure of risk (cost of capital)
• Expected return (risk appetite)
• Instrument volatility relative to ‘the market’

Project Finance
Slide 11
12
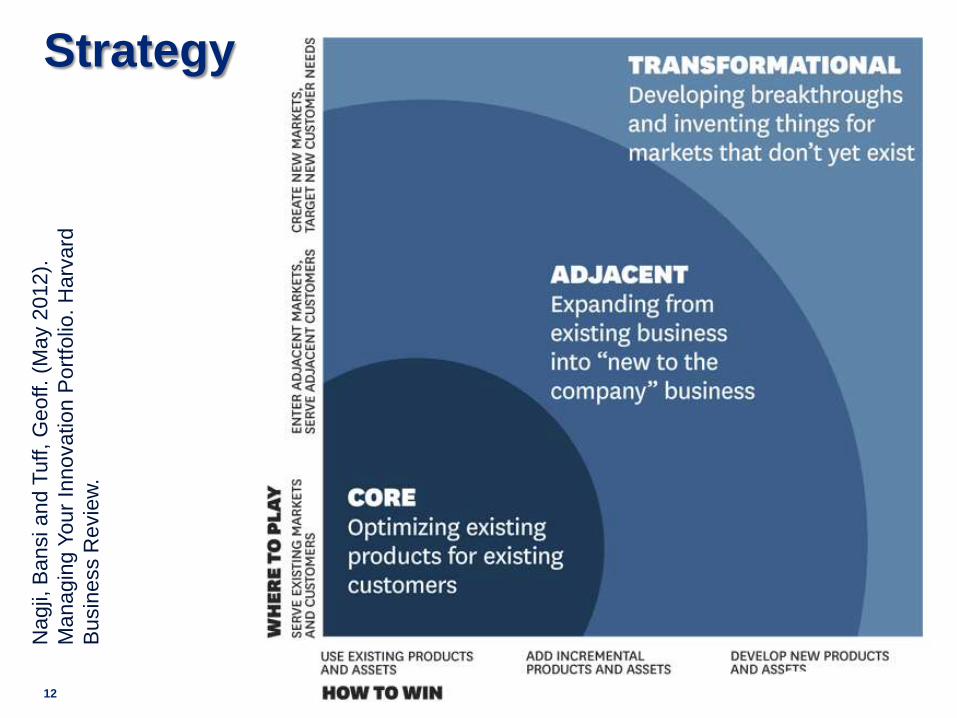
Strategy N
agji,
Bansi and T
uff,
Geoff.
(May 2
012).
Manag
ing Y
our
Innovation P
ort
folio
. H
arv
ard
Busin
ess R
evie
w.

13
Strategy
Rivalry Suppliers Buyers
Barriers
Substitutes
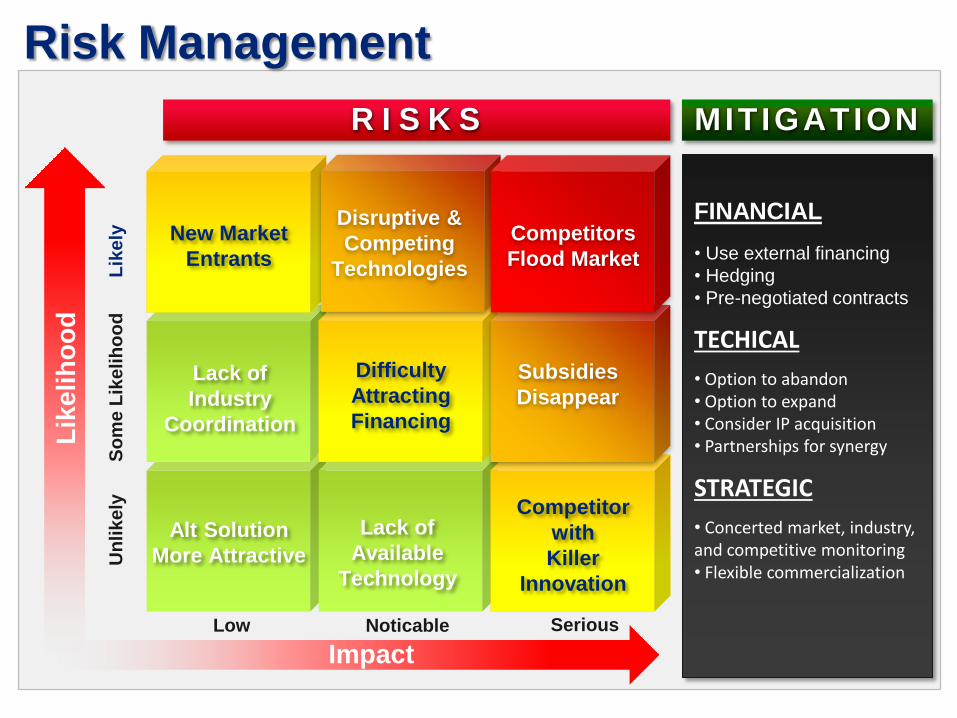
FINANCIAL
• Use external financing
• Hedging
• Pre-negotiated contracts
TECHICAL
• Option to abandon • Option to expand • Consider IP acquisition • Partnerships for synergy
STRATEGIC
• Concerted market, industry, and competitive monitoring • Flexible commercialization
Impact
Lik
elih
oo
d
Un
lik
ely
S
om
e L
ike
lih
oo
d
Lik
ely
Alt Solution
More Attractive
Lack of
Industry
Coordination
New Market
Entrants
Lack of
Available
Technology
Difficulty
Attracting
Financing
Competitor
with
Killer
Innovation
R I S K S MIT IGATION
Low Noticable Serious
Disruptive &
Competing
Technologies
Competitors
Flood Market
Subsidies
Disappear
Risk Management

Slide 15
Decision Management

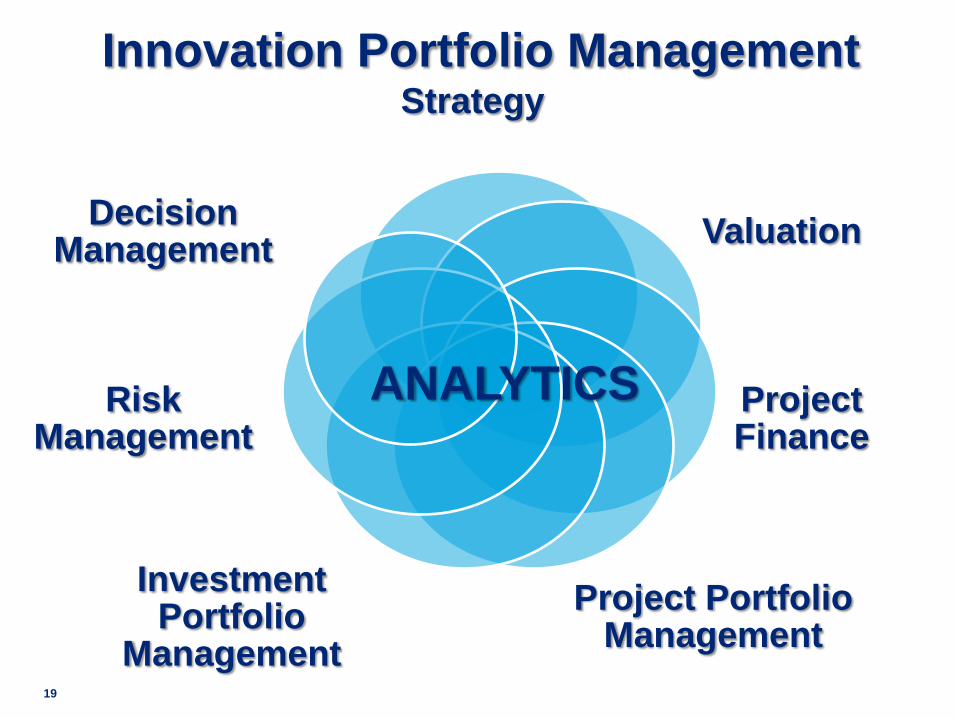
Innovation Portfolio Management
16
Strategy
Valuation
Project Finance
Project Portfolio Management
Investment Portfolio
Management
Risk Management
Decision Management
ANALYTICS

17
Analytics

Analytics in Context
Data-driven solutions to
address innovation
portfolio and risk
management issues.
Innovation Portfolio Management
19
Strategy
Valuation
Project Finance
Project Portfolio Management
Investment Portfolio
Management
Risk Management
Decision Management
ANALYTICS
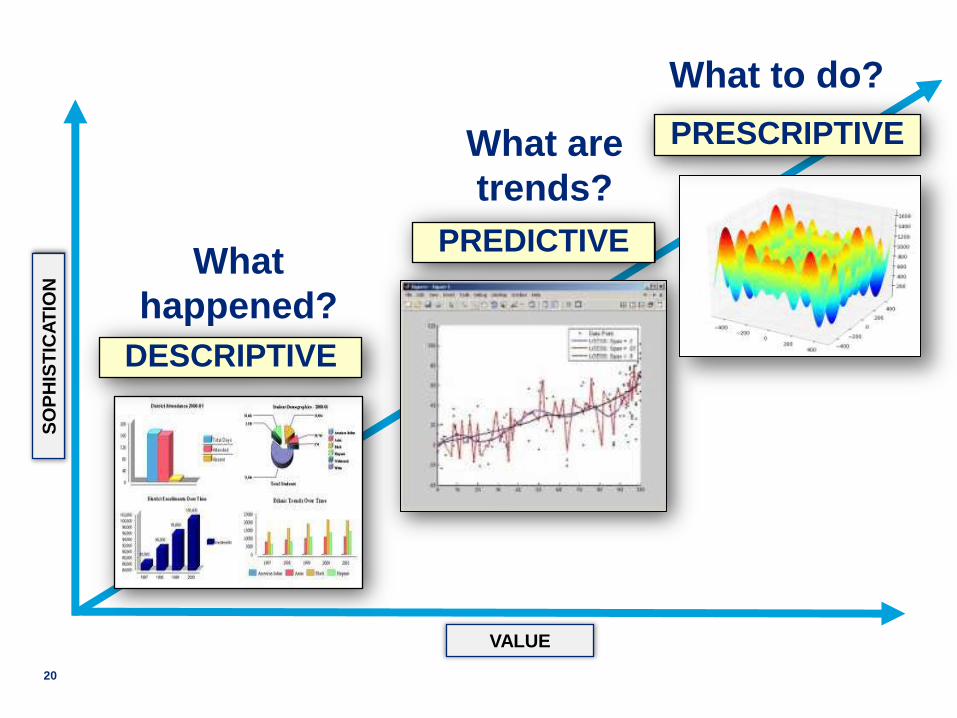
VALUE
SO
PH
IST
ICA
TIO
N
What are
trends?
What
happened?
What to do?
DESCRIPTIVE
PREDICTIVE
PRESCRIPTIVE
20

Analytics as a process Making smarter decisions
PREDICTIVE DESCRIPTIVE
PRESCRIPTIVE
21
2013 Scott Mongeau
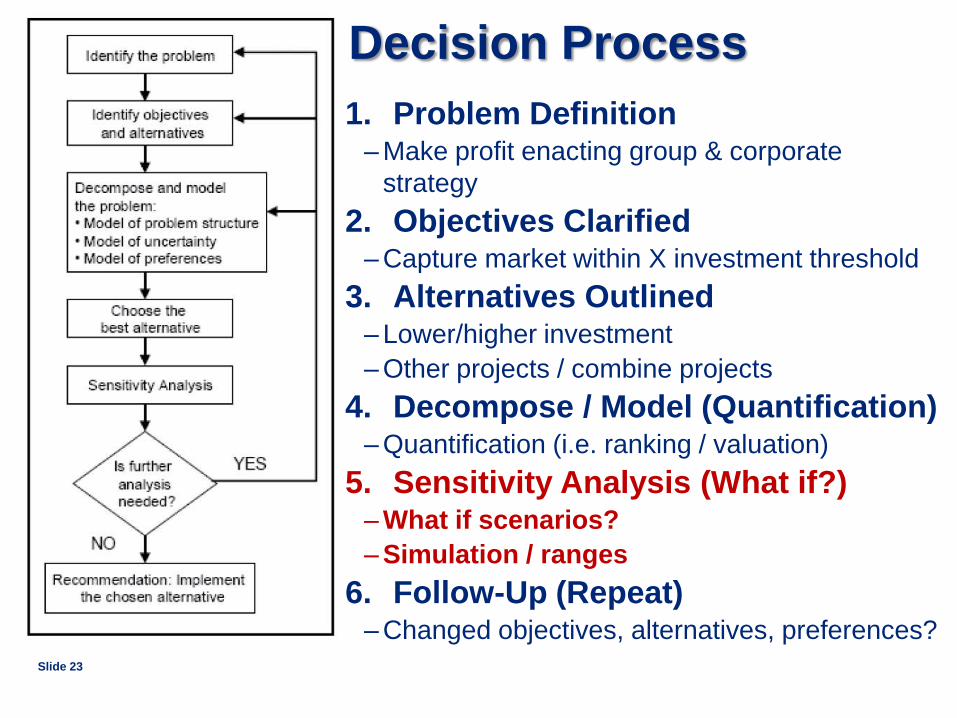
1. Problem Definition – Make profit enacting group & corporate
strategy
2. Objectives Clarified – Capture market within X investment threshold
3. Alternatives Outlined – Lower/higher investment
– Other projects / combine projects
4. Decompose / Model (Quantification) – Quantification (i.e. ranking / valuation)
5. Sensitivity Analysis (What if?) – What if scenarios?
– Simulation / ranges
6. Follow-Up (Repeat) – Changed objectives, alternatives, preferences?
Slide 23
Decision Process

Tools: Innovation Decision Process
Slide 24

25
Palisade DecisionTools Suite
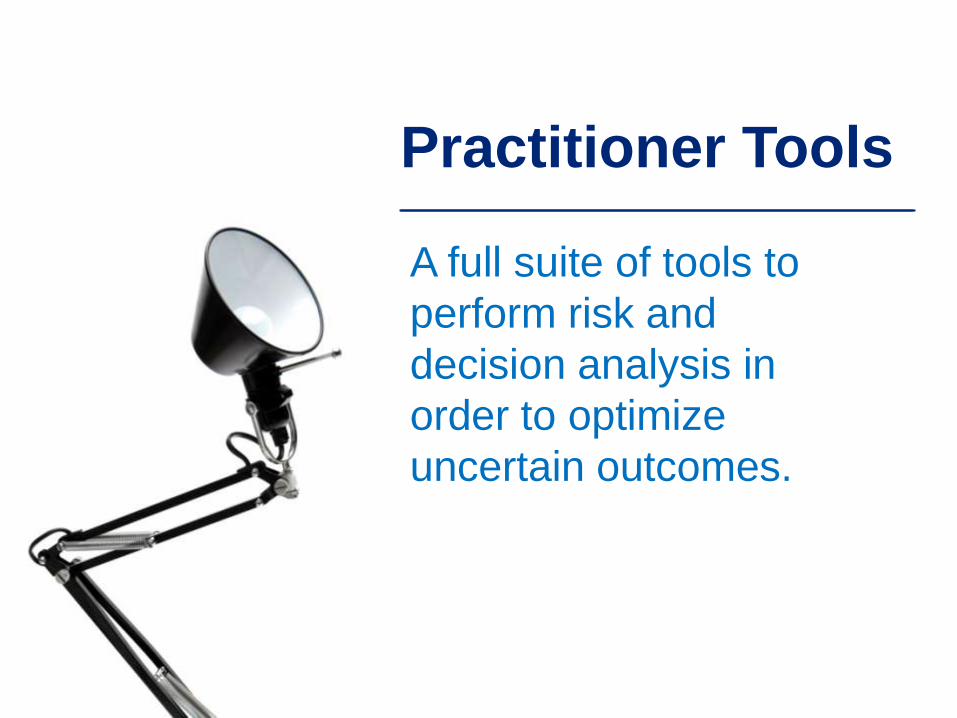
Practitioner Tools
A full suite of tools to
perform risk and
decision analysis in
order to optimize
uncertain outcomes.
Innovation Decision Process
Slide 27
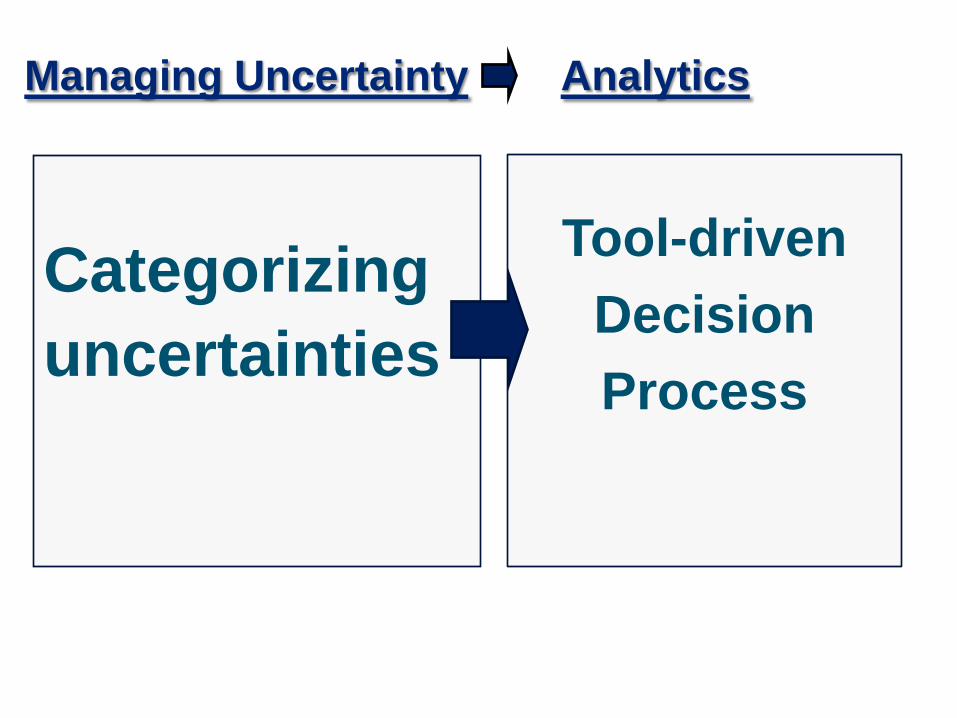
Managing Uncertainty Analytics
Tool-driven
Decision
Process
Categorizing
uncertainties
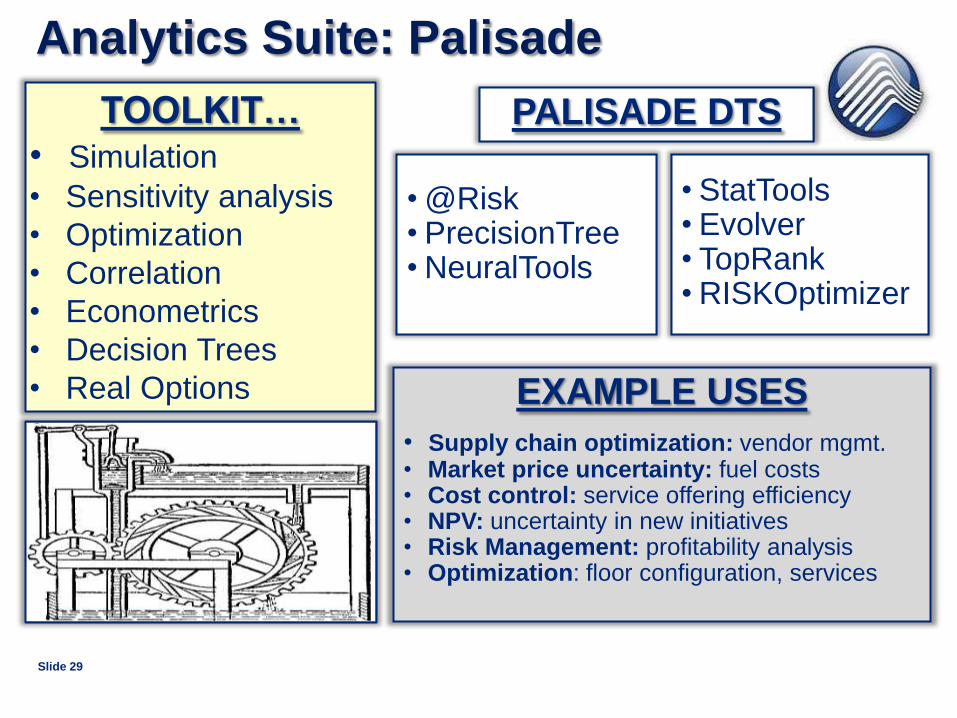
Analytics Suite: Palisade
Slide 29
TOOLKIT…
• Simulation
• Sensitivity analysis
• Optimization
• Correlation
• Econometrics
• Decision Trees
• Real Options EXAMPLE USES
• Supply chain optimization: vendor mgmt. • Market price uncertainty: fuel costs • Cost control: service offering efficiency • NPV: uncertainty in new initiatives • Risk Management: profitability analysis • Optimization: floor configuration, services
• @Risk • PrecisionTree • NeuralTools
• StatTools • Evolver • TopRank • RISKOptimizer
PALISADE DTS
30
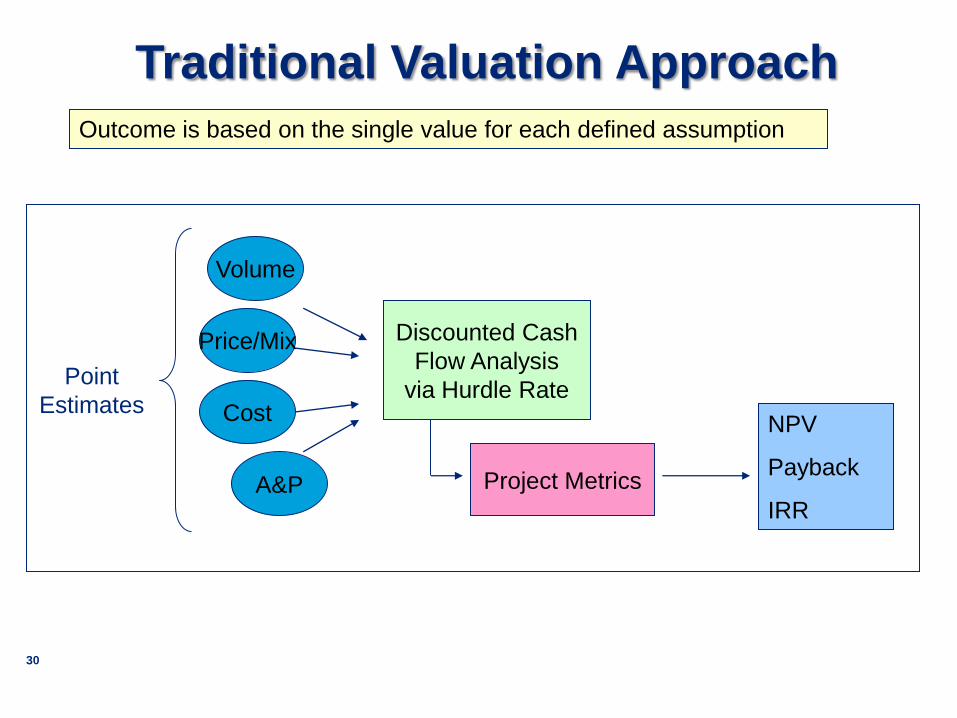
Traditional Valuation Approach
Volume
Outcome is based on the single value for each defined assumption
Price/Mix
Cost
A&P
Discounted Cash
Flow Analysis
via Hurdle Rate
Project Metrics
Point
Estimates NPV
Payback
IRR
Slide 31
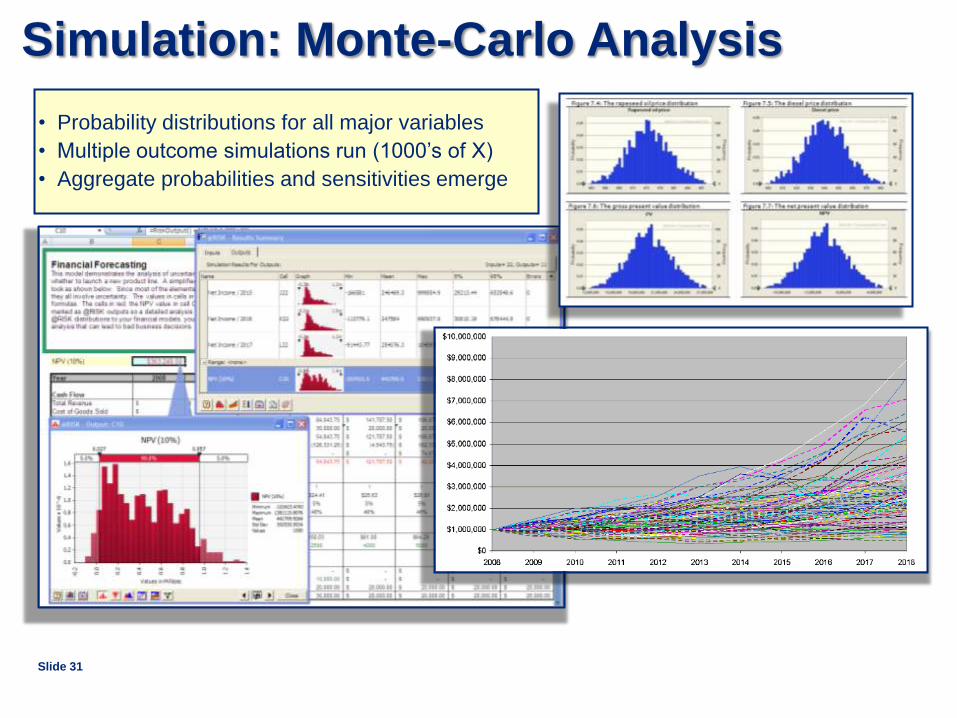
Simulation: Monte-Carlo Analysis
• Probability distributions for all major variables
• Multiple outcome simulations run (1000’s of X)
• Aggregate probabilities and sensitivities emerge

32
Simulation Approach to Valuation
Volume
Price/Mix
Cost
A&P
Discounted Cash
Flow Analysis
Monte
Carlo
Simulation
Outcome is a range of possible values generated from applying simulation
techniques to key assumptions using business developed probabilities
Value
Ranges
Analysis role becomes more value added through increased collaboration and
communication with project team on key drivers and risks & opportunities
Project Metrics
Range of
Possible
Outcomes for
NPV, Payback
and IRR
Key Drivers
Risks &
Opportunities
Slide 33
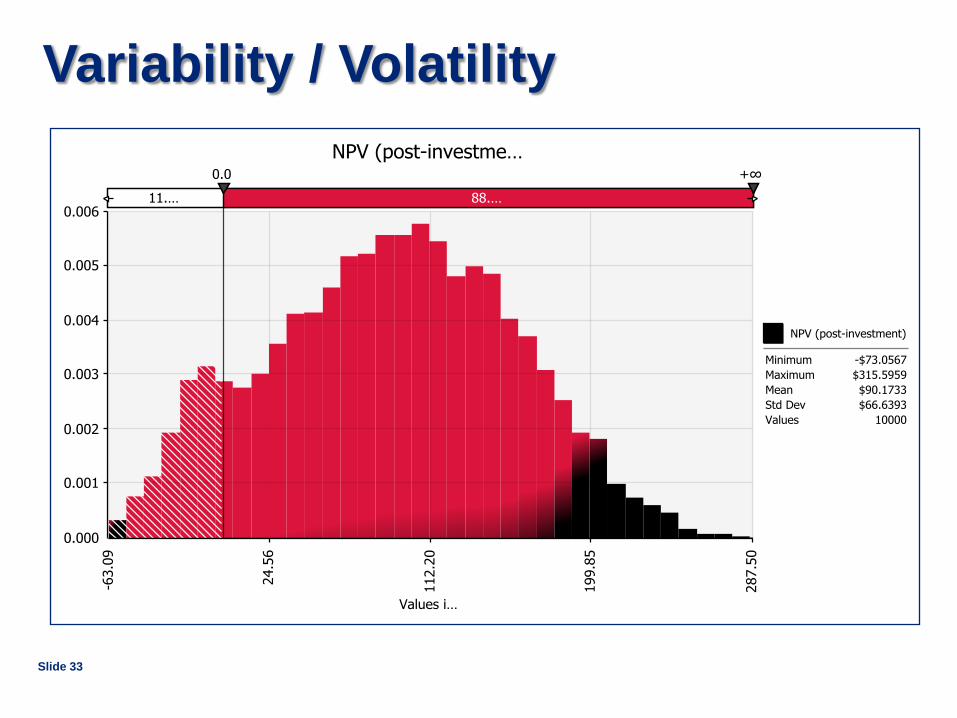
Variability / Volatility
Slide 34
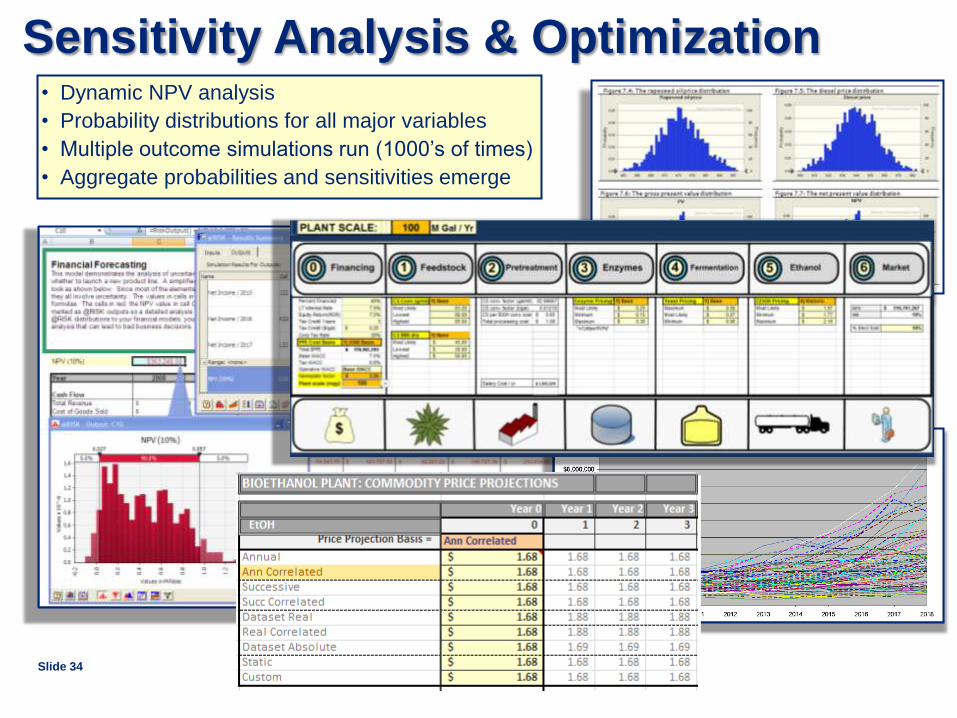
• Dynamic NPV analysis
• Probability distributions for all major variables
• Multiple outcome simulations run (1000’s of times)
• Aggregate probabilities and sensitivities emerge
Sensitivity Analysis & Optimization

35
Examples

Analytics is a rapidly evolving
space. We maintain a focus on
bringing new developments to
bear to optimize value-creating
decisions.
Trends in perspective

Simulation: Scenarios
•Investment – Estimated cost
– Product development cost
•Production – Capital expense
– Overhead
– Total expenses
•Economic
conditions – Inflation
– Currency exchange
– Unemployment
Slide 37
•Commodity cost scenarios
•Market Simulation –Estimated #
Customers –Competitors –Cost per installation
•Sales –Sales price –Sale volume

Slide 38
• SEE: Mongeau, S. 2010. Cellulosic Bioethanol Plant Simulator: Managing
Uncertainty in Complex Business Environments. 2010 Palisade EMEA
Conference
• Iterative model development working with area experts
Case 1: Integrated Operational Cost / Revenue Analysis

ViBeS: Virtual Bioethanol-plant Simulator
Slide 39
• NPV
• Revenues
• Expenses (OPEX)
• Scale
• Transport
• PPE (CAPEX)
• Depreciation
• Financing
• Econometrics
Slide 40
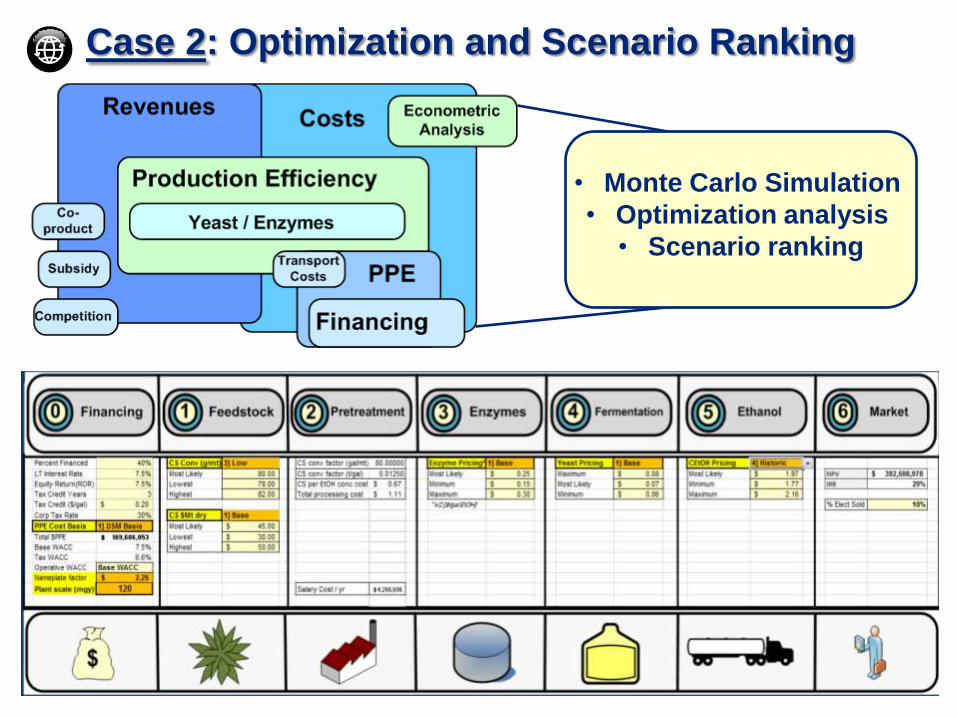
• Monte Carlo Simulation
• Optimization analysis
• Scenario ranking
Case 2: Optimization and Scenario Ranking
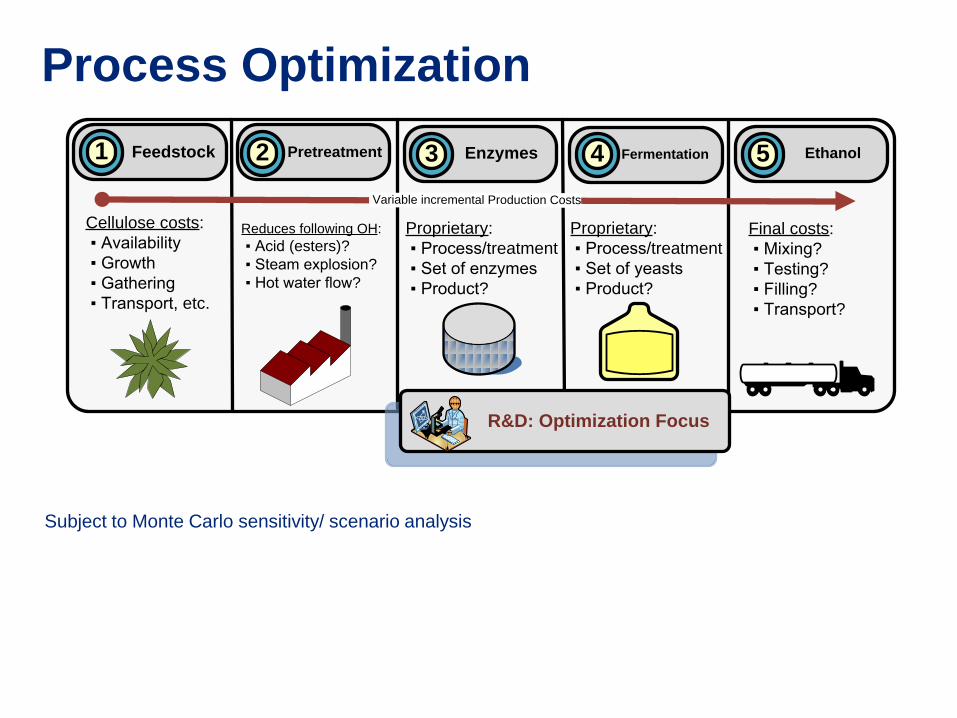
Process Optimization
Subject to Monte Carlo sensitivity/ scenario analysis
Slide
41
Feedstock1 Pretreatment2 Enzymes Fermentation Ethanol3 4 5
Variable incremental Production Costs
Cellulose costs:
▪ Availability
▪ Growth
▪ Gathering
▪ Transport, etc.
Reduces following OH:
▪ Acid (esters)?
▪ Steam explosion?
▪ Hot water flow?
Proprietary:
▪ Process/treatment
▪ Set of enzymes
▪ Product?
Proprietary:
▪ Process/treatment
▪ Set of yeasts
▪ Product?
R&D: Optimization Focus
Final costs:
▪ Mixing?
▪ Testing?
▪ Filling?
▪ Transport?
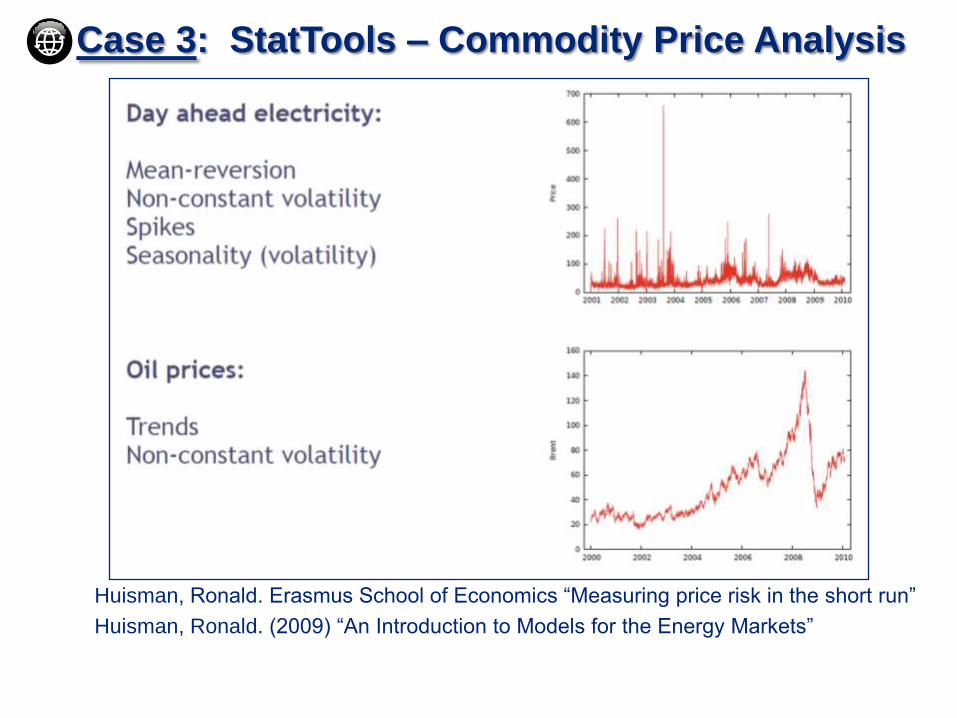
Huisman, Ronald. Erasmus School of Economics “Measuring price risk in the short run”
Huisman, Ronald. (2009) “An Introduction to Models for the Energy Markets”
Case 3: StatTools – Commodity Price Analysis

Case 4: @Risk – Market Behavior Simulation
• Market competition and
consumer behavior
simulation
– Market size
– Usage per customer
– Chance of competitor
entering market
• NPV distribution result
• Monte Carlo analysis
• Results in distributions
concerning market size
and potential profits
Slide 43
Slide
44
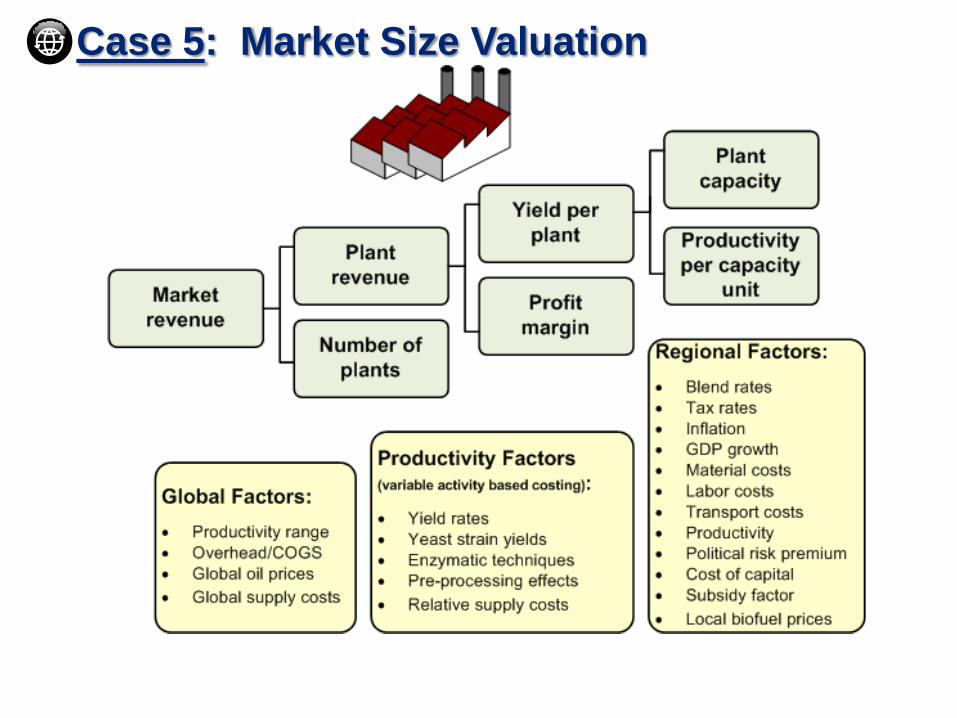
Case 5: Market Size Valuation

Market Competition Simulation / Analysis
• Estimates Required – Product pricing (profits) – Expenses (costs) – Market size – Market growth rate – Point of entry – # of competitors – Possible new entrants – Relevant macroeconomic effects – Estimate ratio of investment to market capture (using example data ideally)
• What is achieved – Optimization / efficiency – Estimates average profitability and riskiness of new products – Gives confidence probability of capturing / holding certain market size – Projected revenues (NPV projection with confidence levels) – Sensitivity analysis (Tornado Graphs) concerning impactful factors
effecting NPV – Scenario analysis with optimal scenario profiles

Example: Tornado Graph – Profit Sensitivities and
Competitive Effects
Slide 46
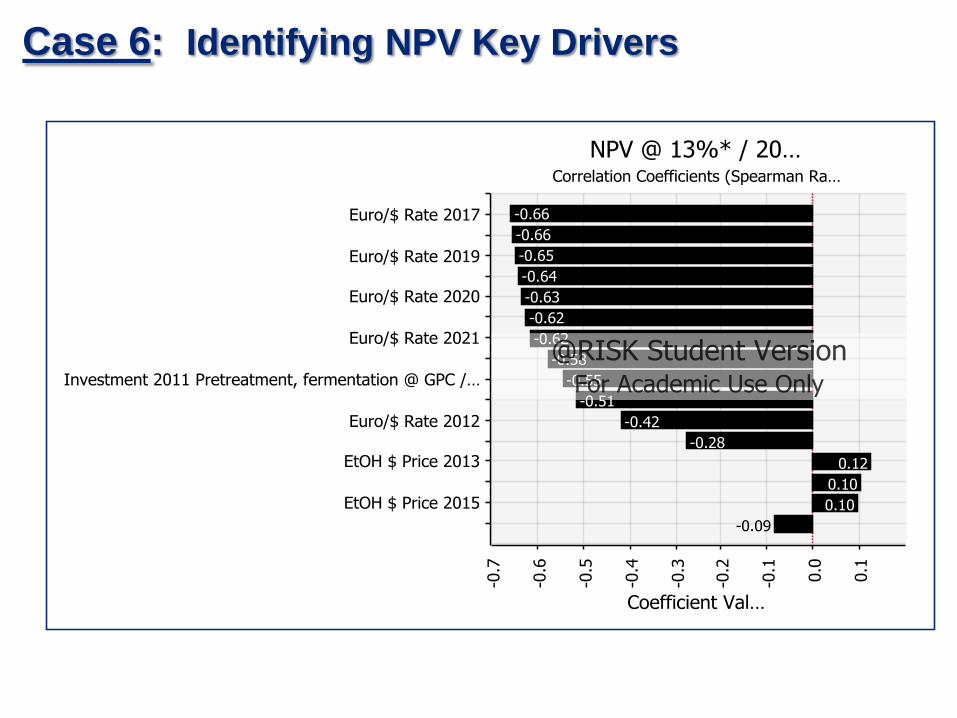
Case 6: Identifying NPV Key Drivers

Example: Histogram - Identifying Non-Normal NPV Distribution
• Right skew • Large mean and less spread equates to lower risk of returns • Spread around mean: SD of NPV $410 million
Slide
49
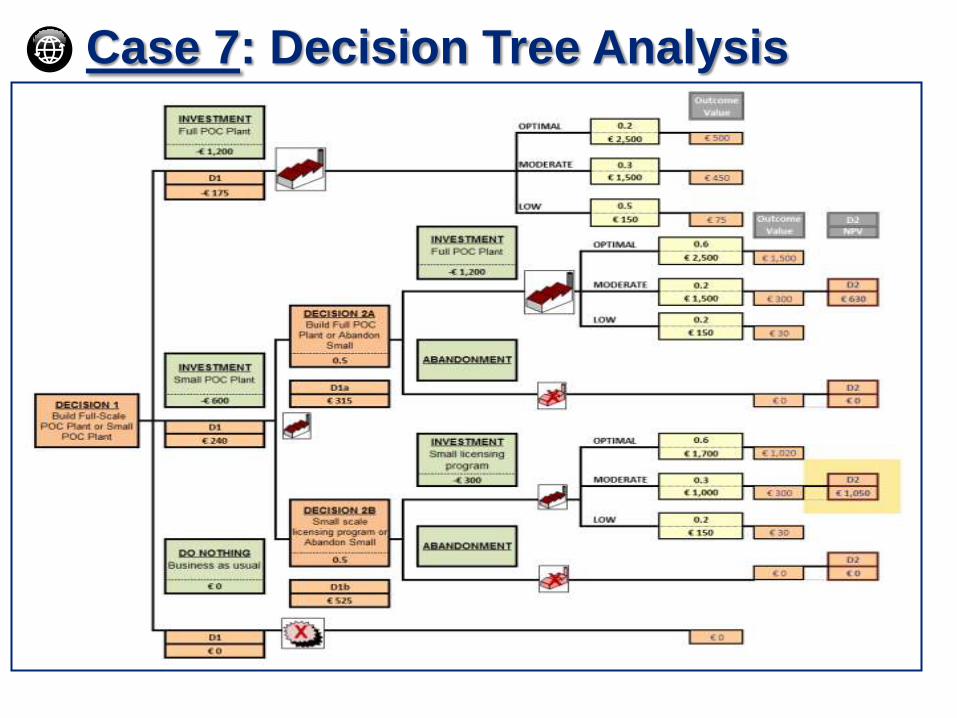
Case 7: Decision Tree Analysis

Option value determined by…
Slide 50
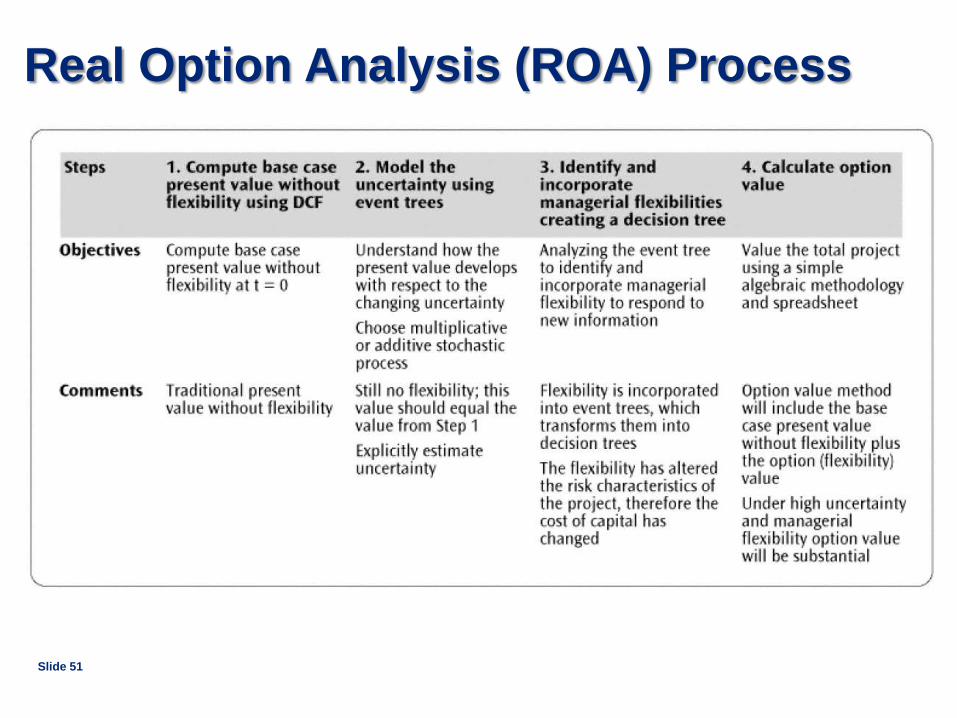
Real Option Analysis (ROA) Process
Slide 51
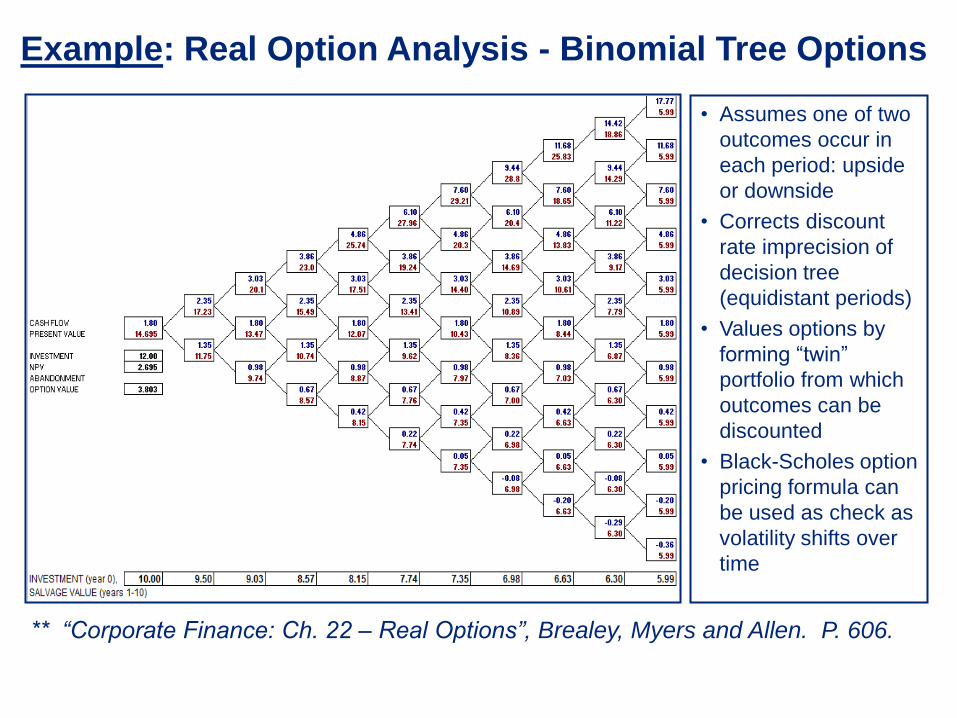
Example: Real Option Analysis - Binomial Tree Options
Slide
52
• Assumes one of two
outcomes occur in
each period: upside
or downside
• Corrects discount
rate imprecision of
decision tree
(equidistant periods)
• Values options by
forming “twin”
portfolio from which
outcomes can be
discounted
• Black-Scholes option
pricing formula can
be used as check as
volatility shifts over
time
** “Corporate Finance: Ch. 22 – Real Options”, Brealey, Myers and Allen. P. 606.
Slide
53
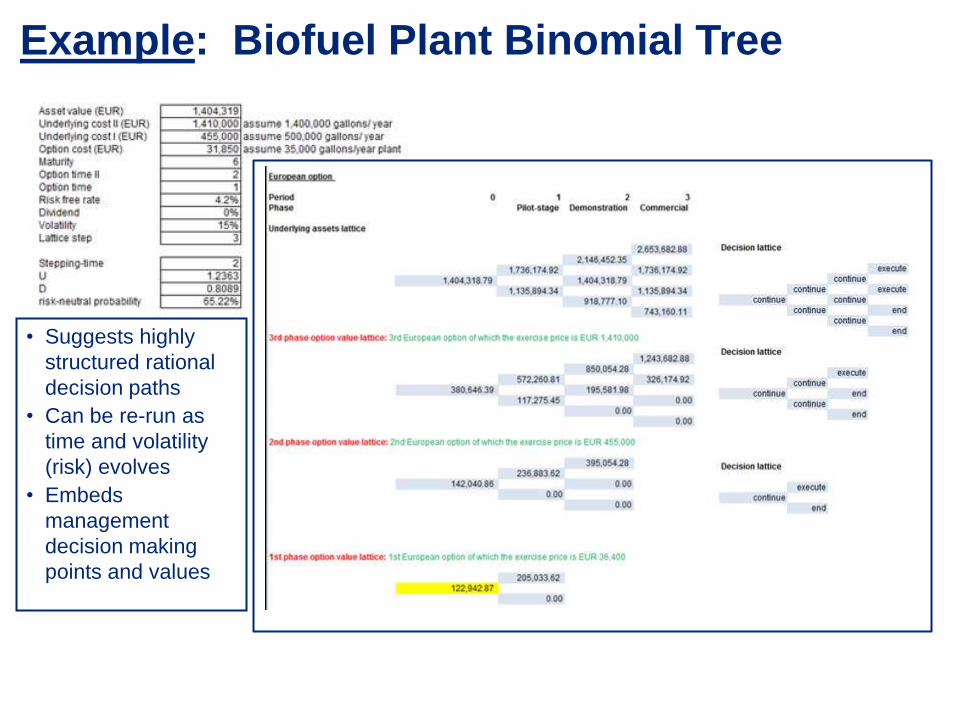
Example: Biofuel Plant Binomial Tree
• Suggests highly
structured rational
decision paths
• Can be re-run as
time and volatility
(risk) evolves
• Embeds
management
decision making
points and values
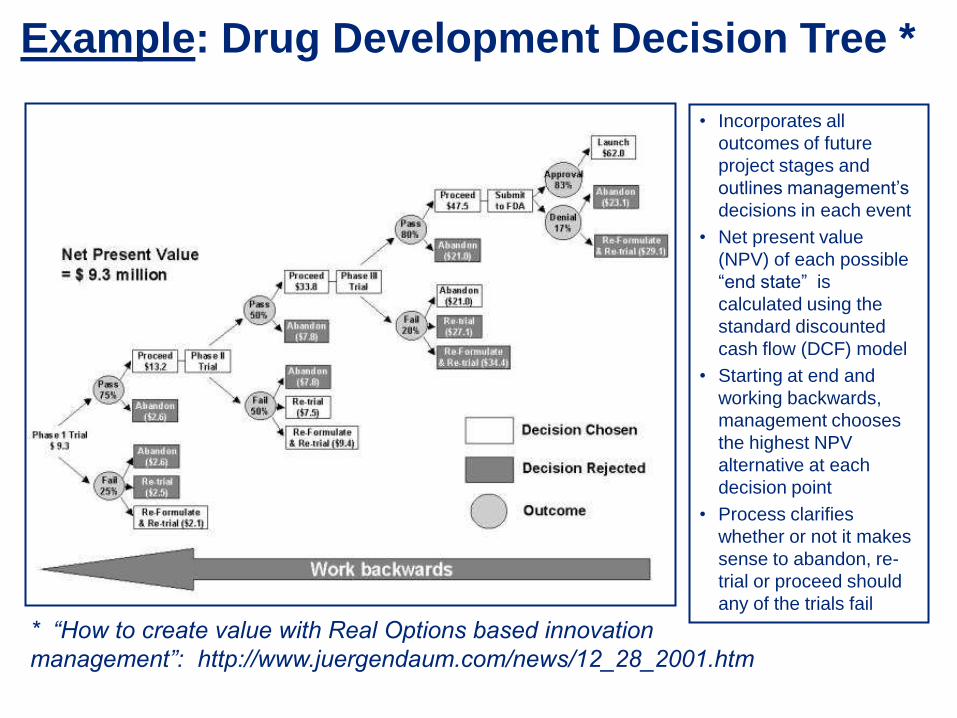
Example: Drug Development Decision Tree *
Slide
54
* “How to create value with Real Options based innovation
management”: http://www.juergendaum.com/news/12_28_2001.htm
• Incorporates all
outcomes of future
project stages and
outlines management’s
decisions in each event
• Net present value
(NPV) of each possible
“end state” is
calculated using the
standard discounted
cash flow (DCF) model
• Starting at end and
working backwards,
management chooses
the highest NPV
alternative at each
decision point
• Process clarifies
whether or not it makes
sense to abandon, re-
trial or proceed should
any of the trials fail
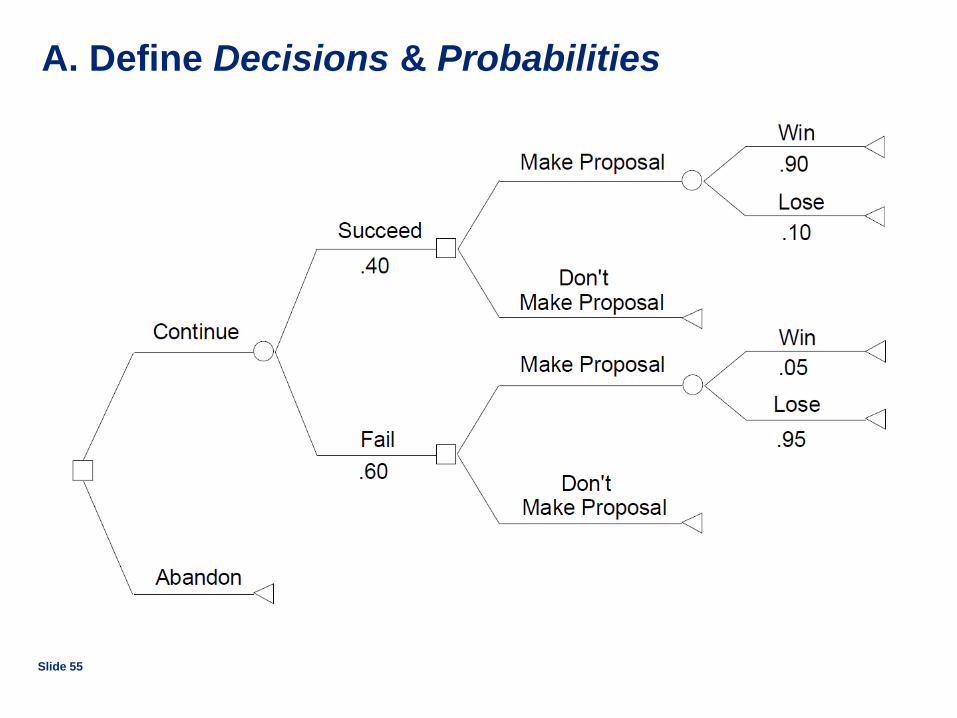
A. Define Decisions & Probabilities
Slide 55

B. Quantify Final Outcomes
Slide 56
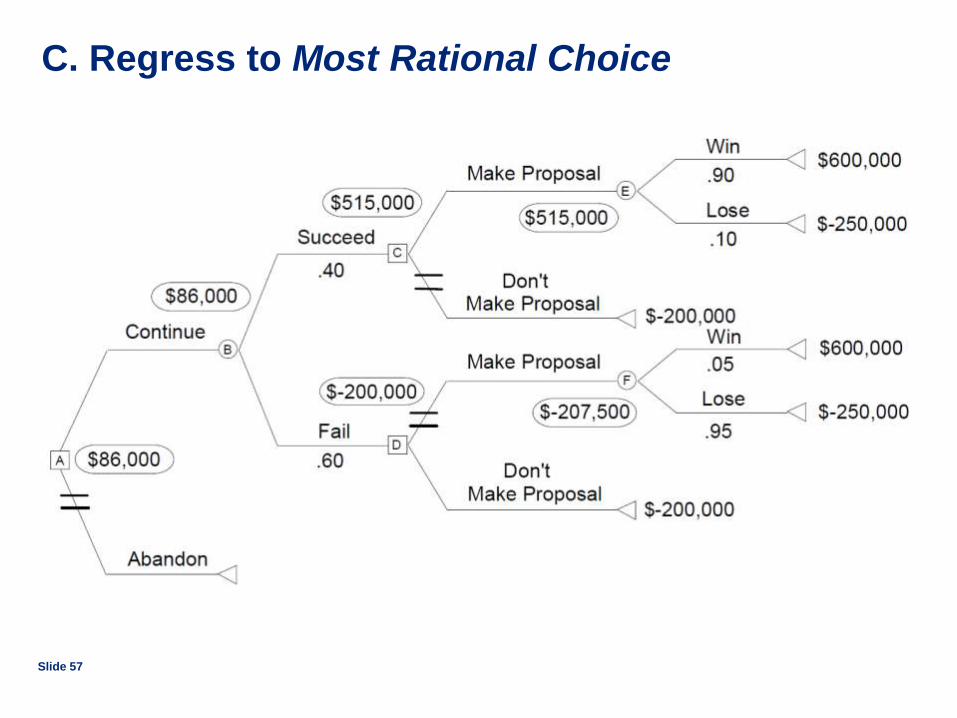
C. Regress to Most Rational Choice
Slide 57
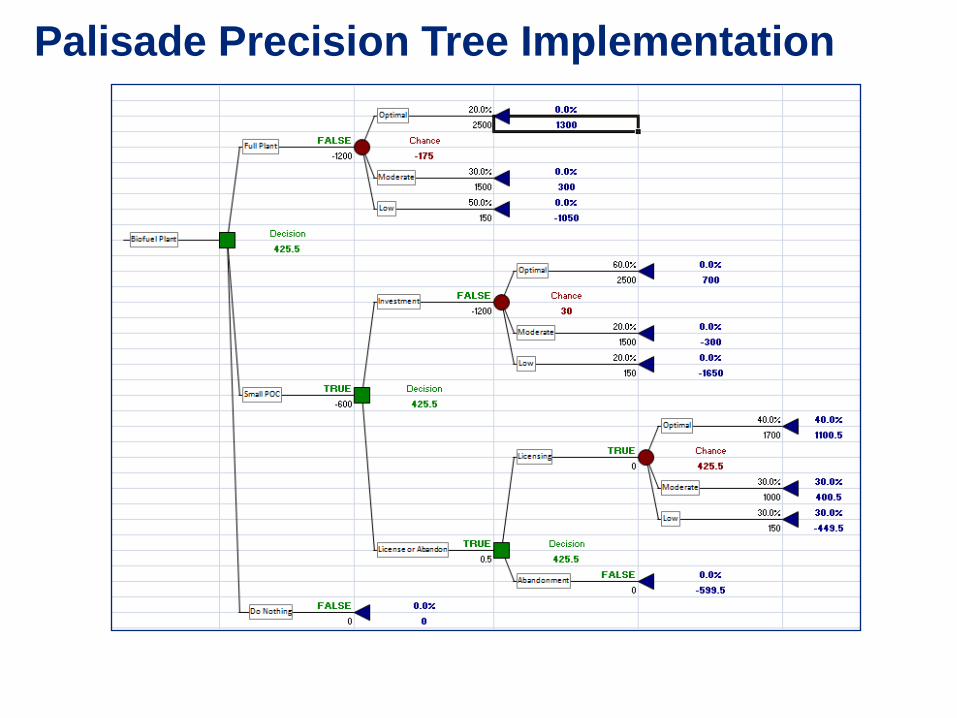
Palisade Precision Tree Implementation
Slide 58

Example: Biofuel Plant Tree Analysis
1. Add management
decision points,
investments
required, and
probabilities
2. NPV valuation of
each node in
scenarios (DCF)
3. Work backwards to
probabilistic
‘inherent value’ of
management option
to expand/contract at
each step
4. Choose for highest
NPV value at each
decision point
5. Revise as
probabilities,
decisions, and
values as time
progresses
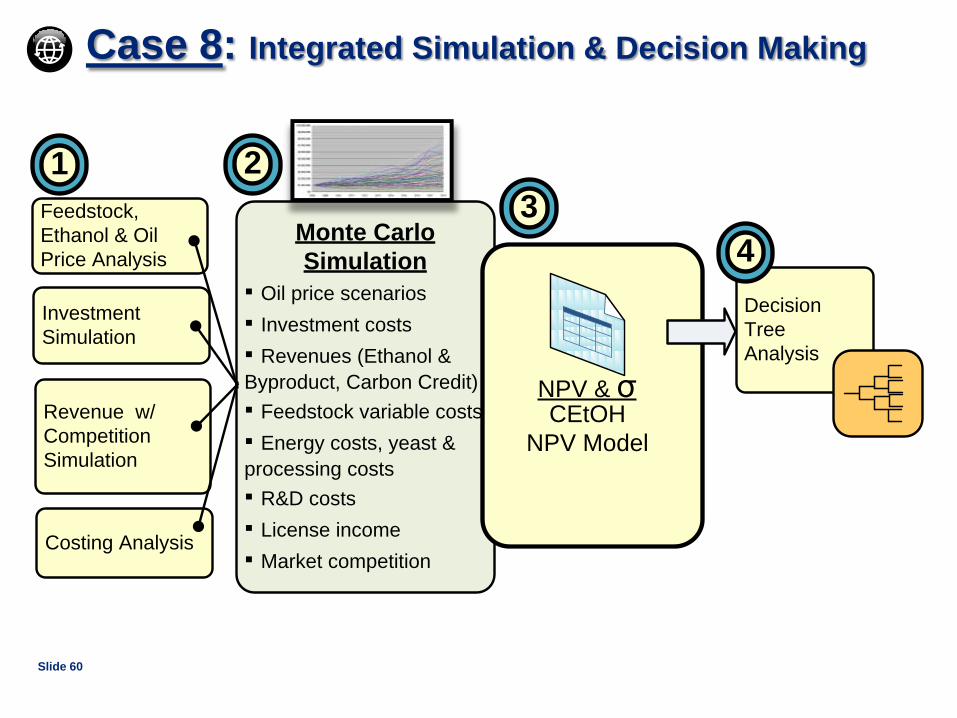
Slide 60
2
Decision
Tree
Analysis
Monte Carlo
Simulation
▪ Oil price scenarios
▪ Investment costs
▪ Revenues (Ethanol &
Byproduct, Carbon Credit)
▪ Feedstock variable costs
▪ Energy costs, yeast &
processing costs
▪ R&D costs
▪ License income
▪ Market competition
Revenue w/
Competition
Simulation
Feedstock,
Ethanol & Oil
Price Analysis
Costing Analysis
Investment
Simulation
3
4
CEtOH
NPV Model
NPV & σ
1
Case 8: Integrated Simulation & Decision Making
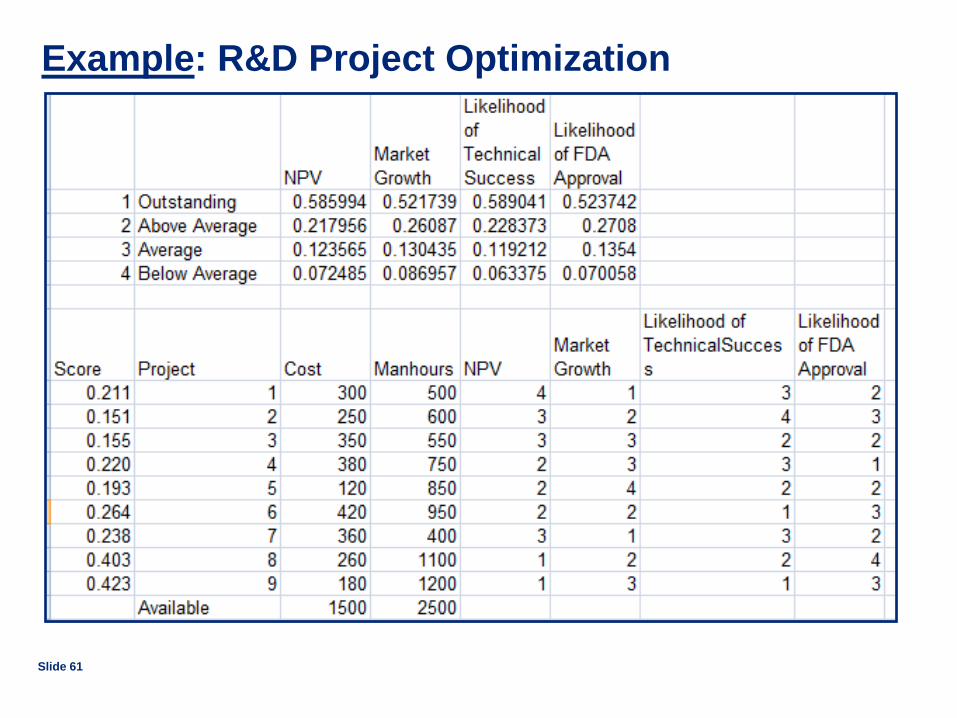
Example: R&D Project Optimization
Slide 61

Managing Uncertainty Analytics
Process Defined
1. NPV analysis
– Three processes
– Product strategies
2. Volatility simulation
– Monte-Carlo simulation
3. Decision Tree Analysis
– Use range of NPV end-points
– Add volatility (probability)
– Add key decision points
Uncertainties Categorized
1. Target process(es) to employ
• Associated costs?
2. Product strategy
• Associated revenues?
3. Revenue forecasting
• Competition, economic factors?
4. Process cost analysis
• Productivity variability?
5. IPM planning / decision making
• What decisions, made when?
Slide 62
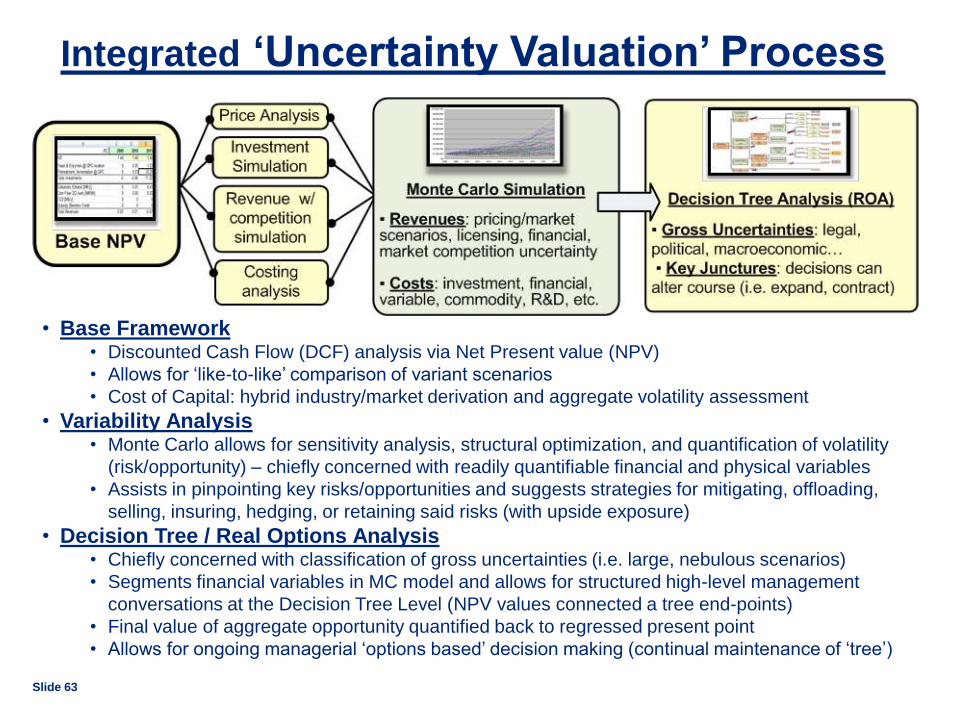
Integrated ‘Uncertainty Valuation’ Process
• Base Framework • Discounted Cash Flow (DCF) analysis via Net Present value (NPV)
• Allows for ‘like-to-like’ comparison of variant scenarios
• Cost of Capital: hybrid industry/market derivation and aggregate volatility assessment
• Variability Analysis • Monte Carlo allows for sensitivity analysis, structural optimization, and quantification of volatility
(risk/opportunity) – chiefly concerned with readily quantifiable financial and physical variables
• Assists in pinpointing key risks/opportunities and suggests strategies for mitigating, offloading,
selling, insuring, hedging, or retaining said risks (with upside exposure)
• Decision Tree / Real Options Analysis • Chiefly concerned with classification of gross uncertainties (i.e. large, nebulous scenarios)
• Segments financial variables in MC model and allows for structured high-level management
conversations at the Decision Tree Level (NPV values connected a tree end-points)
• Final value of aggregate opportunity quantified back to regressed present point
• Allows for ongoing managerial ‘options based’ decision making (continual maintenance of ‘tree’)
Slide 63

64
Conclusion

Innovation Management
Powerful solutions for
innovation management
through state-of-the-art
approaches integrating people,
processes, and technology
perspectives.

Innovation Portfolio Management
66
Strategy
Valuation
Project Finance
Project Portfolio Management
Investment Portfolio
Management
Risk Management
Decision Management
ANALYTICS

Tool-driven Decision Process
Slide 67

Managing Uncertainty Analytics
Process Defined
1. NPV analysis
– Three processes
– Product strategies
2. Volatility simulation
– Monte-Carlo simulation
3. Real Options Analysis
– Use range of NPV end-points
– Add volatility (probability)
– Add key decision points
Uncertainties Categorized
1. Target process(es) to employ
• Associated costs?
2. Product strategy
• Associated revenues?
3. Revenue forecasting
• Competition, economic factors?
4. Process cost analysis
• Productivity variability?
5. R&D planning / decision making
• What decisions, made when?

APPENDIX

70
References

References: Decision Management • Blenko, M. W., Mankins, M. C., & Rogers, P. (2010, June). The decision-driven organization.
Harvard Business Review, June 2010, p 54 – 62.
• Hammond, J. S., Keeney, R. L., and Raiffa, H. (1999). Smart Choices: A Practical guide to
Making Better Decisions. Boston: Harvard Business School Press.
• An, L. (2011). "Modeling human decisions in coupled human and natural systems: Review of
agent-based models." Ecological Modelling.
• An, L. (2011). "Modeling human decisions in coupled human and natural systems: Review of
agent-based models." Ecological Modelling.
• Barney, J. (1999). "How a Firm's Capabilities Affect Boundary Decisions." Sloan Management
Review 40(3): 9.
• Blenko, M. W., M. C. Mankins, et al. (2010). "The Decision-Driven Organization." Harvard
Business Review.
• Chouinard, Y., J. Ellison, et al. (2011). "The Big Idea: The Sustainable Economy." Harvard
Business review 89(10): 11.
• Grote, G. (2009). Management of Uncertainty: Theory and Applications in the Design of
Systems and Organizations. London, Springer.
• Monch, L., P. Lendermann, et al. (2011). "A survey of challenges in modelling and decision-
making for discrete event logistics systems." Computers In Industry 62(6): 557-567.
• Zook, C. and J. Allen (2011). "The Great Repeatable Business Model." Harvard Business
Review 89(10).
Slide 71
References: Project Finance • Bodmer, E. (2010, October). Project modeling in excel. Program at Amsterdam
Institute of Finance from October 27 – 29, 2010. Amsterdam, Netherlands.
• De Servigny, A. and Jobst, N. (2007). The handbook of structured finance. ebook:
McGraw-Hill.
• Esty, B. C. (2004). Modern project finance: A casebook. Boston: John Wiley & Sons,
Inc.
• Fabozzi, F. J., Davis, H. A., and Choudhry, M. (2006). Introduction to structured
finance. New Jersey: John Wiley & Sons, Inc.
• Fabozzi, F. J., Kothari, V. (2008). Introduction to securitization. New Jersey: John
Wiley & Sons, Inc.
• Finnerty, J. D. (2007). Project financing: Asset-based financial engineering. New
Jersey: John Wiley & Sons, Inc.
• Gatti, S. (2008). Project finance in theory and practice. London: Elsevier.
• HBS Website. HBS project finance portal. Last retrieved March 2011 from
http://www.people.hbs.edu/besty/projfinportal/
• Major Projects Association Website. Major projects. Last retrieved March 2011 from
www.majorprojects.org
• Tan, W. (2007). Principles of project and infrastructure finance. London: Taylor &
Francis Group.
• Yescombe, E. R. (2002). Principles of project finance. Amsterdam: Academic Press.
Slide 72

73
Additional Examples
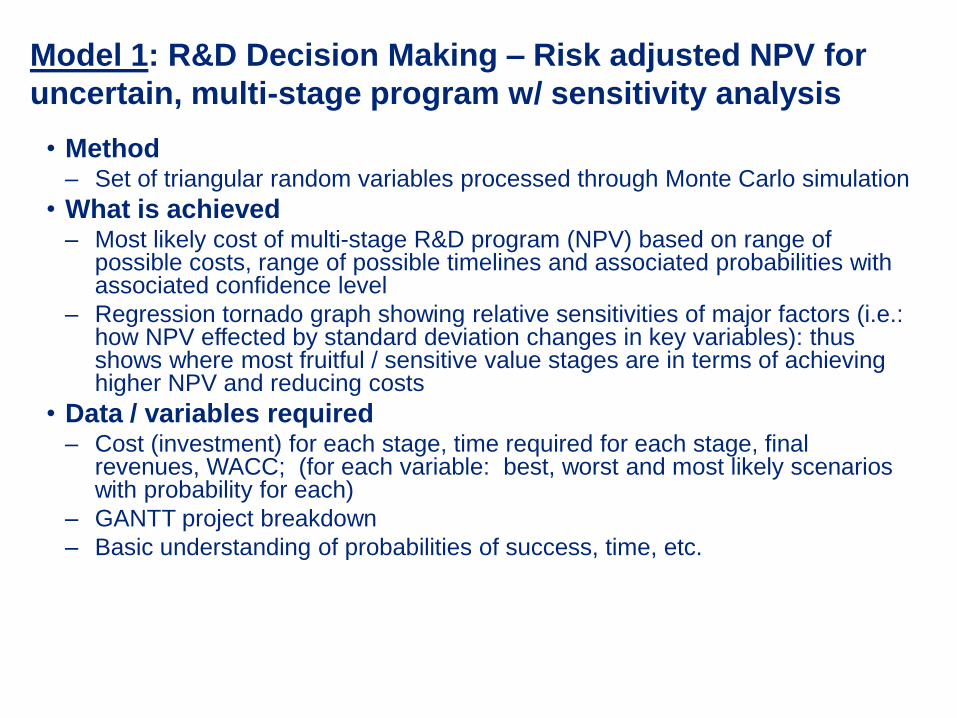
Model 1: R&D Decision Making – Risk adjusted NPV for
uncertain, multi-stage program w/ sensitivity analysis
• Method
– Set of triangular random variables processed through Monte Carlo simulation
• What is achieved – Most likely cost of multi-stage R&D program (NPV) based on range of
possible costs, range of possible timelines and associated probabilities with associated confidence level
– Regression tornado graph showing relative sensitivities of major factors (i.e.: how NPV effected by standard deviation changes in key variables): thus shows where most fruitful / sensitive value stages are in terms of achieving higher NPV and reducing costs
• Data / variables required – Cost (investment) for each stage, time required for each stage, final
revenues, WACC; (for each variable: best, worst and most likely scenarios with probability for each)
– GANTT project breakdown
– Basic understanding of probabilities of success, time, etc.
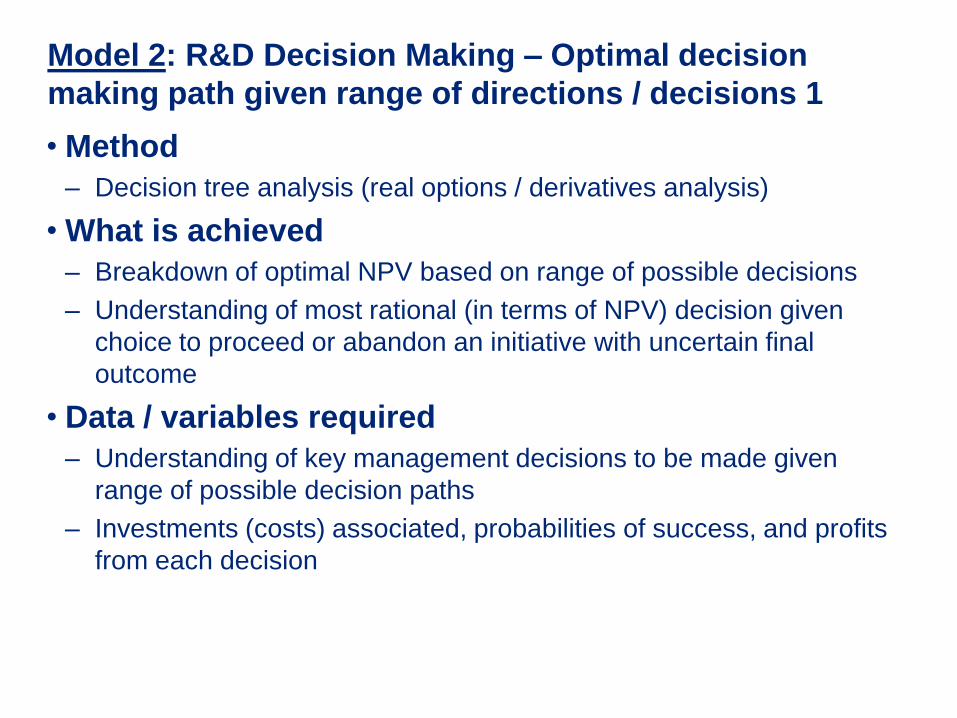
Model 2: R&D Decision Making – Optimal decision
making path given range of directions / decisions 1
• Method
– Decision tree analysis (real options / derivatives analysis)
• What is achieved
– Breakdown of optimal NPV based on range of possible decisions
– Understanding of most rational (in terms of NPV) decision given
choice to proceed or abandon an initiative with uncertain final
outcome
• Data / variables required
– Understanding of key management decisions to be made given
range of possible decision paths
– Investments (costs) associated, probabilities of success, and profits
from each decision
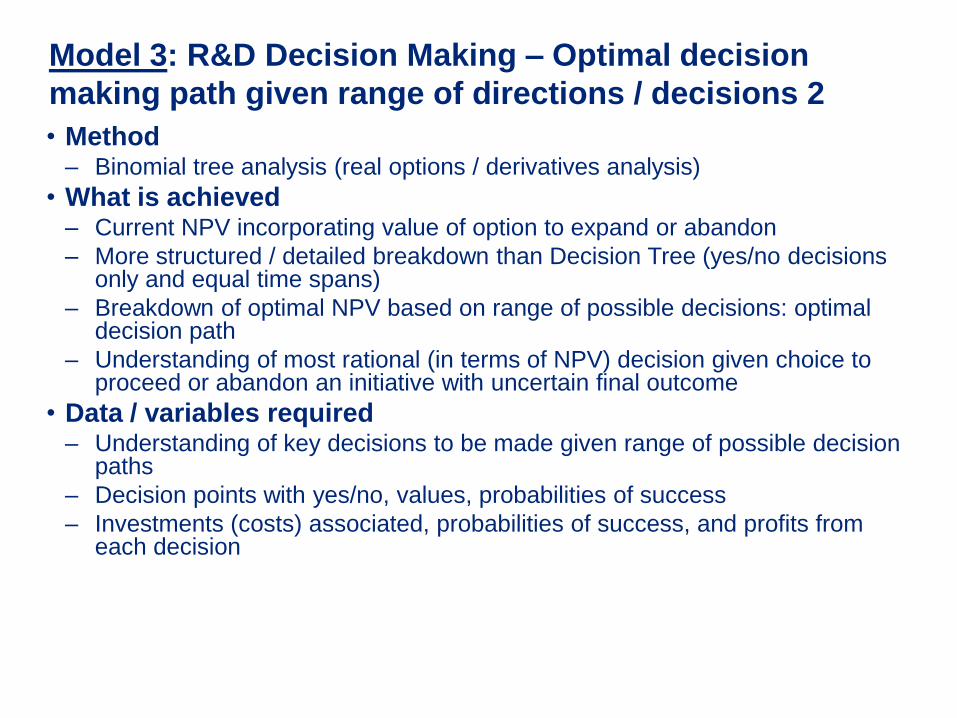
Model 3: R&D Decision Making – Optimal decision
making path given range of directions / decisions 2
• Method – Binomial tree analysis (real options / derivatives analysis)
• What is achieved – Current NPV incorporating value of option to expand or abandon
– More structured / detailed breakdown than Decision Tree (yes/no decisions only and equal time spans)
– Breakdown of optimal NPV based on range of possible decisions: optimal decision path
– Understanding of most rational (in terms of NPV) decision given choice to proceed or abandon an initiative with uncertain final outcome
• Data / variables required – Understanding of key decisions to be made given range of possible decision
paths
– Decision points with yes/no, values, probabilities of success
– Investments (costs) associated, probabilities of success, and profits from each decision
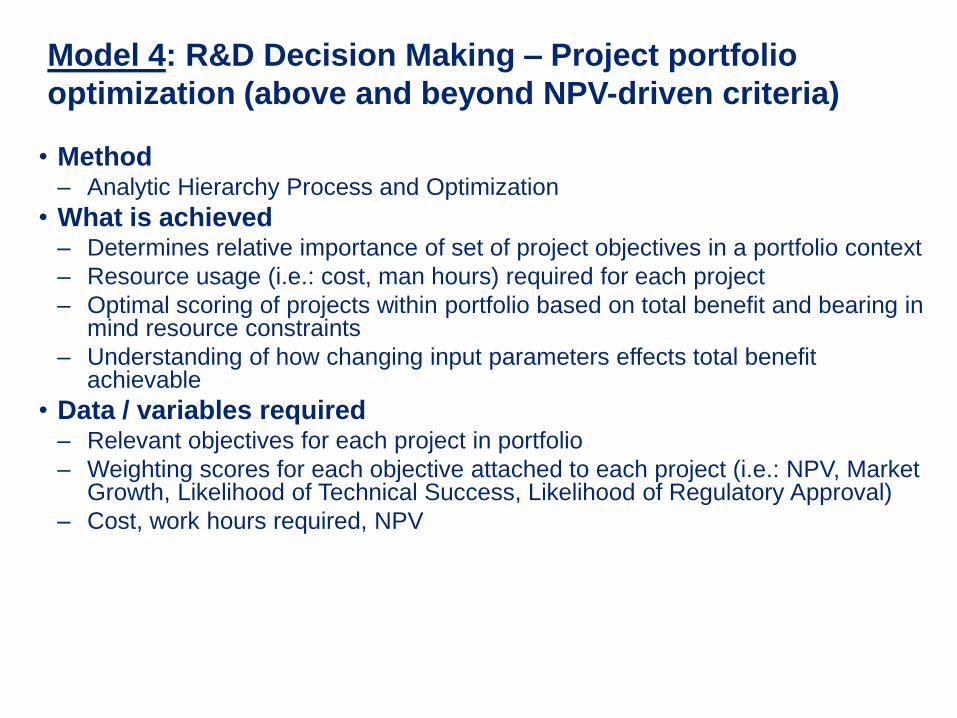
Model 4: R&D Decision Making – Project portfolio
optimization (above and beyond NPV-driven criteria)
• Method – Analytic Hierarchy Process and Optimization
• What is achieved – Determines relative importance of set of project objectives in a portfolio context
– Resource usage (i.e.: cost, man hours) required for each project
– Optimal scoring of projects within portfolio based on total benefit and bearing in mind resource constraints
– Understanding of how changing input parameters effects total benefit achievable
• Data / variables required – Relevant objectives for each project in portfolio
– Weighting scores for each objective attached to each project (i.e.: NPV, Market Growth, Likelihood of Technical Success, Likelihood of Regulatory Approval)
– Cost, work hours required, NPV

Example: R&D Project Optimization
Slide 78
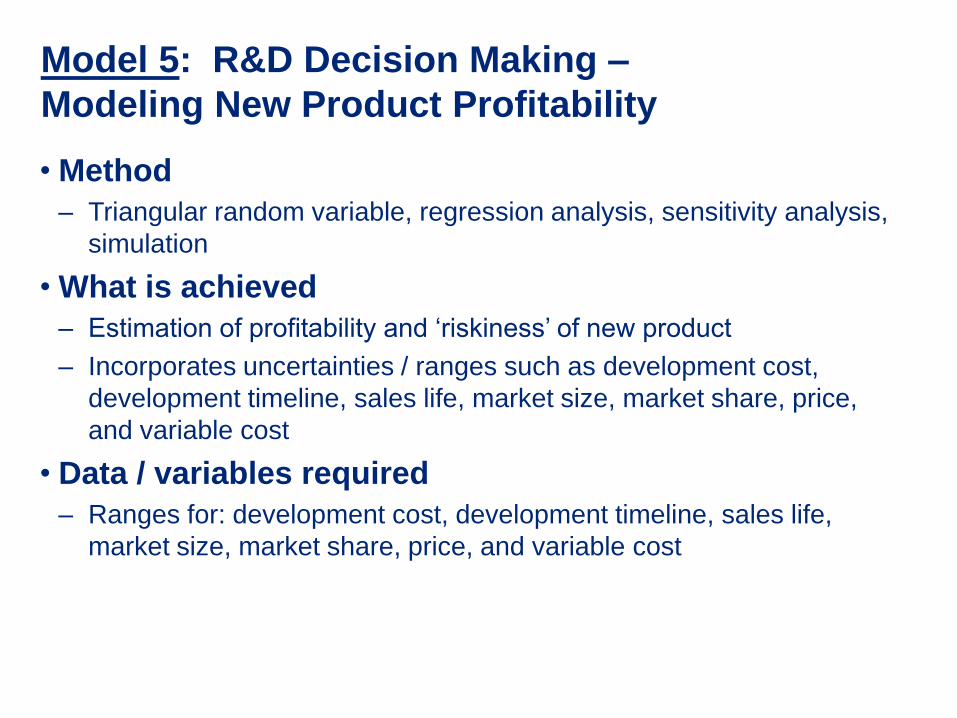
Model 5: R&D Decision Making –
Modeling New Product Profitability
• Method
– Triangular random variable, regression analysis, sensitivity analysis,
simulation
• What is achieved
– Estimation of profitability and ‘riskiness’ of new product
– Incorporates uncertainties / ranges such as development cost,
development timeline, sales life, market size, market share, price,
and variable cost
• Data / variables required
– Ranges for: development cost, development timeline, sales life,
market size, market share, price, and variable cost

Model 6: Cost Analysis –
Resolving Cost of Producing Product
• Method
– Sampling, regression analysis and optimization
• What is achieved
– Based on sampled (incomplete, generalized and/or global)
component cost information, determine optimized total cost of
product production
– Given incomplete information on costing, regression analysis alows
for targeted product costing with statistical confidence level
• Data / variables required
– Data on cost components of product
– Sample data on cost components (can also be based on similar /
related processes)
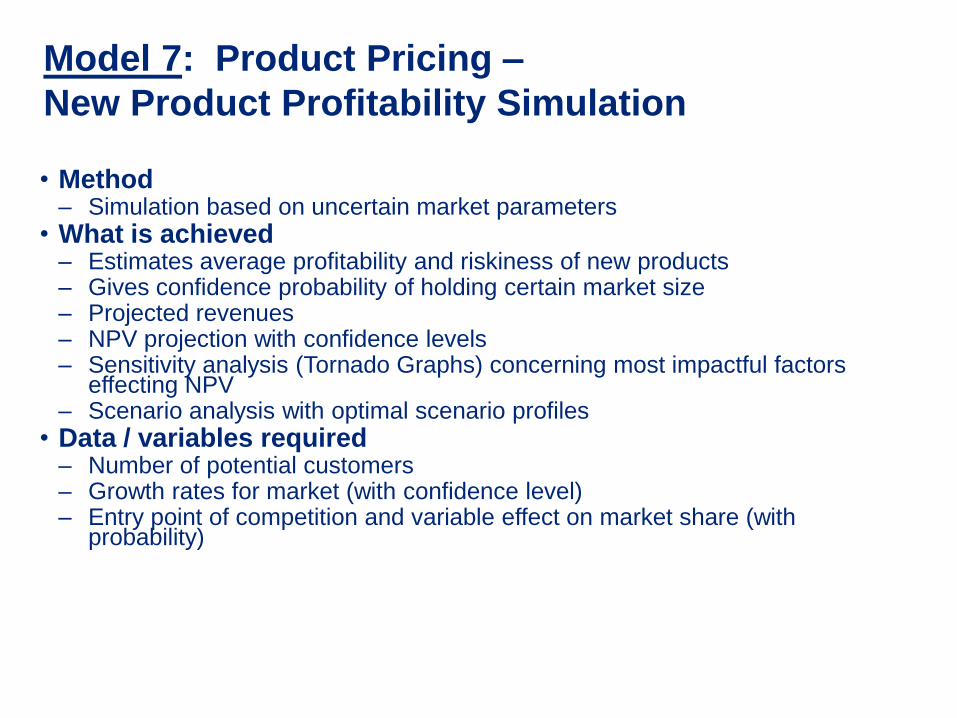
Model 7: Product Pricing –
New Product Profitability Simulation
• Method – Simulation based on uncertain market parameters
• What is achieved – Estimates average profitability and riskiness of new products – Gives confidence probability of holding certain market size – Projected revenues – NPV projection with confidence levels – Sensitivity analysis (Tornado Graphs) concerning most impactful factors
effecting NPV – Scenario analysis with optimal scenario profiles
• Data / variables required – Number of potential customers – Growth rates for market (with confidence level) – Entry point of competition and variable effect on market share (with
probability)
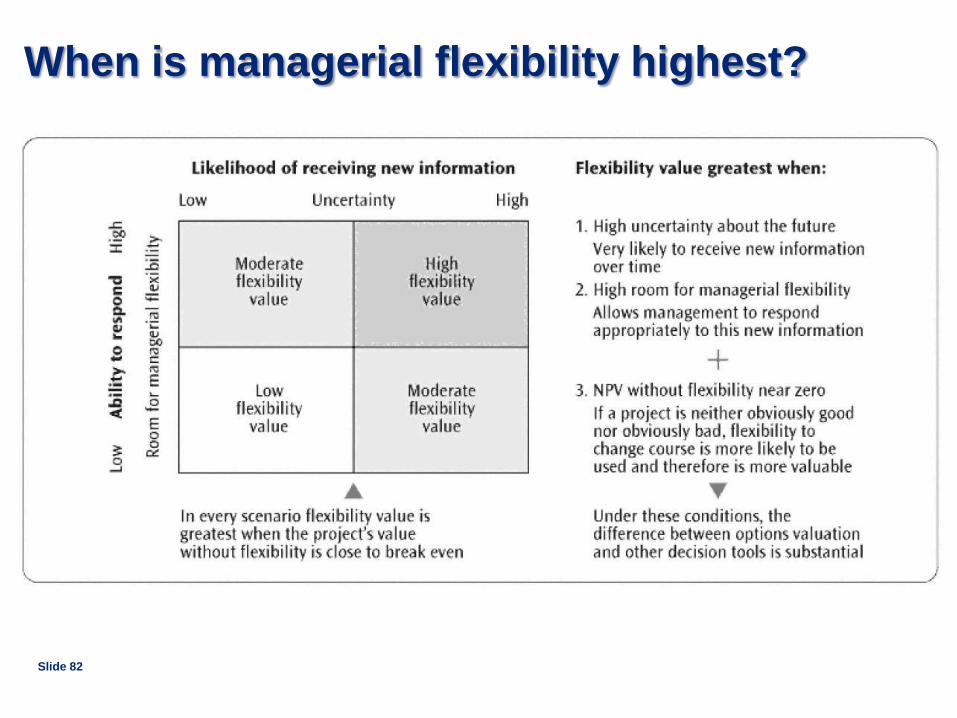
When is managerial flexibility highest?
Slide 82
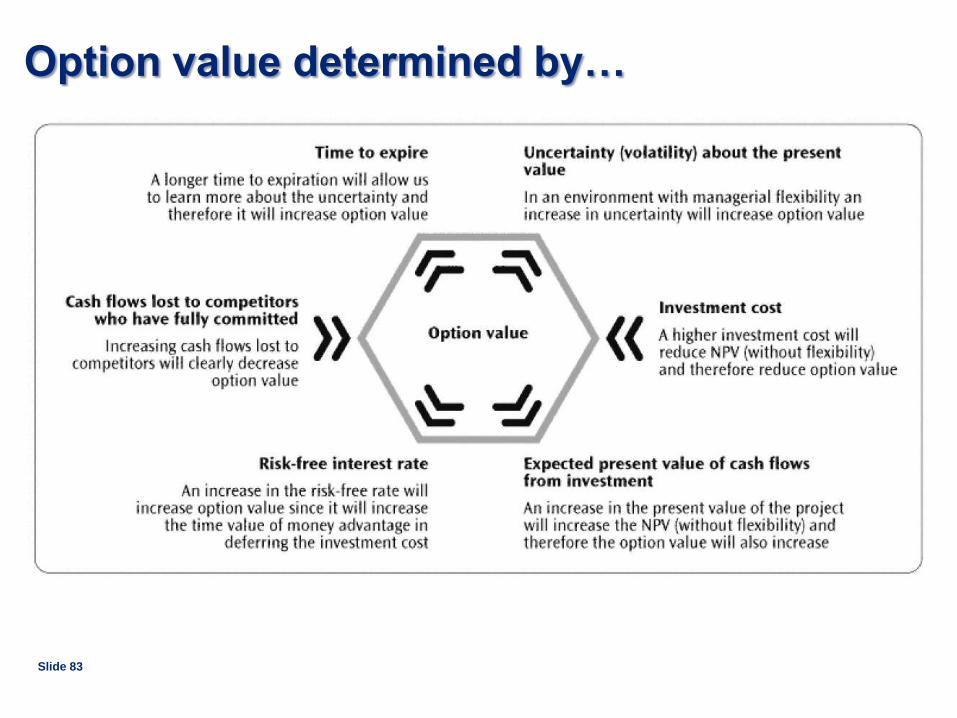
Option value determined by…
Slide 83

Real Option Analysis Process
Slide 84

85
Contact

Contact Details

87
Scott Mongeau
Manager Analytics
Deloitte Risk Services,
Netherlands
+31 (0)6 125 802 83
Contact Details
Advanced Analytics
The standard of excellence
as a one-stop-shop for full
service advanced analytics
solutions.