Embed Size (px)
Citation preview

Flash Eurobarometer 343
INNOVATION IN THE PUBLIC SECTOR: ITS PERCEPTION IN AND IMPACT ON BUSINESS
REPORT
Fieldwork: February-March 2012
Publication: June 2012
This survey has been requested by the European Commission, Directorate-General Enterprise and
Industry and co-ordinated by Directorate-General for Communication.
This document does not represent the point of view of the European Commission.
The interpretations and opinions contained in it are solely those of the authors.
Flash Eurobarometer 343 - TNS Political & Social

FLASH EUROBAROMETER XXX “Title”
1
Flash Eurobarometer 343
Innovation in the public sector: its perception in and impact on business
Conducted by TNS Political & Social at the request of the European Commission,
Directorate-General Enterprise and Industry
Survey co-ordinated by the European Commission,
Directorate-General for Communication (DG COMM “Research and Speechwriting” Unit)

FLASH EUROBAROMETER 343 “Public sector and company innovation”
2
TABLE OF CONTENTS
MAIN FINDINGS 3
INTRODUCTION: 5
1. Role of innovation in companies ........................................................ 8
1.1 Innovations in the (responding) companies .......................................... 8
2. Companies use of public services .................................................... 15
2.1 Use of public services by businesses ................................................... 15
2.2 Development of the public sector services for businesses ................... 20
2.3 Impact of the public sector services on businesses ............................. 23
3. Views on innovation in public services ............................................ 37
3.1 Most innovative public services ........................................................... 37
3.2 Conditions and support for innovation provided by the public sector .. 41
4. Public procurement and innovation ................................................. 53
CONCLUSION: 66
ANNEXES Technical specifications Questionnaire Tables
FLASH EUROBAROMETER 343 “Public sector and company innovation”
3
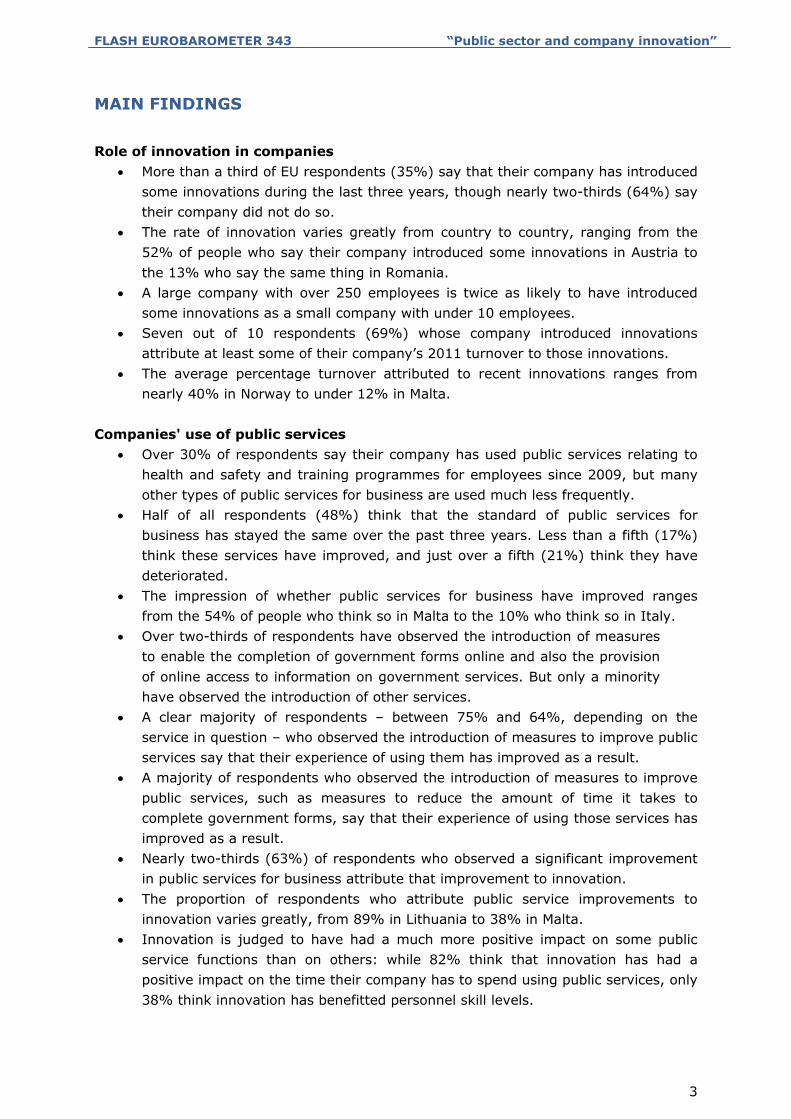
MAIN FINDINGS Role of innovation in companies
More than a third of EU respondents (35%) say that their company has introduced some innovations during the last three years, though nearly two-thirds (64%) say their company did not do so.
The rate of innovation varies greatly from country to country, ranging from the 52% of people who say their company introduced some innovations in Austria to the 13% who say the same thing in Romania.
A large company with over 250 employees is twice as likely to have introduced some innovations as a small company with under 10 employees.
Seven out of 10 respondents (69%) whose company introduced innovations attribute at least some of their company’s 2011 turnover to those innovations.
The average percentage turnover attributed to recent innovations ranges from nearly 40% in Norway to under 12% in Malta.
Companies' use of public services
Over 30% of respondents say their company has used public services relating to health and safety and training programmes for employees since 2009, but many other types of public services for business are used much less frequently.
Half of all respondents (48%) think that the standard of public services for business has stayed the same over the past three years. Less than a fifth (17%) think these services have improved, and just over a fifth (21%) think they have deteriorated.
The impression of whether public services for business have improved ranges from the 54% of people who think so in Malta to the 10% who think so in Italy.
Over two-thirds of respondents have observed the introduction of measures to enable the completion of government forms online and also the provision of online access to information on government services. But only a minority have observed the introduction of other services.
A clear majority of respondents – between 75% and 64%, depending on the service in question – who observed the introduction of measures to improve public services say that their experience of using them has improved as a result.
A majority of respondents who observed the introduction of measures to improve public services, such as measures to reduce the amount of time it takes to complete government forms, say that their experience of using those services has improved as a result.
Nearly two-thirds (63%) of respondents who observed a significant improvement in public services for business attribute that improvement to innovation.
The proportion of respondents who attribute public service improvements to innovation varies greatly, from 89% in Lithuania to 38% in Malta.
Innovation is judged to have had a much more positive impact on some public service functions than on others: while 82% think that innovation has had a positive impact on the time their company has to spend using public services, only 38% think innovation has benefitted personnel skill levels.
FLASH EUROBAROMETER 343 “Public sector and company innovation”
4
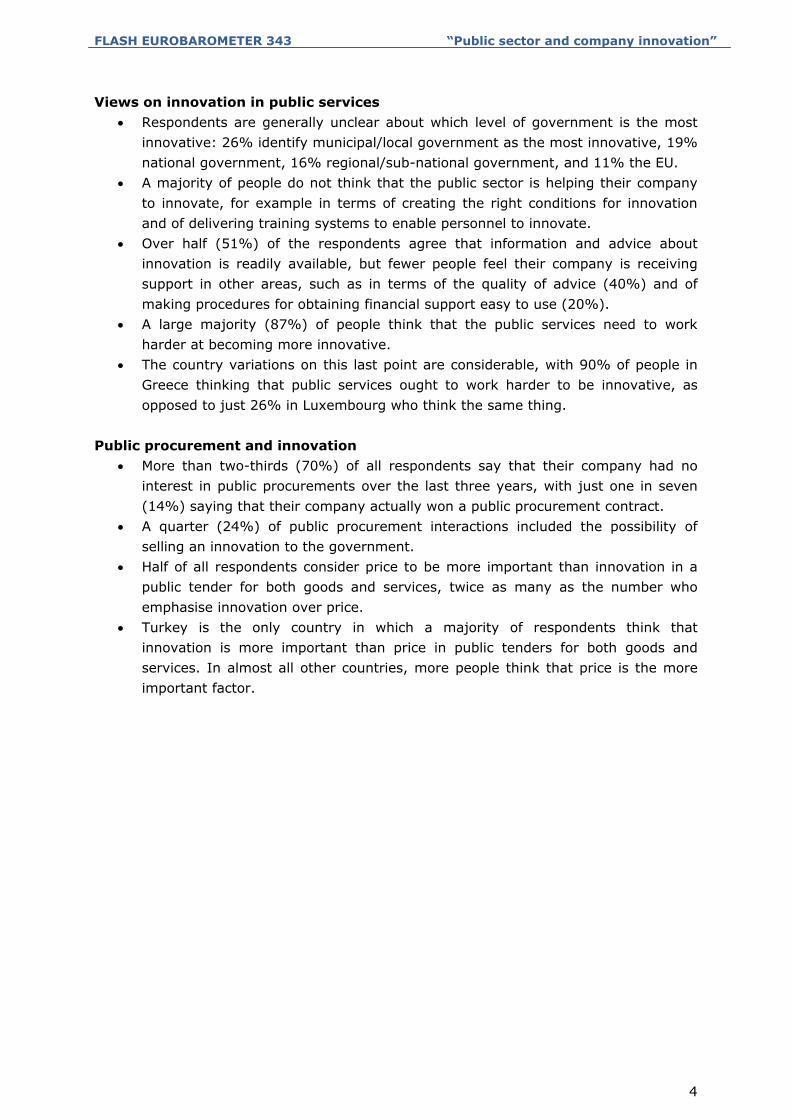
Views on innovation in public services Respondents are generally unclear about which level of government is the most
innovative: 26% identify municipal/local government as the most innovative, 19% national government, 16% regional/sub-national government, and 11% the EU.
A majority of people do not think that the public sector is helping their company to innovate, for example in terms of creating the right conditions for innovation and of delivering training systems to enable personnel to innovate.
Over half (51%) of the respondents agree that information and advice about innovation is readily available, but fewer people feel their company is receiving support in other areas, such as in terms of the quality of advice (40%) and of making procedures for obtaining financial support easy to use (20%).
A large majority (87%) of people think that the public services need to work harder at becoming more innovative.
The country variations on this last point are considerable, with 90% of people in Greece thinking that public services ought to work harder to be innovative, as opposed to just 26% in Luxembourg who think the same thing.
Public procurement and innovation
More than two-thirds (70%) of all respondents say that their company had no interest in public procurements over the last three years, with just one in seven (14%) saying that their company actually won a public procurement contract.
A quarter (24%) of public procurement interactions included the possibility of selling an innovation to the government.
Half of all respondents consider price to be more important than innovation in a public tender for both goods and services, twice as many as the number who emphasise innovation over price.
Turkey is the only country in which a majority of respondents think that innovation is more important than price in public tenders for both goods and services. In almost all other countries, more people think that price is the more important factor.
FLASH EUROBAROMETER 343 “Public sector and company innovation”
5
INTRODUCTION: In the context of rapid globalisation and the rebalancing of the world economy towards developing countries and away from Europe and the West, the European Union recognises that innovation is essential to ensuring the continuing ability of Europe’s businesses to compete in the international marketplace. The EU has therefore made its new Innovation Union strategy1 one of the flagship initiatives of its Europe 2020 growth plan. This overarching plan aims to ensure that the EU, in spite of the current economic challenges that many European countries are facing, emerges from this decade as a smart, sustainable and inclusive economy. As part of this initiative, the Innovation Union aims to promote the conception, development and production of new products, processes and services. To ensure that the Innovation Union moves forward in achieving its objectives, the EU issued a Communication on Innovation Union in October 2010 which included over 30 action points. The plan has three primary aims: to make Europe into a world-class science performer; to remove obstacles to innovation, such as expensive patenting and skills shortages; and to revolutionize the way public and private sectors work together, notably through Innovation Partnerships between the European institutions, national and sub-regional authorities and business. In December 2011, the European Commission delivered a report2 on the State of the Innovation Union in 2011, detailing the progress made in the first year of the union’s life. This Flash Eurobarometer seeks to build upon that work by gaining some insight into the way in which on-going public sector innovations are perceived by individuals who work for private sector companies. Private sector companies are potentially the main beneficiaries when the public sector provides innovative services; equally, they can be seriously held back from innovating themselves and from being profitable when public services do not deliver. This report first addresses the issue of whether companies themselves are trying to be innovative. Secondly, it focuses on private companies’ interaction with public services, exploring which services they use most often, whether the standard of those services is felt to be improving, and whether they are aware of innovative new public services being introduced.
1 Further information on the Innovation Union strategy is available here: http://ec.europa.eu/research/innovation-union/index_en.cfm?pg=intro 2 The full report is available here: http://eur-lex.europa.eu/LexUriServ/LexUriServ.do?uri=COM:2011:0849:FIN:EN:PDF
FLASH EUROBAROMETER 343 “Public sector and company innovation”
6
Thirdly, the survey turns to the issue of the private sector’s interaction with government, examining which levels of government are regarded as the most innovative, whether companies are being well served in terms of being given the opportunity to work innovatively by government, and whether public services themselves need to work harder at becoming more innovative. Finally, the survey turns to public procurement and innovation, looking at whether companies have been involved in public procurements and, if so, whether it involved the sale of an innovation to the government. It also gauges the opinion of respondents on whether price is more important than innovation when it comes to bidding for public contracts. This Flash Eurobarometer – No 343: Impact and perception of the public sector innovation among companies – was conducted by TNS Political & Social at the request of the Directorate-General for Enterprise and Industry. The fieldwork was conducted between February 16th and March 7th 2012. Over 9,500 randomly selected companies were interviewed in the 27 EU Member States, plus Croatia, Turkey, the Former Yugoslav Republic of Macedonia, Norway, Iceland, and Switzerland. The sample size varied between countries, ranging from about 100 in the smallest countries to about 500 in the largest (see section “Survey details” in the Annex where the actual sample sizes for the 33 countries are indicated). Interviews were predominantly carried out by telephone. However, due to the low fixed-line telephone coverage in Bulgaria, the Czech Republic, Estonia, Latvia, Lithuania, Hungary, Poland, Romania, Slovakia and the Former Yugoslav Republic of Macedonia, face-to-face interviews were also conducted in those countries (70% telephone and 30% face-to-face interviews). Note: Flash Eurobarometer surveys systematically include mobile phones in samples in Austria, Finland, Italy, Portugal and Spain. To correct for sampling disparities, a post-stratification weighting of the results was implemented, based on the main socio-demographic variables. More details on survey methodology are included in the Annex of this report (see section “Survey details”). All interviews were carried using the TNS e-Call center (our centralized CATI system). The sample was selected from an international business database, with some additional sample from local sources in countries where necessary.
**********
The Eurobarometer website can be consulted at the following address: http://ec.europa.eu/public_opinion/index_fr.htm
We wish to thank the people interviewed throughout the European Union who gave their time to take part in this survey.
Without their active participation, this survey would not have been possible.

FLASH EUROBAROMETER 343 “Public sector and company innovation”
7
Note In this report, countries are referred to by their official abbreviation. The abbreviations used in this report correspond to:
ABBREVIATIONS
EU27 European Union – 27 Member States
NMS 12 12 new Member States
EU 15 15 first Member States
DK/NA Don’t know / No answer
BE Belgium
BG Bulgaria
CZ Czech Republic
DK Denmark
DE Germany
EE Estonia
EL Greece
ES Spain
FR France
IE Ireland
IT Italy
CY Republic of Cyprus
LT Lithuania
LV Latvia
LU Luxembourg
HU Hungary
MT Malta
NL The Netherlands
AT Austria
PL Poland
PT Portugal
RO Romania
SI Slovenia
SK Slovakia
FI Finland
SE Sweden
UK The United Kingdom
HR Croatia
TR Turkey
MK Former Yugoslav Republic of Macedonia
IS Iceland
NO Norway CH Switzerland
FLASH EUROBAROMETER 343 “Public sector and company innovation”
8
1. ROLE OF INNOVATION IN COMPANIES
1.1 Innovations in the (responding) companies
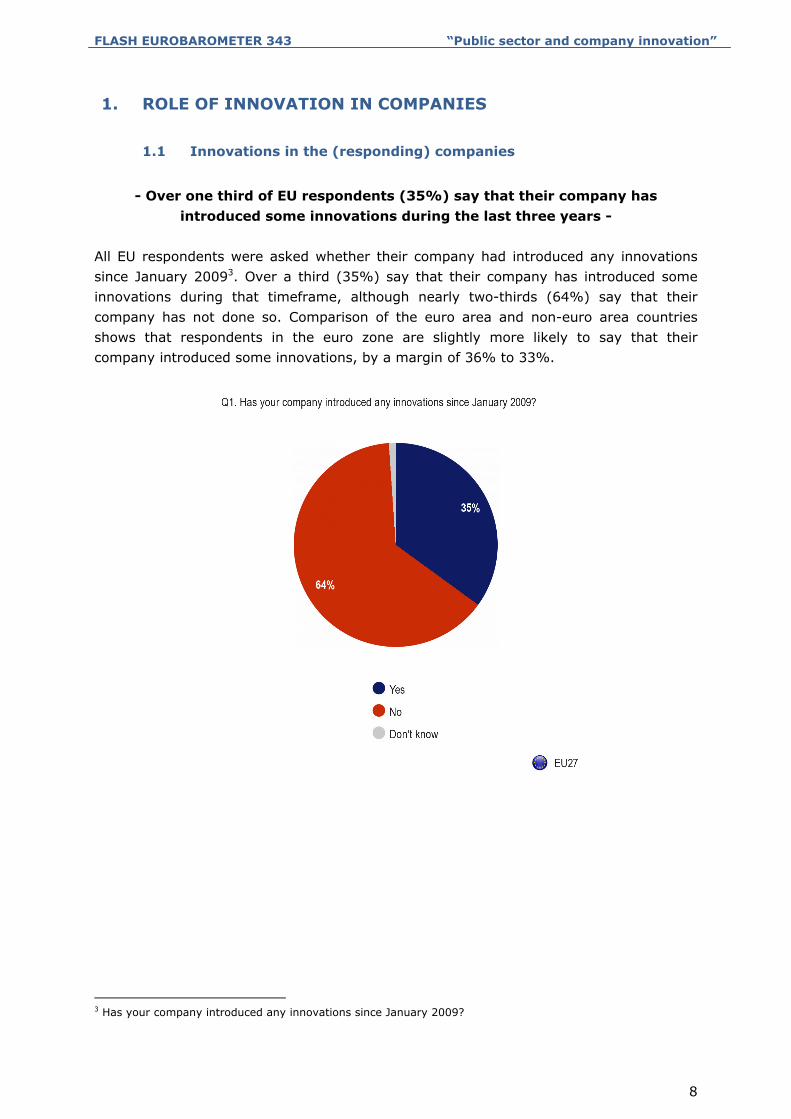
- Over one third of EU respondents (35%) say that their company has
introduced some innovations during the last three years - All EU respondents were asked whether their company had introduced any innovations since January 20093. Over a third (35%) say that their company has introduced some innovations during that timeframe, although nearly two-thirds (64%) say that their company has not done so. Comparison of the euro area and non-euro area countries shows that respondents in the euro zone are slightly more likely to say that their company introduced some innovations, by a margin of 36% to 33%.
3 Has your company introduced any innovations since January 2009?

FLASH EUROBAROMETER 343 “Public sector and company innovation”
9
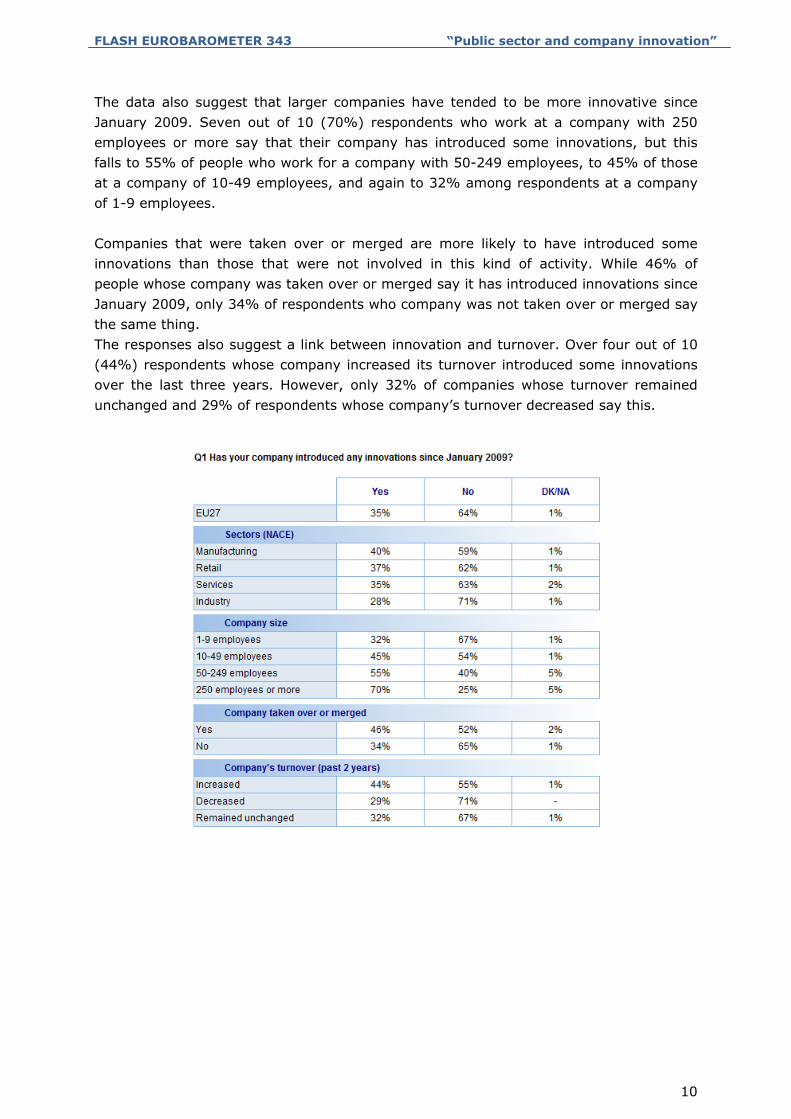
Country-level analysis reveals large variations in the level of company innovation that respondents have perceived since January 2009. In three EU Member States a majority of respondents say that their company has introduced some innovations: Austria (52%), the Czech Republic (51%), and Slovakia (51%). And in 12 of the 33 interviewed counties covered by this survey at least four out of 10 respondents say that their company has been innovative during the last three years. However, fewer than a quarter of respondents say this in six countries, with only 13% of those in Romania reporting innovation at their company, followed by 18% in Lithuania and 21% in the Former Yugoslav Republic of Macedonia.
Looking in more detail at the different types of companies under consideration, manufacturing companies appear to have been the most innovative since January 2009. While 40% of manufacturing respondents say that their company has introduced some innovations, this falls to 37% among retail respondents, 35% among services respondents, and 28% among people who work in industry.
FLASH EUROBAROMETER 343 “Public sector and company innovation”
10
The data also suggest that larger companies have tended to be more innovative since January 2009. Seven out of 10 (70%) respondents who work at a company with 250 employees or more say that their company has introduced some innovations, but this falls to 55% of people who work for a company with 50-249 employees, to 45% of those at a company of 10-49 employees, and again to 32% among respondents at a company of 1-9 employees. Companies that were taken over or merged are more likely to have introduced some innovations than those that were not involved in this kind of activity. While 46% of people whose company was taken over or merged say it has introduced innovations since January 2009, only 34% of respondents who company was not taken over or merged say the same thing. The responses also suggest a link between innovation and turnover. Over four out of 10 (44%) respondents whose company increased its turnover introduced some innovations over the last three years. However, only 32% of companies whose turnover remained unchanged and 29% of respondents whose company’s turnover decreased say this.

FLASH EUROBAROMETER 343 “Public sector and company innovation”
11
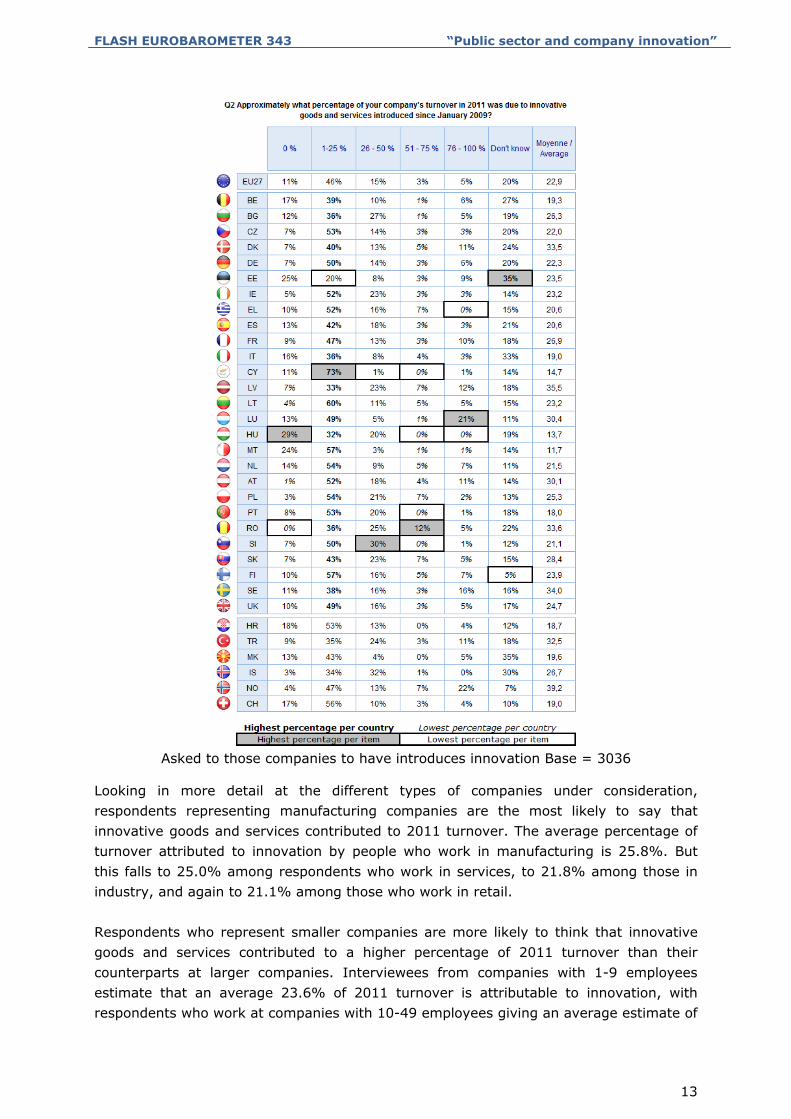
- Nearly seven out of 10 respondents whose company introduced innovations say that some of their company’s 2011 turnover was due to those innovations - Respondents who said that their company had introduced some innovations since January 2009 were then asked to say approximately what percentage of their company’s turnover in 2011 was due to the innovative goods and services that had been introduced4. Almost seven out of 10 (69%) of the people in this group attribute some of their company’s 2011 turnover to the recent innovations: 46% say that innovative goods and services accounted for 1-25% of turnover; 15% say they accounted for 26-50% of turnover; 3% say the innovations were responsible for 51-75% of turnover; and 5% say that the innovations accounted for 76-100% of turnover. Just one respondent in 10 (11%) says that zero of their company’s 2011 turnover was due to the innovations introduced since January 2009. One respondent in five (20%) does not know how much the innovations introduced by their company contributed to 2011 turnover.
Asked to those companies to have introduces innovation Base = 3036
4 Approximately what percentage of your company's turnover in 2011 was due to innovative goods and services
introduced since January 2009?

FLASH EUROBAROMETER 343 “Public sector and company innovation”
12
Respondents in the NMS12 countries are somewhat more likely than their EU15 counterparts to think that innovations contributed to their company’s 2011 turnover, with 23.8% the average estimate of contributed turnover among NMS12 respondents, as opposed to 22.7% among EU15 respondents. The difference is even wider when comparing the euro area and non-euro area results. While the average estimate of contributed turnover among non-euro zone respondents is 25.1%, the average among euro zone respondents is only 21.8%. In eight of the 33 countries under consideration, respondents give an average estimate of over 30% of 2011 turnover being attributable to innovative goods and services. They are: Norway (39.2%), Latvia (35.5%), Sweden (34.0%), Romania (33.6%), Denmark (33.5%), Turkey (32.5%), Luxembourg (30.4%), and Austria (30.1%). But in nine countries, the average estimate is less than 20%, with the lowest average results occurring in Malta (11.7%), Hungary (13.7%), and Cyprus (14.7%). In all but one of the 27 EU Member States, ‘1-25%’ is the most common answer among respondents estimating what proportion of their company’s 2011 turnover was due to innovative goods and services (the exception being Estonia, where ‘don’t know’ and ‘0%’ were both more popular). In 15 of the 33 EU and non-EU countries at least 50% of respondents say that innovative goods and services contributed 1-25% of their company’s 2011 turnover. In Cyprus, 73% of respondents give this answer, as do 60% in Lithuania and 57% in both Finland and Malta. In Estonia, just 20% of respondents give 1-25% as their estimate. A relatively high proportion of respondents in Iceland (32%) and Slovenia (30%) say that innovative goods and services contributed 26-50% of their company’s 2011 turnover. Romania (12%) is the only country where more than one in 10 people say that innovation was responsible for 51-75% of 2011 turnover. And a relatively high proportion of respondents in Norway (22%) and Luxembourg (21%) attribute 76-100% of their company’s 2011 turnover to innovative goods and services. More than one in five respondents in just three countries say that none of their company’s 2011 turnover can be attributed to innovation: Hungary (29%), Estonia (25%), and Malta (24%). In four countries, over 30% of respondents say they don’t know what percentage of turnover can be linked to innovation: Estonia (35%), the Former Yugoslav Republic of Macedonia (35%), Italy (33%), and Iceland (30%).
FLASH EUROBAROMETER 343 “Public sector and company innovation”
13
Asked to those companies to have introduces innovation Base = 3036
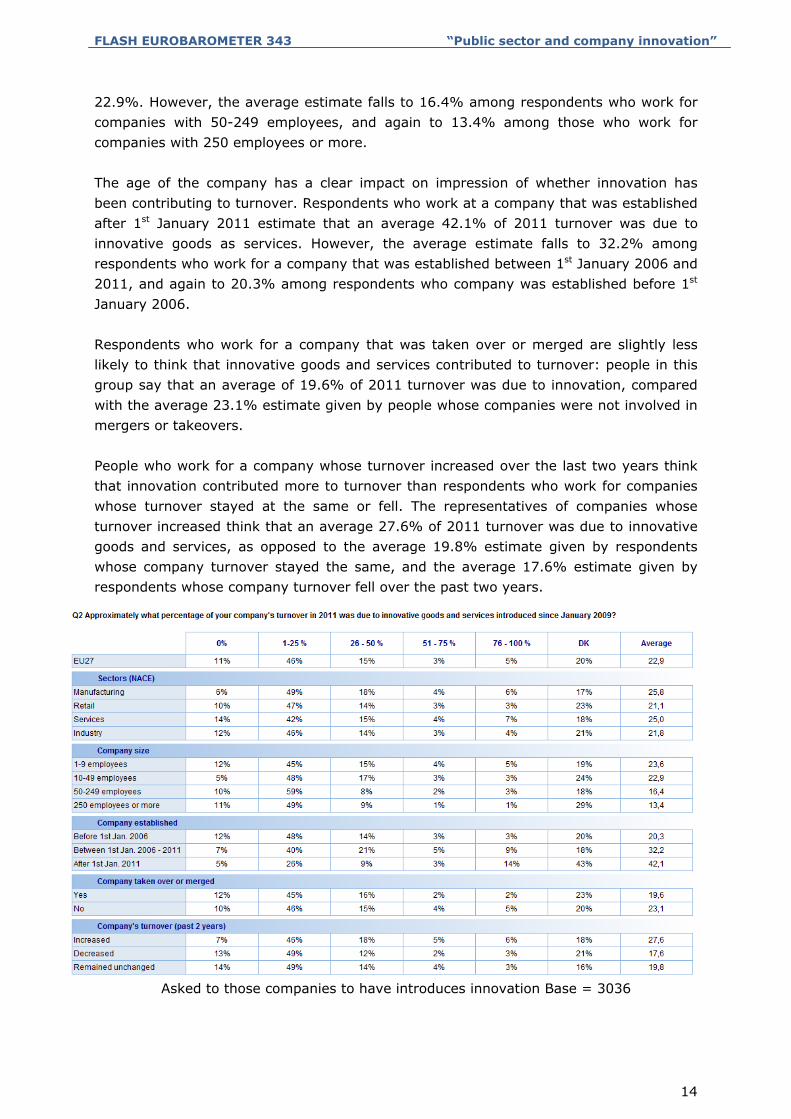
Looking in more detail at the different types of companies under consideration, respondents representing manufacturing companies are the most likely to say that innovative goods and services contributed to 2011 turnover. The average percentage of turnover attributed to innovation by people who work in manufacturing is 25.8%. But this falls to 25.0% among respondents who work in services, to 21.8% among those in industry, and again to 21.1% among those who work in retail. Respondents who represent smaller companies are more likely to think that innovative goods and services contributed to a higher percentage of 2011 turnover than their counterparts at larger companies. Interviewees from companies with 1-9 employees estimate that an average 23.6% of 2011 turnover is attributable to innovation, with respondents who work at companies with 10-49 employees giving an average estimate of
FLASH EUROBAROMETER 343 “Public sector and company innovation”
14
22.9%. However, the average estimate falls to 16.4% among respondents who work for companies with 50-249 employees, and again to 13.4% among those who work for companies with 250 employees or more. The age of the company has a clear impact on impression of whether innovation has been contributing to turnover. Respondents who work at a company that was established after 1st January 2011 estimate that an average 42.1% of 2011 turnover was due to innovative goods as services. However, the average estimate falls to 32.2% among respondents who work for a company that was established between 1st January 2006 and 2011, and again to 20.3% among respondents who company was established before 1st January 2006. Respondents who work for a company that was taken over or merged are slightly less likely to think that innovative goods and services contributed to turnover: people in this group say that an average of 19.6% of 2011 turnover was due to innovation, compared with the average 23.1% estimate given by people whose companies were not involved in mergers or takeovers. People who work for a company whose turnover increased over the last two years think that innovation contributed more to turnover than respondents who work for companies whose turnover stayed at the same or fell. The representatives of companies whose turnover increased think that an average 27.6% of 2011 turnover was due to innovative goods and services, as opposed to the average 19.8% estimate given by respondents whose company turnover stayed the same, and the average 17.6% estimate given by respondents whose company turnover fell over the past two years.
Asked to those companies to have introduces innovation Base = 3036

FLASH EUROBAROMETER 343 “Public sector and company innovation”
15
2. COMPANIES USE OF PUBLIC SERVICES
2.1 Use of public services by businesses
- The public services most commonly used by companies are those related to
health and safety and to training programmes for employees - All respondents were asked to say whether their company had used eight types of public services since January 20095. Over three out of ten respondents say that their company has used public services for health and safety issues (32%, with 24% saying their company used these less than five times, and 8% saying it used them five times or more) and also for training programmes for employees (30%, with 22% saying their company used these less than five times, and 8% saying it used them five times or more) since January 2009. One in five (21%) respondents also say that their company has used public services for environment-related permits and obligations in that timeframe, with 14% saying their company used these services less than five times, and 7% saying it used them five times or more. One in 10 (11%) respondents say that their company used public services for other needs, such as starting a new business or obtaining legal advice. Less than one in 10 say that their company used the other four types of public service under consideration: services for conformity certification for new products (8%); services for applying for research or innovation subsidies (7%); services for applying for patents or trademarks (7%); and services for obtaining work permits for foreign workers (6%).
5 Since January 2009, has your company used any of the following public services?

FLASH EUROBAROMETER 343 “Public sector and company innovation”
16
Comparing the results from euro area and non-euro countries, the data show that in most cases respondents from euro zone countries are somewhat more likely to say that their company used the various public services under discussion. For example, 32% of euro zone respondents say that their company has used training services for employees since January 2009, compared with 26% of non-euro area respondents. However, the main exception is in the use of public services for environment-related permits and obligations, with 25% of non-euro area respondents saying that their company used this type of services, as opposed to just 19% of their euro area counterparts. While there is relatively little difference between the EU15 and NMS12 results when considering most of the types of public services under discussion, NMS12 respondents are more likely than EU15 respondents to say that their company used public services for health and safety issues (by a margin of 38% to 31%) and also for conformity certification for new products (by a margin of 12% to 7%). However, EU15 respondents are more likely to say that their company has used training programmes for employees since January 2009, by a margin of 31% to 26%. The country-level results show that in 11 of the 33 countries under consideration at least four out of 10 respondents say that their company has used public services relating to health and safety issues since January 2009. In the Czech Republic and Slovakia, 46% of respondents say that their company used this type of service. At the other end of the scale less than a fifth of respondents say that their company used public services to address health and safety issues in two countries: Greece (17%) and France (18%). In four of the 33 countries, over a third of respondents say that their company has used public services to deliver training programmes for employees since January 2009. In Spain a majority (54%) of respondents say this, with over a third also giving this response in Austria (38%), the Czech Republic (38%) and the Netherlands (37%). In six countries less than a fifth of respondents say that their company used public services to deliver training programmes for employees, with the lowest proportion of people saying this occurring in Norway (12%), Iceland (14%) and Turkey (14%). Within the EU, the lowest numbers of respondents whose company used public services to deliver training programmes for employees were in Greece (16%), Malta (19%) and Sweden (19%). Similarly, in the case of public services for environment-related permits and obligations, over a third of respondents in four of the 33 countries say their company has made use of this kind of service since January 2009. They are: Malta (37%), Finland (36%), Hungary (34%), and Slovenia (34%). However, less than a fifth of respondents report that their company used this type of public service in nine countries, with the lowest proportions giving this answer occurring in France (11%), Italy (13%), Greece (14%) and Romania (14%).

FLASH EUROBAROMETER 343 “Public sector and company innovation”
17
While a relatively small proportion of respondents in most countries say that their company has used other types of public services, such as for starting a new business or obtaining legal advice, since January 2009, at least a fifth say that their company did so in five countries: the Netherlands (27%), Cyprus (22%), Austria (21%), Iceland (20%), and Germany (20%). At least one in 10 people say that their company did this in 18 of the 33 countries. Again, relatively few people in most countries say that their company used public services for conformity certification for new products. But at least a fifth of respondents say that their company did this in three countries: Turkey (24%), Cyprus (21%) and Slovenia (20%). At least one in 10 people say that their company did this in 20 of the 33 countries. At least a tenth of respondents in 21 of the 33 countries say that their company has used public services to apply for research or innovation subsidies since January 2009. The Netherlands (24%) has the highest proportion of people who say this, followed by Slovenia (16%) and Malta (15%).

FLASH EUROBAROMETER 343 “Public sector and company innovation”
18
Over a tenth of respondents in eight of the 33 countries say that their company has used public services to apply for patents or trademarks since January 2009. Turkey (24%) has the highest proportion of people who say this, followed by the Netherlands (16%). At least 10% of respondents in seven of the 33 countries say that their company has used public services to obtain work permits for foreign workers since January 2009. In Switzerland a fifth (20%) of respondents say that their company used this type of service, as do 17% of those in Luxembourg and 14% in both Spain and Slovenia.
FLASH EUROBAROMETER 343 “Public sector and company innovation”
19
Looking at the results pertaining to the different types of company under consideration, it appears as if certain types of company are more likely to have used particular kinds of public services. For example, people who work in services (33%) or industry (32%) are the most likely to say that their company uses public services to deliver training programmes for employees, while those who work in industry (36%) are also the most likely to say that their company used public services relating to health and safety issues. However, respondents who work in manufacturing (23%) are the most likely to say that their company used public services relating to environmental permits and obligations. Individuals who work at large companies are more likely to say that their company made use of the various kinds of public services under discussion here. For example, six out of 10 (60%) people who work at a company with 250 or more staff say that their company used public services to deliver training programmes; however, this falls to 54% among respondents who work at a company with 50-249 employees, to 43% among respondents who work at a company with 10-49 employees, and again to 27% among those who work at a company with nine employees or less.

FLASH EUROBAROMETER 343 “Public sector and company innovation”
20
2.2 Development of the public sector services for businesses
- Half of all respondents think that the standard of public services for
businesses has stayed the same over the past three years - All respondents were asked to say whether or not, in their experience, public services for businesses have generally improved over the past three years6. Under a fifth (17%) of all respondents say that public services for businesses have improved during that time period, with almost half (48%) judging that they have remained the same. A fifth (21%) say that public services for businesses have deteriorated, while 14% of respondents say they don’t know whether they have got better or worse. There are no significant variations between euro area and non-euro area countries, and between EU15 and NMS12 countries, on this question.
The general impression of whether public services for businesses have improved over the last three years varies considerably from country to country. In eight of the 33 countries included in this survey at least 30% of respondents feel that public services for businesses have improved, with a particularly high proportion of people taking this view in Malta (54%), Turkey (49%) and Portugal (40%). However, in Italy only 10% of respondents feel that public services for businesses are improving, as do just 11% of respondents in Iceland, Slovakia and Slovenia.
6 Based on your experience, have public services for businesses generally improved or not over the past three
years?

FLASH EUROBAROMETER 343 “Public sector and company innovation”
21
In 10 countries, a majority of respondents argue that the standard of public services for businesses has stayed the same, with this answer proving most popular in Finland (61%), Austria (54%) and the UK (54%). The sense that public services for businesses have deteriorated over the past three years is by far the strongest in Greece, where 46% of respondents take this view. A relatively high proportion of respondents also say this in Slovakia (32%) and the Former Yugoslav Republic of Macedonia (27%). In 13 countries at least one person in five says that public services for businesses have grown worse.
Looking in more detail at the different types of companies concerned, the data suggest that smaller companies are more likely to have formed the impression that public services for businesses have deteriorated: 20-21% of representatives at companies with 1-9 or 10-49 employees say this, as opposed to 16% of people who work at a company with 50-249 employees and just 8% of people who work at a company with 250 staff or more. Conversely, larger companies are more inclined to say that public services for businesses have improved over the last three years.
FLASH EUROBAROMETER 343 “Public sector and company innovation”
22
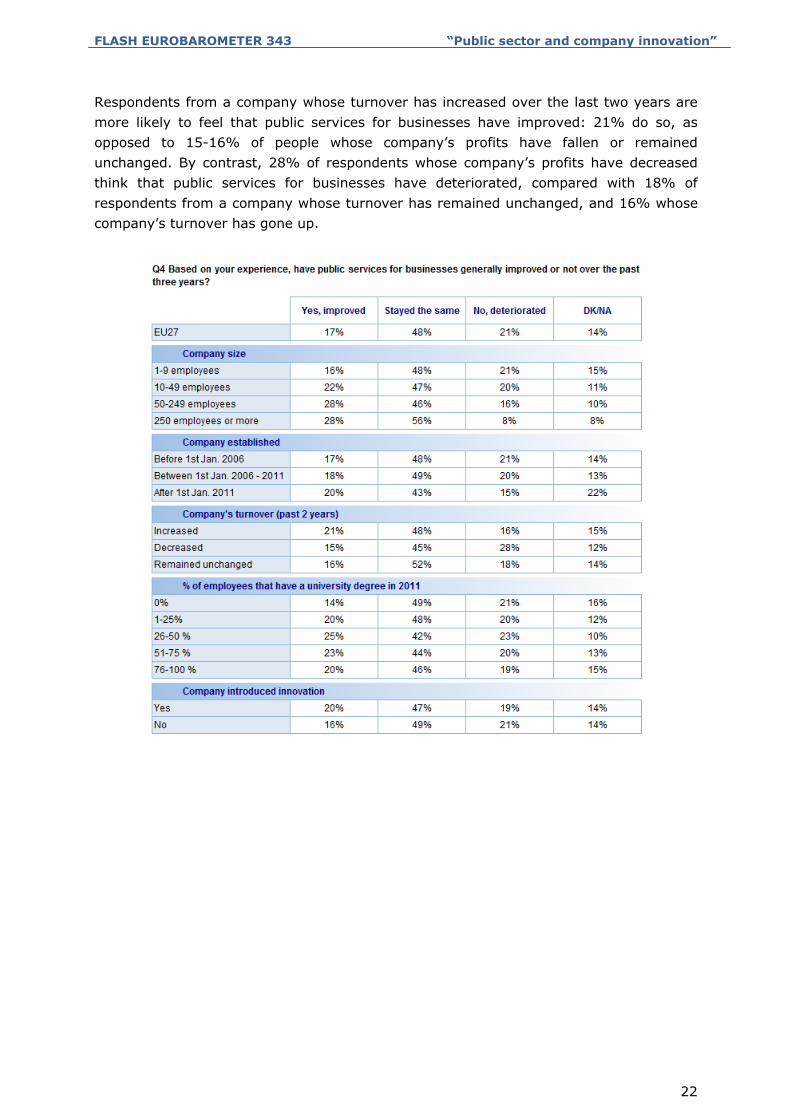
Respondents from a company whose turnover has increased over the last two years are more likely to feel that public services for businesses have improved: 21% do so, as opposed to 15-16% of people whose company’s profits have fallen or remained unchanged. By contrast, 28% of respondents whose company’s profits have decreased think that public services for businesses have deteriorated, compared with 18% of respondents from a company whose turnover has remained unchanged, and 16% whose company’s turnover has gone up.
FLASH EUROBAROMETER 343 “Public sector and company innovation”
23
2.3 Impact of the public sector services on businesses
- Over two-thirds of respondents have observed the introduction of measures to enable the completion of government forms online and to provide online access
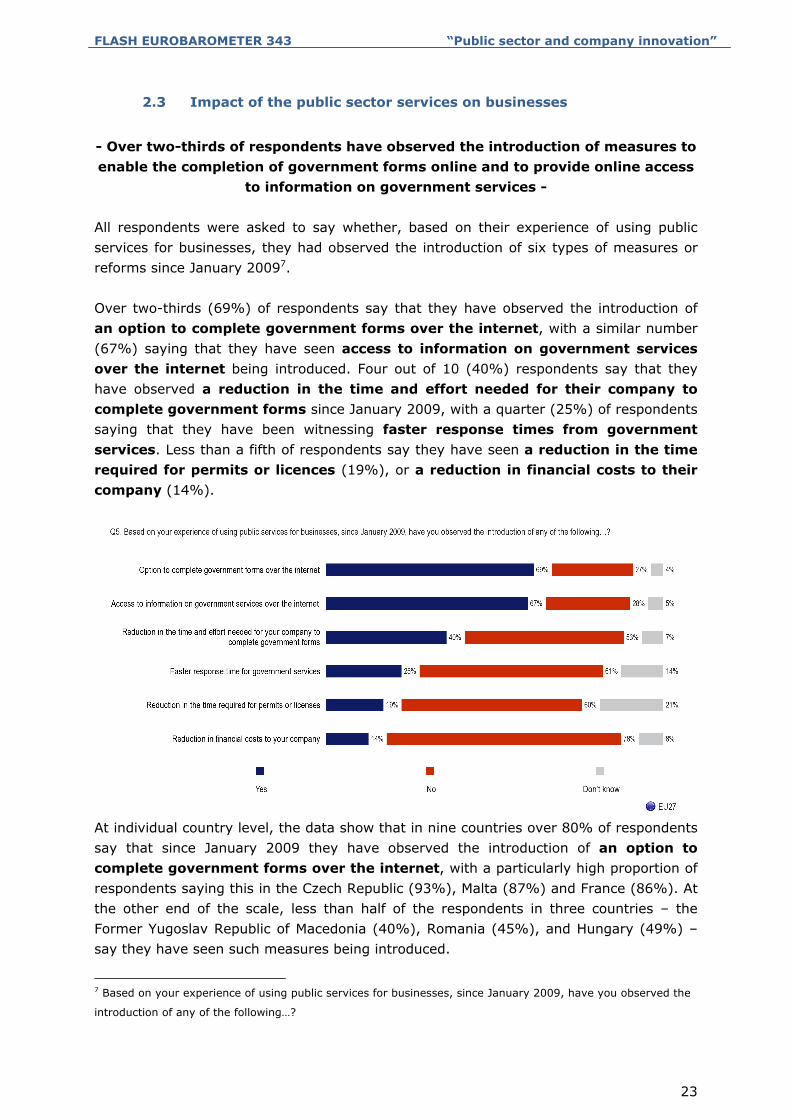
to information on government services - All respondents were asked to say whether, based on their experience of using public services for businesses, they had observed the introduction of six types of measures or reforms since January 20097. Over two-thirds (69%) of respondents say that they have observed the introduction of an option to complete government forms over the internet, with a similar number (67%) saying that they have seen access to information on government services over the internet being introduced. Four out of 10 (40%) respondents say that they have observed a reduction in the time and effort needed for their company to complete government forms since January 2009, with a quarter (25%) of respondents saying that they have been witnessing faster response times from government services. Less than a fifth of respondents say they have seen a reduction in the time required for permits or licences (19%), or a reduction in financial costs to their company (14%).
At individual country level, the data show that in nine countries over 80% of respondents say that since January 2009 they have observed the introduction of an option to complete government forms over the internet, with a particularly high proportion of respondents saying this in the Czech Republic (93%), Malta (87%) and France (86%). At the other end of the scale, less than half of the respondents in three countries – the Former Yugoslav Republic of Macedonia (40%), Romania (45%), and Hungary (49%) – say they have seen such measures being introduced.
7 Based on your experience of using public services for businesses, since January 2009, have you observed the
introduction of any of the following…?

FLASH EUROBAROMETER 343 “Public sector and company innovation”
24
In five countries over 80% of respondents say that since January 2009 they have observed the introduction of access to information on government services over the internet. In Greece, 85% of people say they have observed this new measure, as do 82% in both Latvia and Turkey. However, relatively few respondents in the Former Yugoslav Republic of Macedonia (44%), Hungary (50%) and Cyprus (51%) say that access to information on government services has been made available online over the last three years. In nine countries, a majority of respondents say that since January 2009 they have seen a reduction in the time and effort needed for their company to complete government forms. By far the highest proportion of people who say this are in Latvia (75%) and Malta (70%). By contrast, less than three out of 10 respondents think that measures have been taken to reduce the time and effort needed for their company to complete government forms in three countries: Hungary (25%), the Netherlands (26%), and Denmark (29%). In 11 countries, at least 30% of respondents say that over the last three years they have observed a faster response time for government services. A relatively high proportion of people report this kind of improvement in Turkey (56%), Latvia (52%) and Portugal (47%). However, under a fifth of people say that the government’s service response time has gone down in Iceland (12%), Croatia (17%), and Greece (19%). Over 30% of respondents say that over the last three years they have observed a reduction in the time required for permits or licences in eight of the 33 countries under consideration. The same three countries as before – Turkey (44%), Latvia (41%) and Portugal (41%) – record the highest proportions of people who have observed this kind of improvement. Relatively few respondents witnessed a reduction in the time required for permits or licences in Sweden (8%) and Norway (9%). Once more Turkey (49%), Latvia (37%) and Portugal (30%) have the highest proportion of respondents who say that they have seen a reduction in financial costs to their company over the last three years, and they are the only three countries where at least three out of 10 respondents do so. At the other end of the scale, just 9% of respondents in Italy and 10% in both Belgium and Sweden say that they have observed any reduction in financial costs to their company.

FLASH EUROBAROMETER 343 “Public sector and company innovation”
25
Breaking down the results to look at the different types of company, the data suggest that in five of the six cases being looked at companies who work in services are the most likely to say that they have observed the introduction of improvements over the last three years, while companies who work in manufacturing are the least likely to say this. The one exception is access to information on government services over the internet, which companies who work in industry are the most likely to say they have seen being introduced. Larger companies are also more likely to say that they have observed procedural improvements. However, on the questions of faster response time for government services and of the reduction of financial costs to companies the results are slightly different, with respondents from companies with 50-249 employees somewhat more

FLASH EUROBAROMETER 343 “Public sector and company innovation”
26
likely than respondents from companies with 250 employees or more to say that they have observed the introduction of these measures. In some cases, we can observe that respondents from a company whose turnover increased over the last two years are more likely to say that they have observed procedural improvements. For example, 75% of respondents whose company’s turnover increased say they observed the introduction of an option to complete government forms over the internet, whereas only 66% of respondents whose company’s turnover decreased say the same thing. Respondents whose company has introduced innovations are also more likely to say that they have observed the introduction of measures to improve public services. For example, 45% of respondents whose company introduced innovations say that they have seen a reduction in the time and effort needed for their company to complete government forms over the last three years, whereas only 37% of people whose company did not introduce any innovations say the same thing. Individuals who said in the previous question that in their opinion public services for businesses had improved are of course more likely to say that they have seen the introduction of measures to improve those services. For example, 82% of respondents who said that public services for businesses had improved say that they observed the introduction of an option to complete government forms over the internet, compared with only 66% of respondents who said that public services for businesses had deteriorated.
FLASH EUROBAROMETER 343 “Public sector and company innovation”
27
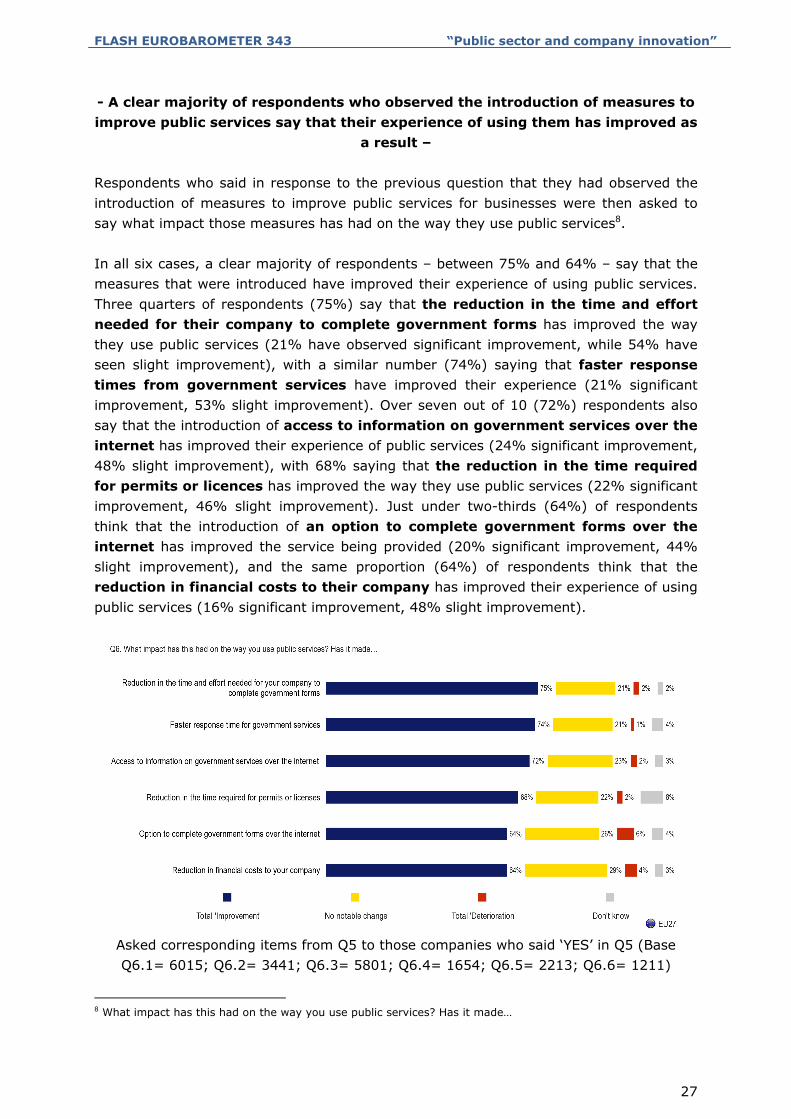
- A clear majority of respondents who observed the introduction of measures to improve public services say that their experience of using them has improved as
a result – Respondents who said in response to the previous question that they had observed the introduction of measures to improve public services for businesses were then asked to say what impact those measures has had on the way they use public services8. In all six cases, a clear majority of respondents – between 75% and 64% – say that the measures that were introduced have improved their experience of using public services. Three quarters of respondents (75%) say that the reduction in the time and effort needed for their company to complete government forms has improved the way they use public services (21% have observed significant improvement, while 54% have seen slight improvement), with a similar number (74%) saying that faster response times from government services have improved their experience (21% significant improvement, 53% slight improvement). Over seven out of 10 (72%) respondents also say that the introduction of access to information on government services over the internet has improved their experience of public services (24% significant improvement, 48% slight improvement), with 68% saying that the reduction in the time required for permits or licences has improved the way they use public services (22% significant improvement, 46% slight improvement). Just under two-thirds (64%) of respondents think that the introduction of an option to complete government forms over the internet has improved the service being provided (20% significant improvement, 44% slight improvement), and the same proportion (64%) of respondents think that the reduction in financial costs to their company has improved their experience of using public services (16% significant improvement, 48% slight improvement).
Asked corresponding items from Q5 to those companies who said ‘YES’ in Q5 (Base Q6.1= 6015; Q6.2= 3441; Q6.3= 5801; Q6.4= 1654; Q6.5= 2213; Q6.6= 1211)
8 What impact has this had on the way you use public services? Has it made…
FLASH EUROBAROMETER 343 “Public sector and company innovation”
28
In seven of the 33 countries, at least 80% of respondents say that the reduction in the time and effort needed for their company to complete government forms has resulted in an improvement in their experience of using public services. Over nine tenths say this in Cyprus (91%), Turkey (91%) and Greece (90%). In all 33 countries at least half of the people who observed the introduction of measures to reduce the time and effort needed to complete government forms say that there has been an improvement as a result, although only 50% say this in Malta, as do 62% in Estonia. In nine countries, at least 80% of respondents say that the introduction of a faster response time for government services has improved their experience of using public services. A relatively high proportion of people say this in Spain (93%), the Czech Republic (89%), and Turkey (88%). A majority of people in all but one country say that the measures they saw being introduced have improved their experience, the exception being Malta, where only 32% of respondents say that measures intended to deliver a faster response time for government services have actually improved their experience. In five countries over 80% of respondents say that measures introduced to provide access to information on government services over the internet have improved their public service experience. Particularly high numbers of people think this in Cyprus (93%) and Turkey (92%). In all 33 countries at least half of the people who observed the introduction of measures to provide access to information on government services over the internet say that there has been an improvement in their experience, although only 57% of people in Sweden and 58% in both the Czech Republic and Denmark say this. Over 80% of respondents in just four countries say that the measures introduced to reduce the time required for permits or licences has improved their experience of using public services. They are: Cyprus (85%), Sweden (83%), Spain (82%) and Turkey (81%). In only three countries do less than half of those respondents who observed efforts to reduce the time required for permits or licences say that their experience has improved: Iceland (33%), Malta (45%), and Norway (48%). In four countries over 80% of respondents say that the introduction of an option to complete government forms over the internet has resulted in improvements to their service. They are: Cyprus (89%), Greece (88%), Turkey (86%), and Latvia (85%). At the other end of the scale, just 48% of those in Germany and 50% of those in the UK who observed this kind of reform think that their experience of using public services has improved as a result.

FLASH EUROBAROMETER 343 “Public sector and company innovation”
29
At least four fifths of respondents in eight countries think that the introduction of measures to reduce financial costs to their company have resulted in an improvement to the service, with a particularly high proportion of people saying this in Cyprus (99%), the Former Yugoslav Republic of Macedonia (91%), Denmark (89%) and Turkey (88%)9. But in Ireland only 29% of people who observed this kind of measure think it has improved their experience of using public services, as do 42% of respondents in Sweden.
9 It is important to note that the samples are relatively small at this stage of the survey.

FLASH EUROBAROMETER 343 “Public sector and company innovation”
30
In some cases, respondents from a particular type of company are more likely to say that certain measures being introduced. For example, people who work in services are the most likely to say that the introduction of access to information on government services over the internet (75%) and the reduction in time required for permits or licences (75%) have improved their experience of using government services. By contrast, in the manufacturing sector is the most likely to say that the introduction of measures to reduce the financial costs to their company (73%) has improved their experience. Respondents from smaller companies tend to be less inclined to say that the measures they observed have translated into an improvement of public services than respondents from a larger company. For example, only 73% of people who work at a company with 1-9 employees say that measures designed to reduce the time and effort needed to complete government forms has translated into an improvement, but this rises to 85% among respondents from a company with 250 or more staff. People who said earlier that they thought public services for business had improved over the last three years were, of course, more likely to say that the introduction of the various measures under discussion had resulted in improvements. For example, 84% of respondents who thought that public services for business had improved say that the introduction of measures to ensure a faster response time for government services has improved their experience of using public services, whereas only 66% of respondents who said that public services for business have deteriorated say this.

FLASH EUROBAROMETER 343 “Public sector and company innovation”
31
- Nearly two-thirds of respondents who observed a significant improvement in public services for business attribute that improvement to innovation –
Respondents who said in the previous question that they had observed significant improvement in at least one of the six areas under discussion were then asked whether the improvement in public services for businesses was due to an innovation, that is to say a new or significantly improved service10. The outcome is that nearly two-thirds (63%) of the respondents who observed a significant improvement say that this was indeed due to an innovation, with just 28% saying that the significant improvement they observed did not relate to an innovation. One respondent in 10 (9%) does not know the cause of the significant improvement to public services which they detected. While there is little difference between euro area and non-euro area responses on this question, EU15 respondents appear to be more likely than their NMS12 counterparts to say that significant improvements were down to innovation, by a margin of 64% to 56%.
Asked to those companies who think there is a significant improvement in at least one of
the items from Q5/Q6 (Base = 2067)
10 Was the improvement of the public services for businesses due to an innovation, that is to say a new or
significantly improved service?

FLASH EUROBAROMETER 343 “Public sector and company innovation”
32
At individual country level, we find that in 26 of the 33 countries included in this survey at least half of the respondents who observed a significant improvement attribute that improvement to innovation. In three countries, over 80% of respondents take this view: Lithuania (89%), Turkey, 87%), and Portugal (83%). However, in Iceland only 28% of respondents say this, as do 38% in Malta and 42% in the Former Yugoslav Republic of Macedonia. In seven countries, over four out of 10 respondents say that the significant improvement they observed was not due to innovation. The highest proportion of people who give this answer is in Cyprus (47%) and Luxembourg (47%). Elsewhere, relatively high numbers of respondents say that they do not know the reason for the significant improvement in the standard of public services, such as in Iceland (44%), the Former Yugoslav Republic of Macedonia (42%) and Ireland (28%).
FLASH EUROBAROMETER 343 “Public sector and company innovation”
33
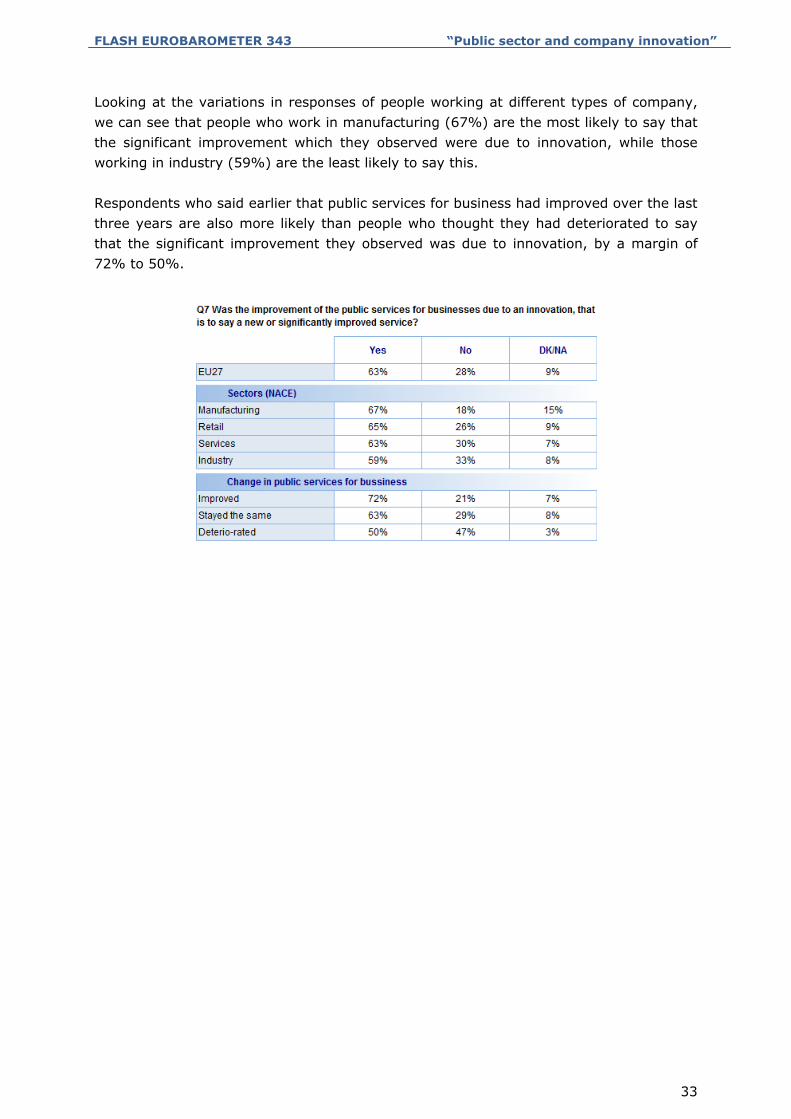
Looking at the variations in responses of people working at different types of company, we can see that people who work in manufacturing (67%) are the most likely to say that the significant improvement which they observed were due to innovation, while those working in industry (59%) are the least likely to say this. Respondents who said earlier that public services for business had improved over the last three years are also more likely than people who thought they had deteriorated to say that the significant improvement they observed was due to innovation, by a margin of 72% to 50%.

FLASH EUROBAROMETER 343 “Public sector and company innovation”
34
- Innovation is judged to have had a much more positive impact on some public service functions than on others –
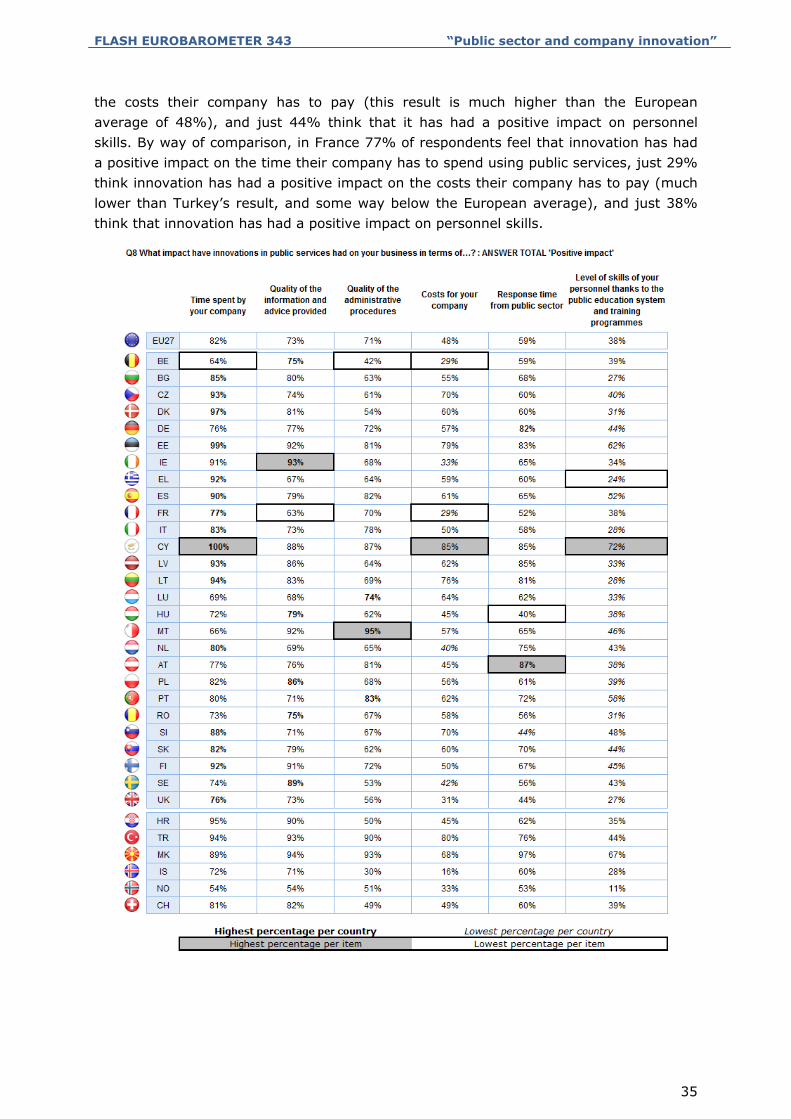
Respondents who answered the previous question by attributing significant improvement in public services for business to innovation were then asked what impact innovations in public services has had on six aspects of their business11. There is a wide variation in the respondents’ assessment of the impact that innovations in public services has had on different areas of their business. Over eight out of 10 (82%) respondents think that innovation has had a positive impact on the time their company has to spend when it comes to using public services, while nearly three quarters (73%) say that innovation has had a positive impact on the quality of information and advice provided. A similar number (71%) say that innovation has had a positive impact on the quality of administrative procedures, with a majority (59%) also saying that innovation has had a positive impact on the public sector’s response time. However, less than half of the respondents think that innovation has had a positive impact on company costs (48%) or on their personnel’s level of skills (38%).
Asked to those companies who think the improvement in public services is due to an
significant innovation (Base = 1303)
Country-level analysis is difficult for this question because the size of the respondent sample is very small in the case of most countries12. However, looking only at those countries with the largest respondent samples, it is still possible to see how the individual country results reflect the main results discussed above. In Turkey, for example, 94% of respondents feel that innovation has had a positive impact on the time their company has to spend using public services, 80% think innovation has had a positive impact on
11 What impact have innovations in public services had on your business in terms of…? 12 Sample sizes on this question range from 176 companies in Turkey to 13 companies in Luxembourg.
FLASH EUROBAROMETER 343 “Public sector and company innovation”
35
the costs their company has to pay (this result is much higher than the European average of 48%), and just 44% think that it has had a positive impact on personnel skills. By way of comparison, in France 77% of respondents feel that innovation has had a positive impact on the time their company has to spend using public services, just 29% think innovation has had a positive impact on the costs their company has to pay (much lower than Turkey’s result, and some way below the European average), and just 38% think that innovation has had a positive impact on personnel skills.

FLASH EUROBAROMETER 343 “Public sector and company innovation”
36
Respondents form certain types of company appear to be more likely than others to think that innovation has had a positive impact in particular areas. For example, companies who work in services are the most likely to say that innovation has had a positive impact on the time their company has to spend using public services (87%, vs. 78% for industry) and also on the quality of administrative procedures (78%, vs. 66% for manufacturing). However, companies who work in services are the least likely to think that innovation has had a positive impact on public sector response time (55%, vs. 61% for retail and industry). It is unsurprising to find that respondents who said previously that public services for business had improved are more likely to say that innovations have had a positive impact than respondents who said that public services for business had deteriorated. For example, two-thirds (66%) people who said that public services for business had improved say that innovation has had a positive impact on public sector response time, whereas only 48% of people who thought that public services for business had deteriorated say the same thing.
FLASH EUROBAROMETER 343 “Public sector and company innovation”
37
3. VIEWS ON INNOVATION IN PUBLIC SERVICES
3.1 Most innovative public services
- Respondents are generally unclear about which level of government is the
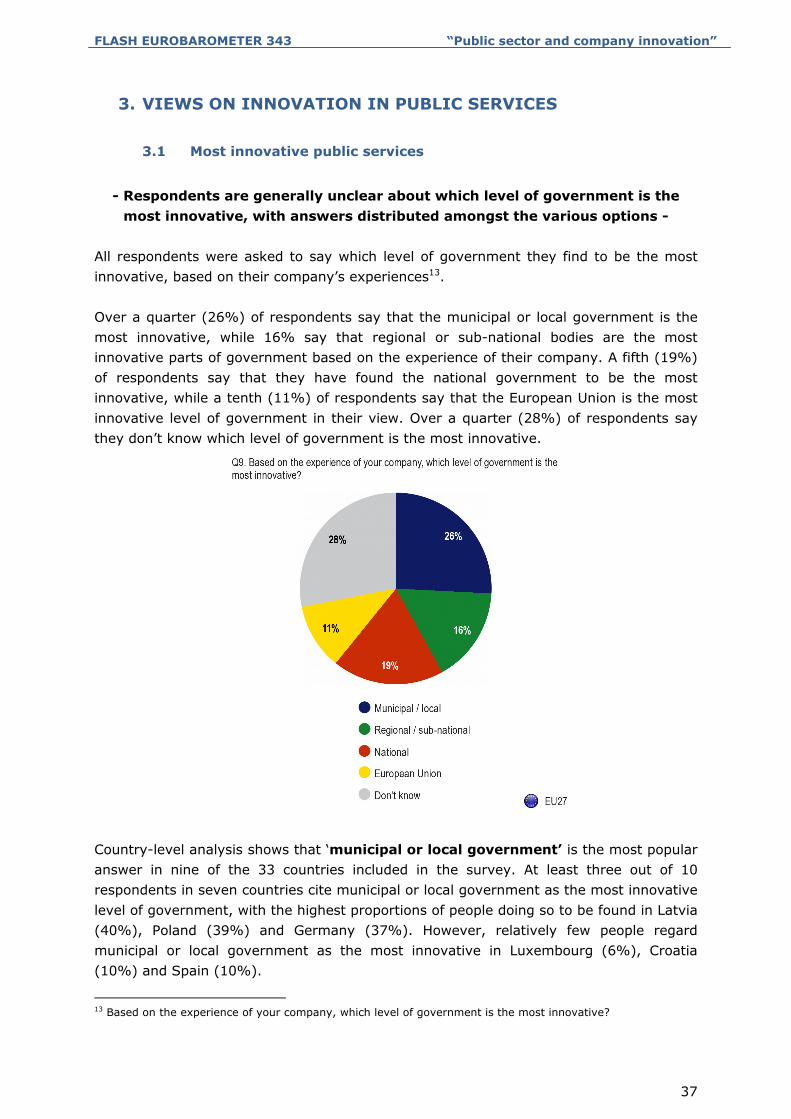
most innovative, with answers distributed amongst the various options - All respondents were asked to say which level of government they find to be the most innovative, based on their company’s experiences13. Over a quarter (26%) of respondents say that the municipal or local government is the most innovative, while 16% say that regional or sub-national bodies are the most innovative parts of government based on the experience of their company. A fifth (19%) of respondents say that they have found the national government to be the most innovative, while a tenth (11%) of respondents say that the European Union is the most innovative level of government in their view. Over a quarter (28%) of respondents say they don’t know which level of government is the most innovative.
Country-level analysis shows that ‘municipal or local government’ is the most popular answer in nine of the 33 countries included in the survey. At least three out of 10 respondents in seven countries cite municipal or local government as the most innovative level of government, with the highest proportions of people doing so to be found in Latvia (40%), Poland (39%) and Germany (37%). However, relatively few people regard municipal or local government as the most innovative in Luxembourg (6%), Croatia (10%) and Spain (10%).
13 Based on the experience of your company, which level of government is the most innovative?
FLASH EUROBAROMETER 343 “Public sector and company innovation”
38
Regional or sub-national bodies are regarded as the most innovative parts of government in just one country: Austria, where 33% of people say this. Relatively high numbers of respondents also regard regional or sub-national bodies as the most innovative levels of government in Germany (26%) and Finland (24%), with at least a fifth of respondents citing ‘regional or sub-national’ bodies in six of the 33 countries. But in 12 countries, less than a tenth of respondents do so. In nine countries, more people identify the national government as the most innovative than the number of respondents mentioning other levels of government. In six countries, at least three out of 10 respondents cite the national administration as the most innovative level of government, with particularly high proportions of respondents doing so in Luxembourg (41%), Norway (38%), and Ireland (35%). But relatively few people regard the national government as being especially innovative in Poland (4%), Cyprus (6%) and Iceland (8%). The European Union is seen as the most innovative level of government in three countries: Greece (40%) and Malta (39%), with 39% of respondents in Cyprus also mentioning the EU as the most innovative layer of government. At least a fifth of respondents see the EU as the most innovative part of government in nine of the 33 countries. However, in 16 countries less than 10% of respondents say that the EU is the most innovative level of government based on their company’s experience. ‘Don’t know’ is the commonest response in 16 countries, with at least three out of 10 respondents in the same number of countries saying that they don’t know which level of government is the most innovative. This response was particularly commonplace in Iceland (59%), Slovenia (44%), and Cyprus (40%).

FLASH EUROBAROMETER 343 “Public sector and company innovation”
39
Looking in more detail at the responses according to the particular types of company the respondents work for, we find that those who work in services are the most likely to view the national government as the most innovative governmental layer: 24% of respondents in this group do so, compared with 17% of people who work for retail companies. Respondents from large companies are also the most likely to think that the national government is the most innovative part of government: 33% of those who work for a company with at least 250 employees say this, as opposed to just 19% of respondents from a company with 1-9 employees. By contrast, respondents who work for a company with 1-9 employees are the most likely to think that the municipal or local government is the most innovative: 26% say this, whereas only 14% of respondents who work at a company with at least 250 employees do so.

FLASH EUROBAROMETER 343 “Public sector and company innovation”
40
People who work at newly established companies are the most likely to think that the municipal or local government is the most innovative: 41% of respondents whose company was set up after 1st January 2011 cite municipal or local government, compared with 29% of people whose company was established between 1st January 2006 and 2011, and 24% of those whose company was established before 1st January 2006. By contrast, respondents whose company was set up before 2011 are more likely to say that they don’t know which level of government is the most innovative, by a margin of 28-29% to 12%. Respondents who said previously that public services for businesses have improved are the most likely to think that the national government is the most innovative level of government: 33% of people in this group think so, as opposed to 18% who think the standard of public services for businesses has stayed the same, and 13% who think the standard has deteriorated. By contrast, respondents who think that public services for businesses have deteriorated are the most likely to say they don’t know which level of government is the most innovative: 36% say this, compared with just 12% of people who think public services for businesses have improved.

FLASH EUROBAROMETER 343 “Public sector and company innovation”
41
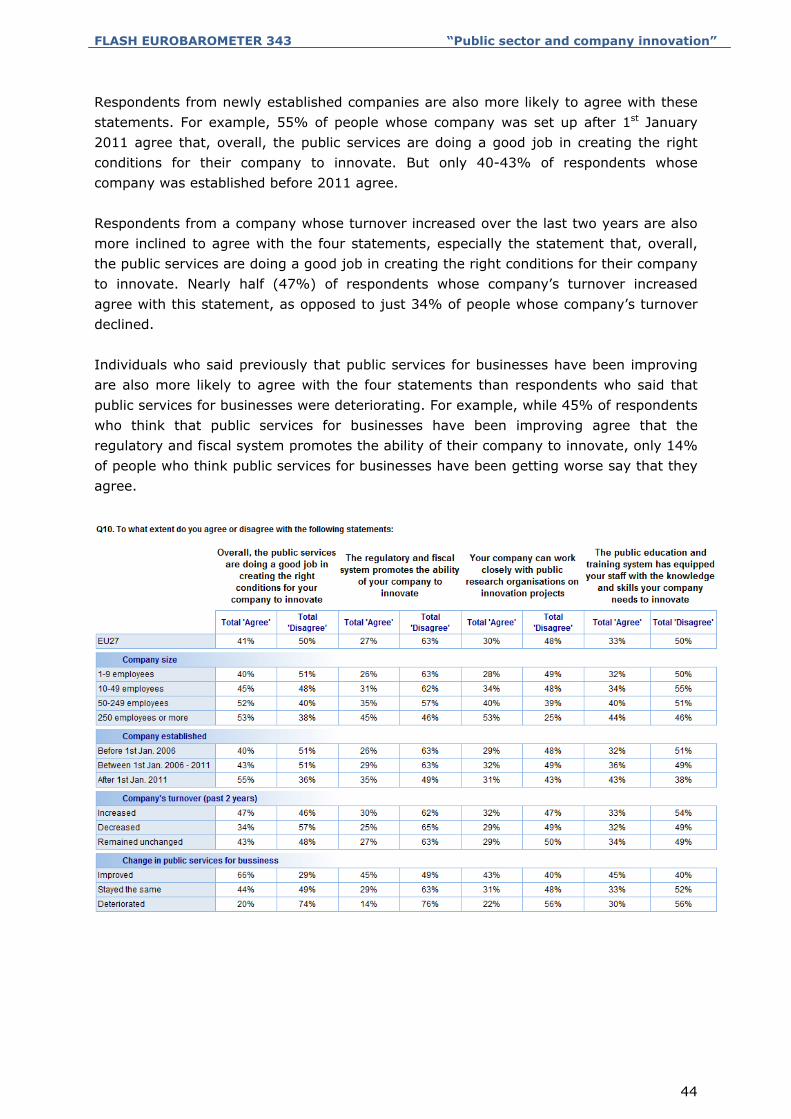
3.2 Conditions and support for innovation provided by the public sector
- More respondents disagree than agree with all four statements about whether
the public sector is helping their company to innovate - All respondents were asked to say whether they agree or disagree with four statements relating to their company’s interaction with public services for businesses and whether those services are helping them to innovate14. Respondents were first asked whether they agree or disagree with the statement that, “overall, the public services are doing a good job in creating the right conditions for your company to innovate”. Four out of 10 (41%) respondents agree with this statement, with just 4% strongly agreeing and 37% tending to agree. However, half of them (50%) disagree, 17% strongly disagreeing and 37% tending to disagree. A tenth (9%) of respondents say they don’t know if the public services are doing a good job of enabling their company to innovate. Secondly, respondents were asked whether they agree that “the public education and training system has equipped your staff with the knowledge and skills your company needs to innovate”. One third (33%) of respondents agree with this, with 7% strongly agreeing and 26% tending to agree. But half (50%) disagree, with 27% strongly disagreeing and 23% tending to disagree. A sixth (17%) of respondents say they don’t know whether public education has enabled their staff to innovate. Thirdly, respondents were asked whether “your company can work closely with public research organisations on innovation projects”. Three out of 10 (30%) respondents agree with this, 6% strongly and 24% only tending to agree. Just under half (48%) of them disagree, with 24% strongly disagreeing and 24% tending to disagree. Over a fifth (22%) of respondents say they don’t know whether their company can work closely with public research organisations on innovation projects. Lastly, respondents were asked whether “the regulatory and fiscal system promotes the ability of your company to innovate”. Just over a quarter (27%) of respondents agree with this statement, with 3% strongly agreeing and 24% tending to agree. Nearly two-thirds (63%) of respondents disagree, with 31% strongly disagreeing and 32% tending to disagree. One in ten (10%) don’t know whether the regulatory and fiscal system has helped their company to innovate.
14 To what extent do you agree or disagree with the following statements:

FLASH EUROBAROMETER 343 “Public sector and company innovation”
42
Country-level analysis shows that there are wide variations in the level of agreement with these four statements from country to country. On the question of whether the public services are doing a good job in creating the right conditions for companies to innovate, a majority of respondents in 12 of the 33 countries are in agreement. A particular high proportion of respondents agree with this statement in Luxembourg (78%), Turkey (71%) and Latvia (67%). But elsewhere agreement is relatively low, and in both Greece and Iceland only 20% of respondents agree that public services are doing a good job of helping companies to innovate. When it comes to the question of whether the public education and training system has equipped staff with the knowledge and skills their company needs to innovate, a majority of respondents in just five of the 33 countries say they agree: Turkey (61%), Finland (57%), Romania (55%), Luxembourg (52%), and the Former Yugoslav Republic of Macedonia (51%). By contrast, relatively few respondents agree with this statement in Norway (14%), Estonia (22%) and Greece (22%). In just four of the 33 countries does a majority of people agree that their company can work closely with public research organisations on innovation projects. They are: Lithuania (58%), Romania (57%), the Former Yugoslav Republic of Macedonia (55%) and Turkey (52%). Agreement is lowest in Sweden (13%), Norway (16%) and Estonia (18%). Also in four of the 33 countries we find that a majority of respondents agrees with the idea that the regulatory and fiscal system promotes the ability of their company to innovate. Those four countries are: Luxembourg (66%), Turkey (64%), the Former Yugoslav Republic of Macedonia (53%), and Malta (50%). Agreement with this statement is lowest in Iceland (13%), Denmark (14%), and Greece (14%).

FLASH EUROBAROMETER 343 “Public sector and company innovation”
43
In the case of all four statements, we find that respondents from a large company are more likely to agree. For example, 45% of respondents who work for a company with at least 250 employees say that they agree with the statement that the regulatory and fiscal system promotes the ability of their company to innovate. However, this level of agreement falls progressively, with only 26% of respondents from a company with 1-9 employees agreeing.
FLASH EUROBAROMETER 343 “Public sector and company innovation”
44
Respondents from newly established companies are also more likely to agree with these statements. For example, 55% of people whose company was set up after 1st January 2011 agree that, overall, the public services are doing a good job in creating the right conditions for their company to innovate. But only 40-43% of respondents whose company was established before 2011 agree. Respondents from a company whose turnover increased over the last two years are also more inclined to agree with the four statements, especially the statement that, overall, the public services are doing a good job in creating the right conditions for their company to innovate. Nearly half (47%) of respondents whose company’s turnover increased agree with this statement, as opposed to just 34% of people whose company’s turnover declined. Individuals who said previously that public services for businesses have been improving are also more likely to agree with the four statements than respondents who said that public services for businesses were deteriorating. For example, while 45% of respondents who think that public services for businesses have been improving agree that the regulatory and fiscal system promotes the ability of their company to innovate, only 14% of people who think public services for businesses have been getting worse say that they agree.

FLASH EUROBAROMETER 343 “Public sector and company innovation”
45
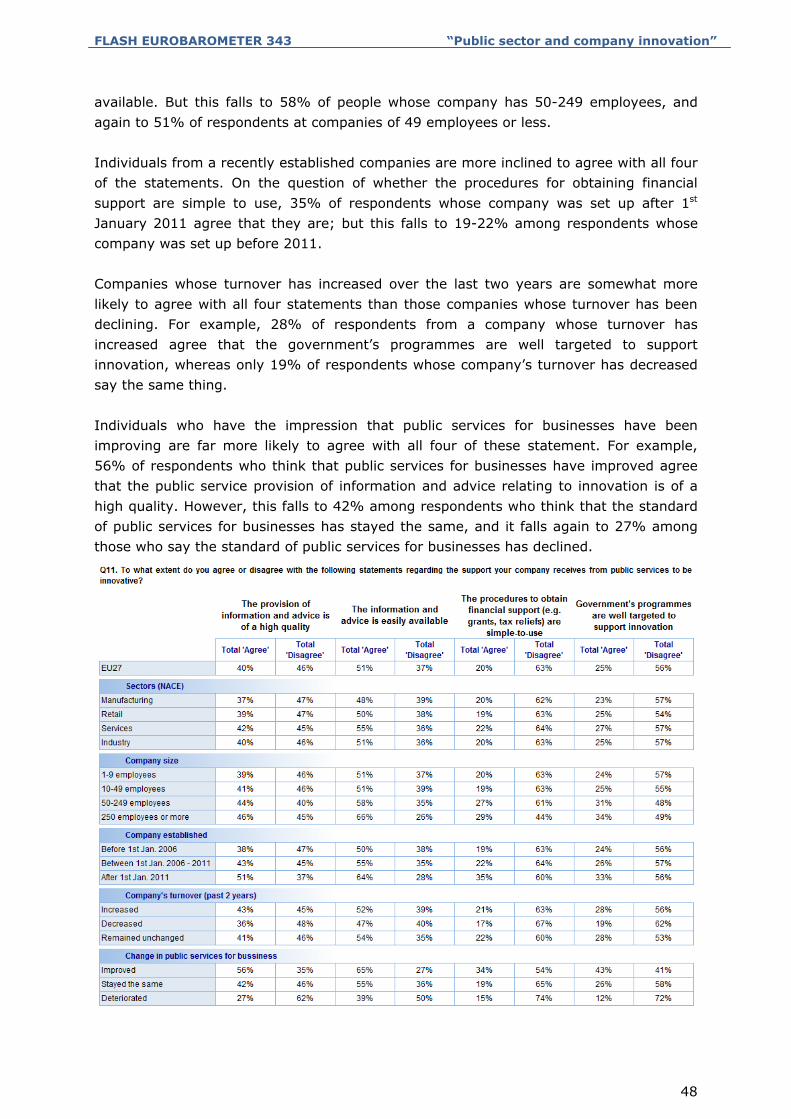
- A majority of respondents agree that information and advice about innovation is easily available, but agreement is less widespread on other issues -
All respondents were then asked to say whether they agree or disagree with four further statements about the support their company receives from public services to enable them to be innovative15. First, respondents were asked whether they agree or disagree with the statement that, “the information and advice is easily available”. A majority (51%) of respondents agree with this statement, with 11% strongly agreeing and 40% tending to agree. However, over a third (37%) disagree, with 14% strongly disagreeing and 23% tending to disagree. Over a tenth (12%) of respondents say they don’t know whether the information and advice is easily available. Next, respondents were asked whether they agree that “the provision of information and advice is of a high quality”. Four out of 10 (40%) respondents agree with this, with 7% strongly agreeing and 33% tending to agree. However, a relative majority (46%) disagree, with 19% strongly disagreeing and 27% tending to disagree. Over a tenth of respondents (14%) of say they don’t know if the provision of information and advice is of a high quality. Thirdly, respondents were asked whether “the government’s programmes are well targeted to support innovation”. A quarter (25%) of respondents agree that these programmes do support innovation, with 3% strongly agreeing and 22% tending to agree. A majority (56%) of respondents disagree, however, with 26% strongly disagreeing and 30% tending to disagree. Nearly a fifth (19%) of respondents say they don’t know if the government’s programmes are well targeted. Lastly, respondents were asked whether “the procedures for obtaining financial support (e.g. grants, tax reliefs) are simple to use”. A fifth (20%) of respondents agree with this statement, with 4% strongly agreeing and 16% tending to agree. Nearly two-thirds (63%) of respondents disagree, with 34% strongly disagreeing and 29% tending to disagree. A sixth (17%) of respondents say that don’t know whether the procedures for obtaining financial support are easy to use.
15 To what extent do you agree or disagree with the following statements regarding the support your company
receives from public services to be innovative?

FLASH EUROBAROMETER 343 “Public sector and company innovation”
46
Country-level analysis shows that in 22 of the 33 countries included in this survey a majority of respondents take the view that public service information and advice about innovation is easily accessible. A high proportion of respondents agree that the information and advice about innovation is easily accessible in Slovenia (73%), Turkey (73%), and Romania (67%). But in three countries less than four in 10 respondents agree that in their country the information and advice is easily accessible: Norway (29%), Denmark (38%), and Iceland (39%). On the question of the whether the provision of information and advice is of high quality, a majority of respondents in 12 of the 33 countries agree that it is indeed high-quality information. Two-thirds (66%) of respondents in Turkey hold this opinion, followed by 62% of people in Luxembourg and 58% of those in the Former Yugoslav Republic of Macedonia. However, less than three out of 10 respondents consider the information and advice provided in their country to be of high quality in Greece (21%), Iceland (26%), Spain (27%), Italy (28%) and Norway (29%). In just three of the 33 countries does a majority of respondents agree that the government’s programmes are well targeted to support innovation. They are Turkey (71%), Luxembourg (57%), and Malta (56%), with a relatively high proportion also agreeing in the Former Yugoslav Republic of Macedonia (48%). In eight countries, less than a fifth of respondents agree that the government’s programmes are well targeted, with the lowest levels of agreement occurring in Greece (11%), Iceland (12%) and Slovakia (12%). Turkey, which demonstrates the highest level of agreement on all four of the questions in this section of the report, is the only country in which a majority (59%) of respondents agrees that the procedures for obtaining financial support (e.g. grants, tax reliefs) are simple to use. In only six of the 33 countries do at least three out of 10 respondents agree that the procedures for obtaining financial support are simple to use, the other five being Luxembourg (40%), the Former Yugoslav Republic of Macedonia (39%), Belgium (32%), Romania (32%), and Cyprus (31%). In 11 countries, less than a fifth of

FLASH EUROBAROMETER 343 “Public sector and company innovation”
47
respondents agree that these procedures are simple, with agreement lowest in Slovakia (8%), Iceland (9%) and Norway (10%).
Considering the different types of company that respondents work for, the data suggest that companies who work in services are the most likely to agree with all four of these questions. For example, 55% of people who work in services agree that the information and advice provided by public services is easily available, whereas only 48% of people who work in manufacturing do so. Again in all four cases, respondents from a larger company are more likely to agree. For example, two-thirds (66%) of people who work for a company with at least 250 employees agree that the information and advice provided by public services is easily
FLASH EUROBAROMETER 343 “Public sector and company innovation”
48
available. But this falls to 58% of people whose company has 50-249 employees, and again to 51% of respondents at companies of 49 employees or less. Individuals from a recently established companies are more inclined to agree with all four of the statements. On the question of whether the procedures for obtaining financial support are simple to use, 35% of respondents whose company was set up after 1st January 2011 agree that they are; but this falls to 19-22% among respondents whose company was set up before 2011. Companies whose turnover has increased over the last two years are somewhat more likely to agree with all four statements than those companies whose turnover has been declining. For example, 28% of respondents from a company whose turnover has increased agree that the government’s programmes are well targeted to support innovation, whereas only 19% of respondents whose company’s turnover has decreased say the same thing. Individuals who have the impression that public services for businesses have been improving are far more likely to agree with all four of these statement. For example, 56% of respondents who think that public services for businesses have improved agree that the public service provision of information and advice relating to innovation is of a high quality. However, this falls to 42% among respondents who think that the standard of public services for businesses has stayed the same, and it falls again to 27% among those who say the standard of public services for businesses has declined.
FLASH EUROBAROMETER 343 “Public sector and company innovation”
49
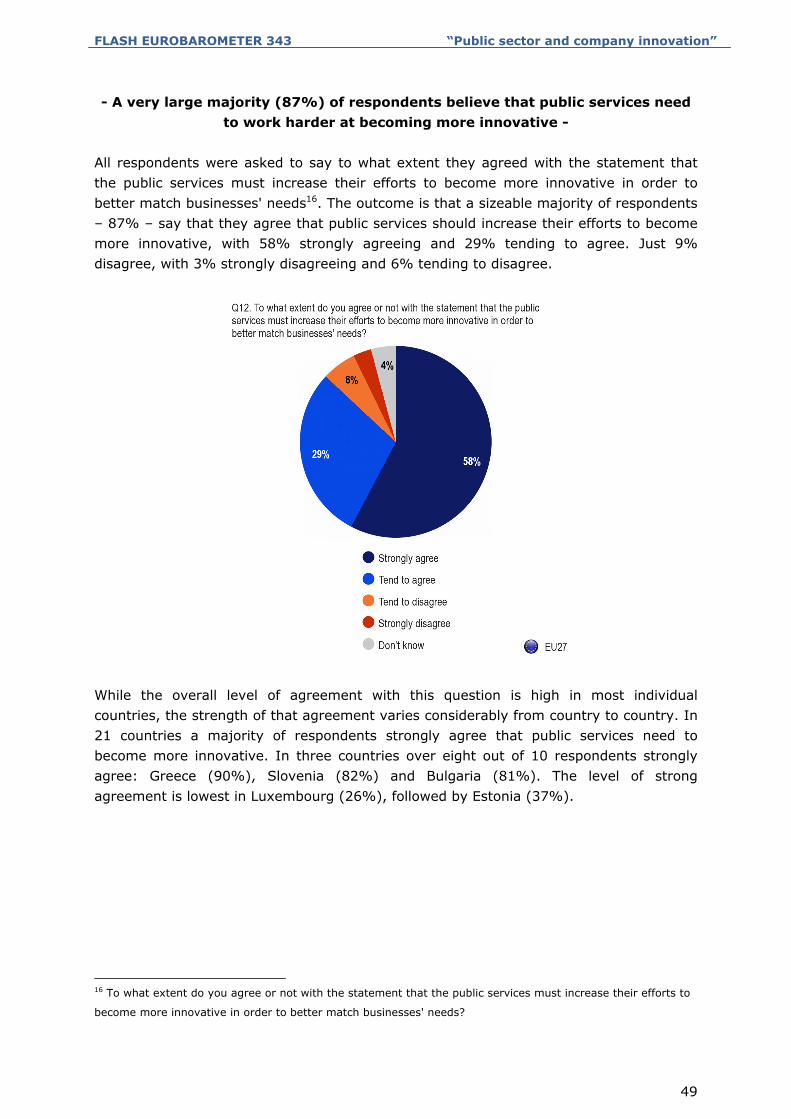
- A very large majority (87%) of respondents believe that public services need to work harder at becoming more innovative -
All respondents were asked to say to what extent they agreed with the statement that the public services must increase their efforts to become more innovative in order to better match businesses' needs16. The outcome is that a sizeable majority of respondents – 87% – say that they agree that public services should increase their efforts to become more innovative, with 58% strongly agreeing and 29% tending to agree. Just 9% disagree, with 3% strongly disagreeing and 6% tending to disagree.
While the overall level of agreement with this question is high in most individual countries, the strength of that agreement varies considerably from country to country. In 21 countries a majority of respondents strongly agree that public services need to become more innovative. In three countries over eight out of 10 respondents strongly agree: Greece (90%), Slovenia (82%) and Bulgaria (81%). The level of strong agreement is lowest in Luxembourg (26%), followed by Estonia (37%).
16 To what extent do you agree or not with the statement that the public services must increase their efforts to
become more innovative in order to better match businesses' needs?

FLASH EUROBAROMETER 343 “Public sector and company innovation”
50
In terms of overall agreement, at least nine out of 10 respondents agree that public services need to become more innovative in 11 countries. Agreement is highest in Greece (97%), Bulgaria (95%), Cyprus (94%), and Spain (94%). At least eight out of 10 respondents agree in all but five countries, the exceptions being the Former Yugoslav Republic of Macedonia (75%), Iceland (77%), Luxembourg (77%), Denmark (78%), and Norway (78%). In 12 of the 33 countries at least 10% of respondents disagree with the idea that the public services need to become more innovative17. The overall level of disagreement is highest in Luxembourg (17%), Belgium (15%) and Poland (14%).
17 The size of the samples is generally very small at this stage.
FLASH EUROBAROMETER 343 “Public sector and company innovation”
51
Considering the different types of company that respondents represent, the data suggest that respondents who represent companies from services are slightly more likely to agree that public services need to be more innovative than their counterparts in other industries. While 61% of respondents who work in services agree, only 56% of those who work in manufacturing do so. Respondents who work for larger companies are somewhat more likely to agree that the public services need to make more effort to be innovative. Two-thirds (65%) of respondents who work at companies with 50-249 employees agree with this, as opposed to 85% of respondents at companies of 49 employees or less. Respondents from well-established companies appear to be more inclined to agree that the public services need to do more to become more innovative. While 59% of respondents whose company was set up before 1st January 2006 agree with this sentiment, only 50% of respondents whose company was set up after 1st January 2011 agree. People who work at a company whose turnover has fallen over the last two years are somewhat more likely to think that the public services need to try harder to become innovative. Two-thirds (65%) of respondents whose company’s turnover decreased agree with this, whereas only 58% of respondents from a company whose turnover increased say the same thing.

FLASH EUROBAROMETER 343 “Public sector and company innovation”
52
Respondents from a company that has introduced innovations are more likely to feel that the public services need to make more effort to become innovative. While 64% of people in this group agree, only 55% of people whose company has not introduced innovation agree that the public services need to make more effort. Respondents who have the impression that public services for businesses have been deteriorating are more likely to agree with the idea that the public services should make more effort to become innovative. Two-thirds (65%) of respondents who say that public services for businesses have been getting worse agree that the public services should increase their efforts to be more innovative, while only 57% of respondents who think the standard of public services have improved or stayed the same agree.

FLASH EUROBAROMETER 343 “Public sector and company innovation”
53
4. PUBLIC PROCUREMENT AND INNOVATION - Two-thirds of respondents say that their company has had no interest in public
procurements over the last three years - All respondents were asked about their company’s involvement in public procurements since January 2009, with multiple answers possible18. Around one in seven (14%) respondents say that their company has won at least one public procurement contract since January 2009. A similar number (13%) say that their company has submitted at least one tender for a public procurement without success. A tenth (11%) of respondents say that their company investigated opportunities to sell to governments or public bodies, but did not submit any tender. A large majority of respondents (70%) say that their company has not done any of these things. Comparison of the EU15 and NMS12 results suggests that companies in the NMS12 countries are somewhat more likely to have been involved with public procurements: only 59% of NMS12 respondents say that their company had not had any involvement with public procurement, while 69% of EU15 respondents say this. NMS12 respondents are more likely to say that their company won a public contract (17%, vs. 14%), submitted a tender (16%, vs. 13%), and investigated the opportunities (13%, vs. 10%).
18 The term “public procurement” describes the purchases of goods, services and public works by governments
and public bodies. Since January 2009 has your company…
FLASH EUROBAROMETER 343 “Public sector and company innovation”
54
Country-level analysis shows that in 12 of the 33 countries included in this survey at least a fifth of respondents say that their company has won at least one public procurement contract since 2009. The proportion of respondents giving this answer is highest in Norway (32%), Switzerland (31%) and Cyprus (28%). The Netherlands (10%) and Spain (10%) have the lowest proportions of respondents who say that their company has won a public procurement contract in the last three years. In eight countries, at least a fifth of respondents say that their company submitted at least one tender for a public procurement without success, with a relatively high proportion of respondents saying this in Switzerland (36%), Slovakia (31%) and Finland (25%). But in a number of countries, very few people give this answer, notably those in Cyprus (2%) and Italy (5%).
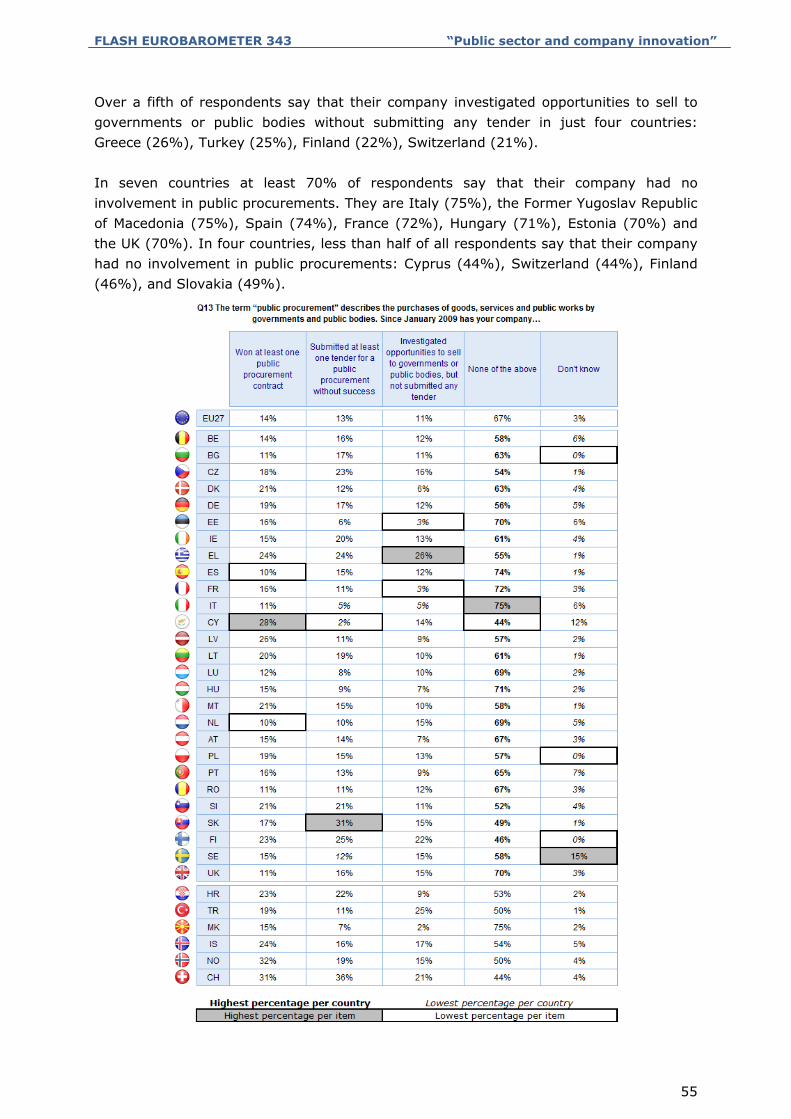
FLASH EUROBAROMETER 343 “Public sector and company innovation”
55
Over a fifth of respondents say that their company investigated opportunities to sell to governments or public bodies without submitting any tender in just four countries: Greece (26%), Turkey (25%), Finland (22%), Switzerland (21%). In seven countries at least 70% of respondents say that their company had no involvement in public procurements. They are Italy (75%), the Former Yugoslav Republic of Macedonia (75%), Spain (74%), France (72%), Hungary (71%), Estonia (70%) and the UK (70%). In four countries, less than half of all respondents say that their company had no involvement in public procurements: Cyprus (44%), Switzerland (44%), Finland (46%), and Slovakia (49%).

FLASH EUROBAROMETER 343 “Public sector and company innovation”
56
Respondents who work in industry appear more likely than those who work at other types of company to say that their company has been involved in public procurements. Only 53% of industry respondents say that their company had no involvement in public procurements, compared with 68% of respondents who work in manufacturing, 70% who work in retail, and 75% of those working in services. Respondents from larger companies are also more likely to say that their company has been involved in public procurements. Only 45% of respondents from a company with at least 250 employees say that their company had no involvement in public procurements, compared with 52% of respondents who work at a company with 50-249 employees, 55% who work at a company with 10-49 employees, and 70% of people who work at a company of 1-9 employees. Respondents whose company has introduced some innovations are more likely to say that their company has been involved in public procurements. While only 60% of people whose company has introduced some innovations say that their company had no involvement in public procurements, 71% of those whose company did not introduce any innovations say the same thing.
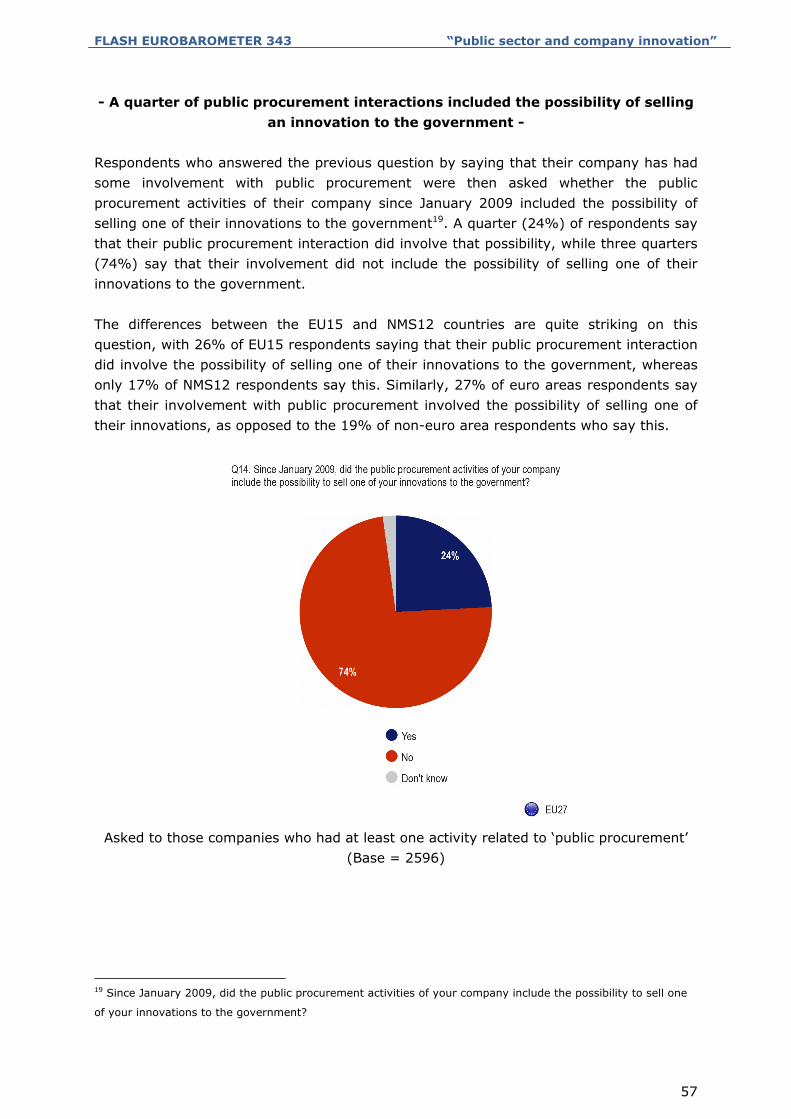
FLASH EUROBAROMETER 343 “Public sector and company innovation”
57
- A quarter of public procurement interactions included the possibility of selling an innovation to the government -
Respondents who answered the previous question by saying that their company has had some involvement with public procurement were then asked whether the public procurement activities of their company since January 2009 included the possibility of selling one of their innovations to the government19. A quarter (24%) of respondents say that their public procurement interaction did involve that possibility, while three quarters (74%) say that their involvement did not include the possibility of selling one of their innovations to the government. The differences between the EU15 and NMS12 countries are quite striking on this question, with 26% of EU15 respondents saying that their public procurement interaction did involve the possibility of selling one of their innovations to the government, whereas only 17% of NMS12 respondents say this. Similarly, 27% of euro areas respondents say that their involvement with public procurement involved the possibility of selling one of their innovations, as opposed to the 19% of non-euro area respondents who say this.
Asked to those companies who had at least one activity related to ‘public procurement’
(Base = 2596)
19 Since January 2009, did the public procurement activities of your company include the possibility to sell one
of your innovations to the government?

FLASH EUROBAROMETER 343 “Public sector and company innovation”
58
At individual country level we find that in nine of the 33 countries at least three out of 10 respondents whose companies have been involved in public procurement say that this involvement included the possibility of selling one of their innovations to the government. In four countries over 40% of respondents say this: Denmark (49%), Cyprus (48%), Malta (42%), and Spain (40%). But in seven countries, under a fifth of respondents say that their company’s public procurement interaction included the possibility of selling one of their innovations. In Hungary, only 1% of respondents20 say that their company’s public procurement included the possibility of selling an innovation, as do 4% of those in Croatia and 10% in Belgium.
20 In some cases the sample sizes are quite small in this question. In the case of Hungary 1% equals one
individual out of a total of 82.

FLASH EUROBAROMETER 343 “Public sector and company innovation”
59
Analysis of the different types of companies that respondents represent suggest that service companies are the most likely to have been involved in a public procurement that included the possibility of selling one of their innovations to the government. A third (32%) of respondents coming from services say this, compared with 25% of respondents coming from manufacturing, 23% who work in retail, and 19% who work in industry. Respondents from larger companies are more likely to say that their company was involved in a public procurement that included the possibility of selling one of their innovations: 33-34% of people who work at a company with at least 50 employees say this, as opposed to 23% of respondents who work at a company with less than 50 staff. Respondents whose company introduced some innovations since January 2009 are more likely to say that their company was involved in a public procurement that included the possibility of selling one of its innovations: 35% of the people in this group say this, compared with just 15% of those whose company did not introduce any innovation during the same timeframe. Respondent who feel that public services for businesses have improved since January 2009 are more likely to say that their company was involved in a public procurement that included the possibility of selling one of their innovations to the government: 31% of people in this group say this, as opposed to 21-22% of respondents who think the standard of public services for businesses has stayed the same or deteriorated.

FLASH EUROBAROMETER 343 “Public sector and company innovation”
60
- Half of all respondents consider price to be more important than innovation in a public tender for goods, twice as many as the number who emphasise
innovation over price - All respondents were asked whether, in their experience, price or innovation is the more important factor when it comes to winning a public tender for goods21. Half (49%) of the respondents say that price is the more important consideration, while a quarter (24%) of respondents say that innovation is more important than price. A tenth (9%) of respondents say spontaneously than price and innovation have equal importance, while just under a fifth (18%) say they don’t know which is the more importance factor.
A comparison of the EU15 and NMS12 results shows that NMS12 respondents are more likely to place an emphasis on price, with 57% saying that price is more important, as opposed to 47% of EU15 respondents. Among EU15 respondents, 26% say that innovation is more important, whereas only 18% of NMS12 respondents share this view. Non-euro area respondents are also more likely than their euro area counterparts to say that price is more important, by a margin of 55% to 46%. Euro area respondents are more likely to emphasise innovation, by a margin of 27% to 19%. In all but two of the 33 individual countries, a majority or relative majority of respondents say that price is more important than innovation when it comes to winning a public tender for goods. Over 50% of respondents say that price is more important in 14 countries, with 68% saying this in Poland, followed by 60% in both Lithuania and the Czech Republic. 21 In your experience, what is more important to win a public tender for GOODS…

FLASH EUROBAROMETER 343 “Public sector and company innovation”
61
The two exceptions are Turkey, where 52% say that innovation is important (vs. 24% who say price is more important), and Portugal, where 38% emphasise innovation (though 38% also say that price is more important). In seven countries, at least three out of 10 respondents say that innovation is more important, the other five being: Luxembourg (43%), Cyprus (37%), France (37%), Bulgaria (33%), and Finland (32%). In six countries at least a fifth of respondents spontaneously say that price and innovation are of equal importance. They are: the Former Yugoslav Republic of Macedonia (53%), Estonia (37%), Switzerland (26%), Hungary (25%), the Netherlands (25%), and Malta (22%). ‘Don’t know’ is also a common response in several countries, notably Sweden (45%), Iceland (39%), Denmark (33%), Norway (32%), and Italy (32%).

FLASH EUROBAROMETER 343 “Public sector and company innovation”
62
Analysis of the different types of companies that respondents work for suggests that people who work in industry are the most likely to emphasise price over innovation. A majority (54%) of people who work in industry say that price is more important, compared with 48% of respondents who work in retail or services, and 44% of those working in manufacturing. Respondents who work in services (27%) are the most likely to say that innovation is more important. Respondents from a company that has introduced some innovations are slightly more likely to say that innovation is more important than price when it comes to winning a public tender for goods: 27% of the people in this group say so, compared with just 23% of respondents whose company did not introduce any innovations.

FLASH EUROBAROMETER 343 “Public sector and company innovation”
63
- The results are the same for public tenders for services: half of the respondents emphasise price, while only a quarter emphasise innovation-
All respondents were then asked whether, in their experience, price or innovation is the more important factor when it comes to winning a public tender for services22. The EU-level results are almost identical to those obtained for the previous question relating to public tenders for goods. Half (50%) of the respondents say that price is the more important factor, while a quarter (24%) say that innovation is more important than price. Just under a tenth (8%) of respondents say spontaneously that price and innovation have equal importance, while close to a fifth (18%) say they don’t know which is the more importance factor.
The country-level results on the subject of public tenders for services are also broadly in line with those seen above for services. This time, in all but three of the 33 individual countries a majority or relative majority of respondents say that price is more important than innovation when it comes to winning a public tender for services. Over 50% of respondents say that price is more important in 13 countries, with 65% saying this in the Czech Republic, 64% doing so in Poland, and 60% agreeing with this in both Lithuania and Ireland. In the Former Yugoslav Republic of Macedonia and Sweden only 27% and 29% of respondents respectively say that price is the more important consideration. 22 In your experience, what is more important to win a public tender for SERVICES…

FLASH EUROBAROMETER 343 “Public sector and company innovation”
64
The three countries in which more respondents say that innovation is the more important factor in winning a public tender for services are: Turkey (56%), Cyprus (42%), and Luxembourg (41%). In six countries, at least three out of 10 respondents take the view that innovation is the more important factor, the remaining three being Bulgaria (35%), Finland (34%), and France (32%). In six countries at least a fifth of respondents spontaneously say that price and innovation are of equal importance (they are the same six countries as in the case of public tenders for goods). They are: the Former Yugoslav Republic of Macedonia (44%), Estonia (32%), Hungary (26%), Malta (24%), Switzerland (23%), and the Netherlands (21%). ‘Don’t know’ is also a common response in several countries, notably Sweden (44%), Iceland (37%), and Italy (36%).

FLASH EUROBAROMETER 343 “Public sector and company innovation”
65
Analysis of the different types of companies that respondents represent suggests that those who work in industry are the most likely to emphasise price over innovation in the case of public tenders of services, just as they were in the case of public tenders for goods. A majority (59%) of those who work in industry say that price is more important, compared with 52% who come from services, 45% of respondents who work in retail or manufacturing. Respondents who work in services or retail (both 25%) are the most likely to say that innovation is more important. Respondents who work at a company that was only recently established are more likely to say that price is more important than innovation were public tenders for services are concerned: 63% of people whose company was established after 1st January 2011 emphasise price, compared with only 49-51% of respondents whose company was established before 2011. By contrast, 24-26% of people whose company was established before 2011 say that innovation is more important than price, whereas only 16% of respondents whose company was set up in 2011 give this answer.

FLASH EUROBAROMETER 343 “Public sector and company innovation”
66
CONCLUSION: This Flash Eurobarometer’s initial finding that only one-third (35%) of respondents work for a company that introduced some kind of innovation during the past three years is arguably a reflection that the EU’s Innovation Union programme was only active during the third of that three-year period. As the project matures, a higher proportion of European companies should become innovators – something that is surely needed if innovation is indeed one of the keys to sustaining success in business in the face of an increasingly globalised economy. It is more encouraging to see, however, that respondents recognise the importance of innovation to company turnover. With 69% of people whose company introduced some innovations arguing that those innovations contributed to 2011 turnover, the case for promoting innovation within both the public and private sectors becomes very strong. The interaction between the private sector and public services is, of course, not always straightforward, especially in cases where excessive red tape prevents businesses from being as much innovative as they could be. Indeed, the rate of use of public services for business is generally not all that high, according to this report’s data. Even in the cases of public services relating to health and safety and of training programmes for employees – the most widely used services – less than a third of respondents say that their company has made use of those types of services since January 2009. Usage of other types of services is even lower. Uptake can clearly be improved by making the right services available, properly communicating their availability to the target companies, and then streamlining those services so that companies see them as an opportunity rather than a hindrance. Company location undeniably plays an important part in terms of the extent to which companies innovate, and the extent to which they perceive and involve themselves in public services. For example, at European level the perception is that the standard of public services for business has stayed more or less the same over the last three years. Yet this perception is not uniform: in Malta and Turkey around half of all respondents think public services are improving, while in Greece around half think they are getting worse. As the Innovation Union strategy gains traction, public services for business should in theory start to improve across the board, and not only in specific countries. The economic crisis will of course make this objective even more challenging in some countries . At the same time the countries that are suffering most from the crisis are the ones most in need of agile public services with the capacity to boost business innovation, and a key test of the Innovation Union will be whether public services for business can be made to improve in places like Greece in spite of the downturn.

FLASH EUROBAROMETER 343 “Public sector and company innovation”
67
Perhaps the most telling statistic to be found in this report is the 87% of respondents who agree (most of them strongly) that public services need to up their efforts to become more innovative in order to better match businesses’ needs. Only a fifth of respondents, for example, think that the procedures for obtaining financial support are easy to use; only a quarter feel that government programmes are well targeted at supporting innovation. The recognition of innovation being crucial is present within the private sector. But the results show that there is no strong sense among business people in many European countries that the public sector is providing the right support to enable businesses to innovate, or that the public sector is sufficiently innovative itself.

ANNEXES

TECHNICAL SPECIFICATIONS

FLASH EUROBAROMETER 343 “Public sector and company innovation”
FLASH EUROBAROMETER 343
“Impact and Perception of the Public Sector Innovation among Companies” TECHNICAL SPECIFICATIONS
Between the 16th of February and the 7th of March 2012, TNS political & social, a consortium created between TNS UK and TNS opinion, carried out the survey FLASH EUROBAROMETER 343 about the "Impact and Perception of the Public Sector Innovation among Companies". This survey has been requested by the EUROPEAN COMMISSION, Directorate-General for Enterprise and Industry. It is a business to business survey co-ordinated by the Directorate-General for Communication ("Research and Speechwriting" Unit). The FLASH EUROBAROMETER 343 covers businesses employing 1 or more persons in the manufacturing (Nace category C), retail (Nace category G), services (Nace categories I/J/K/H) and industry (Nace categories B/D/E/F) sectors within the European Union. We thus surveyed businesses within the following NACE codes: B - Mining and quarrying, C – Manufacturing, D - Electricity, gas, steam and air conditioning supply, E - Water supply; sewerage; waste managment and remediation activities, F – Construction, G - Wholesale and retail trade; repair of motor vehicles and motorcycles, H – Transportation and storage, I - Accommodation and food service activities, J - Information and communication, K - Financial and insurance activities. It was also conducted in Croatia, Iceland, the Former Yugoslav Republic of Macedonia, Norway, Switzerland and Turkey where the same target group was interviewed. Whenever a company was eligible the selected respondent had to be a general manager, a financial director or a significant owner. All interviews were carried using the TNS e-Call center (our centralized CATI system). The sample was selected from an international business database, with some additional sample from local sources in countries where necessary. Quotas were applied on both company size (using three different ranges: 1-9 employees, 10-49 employees, 50 employees or more) and sectors (retail, services, manufacturing and industry). These quotas were adjusted according to the country’s universe but were also reasoned in order to ensure that the sample was large enough in every cell.
ST1
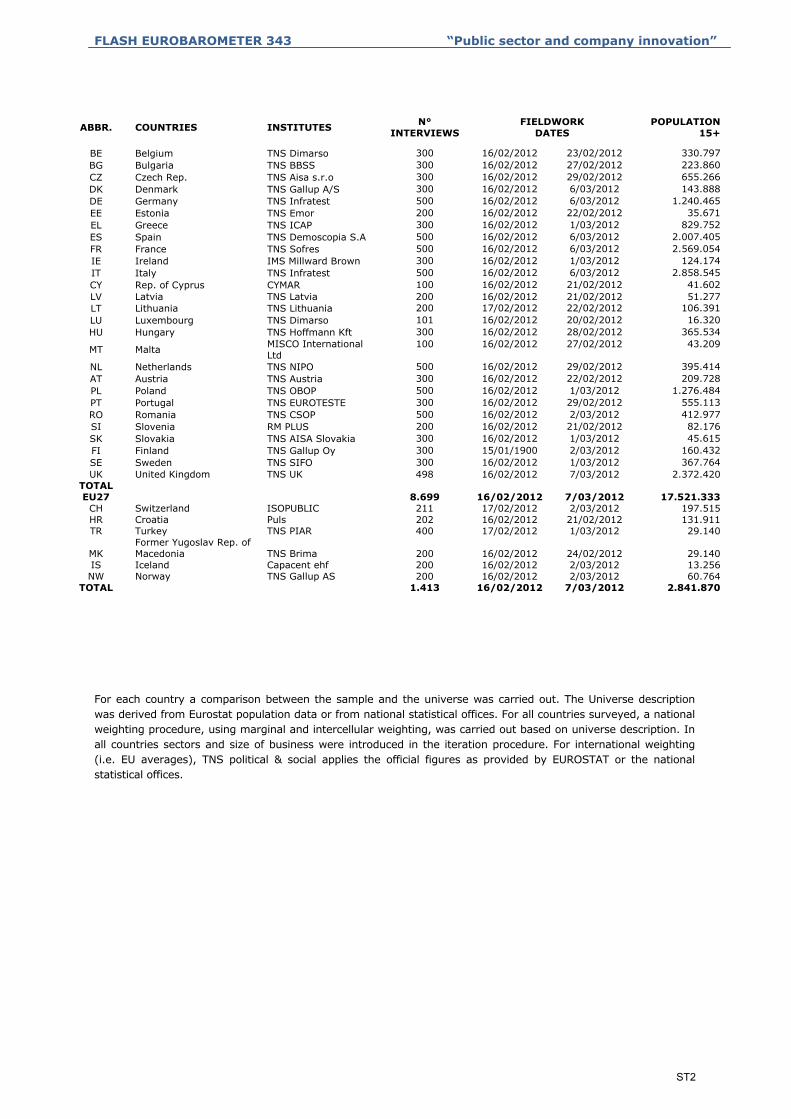
FLASH EUROBAROMETER 343 “Public sector and company innovation”
For each country a comparison between the sample and the universe was carried out. The Universe description was derived from Eurostat population data or from national statistical offices. For all countries surveyed, a national weighting procedure, using marginal and intercellular weighting, was carried out based on universe description. In all countries sectors and size of business were introduced in the iteration procedure. For international weighting (i.e. EU averages), TNS political & social applies the official figures as provided by EUROSTAT or the national statistical offices.
ABBR. COUNTRIES INSTITUTES N° INTERVIEWS
FIELDWORK DATES
POPULATION 15+
BE Belgium TNS Dimarso 300 16/02/2012 23/02/2012 330.797 BG Bulgaria TNS BBSS 300 16/02/2012 27/02/2012 223.860 CZ Czech Rep. TNS Aisa s.r.o 300 16/02/2012 29/02/2012 655.266 DK Denmark TNS Gallup A/S 300 16/02/2012 6/03/2012 143.888 DE Germany TNS Infratest 500 16/02/2012 6/03/2012 1.240.465 EE Estonia TNS Emor 200 16/02/2012 22/02/2012 35.671 EL Greece TNS ICAP 300 16/02/2012 1/03/2012 829.752 ES Spain TNS Demoscopia S.A 500 16/02/2012 6/03/2012 2.007.405 FR France TNS Sofres 500 16/02/2012 6/03/2012 2.569.054 IE Ireland IMS Millward Brown 300 16/02/2012 1/03/2012 124.174 IT Italy TNS Infratest 500 16/02/2012 6/03/2012 2.858.545 CY Rep. of Cyprus CYMAR 100 16/02/2012 21/02/2012 41.602 LV Latvia TNS Latvia 200 16/02/2012 21/02/2012 51.277 LT Lithuania TNS Lithuania 200 17/02/2012 22/02/2012 106.391 LU Luxembourg TNS Dimarso 101 16/02/2012 20/02/2012 16.320 HU Hungary TNS Hoffmann Kft 300 16/02/2012 28/02/2012 365.534
MT Malta MISCO International Ltd
100 16/02/2012 27/02/2012 43.209
NL Netherlands TNS NIPO 500 16/02/2012 29/02/2012 395.414 AT Austria TNS Austria 300 16/02/2012 22/02/2012 209.728 PL Poland TNS OBOP 500 16/02/2012 1/03/2012 1.276.484 PT Portugal TNS EUROTESTE 300 16/02/2012 29/02/2012 555.113 RO Romania TNS CSOP 500 16/02/2012 2/03/2012 412.977 SI Slovenia RM PLUS 200 16/02/2012 21/02/2012 82.176 SK Slovakia TNS AISA Slovakia 300 16/02/2012 1/03/2012 45.615 FI Finland TNS Gallup Oy 300 15/01/1900 2/03/2012 160.432 SE Sweden TNS SIFO 300 16/02/2012 1/03/2012 367.764 UK United Kingdom TNS UK 498 16/02/2012 7/03/2012 2.372.420
TOTAL EU27
8.699 16/02/2012 7/03/2012 17.521.333 CH Switzerland ISOPUBLIC 211 17/02/2012 2/03/2012 197.515 HR Croatia Puls 202 16/02/2012 21/02/2012 131.911 TR Turkey TNS PIAR 400 17/02/2012 1/03/2012 29.140
MK Former Yugoslav Rep. of Macedonia TNS Brima 200
16/02/2012
24/02/2012 29.140
IS Iceland Capacent ehf 200 16/02/2012 2/03/2012 13.256 NW Norway TNS Gallup AS 200 16/02/2012 2/03/2012 60.764
TOTAL 1.413 16/02/2012 7/03/2012 2.841.870
ST2

FLASH EUROBAROMETER 343 “Public sector and company innovation”
Readers are reminded that survey results are estimations, the accuracy of which, everything being equal, rests upon the sample size and upon the observed percentage. With samples of about 500 interviews, the real percentages vary within the following confidence limits:
Observed percentages 10% or 90% 20% or 80% 30% or 70% 40% or 60% 50%
Confidence limits ± 2.6 points ± 3.5 points ± 4.0 points ± 4.3 points ± 4.4 points
With samples of about 400 interviews, the real percentages vary within the following confidence limits:
Observed percentages 10% or 90% 20% or 80% 30% or 70% 40% or 60% 50%
Confidence limits ± 2.9 points
± 3.9 points ± 4.5 points
± 4.8 points
± 4.9 points
With samples of about 300 interviews, the real percentages vary within the following confidence limits:
Observed percentages 10% or 90% 20% or 80% 30% or 70% 40% or 60% 50%
Confidence limits ± 3.4 points ± 4.5 points ± 5.2
points ± 5.5 points
± 5.7 points
With samples of about 200 interviews, the real percentages vary within the following confidence limits:
Observed percentages 10% or 90% 20% or 80% 30% or 70% 40% or 60% 50%
Confidence limits ± 4.2 points
± 5.5 points ± 6.4 points
± 6.8 points
± 6.9 points
With samples of about 100 interviews, the real percentages vary within the following confidence limits:
Observed percentages 10% or 90% 20% or 80% 30% or 70% 40% or 60% 50%
Confidence limits ± 5.9 points ± 7.8 points ± 9.0
points ± 9.6 points
± 9.8 points
ST3

QUESTIONNAIRE

FLASH EUROBAROMETER 343 PUBLIC SECTOR AND COMPANY INNOVATION
FL343 - Innobarometer
D1A
D1B
12345
D2
1234
D3
123
Section 1 Socio-economic questions
Let me start with a few basic questions regarding your company. For all questions, please limit your responses to the activities of your company IN [YOUR COUNTRY] only.
How many employees (full-time equivalent) does your company currently have?
(IF "DK\NA", CODE '99999')
employees
FL342 SCR10a (M)
ASK D1B IF CODE 99999 (DK/NA) IN D1A - OTHERS GO TO D2
How many employees (full-time equivalent) does your company currently have?
(READ OUT – ONE ANSWER ONLY)
1 to 9 employees10 to 49 employees50 to 249 employees250 employees or moreDK/NA
FL342 SCR10b (M)
IF D1B=5 THEN STOP INTERVIEW
When was your company established?
(READ OUT – ONE ANSWER ONLY)
Before 1st January 2006Between 1st January 2006 and 1st January 2011After 1st January 2011DK/NA
NEW
Has your company been taken over or merged with another company since the 1st of January 2006?
(READ OUT – ONE ANSWER ONLY)
YesNoDK/NA
NEW
Q1

FLASH EUROBAROMETER 343 PUBLIC SECTOR AND COMPANY INNOVATION
D4.1
D4.2
D4.3
D5
123456
THE PERCENTAGES IN D4.1, D4.2 AND D4.3 HAVE TO SUM UP TO ONE HUNDRED (D4.1+D4.2+D4.3 = 100%)IF AT LEAST ONE ANSWER 997,998 OR 999 in D4.1, D4.2 OR D4.3 THEN THE SUM OF THE VALID ANSWERS (ANSWERS BETWEEN 0 AND 100%) CAN BE LOWER THAN 100%
Approximately what percentage of your company's turnover in 2011 was sold in each of the following markets?
(WRITE DOWN THE ANSWER IN PERCENTAGE)(IF "NONE" CODE '997' - IF "REFUSAL" CODE '998' - IF "DK/NA" CODE '999')
In your own country (where the company located)
NEW
Approximately what percentage of your company's turnover in 2011 was sold in each of the following markets?
(WRITE DOWN THE ANSWER IN PERCENTAGE)(IF "NONE" CODE '997' - IF "REFUSAL" CODE '998' - IF "DK/NA" CODE '999')
In other EU countries, Switzerland, Norway, Iceland and Liechtenstein
NEW
Approximately what percentage of your company's turnover in 2011 was sold in each of the following markets?
(WRITE DOWN THE ANSWER IN PERCENTAGE)(IF "NONE" CODE '997' - IF "REFUSAL" CODE '998' - IF "DK/NA" CODE '999')
Other
NEW
Excluding changes due to mergers or acquisitions, compared to 2009, did your company’s
turnover in 2011…?
(READ OUT – ONE ANSWER ONLY)
Increase by more than 25% Increase by 5–25%
Remain approximately the sameDecrease by 5–25%
Decrease by over 25%DK/NA
NEW
Q2

FLASH EUROBAROMETER 343 PUBLIC SECTOR AND COMPANY INNOVATION
D6
Q1
123
Q2
Approximately what percentage of your employees has a university degree in 2011?
(WRITE DOWN THE ANSWER IN PERCENTAGE)(IF "NONE" CODE '997' - IF "REFUSAL" CODE '998' - IF "DK/NA" CODE '999')
NEW
Section 2 – Innovations in the responding company
Innovation occurs when a company introduces a NEW or SIGNIFICANTLY IMPROVED good, service, process, marketing strategy or organizational method. A company does not need to develop the innovation itself, but can acquire the innovation from other companies or organizations.
Has your company introduced any innovations since January 2009?
(READ OUT – ONE ANSWER ONLY)
YesNoDK/NA
NEW
ASK Q2 IF ‘YES’, CODE 1 IN Q1 - OTHERS GO TO Q3
Approximately what percentage of your company's turnover in 2011 was due to innovative goods and services introduced since January 2009?
(WRITE DOWN THE ANSWERS IN PERCENTAGES)(IF "NONE" CODE '997' - IF "REFUSAL" CODE '998' - IF "DK/NA" CODE '999')
NEW
Q3

FLASH EUROBAROMETER 343 PUBLIC SECTOR AND COMPANY INNOVATION
Q3
1
2
3
4
5
6
7
8
ASK ALL
Section 3 Use of public services for businesses
I will now ask you some questions about your use of several public services for businesses. These are services which are provided by national, regional or local government or indirectly via other sector agencies.
Since January 2009, has your company used any of the following public services?
(ONE ANSWER ONLY)
(READ OUT)Yes, 5
times or more
Yes, less than 5 times
No DK/NA
Training programs for employees 1 2 3 4Obtaining work permits for foreign workers 1 2 3 4
Health and safety issues 1 2 3 4Environment related permits and obligations (incl. reporting, water and waste management, emissions)
1 2 3 4
Applying for research or innovation subsidies 1 2 3 4
Applying for patents or trademarks 1 2 3 4
Conformity certification for new products 1 2 3 4
Other (such as starting a new business, obtaining legal advice or obtaining subsidies for research or innovation activities)
1 2 3 4
NEW
Q4
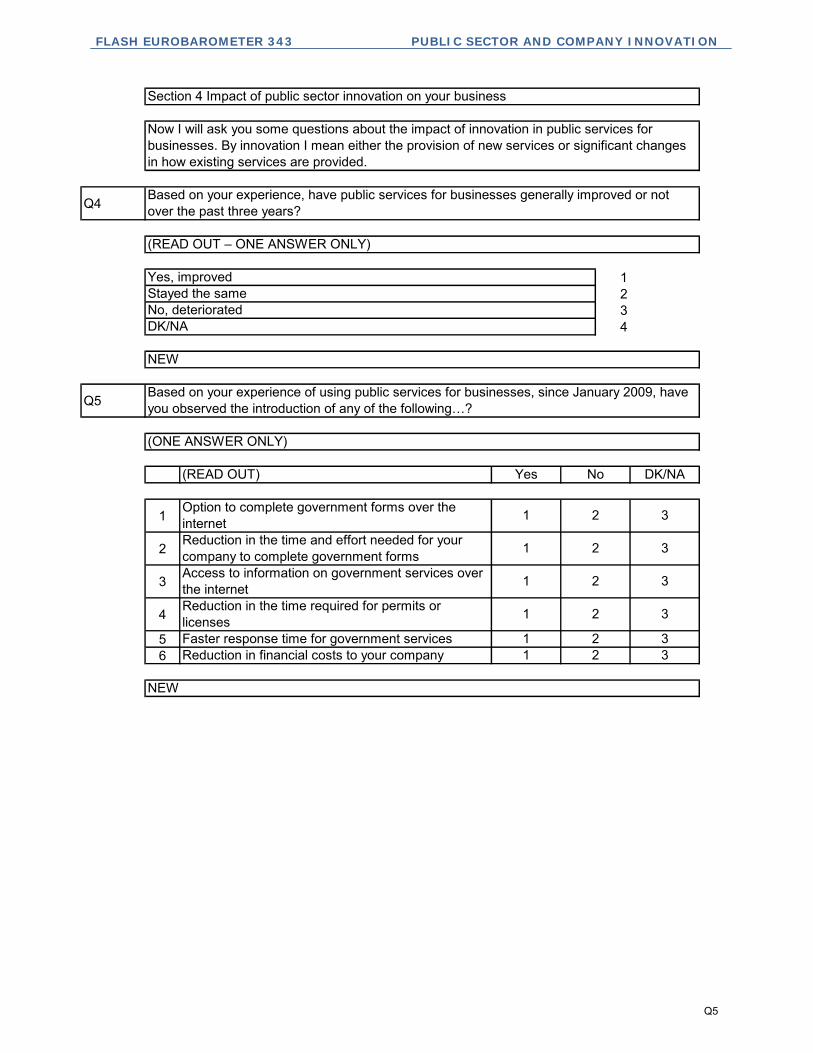
FLASH EUROBAROMETER 343 PUBLIC SECTOR AND COMPANY INNOVATION
Q4
1234
Q5
1
2
3
4
56
Section 4 Impact of public sector innovation on your business
Now I will ask you some questions about the impact of innovation in public services for businesses. By innovation I mean either the provision of new services or significant changes in how existing services are provided.
Based on your experience, have public services for businesses generally improved or not over the past three years?
(READ OUT – ONE ANSWER ONLY)
Yes, improvedStayed the sameNo, deterioratedDK/NA
NEW
Based on your experience of using public services for businesses, since January 2009, have you observed the introduction of any of the following…?
(ONE ANSWER ONLY)
(READ OUT) Yes No DK/NA
Option to complete government forms over the internet 1 2 3
Reduction in the time and effort needed for your company to complete government forms 1 2 3
Access to information on government services over the internet 1 2 3
Reduction in the time required for permits or licenses 1 2 3
Faster response time for government services 1 2 3Reduction in financial costs to your company 1 2 3
NEW
Q5
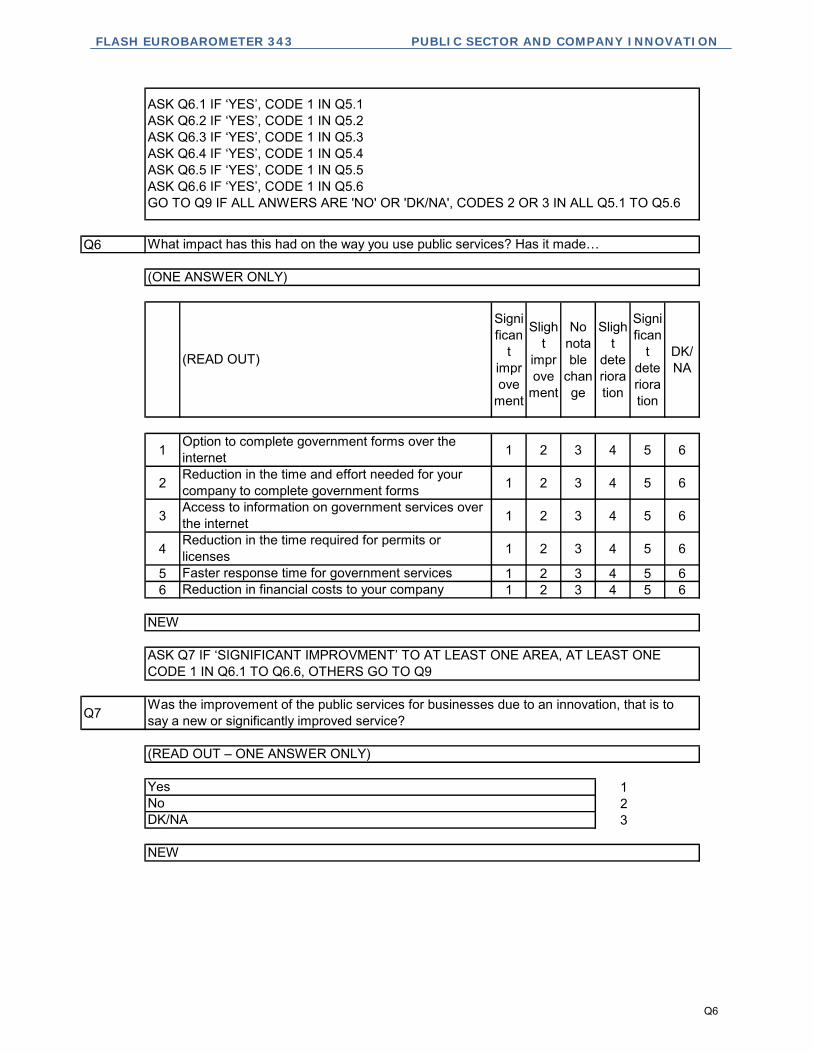
FLASH EUROBAROMETER 343 PUBLIC SECTOR AND COMPANY INNOVATION
Q6
Significan
t improve
ment
Slight
improve
ment
No notable
change
Slight
deterioration
Significan
t deterioration
DK/NA
1 1 2 3 4 5 6
2 1 2 3 4 5 6
3 1 2 3 4 5 6
4 1 2 3 4 5 6
5 1 2 3 4 5 66 1 2 3 4 5 6
Q7
123
ASK Q6.1 IF ‘YES’, CODE 1 IN Q5.1
ASK Q6.2 IF ‘YES’, CODE 1 IN Q5.2
ASK Q6.3 IF ‘YES’, CODE 1 IN Q5.3
ASK Q6.4 IF ‘YES’, CODE 1 IN Q5.4
ASK Q6.5 IF ‘YES’, CODE 1 IN Q5.5
ASK Q6.6 IF ‘YES’, CODE 1 IN Q5.6
GO TO Q9 IF ALL ANWERS ARE 'NO' OR 'DK/NA', CODES 2 OR 3 IN ALL Q5.1 TO Q5.6
What impact has this had on the way you use public services? Has it made…
(ONE ANSWER ONLY)
(READ OUT)
Option to complete government forms over the internetReduction in the time and effort needed for your company to complete government formsAccess to information on government services over the internetReduction in the time required for permits or licensesFaster response time for government servicesReduction in financial costs to your company
NEW
ASK Q7 IF ‘SIGNIFICANT IMPROVMENT’ TO AT LEAST ONE AREA, AT LEAST ONE
CODE 1 IN Q6.1 TO Q6.6, OTHERS GO TO Q9
Was the improvement of the public services for businesses due to an innovation, that is to say a new or significantly improved service?
(READ OUT – ONE ANSWER ONLY)
YesNoDK/NA
NEW
Q6

FLASH EUROBAROMETER 343 PUBLIC SECTOR AND COMPANY INNOVATION
Q8
Very positive
impact
Rather
positive
impact
No impa
ct
Rather
negative
impact
Very negative
impact
DK/NA
1 1 2 3 4 5 62 1 2 3 4 5 63 1 2 3 4 5 64 1 2 3 4 5 65 1 2 3 4 5 6
6 1 2 3 4 5 6
Q9
12345
ASK Q8 IF ‘YES’, CODE 1 IN Q7, OTHERS GO TO Q9
What impact have innovations in public services had on your business in terms of…?
(ONE ANSWER ONLY)
(READ OUT)
Time spent by your companyQuality of the information and advice providedQuality of the administrative proceduresCosts for your companyResponse time from public sector
Level of skills of your personnel thanks to the public education system and training programmes
NEW
ASK ALL
Based on the experience of your company, which level of government is the most innovative?
(READ OUT – ONE ANSWER ONLY)
Municipal / localRegional / sub-nationalNationalEuropean UnionDK/NA
NEW
Q7

FLASH EUROBAROMETER 343 PUBLIC SECTOR AND COMPANY INNOVATION
Q10
1
2
3
4
Q11
1
2
3
4
To what extent do you agree or disagree with the following statements:
(ONE ANSWER ONLY)
(READ OUT) Strongly agree
Tend to agree
Tend to disagree
Strongly disagree DK/NA
Overall, the public services are doing a good job in creating the right conditions for your company to innovate
1 2 3 4 5
The regulatory and fiscal system promotes the ability of your company to innovate
1 2 3 4 5
Your company can work closely with public research organisations on innovation projects
1 2 3 4 5
The public education and training system has equipped your staff with the knowledge and skills your company needs to innovate
1 2 3 4 5
NEW
To what extent do you agree or disagree with the following statements regarding the support your company receives from public services to be innovative?
(ONE ANSWER ONLY)
(READ OUT) Strongly agree
Tend to agree
Tend to disagree
Strongly disagree DK/NA
The provision of information and advice is of a high quality
1 2 3 4 5
The information and advice is easily available 1 2 3 4 5
The procedures to obtain financial support (e.g. grants, tax reliefs) are simple-to-use
1 2 3 4 5
Government’s programmes
are well targeted to support innovation
1 2 3 4 5
NEW
Q8

FLASH EUROBAROMETER 343 PUBLIC SECTOR AND COMPANY INNOVATION
Q12
12345
Q13
1,
2,
3,
4,5,
Q14
123
To what extent do you agree or not with the statement that the public services must increase their efforts to become more innovative in order to better match businesses' needs?
(READ OUT – ONE ANSWER ONLY)
Strongly agreeTend to agreeTend to disagreeStrongly disagreeDK/NA
NEW
Section 5 Impact of public sector innovation on your business: the role of public procurement
The term “public procurement” describes the purchases of goods, services and public works
by governments and public bodies. Since January 2009 has your company…
(READ OUT – MULTIPLE ANSWERS POSSIBLE )
Won at least one public procurement contract
Submitted at least one tender for a public procurement without success
Investigated opportunities to sell to governments or public bodies, but not submitted any tenderNone of the aboveDK/NA
NEW
ASK Q14 IF Q13 = 1,2 OR 3, OTHERS GO TO Q15
Since January 2009, did the public procurement activities of your company include the possibility to sell one of your innovations to the government?
(READ OUT – ONE ANSWER ONLY)
YesNoDK/NA
NEW
Q9
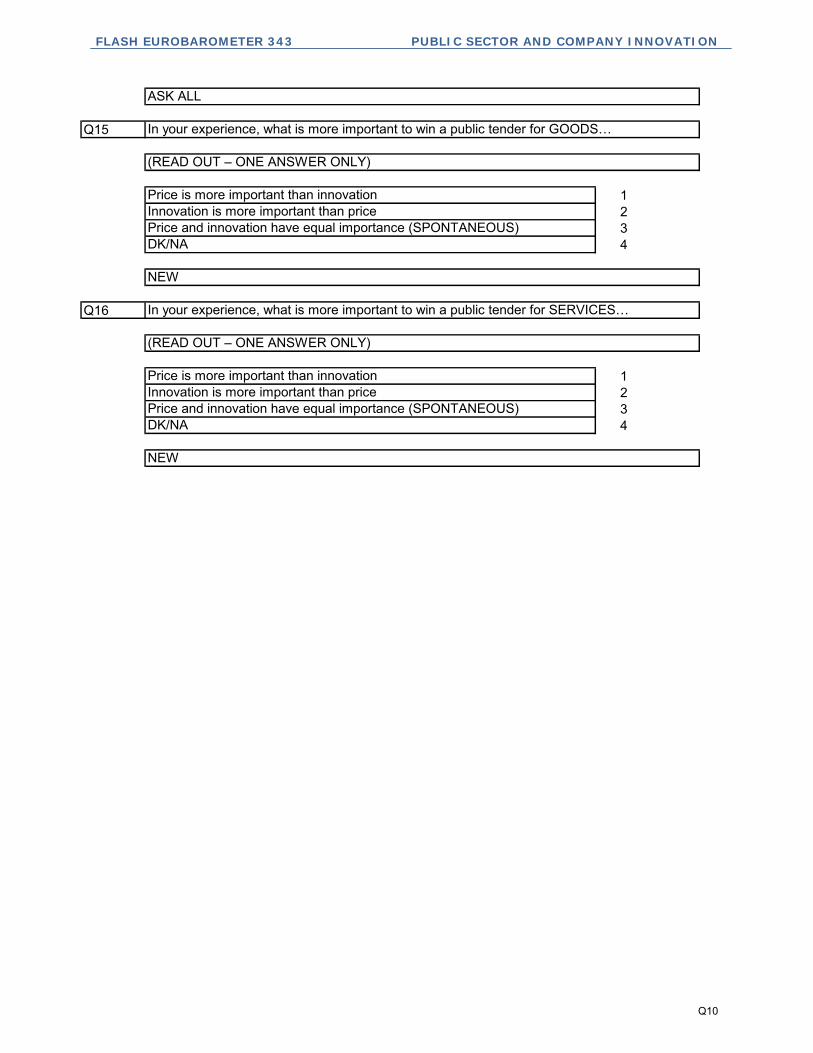
FLASH EUROBAROMETER 343 PUBLIC SECTOR AND COMPANY INNOVATION
Q15
1234
Q16
1234
ASK ALL
In your experience, what is more important to win a public tender for GOODS…
(READ OUT – ONE ANSWER ONLY)
Price is more important than innovationInnovation is more important than price
Innovation is more important than pricePrice and innovation have equal importance (SPONTANEOUS)DK/NA
NEW
Price and innovation have equal importance (SPONTANEOUS)DK/NA
NEW
In your experience, what is more important to win a public tender for SERVICES…
(READ OUT – ONE ANSWER ONLY)
Price is more important than innovation
Q10

TABLES
FLASH EUROBAROMETER 343 “Public sector and company innovation”
%
EU 27
BE
BG
CZ
DK
DE
EE
IE
EL
ES
FR
IT
CY
LV
LT
LU
HU
MT
NL
AT
PL
PT
RO
SI
SK
FI
SE
UK
HR
TR
MK
IS
NO
CH
29 25
21 13
0
1 15 48 36 0
12 34
11 20
0
15 33 25 27 0
20 46
25 23
0
21 51 21 7 0
18 51
12 13
0
10 28 24 38 0
15 37
23 15
0
15 29 28 28 0
18 57
19 19
0
21 37 17 25 0
14 48
27 26
0
13 53 14 20 0
15 47
19 20
0
12 46 26 16 0
11 36
21 22
0
12 38 18 32 0
14 47
9 16
0
5 49 27 19 0
15 42
30 17
0
15 45 25 15 0
13 62
20 16
0
16 43 18 23 0
10 43
25 25
0
10 41 27 22 0
13 51
17 28
0
26 24 27 23 0
15 35
14 13
0
16 38 26 20 0
12 43
23 23
0
16 41 16 27 0
0
11 40 26 23 0
Produzierende Industrie (NACE
Kategorie C)
Flash EB343
16 57
Industrie(NACE Kategorie
B/D/E/F)
Flash EB343
Industrie (NACE catégories
B/D/E/F)
Industry (NACE categories
B/D/E/F)
13 41
Commerce (NACE catégorie G)
Retail (NACE category G)
Handel(NACE KategorieG)
Flash EB343
Industrie manufacturière
(NACE catégorie C)
Manufacturing (NACE category C)
Service (NACE catégories
I/J/K/H)
Services (NACE categories
I/J/K/H)
Dienstleistungen(NACE Kategorie
I/J/K/H)
Flash EB343
NSP/SR
DK/NA
WN/KA
Flash EB343
NACEb NACE CODE
NACEb NACE CODE
T1

FLASH EUROBAROMETER 343 “Public sector and company innovation”
%
EU 27
BE
BG
CZ
DK
DE
EE
IE
EL
ES
FR
IT
CY
LV
LT
LU
HU
MT
NL
AT
PL
PT
RO
SI
SK
FI
SE
UK
HR
TR
MK
IS
NO
CH
6 1
3 0
0
53 37 7 3 0
71 22
2 1
0
82 14 3 1 0
83 14
4 0
1
76 15 6 2 1
79 17
8 1
0
80 16 2 2 0
86 10
2 1
0
83 14 2 1 0
66 25
1 1
0
90 7 2 1 0
79 18
8 2
0
87 9 3 1 0
92 6
3 1
1
72 22 4 2 0
66 23
3 1
2
78 6 4 1 11
80 14
7 0
2
67 26 6 1 0
74 20
2 1
0
78 13 2 1 6
75 18
5 1
0
86 10 2 1 1
88 9
3 2
1
84 11 2 1 2
83 10
7 2
5
80 16 3 1 0
70 20
7 2
1
72 20 4 2 2
71 19
3 1
2
68 22 7 2 1
1
81 13 3 2 1
zwischen 1 und 9 Beschäftigte
Flash EB343
66 23
250 Beschäftigte oder mehr
Flash EB343
250 employés et plus
250 employees or more
82 13
10 à 49 employés
10 to 49 employees
zwischen 10 und 49 Beschäftigte
Flash EB343
1 à 9 employés
1 to 9 employees
50 à 249 employés
50 to 249 employees
zwischen 50 und 249 Beschäftigte
Flash EB343
NSP/SR
DK/NA
WN/KA
Flash EB343
D1A Combien d’employés (équivalent temps-plein) compte actuellement votre entreprise?
D1A How many employees (full-time equivalent) does your company currently have?
D1A Wie viele Beschäftigte hat Ihr Unternehmen derzeit (ausgedrückt in Vollzeit-Arbeitskräften / FTE)?
T2
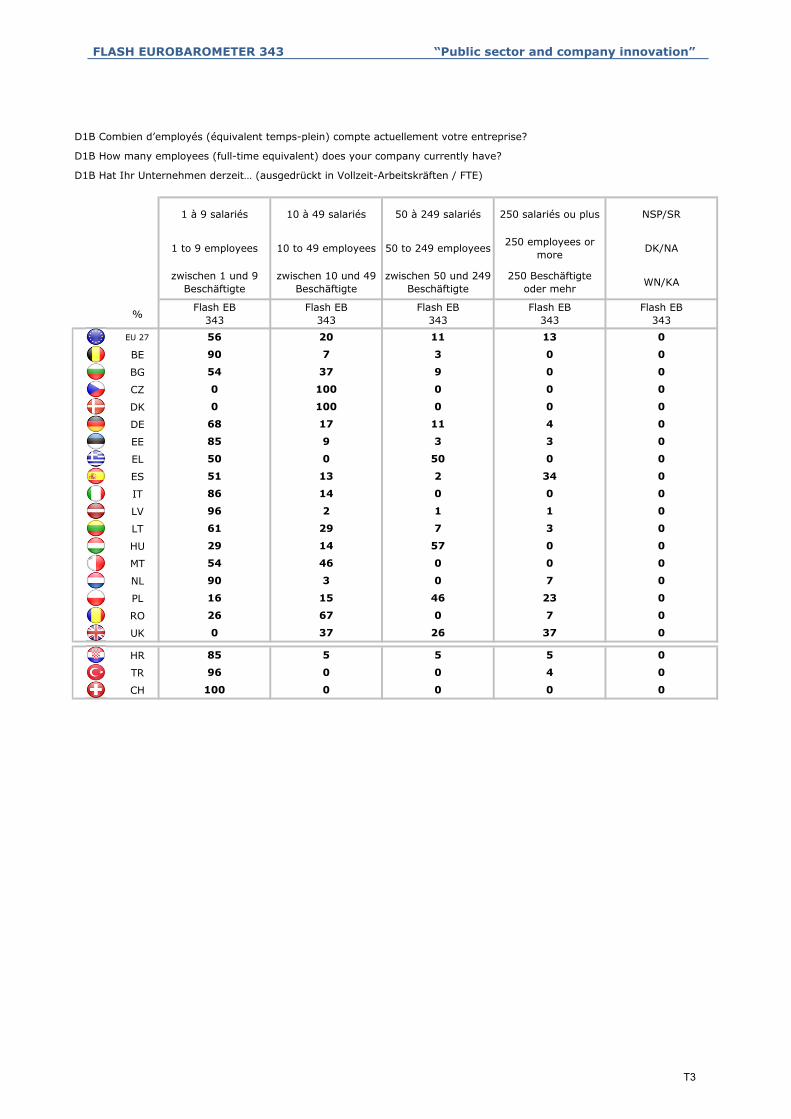
FLASH EUROBAROMETER 343 “Public sector and company innovation”
%
EU 27
BE
BG
CZ
DK
DE
EE
EL
ES
IT
LV
LT
HU
MT
NL
PL
RO
UK
HR
TR
CH 0100 0 0 0
0
96 0 0 4 0
85 5 5 5
0
0 37 26 37 0
26 67 0 7
0
16 15 46 23 0
90 3 0 7
0
54 46 0 0 0
29 14 57 0
0
61 29 7 3 0
96 2 1 1
0
86 14 0 0 0
51 13 2 34
0
50 0 50 0 0
85 9 3 3
0
68 17 11 4 0
0 100 0 0
0
0 100 0 0 0
54 37 9 0
0
90 7 3 0 0
56 20 11 13
NSP/SR
DK/NA
WN/KA
Flash EB343
250 salariés ou plus
250 employees or more
250 Beschäftigte oder mehr
Flash EB343
50 à 249 salariés
50 to 249 employees
zwischen 50 und 249 Beschäftigte
Flash EB343
10 à 49 salariés
10 to 49 employees
zwischen 10 und 49 Beschäftigte
Flash EB343
1 à 9 salariés
1 to 9 employees
zwischen 1 und 9 Beschäftigte
Flash EB343
D1B Combien d’employés (équivalent temps-plein) compte actuellement votre entreprise?
D1B How many employees (full-time equivalent) does your company currently have?
D1B Hat Ihr Unternehmen derzeit… (ausgedrückt in Vollzeit-Arbeitskräften / FTE)
T3

FLASH EUROBAROMETER 343 “Public sector and company innovation”
%
EU 27
BE
BG
CZ
DK
DE
EE
IE
EL
ES
FR
IT
CY
LV
LT
LU
HU
MT
NL
AT
PL
PT
RO
SI
SK
FI
SE
UK
HR
TR
MK
IS
NO
CH
6 1
3 0
0
53 37 7 3 0
71 22
2 1
0
82 14 3 1 0
83 14
4 0
0
77 15 6 2 0
80 17
8 1
0
80 16 2 2 0
86 10
2 1
0
83 14 2 1 0
66 25
2 0
0
90 7 2 1 0
79 18
8 2
0
87 9 3 1 0
92 6
4 2
0
72 22 4 2 0
67 23
3 1
0
83 11 5 1 0
80 14
7 0
0
67 26 6 1 0
76 20
2 1
0
84 13 2 1 0
75 18
6 1
0
87 10 2 1 0
88 9
3 2
0
85 12 2 1 0
83 10
7 2
0
80 16 3 1 0
74 21
7 2
0
74 20 4 2 0
71 20
3 1
0
68 23 7 2 0
0
82 13 3 2 0
zwischen 1 und 9 Beschäftigte
Flash EB343
67 24
250 Beschäftigte oder mehr
Flash EB343
250 salariés ou plus
250 employees or more
83 13
10 à 49 salariés
10 to 49 employees
zwischen 10 und 49 Beschäftigte
Flash EB343
1 à 9 salariés
1 to 9 employees
50 à 249 salariés
50 to 249 employees
zwischen 50 und 249 Beschäftigte
Flash EB343
NSP/SR
DK/NA
WN/KA
Flash EB343
D1T Combien d’employés (équivalent temps-plein) compte actuellement votre entreprise?
D1T How many employees (full-time equivalent) does your company currently have?
D1T Hat Ihr Unternehmen derzeit… (ausgedrückt in Vollzeit-Arbeitskräften / FTE)
T4
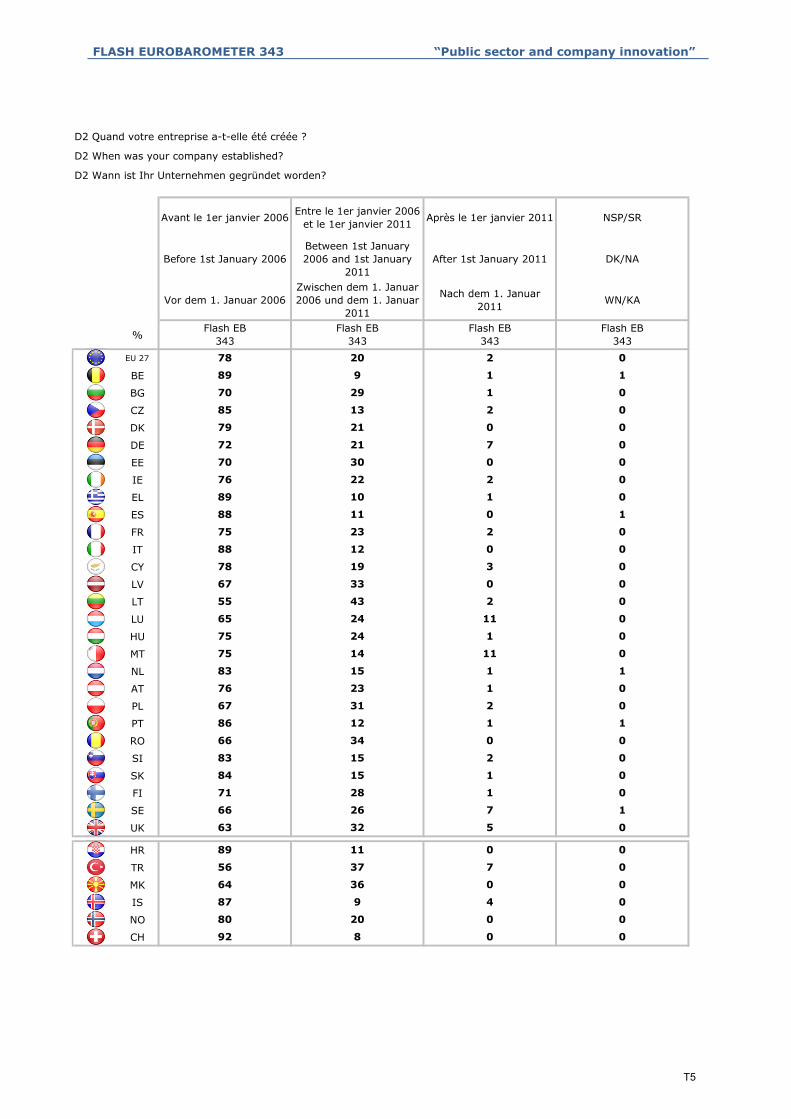
FLASH EUROBAROMETER 343 “Public sector and company innovation”
%
EU 27
BE
BG
CZ
DK
DE
EE
IE
EL
ES
FR
IT
CY
LV
LT
LU
HU
MT
NL
AT
PL
PT
RO
SI
SK
FI
SE
UK
HR
TR
MK
IS
NO
CH 92 8 0 0
80 20 0 0
87 9 4 0
64 36 0 0
56 37 7 0
89 11 0 0
63 32 5 0
66 26 7 1
71 28 1 0
84 15 1 0
83 15 2 0
66 34 0 0
86 12 1 1
67 31 2 0
76 23 1 0
83 15 1 1
75 14 11 0
75 24 1 0
65 24 11 0
55 43 2 0
67 33 0 0
78 19 3 0
88 12 0 0
75 23 2 0
88 11 0 1
89 10 1 0
76 22 2 0
70 30 0 0
72 21 7 0
79 21 0 0
85 13 2 0
70 29 1 0
89 9 1 1
78 20 2 0
NSP/SR
DK/NA
WN/KA
Flash EB343
Après le 1er janvier 2011
After 1st January 2011
Nach dem 1. Januar 2011
Flash EB343
Entre le 1er janvier 2006 et le 1er janvier 2011
Between 1st January 2006 and 1st January
2011Zwischen dem 1. Januar 2006 und dem 1. Januar
2011Flash EB
343
Avant le 1er janvier 2006
Before 1st January 2006
Vor dem 1. Januar 2006
Flash EB343
D2 Quand votre entreprise a-t-elle été créée ?
D2 When was your company established?
D2 Wann ist Ihr Unternehmen gegründet worden?
T5

FLASH EUROBAROMETER 343 “Public sector and company innovation”
%
EU 27
BE
BG
CZ
DK
DE
EE
IE
EL
ES
FR
IT
CY
LV
LT
LU
HU
MT
NL
AT
PL
PT
RO
SI
SK
FI
SE
UK
HR
TR
MK
IS
NO
CH 11 88 1
11 88 1
11 89 0
5 95 0
1 97 2
8 92 0
4 96 0
11 88 1
16 84 0
6 94 0
5 95 0
7 92 1
1 98 1
8 92 0
2 97 1
3 96 1
11 89 0
6 92 2
2 98 0
5 95 0
9 87 4
7 92 1
1 99 0
4 95 1
10 90 0
2 97 1
5 95 0
7 93 0
4 95 1
6 93 1
18 82 0
0
6 94 0
4 96 0
7 93
Oui
Yes
Ja
Flash EB343
NSP/SR
DK/NA
WN/KA
Flash EB343
Non
No
Nein
Flash EB343
D3 Votre entreprise a-t-elle fait l’objet d’un rachat ou d’une fusion avec une autre entreprise depuis le 1er janvier 2006 ?
D3 Has your company been taken over or merged with another company since the 1st of January 2006?
D3 Wurde Ihr Unternehmen seit dem 1. Januar 2006 von einem anderen Unternehmen übernommen oder gab es einen Zusammenschluss mit einem anderen Unternehmen?
T6

FLASH EUROBAROMETER 343 “Public sector and company innovation”
%
EU 27
BE
BG
CZ
DK
DE
EE
IE
EL
ES
FR
IT
CY
LV
LT
LU
HU
MT
NL
AT
PL
PT
RO
SI
SK
FI
SE
UK
HR
TR
MK
IS
NO
CH
90 0
4 2 3 6 79 6
0 2 2 6
88 5
0 2 1 2 92 3
0 1 3 3
84 2
2 3 5 7 80 3
0 5 0 9
86 3
1 2 0 2 89 6
2 1 5 3
78 8
0 3 1 4 90 2
0 3 3 8
92 3
2 6 11 5 70 6
1 1 2 1
89 2
3 1 1 2 85 8
1 3 3 2
81 4
0 10 7 6 72 5
1 4 4 6
87 2
1 1 0 0 90 8
2 4 3 2
77 11
3 9 8 4 65 11
5 5 2 0
71 21
3 6 3 1 85 2
1 3 4 0
92 4
1 4 4 3 83 5
1 1 1 1
82 2
1 2 3 2 88 4
0 8 5 3
75 4
0 4 2 1 91 2
2 9 4 6
73 4
0 3 4 5 79 9
3 7 9 4
87 0
2 5 3 2 86 2
6 2 1 4
86 5
1 4 3 2 87 3
1 3 3 2
76 - 100 %
76 - 100 %
Flash EB343
Flash EB343
0
0
0
DK
WN
Flash EB343
26 - 50 %
26 - 50 %
Flash EB343
51 - 75 %
51 - 75 %
26 - 50 % NSP51 - 75 %
In your own country
Flash EB343
1 - 25 %
1 - 25 %
1 - 25 %
Flash EB343
D4.1 Wie hoch war in etwa der Anteil jedes der folgenden Märkte am Umsatz Ihres Unternehmens im Jahr 2011 in Prozent?
In Ihrem eigenen Land
76 - 100 %
D4.1 Environ quel pourcentage du chiffre d’affaires de votre entreprise en 2011 a été vendu dans chacun des marchés suivants ? Dans votre propre état
D4.1 Approximately what percentage of your company's turnover in 2011 was sold in each of the following markets?
T7

FLASH EUROBAROMETER 343 “Public sector and company innovation”
%
EU 27
BE
BG
CZ
DK
DE
EE
IE
EL
ES
FR
IT
CY
LV
LT
LU
HU
MT
NL
AT
PL
PT
RO
SI
SK
FI
SE
UK
HR
TR
MK
IS
NO
CH
1 0
67 16 6 1 1 9
77 15 7 0
0 5
88 5 3 0 0 4
86 4 5 0
3 4
77 10 3 3 3 4
80 7 5 1
2 3
83 10 0 1 0 6
70 20 4 1
3 8
77 17 2 1 1 2
65 18 5 1
1 3
51 25 11 4 3 6
92 2 2 0
3 2
81 7 2 1 1 8
78 14 3 0
1 4
53 23 10 3 6 5
60 27 5 3
3 2
84 6 0 1 1 8
69 21 2 3
3 11
54 20 6 11 1 8
72 9 4 1
1 22
72 13 6 3 4 2
68 2 4 3
0 5
78 11 3 1 0 7
83 10 2 0
2 3
83 9 2 1 1 4
65 21 4 5
7 4
86 7 3 1 1 2
64 18 4 3
3 4
63 22 4 1 0 10
56 22 8 7
7 1
69 20 5 1 3 2
83 6 3 0
1 5
69 20 5 2 1 3
77 13 3 1
76 - 100 %
76 - 100 %
Flash EB343
Flash EB343
0
0
0
DK
WN
Flash EB343
26 - 50 %
26 - 50 %
Flash EB343
51 - 75 %
51 - 75 %
26 - 50 % NSP51 - 75 %
In others countries of EU
Flash EB343
1 - 25 %
1 - 25 %
1 - 25 %
Flash EB343
D4.2 Wie hoch war in etwa der Anteil jedes der folgenden Märkte am Umsatz Ihres Unternehmens im Jahr 2011 in Prozent?
In anderen EU-Ländern
76 - 100 %
D4.2 Environ quel pourcentage du chiffre d’affaires de votre entreprise en 2011 a été vendu dans chacun des marchés suivants ? Dans d'autres états membres de l'UE
D4.2 Approximately what percentage of your company's turnover in 2011 was sold in each of the following markets?
T8

FLASH EUROBAROMETER 343 “Public sector and company innovation”
%
EU 27
BE
BG
CZ
DK
DE
EE
IE
EL
ES
FR
IT
CY
LV
LT
LU
HU
MT
NL
AT
PL
PT
RO
SI
SK
FI
SE
UK
HR
TR
MK
IS
NO
CH
0 0
78 7 2 3 0 10
95 3 0 2
1 4
82 11 3 0 0 4
93 1 1 0
0 4
80 10 4 0 1 5
76 19 1 0
0 4
80 9 3 2 0 6
89 3 2 2
0 8
86 10 0 0 2 2
80 9 3 0
0 3
62 28 1 0 3 6
95 1 0 1
1 2
80 10 0 0 2 8
91 3 2 1
2 4
81 11 1 1 1 5
76 15 2 1
1 2
81 11 0 0 2 6
93 3 0 1
3 11
83 1 0 1 4 11
79 4 3 0
0 22
90 6 3 0 0 1
75 3 0 0
0 4
80 7 3 1 2 7
92 3 1 0
1 3
86 6 1 1 2 4
73 19 3 1
1 4
88 7 2 0 1 2
85 6 3 1
2 4
76 10 2 1 2 9
77 13 4 0
2 1
90 5 1 0 2 2
90 6 1 0
1 5
86 7 2 0 2 3
84 7 2 1
76 - 100 %
76 - 100 %
Flash EB343
Flash EB343
0
0
0
DK
WN
Flash EB343
26 - 50 %
26 - 50 %
Flash EB343
51 - 75 %
51 - 75 %
26 - 50 % NSP51 - 75 %
Others
Flash EB343
1 - 25 %
1 - 25 %
1 - 25 %
Flash EB343
D4.3 Wie hoch war in etwa der Anteil jedes der folgenden Märkte am Umsatz Ihres Unternehmens im Jahr 2011 in Prozent?
Andere
76 - 100 %
D4.3 Environ quel pourcentage du chiffre d’affaires de votre entreprise en 2011 a été vendu dans chacun des marchés suivants ? Autres
D4.3 Approximately what percentage of your company's turnover in 2011 was sold in each of the following markets?
T9

FLASH EUROBAROMETER 343 “Public sector and company innovation”
%
EU 27
BE
BG
CZ
DK
DE
EE
IE
EL
ES
FR
IT
CY
LV
LT
LU
HU
MT
NL
AT
PL
PT
RO
SI
SK
FI
SE
UK
HR
TR
MK
IS
NO
CH 3 5 36 139 27 46 10
3 2 48 2022 26 30 17
9 8 43 2223 20 27 13
20 1 25 446 19 30 24
8 6 49 2424 25 21 16
29 4 17 548 9 25 25
9 10 32 2714 18 31 18
3 10 44 1420 24 32 11
6 3 52 2019 33 25 14
18 7 27 417 20 25 23
15 6 32 3214 18 30 17
19 3 30 4510 20 22 26
21 3 20 444 16 33 23
11 5 33 2914 19 33 18
6 7 38 1813 25 37 12
9 4 42 2613 29 28 17
4 13 29 321 28 26 28
17 5 30 3812 18 27 21
4 8 34 216 28 37 17
17 8 31 319 22 30 14
18 4 38 3111 27 27 13
17 15 20 452 18 20 28
10 5 27 377 20 31 27
4 4 35 266 29 35 22
28 6 14 602 12 20 32
37 3 19 646 13 14 27
17 4 18 585 13 20 41
11 4 34 2413 21 38 13
4 10 46 1417 29 30 10
5 4 49 2121 28 26 16
11 4 28 326 22 36 21
35 7 20 559 11 18 20
3 10 43 134 39 34 10
13 6 30 359 21 29 22
Total 'Diminué'
Total 'Decrease'
Total 'Rückgang'
Flash EB343
Total 'Augmenté'
Total 'Increase'
Total 'Anstieg'
Flash EB343
NSP/SR
DK/NA
WN/KA
Flash EB343
Baissé de plus de 25%
Decrease by over 25%
um mehr als 25%
gesunken
Flash EB343
Baissé de 5 à 25%
Decrease by 5–25%
um 5-25% gesunken
Flash EB343
Est resté approximative-ment le même
Remain approximately
the same
annähernd gleich geblieben
Flash EB343
Augmenté de 5 à 25%
Increase by 5–25%
um 5-25% gestiegen
Flash EB343
Augmenté de plus de
25%
Increase by more than
25%
um mehr als 25%
gestiegen
Flash EB343
D5 Indépendamment des changements survenus à la suite d’une fusion/ acquisition, par rapport à 2009, le chiffre d’affaire de votre entreprise en 2011 a-t-il… ?
D5 Excluding changes due to mergers or acquisitions, compared to 2009, did your company’s turnover in 2011…?
D5 Abgesehen von Veränderungen, die sich auf Firmenzusammenschlüsse oder Firmenübernahmen zurückführen lassen, ist der Umsatz Ihres Unternehmens im Jahr 2011 im Vergleich zu 2009...?
T10

FLASH EUROBAROMETER 343 “Public sector and company innovation”
%
EU 27
BE
BG
CZ
DK
DE
EE
IE
EL
ES
FR
IT
CY
LV
LT
LU
HU
MT
NL
AT
PL
PT
RO
SI
SK
FI
SE
UK
HR
TR
MK
IS
NO
CH
8 4
53 23 6 3 4 11
55 20 10 3
10 1
62 18 11 1 6 2
52 28 7 2
11 1
28 28 17 9 10 8
28 44 15 1
9 3
57 18 7 2 11 5
56 21 8 3
10 1
66 17 10 1 6 0
42 34 11 2
19 1
52 23 7 7 8 3
33 24 19 4
20 5
60 26 6 2 3 3
47 14 13 1
2 1
72 12 11 0 5 0
63 26 7 1
12 1
85 11 0 0 3 1
53 24 9 1
15 3
63 23 7 1 4 2
30 27 22 3
7 6
23 31 22 6 17 1
38 33 15 1
7 2
64 26 3 1 2 4
63 16 11 1
14 1
48 25 15 3 8 1
33 31 17 4
16 15
46 23 13 7 8 3
27 25 15 2
14 2
57 23 9 3 5 3
43 22 16 3
19 6
48 31 12 3 4 2
22 26 22 5
8 3
74 20 3 0 2 1
55 22 10 2
NSP
DK
WN
Flash EB343
76 - 100 %
76 - 100 %
1-25 %
1-25 %
1-25 %
Flash EB343
76 - 100 %
Flash EB343
51 - 75 %
51 - 75 %
51 - 75 %
Flash EB343
0
0
0
Flash EB343
26 - 50 %
26 - 50 %
26 - 50 %
Flash EB343
D6 Environ quel pourcentage de vos employés ont un diplôme universitaire en 2011 ?
D6 Approximately what percentage of your employees has a university degree in 2011?
D6 Wie hoch war im Jahr 2011 ungefähr der Prozentsatz von Angestellten mit Universitätsabschluss in Ihrem Unternehmen?
T11

FLASH EUROBAROMETER 343 “Public sector and company innovation”
%
EU 27
BE
BG
CZ
DK
DE
EE
IE
EL
ES
FR
IT
CY
LV
LT
LU
HU
MT
NL
AT
PL
PT
RO
SI
SK
FI
SE
UK
HR
TR
MK
IS
NO
CH 49 50 1
31 68 1
39 61 0
43 56 1
21 79 0
32 66 2
49 51 0
35 65 0
27 70 3
26 74 0
51 48 1
38 60 2
13 86 1
52 47 1
36 63 1
26 74 0
44 56 0
23 77 0
22 78 0
35 65 0
18 77 5
37 62 1
25 70 5
45 54 1
26 74 0
41 58 1
24 76 0
42 57 1
40 58 2
51 47 2
49 49 2
1
29 70 1
34 66 0
35 64
Oui
Yes
Ja
Flash EB343
NSP/SR
DK/NA
WN/KA
Flash EB343
Non
No
Nein
Flash EB343
Q1 Votre entreprise a-t-elle introduit une innovation depuis janvier 2009 ?
Q1 Has your company introduced any innovations since January 2009?
Q1 Hat Ihr Unternehmen seit Januar 2009 Innovationen eingeführt?
T12
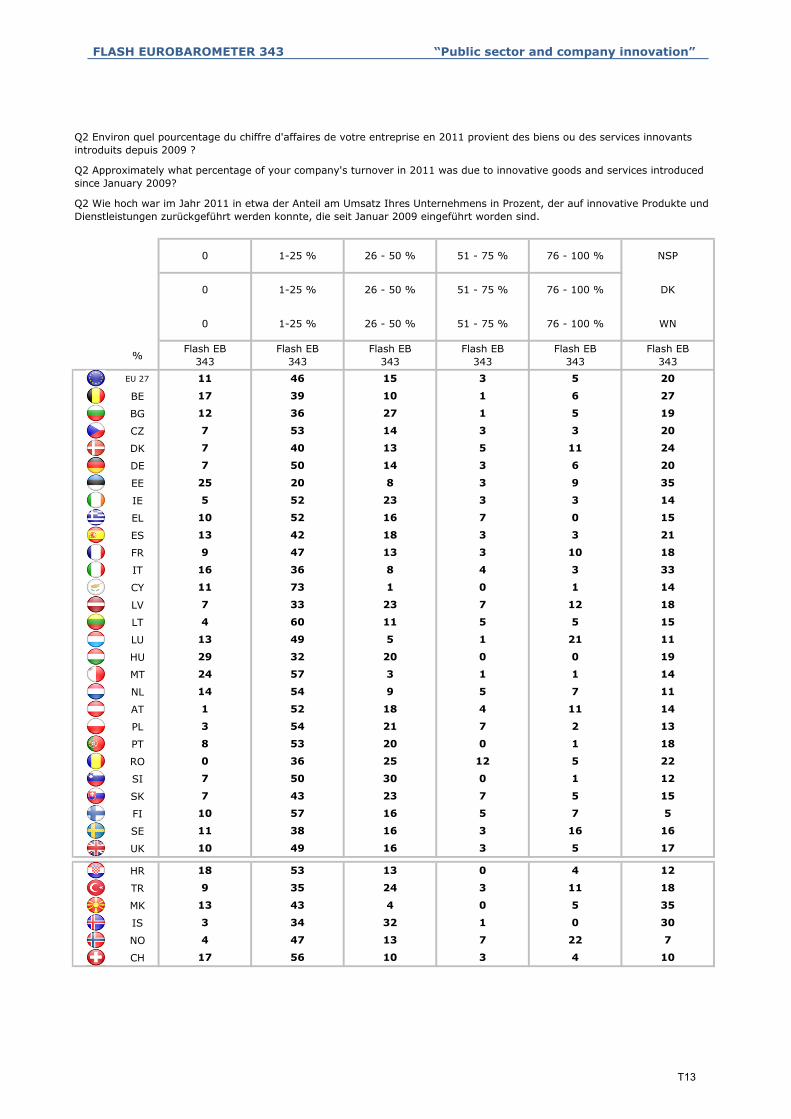
FLASH EUROBAROMETER 343 “Public sector and company innovation”
%
EU 27
BE
BG
CZ
DK
DE
EE
IE
EL
ES
FR
IT
CY
LV
LT
LU
HU
MT
NL
AT
PL
PT
RO
SI
SK
FI
SE
UK
HR
TR
MK
IS
NO
CH
22 7
17 56 10 3 4 10
4 47 13 7
5 35
3 34 32 1 0 30
13 43 4 0
4 12
9 35 24 3 11 18
18 53 13 0
16 16
10 49 16 3 5 17
11 38 16 3
5 15
10 57 16 5 7 5
7 43 23 7
5 22
7 50 30 0 1 12
0 36 25 12
2 13
8 53 20 0 1 18
3 54 21 7
7 11
1 52 18 4 11 14
14 54 9 5
0 19
24 57 3 1 1 14
29 32 20 0
5 15
13 49 5 1 21 11
4 60 11 5
1 14
7 33 23 7 12 18
11 73 1 0
10 18
16 36 8 4 3 33
9 47 13 3
0 15
13 42 18 3 3 21
10 52 16 7
9 35
5 52 23 3 3 14
25 20 8 3
11 24
7 50 14 3 6 20
7 40 13 5
5 19
7 53 14 3 3 20
12 36 27 1
5 20
17 39 10 1 6 27
11 46 15 3
NSP
DK
WN
Flash EB343
76 - 100 %
76 - 100 %
1-25 %
1-25 %
1-25 %
Flash EB343
76 - 100 %
Flash EB343
51 - 75 %
51 - 75 %
51 - 75 %
Flash EB343
0
0
0
Flash EB343
26 - 50 %
26 - 50 %
26 - 50 %
Flash EB343
Q2 Environ quel pourcentage du chiffre d'affaires de votre entreprise en 2011 provient des biens ou des services innovants introduits depuis 2009 ?
Q2 Approximately what percentage of your company's turnover in 2011 was due to innovative goods and services introduced since January 2009?
Q2 Wie hoch war im Jahr 2011 in etwa der Anteil am Umsatz Ihres Unternehmens in Prozent, der auf innovative Produkte und Dienstleistungen zurückgeführt werden konnte, die seit Januar 2009 eingeführt worden sind.
T13
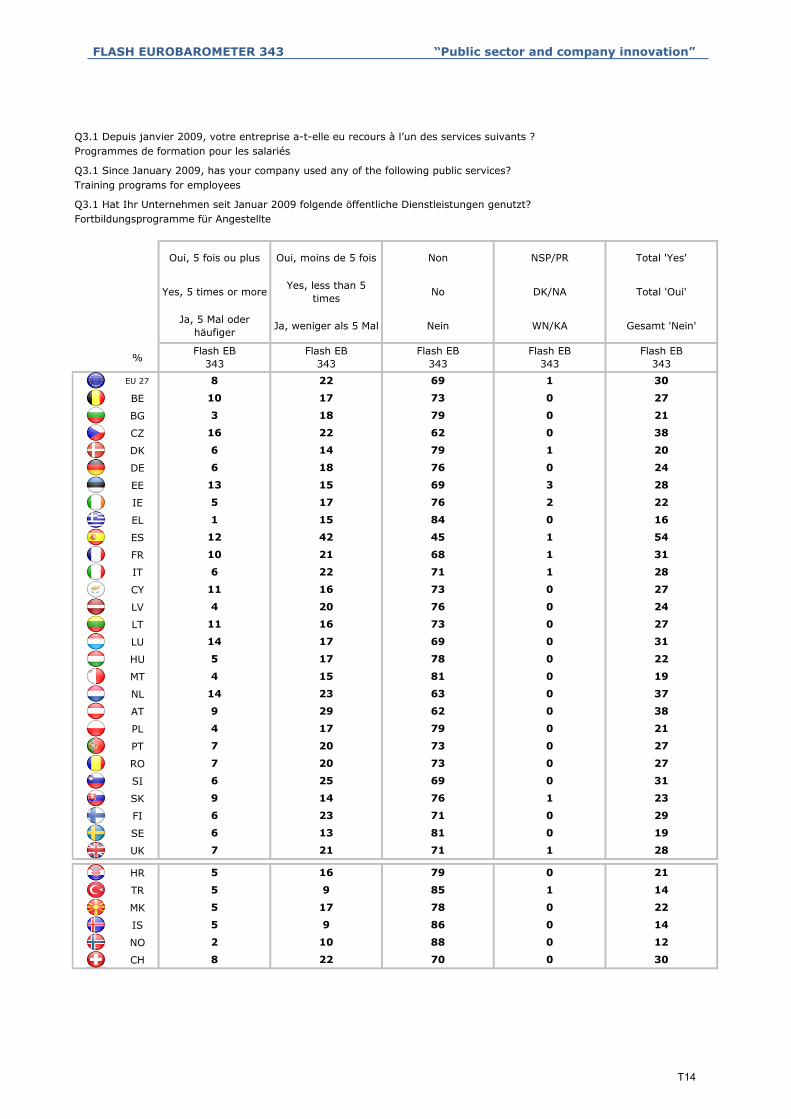
FLASH EUROBAROMETER 343 “Public sector and company innovation”
%
EU 27
BE
BG
CZ
DK
DE
EE
IE
EL
ES
FR
IT
CY
LV
LT
LU
HU
MT
NL
AT
PL
PT
RO
SI
SK
FI
SE
UK
HR
TR
MK
IS
NO
CH
0
0
308 22 70 0
14
2 10 88
0
12
5 9 86 0
14
5 17 78
0
22
5 9 85 1
28
5 16 79
1
21
7 21 71 1
29
6 13 81
0
19
6 23 71 0
31
9 14 76
0
23
6 25 69 0
27
7 20 73
0
27
7 20 73 0
38
4 17 79
0
21
9 29 62 0
19
14 23 63
0
37
4 15 81 0
31
5 17 78
0
22
14 17 69 0
24
11 16 73
1
27
4 20 76 0
28
11 16 73
0
27
6 22 71 1
54
10 21 68
3
31
12 42 45 1
22
1 15 84
1
16
5 17 76 2
24
13 15 69
0
28
6 18 76 0
38
6 14 20
16 22 62 0
27
3
10 17 73 0
79
22 1 30
No
Nein
Flash EB343
Yes, 5 times or more
18
Ja, 5 Mal oder häufiger
Flash EB343
DK/NA
WN/KA
Oui, moins de 5 fois
Yes, less than 5 times
Ja, weniger als 5 Mal
698
NSP/PR
Flash EB343
Q3.1 Depuis janvier 2009, votre entreprise a-t-elle eu recours à l’un des services suivants ? Programmes de formation pour les salariés
Q3.1 Since January 2009, has your company used any of the following public services?
21
Total 'Oui'
Gesamt 'Nein'
Flash EB343
79
Q3.1 Hat Ihr Unternehmen seit Januar 2009 folgende öffentliche Dienstleistungen genutzt? Fortbildungsprogramme für Angestellte
Training programs for employees
Flash EB343
Oui, 5 fois ou plus Non Total 'Yes'
T14

FLASH EUROBAROMETER 343 “Public sector and company innovation”
%
EU 27
BE
BG
CZ
DK
DE
EE
IE
EL
ES
FR
IT
CY
LV
LT
LU
HU
MT
NL
AT
PL
PT
RO
SI
SK
FI
SE
UK
HR
TR
MK
IS
NO
CH
1
0
207 13 80 0
6
2 8 89
0
10
2 4 94 0
3
2 3 95
0
5
1 2 97 0
3
0 2 98
0
2
1 2 94 3
5
0 4 96
0
4
1 4 95 0
14
0 2 98
0
2
2 12 86 0
11
0 3 97
0
3
4 7 88 1
9
0 2 98
1
2
3 6 90 1
7
1 5 94
1
6
2 5 93 0
17
1 6 92
0
7
9 8 82 1
2
3 0 96
1
3
0 2 98 0
9
3 8 89
1
11
1 8 86 5
14
0 3 96
2
3
2 12 85 1
6
0 9 90
0
9
0 6 92 2
7
0 1 97
1
1
2 5 92 1
6
1 4 5
3 3 93 1
3
0
0 3 97 0
95
5 2 6
No
Nein
Flash EB343
Yes, 5 times or more
3
Ja, 5 Mal oder häufiger
Flash EB343
DK/NA
WN/KA
Oui, moins de 5 fois
Yes, less than 5 times
Ja, weniger als 5 Mal
921
NSP/PR
Flash EB343
Q3.2 Depuis janvier 2009, votre entreprise a-t-elle eu recours à l’un des services suivants ? Obtention de permis de travail pour les salariés étrangers
Q3.2 Since January 2009, has your company used any of the following public services?
3
Total 'Oui'
Gesamt 'Nein'
Flash EB343
96
Q3.2 Hat Ihr Unternehmen seit Januar 2009 folgende öffentliche Dienstleistungen genutzt? Einholen einer Arbeitserlaubnis für ausländische Arbeitnehmer
Obtaining work permits for foreign workers
Flash EB343
Oui, 5 fois ou plus Non Total 'Yes'
T15

FLASH EUROBAROMETER 343 “Public sector and company innovation”
%
EU 27
BE
BG
CZ
DK
DE
EE
IE
EL
ES
FR
IT
CY
LV
LT
LU
HU
MT
NL
AT
PL
PT
RO
SI
SK
FI
SE
UK
HR
TR
MK
IS
NO
CH
1
0
253 22 74 1
23
6 24 69
3
30
3 20 76 1
34
8 22 70
4
30
17 17 65 1
25
17 27 53
1
44
7 18 74 1
42
3 23 70
3
26
12 30 58 0
44
15 31 53
3
46
9 35 54 2
41
8 14 75
0
22
11 30 55 4
31
9 32 56
5
41
6 25 68 1
26
10 28 62
6
38
2 24 74 0
29
13 16 66
0
29
9 20 67 4
34
15 25 54
1
40
6 28 65 1
41
4 25 71
1
29
12 29 58 1
42
4 14 81
4
18
11 31 55 3
24
7 10 82
3
17
6 18 75 1
30
18 22 56
6
40
6 24 70 0
46
7 18 25
10 36 54 0
31
8
7 24 68 1
72
24 2 32
No
Nein
Flash EB343
Yes, 5 times or more
27
Ja, 5 Mal oder häufiger
Flash EB343
DK/NA
WN/KA
Oui, moins de 5 fois
Yes, less than 5 times
Ja, weniger als 5 Mal
668
NSP/PR
Flash EB343
Q3.3 Depuis janvier 2009, votre entreprise a-t-elle eu recours à l’un des services suivants ? Questions de santé et de sécurité
Q3.3 Since January 2009, has your company used any of the following public services?
35
Total 'Oui'
Gesamt 'Nein'
Flash EB343
59
Q3.3 Hat Ihr Unternehmen seit Januar 2009 folgende öffentliche Dienstleistungen genutzt? Dienstleistungen im Zusammenhang mit Gesundheits- und Arbeitsschutzangelegenheiten
Health and safety issues
Flash EB343
Oui, 5 fois ou plus Non Total 'Yes'
T16

FLASH EUROBAROMETER 343 “Public sector and company innovation”
%
EU 27
BE
BG
CZ
DK
DE
EE
IE
EL
ES
FR
IT
CY
LV
LT
LU
HU
MT
NL
AT
PL
PT
RO
SI
SK
FI
SE
UK
HR
TR
MK
IS
NO
CH
1
4
172 15 83 0
22
7 20 72
2
27
2 20 75 3
23
4 16 76
2
20
7 16 76 1
24
10 7 81
3
17
9 15 71 5
36
10 18 70
1
28
9 27 63 1
34
9 15 73
2
24
12 22 65 1
32
5 9 85
2
14
12 20 65 3
17
6 14 78
3
20
4 13 82 1
37
8 22 68
0
30
7 30 63 0
31
15 19 63
2
34
15 16 58 11
26
12 15 73
1
27
7 19 74 0
13
11 7 80
1
18
3 10 81 6
30
2 9 88
2
11
13 17 69 1
22
2 12 85
3
14
11 11 76 2
20
6 9 83
2
15
5 15 79 1
29
13 17 30
9 20 68 3
20
9
6 14 78 2
67
14 3 21
No
Nein
Flash EB343
Yes, 5 times or more
17
Ja, 5 Mal oder häufiger
Flash EB343
DK/NA
WN/KA
Oui, moins de 5 fois
Yes, less than 5 times
Ja, weniger als 5 Mal
767
NSP/PR
Flash EB343
Q3.4 Depuis janvier 2009, votre entreprise a-t-elle eu recours à l’un des services suivants ? Permis et obligations dans le domaine environnemental (y compris bilan, gestion de l’eau et des déchets, émissions de gaz)
Q3.4 Since January 2009, has your company used any of the following public services?
26
Total 'Oui'
Gesamt 'Nein'
Flash EB343
72
Q3.4 Hat Ihr Unternehmen seit Januar 2009 folgende öffentliche Dienstleistungen genutzt? Genehmigungen und Auflagen im Bereich Umweltschutz (einschl. Berichterstattung, Wasser- und Abfallmanagement, Emissionen)
Environment related permits and obligations (incl. reporting, water and waste management, emissions)
Flash EB343
Oui, 5 fois ou plus Non Total 'Yes'
T17

FLASH EUROBAROMETER 343 “Public sector and company innovation”
%
EU 27
BE
BG
CZ
DK
DE
EE
IE
EL
ES
FR
IT
CY
LV
LT
LU
HU
MT
NL
AT
PL
PT
RO
SI
SK
FI
SE
UK
HR
TR
MK
IS
NO
CH
0
0
30 3 96 1
9
0 10 90
0
10
2 7 91 0
12
0 4 96
1
4
2 10 87 1
6
1 10 89
0
11
1 5 91 3
14
1 2 96
0
3
0 14 86 0
16
0 4 96
0
4
1 15 84 0
7
0 2 98
1
2
0 7 93 0
10
1 5 94
0
6
1 9 88 2
15
6 18 75
0
24
0 15 85 0
5
2 8 90
2
10
0 5 91 4
4
0 4 96
1
4
0 4 96 0
6
4 8 86
0
12
2 4 91 3
9
0 3 96
3
3
2 7 90 1
4
1 11 88
0
12
1 3 94 2
7
0 3 94
0
3
1 6 92 1
10
2 6 8
1 9 88 2
7
0
1 6 92 1
92
6 1 7
No
Nein
Flash EB343
Yes, 5 times or more
5
Ja, 5 Mal oder häufiger
Flash EB343
DK/NA
WN/KA
Oui, moins de 5 fois
Yes, less than 5 times
Ja, weniger als 5 Mal
921
NSP/PR
Flash EB343
Q3.5 Depuis janvier 2009, votre entreprise a-t-elle eu recours à l’un des services suivants ? Demander des subventions au titre de la recherche ou de l’innovation
Q3.5 Since January 2009, has your company used any of the following public services?
5
Total 'Oui'
Gesamt 'Nein'
Flash EB343
95
Q3.5 Hat Ihr Unternehmen seit Januar 2009 folgende öffentliche Dienstleistungen genutzt? Anträge auf Subventionen für Forschung oder Innovationen
Applying for research or innovation subsidies
Flash EB343
Oui, 5 fois ou plus Non Total 'Yes'
T18
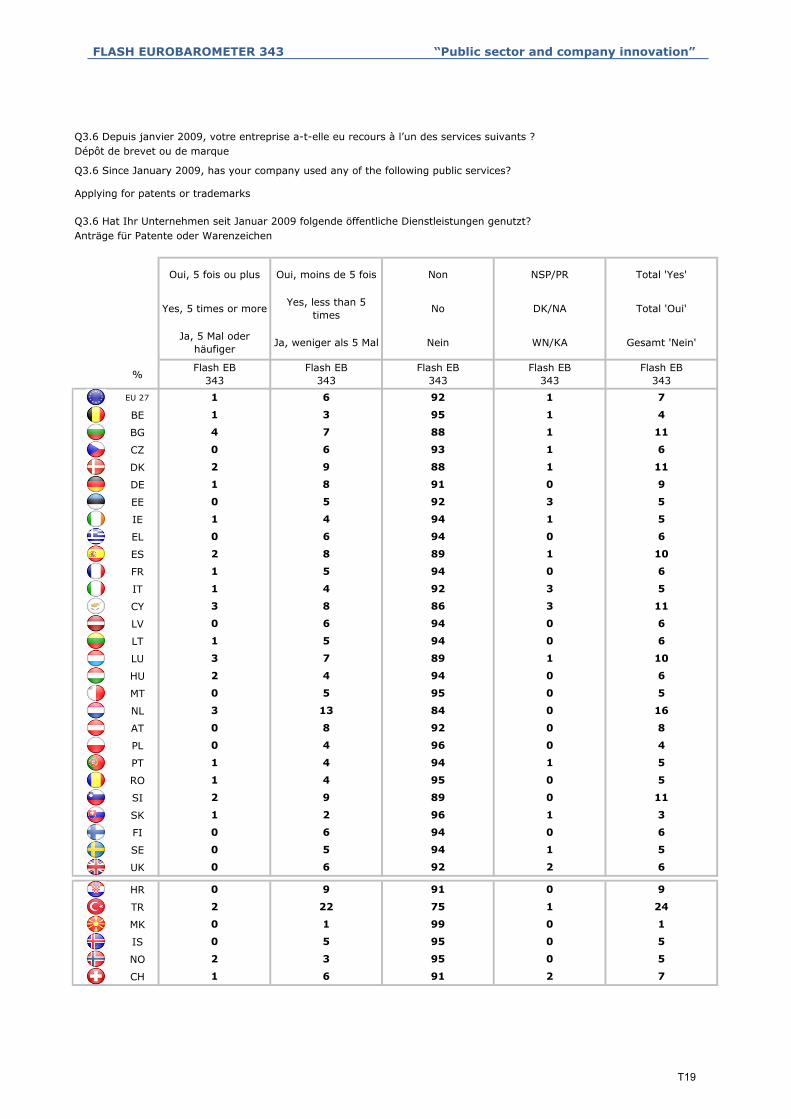
FLASH EUROBAROMETER 343 “Public sector and company innovation”
%
EU 27
BE
BG
CZ
DK
DE
EE
IE
EL
ES
FR
IT
CY
LV
LT
LU
HU
MT
NL
AT
PL
PT
RO
SI
SK
FI
SE
UK
HR
TR
MK
IS
NO
CH
0
0
71 6 91 2
5
2 3 95
0
5
0 5 95 0
24
0 1 99
1
1
2 22 75 1
6
0 9 91
1
9
0 6 92 2
6
0 5 94
0
5
0 6 94 0
11
1 2 96
0
3
2 9 89 0
5
1 4 95
0
5
1 4 94 1
8
0 4 96
0
4
0 8 92 0
5
3 13 84
0
16
0 5 95 0
10
2 4 94
3
6
3 7 89 1
6
1 5 94
0
6
0 6 94 0
5
3 8 86
0
11
1 4 92 3
10
1 5 94
3
6
2 8 89 1
5
0 6 94
1
6
1 4 94 1
9
0 5 92
1
5
1 8 91 0
6
2 9 11
0 6 93 1
4
4
1 3 95 1
88
6 1 7
No
Nein
Flash EB343
Yes, 5 times or more
7
Ja, 5 Mal oder häufiger
Flash EB343
DK/NA
WN/KA
Oui, moins de 5 fois
Yes, less than 5 times
Ja, weniger als 5 Mal
921
NSP/PR
Flash EB343
Q3.6 Depuis janvier 2009, votre entreprise a-t-elle eu recours à l’un des services suivants ? Dépôt de brevet ou de marque
Q3.6 Since January 2009, has your company used any of the following public services?
11
Total 'Oui'
Gesamt 'Nein'
Flash EB343
88
Q3.6 Hat Ihr Unternehmen seit Januar 2009 folgende öffentliche Dienstleistungen genutzt? Anträge für Patente oder Warenzeichen
Applying for patents or trademarks
Flash EB343
Oui, 5 fois ou plus Non Total 'Yes'
T19
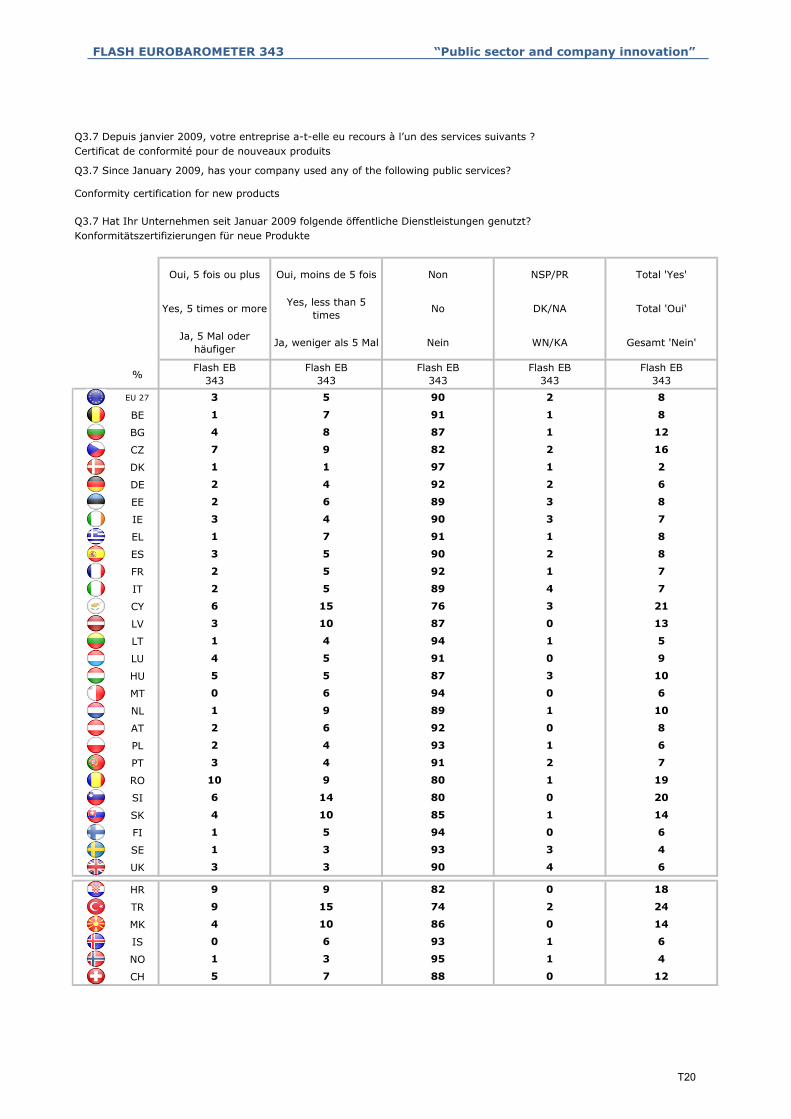
FLASH EUROBAROMETER 343 “Public sector and company innovation”
%
EU 27
BE
BG
CZ
DK
DE
EE
IE
EL
ES
FR
IT
CY
LV
LT
LU
HU
MT
NL
AT
PL
PT
RO
SI
SK
FI
SE
UK
HR
TR
MK
IS
NO
CH
1
0
125 7 88 0
6
1 3 95
0
4
0 6 93 1
24
4 10 86
3
14
9 15 74 2
6
9 9 82
1
18
3 3 90 4
6
1 3 93
1
4
1 5 94 0
20
4 10 85
1
14
6 14 80 0
7
10 9 80
1
19
3 4 91 2
8
2 4 93
3
6
2 6 92 0
6
1 9 89
1
10
0 6 94 0
9
5 5 87
3
10
4 5 91 0
13
1 4 94
1
5
3 10 87 0
7
6 15 76
1
21
2 5 89 4
8
2 5 92
3
7
3 5 90 2
7
1 7 91
1
8
3 4 90 3
6
2 6 89
1
8
2 4 92 2
16
1 1 2
7 9 82 2
8
4
1 7 91 1
97
5 2 8
No
Nein
Flash EB343
Yes, 5 times or more
8
Ja, 5 Mal oder häufiger
Flash EB343
DK/NA
WN/KA
Oui, moins de 5 fois
Yes, less than 5 times
Ja, weniger als 5 Mal
903
NSP/PR
Flash EB343
Q3.7 Depuis janvier 2009, votre entreprise a-t-elle eu recours à l’un des services suivants ? Certificat de conformité pour de nouveaux produits
Q3.7 Since January 2009, has your company used any of the following public services?
12
Total 'Oui'
Gesamt 'Nein'
Flash EB343
87
Q3.7 Hat Ihr Unternehmen seit Januar 2009 folgende öffentliche Dienstleistungen genutzt? Konformitätszertifizierungen für neue Produkte
Conformity certification for new products
Flash EB343
Oui, 5 fois ou plus Non Total 'Yes'
T20

FLASH EUROBAROMETER 343 “Public sector and company innovation”
%
EU 27
BE
BG
CZ
DK
DE
EE
IE
EL
ES
FR
IT
CY
LV
LT
LU
HU
MT
NL
AT
PL
PT
RO
SI
SK
FI
SE
UK
HR
TR
MK
IS
NO
CH
1
0
112 9 89 0
20
2 7 90
0
9
1 19 80 0
8
0 9 91
1
9
2 6 90 2
15
2 5 93
0
7
2 13 83 2
19
0 8 91
0
8
2 17 81 0
9
0 2 98
0
2
1 8 91 0
6
2 5 93
1
7
2 4 92 2
21
0 11 89
3
11
4 17 78 1
6
4 23 72
2
27
0 6 94 0
1
1 7 89
3
8
0 1 98 1
8
6 9 83
0
15
1 7 92 0
6
12 10 75
1
22
1 5 88 6
13
1 6 93
3
7
3 10 84 3
14
1 9 89
1
10
6 8 83 3
20
1 9 87
1
10
5 15 79 1
7
2 7 9
1 6 92 1
9
3
0 9 90 1
90
9 2 11
No
Nein
Flash EB343
Yes, 5 times or more
5
Ja, 5 Mal oder häufiger
Flash EB343
DK/NA
WN/KA
Oui, moins de 5 fois
Yes, less than 5 times
Ja, weniger als 5 Mal
872
NSP/PR
Flash EB343
Q3.8 Depuis janvier 2009, votre entreprise a-t-elle eu recours à l’un des services suivants ? Autres (comme le lancement d’une nouvelle entreprise, obtenir des conseils juridiques ou des subventions pour des activités de recherche ou d’innovation)
Q3.8 Since January 2009, has your company used any of the following public services?
8
Total 'Oui'
Gesamt 'Nein'
Flash EB343
91
Q3.8 Hat Ihr Unternehmen seit Januar 2009 folgende öffentliche Dienstleistungen genutzt? Sonstige Dienstleistungen (wie z.B. Unternehmensgründung, Einholen von juristischer Beratung oder Erhalt von Subventionen für Forschung oder Innovationen)
Other (such as starting a new business, obtaining legal advice or obtaining subsidies for research or innovation activities)
Flash EB343
Oui, 5 fois ou plus Non Total 'Yes'
T21
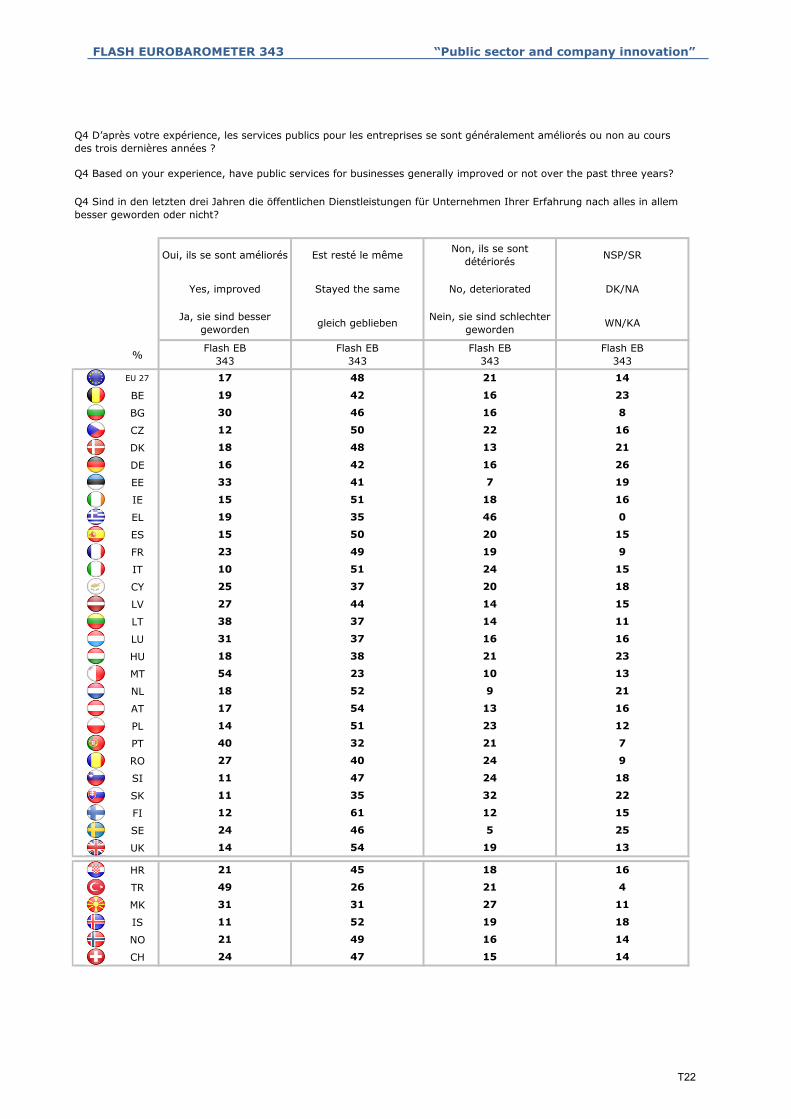
FLASH EUROBAROMETER 343 “Public sector and company innovation”
%
EU 27
BE
BG
CZ
DK
DE
EE
IE
EL
ES
FR
IT
CY
LV
LT
LU
HU
MT
NL
AT
PL
PT
RO
SI
SK
FI
SE
UK
HR
TR
MK
IS
NO
CH 24 47 15 14
21 49 16 14
11 52 19 18
31 31 27 11
49 26 21 4
21 45 18 16
14 54 19 13
24 46 5 25
12 61 12 15
11 35 32 22
11 47 24 18
27 40 24 9
40 32 21 7
14 51 23 12
17 54 13 16
18 52 9 21
54 23 10 13
18 38 21 23
31 37 16 16
38 37 14 11
27 44 14 15
25 37 20 18
10 51 24 15
23 49 19 9
15 50 20 15
19 35 46 0
15 51 18 16
33 41 7 19
16 42 16 26
18 48 13 21
12 50 22 16
30 46 16 8
19 42 16 23
17 48 21 14
NSP/SR
DK/NA
WN/KA
Flash EB343
Non, ils se sont détériorés
No, deteriorated
Nein, sie sind schlechter geworden
Flash EB343
Est resté le même
Stayed the same
gleich geblieben
Flash EB343
Oui, ils se sont améliorés
Yes, improved
Ja, sie sind besser geworden
Flash EB343
Q4 D’après votre expérience, les services publics pour les entreprises se sont généralement améliorés ou non au cours des trois dernières années ?
Q4 Based on your experience, have public services for businesses generally improved or not over the past three years?
Q4 Sind in den letzten drei Jahren die öffentlichen Dienstleistungen für Unternehmen Ihrer Erfahrung nach alles in allem besser geworden oder nicht?
T22

FLASH EUROBAROMETER 343 “Public sector and company innovation”
%
EU 27
BE
BG
CZ
DK
DE
EE
IE
EL
ES
FR
IT
CY
LV
LT
LU
HU
MT
NL
AT
PL
PT
RO
SI
SK
FI
SE
UK
HR
TR
MK
IS
NO
CH 78 16 6
65 24 11
80 14 6
62 38 0
40 53 7
58 39 3
68 24 8
85 10 5
69 19 12
84 13 3
78 18 4
67 27 6
45 51 4
77 19 4
63 32 5
87 3 10
65 33 2
78 19 3
49 39 12
82 14 4
66 26 8
64 27 9
54 40 6
63 35 2
86 12 2
67 31 2
74 24 2
73 23 4
75 13 12
93 6 1
81 17 2
77 21 2
81 14 5
69 27 4
Yes
Ja
Flash EB343
Option to complete government forms over the internet
Non
No
Nein
Flash EB343
Oui NSP/SR
DK/NA
WN/KA
Flash EB343
Q5.1 Haben Sie Ihrer Erfahrung nach bei der Inanspruchnahme öffentlicher Dienstleistungen für Unternehmen seit Januar 2009 die Einführung der folgenden Punkte bemerkt? Die Möglichkeit, über das Internet Verwaltungsformulare auszufüllen
Q5.1 D’après votre expérience de l’utilisation de services publics pour les entreprises, avez-vous observé, depuis janvier 2009, l’introduction de l’un des éléments suivants ? Possibilité de remplir les formulaires administratifs sur internet
Q5.1 Based on your experience of using public services for businesses, since January 2009, have you observed the introduction of any of the following…?
T23
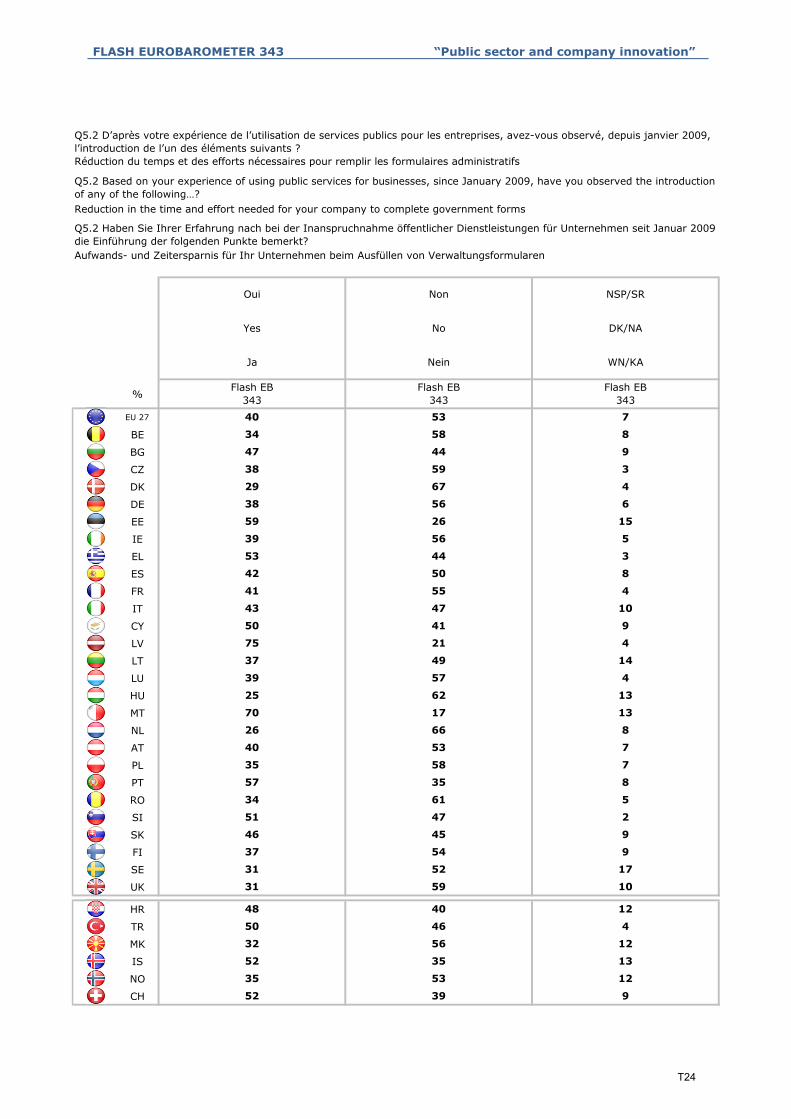
FLASH EUROBAROMETER 343 “Public sector and company innovation”
%
EU 27
BE
BG
CZ
DK
DE
EE
IE
EL
ES
FR
IT
CY
LV
LT
LU
HU
MT
NL
AT
PL
PT
RO
SI
SK
FI
SE
UK
HR
TR
MK
IS
NO
CH 52 39 9
52 35 13
35 53 12
50 46 4
32 56 12
31 59 10
48 40 12
37 54 9
31 52 17
51 47 2
46 45 9
57 35 8
34 61 5
40 53 7
35 58 7
70 17 13
26 66 8
39 57 4
25 62 13
75 21 4
37 49 14
43 47 10
50 41 9
42 50 8
41 55 4
39 56 5
53 44 3
38 56 6
59 26 15
38 59 3
29 67 4
34 58 8
47 44 9
40 53 7
Yes
Ja
Flash EB343
Reduction in the time and effort needed for your company to complete government forms
Non
No
Nein
Flash EB343
Oui NSP/SR
DK/NA
WN/KA
Flash EB343
Q5.2 Haben Sie Ihrer Erfahrung nach bei der Inanspruchnahme öffentlicher Dienstleistungen für Unternehmen seit Januar 2009 die Einführung der folgenden Punkte bemerkt? Aufwands- und Zeitersparnis für Ihr Unternehmen beim Ausfüllen von Verwaltungsformularen
Q5.2 D’après votre expérience de l’utilisation de services publics pour les entreprises, avez-vous observé, depuis janvier 2009, l’introduction de l’un des éléments suivants ? Réduction du temps et des efforts nécessaires pour remplir les formulaires administratifs
Q5.2 Based on your experience of using public services for businesses, since January 2009, have you observed the introduction of any of the following…?
T24
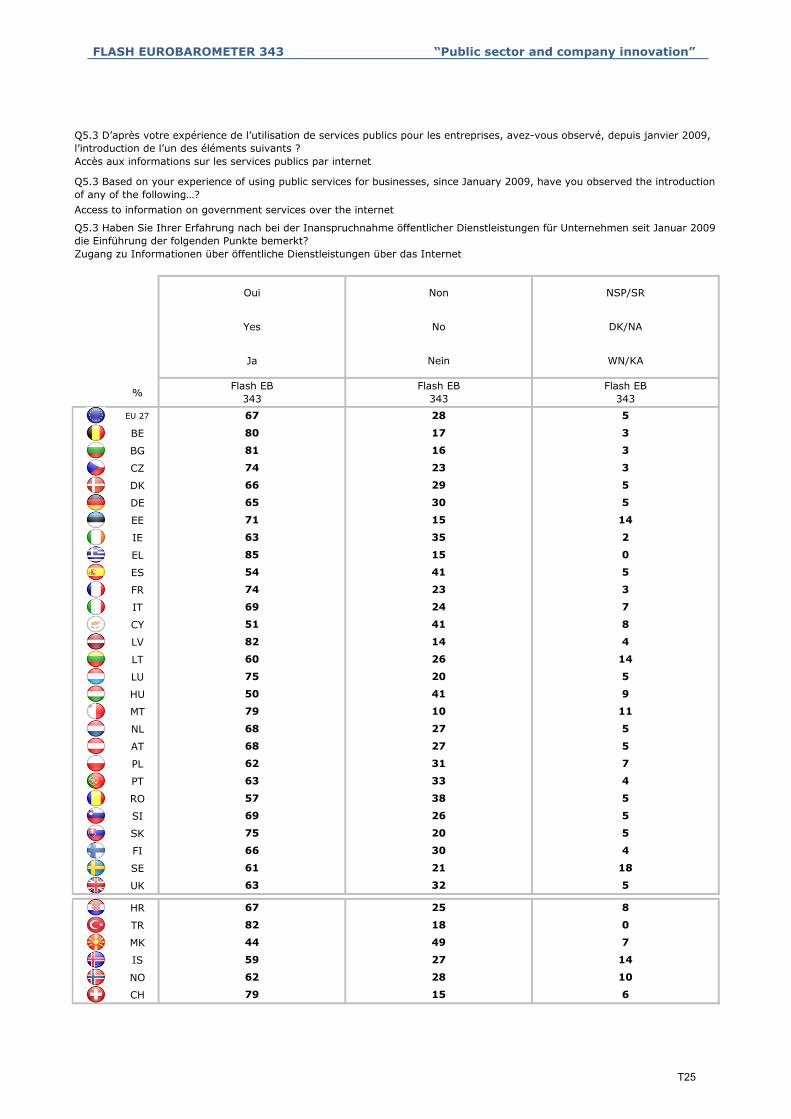
FLASH EUROBAROMETER 343 “Public sector and company innovation”
%
EU 27
BE
BG
CZ
DK
DE
EE
IE
EL
ES
FR
IT
CY
LV
LT
LU
HU
MT
NL
AT
PL
PT
RO
SI
SK
FI
SE
UK
HR
TR
MK
IS
NO
CH 79 15 6
59 27 14
62 28 10
82 18 0
44 49 7
63 32 5
67 25 8
66 30 4
61 21 18
69 26 5
75 20 5
63 33 4
57 38 5
68 27 5
62 31 7
79 10 11
68 27 5
75 20 5
50 41 9
82 14 4
60 26 14
69 24 7
51 41 8
54 41 5
74 23 3
63 35 2
85 15 0
65 30 5
71 15 14
74 23 3
66 29 5
80 17 3
81 16 3
67 28 5
Yes
Ja
Flash EB343
Access to information on government services over the internet
Non
No
Nein
Flash EB343
Oui NSP/SR
DK/NA
WN/KA
Flash EB343
Q5.3 Haben Sie Ihrer Erfahrung nach bei der Inanspruchnahme öffentlicher Dienstleistungen für Unternehmen seit Januar 2009 die Einführung der folgenden Punkte bemerkt? Zugang zu Informationen über öffentliche Dienstleistungen über das Internet
Q5.3 D’après votre expérience de l’utilisation de services publics pour les entreprises, avez-vous observé, depuis janvier 2009, l’introduction de l’un des éléments suivants ? Accès aux informations sur les services publics par internet
Q5.3 Based on your experience of using public services for businesses, since January 2009, have you observed the introduction of any of the following…?
T25
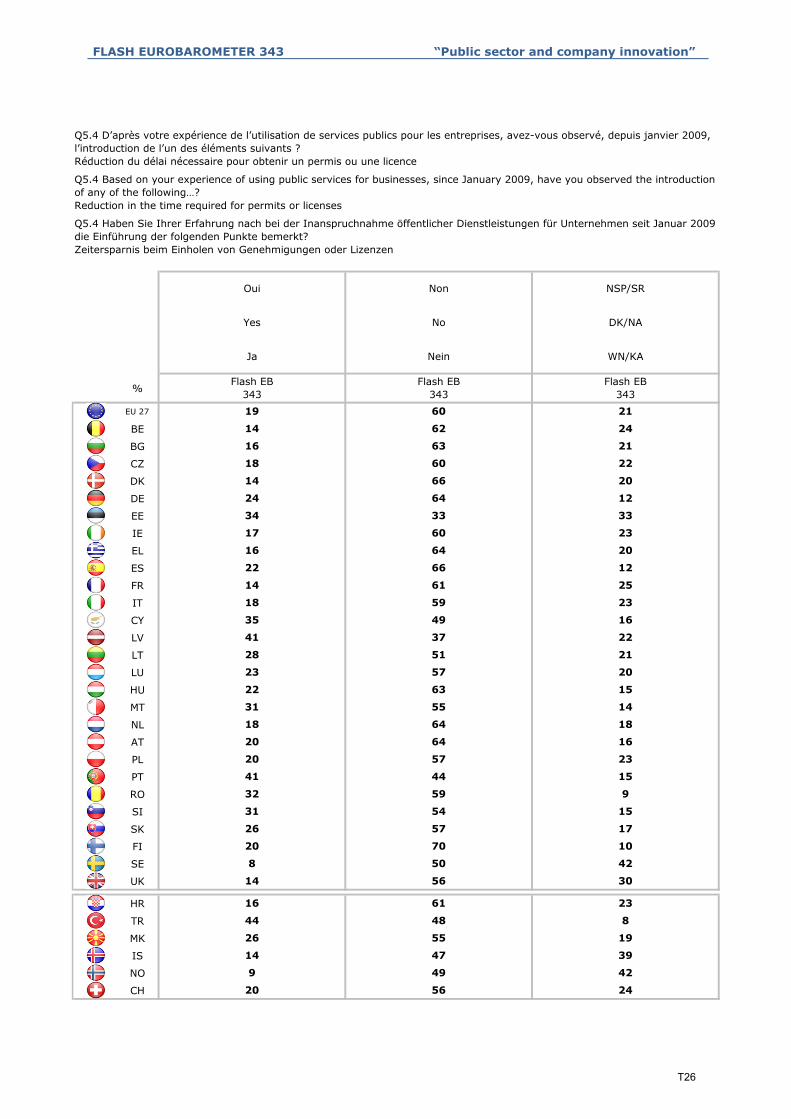
FLASH EUROBAROMETER 343 “Public sector and company innovation”
%
EU 27
BE
BG
CZ
DK
DE
EE
IE
EL
ES
FR
IT
CY
LV
LT
LU
HU
MT
NL
AT
PL
PT
RO
SI
SK
FI
SE
UK
HR
TR
MK
IS
NO
CH 20 56 24
14 47 39
9 49 42
44 48 8
26 55 19
14 56 30
16 61 23
20 70 10
8 50 42
31 54 15
26 57 17
41 44 15
32 59 9
20 64 16
20 57 23
31 55 14
18 64 18
23 57 20
22 63 15
41 37 22
28 51 21
18 59 23
35 49 16
22 66 12
14 61 25
17 60 23
16 64 20
24 64 12
34 33 33
18 60 22
14 66 20
14 62 24
16 63 21
19 60 21
Yes
Ja
Flash EB343
Reduction in the time required for permits or licenses
Non
No
Nein
Flash EB343
Oui NSP/SR
DK/NA
WN/KA
Flash EB343
Q5.4 Haben Sie Ihrer Erfahrung nach bei der Inanspruchnahme öffentlicher Dienstleistungen für Unternehmen seit Januar 2009 die Einführung der folgenden Punkte bemerkt? Zeitersparnis beim Einholen von Genehmigungen oder Lizenzen
Q5.4 D’après votre expérience de l’utilisation de services publics pour les entreprises, avez-vous observé, depuis janvier 2009, l’introduction de l’un des éléments suivants ? Réduction du délai nécessaire pour obtenir un permis ou une licence
Q5.4 Based on your experience of using public services for businesses, since January 2009, have you observed the introduction of any of the following…?
T26

FLASH EUROBAROMETER 343 “Public sector and company innovation”
%
EU 27
BE
BG
CZ
DK
DE
EE
IE
EL
ES
FR
IT
CY
LV
LT
LU
HU
MT
NL
AT
PL
PT
RO
SI
SK
FI
SE
UK
HR
TR
MK
IS
NO
CH 33 52 15
12 59 29
20 54 26
56 41 3
29 55 16
21 64 15
17 70 13
23 64 13
22 45 33
38 51 11
28 61 11
47 37 16
29 62 9
29 60 11
26 65 9
32 55 13
25 64 11
36 53 11
20 63 17
52 28 20
26 47 27
22 53 25
31 54 15
25 65 10
32 61 7
26 64 10
19 76 5
22 66 12
33 37 30
22 70 8
21 64 15
25 60 15
35 53 12
25 61 14
Yes
Ja
Flash EB343
Faster response time for government services
Non
No
Nein
Flash EB343
Oui NSP/SR
DK/NA
WN/KA
Flash EB343
Q5.5 Haben Sie Ihrer Erfahrung nach bei der Inanspruchnahme öffentlicher Dienstleistungen für Unternehmen seit Januar 2009 die Einführung der folgenden Punkte bemerkt? Kürzere Antwortzeiten bei öffentlichen Dienstleistungen
Q5.5 D’après votre expérience de l’utilisation de services publics pour les entreprises, avez-vous observé, depuis janvier 2009, l’introduction de l’un des éléments suivants ? Temps de réponse plus court pour les services publics
Q5.5 Based on your experience of using public services for businesses, since January 2009, have you observed the introduction of any of the following…?
T27

FLASH EUROBAROMETER 343 “Public sector and company innovation”
%
EU 27
BE
BG
CZ
DK
DE
EE
IE
EL
ES
FR
IT
CY
LV
LT
LU
HU
MT
NL
AT
PL
PT
RO
SI
SK
FI
SE
UK
HR
TR
MK
IS
NO
CH 19 73 8
16 69 15
14 77 9
49 48 3
17 71 12
12 81 7
12 87 1
14 80 6
10 66 24
27 68 5
17 77 6
30 62 8
16 80 4
15 79 6
11 87 2
13 82 5
11 80 9
12 73 15
13 77 10
37 53 10
14 74 12
9 77 14
24 57 19
15 78 7
13 81 6
13 80 7
21 76 3
19 71 10
26 53 21
19 74 7
17 76 7
10 82 8
15 81 4
14 78 8
Yes
Ja
Flash EB343
Reduction in financial costs to your company
Non
No
Nein
Flash EB343
Oui NSP/SR
DK/NA
WN/KA
Flash EB343
Q5.6 Haben Sie Ihrer Erfahrung nach bei der Inanspruchnahme öffentlicher Dienstleistungen für Unternehmen seit Januar 2009 die Einführung der folgenden Punkte bemerkt? Kostenreduzierung für Ihr Unternehmen
Q5.6 D’après votre expérience de l’utilisation de services publics pour les entreprises, avez-vous observé, depuis janvier 2009, l’introduction de l’un des éléments suivants ? Réduction des frais à la charge de votre entreprise
Q5.6 Based on your experience of using public services for businesses, since January 2009, have you observed the introduction of any of the following…?
T28

FLASH EUROBAROMETER 343 “Public sector and company innovation”
%
EU 27
BE
BG
CZ
DK
DE
EE
IE
EL
ES
FR
IT
CY
LV
LT
LU
HU
MT
NL
AT
PL
PT
RO
SI
SK
FI
SE
UK
HR
TR
MK
IS
NO
CH
24 41 28 2
21 46 27 2
25 45 18 0
22 46 21 0
25 40 21 4
49 37 11 3
21 37 32 2
14 36 34 6
13 50 24 6
21 44 32 1
10 58 17 4
9 44 40 4
23 46 26 2
34 45 14 2
14 42 33 4
21 34 33 1
16 39 33 2
42 23 21 2
14 49 25 1
13 55 28 0
22 67 11 0
42 43 11 0
23 34 34 2
16 54 19 2
32 56 10 2
32 44 11 5
14 43 24 1
13 54 31 0
11 47 27 7
8 40 43 2
10 62 22 3
12 48 32 3
20 44 26 3
19 42 31 3
No notable change
Hat keine bemerkbare Veränderung gebracht
Flash EB343
Légèrement détériorée
Slight deterioration
Hat eine leichte Verschlechterung
gebracht
Flash EB343
Option to complete government forms over the internet
Améliorée significative Pas de changement notable
Significant improvement
Hat eine deutliche Verbesserung
gebracht
Flash EB343
Légèrement améliorée
Slight improvement
Hat eine leichte Verbesserung
gebracht
Flash EB343
Q6.1 Wie hat sich ... darauf ausgewirkt, wie Sie öffentliche Dienstleitungen nutzen? die Möglichkeit, über das Internet Verwaltungsformulare auszufüllen
Q6.1 Quel impact cela a-t-il eu sur votre utilisation de ces services publics ? A-t-elle été... Possibilité de remplir les formulaires administratifs sur internet
Q6.1 What impact has this had on the way you use public services? Has it made…
T29

FLASH EUROBAROMETER 343 “Public sector and company innovation”
%
EU 27
BE
BG
CZ
DK
DE
EE
IE
EL
ES
FR
IT
CY
LV
LT
LU
HU
MT
NL
AT
PL
PT
RO
SI
SK
FI
SE
UK
HR
TR
MK
IS
NO
CH
Total 'Deterioration'
Q6.1 Quel impact cela a-t-il eu sur votre utilisation de ces services publics ? A-t-elle été... Possibilité de remplir les formulaires administratifs sur internet
Q6.1 What impact has this had on the way you use public services? Has it made… Option to complete government forms over the internet
Q6.1 Wie hat sich ... darauf ausgewirkt, wie Sie öffentliche Dienstleitungen nutzen? die Möglichkeit, über das Internet Verwaltungsformulare auszufüllen
Détériorée significativement
WN/KAHat eine deutliche Verschlechterung
gebrachtTotal 'Verbesserung' Total
'Verschlechterung'
NSP/SR Total Amélioration Total Détérioration
Significant deterioration DK/NA Total 'Improvement'
Flash EB343
Flash EB343
3 4 64 6
Flash EB343
Flash EB343
61 5
0 3 72 3
2 3
60 5
6 2 58 13
2 3
48 4
0 18 57 1
2 5
67 2
0 0 88 2
2 0
76 9
4 3 57 6
4 4
70 7
0 0 89 0
5 4
85 2
0 11 63 1
2 2
68 0
0 10 55 2
0 4
65 4
3 4 56 7
2 10
55 2
0 3 69 2
1 10
79 5
1 10 68 5
3 2
53 4
1 6 63 7
0 3
65 1
1 7 58 3
0 2
50 12
0 10 65 4
6 4
3 8
86 3
0 12 70 0
0 0
67 20 4
68 3
1 4 65 3
T30

FLASH EUROBAROMETER 343 “Public sector and company innovation”
%
EU 27
BE
BG
CZ
DK
DE
EE
IE
EL
ES
FR
IT
CY
LV
LT
LU
HU
MT
NL
AT
PL
PT
RO
SI
SK
FI
SE
UK
HR
TR
MK
IS
NO
CH
21 42 37 0
20 57 19 3
30 46 22 0
18 53 26 1
27 45 18 5
43 48 9 0
17 47 28 2
25 48 20 2
15 65 11 3
16 63 21 0
18 69 9 2
16 50 21 7
24 48 27 0
27 50 17 2
15 61 19 0
21 53 24 0
35 37 25 0
24 26 37 2
11 68 8 0
29 49 21 0
9 82 9 0
35 42 18 0
12 54 32 0
14 61 19 0
23 67 10 0
40 45 10 2
11 51 20 0
20 56 20 2
18 46 30 3
12 56 27 3
15 60 23 2
15 68 17 0
21 54 21 1
10 56 29 3
No notable change
Hat keine bemerkbare Veränderung gebracht
Flash EB343
Légèrement détériorée
Slight deterioration
Hat eine leichte Verschlechterung
gebrachtFlash EB
343
Q6.2 Quel impact cela a-t-il eu sur votre utilisation de ces services publics ? A-t-elle été...
Améliorée significative Pas de changement notable
Significant improvement
Hat eine deutliche Verbesserung gebracht
Flash EB343
Légèrement améliorée
Slight improvement
Hat eine leichte Verbesserung gebracht
Flash EB343
die Aufwands- und Zeitersparnis für Ihr Unternehmen beim Ausfüllen von VerwaltungsformularenQ6.2 Wie hat sich ... darauf ausgewirkt, wie Sie öffentliche Dienstleitungen nutzen?
Reduction in the time and effort needed for your company to complete government formsQ6.2 What impact has this had on the way you use public services? Has it made…
Réduction du temps et des efforts nécessaires pour votre entreprise pour remplir les formulaires administratifs
T31

FLASH EUROBAROMETER 343 “Public sector and company innovation”
%
EU 27
BE
BG
CZ
DK
DE
EE
IE
EL
ES
FR
IT
CY
LV
LT
LU
HU
MT
NL
AT
PL
PT
RO
SI
SK
FI
SE
UK
HR
TR
MK
IS
NO
CH
Total 'Deterioration'
Q6.2 Quel impact cela a-t-il eu sur votre utilisation de ces services publics ? A-t-elle été... Réduction du temps et des efforts nécessaires pour votre entreprise pour remplir les formulaires administratifs
Q6.2 What impact has this had on the way you use public services? Has it made… Reduction in the time and effort needed for your company to complete government forms
Q6.2 Wie hat sich ... darauf ausgewirkt, wie Sie öffentliche Dienstleitungen nutzen? die Aufwands- und Zeitersparnis für Ihr Unternehmen beim Ausfüllen von Verwaltungsformularen
Détériorée significativement
WN/KAHat eine deutliche Verschlechterung
gebrachtTotal 'Verbesserung' Total 'Verschlechterung'
NSP/SR Total Amélioration Total Détérioration
Significant deterioration DK/NA Total 'Improvement'
Flash EB343
Flash EB343
1 2 75 2
Flash EB343
Flash EB343
66 3
0 0 75 2
0 2
83 0
3 0 64 6
0 0
68 4
0 18 62 0
1 1
76 4
0 0 90 0
2 0
85 4
1 1 66 1
2 1
75 1
0 0 91 0
1 5
77 0
0 13 79 0
0 5
78 0
0 3 72 0
0 1
50 11
2 3 76 2
9 2
74 1
0 1 72 0
1 1
77 2
0 2 87 2
0 4
66 8
3 3 80 6
1 5
79 0
0 6 64 2
0 0
73 3
0 5 72 5
1 4
0 2
91 0
0 2 76 0
0 0
77 30 1
71 1
0 0 63 0
T32

FLASH EUROBAROMETER 343 “Public sector and company innovation”
%
EU 27
BE
BG
CZ
DK
DE
EE
IE
EL
ES
FR
IT
CY
LV
LT
LU
HU
MT
NL
AT
PL
PT
RO
SI
SK
FI
SE
UK
HR
TR
MK
IS
NO
CH
28 47 17 4
26 47 23 0
27 56 6 1
20 52 16 3
37 37 16 2
46 46 7 0
14 43 35 0
18 41 35 1
12 56 23 3
23 49 26 1
21 57 18 1
20 44 28 3
30 46 20 2
33 46 16 1
20 41 35 2
27 47 21 0
31 38 25 0
41 34 11 0
12 62 20 0
27 53 18 1
30 63 5 0
28 49 17 0
29 43 24 0
22 54 18 2
29 54 16 0
33 49 12 4
12 48 21 2
18 57 22 2
13 45 27 7
17 49 27 1
24 58 15 1
8 50 36 1
24 48 23 1
18 54 23 0
No notable change
Hat keine bemerkbare Veränderung gebracht
Flash EB343
Légèrement détériorée
Slight deterioration
Hat eine leichte Verschlechterung
gebrachtFlash EB
343
Access to information on government services over the internet
Améliorée significative Pas de changement notable
Significant improvement
Hat eine deutliche Verbesserung gebracht
Flash EB343
Légèrement améliorée
Slight improvement
Hat eine leichte Verbesserung gebracht
Flash EB343
Q6.3 Wie hat sich ... darauf ausgewirkt, wie Sie öffentliche Dienstleitungen nutzen? der Zugang zu Informationen über öffentliche Dienstleistungen über das Internet
Q6.3 Quel impact cela a-t-il eu sur votre utilisation de ces services publics ? A-t-elle été... Accès aux informations sur les services publics par internet
Q6.3 What impact has this had on the way you use public services? Has it made…
T33
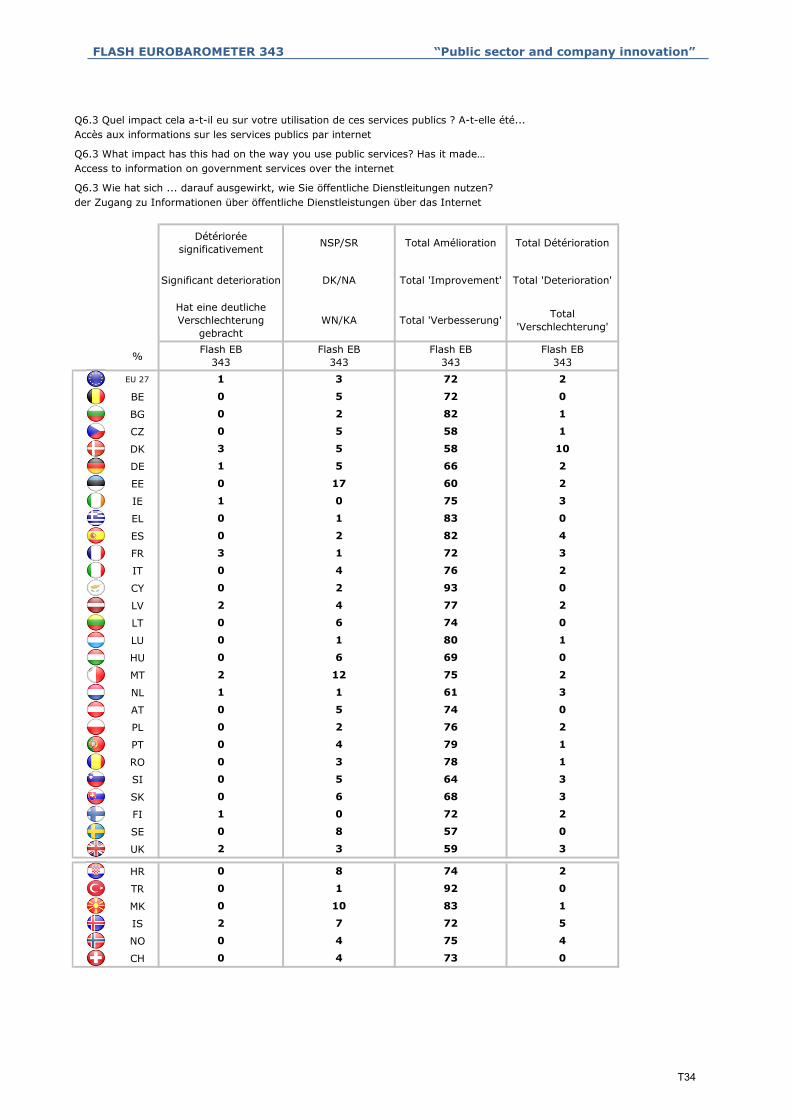
FLASH EUROBAROMETER 343 “Public sector and company innovation”
%
EU 27
BE
BG
CZ
DK
DE
EE
IE
EL
ES
FR
IT
CY
LV
LT
LU
HU
MT
NL
AT
PL
PT
RO
SI
SK
FI
SE
UK
HR
TR
MK
IS
NO
CH
Total 'Deterioration'
Q6.3 Quel impact cela a-t-il eu sur votre utilisation de ces services publics ? A-t-elle été... Accès aux informations sur les services publics par internet
Q6.3 What impact has this had on the way you use public services? Has it made… Access to information on government services over the internet
Q6.3 Wie hat sich ... darauf ausgewirkt, wie Sie öffentliche Dienstleitungen nutzen? der Zugang zu Informationen über öffentliche Dienstleistungen über das Internet
Détériorée significativement
Hat eine deutliche Verschlechterung
gebrachtWN/KA Total 'Verbesserung' Total
'Verschlechterung'
NSP/SR Total Amélioration Total Détérioration
Significant deterioration DK/NA Total 'Improvement'
Flash EB343
Flash EB343
1 3 72 2
Flash EB343
Flash EB343
72 0
0 2 82 1
0 5
58 1
3 5 58 10
0 5
66 2
0 17 60 2
1 5
75 3
0 1 83 0
1 0
82 4
3 1 72 3
0 2
76 2
0 2 93 0
0 4
77 2
0 6 74 0
2 4
80 1
0 6 69 0
0 1
75 2
1 1 61 3
2 12
74 0
0 2 76 2
0 5
79 1
0 3 78 1
0 4
64 3
0 6 68 3
0 5
72 2
0 8 57 0
1 0
59 3
0 8 74 2
2 3
2 7
92 0
0 10 83 1
0 1
73 00 4
72 5
0 4 75 4
T34
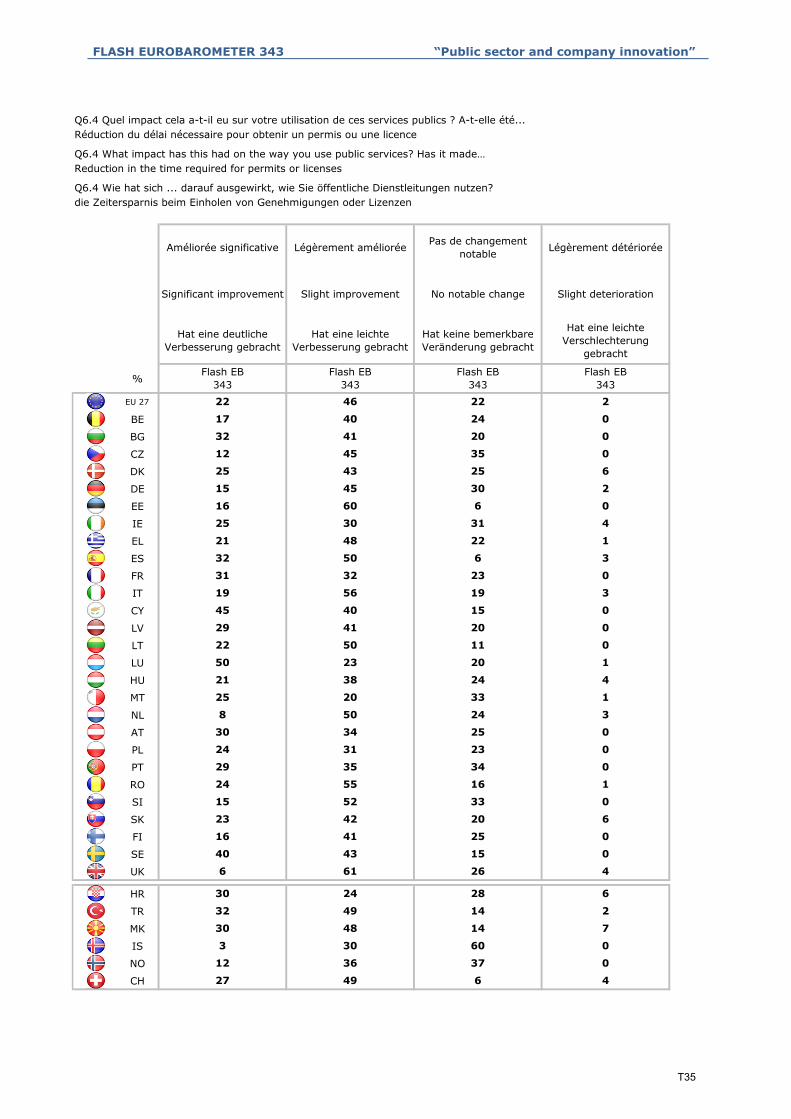
FLASH EUROBAROMETER 343 “Public sector and company innovation”
%
EU 27
BE
BG
CZ
DK
DE
EE
IE
EL
ES
FR
IT
CY
LV
LT
LU
HU
MT
NL
AT
PL
PT
RO
SI
SK
FI
SE
UK
HR
TR
MK
IS
NO
CH
12 36 37 0
27 49 6 4
30 48 14 7
3 30 60 0
30 24 28 6
32 49 14 2
40 43 15 0
6 61 26 4
23 42 20 6
16 41 25 0
24 55 16 1
15 52 33 0
24 31 23 0
29 35 34 0
8 50 24 3
30 34 25 0
21 38 24 4
25 20 33 1
22 50 11 0
50 23 20 1
45 40 15 0
29 41 20 0
31 32 23 0
19 56 19 3
21 48 22 1
32 50 6 3
16 60 6 0
25 30 31 4
25 43 25 6
15 45 30 2
32 41 20 0
12 45 35 0
22 46 22 2
17 40 24 0
No notable change
Hat keine bemerkbare Veränderung gebracht
Flash EB343
Légèrement détériorée
Slight deterioration
Hat eine leichte Verschlechterung
gebracht
Flash EB343
Reduction in the time required for permits or licenses
Améliorée significative Pas de changement notable
Significant improvement
Hat eine deutliche Verbesserung gebracht
Flash EB343
Légèrement améliorée
Slight improvement
Hat eine leichte Verbesserung gebracht
Flash EB343
Q6.4 Wie hat sich ... darauf ausgewirkt, wie Sie öffentliche Dienstleitungen nutzen? die Zeitersparnis beim Einholen von Genehmigungen oder Lizenzen
Q6.4 Quel impact cela a-t-il eu sur votre utilisation de ces services publics ? A-t-elle été... Réduction du délai nécessaire pour obtenir un permis ou une licence
Q6.4 What impact has this had on the way you use public services? Has it made…
T35

FLASH EUROBAROMETER 343 “Public sector and company innovation”
%
EU 27
BE
BG
CZ
DK
DE
EE
IE
EL
ES
FR
IT
CY
LV
LT
LU
HU
MT
NL
AT
PL
PT
RO
SI
SK
FI
SE
UK
HR
TR
MK
IS
NO
CH
Total 'Deterioration'
Q6.4 Quel impact cela a-t-il eu sur votre utilisation de ces services publics ? A-t-elle été... Réduction du délai nécessaire pour obtenir un permis ou une licence
Q6.4 What impact has this had on the way you use public services? Has it made… Reduction in the time required for permits or licenses
Q6.4 Wie hat sich ... darauf ausgewirkt, wie Sie öffentliche Dienstleitungen nutzen? die Zeitersparnis beim Einholen von Genehmigungen oder Lizenzen
Détériorée significativement
Hat eine deutliche Verschlechterung
gebrachtWN/KA Total 'Verbesserung' Total
'Verschlechterung'
NSP/SR Total Amélioration Total Détérioration
Significant deterioration DK/NA Total 'Improvement'
Flash EB343
Flash EB343
0 8 68 2
Flash EB343
Flash EB343
57 0
3 4 73 3
0 19
57 0
0 1 68 6
0 8
60 2
3 15 76 3
0 8
55 4
0 8 69 1
0 10
82 3
0 14 63 0
0 9
75 3
0 0 85 0
0 3
70 0
0 17 72 0
0 10
73 1
4 9 59 8
0 6
45 1
2 13 58 5
0 21
64 0
0 22 55 0
0 11
64 0
1 3 79 2
0 2
67 0
0 9 65 6
0 0
57 0
0 2 83 0
0 18
67 7
0 12 54 6
3 0
0 7
81 2
0 1 78 7
0 3
76 40 14
33 0
0 15 48 0
T36

FLASH EUROBAROMETER 343 “Public sector and company innovation”
%
EU 27
BE
BG
CZ
DK
DE
EE
IE
EL
ES
FR
IT
CY
LV
LT
LU
HU
MT
NL
AT
PL
PT
RO
SI
SK
FI
SE
UK
HR
TR
MK
IS
NO
CH
44 39 11 0
21 49 26 0
11 59 30 0
9 0
49 21 21 0
24 56 18 0
40 48
13 56 27 0
25 0
24 45 22 3
22 35 34 4
28 47
10 56 29 5
29 0
22 51 22 0
16 67 11 2
25 42
27 47 19 0
54 4
31 39 28 0
15 57 20 2
9 23
28 57 15 0
15 0
19 62 10 0
20 50 27 0
25 51
20 49 23 0
4 0
28 40 30 0
21 52 22 0
35 58
25 50 19 0
23 0
17 60 20 0
15 58 14 3
14 60
15 74 7 0
29 0
21 53 21 0
16 67 12 2
27 44
No notable change
Hat keine bemerkbare Veränderung gebracht
Flash EB343
Légèrement détériorée
Slight deterioration
Hat eine leichte Verschlechterung
gebrachtFlash EB
343
Significant improvement
Hat eine deutliche Verbesserung gebracht
Flash EB343
Légèrement améliorée
Slight improvement
Hat eine leichte Verbesserung gebracht
Flash EB343
die kürzeren Antwortzeiten bei öffentlichen Dienstleistungen
Améliorée significative Pas de changement notable
Temps de réponse plus court pour les services publics
Q6.5 What impact has this had on the way you use public services? Has it made… Faster response time for government services
Q6.5 Wie hat sich ... darauf ausgewirkt, wie Sie öffentliche Dienstleitungen nutzen?
Q6.5 Quel impact cela a-t-il eu sur votre utilisation de ces services publics ? A-t-elle été...
T37
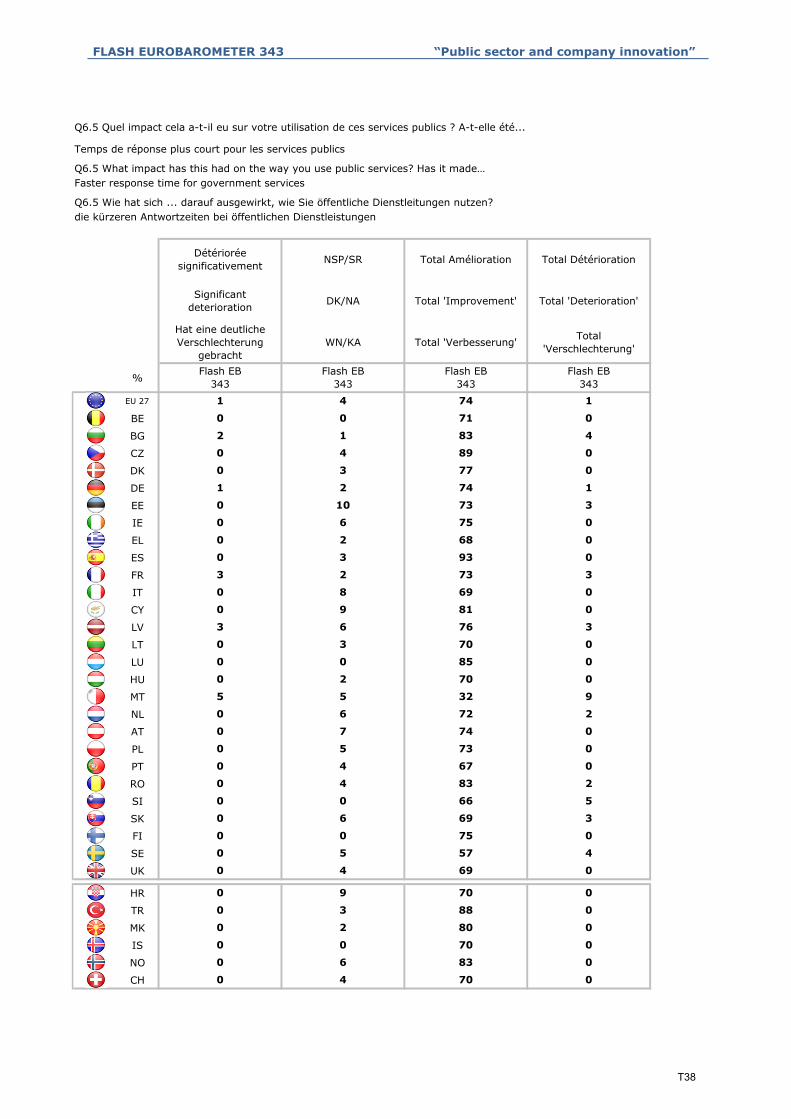
FLASH EUROBAROMETER 343 “Public sector and company innovation”
%
EU 27
BE
BG
CZ
DK
DE
EE
IE
EL
ES
FR
IT
CY
LV
LT
LU
HU
MT
NL
AT
PL
PT
RO
SI
SK
FI
SE
UK
HR
TR
MK
IS
NO
CH
Temps de réponse plus court pour les services publics
Faster response time for government services
NSP/SR Total Amélioration
Q6.5 What impact has this had on the way you use public services? Has it made…
Q6.5 Quel impact cela a-t-il eu sur votre utilisation de ces services publics ? A-t-elle été...
Significant deterioration DK/NA Total 'Improvement'
die kürzeren Antwortzeiten bei öffentlichen Dienstleistungen
Détériorée significativement
Q6.5 Wie hat sich ... darauf ausgewirkt, wie Sie öffentliche Dienstleitungen nutzen?
Total Détérioration
Total 'Verbesserung'
Flash EB343
Flash EB343
Flash EB343
WN/KA Total 'Verschlechterung'
Hat eine deutliche Verschlechterung
gebracht
74
0 0 71
11 4
83
0 4 89
42 1
77
1 2 74
00 3
73
0 6 75
30 10
0
68
0 3 93
00 2
0
73
0 8 69
33 2
0
81
3 6 76
00 9
3
70
0 0 85
00 3
0
70
5 5 32
00 2
9
72
0 7 74
20 6
0
73
0 4 67
00 5
0
83
0 0 66
20 4
5
0 0 75
30 6
0
0 4 69
40 5
0
0 3 88
00 9
0
0 0 70
00 2
0
0 4 70
00 6
0
Total 'Deterioration'
Flash EB343
0
0
1
83
80
70
57
69
T38
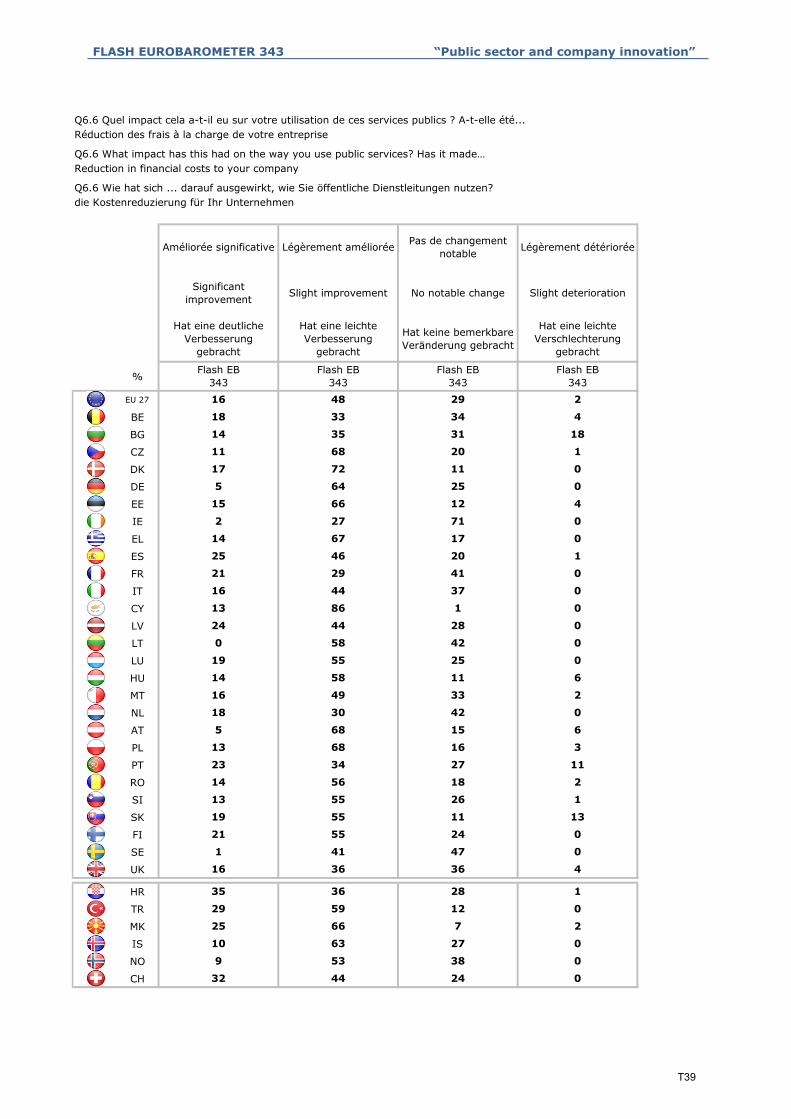
FLASH EUROBAROMETER 343 “Public sector and company innovation”
%
EU 27
BE
BG
CZ
DK
DE
EE
IE
EL
ES
FR
IT
CY
LV
LT
LU
HU
MT
NL
AT
PL
PT
RO
SI
SK
FI
SE
UK
HR
TR
MK
IS
NO
CH
9 53 38 0
32 44 24 0
25 66 7 2
10 63 27 0
35 36 28 1
29 59 12 0
1 41 47 0
16 36 36 4
19 55 11 13
21 55 24 0
14 56 18 2
13 55 26 1
13 68 16 3
23 34 27 11
18 30 42 0
5 68 15 6
14 58 11 6
16 49 33 2
0 58 42 0
19 55 25 0
13 86 1 0
24 44 28 0
21 29 41 0
16 44 37 0
14 67 17 0
25 46 20 1
15 66 12 4
2 27 71 0
17 72 11 0
5 64 25 0
14 35 31 18
11 68 20 1
16 48 29 2
18 33 34 4
No notable change
Hat keine bemerkbare Veränderung gebracht
Flash EB343
Légèrement détériorée
Slight deterioration
Hat eine leichte Verschlechterung
gebracht
Flash EB343
Reduction in financial costs to your company
Améliorée significative Pas de changement notable
Significant improvement
Hat eine deutliche Verbesserung
gebracht
Flash EB343
Légèrement améliorée
Slight improvement
Hat eine leichte Verbesserung
gebracht
Flash EB343
Q6.6 Wie hat sich ... darauf ausgewirkt, wie Sie öffentliche Dienstleitungen nutzen? die Kostenreduzierung für Ihr Unternehmen
Q6.6 Quel impact cela a-t-il eu sur votre utilisation de ces services publics ? A-t-elle été... Réduction des frais à la charge de votre entreprise
Q6.6 What impact has this had on the way you use public services? Has it made…
T39

FLASH EUROBAROMETER 343 “Public sector and company innovation”
%
EU 27
BE
BG
CZ
DK
DE
EE
IE
EL
ES
FR
IT
CY
LV
LT
LU
HU
MT
NL
AT
PL
PT
RO
SI
SK
FI
SE
UK
HR
TR
MK
IS
NO
CH
Total 'Deterioration'
Q6.6 Quel impact cela a-t-il eu sur votre utilisation de ces services publics ? A-t-elle été... Réduction des frais à la charge de votre entreprise
Q6.6 What impact has this had on the way you use public services? Has it made… Reduction in financial costs to your company
Q6.6 Wie hat sich ... darauf ausgewirkt, wie Sie öffentliche Dienstleitungen nutzen? die Kostenreduzierung für Ihr Unternehmen
Détériorée significativement
Hat eine deutliche Verschlechterung
gebrachtWN/KA Total
'Verbesserung'Total
'Verschlechterung'
NSP/SR Total Amélioration Total Détérioration
Significant deterioration DK/NA Total
'Improvement'
Flash EB343
Flash EB343
2 3 64 4
Flash EB343
Flash EB343
51 14
0 2 49 18
110
79 1
0 0 89 0
00
69 4
0 3 81 4
24
29 0
2 0 81 2
00
71 5
0 9 50 0
44
60 1
0 0 99 0
21
68 4
0 0 58 0
04
74 0
11 0 72 17
10
65 2
0 10 48 0
00
73 6
0 0 81 3
60
57 16
5 5 70 7
05
68 1
2 0 74 15
50
76 0
0 11 42 0
00
52 8
0 0 71 1
44
62 0
88 0
0 0 91 2
00
76 000
00 73 0
0 0
T40
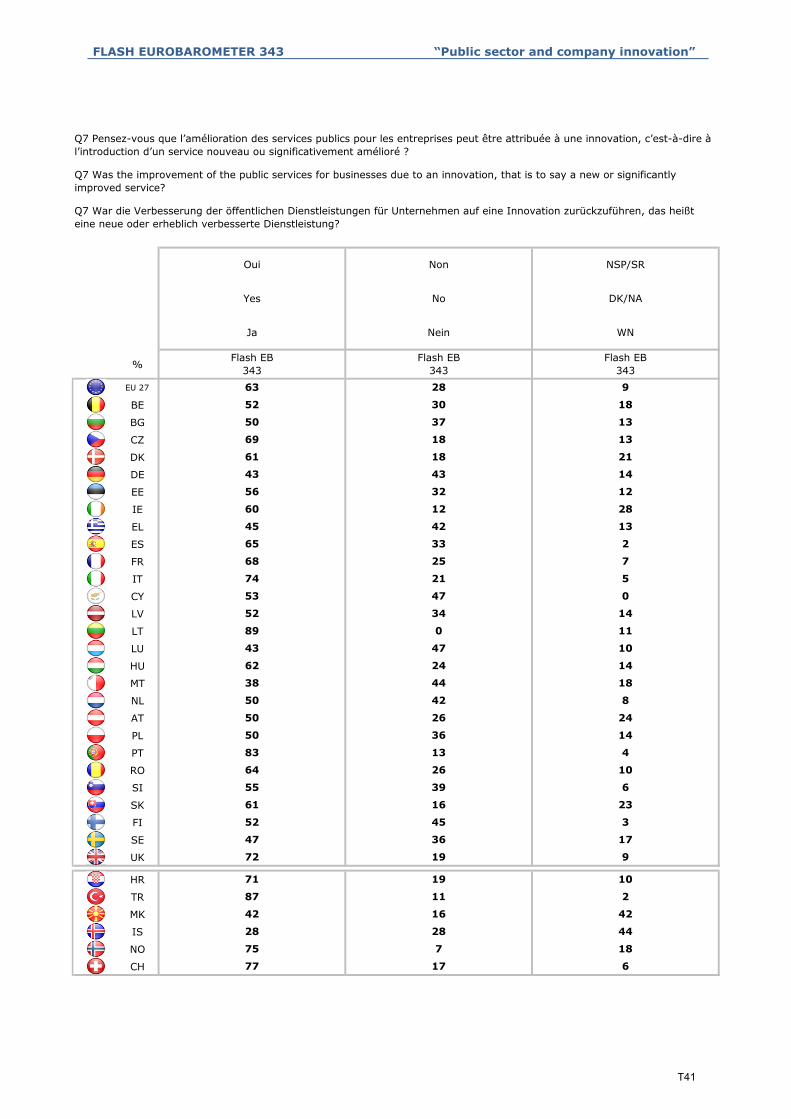
FLASH EUROBAROMETER 343 “Public sector and company innovation”
%
EU 27
BE
BG
CZ
DK
DE
EE
IE
EL
ES
FR
IT
CY
LV
LT
LU
HU
MT
NL
AT
PL
PT
RO
SI
SK
FI
SE
UK
HR
TR
MK
IS
NO
CH 77 17 6
28 28 44
75 7 18
87 11 2
42 16 42
72 19 9
71 19 10
52 45 3
47 36 17
55 39 6
61 16 23
83 13 4
64 26 10
50 26 24
50 36 14
38 44 18
50 42 8
43 47 10
62 24 14
52 34 14
89 0 11
74 21 5
53 47 0
65 33 2
68 25 7
60 12 28
45 42 13
43 43 14
56 32 12
69 18 13
61 18 21
9
52 30 18
50 37 13
63 28
Oui
Yes
Ja
Flash EB343
NSP/SR
DK/NA
WN
Flash EB343
Non
No
Nein
Flash EB343
Q7 Pensez-vous que l’amélioration des services publics pour les entreprises peut être attribuée à une innovation, c’est-à-dire à l’introduction d’un service nouveau ou significativement amélioré ?
Q7 Was the improvement of the public services for businesses due to an innovation, that is to say a new or significantly improved service?
Q7 War die Verbesserung der öffentlichen Dienstleistungen für Unternehmen auf eine Innovation zurückzuführen, das heißt eine neue oder erheblich verbesserte Dienstleistung?
T41

FLASH EUROBAROMETER 343 “Public sector and company innovation”
%
EU 27
BE
BG
CZ
DK
DE
EE
IE
EL
ES
FR
IT
CY
LV
LT
LU
HU
MT
NL
AT
PL
PT
RO
SI
SK
FI
SE
UK
HR
TR
MK
IS
NO
CH
10 44 39 0
7 74 18 1
58 31 11 0
14 58 14 14
14 81 5 0
38 56 4 2
12 62 25 1
9 67 13 7
13 69 16 2
15 77 7 0
9 64 27 0
19 69 1 11
4 78 18 0
22 58 17 0
11 69 20 0
22 55 22 0
8 64 28 0
44 22 4 1
29 65 6 0
29 40 30 0
17 83 0 0
27 66 7 0
9 68 20 0
17 66 15 0
20 72 8 0
30 60 8 0
44 55 0 0
32 59 8 0
20 77 3 0
12 64 18 0
18 67 15 0
0 93 7 0
15 67 15 1
7 57 31 5
No impact
Keine Auswirkungen
Flash EB343
Impact plutôt négatif
Rather negative impact
Eher negative Auswirkungen
Flash EB343
Q8.1 Quel impact ont eu les innovations dans les services publics sur votre entreprise en termes de … ?
Un impact très positif Pas d’impact
Very positive impact
Sehr positive Auswirkungen
Flash EB343
Impact plutôt positif
Rather positive impact
Eher positive Auswirkungen
Flash EB343
Q8.1 Welche Auswirkungen haben Innovationen im Bereich öffentlicher Dienstleistungen auf Ihr Unternehmen gehabt, wenn es um Folgendes geht? Die von Ihrem Unternehmen aufgewendete Zeit
Temps passé par votre entreprise
Time spent by your companyQ8.1 What impact have innovations in public services had on your business in terms of…?
T42
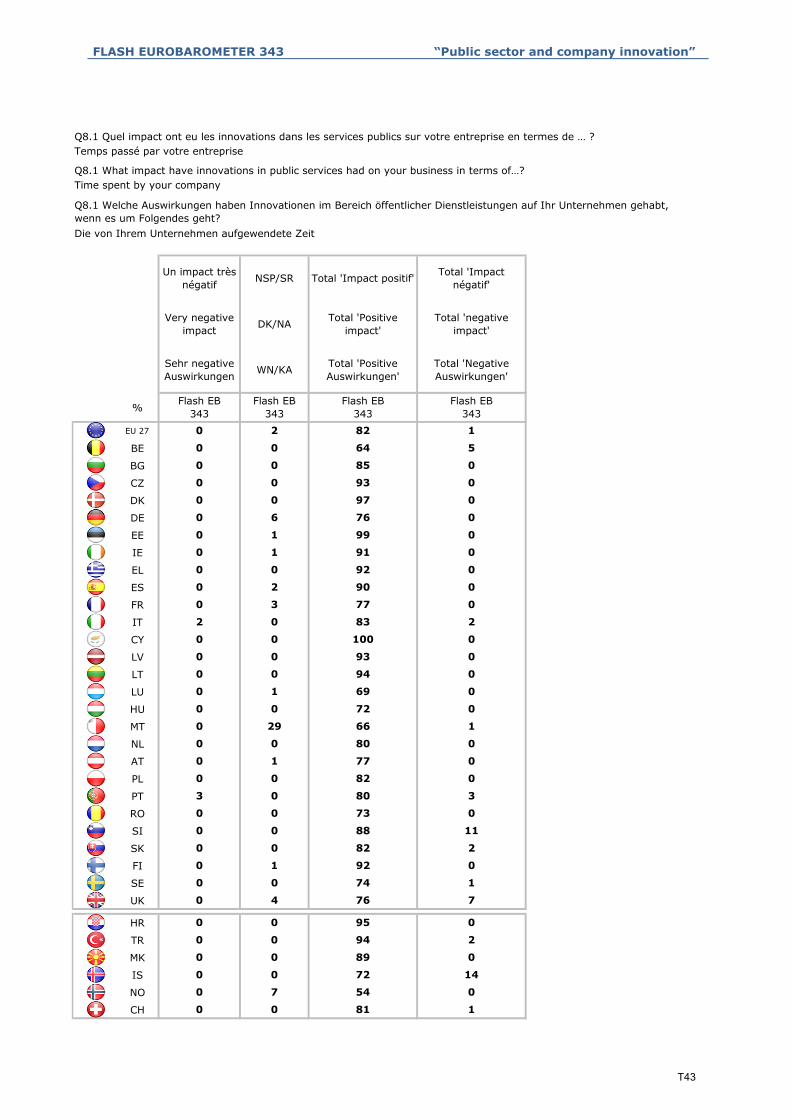
FLASH EUROBAROMETER 343 “Public sector and company innovation”
%
EU 27
BE
BG
CZ
DK
DE
EE
IE
EL
ES
FR
IT
CY
LV
LT
LU
HU
MT
NL
AT
PL
PT
RO
SI
SK
FI
SE
UK
HR
TR
MK
IS
NO
CH
Temps passé par votre entreprise
Time spent by your company
Total 'Positive impact'
Die von Ihrem Unternehmen aufgewendete Zeit
Un impact très négatif
Total 'negative impact'
Sehr negative Auswirkungen WN/KA Total 'Positive
Auswirkungen'Total 'Negative Auswirkungen'
NSP/SR Total 'Impact positif' Total 'Impact négatif'
Very negative impact DK/NA
Flash EB343
Flash EB343
0 2 82 1
Flash EB343
Flash EB343
64 5
0 0 85 0
0 0
93 0
0 0 97 0
0 0
76 0
0 1 99 0
0 6
91 0
0 0 92 0
0 1
90 0
0 3 77 0
0 2
83 2
0 0 100 0
2 0
93 0
0 0 94 0
0 0
69 0
0 0 72 0
0 1
66 1
0 0 80 0
0 29
77 0
0 0 82 0
0 1
80 3
0 0 73 0
3 0
88 11
0 0 82 2
0 0
4
92 0
0 0 74 1
0 1
0
0 0
76 7
0 0 95 0
0
7 54 0
0 0
94 2
0 0 89
Q8.1 Welche Auswirkungen haben Innovationen im Bereich öffentlicher Dienstleistungen auf Ihr Unternehmen gehabt, wenn es um Folgendes geht?
81 1
Q8.1 What impact have innovations in public services had on your business in terms of…?
Q8.1 Quel impact ont eu les innovations dans les services publics sur votre entreprise en termes de … ?
0 0
72 14
0
T43

FLASH EUROBAROMETER 343 “Public sector and company innovation”
%
EU 27
BE
BG
CZ
DK
DE
EE
IE
EL
ES
FR
IT
CY
LV
LT
LU
HU
MT
NL
AT
PL
PT
RO
SI
SK
FI
SE
UK
HR
TR
MK
IS
NO
CH
Q8.2 Quel impact ont eu les innovations dans les services publics sur votre entreprise en termes de … ?
Q8.2 Welche Auswirkungen haben Innovationen im Bereich öffentlicher Dienstleistungen auf Ihr Unternehmen gehabt, wenn es um Folgendes geht?
5 77 17 1
8 46 39 0
14 57 29 0
3 0
35 59 6 0
28 65
19 71 10 0
13 60 13 5
7 0
38 51 11 0
17 74
9 70 21 0
4 67 12 10
24 3
10 65 24 1
14 57
3 83 14 0
27 49 22 0
6 1
11 58 31 0
61 31
15 64 21 0
31 37 31 0
13 1
39 44 17 0
16 70
17 71 0 0
7 66 21 0
16 2
7 56 35 0
32 47
4 63 33 0
42 51 7 0
23 0
44 48 5 0
0
20 57
29 52 19 0
1
2 72 26 0
25 0
18 62 18
Flash EB343
Impact plutôt négatif
Rather negative impact
Eher negative Auswirkungen
Flash EB343
1 74
13 60 23
Q8.2 What impact have innovations in public services had on your business in terms of…?
Very positive impact
Sehr positive Auswirkungen
Flash EB343
Impact plutôt positif
Rather positive impact
Eher positive Auswirkungen
Flash EB343
No impact
Keine Auswirkungen
Qualité des informations et des conseils obtenus
Un impact très positif Pas d’impact
Die Qualität der bereitgestellten Informationen und Beratung
Quality of the information and advice provided
T44
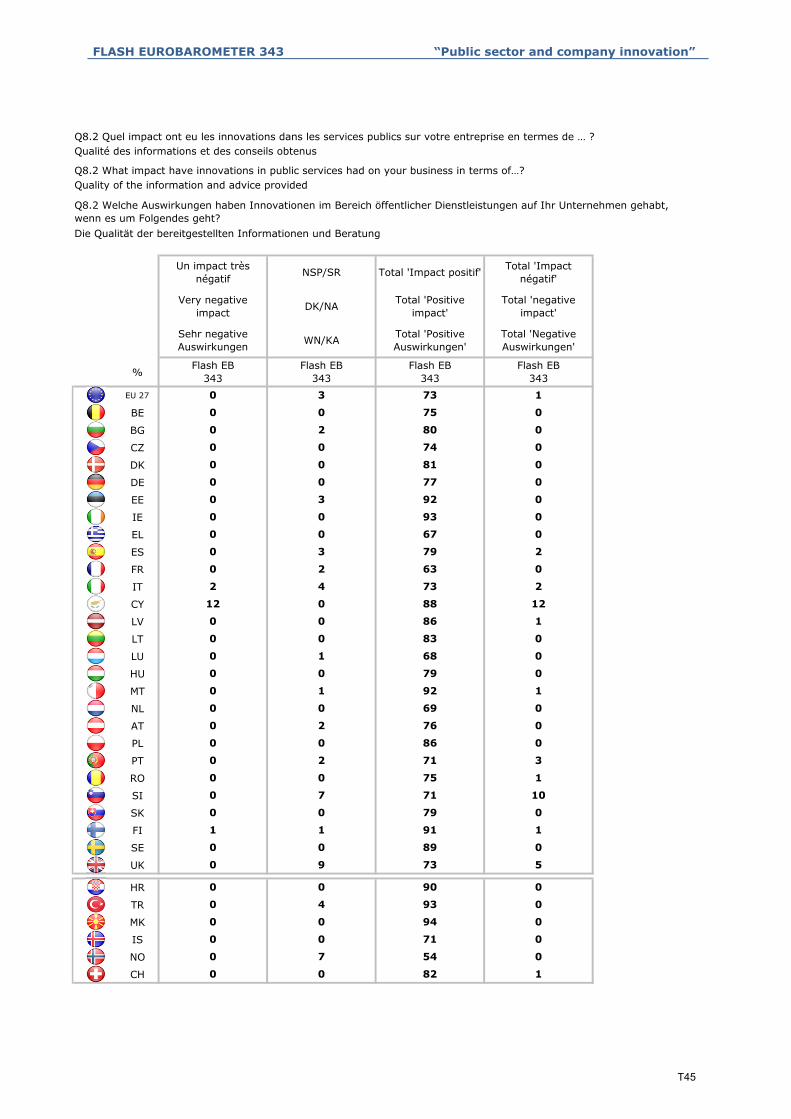
FLASH EUROBAROMETER 343 “Public sector and company innovation”
%
EU 27
BE
BG
CZ
DK
DE
EE
IE
EL
ES
FR
IT
CY
LV
LT
LU
HU
MT
NL
AT
PL
PT
RO
SI
SK
FI
SE
UK
HR
TR
MK
IS
NO
CH
Quality of the information and advice providedQ8.2 What impact have innovations in public services had on your business in terms of…?
Qualité des informations et des conseils obtenusQ8.2 Quel impact ont eu les innovations dans les services publics sur votre entreprise en termes de … ?
Total 'Negative Auswirkungen'
Un impact très négatif NSP/SR Total 'Impact positif'
Die Qualität der bereitgestellten Informationen und Beratung
Q8.2 Welche Auswirkungen haben Innovationen im Bereich öffentlicher Dienstleistungen auf Ihr Unternehmen gehabt, wenn es um Folgendes geht?
Very negative impact DK/NA Total 'Positive
impact'
Flash EB343
Flash EB343
Sehr negative Auswirkungen WN/KA
0 3
Total 'Positive Auswirkungen'
Flash EB343
73
0 0 75
0 74
0 2
0 0
80
0
81
0 0 77
0 93
0 3
0 0
92
0
67
0 3 79
4 73
0 2
12 0
63
2
88
0 0 86
1 68
0 0
0 0
83
0
79
0 1 92
2 76
0 0
0 0
69
0
86
0 2 71
7 71
0 0
0 0
75
0
79
1 1 91
9 73
0 0
0 0
89
0
90
0 4 93
0 71
0 0
0 7
94
0
54
0 0 82
Total 'Impact négatif'
Total 'negative impact'
Flash EB3431
0
0
0
0
0
0
0
0
2
0
2
12
1
0
0
0
1
0
0
0
3
1
10
0
1
0
5
0
0
0
0
0
1
T45

FLASH EUROBAROMETER 343 “Public sector and company innovation”
%
EU 27
BE
BG
CZ
DK
DE
EE
IE
EL
ES
FR
IT
CY
LV
LT
LU
HU
MT
NL
AT
PL
PT
RO
SI
SK
FI
SE
UK
HR
TR
MK
IS
NO
CH 5 44 32 1
17 34 21 0
15 15 37 14
58 35 7 0
25 65 9 0
10 40 36 4
12 44 24 11
22 31 26 12
6 66 9 6
2 60 27 7
2 65 29 1
8 59 26 1
12 71 17 0
0 68 25 2
13 68 17 0
10 55 31 0
71 24 4 1
0 62 23 8
9 65 3 22
26 43 21 10
6 58 34 0
39 48 13 0
4 74 9 6
4 66 28 0
21 61 10 1
8 56 21 8
42 26 15 0
44 37 6 0
10 62 13 0
11 43 28 0
2 59 39 0
9 54 18 19
1 41 52 6
9 62 20 3
Flash EB343
Impact plutôt négatif
Rather negative impact
Eher negative Auswirkungen
Flash EB343
No impact
Pas d’impact
Flash EB343
Impact plutôt positif
Rather positive impact
Eher positive Auswirkungen
Flash EB343
Very positive impact
Un impact très positif
Qualité des procédures administratives
Quality of the administrative proceduresQ8.3 What impact have innovations in public services had on your business in terms of…?
Sehr positive Auswirkungen
Keine Auswirkungen
Q8.3 Quel impact ont eu les innovations dans les services publics sur votre entreprise en termes de … ?
Q8.3 Welche Auswirkungen haben Innovationen im Bereich öffentlicher Dienstleistungen auf Ihr Unternehmen gehabt, wenn es um Folgendes geht? Die Qualität der Verwaltungsverfahren
T46

FLASH EUROBAROMETER 343 “Public sector and company innovation”
%
EU 27
BE
BG
CZ
DK
DE
EE
IE
EL
ES
FR
IT
CY
LV
LT
LU
HU
MT
NL
AT
PL
PT
RO
SI
SK
FI
SE
UK
HR
TR
MK
IS
NO
CH 49 1
Q8.3 Welche Auswirkungen haben Innovationen im Bereich öffentlicher Dienstleistungen auf Ihr Unternehmen gehabt, wenn es um Folgendes geht?
Q8.3 What impact have innovations in public services had on your business in terms of…?
Q8.3 Quel impact ont eu les innovations dans les services publics sur votre entreprise en termes de … ?
0 18
30 14
0 28 51 0
0 19
90 0
0 0 93 0
0 1
56 11
0 10 50 4
0 9
72 6
0 9 53 12
0 13
67 2
4 0 62 11
1 2
83 0
0 6 67 1
0 0
81 1
5 0 68 7
1 1
95 1
0 4 65 0
0 0
74 22
0 7 62 8
0 1
64 0
0 0 69 10
0 2
78 9
0 0 87 0
3 4
82 1
0 2 70 0
0 7
68 0
0 7 64 8
0 17
72 0
0 13 81 0
0 15
61 0
0 18 54 0
0 0
42 6
0 0 63 19
0 0
Flash EB343
Flash EB343
1 5 71 4
Flash EB343
Flash EB343
Total 'negative impact'
Sehr negative Auswirkungen WN/KA Total 'Positive
Auswirkungen'Total 'Negative Auswirkungen'
NSP/SR Total 'Impact positif' Total 'Impact négatif'
Very negative impact DK/NA
Qualité des procédures administratives
Quality of the administrative procedures
Total 'Positive impact'
Die Qualität der Verwaltungsverfahren
Un impact très négatif
T47
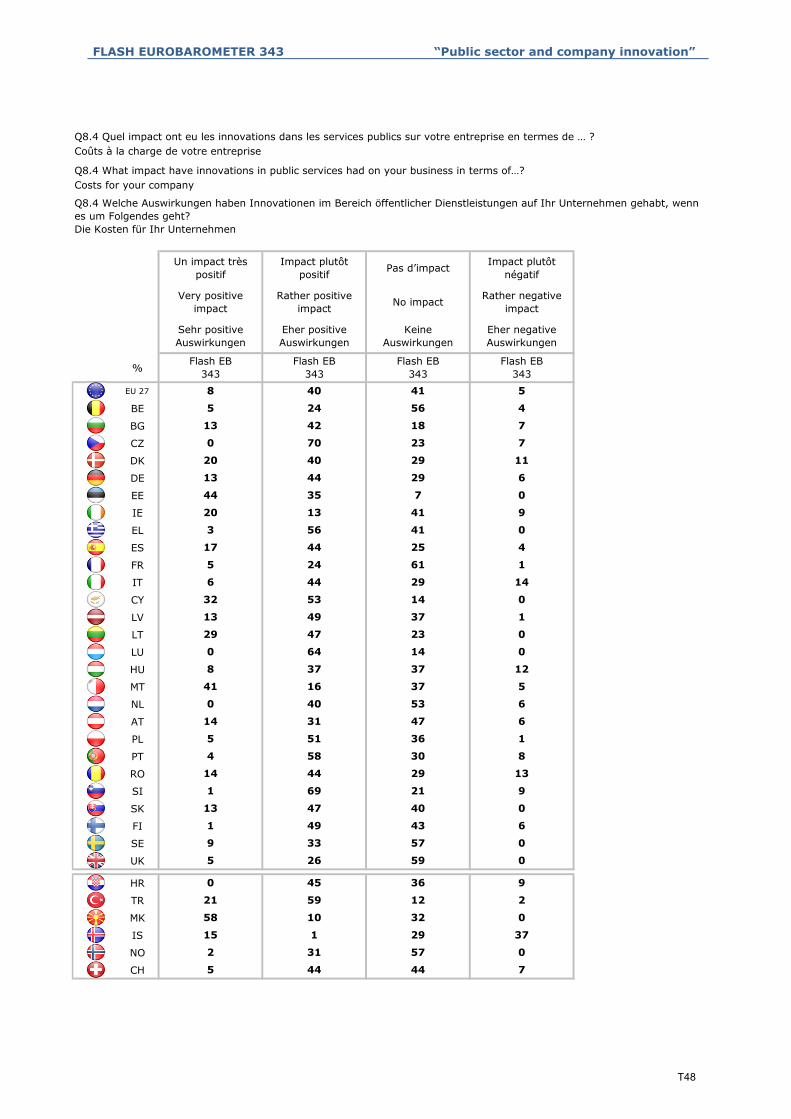
FLASH EUROBAROMETER 343 “Public sector and company innovation”
%
EU 27
BE
BG
CZ
DK
DE
EE
IE
EL
ES
FR
IT
CY
LV
LT
LU
HU
MT
NL
AT
PL
PT
RO
SI
SK
FI
SE
UK
HR
TR
MK
IS
NO
CH 5 44 44 7
2 31 57 0
15 1 29 37
58 10 32 0
21 59 12 2
0 45 36 9
5 26 59 0
9 33 57 0
1 49 43 6
13 47 40 0
1 69 21 9
14 44 29 13
4 58 30 8
5 51 36 1
14 31 47 6
0 40 53 6
41 16 37 5
8 37 37 12
0 64 14 0
29 47 23 0
13 49 37 1
32 53 14 0
6 44 29 14
5 24 61 1
17 44 25 4
3 56 41 0
20 13 41 9
44 35 7 0
13 44 29 6
20 40 29 11
0 70 23 7
13 42 18 7
5 24 56 4
8 40 41 5
Flash EB343
Impact plutôt négatif
Rather negative impact
Eher negative Auswirkungen
Flash EB343
No impact
Pas d’impact
Flash EB343
Impact plutôt positif
Rather positive impact
Eher positive Auswirkungen
Flash EB343
Very positive impact
Un impact très positif
Coûts à la charge de votre entreprise
Costs for your companyQ8.4 What impact have innovations in public services had on your business in terms of…?
Sehr positive Auswirkungen
Keine Auswirkungen
Q8.4 Quel impact ont eu les innovations dans les services publics sur votre entreprise en termes de … ?
Q8.4 Welche Auswirkungen haben Innovationen im Bereich öffentlicher Dienstleistungen auf Ihr Unternehmen gehabt, wenn es um Folgendes geht? Die Kosten für Ihr Unternehmen
T48

FLASH EUROBAROMETER 343 “Public sector and company innovation”
%
EU 27
BE
BG
CZ
DK
DE
EE
IE
EL
ES
FR
IT
CY
LV
LT
LU
HU
MT
NL
AT
PL
PT
RO
SI
SK
FI
SE
UK
HR
TR
MK
IS
NO
CH 49 7
Q8.4 Welche Auswirkungen haben Innovationen im Bereich öffentlicher Dienstleistungen auf Ihr Unternehmen gehabt, wenn es um Folgendes geht?
Q8.4 What impact have innovations in public services had on your business in terms of…?
Q8.4 Quel impact ont eu les innovations dans les services publics sur votre entreprise en termes de … ?
0 0
16 37
0 10 33 0
0 18
80 6
0 0 68 0
4 2
31 0
5 5 45 14
0 10
50 6
1 0 42 1
0 1
70 9
0 0 60 0
0 0
62 8
0 0 58 13
0 0
45 6
7 0 56 8
0 2
57 5
0 1 40 6
0 1
64 21
6 0 45 18
21 1
62 1
0 1 76 0
0 0
50 18
0 1 85 0
4 3
61 4
1 8 29 2
0 10
33 9
0 0 59 0
0 17
57 6
0 14 79 0
0 8
70 7
0 0 60 11
0 0
29 4
19 1 55 26
0 11
Flash EB343
Flash EB343
1 5 48 6
Flash EB343
Flash EB343
Total 'negative impact'
Sehr negative Auswirkungen WN Total 'Positive
Auswirkungen'Total 'Negative Auswirkungen'
NSP/SR Total 'Impact positif' Total 'Impact négatif'
Very negative impact DK/NA
Coûts à la charge de votre entreprise
Costs for your company
Total 'Positive impact'
Die Kosten für Ihr Unternehmen
Un impact très négatif
T49

FLASH EUROBAROMETER 343 “Public sector and company innovation”
%
EU 27
BE
BG
CZ
DK
DE
EE
IE
EL
ES
FR
IT
CY
LV
LT
LU
HU
MT
NL
AT
PL
PT
RO
SI
SK
FI
SE
UK
HR
TR
MK
IS
NO
CH 10 50 27 1
10 43 37 0
15 45 15 22
28 69 3 0
24 52 18 3
9 53 28 5
4 40 36 6
2 54 44 0
13 54 19 2
15 55 18 4
9 35 39 9
10 46 43 1
11 61 24 3
1 60 19 11
26 61 10 0
10 65 25 0
35 30 31 3
7 33 37 15
0 62 15 0
16 65 3 10
21 64 13 1
39 46 14 0
8 50 26 11
11 41 33 7
17 48 22 6
7 53 31 8
19 46 25 9
44 39 1 0
21 61 15 0
20 40 40 0
8 52 40 0
13 55 17 5
8 51 32 8
10 49 28 7
Flash EB343
Impact plutôt négatif
Rather negative impact
Eher negative Auswirkungen
Flash EB343
No impact
Pas d’impact
Flash EB343
Impact plutôt positif
Rather positive impact
Eher positive Auswirkungen
Flash EB343
Very positive impact
Un impact très positif
Temps de réponse de l’administration
Response time from public sectorQ8.5 What impact have innovations in public services had on your business in terms of…?
Sehr positive Auswirkungen Keine Auswirkungen
Q8.5 Quel impact ont eu les innovations dans les services publics sur votre entreprise en termes de … ?
Q8.5 Welche Auswirkungen haben Innovationen im Bereich öffentlicher Dienstleistungen auf Ihr Unternehmen gehabt, wenn es um Folgendes geht? Die Antwortzeiten des öffentlichen Dienstes
T50

FLASH EUROBAROMETER 343 “Public sector and company innovation”
%
EU 27
BE
BG
CZ
DK
DE
EE
IE
EL
ES
FR
IT
CY
LV
LT
LU
HU
MT
NL
AT
PL
PT
RO
SI
SK
FI
SE
UK
HR
TR
MK
IS
NO
CH 60 1
Q8.5 Welche Auswirkungen haben Innovationen im Bereich öffentlicher Dienstleistungen auf Ihr Unternehmen gehabt, wenn es um Folgendes geht?
Q8.5 What impact have innovations in public services had on your business in terms of…?
Q8.5 Quel impact ont eu les innovations dans les services publics sur votre entreprise en termes de … ?
0 12
60 22
0 10 53 0
0 3
76 5
0 0 97 0
2 1
44 6
0 5 62 5
0 14
67 8
0 0 56 0
6 6
44 17
1 7 70 5
8 0
72 4
0 0 56 1
1 0
87 0
0 9 61 11
0 3
65 3
0 0 75 0
0 1
62 22
0 8 40 15
22 1
85 1
0 6 81 10
0 1
58 11
0 1 85 0
0 5
65 10
0 8 52 7
4 3
65 9
1 0 60 9
0 1
82 0
0 16 83 0
0 3
60 0
0 0 60 0
0 0
59 9
9 1 68 14
1 0
Flash EB343
Flash EB343
1 5 59 8
Flash EB343
Flash EB343
Total 'negative impact'
Sehr negative Auswirkungen WN Total 'Positive
Auswirkungen'Total 'Negative Auswirkungen'
NSP/SR Total 'Impact positif'
Total 'Impact négatif'
Very negative impact DK/NA
Temps de réponse de l’administration
Response time from public sector
Total 'Positive impact'
Die Antwortzeiten des öffentlichen Dienstes
Un impact très négatif
T51
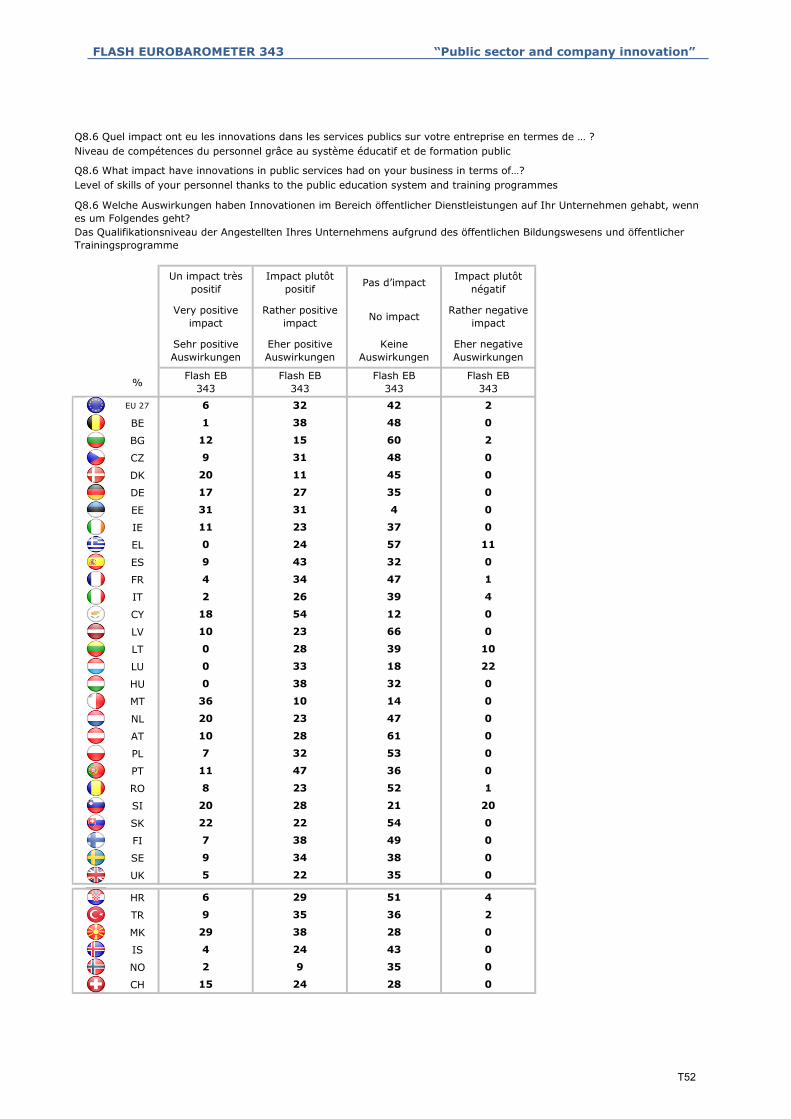
FLASH EUROBAROMETER 343 “Public sector and company innovation”
%
EU 27
BE
BG
CZ
DK
DE
EE
IE
EL
ES
FR
IT
CY
LV
LT
LU
HU
MT
NL
AT
PL
PT
RO
SI
SK
FI
SE
UK
HR
TR
MK
IS
NO
CH
Q8.6 Welche Auswirkungen haben Innovationen im Bereich öffentlicher Dienstleistungen auf Ihr Unternehmen gehabt, wenn es um Folgendes geht?
Level of skills of your personnel thanks to the public education system and training programmesQ8.6 What impact have innovations in public services had on your business in terms of…?
Niveau de compétences du personnel grâce au système éducatif et de formation public Q8.6 Quel impact ont eu les innovations dans les services publics sur votre entreprise en termes de … ?
15 24 28 0
2 9 35 0
4 24 43 0
29 38 28 0
9 35 36 2
6 29 51 4
5 22 35 0
9 34 38 0
7 38 49 0
22 22 54 0
20 28 21 20
8 23 52 1
11 47 36 0
7 32 53 0
10 28 61 0
20 23 47 0
36 10 14 0
0 38 32 0
0 33 18 22
0 28 39 10
10 23 66 0
18 54 12 0
2 26 39 4
4 34 47 1
9 43 32 0
0 24 57 11
11 23 37 0
31 31 4 0
17 27 35 0
20 11 45 0
9 31 48 0
12 15 60 2
1 38 48 0
6 32 42 2
Keine Auswirkungen
Flash EB343
Impact plutôt négatif
Rather negative impact
Eher negative Auswirkungen
Flash EB343
Sehr positive Auswirkungen
Flash EB343
Impact plutôt positif
Rather positive impact
Eher positive Auswirkungen
Flash EB343
Un impact très positif Pas d’impact
Very positive impact No impact
Das Qualifikationsniveau der Angestellten Ihres Unternehmens aufgrund des öffentlichen Bildungswesens und öffentlicher Trainingsprogramme
T52
FLASH EUROBAROMETER 343 “Public sector and company innovation”
%
EU 27
BE
BG
CZ
DK
DE
EE
IE
EL
ES
FR
IT
CY
LV
LT
LU
HU
MT
NL
AT
PL
PT
RO
SI
SK
FI
SE
UK
HR
TR
MK
IS
NO
CH 39 0
Das Qualifikationsniveau der Angestellten Ihres Unternehmens aufgrund des öffentlichen Bildungswesens und öffentlicher Trainingsprogramme
Q8.6 Welche Auswirkungen haben Innovationen im Bereich öffentlicher Dienstleistungen auf Ihr Unternehmen gehabt, wenn es um Folgendes geht?
Q8.6 Quel impact ont eu les innovations dans les services publics sur votre entreprise en termes de … ?
0 33
28 0
0 54 11 0
0 29
44 5
0 5 67 0
3 15
27 5
0 10 35 4
5 33
45 0
0 19 43 0
0 6
48 21
2 0 44 2
1 10
58 0
6 10 31 7
0 6
38 0
0 8 39 0
0 1
46 0
0 10 43 0
0 40
33 22
0 30 38 0
0 27
33 0
6 17 28 16
0 1
28 6
0 16 72 0
2 27
52 6
0 14 38 1
6 10
34 0
0 8 24 11
0 29
44 0
0 34 62 0
0 21
40 0
0 24 31 0
0 12
39 5
9 2 27 11
5 8
Flash EB343
Flash EB343
2 16 38 4
Flash EB343
Flash EB343
Total 'negative impact'
Sehr negative Auswirkungen WN Total 'Positive
Auswirkungen'Total 'Negative Auswirkungen'
NSP/SR Total 'Impact positif' Total 'Impact négatif'
Very negative impact DK/NA Total 'Positive
impact'
Un impact très négatif
Niveau de compétences du personnel grâce au système éducatif et de formation public
Q8.6 What impact have innovations in public services had on your business in terms of…? Level of skills of your personnel thanks to the public education system and training programmes
T53

FLASH EUROBAROMETER 343 “Public sector and company innovation”
%
EU 27
BE
BG
CZ
DK
DE
EE
IE
EL
ES
FR
IT
CY
LV
LT
LU
HU
MT
NL
AT
PL
PT
RO
SI
SK
FI
SE
UK
HR
TR
MK
IS
NO
CH
38 7
26 13
31
33 23 22 1 21
16 8
19 28
29
23 6 8 4 59
20 12
27 3
32
30 17 24 22 7
10 11
18 9
35
33 11 21 4 31
23 12
17 22
36
29 24 28 6 13
22 15
4 17
31
24 10 13 9 44
24 6
30 7
25
19 7 30 17 27
39 15
12 16
23
23 33 19 1 24
27 13
13 28
35
17 5 18 39 21
27 10
6 39
33
6 17 41 15 21
22 4
23 5
40
40 15 13 16 16
11 4
9 42
24
24 17 19 9 31
26 22
28 14
31
10 16 26 20 28
11 7
31 4
38
23 4 35 14 24
16 4
26 21
30
37 26 11 2 24
29 6
19 11
30
30 21 13 9 27
28
20 16 29 6 29
Die kommunale bzw. lokale Verwaltung
Flash EB343
17 6
Die EU
Flash EB343
L’Union européenne
European Union
26 16
Régional / sub-national
Regional / sub-national
Die regionale bzw. sub-nationale Verwaltung
(d.h. Bundesland)
Flash EB343
Municipal / local
Municipal / local
National
National
Die nationale Verwaltung
Flash EB343
NSP/SR
DK/NA
WN/KA
Flash EB343
Q9 D’après l’expérience de votre entreprise, quel niveau de l’administration est le plus innovant ?
Q9 Based on the experience of your company, which level of government is the most innovative?
Q9 Welche Verwaltungsebene ist nach den in Ihrem Unternehmen gemachten Erfahrungen am innovativsten?
T54

FLASH EUROBAROMETER 343 “Public sector and company innovation”
%
EU 27
BE
BG
CZ
DK
DE
EE
IE
EL
ES
FR
IT
CY
LV
LT
LU
HU
MT
NL
AT
PL
PT
RO
SI
SK
FI
SE
UK
HR
TR
MK
IS
NO
CH 7 57 365 52 26 10
43
4 44 14 8 30 48 22
1 19 28 15
1 7117 11
37 20
28
16 44 25 4 11 60 29
27 44
42
1 27 29 39 4 28 68
3 42 25 17
5 5831 6
13 45
37
6 39 15 8 32 45 23
5 53
59
5 25 36 25 9 30 61
4 29 28 31
8 4725 20
8 33
45
13 39 15 23 10 52 38
10 37
38
4 30 43 17 6 34 60
6 47 26 12
5 6210 23
9 53
33
4 44 24 13 15 48 37
15 47
19
6 44 29 10 11 50 39
11 67 7 12
6 6722 5
3 78
27
13 41 18 14 14 54 32
20 47
59
18 24 20 24 14 42 44
2 32 33 26
9 3334 24
7 34
58
5 45 27 20 3 50 47
5 28
60
2 18 32 43 5 20 75
6 27 28 32
12 4927 12
7 33
39
15 41 7 8 29 56 15
7 42
61
2 38 33 14 13 40 47
1 32 46 15
12 4923 16
6 33
39
4 28 25 32 11 32 57
5 44
Total 'Disagree'
Total 'Stimme nicht zu'
Flash EB343
5 36 30 20 9 41 50
DK/NA
WN/KA
Flash EB343
Total 'D'accord'
Total 'Agree'
Total 'Stimme zu'
Flash EB343
Tend to disagree
Lehne eher ab
Flash EB343
Pas du tout d’accord
Strongly disagree
Stimme überhaupt nicht zuFlash EB
343
Strongly agree
Stimme voll und ganz zu
Flash EB343
Plutôt d’accord
Tend to agree
Stimme eher zu
Flash EB343
Tout à fait d’accord
Plutôt pas d’accord NSP/SR Total 'Pas
d'accord'
Q10.1 Inwieweit stimmen Sie den folgenden Aussagen zu oder nicht zu? Alles in allem leistet die öffentliche Verwaltung gute Arbeit bei der Schaffung der richtigen Bedingungen für Ihr Unternehmen, um Innovationen einzuführen
Q10.1 Dans quelle mesure êtes-vous d’accord ou pas d’accord avec les affirmations suivantes : De façon générale, les services publics font du bon travail pour créer les conditions adéquates pour que votre entreprise puisse innover
Q10.1 To what extent do you agree or disagree with the following statements: Overall, the public services are doing a good job in creating the right conditions for your company to innovate
T55

FLASH EUROBAROMETER 343 “Public sector and company innovation”
%
EU 27
BE
BG
CZ
DK
DE
EE
IE
EL
ES
FR
IT
CY
LV
LT
LU
HU
MT
NL
AT
PL
PT
RO
SI
SK
FI
SE
UK
HR
TR
MK
IS
NO
CH 12 34 547 27 40 14
56
2 20 28 16 34 22 44
1 12 30 26
3 6418 15
31 13
33
9 44 20 4 23 53 24
22 42
44
3 25 25 38 9 28 63
2 32 27 17
7 3048 15
22 34
63
8 27 18 18 29 35 36
0 30
68
3 19 37 29 12 22 66
0 17 33 35
7 2922 42
15 17
64
12 32 17 30 9 44 47
8 21
52
3 25 35 33 4 28 68
3 32 39 13
25 5015 10
13 35
25
7 33 29 22 9 40 51
9 41
27
4 37 27 20 12 41 47
8 58 15 12
13 4131 15
7 66
46
14 30 21 28 7 44 49
5 36
72
14 15 17 38 16 29 55
1 21 32 40
8 2638 28
6 22
66
2 23 32 35 8 25 67
3 23
56
2 12 21 62 3 14 83
4 26 26 30
17 2735 21
14 30
56
7 27 8 8 50 34 16
3 24
79
3 11 38 38 10 14 76
1 14 48 31
10 3332 25
6 15
57
4 20 28 37 11 24 65
3 30
Total 'Disagree'
Total 'Stimme nicht zu'
Flash EB343
3 24 32 31 10 27 63
DK/NA
WN/KA
Flash EB343
Total 'D'accord'
Total 'Agree'
Total 'Stimme zu'
Flash EB343
Tend to disagree
Lehne eher ab
Flash EB343
Pas du tout d’accord
Strongly disagree
Stimme überhaupt nicht zuFlash EB
343
Strongly agree
Stimme voll und ganz zu
Flash EB343
Plutôt d’accord
Tend to agree
Stimme eher zu
Flash EB343
Tout à fait d’accord
Plutôt pas d’accord NSP/SR Total 'Pas
d'accord'
Q10.2 Inwieweit stimmen Sie den folgenden Aussagen zu oder nicht zu?
Das behördliche und finanzwirtschaftliche System unterstützt die Fähigkeit Ihres Unternehmens, Innovationen einzuführen
Q10.2 Dans quelle mesure êtes-vous d’accord ou pas d’accord avec les affirmations suivantes : Le système fiscal et réglementaire soutient les capacités de votre entreprise à innover
Q10.2 To what extent do you agree or disagree with the following statements: The regulatory and fiscal system promotes the ability of your company to innovate
T56
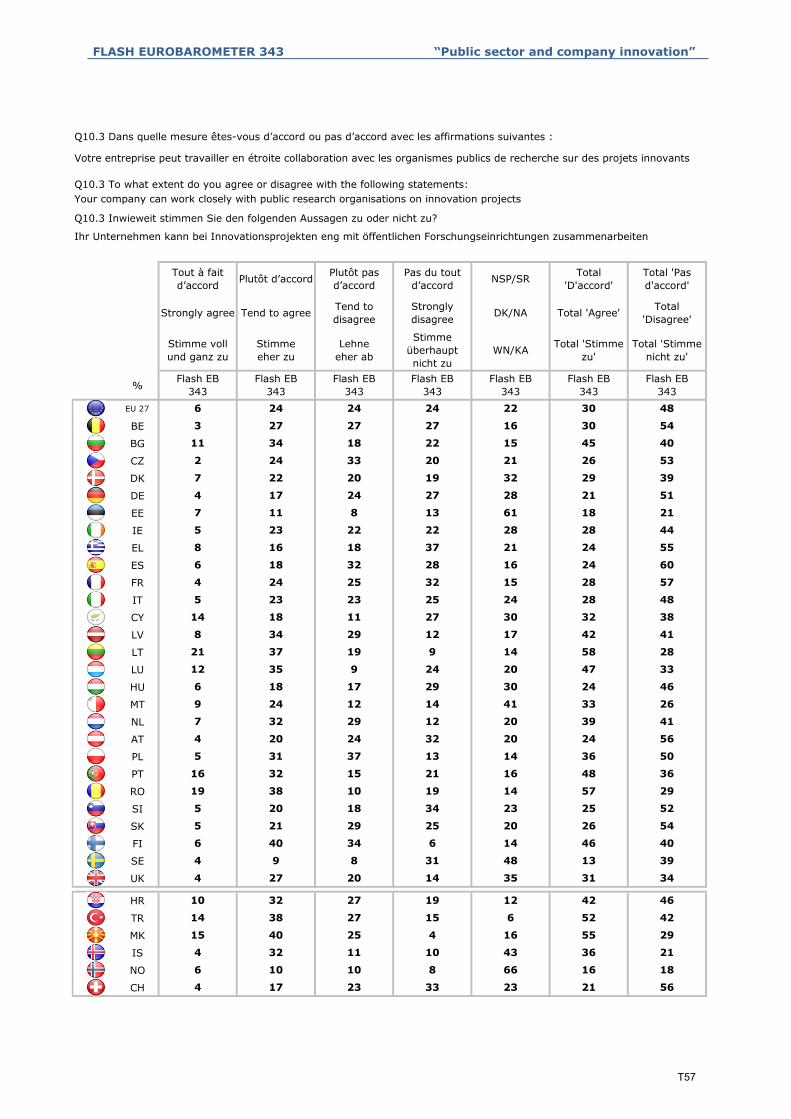
FLASH EUROBAROMETER 343 “Public sector and company innovation”
%
EU 27
BE
BG
CZ
DK
DE
EE
IE
EL
ES
FR
IT
CY
LV
LT
LU
HU
MT
NL
AT
PL
PT
RO
SI
SK
FI
SE
UK
HR
TR
MK
IS
NO
CH 23 21 564 17 23 33
21
6 10 10 8 66 16 18
4 32 11 10
6 5227 15
43 36
42
15 40 25 4 16 55 29
14 38
34
10 32 27 19 12 42 46
4 27 20 14
14 4634 6
35 31
40
4 9 8 31 48 13 39
6 40
52
5 21 29 25 20 26 54
5 20 18 34
16 4815 21
23 25
36
19 38 10 19 14 57 29
16 32
56
5 31 37 13 14 36 50
4 20 24 32
41 3312 14
20 24
26
7 32 29 12 20 39 41
9 24
33
6 18 17 29 30 24 46
12 35 9 24
17 4229 12
20 47
41
21 37 19 9 14 58 28
8 34
48
14 18 11 27 30 32 38
5 23 23 25
16 2432 28
24 28
60
4 24 25 32 15 28 57
6 18
44
8 16 18 37 21 24 55
5 23 22 22
28 2124 27
28 28
51
7 11 8 13 61 18 21
4 17
53
7 22 20 19 32 29 39
2 24 33 20
16 3027 27
21 26
54
11 34 18 22 15 45 40
3 27
Total 'Disagree'
Total 'Stimme nicht zu'
Flash EB343
6 24 24 24 22 30 48
DK/NA
WN/KA
Flash EB343
Total 'D'accord'
Total 'Agree'
Total 'Stimme zu'
Flash EB343
Tend to disagree
Lehne eher ab
Flash EB343
Pas du tout d’accord
Strongly disagree
Stimme überhaupt nicht zuFlash EB
343
Strongly agree
Stimme voll und ganz zu
Flash EB343
Plutôt d’accord
Tend to agree
Stimme eher zu
Flash EB343
Tout à fait d’accord
Plutôt pas d’accord NSP/SR Total 'Pas
d'accord'
Q10.3 Inwieweit stimmen Sie den folgenden Aussagen zu oder nicht zu?
Ihr Unternehmen kann bei Innovationsprojekten eng mit öffentlichen Forschungseinrichtungen zusammenarbeiten
Q10.3 Dans quelle mesure êtes-vous d’accord ou pas d’accord avec les affirmations suivantes :
Votre entreprise peut travailler en étroite collaboration avec les organismes publics de recherche sur des projets innovants
Q10.3 To what extent do you agree or disagree with the following statements: Your company can work closely with public research organisations on innovation projects
T57

FLASH EUROBAROMETER 343 “Public sector and company innovation”
%
EU 27
BE
BG
CZ
DK
DE
EE
IE
EL
ES
FR
IT
CY
LV
LT
LU
HU
MT
NL
AT
PL
PT
RO
SI
SK
FI
SE
UK
HR
TR
MK
IS
NO
CH 22 43 3513 30 20 15
36
2 12 12 20 54 14 32
1 25 23 13
5 6114 20
38 26
34
17 34 30 5 14 51 35
19 42
40
9 35 14 26 16 44 40
8 27 19 21
4 5733 6
25 35
39
6 18 10 30 36 24 40
5 52
55
10 21 28 28 13 31 56
4 23 13 42
9 4922 20
18 27
42
21 34 10 21 14 55 31
19 30
51
3 27 32 23 15 30 55
13 25 23 28
39 3313 15
11 38
28
4 24 30 20 22 28 50
10 23
32
14 33 19 19 15 47 38
8 44 13 19
9 4125 25
16 52
50
11 25 28 24 12 36 52
11 30
58
19 15 18 15 33 34 33
4 21 18 40
11 3528 26
17 25
54
7 29 26 27 11 36 53
8 27
42
4 18 19 44 15 22 63
9 24 17 25
21 2927 23
25 33
50
7 15 4 19 55 22 23
8 21
55
11 27 14 19 29 38 33
4 23 31 24
16 3922 23
18 27
45
9 27 24 30 10 36 54
4 35
Total 'Disagree'
Total 'Stimme nicht zu'
Flash EB343
7 26 23 27 17 33 50
DK/NA
WN/KA
Flash EB343
Total 'D'accord'
Total 'Agree'
Total 'Stimme zu'
Flash EB343
Tend to disagree
Lehne eher ab
Flash EB343
Pas du tout d’accord
Strongly disagree
Stimme überhaupt nicht zuFlash EB
343
Strongly agree
Stimme voll und ganz zu
Flash EB343
Plutôt d’accord
Tend to agree
Stimme eher zu
Flash EB343
Tout à fait d’accord
Plutôt pas d’accord NSP/SR Total 'Pas
d'accord'
Q10.4 Inwieweit stimmen Sie den folgenden Aussagen zu oder nicht zu? Das öffentliche Bildungs- und Weiterbildungssystem hat die Angestellten Ihres Unternehmens mit den Kenntnissen und Fähigkeiten ausgestattet, die Ihr Unternehmen benötigt, um Innovationen einzuführen
Q10.4 Dans quelle mesure êtes-vous d’accord ou pas d’accord avec les affirmations suivantes : Le système éducatif et de formation public donne à votre personnel les connaissances et compétences dont votre entreprise a besoin pour innover
Q10.4 To what extent do you agree or disagree with the following statements: The public education and training system has equipped your staff with the knowledge and skills your company needs to innovate
T58

FLASH EUROBAROMETER 343 “Public sector and company innovation”
%
EU 27
BE
BG
CZ
DK
DE
EE
IE
EL
ES
FR
IT
CY
LV
LT
LU
HU
MT
NL
AT
PL
PT
RO
SI
SK
FI
SE
UK
HR
TR
MK
IS
NO
CH 20 56 2411 45 15 9
36
7 22 15 5 51 29 20
1 25 27 9
5 6617 12
38 26
29
14 44 27 3 12 58 30
27 39
34
6 25 29 33 7 31 62
5 42 22 12
11 5330 6
19 47
36
12 29 9 15 35 41 24
3 50
50
7 26 29 21 17 33 50
9 29 36 14
9 4321 27
12 38
48
19 34 16 20 11 53 36
9 34
30
3 34 35 18 10 37 53
11 44 20 10
19 559 17
15 55
26
5 43 33 6 13 48 39
9 46
30
9 41 25 11 14 50 36
16 46 22 8
12 5720 11
8 62
31
15 36 24 12 13 51 36
15 42
54
21 24 10 20 25 45 30
4 24 28 26
12 2734 27
18 28
61
11 40 26 14 9 51 40
6 21
32
7 14 30 45 4 21 75
8 46 19 13
19 4524 12
14 54
36
11 26 9 8 46 37 17
13 32
52
5 24 23 10 38 29 33
4 30 41 11
16 5717 10
14 34
27
7 24 21 39 9 31 60
8 49
Total 'Disagree'
Total 'Stimme nicht zu'
Flash EB343
7 33 27 19 14 40 46
DK/NA
WN/KA
Flash EB343
Total 'D'accord'
Total 'Agree'
Total 'Stimme zu'
Flash EB343
Tend to disagree
Lehne eher ab
Flash EB343
Pas du tout d’accord
Strongly disagree
Stimme überhaupt nicht zuFlash EB
343
Strongly agree
Stimme voll und ganz zu
Flash EB343
Plutôt d’accord
Tend to agree
Stimme eher zu
Flash EB343
Tout à fait d’accord
Plutôt pas d’accord NSP/SR Total 'Pas
d'accord'
Q11.1 Inwieweit stimmen Sie den folgenden Aussagen zu oder nicht zu, wenn es um die von der öffentlichen Verwaltung gewährte Unterstützung für Ihr Unternehmen geht, innovativ zu sein? Die Bereitstellung von Informationen und Beratung ist von hoher Qualität
Q11.1 Dans quelle mesure êtes-vous d’accord ou pas avec les propositions suivantes concernant le soutien reçu par votre entreprise de la part des services publics afin d’être innovante? Les informations et conseils fournis sont de bonne qualité
Q11.1 To what extent do you agree or disagree with the following statements regarding the support your company receives from public services to be innovative? The provision of information and advice is of a high quality
T59

FLASH EUROBAROMETER 343 “Public sector and company innovation”
%
EU 27
BE
BG
CZ
DK
DE
EE
IE
EL
ES
FR
IT
CY
LV
LT
LU
HU
MT
NL
AT
PL
PT
RO
SI
SK
FI
SE
UK
HR
TR
MK
IS
NO
CH 16 66 1812 54 17 1
26
9 20 20 4 47 29 24
4 35 18 8
2 7313 12
35 39
25
19 40 27 2 12 59 29
35 38
27
9 37 29 20 5 46 49
10 45 17 10
6 5337 4
18 55
41
12 28 16 13 31 40 29
5 48
21
13 43 25 10 9 56 35
19 54 17 4
9 5422 15
6 73
37
31 36 11 12 10 67 23
12 42
24
5 40 32 14 9 45 46
19 45 18 6
11 5718 14
12 64
32
14 42 25 8 11 56 33
10 47
36
12 49 18 6 15 61 24
15 47 29 7
10 6321 6
2 62
27
18 44 21 8 9 62 29
23 40
43
25 30 14 15 16 55 29
7 37 26 17
10 4129 20
13 44
49
12 48 19 14 7 60 33
8 33
28
14 25 30 29 2 39 59
12 48 20 8
13 5822 7
12 60
29
15 31 5 5 44 46 10
19 39
44
7 31 18 10 34 38 28
11 40 35 9
9 6217 12
5 51
29
11 32 23 23 11 43 46
10 52
Total 'Disagree'
Total 'Stimme nicht zu'
Flash EB343
11 40 23 14 12 51 37
DK/NA
WN/KA
Flash EB343
Total 'D'accord'
Total 'Agree'
Total 'Stimme zu'
Flash EB343
Tend to disagree
Lehne eher ab
Flash EB343
Pas du tout d’accord
Strongly disagree
Stimme überhaupt nicht zuFlash EB
343
Strongly agree
Stimme voll und ganz zu
Flash EB343
Plutôt d’accord
Tend to agree
Stimme eher zu
Flash EB343
Tout à fait d’accord
Plutôt pas d’accord NSP/SR Total 'Pas
d'accord'
Q11.2 Inwieweit stimmen Sie den folgenden Aussagen zu oder nicht zu, wenn es um die von der öffentlichen Verwaltung gewährte Unterstützung für Ihr Unternehmen geht, innovativ zu sein? Informationen und Beratung sind leicht verfügbar
Q11.2 Dans quelle mesure êtes-vous d’accord ou pas avec les propositions suivantes concernant le soutien reçu par votre entreprise de la part des services publics afin d’être innovante? Les informations et conseils disponibles sont facilement accessibles
Q11.2 To what extent do you agree or disagree with the following statements regarding the support your company receives from public services to be innovative? The information and advice is easily available
T60

FLASH EUROBAROMETER 343 “Public sector and company innovation”
%
EU 27
BE
BG
CZ
DK
DE
EE
IE
EL
ES
FR
IT
CY
LV
LT
LU
HU
MT
NL
AT
PL
PT
RO
SI
SK
FI
SE
UK
HR
TR
MK
IS
NO
CH 33 20 473 17 30 17
51
4 6 13 11 66 10 24
0 9 29 22
4 5712 27
40 9
39
9 30 27 13 21 39 40
25 32
46
4 18 21 46 11 22 67
6 21 23 23
13 2741 19
27 27
60
4 12 15 26 43 16 41
2 25
65
3 5 27 55 10 8 82
1 20 24 41
15 2129 35
14 21
64
13 19 23 32 13 32 55
6 15
58
1 16 35 36 12 17 71
6 20 34 24
28 2426 22
16 26
48
4 22 36 19 19 26 55
2 22
43
8 20 28 18 26 28 46
5 35 21 22
13 2235 30
17 40
65
3 20 29 30 18 23 59
6 16
68
17 14 18 37 14 31 55
2 11 24 44
8 2232 38
19 13
70
4 17 30 37 12 21 67
4 18
59
6 12 29 48 5 18 77
3 21 26 33
20 1637 27
17 24
64
5 11 12 11 61 16 23
3 13
76
7 12 19 16 46 19 35
1 10 36 40
18 3223 27
13 11
50
8 17 27 38 10 25 65
4 28
Total 'Disagree'
Total 'Stimme nicht zu'
Flash EB343
4 16 29 34 17 20 63
DK/NA
WN/KA
Flash EB343
Total 'D'accord'
Total 'Agree'
Total 'Stimme zu'
Flash EB343
Tend to disagree
Lehne eher ab
Flash EB343
Pas du tout d’accord
Strongly disagree
Stimme überhaupt nicht zuFlash EB
343
Strongly agree
Stimme voll und ganz zu
Flash EB343
Plutôt d’accord
Tend to agree
Stimme eher zu
Flash EB343
Tout à fait d’accord
Plutôt pas d’accord NSP/SR Total 'Pas
d'accord'
Q11.3 Inwieweit stimmen Sie den folgenden Aussagen zu oder nicht zu, wenn es um die von der öffentlichen Verwaltung gewährte Unterstützung für Ihr Unternehmen geht, innovativ zu sein? Die Verfahren zur Inanspruchnahme finanzieller Unterstützung (z.B. Zuschüsse, Steuererleichterungen) sind einfach zu handhaben
Q11.3 Dans quelle mesure êtes-vous d’accord ou pas avec les propositions suivantes concernant le soutien reçu par votre entreprise de la part des services publics afin d’être innovante? Les procédures pour obtenir un soutien financier (subventions, abattements fiscaux, etc.) sont faciles à suivre
Q11.3 To what extent do you agree or disagree with the following statements regarding the support your company receives from public services to be innovative? The procedures to obtain financial support (e.g. grants, tax reliefs) are simple-to-use
T61
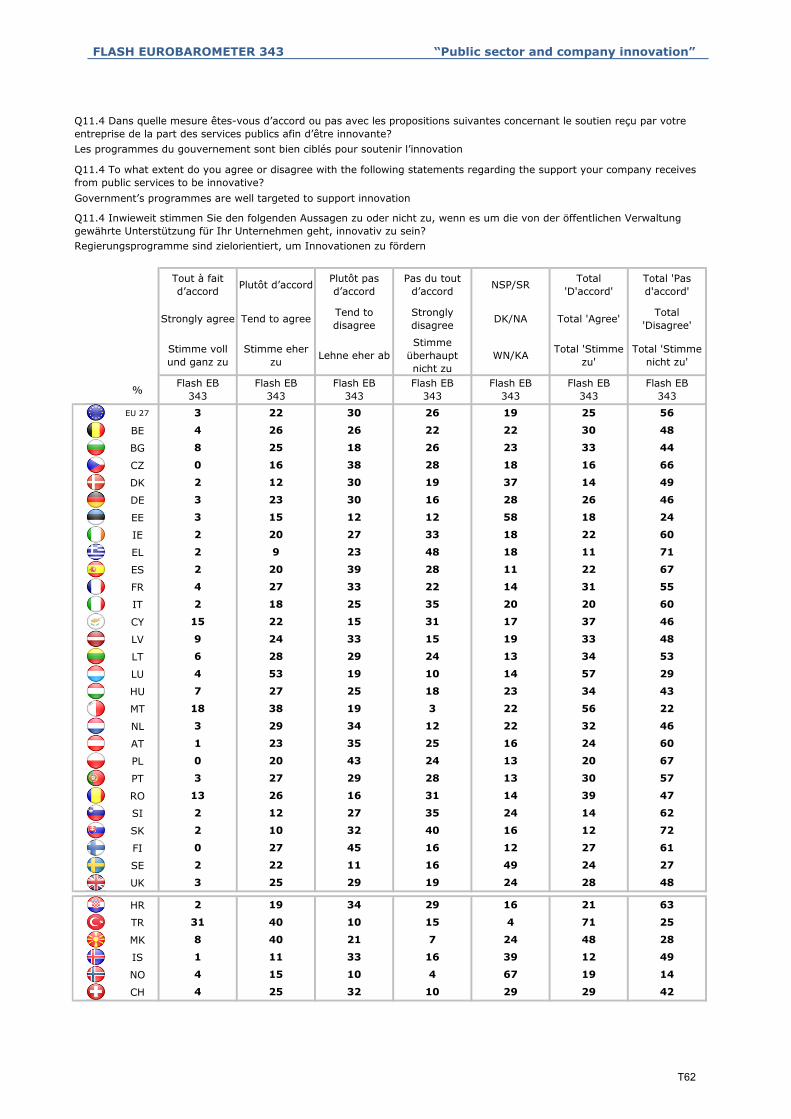
FLASH EUROBAROMETER 343 “Public sector and company innovation”
%
EU 27
BE
BG
CZ
DK
DE
EE
IE
EL
ES
FR
IT
CY
LV
LT
LU
HU
MT
NL
AT
PL
PT
RO
SI
SK
FI
SE
UK
HR
TR
MK
IS
NO
CH 29 29 424 25 32 10
49
4 15 10 4 67 19 14
1 11 33 16
4 7110 15
39 12
25
8 40 21 7 24 48 28
31 40
48
2 19 34 29 16 21 63
3 25 29 19
12 2745 16
24 28
61
2 22 11 16 49 24 27
0 27
62
2 10 32 40 16 12 72
2 12 27 35
13 3029 28
24 14
57
13 26 16 31 14 39 47
3 27
60
0 20 43 24 13 20 67
1 23 35 25
22 5619 3
16 24
22
3 29 34 12 22 32 46
18 38
29
7 27 25 18 23 34 43
4 53 19 10
19 3333 15
14 57
48
6 28 29 24 13 34 53
9 24
60
15 22 15 31 17 37 46
2 18 25 35
11 2239 28
20 20
67
4 27 33 22 14 31 55
2 20
60
2 9 23 48 18 11 71
2 20 27 33
28 2630 16
18 22
46
3 15 12 12 58 18 24
3 23
66
2 12 30 19 37 14 49
0 16 38 28
22 3026 22
18 16
48
8 25 18 26 23 33 44
4 26
Total 'Disagree'
Total 'Stimme nicht zu'
Flash EB343
3 22 30 26 19 25 56
DK/NA
WN/KA
Flash EB343
Total 'D'accord'
Total 'Agree'
Total 'Stimme zu'
Flash EB343
Tend to disagree
Lehne eher ab
Flash EB343
Pas du tout d’accord
Strongly disagree
Stimme überhaupt nicht zuFlash EB
343
Strongly agree
Stimme voll und ganz zu
Flash EB343
Plutôt d’accord
Tend to agree
Stimme eher zu
Flash EB343
Tout à fait d’accord
Plutôt pas d’accord NSP/SR Total 'Pas
d'accord'
Q11.4 Inwieweit stimmen Sie den folgenden Aussagen zu oder nicht zu, wenn es um die von der öffentlichen Verwaltung gewährte Unterstützung für Ihr Unternehmen geht, innovativ zu sein? Regierungsprogramme sind zielorientiert, um Innovationen zu fördern
Q11.4 Dans quelle mesure êtes-vous d’accord ou pas avec les propositions suivantes concernant le soutien reçu par votre entreprise de la part des services publics afin d’être innovante? Les programmes du gouvernement sont bien ciblés pour soutenir l’innovation
Q11.4 To what extent do you agree or disagree with the following statements regarding the support your company receives from public services to be innovative? Government’s programmes are well targeted to support innovation
T62

FLASH EUROBAROMETER 343 “Public sector and company innovation”
%
EU 27
BE
BG
CZ
DK
DE
EE
IE
EL
ES
FR
IT
CY
LV
LT
LU
HU
MT
NL
AT
PL
PT
RO
SI
SK
FI
SE
UK
HR
TR
MK
IS
NO
CH
7
38 44 9 1 8 82 10
49 29 2 5
15 7510 0
15 78
10
38 39 3 1 19 77 4
47 28
5
62 24 5 7 2 86 12
65 27 3 2
24 684 4
3 92
8
55 32 6 2 5 87 8
42 26
12
40 49 6 2 3 89 8
59 23 9 3
5 901 4
6 82
5
82 9 3 3 3 91 6
72 18
14
62 28 3 3 4 90 6
52 32 11 3
6 848 2
2 84
10
49 37 7 3 4 86 10
46 38
6
71 19 6 0 4 90 6
59 28 3 3
4 849 3
7 87
12
26 51 10 7 6 77 17
57 27
0
57 36 4 3 0 93 7
74 20 0 0
3 858 4
6 94
12
68 23 5 2 2 91 7
37 48
3
75 19 3 2 1 94 5
90 7 2 1
11 806 3
0 97
9
65 23 3 4 5 88 7
38 42
9
53 32 5 3 7 85 8
55 23 7 2
2 951 2
13 78
3
57 29 9 2 3 86 11
81 14
4 87 9
43 37 10 5 5 80 15
58 29 6 3
Total 'Pas d'accord'
Total 'Disagree'
Total 'Stimme nicht zu'
Flash EB343
Total 'D'accord'
Total 'Agree'
Total 'Stimme zu'
Flash EB343
NSP/SR
DK/NA
WN
Flash EB343
Pas du tout d’accord
Strongly disagree
Stimme überhaupt nicht zuFlash EB
343
Plutôt pas d’accord
Tend to disagree
Lehne eher ab
Flash EB343
Plutôt d’accord
Tend to agree
Stimme eher zu
Flash EB343
Tout à fait d’accord
Strongly agree
Stimme voll und ganz zu
Flash EB343
Q12 Dans quelle mesure êtes-vous d’accord ou pas avec la proposition selon laquelle les services publics devraient accroitre leurs efforts pour être plus innovants afin de mieux répondre aux besoins des entreprises ?
Q12 To what extent do you agree or not with the statement that the public services must increase their efforts to become more innovative in order to better match businesses' needs?
Q12 Inwieweit stimmen Sie der Aussage zu oder nicht zu, dass die öffentliche Verwaltung mehr Anstrengungen unternehmen muss, um innovativer zu werden und dadurch dem Bedarf der Unternehmen besser gerecht zu werden?
T63

FLASH EUROBAROMETER 343 “Public sector and company innovation”
%
EU 27
BE
BG
CZ
DK
DE
EE
IE
EL
ES
FR
IT
CY
LV
LT
LU
HU
MT
NL
AT
PL
PT
RO
SI
SK
FI
SE
UK
HR
TR
MK
IS
NO
CH 31 36
32 19
24 16
7
19 11
23 22
11 16
15
15 12
23 25
17 31
21 21
11 11
16 13
19 15
15 14
10 10
21 15
15 9
12 8
20 19
26 11
28 2
11 5
16 11
10 15
24 24
15 20
16 6
19 17
21 12
18 23
11 17
14 16
14 13
Submitted at least one tender for a public procurement without success
für zumindest eine öffentliche Ausschreibung ein Angebot ohne Erfolg
abgegebenFlash EB
343
Remporté au moins un contrat de marché public
Won at least one public procurement contract
zumindest eine öffentliche Ausschreibung gewonnen
Flash EB343
Soumis au moins une offre dans le cadre d’un appel d’offre public, sans
succès
Q13 Der Begriff "öffentliche Auftragsvergabe" beschreibt den Einkauf von Waren, Dienstleistungen und öffentlichen Arbeiten durch Verwaltungen und öffentliche Körperschaften. Seit Januar 2009 hat Ihr Unternehmen... (MEHRFACHNENNUNGEN MÖGLICH)
Q13 The term “public procurement” describes the purchases of goods, services and public works by governments and public bodies. Since January 2009 has your company… (MULTIPLE ANSWERS POSSIBLE)
Q13 L’expression « passation de marchés publics » décrit l’achat ou l’acquisition de biens, de services ou de travaux publics par l’Etat ou d’autres organismes publics. Depuis janvier 2009, votre entreprise a-t-elle… (PLUSIEURS REPONSES POSSIBLES)
T64

FLASH EUROBAROMETER 343 “Public sector and company innovation”
%
EU 27
BE
BG
CZ
DK
DE
EE
IE
EL
ES
FR
IT
CY
LV
LT
LU
HU
MT
NL
AT
PL
PT
RO
SI
SK
FI
SE
UK
HR
TR
MK
IS
NO
CH 21 44 4
Q13 L’expression « passation de marchés publics » décrit l’achat ou l’acquisition de biens, de services ou de travaux publics par l’Etat ou d’autres organismes publics. Depuis janvier 2009, votre entreprise a-t-elle… (PLUSIEURS REPONSES POSSIBLES)
Q13 Der Begriff "öffentliche Auftragsvergabe" beschreibt den Einkauf von Waren, Dienstleistungen und öffentlichen Arbeiten durch Verwaltungen und öffentliche Körperschaften. Seit Januar 2009 hat Ihr Unternehmen... (MEHRFACHNENNUNGEN MÖGLICH)
Q13 The term “public procurement” describes the purchases of goods, services and public works by governments and public bodies. Since January 2009 has your company… (MULTIPLE ANSWERS POSSIBLE)
17 54 5
15 50 4
25 50 1
2 75 2
15 70 3
9 53 2
22 46 0
15 58 15
11 52 4
15 49 1
9 65 7
12 67 3
7 67 3
13 57 0
10 58 1
15 69 5
10 69 2
7 71 2
9 57 2
10 61 1
5 75 6
14 44 12
12 74 1
3 72 3
13 61 4
26 55 1
12 56 5
3 70 6
16 54 1
6 63 4
12 58 6
11 63 0
Flash EB343
Flash EB343
Flash EB343
11 67 3
Investigated opportunities to sell to governments or public bodies, but not submitted any tender None of the above DK/NA
sich informiert, welche Möglichkeiten bestehen, an Verwaltungen oder öffentliche Körperschaften zu verkaufen,
aber kein Angebot abgegebenNichts davon WN/KA
Recherché les opportunités de vente à l’Etat ou à des organismes publics mais n’a jamais participé à un appel d’offre
Aucune des affirmations proposées NSP/SR
T65
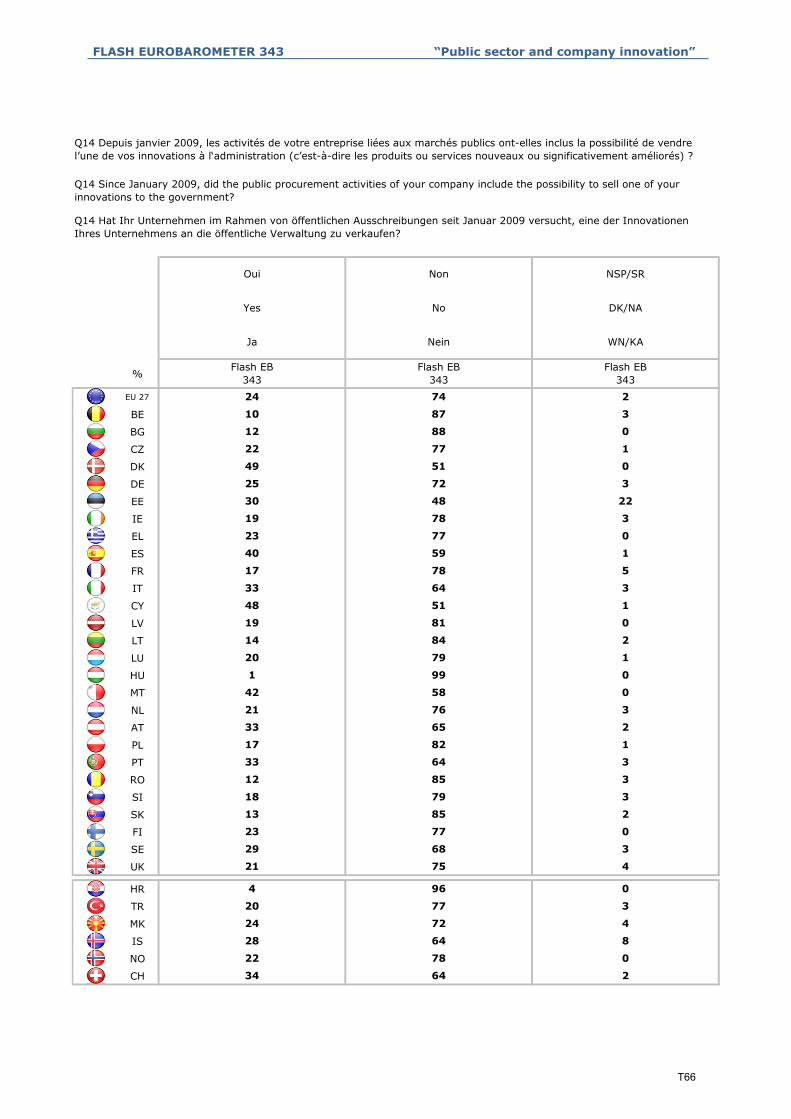
FLASH EUROBAROMETER 343 “Public sector and company innovation”
%
EU 27
BE
BG
CZ
DK
DE
EE
IE
EL
ES
FR
IT
CY
LV
LT
LU
HU
MT
NL
AT
PL
PT
RO
SI
SK
FI
SE
UK
HR
TR
MK
IS
NO
CH 34 64 2
28 64 8
22 78 0
20 77 3
24 72 4
21 75 4
4 96 0
23 77 0
29 68 3
18 79 3
13 85 2
33 64 3
12 85 3
33 65 2
17 82 1
42 58 0
21 76 3
20 79 1
1 99 0
19 81 0
14 84 2
33 64 3
48 51 1
40 59 1
17 78 5
19 78 3
23 77 0
25 72 3
30 48 22
22 77 1
49 51 0
2
10 87 3
12 88 0
24 74
Oui
Yes
Ja
Flash EB343
NSP/SR
DK/NA
WN/KA
Flash EB343
Non
No
Nein
Flash EB343
Q14 Depuis janvier 2009, les activités de votre entreprise liées aux marchés publics ont-elles inclus la possibilité de vendre l’une de vos innovations à l‘administration (c’est-à-dire les produits ou services nouveaux ou significativement améliorés) ?
Q14 Since January 2009, did the public procurement activities of your company include the possibility to sell one of your innovations to the government?
Q14 Hat Ihr Unternehmen im Rahmen von öffentlichen Ausschreibungen seit Januar 2009 versucht, eine der Innovationen Ihres Unternehmens an die öffentliche Verwaltung zu verkaufen?
T66
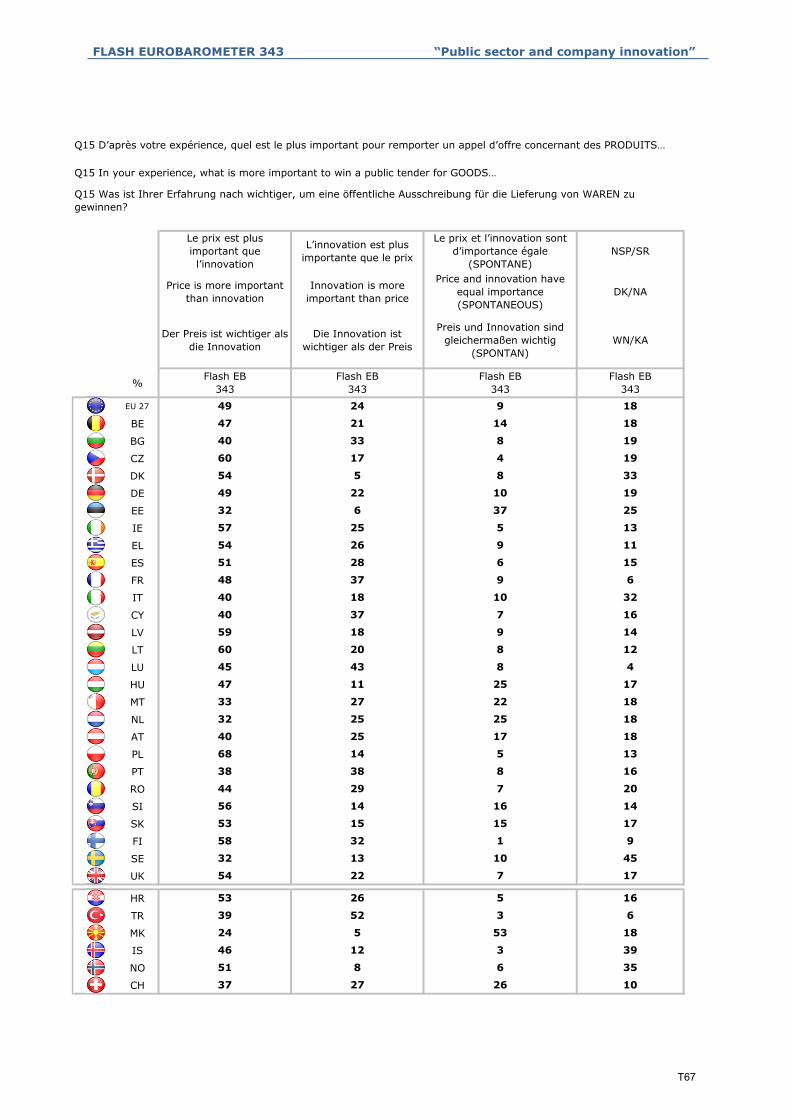
FLASH EUROBAROMETER 343 “Public sector and company innovation”
%
EU 27
BE
BG
CZ
DK
DE
EE
IE
EL
ES
FR
IT
CY
LV
LT
LU
HU
MT
NL
AT
PL
PT
RO
SI
SK
FI
SE
UK
HR
TR
MK
IS
NO
CH 37 27 26 10
51 8 6 35
46 12 3 39
24 5 53 18
39 52 3 6
53 26 5 16
54 22 7 17
32 13 10 45
58 32 1 9
53 15 15 17
56 14 16 14
44 29 7 20
38 38 8 16
68 14 5 13
40 25 17 18
32 25 25 18
33 27 22 18
47 11 25 17
45 43 8 4
60 20 8 12
59 18 9 14
40 37 7 16
40 18 10 32
48 37 9 6
51 28 6 15
54 26 9 11
57 25 5 13
32 6 37 25
49 22 10 19
54 5 8 33
60 17 4 19
40 33 8 19
47 21 14 18
49 24 9 18
NSP/SR
DK/NA
WN/KA
Flash EB343
Le prix et l’innovation sont d’importance égale
(SPONTANE)Price and innovation have
equal importance (SPONTANEOUS)
Preis und Innovation sind gleichermaßen wichtig
(SPONTAN)
Flash EB343
L’innovation est plus importante que le prix
Innovation is more important than price
Die Innovation ist wichtiger als der Preis
Flash EB343
Le prix est plus important que l’innovation
Price is more important than innovation
Der Preis ist wichtiger als die Innovation
Flash EB343
Q15 D’après votre expérience, quel est le plus important pour remporter un appel d’offre concernant des PRODUITS…
Q15 In your experience, what is more important to win a public tender for GOODS…
Q15 Was ist Ihrer Erfahrung nach wichtiger, um eine öffentliche Ausschreibung für die Lieferung von WAREN zu gewinnen?
T67
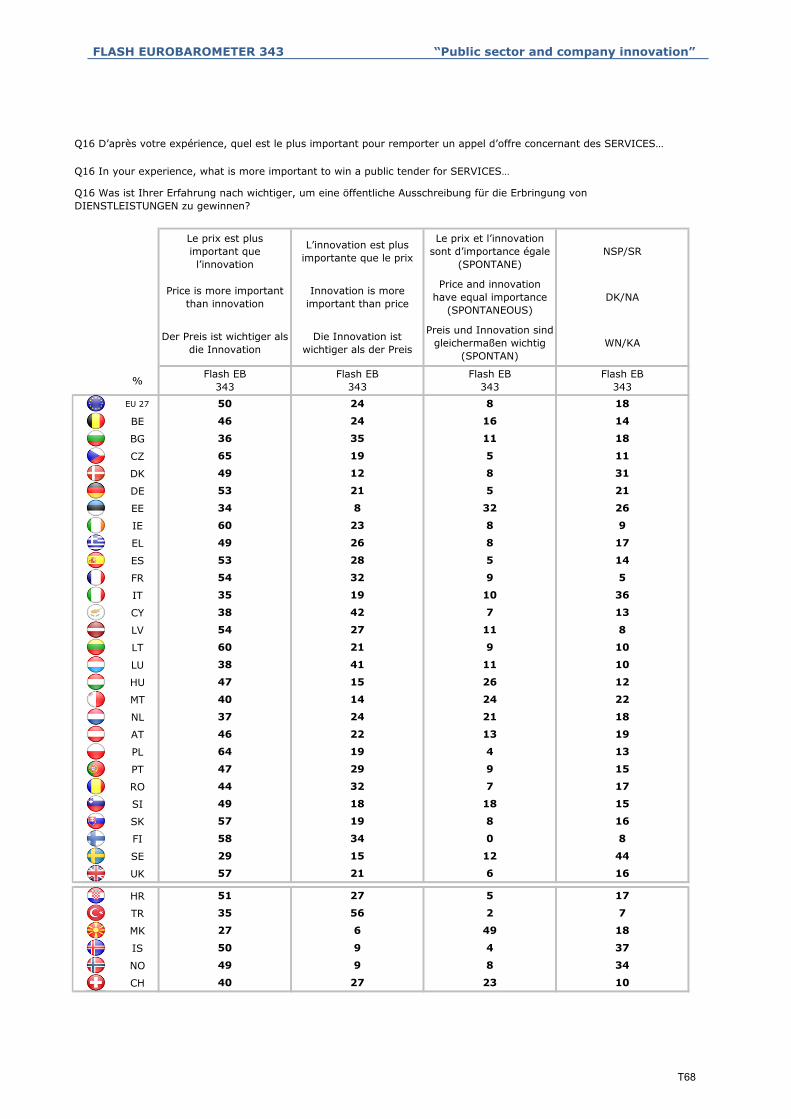
FLASH EUROBAROMETER 343 “Public sector and company innovation”
%
EU 27
BE
BG
CZ
DK
DE
EE
IE
EL
ES
FR
IT
CY
LV
LT
LU
HU
MT
NL
AT
PL
PT
RO
SI
SK
FI
SE
UK
HR
TR
MK
IS
NO
CH 40 27 23 10
49 9 8 34
50 9 4 37
27 6 49 18
35 56 2 7
51 27 5 17
57 21 6 16
29 15 12 44
58 34 0 8
57 19 8 16
49 18 18 15
44 32 7 17
47 29 9 15
64 19 4 13
46 22 13 19
37 24 21 18
40 14 24 22
47 15 26 12
38 41 11 10
60 21 9 10
54 27 11 8
38 42 7 13
35 19 10 36
54 32 9 5
53 28 5 14
49 26 8 17
60 23 8 9
34 8 32 26
53 21 5 21
49 12 8 31
65 19 5 11
36 35 11 18
46 24 16 14
50 24 8 18
NSP/SR
DK/NA
WN/KA
Flash EB343
Le prix et l’innovation sont d’importance égale
(SPONTANE)
Price and innovation have equal importance
(SPONTANEOUS)
Preis und Innovation sind gleichermaßen wichtig
(SPONTAN)
Flash EB343
L’innovation est plus importante que le prix
Innovation is more important than price
Die Innovation ist wichtiger als der Preis
Flash EB343
Le prix est plus important que l’innovation
Price is more important than innovation
Der Preis ist wichtiger als die Innovation
Flash EB343
Q16 D’après votre expérience, quel est le plus important pour remporter un appel d’offre concernant des SERVICES…
Q16 In your experience, what is more important to win a public tender for SERVICES…
Q16 Was ist Ihrer Erfahrung nach wichtiger, um eine öffentliche Ausschreibung für die Erbringung von DIENSTLEISTUNGEN zu gewinnen?
T68