Embed Size (px)
Citation preview

Part February
2021
INNOVATION FOR A POST-PANDEMIC WORLD
Discovering Pockets of Demand 17
© 2021 Information Resources Inc. (IRI). Confidential and Proprietary. 2
EXECUTIVE SUMMARY2020 changed the CPG retail landscape, most notably fueling unprecedented growth that in February 2021 remains up 10% from
year-ago levels. Years’ worth of industry transformation occurred in 2020, but what about 2021? Viewed from the consumer lens,
how should product innovation address the dramatic, home-centric way lives are lived and as we begin our journey to return to the
new normal? In this report, we discuss emerging consumer trends to guide innovation now and in the future.
Current Innovation Trends• Dramatic changes impacting new product success in 2020 include work / working out from home; shift to at-home consumption;
new approaches to leisure and holidays; changes to how we shop, especially with adoption of e-commerce; and investments made to our homes.
• Product innovation progressed at nearly a level pace in 2020, but line extensions were down.
• National and private / store brand product innovation leveraged and adapted many existing and emerging trends, including self-care and societal care, indulgence and convenience.
Innovation Opportunities• Seize areas ripe for product innovation, including home-centric work and leisure, increased consumption at home, new ways of
celebrating and new shopping behaviors.
• Innovate on the macro themes of self- and societal care, indulgence and convenience, as current trends, including plant-based, premium, and health and wellness continues in 2021. These themes will be redefined in the new normal (e.g., at-home cooking and on-the-go convenience, ease of searching and shopping).
• Be adept at detecting shifts in consumer needs and preferences, and leverage information including unconscious and unarticulated needs, in addition to search, social media and purchase data.
• Determine which preferences are must-haves using advanced analytics and algorithms from actual purchases of millions of shoppers across broad demand spaces, not just within your categories.
• Articulate product attributes so consumers understand benefits and are willing to pay the right price. Leverage trade-off models to understand which benefits matter to consumers. Communicate product origins, sustainability and societal care, as appropriate.
• Market innovation via search-friendly, shoppable recipes, and as samples in click & collect or home delivery orders as product discovery evolves in the new normal.

© 2021 Information Resources Inc. (IRI). Confidential and Proprietary. 3
Industry Leaders on the Value of Innovation
Source: *IRI C-Suite Conversations, **AP, Earnings, Calls, NRF 2021.
“…innovation is a key way that you attract [new buyers] to your brands… Retailers want to sustain growth, and they view innovation as a way to sustain growth.”
Tom McGough, EVP, Co-COOConagra Brands*
“Innovation went far beyond new products. It went inside the company to find better ways to cope with unprecedented change.”
Fabian Garcia, PresidentUnilever, North America*
“Now a lot of our innovation is going to have a higher hurdle before it gets into the market… we’re going back to some of [the] fundamentals and questioning them.”
Ram Krishnan, Global Chief Commercial OfficerPepsiCo*
“What we’re doing now is looking at the problems that need to be solved. Doing more dishes in the sink? Spray on Dawn. Need to clean your surfaces? Clean with Microban 24.”
Marc Pritchard, Chief Brand OfficerP&G** "We've seen a dramatic acceleration of food e-commerce
adoption... and we'll benefit from these changes by leveraging our digital capabilities, including significant first-party consumer interactions, to drive differential growth... We're leaning into our Bettycrocker.com and Pillsbury.com food websites to deliver recipe ideas and build consumer connections that drive growth for our brands."
Jeff Harmening, Chairman & CEOGeneral Mills**
Hershey leaned into analytics to leverage the spike in retail and e-commerce sales of Hershey Milk six-packs, resulting in 40%-50% sales increase of the product. Hershey also changed its s’mores marketing to focus on backyard themes, resulting in a 24% increase in household penetration and 36% sales growth.
Kristen Riggs, SVP & Chief Growth OfficerHershey Company**
© 2021 Information Resources Inc. (IRI). Confidential and Proprietary. 4
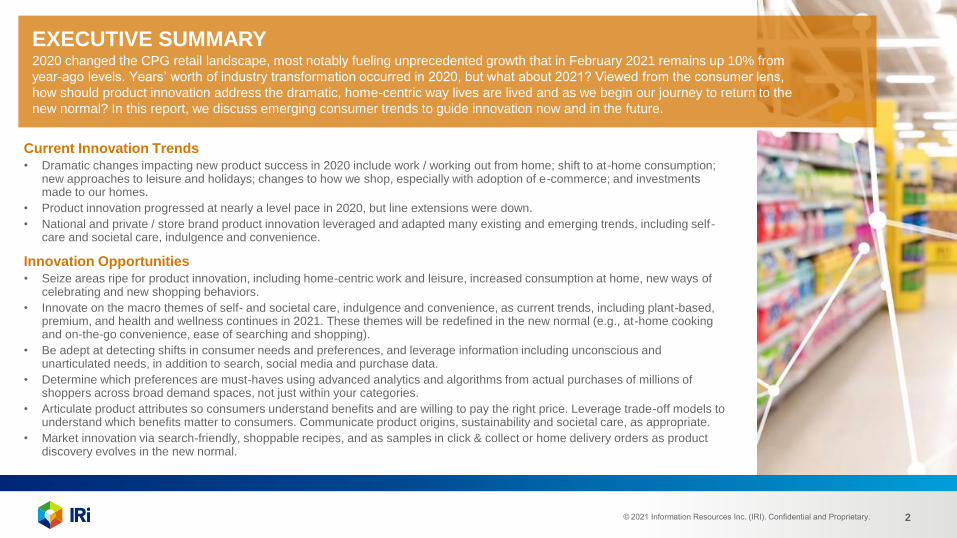
Work and Workout At Home
Physical home space changed to accommodate stay-at-home
Shopping Shifts
Increased adoption of e-commerce, fewer trips, bigger baskets, less product discovery in store
Home Upgrades, Inside & Out, Especially Digitally
Outdoor spaces, gardens, workspaces, cookery, kitchen
appliances, streaming services
Leisure & Holidays
Entertainment, holidays, and celebrations look different
Self- and Societal Care
Convenience
Indulgence
Consumer Lifestyle Shifts
Influence Innovation
Consumption Shifts
More spending at-home vs. away-from-home, increase in cleaning

© 2021 Information Resources Inc. (IRI). Confidential and Proprietary. 5
Working and Working Out at Home Means Elevated
In-Home Consumption Across Many Categories
Sales of home fitness equipment grew more than 40%
in 2020, hitting $9.5B.
Athleisure sales account for 31% of apparel spending in 2020.
Work commute trips nationally remain 30%-40% below
pre-pandemic levels.
Many who are working from home will continue to do so – at
least part of the time – post-pandemic.
“Hygienic Clean” was added to the name for Tide Power Pods.
Source: *https://www.wsj.com/articles/covid-19-pandemic-likely-improved-your-commute-to-work-11609669801, **https://www.reportlinker.com/p05948407/Home-Fitness-Equipment-Global-Market-Report-30-Covid-19-Implications-and-Growth.html?utm_source=GNW

© 2021 Information Resources Inc. (IRI). Confidential and Proprietary. 6
Consumers Upgraded Their Homes,
Inside and Out, and Especially Digitally
Source: *https://www.prnewswire.com/news-releases/pandemic-gardening-boom-boosted-2020-home--garden-pesticide-sales-301197413.html, **https://www.gobankingrates.com/money/business/streaming-wars-ended-2020/
With movie theaters closed,
streaming services saw a 37%**
increase in 2020.
Ben & Jerry's introduced a variety of Netflix Original flavors,
including Netflix & Chilll’d and Boots on
the Moooo’n ice creams, appealing to
binge watchers.
Top flavored malt beverages, which
include hard seltzers, saw dollar sales up 68% in 2020 to $6.8B across multioutlet and convenience stores.
Staycations got a lift in 2020 with upgrades to
outdoor spaces.
26%* of adults started a food garden because
of the pandemic.
Hershey’s S’mores marketing promoted
backyard fun.

© 2021 Information Resources Inc. (IRI). Confidential and Proprietary. 7
Consumption Shifts: The Kitchen Has
Regained Center Stage in the Home
Consumers were introduced and reintroduced to the kitchen during COVID-19; 53% report they’ll continue to create meals from scratch more
than pre-pandemic. The focus on the kitchen led to sales of convenient kitchen appliances, like air fryers, sous vide, coffee and cocktail makers.
Tyson launched new flavors of Instant Pot Kits.
Procter & Gamble’s Dawn dish soap
answers a need for consumers who wash dishes one at a time.
Retailers can own meal inspiration and
solutions, from meal kits to ingredient bars, even partnerships with
local restaurants.
Gelo plant-based cleaners are
biodegradable pods that are added to
water at home to make liquid hand soap.
Source: IRI Consumer Survey fielded among Primary Grocery Shoppers in the National Consumer Panel, May 1-3, 2020.

© 2021 Information Resources Inc. (IRI). Confidential and Proprietary. 8
Much of Our Entertainment Shifted to Screens, and How
We Celebrate Holidays and Special Occasions Has Changed
Parties are virtual or drive-by, and
party fixings might show up in a box.
Moët Hennessy built virtual settings for
consumers for at-home celebrations for
anniversaries, birthdays and weddings – even
mundane events.
Grocery retailers do the holiday
cooking.
Energy drinks and snack subscriptions appeal to gamers.
12 million people attended Fortnite’s
Travis Scott concert in April 2020.

© 2021 Information Resources Inc. (IRI). Confidential and Proprietary. 9
In-Store Shopping Impacted by Assortment On-Shelf
and Out-of-Stocks, Fostering Brand Switching
% Change in Average Weighted Weekly Assortment Selling vs. YA
MULOC+C % chg. vs. YA
Source: IRI POS Data. MULO+C.
Lowest Assortment
Period
-12
-10
-8
-6
-4
-2
0
2
4
6
8
10
2019
4 w
/e 1
0-0
4-2
0
4 w
/e 0
7-1
2-2
0
4 w
/e 0
4-1
9-2
0
4 w
/e 0
1-2
6-2
0
4 w
/e 0
2-2
3-2
0
4 w
/e 0
3-2
2-2
0
4 w
/e 0
5-1
7-2
0
4 w
/e 0
6-1
4-2
0
4 w
/e 0
8-0
9-2
0
4 w
/e 0
9-0
6-2
0
4 w
/e 1
1-0
1-2
0
4 w
/e 1
1-2
9-2
0
4 w
/e 1
2-2
7-2
0
Edible
Nonedible
Assortment across edible
categories is back to normal.
Nonedible assortment
declines continue, mostly
due to out-of-stock in paper
products, home care and
other general merchandise.
Lower demand categories
like cosmetics are selling
fewer unique items and are
ripe for innovation.
© 2021 Information Resources Inc. (IRI). Confidential and Proprietary. 10
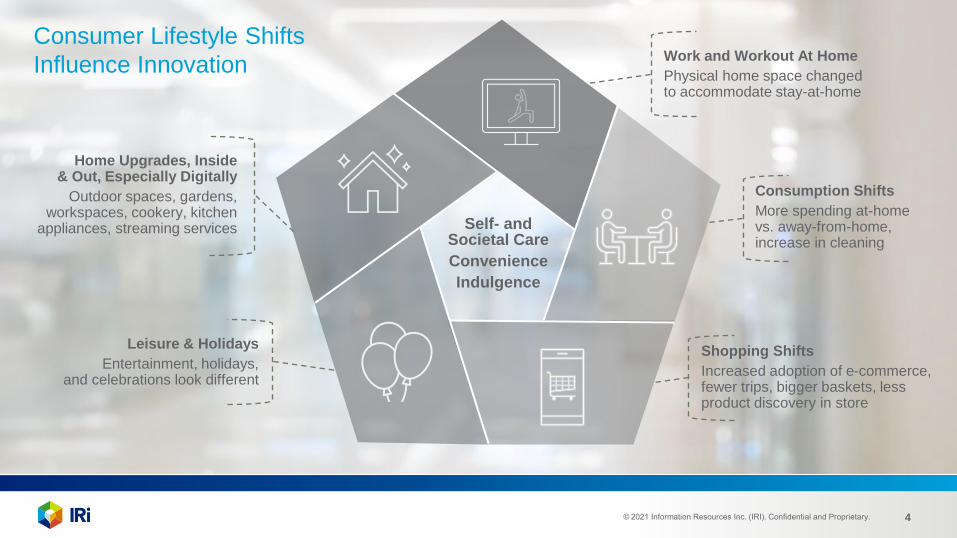
Changes in Shopping Behavior Impact New Product Discovery;
In-Store Searches Are Down, Online Searches Increase
Approach to Looking for New Products During COVID-19
% of Respondents
31
30
19
18
15
12
10
35
25
21
24
13
14
10
May 2020
January 2021
Focused on
Looking for Basics
Spending Minimal
Time in Store
Only Looking if Usual
Products Are Unavailable
Not Noticing Many
New Products in Store
Tight on Money
Avoiding Touching
Too Many Items
Hard to Find New
Products Online
Source: IRI Consumer Survey fielded among Primary Grocery Shoppers in the National Consumer Panel, May 2020. n=1,400 (food and beverage only) ; January 2021, n=2,327. Q. How has your approach to shopping for new consumer goods products -- including food and beverage, health care, beauty and personal care, home care, and pet care – changed during the COVID-19 pandemic?
-4
+5
-6

© 2021 Information Resources Inc. (IRI). Confidential and Proprietary. 11
Awareness and Search Are Key Elements in Online Shopping Experience;
Target Shoppers With Simple Language and Beneficial Attributes
In Addition to Search, Click & Collect or Home Delivery
Makes a Great New Product Sampling Platform
59% Used the search tool to type in the name of a specific item
35% Used the category menus to browse for options within a category
32% Accessed list of pre-purchased items and reordered from that list
29% Checked for sales items before making a purchase decision
12% Looked for new items to try
Source: IRI Consumer Network™ Panel Survey representing Total U.S. Primary Grocery Shoppers – 5/22 – 5/24
Shopping behaviors during last online shopping experience;
those who have shopped for groceries online in the past two months:
© 2021 Information Resources Inc. (IRI). Confidential and Proprietary. 12
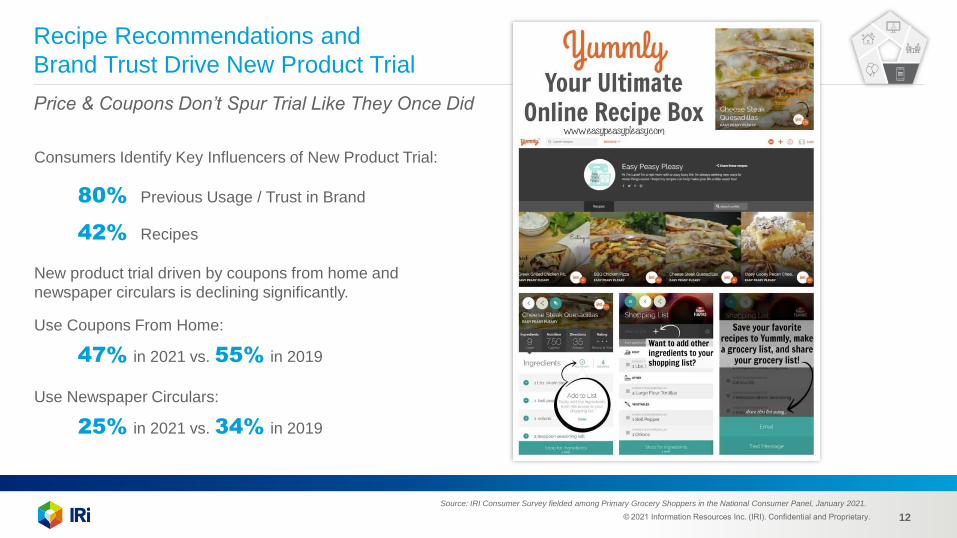
Recipe Recommendations and
Brand Trust Drive New Product Trial
Price & Coupons Don’t Spur Trial Like They Once Did
Source: IRI Consumer Survey fielded among Primary Grocery Shoppers in the National Consumer Panel, January 2021.
Consumers Identify Key Influencers of New Product Trial:
80% Previous Usage / Trust in Brand
42% Recipes
Use Coupons From Home:
47% in 2021 vs. 55% in 2019
Use Newspaper Circulars:
25% in 2021 vs. 34% in 2019
New product trial driven by coupons from home and
newspaper circulars is declining significantly.
© 2021 Information Resources Inc. (IRI). Confidential and Proprietary. 13

© 2021 Information Resources Inc. (IRI). Confidential and Proprietary. 14
2020 Saw Fewer Introductions
of New Brand Extensions
Number of New Line Extensions Launched / MULO+C
6,408
4,559
3 Year Average
(2017-2019)
2020
-29%
4,372
3,633
3 Year Average
(2017-2019)
2020
-17%
NONEDIBLEEDIBLE
Note: Considered innovations with sales >$10k at the Brand/Line extension level. Analysis does not include flavor or pack type innovations / Source: IRI POS Data. MULO+C.

© 2021 Information Resources Inc. (IRI). Confidential and Proprietary. 15
2020 %
chg. vs. YA
2020 Abs chg.
vs. YA ($B)
10.4% $88B
11.9% $16B
18.3% $13B
15.4% $16B
9.5% $14B
7.5% $29B
Out-of-Stocks Widened the Door for Smaller Manufacturers,
Who Drove as Much Market Growth as Large Players in 2020
% Share of Total Store Sales by CPG Manufacturer Size
MULO+C, 52 Weeks Ending 12/27/20
44.933.4
17.9
16.4
12.6
17.8
8.814.4
16.0 18.0
2020 Share Contribution to Growth
Share PPT Change vs. YA
Category and Manufacturer Trends
Private Label
Extra Small ($<100M)
Small ($>100M)
Medium ($>1B)
Large ($>6B)
$933B 100%
+$29B
Source: IRI POS Data MULO+C. IRI Executive Insights / Note: Large is $6B+ in L52W, Medium $1-6B, Small $100M-1B and Extra Small <$100M.
Several Small
Manufacturers
Capitalized on
COVID-19-Induced
Demand Spike

© 2021 Information Resources Inc. (IRI). Confidential and Proprietary. 16
Innovation Met the Needs of High-Growth Cohorts (e.g., Low-
Income Millennials, Gen X and Higher-Income Boomers)
Total Store $ Growth Decomposition by Shopper Cohort & Income Level – 2020 vs. 2019
% of Dollar Growth and Fair Share Index of Growth to Size, 52 WE 12/27/20
8%
7%
High
6%
14%
13%
2%
11%
12%
12%
3%
Middle0%
13%
Low
Color Coding
(Fair Share of Growth
Relative to Sales)
Green – More than Fair Share
White – Fair Share
Red – Less than Fair Share
99
104
115
110
102
110
88
57
180
126
66
HH Income per Capita
Millennials | 30% (124)
Gen X | 35% (111)
Boomers | 32% (91)
Seniors & Retirees | 4% (39)
36% (107) 38% (94) 26% (100)
White Claw Hard Seltzer
Variety Pack Flavor
Collection No. 2
Minute Maid
Zero Sugar
Examples of 2020 Innovations
Over-Indexing with Generations
Klondike
Donuts
Gillette TREO
Shaver
Note: Size of box represents share of dollar growth; Index represents share of growth relative to dollar sales size of box (e.g. fair share of growth) Source: IRI PNL data ending 12/27/20, Total US-All Outlets. IRI Strategic Analytics..

© 2021 Information Resources Inc. (IRI). Confidential and Proprietary. 17
- Constant -
- Solid -
- Dependable -
- Steadfast –
- Infallible -
- Genuine -
- Reliance -
- Solace -
- Assurance -
- Newness -
- Trailblazing -
- Eccentric -
- Breakthrough -
Reliability InnovativeTrust
- Nimble -
- Frictionless -
- Quick -
- Bright -
- Gentle -
Effortless
Consumer Metaphors Changed During the Pandemic
emergent fading
Source: IRI-machineVantage TrendSpotting analysis of social and search data; changes occurring from outset of pandemic
© 2021 Information Resources Inc. (IRI). Confidential and Proprietary. 18
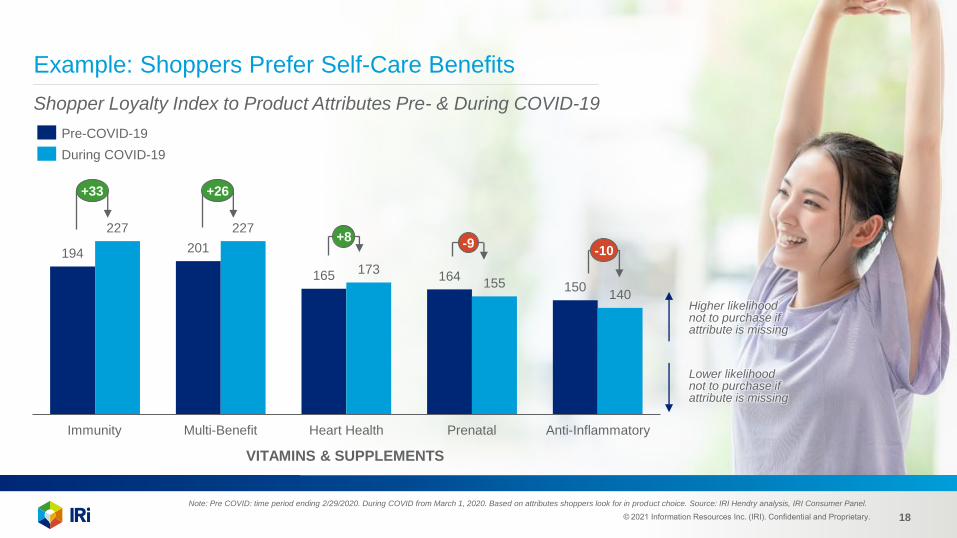
Example: Shoppers Prefer Self-Care Benefits
Shopper Loyalty Index to Product Attributes Pre- & During COVID-19
194 201
165 164150
227 227
173155
140
VITAMINS & SUPPLEMENTS
Immunity Multi-Benefit Heart Health Prenatal Anti-Inflammatory
+33 +26
+8-9
-10
Pre-COVID-19
During COVID-19
Higher likelihood not to purchase if attribute is missing
Lower likelihood not to purchase if attribute is missing
Note: Pre COVID: time period ending 2/29/2020. During COVID from March 1, 2020. Based on attributes shoppers look for in product choice. Source: IRI Hendry analysis, IRI Consumer Panel.

© 2021 Information Resources Inc. (IRI). Confidential and Proprietary. 19
Attributes and Benefits Focused on Product Origins, Societal
Care, Lifestyle / Diets and Self-Care Are Growing Faster
Dollar Sales Growth of Products With Attribute and Benefit Types – MULO+C, 52 WE 12/27/20
Attribute Group F&B 2020 Growth Nonedible 2020 Growth
Product Origins (e.g., Artisanal, Made in USA)
Societal Care (e.g., B-Corp, Eco Friendly, Fair Trade)
Lifestyle Diets (e.g., Ketogenic, Plant-Based Diet, Vegan)
Allergens & Intolerances (e.g., Gluten-Free, Lactose-Free)
Clean Label (e.g., Common Allergen-Free, Non-GMO)
Self-Care (e.g., Immune Support, Antioxidants)
Botanicals & Oils (e.g., Lavender Oil, Citrus)
FDA Nutrient Claims (e.g., More Calcium, Reduced Calories)
Plant Based Protein (e.g., Pea Protein, Hemp Seed Protein)
18%
14%
13%
13%
12%
12%
12%
10%
9%
13%
8%
14%
9%
7%
4%
7%
5%
3%
6%
6%Edible Growth Nonedible GrowthContains all types of plant-based protein. Seitan, pea and
kamut proteins are the fastest growing with +20% growth
Contains dissolvable protein powders
(i.e., whey protein)
Note: Growth based on sum of relevant claims within group. Excludes ingredient label-based attributes. Source: IRI POS Data, Label Insight Claims, MULO+C, Data ending 12/27/2020
© 2021 Information Resources Inc. (IRI). Confidential and Proprietary. 20
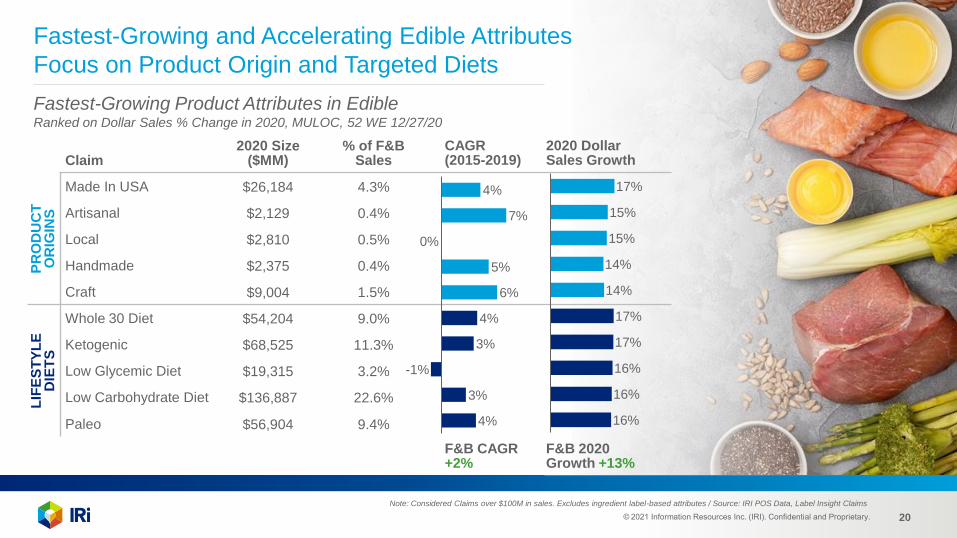
Claim2020 Size
($MM)% of F&B
SalesCAGR (2015-2019)
2020 DollarSales Growth
PR
OD
UC
T
OR
IGIN
S
Made In USA $26,184 4.3%
Artisanal $2,129 0.4%
Local $2,810 0.5%
Handmade $2,375 0.4%
Craft $9,004 1.5%
LIF
ES
TY
LE
D
IET
S
Whole 30 Diet $54,204 9.0%
Ketogenic $68,525 11.3%
Low Glycemic Diet $19,315 3.2%
Low Carbohydrate Diet $136,887 22.6%
Paleo $56,904 9.4%
F&B CAGR +2%
F&B 2020 Growth +13%
Fastest-Growing and Accelerating Edible Attributes
Focus on Product Origin and Targeted Diets
Fastest-Growing Product Attributes in EdibleRanked on Dollar Sales % Change in 2020, MULOC, 52 WE 12/27/20
Note: Considered Claims over $100M in sales. Excludes ingredient label-based attributes / Source: IRI POS Data, Label Insight Claims
4%
7%
0%
5%
6%
4%
3%
-1%
3%
4%
17%
15%
15%
14%
14%
17%
17%
16%
16%
16%

© 2021 Information Resources Inc. (IRI). Confidential and Proprietary. 21
Claim2020 Size
($MM)% of Nonedible
SalesCAGR (2015-2019)
2020 DollarSales Growth
SE
LF
-CA
RE
Contains Essential Oils $1,130 0.3%
Immune Support $3,031 0.9%
Sleep Health Claim $755 0.2%
Electrolyte Claim $396 0.1%
Contains Collagen $214 0.1%
SO
CIE
TA
L C
AR
E Cruelty-Free $1,972 0.6%
Biobased Product $292 0.1%
B-Corporation $644 0.2%
Humane $7,193 2.2%
Ethical $5,796 1.8%
Nonedible CAGR +2%
Nonedible 2020 Growth +6%
In Nonedible, Immunity-Building Product Benefits
Grew Fastest, Like Many Sustainability Claims
Fastest-Growing Product Attributes in NonedibleRanked on Dollar Sales % Change in 2020, MULOC, 52 WE 12/27/20
25%
3%
20%
5%
37%
28%
26%
23%
15%
15%
38%
37%
35%
33%
29%
75%
31%
29%
23%
23%
Note: Considered Claims over $100M in sales. Excludes ingredient label-based attributes / Source: IRI POS Data, Label Insight Claims
© 2021 Information Resources Inc. (IRI). Confidential and Proprietary. 22
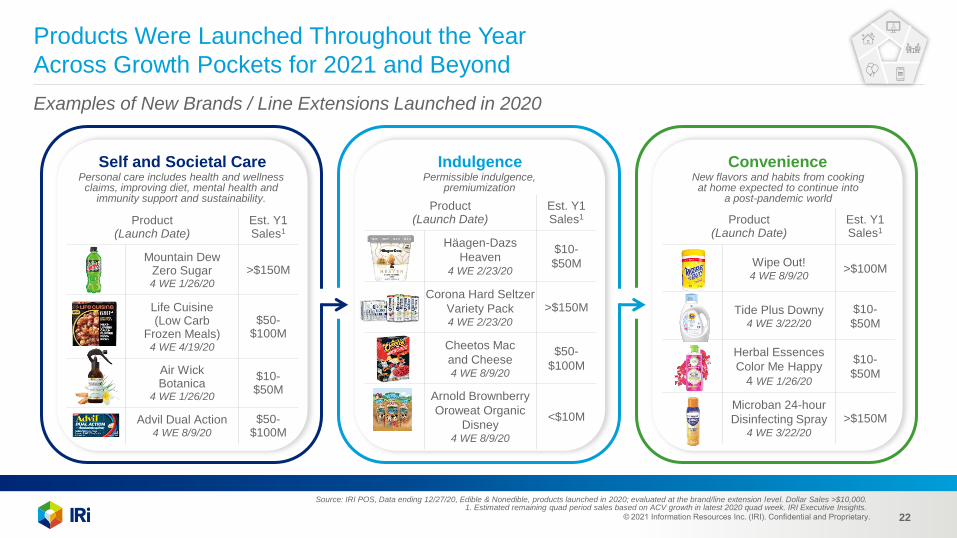
Products Were Launched Throughout the Year
Across Growth Pockets for 2021 and Beyond
Examples of New Brands / Line Extensions Launched in 2020
ConvenienceIndulgenceSelf and Societal Care
Product (Launch Date)
Est. Y1 Sales1
Mountain Dew Zero Sugar4 WE 1/26/20
>$150M
Life Cuisine(Low Carb
Frozen Meals)4 WE 4/19/20
$50-$100M
Air Wick Botanica
4 WE 1/26/20
$10-$50M
Advil Dual Action4 WE 8/9/20
$50-$100M
Personal care includes health and wellness claims, improving diet, mental health and
immunity support and sustainability. Product
(Launch Date)Est. Y1 Sales1
Häagen-Dazs
Heaven4 WE 2/23/20
$10-
$50M
Corona Hard Seltzer
Variety Pack4 WE 2/23/20
>$150M
Cheetos Mac
and Cheese4 WE 8/9/20
$50-
$100M
Arnold Brownberry
Oroweat Organic
Disney4 WE 8/9/20
<$10M
Permissible indulgence, premiumization
Product (Launch Date)
Est. Y1 Sales1
Wipe Out!4 WE 8/9/20
>$100M
Tide Plus Downy4 WE 3/22/20
$10-
$50M
Herbal Essences
Color Me Happy
4 WE 1/26/20
$10-
$50M
Microban 24-hour
Disinfecting Spray4 WE 3/22/20
>$150M
New flavors and habits from cooking at home expected to continue into
a post-pandemic world
Source: IRI POS, Data ending 12/27/20, Edible & Nonedible, products launched in 2020; evaluated at the brand/line extension level. Dollar Sales >$10,000.1. Estimated remaining quad period sales based on ACV growth in latest 2020 quad week. IRI Executive Insights.
© 2021 Information Resources Inc. (IRI). Confidential and Proprietary. 23
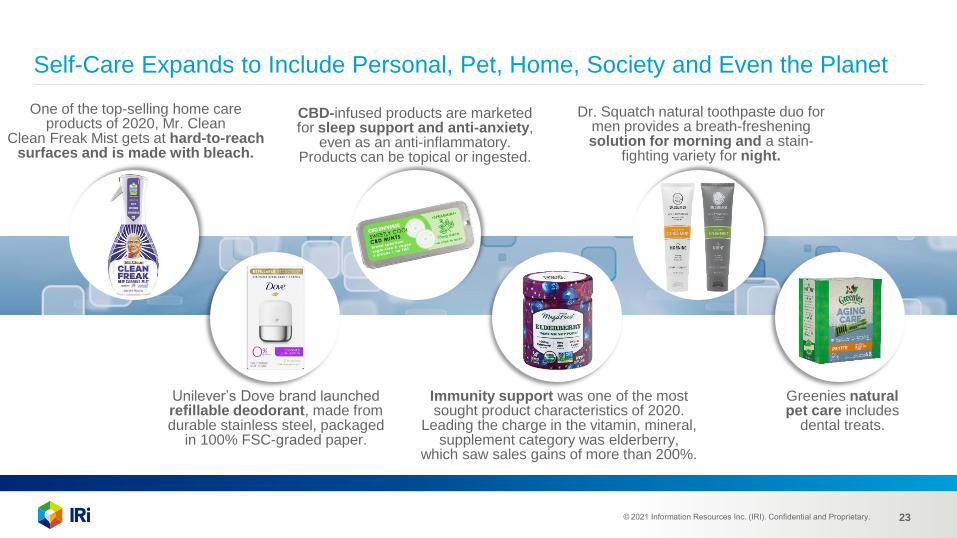
Self-Care Expands to Include Personal, Pet, Home, Society and Even the Planet
CBD-infused products are marketed for sleep support and anti-anxiety,
even as an anti-inflammatory. Products can be topical or ingested.
Immunity support was one of the most sought product characteristics of 2020.
Leading the charge in the vitamin, mineral, supplement category was elderberry,
which saw sales gains of more than 200%.
Unilever’s Dove brand launched refillable deodorant, made from durable stainless steel, packaged
in 100% FSC-graded paper.
One of the top-selling home care products of 2020, Mr. Clean
Clean Freak Mist gets at hard-to-reach surfaces and is made with bleach.
Dr. Squatch natural toothpaste duo for men provides a breath-freshening solution for morning and a stain-
fighting variety for night.
Greenies natural pet care includes
dental treats.
© 2021 Information Resources Inc. (IRI). Confidential and Proprietary. 24
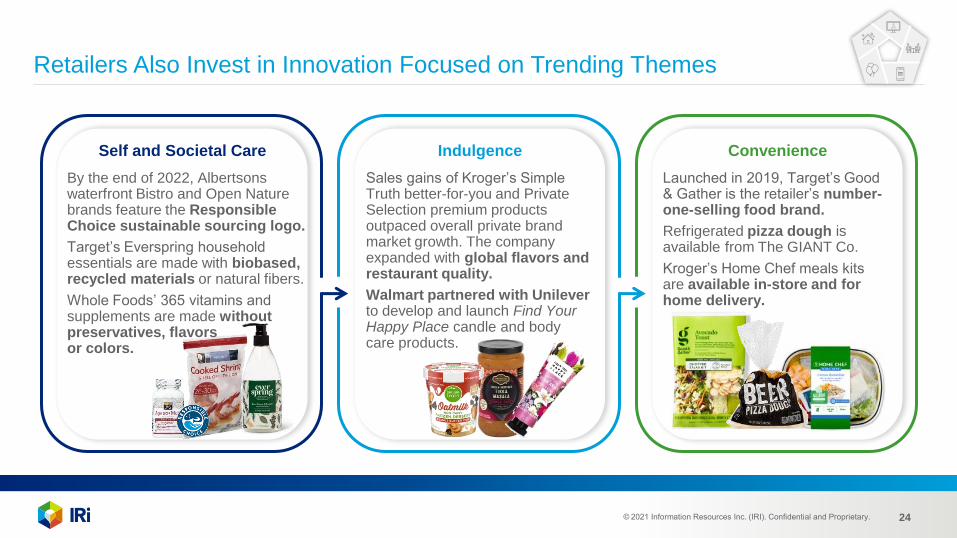
Retailers Also Invest in Innovation Focused on Trending Themes
ConvenienceIndulgenceSelf and Societal Care
Sales gains of Kroger’s Simple Truth better-for-you and Private Selection premium products outpaced overall private brand market growth. The company expanded with global flavors and restaurant quality.
Walmart partnered with Unilever to develop and launch Find Your Happy Place candle and body care products.
Launched in 2019, Target’s Good & Gather is the retailer’s number-one-selling food brand.
Refrigerated pizza dough is available from The GIANT Co.
Kroger’s Home Chef meals kits are available in-store and for home delivery.
By the end of 2022, Albertsons waterfront Bistro and Open Nature brands feature the Responsible Choice sustainable sourcing logo.
Target’s Everspring household essentials are made with biobased, recycled materials or natural fibers.
Whole Foods’ 365 vitamins and supplements are made without preservatives, flavors or colors.
© 2021 Information Resources Inc. (IRI). Confidential and Proprietary. 25
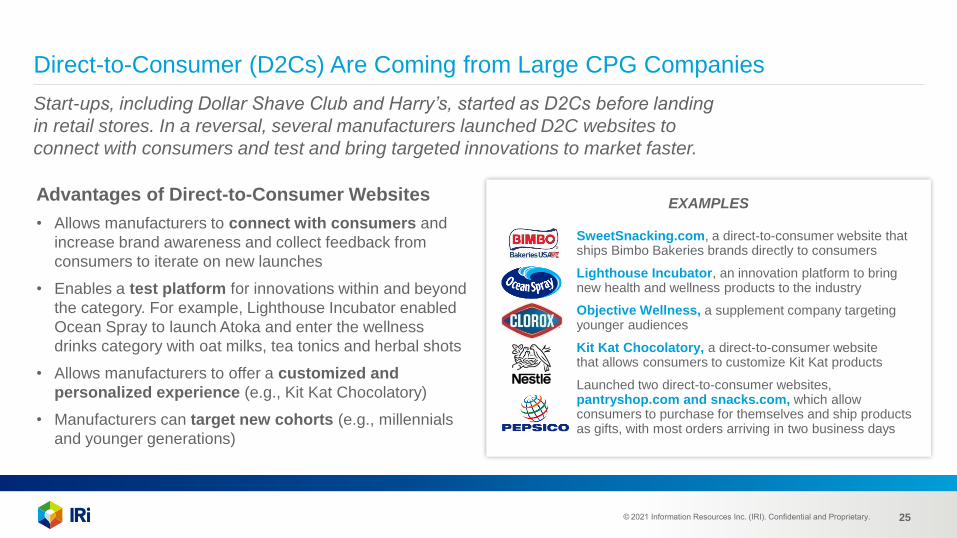
Direct-to-Consumer (D2Cs) Are Coming from Large CPG Companies
Start-ups, including Dollar Shave Club and Harry’s, started as D2Cs before landing
in retail stores. In a reversal, several manufacturers launched D2C websites to
connect with consumers and test and bring targeted innovations to market faster.
Advantages of Direct-to-Consumer Websites
• Allows manufacturers to connect with consumers and
increase brand awareness and collect feedback from
consumers to iterate on new launches
• Enables a test platform for innovations within and beyond
the category. For example, Lighthouse Incubator enabled
Ocean Spray to launch Atoka and enter the wellness
drinks category with oat milks, tea tonics and herbal shots
• Allows manufacturers to offer a customized and
personalized experience (e.g., Kit Kat Chocolatory)
• Manufacturers can target new cohorts (e.g., millennials
and younger generations)
EXAMPLES
SweetSnacking.com, a direct-to-consumer website that ships Bimbo Bakeries brands directly to consumers
Lighthouse Incubator, an innovation platform to bring new health and wellness products to the industry
Objective Wellness, a supplement company targeting younger audiences
Kit Kat Chocolatory, a direct-to-consumer website that allows consumers to customize Kit Kat products
Launched two direct-to-consumer websites, pantryshop.com and snacks.com, which allow consumers to purchase for themselves and ship products as gifts, with most orders arriving in two business days
© 2021 Information Resources Inc. (IRI). Confidential and Proprietary. 26
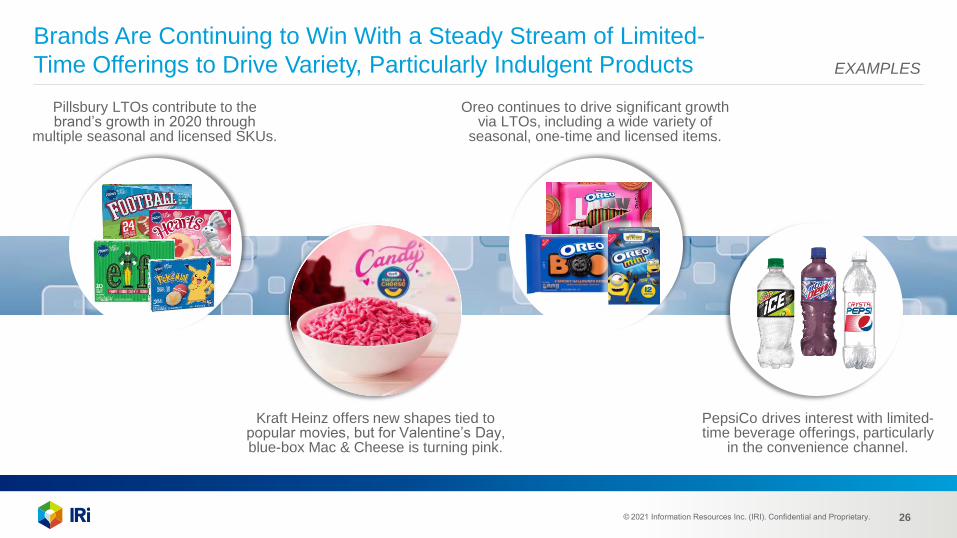
Brands Are Continuing to Win With a Steady Stream of Limited-
Time Offerings to Drive Variety, Particularly Indulgent Products
Oreo continues to drive significant growth via LTOs, including a wide variety of
seasonal, one-time and licensed items.
Kraft Heinz offers new shapes tied to popular movies, but for Valentine’s Day, blue-box Mac & Cheese is turning pink.
PepsiCo drives interest with limited-time beverage offerings, particularly
in the convenience channel.
Pillsbury LTOs contribute to the brand’s growth in 2020 through
multiple seasonal and licensed SKUs.
EXAMPLES

© 2021 Information Resources Inc. (IRI). Confidential and Proprietary. 27
From Delivery-Only “Ghost Kitchens” to Grocery Models,
Foodservice Innovations Address New Demand
Shuttered restaurants and limited social mobility have spurred
new business models:
• Delivery-only foodservice, or ghost kitchens, could account for
$1 trillion in global foodservice sales by 2030, according to
Euromonitor.
• Meal kits and pantry items – some supported by free delivery –
are available from Panera Bread, CPK, Subway and Moe’s
Southwest Grill.
• Goldbelly overnight service connects consumers to the
restaurant and small business foods they love.
• DoorDash launched DashMart, offering thousands of
convenience products and restaurant items.

© 2021 Information Resources Inc. (IRI). Confidential and Proprietary. 28

© 2021 Information Resources Inc. (IRI). Confidential and Proprietary. 29
Work and Workout At Home
• Remote working continues to some degree, a plus for at-home food spend
• Reduction in work commute negatively impacts out-of-home food dollar
Shopping Shifts
• Significant growth in e-commerce and contactless shopping
• Preference for one-stop shopping, less time spent in store
Home Upgrades, Inside & Out, Especially Digitally
• Focus on cleaning and sanitation will stick
• Work, shop and entertain from home will continue to some degree
• More pets at home
Leisure & Holidays
• Increased digital entertainment
• Permission to celebrate anything at home
• New holiday traditions
Self- and Societal Care
Convenience
Indulgence
Consumer Lifestyle Shifts
Will Have Lasting Impact
Consumption Shifts
• At-home consumption outweighs away-from-home
• At-home experiences are elevated vs. pre-pandemic
• Premiumization elevates the everyday
• Emphasis on self- and societal care continues
© 2021 Information Resources Inc. (IRI). Confidential and Proprietary. 30
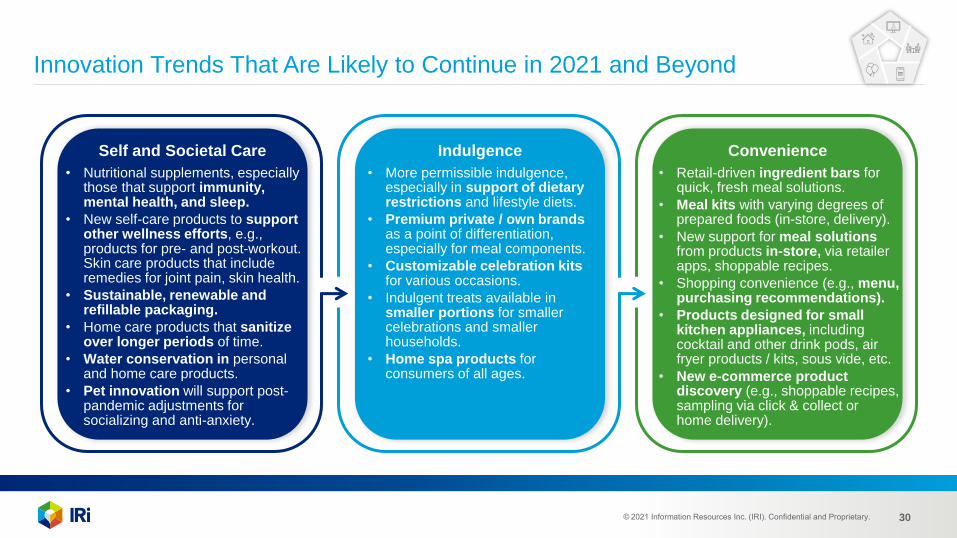
Innovation Trends That Are Likely to Continue in 2021 and Beyond
ConvenienceIndulgenceSelf and Societal Care
• Nutritional supplements, especially those that support immunity, mental health, and sleep.
• New self-care products to support other wellness efforts, e.g., products for pre- and post-workout. Skin care products that include remedies for joint pain, skin health.
• Sustainable, renewable and refillable packaging.
• Home care products that sanitize over longer periods of time.
• Water conservation in personal and home care products.
• Pet innovation will support post-pandemic adjustments for socializing and anti-anxiety.
• More permissible indulgence, especially in support of dietary restrictions and lifestyle diets.
• Premium private / own brands as a point of differentiation, especially for meal components.
• Customizable celebration kits for various occasions.
• Indulgent treats available in smaller portions for smaller celebrations and smaller households.
• Home spa products for consumers of all ages.
• Retail-driven ingredient bars for quick, fresh meal solutions.
• Meal kits with varying degrees of prepared foods (in-store, delivery).
• New support for meal solutions from products in-store, via retailer apps, shoppable recipes.
• Shopping convenience (e.g., menu, purchasing recommendations).
• Products designed for small kitchen appliances, including cocktail and other drink pods, air fryer products / kits, sous vide, etc.
• New e-commerce product discovery (e.g., shoppable recipes, sampling via click & collect or home delivery).
© 2021 Information Resources Inc. (IRI). Confidential and Proprietary. 31
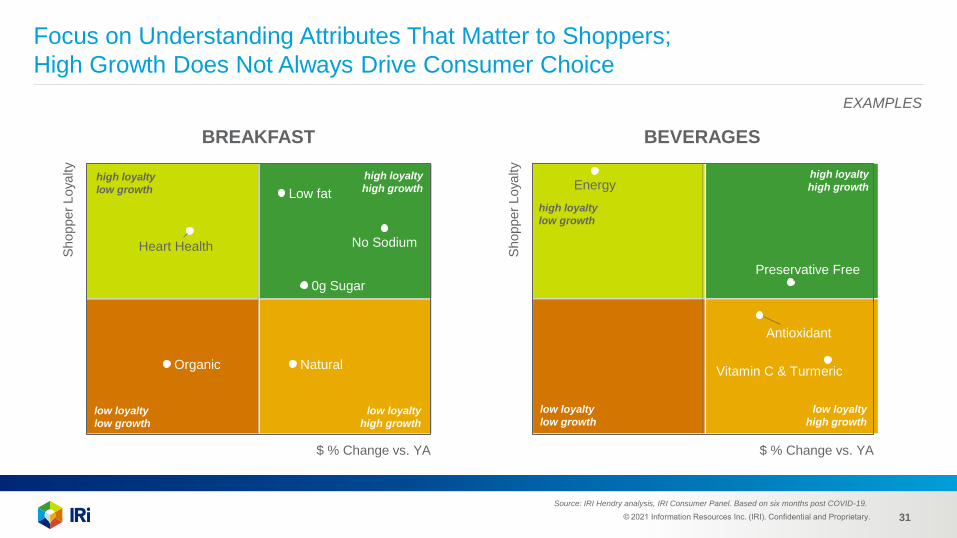
Focus on Understanding Attributes That Matter to Shoppers;
High Growth Does Not Always Drive Consumer Choice
Organic
$ % Change vs. YA
0g Sugar
Heart Health
Shopper
Loya
lty
Low fat
Natural
No Sodium
$ % Change vs. YA
Shopper
Loyalty
Energy
Preservative Free
Antioxidant
Vitamin C & Turmeric
BREAKFAST BEVERAGES
EXAMPLES
high loyalty
low growth
low loyalty
low growth
low loyalty
high growth
high loyalty
high growth
high loyalty
low growth
low loyalty
low growth
low loyalty
high growth
high loyalty
high growth
Source: IRI Hendry analysis, IRI Consumer Panel. Based on six months post COVID-19.

© 2021 Information Resources Inc. (IRI). Confidential and Proprietary. 32
Example: Trendspotting Analysis Identifies Pizza as a Self-Care Solution
Machine Learning and AI Algorithms, Embedded With Neuroscience, Aid in Developing Deep Market Understanding Across Structured and Unstructured Data
SO WHAT –Uncover Opportunities & Threats
Analysis uncovers a connection between healthy eating and pizza.
TOP 10 SUPERFOOD PIZZA /
INNOVATION TRENDS
SO WHAT
WHAT
WHAT – Identify Trends
WHY
WHY – Connect Trends to Inputs
Structured Data: sales metrics, product attributes, shopper loyalty
Unstructured Data: social media, Google searches, movie and
TV scripts, news feeds, digital engagementOther Big Ideas: sweet and salty
pizza, gourmet to designer pizza
Source: IRI-machineVantage TrendSpotting analysis of social and search data.
© 2021 Information Resources Inc. (IRI). Confidential and Proprietary. 33
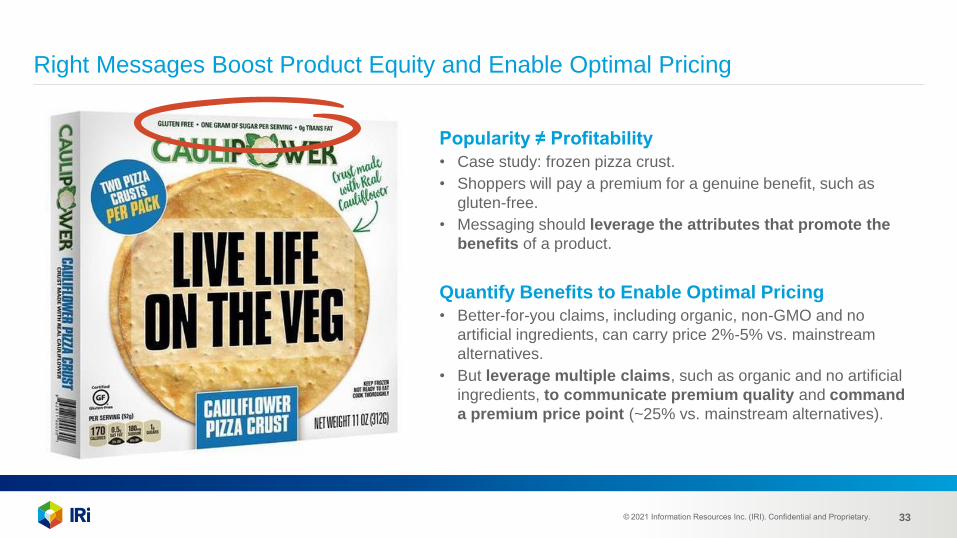
Right Messages Boost Product Equity and Enable Optimal Pricing
Popularity ≠ Profitability
• Case study: frozen pizza crust.
• Shoppers will pay a premium for a genuine benefit, such as
gluten-free.
• Messaging should leverage the attributes that promote the
benefits of a product.
Quantify Benefits to Enable Optimal Pricing
• Better-for-you claims, including organic, non-GMO and no
artificial ingredients, can carry price 2%-5% vs. mainstream
alternatives.
• But leverage multiple claims, such as organic and no artificial
ingredients, to communicate premium quality and command
a premium price point (~25% vs. mainstream alternatives).

© 2021 Information Resources Inc. (IRI). Confidential and Proprietary. 34
Innovation Playbook
• Spot evolving trends, both stated and
unarticulated needs.
• Test and validate against consumer
preferences.
• Innovate:
− Identify and articulate the right attributes.
− Leverage trade-off models to understand
which benefits consumers will pay for.
• Get the messaging right – communicate
product origins, sustainability, societal care, etc.
• Target messaging to consumer cohorts.
• Make search easy, use language that
consumers understand.

© 2021 Information Resources Inc. (IRI). Confidential and Proprietary. 35
IRI Offers a Variety of Solutions and Services
to Help Brands Succeed With Innovation
Brand Landscape
• Gives broad multi-category brand views with cross-category cultural attributes to identify and activate brand strategy initiatives.
• Easily identifies competitive set, explores specific structure segments or walking attributes to assess business performance.
• Updates dynamic structures with new products, most recent size and trend POS data plus demographic and panel measures monthly.
• Identifies macro changes to consumer demand as they happen
• Continually aligns brand portfolios against future shopper needs
Innovation Consulting
• Leverages actual shopper behavior in an integrated service from white space identification and new product concept testing through post-launch assessment.
• Allows for maximum insights and the best chance of new product success with the lowest possible risk.
TrendspottingIRI machineVantage
• Spot trends using POS, product attributes, frequent shopper purchase data.
• Connect trends to conscious and nonconscious metaphors using social, search data.
• Uncover opportunities using combination of AI/ML and deep learning techniques.
Brand Optimization Engine
• Applies augmented decision-making to prioritize growth opportunities based on size, demographics and execution difficulty.
• Assesses source of volume and incrementality to brand or category.
• Aids in choice of the right media spend, distribution and price to capture most switchers.
Social Intelligence Analytics & Brand
Value Analysis
• Provides feedback on what consumers are saying about your brand online.
• Determines which functional and emotive attributes you “own” and which are “table stakes.”
• Builds improved messaging campaigns and identifies opportunities for brand growth.
• Grows both top and bottom line while also driving market share.
ACTION AND IMPACT ACTION AND IMPACT ACTION AND IMPACT• >10% growth in sales• Increases brand value• Enables more effective
media campaigns
• Doubles odds of new product success, dramatically cutting the cost of innovation
• Continually identifies and activates against growth opportunities
• Proactive trend-spotting to uncover innovation opportunities
• Evaluate threat of competitive new product launches
• Understand consumers on a deeper level
• Implement product innovations that are meaningful and grow business

© 2021 Information Resources Inc. (IRI). Confidential and Proprietary. 36
Mark Clouse
President and CEO, Campbell Soup Company
November 10, 2020
Stuart Aitken
Chief Merchant & Marketing Officer, The Kroger Co.
September 3, 2020
Vivek Sankaran
President & CEO, Albertsons Companies
August 25, 2020
© 2021 Information Resources Inc. (IRI). Confidential and Proprietary. 37
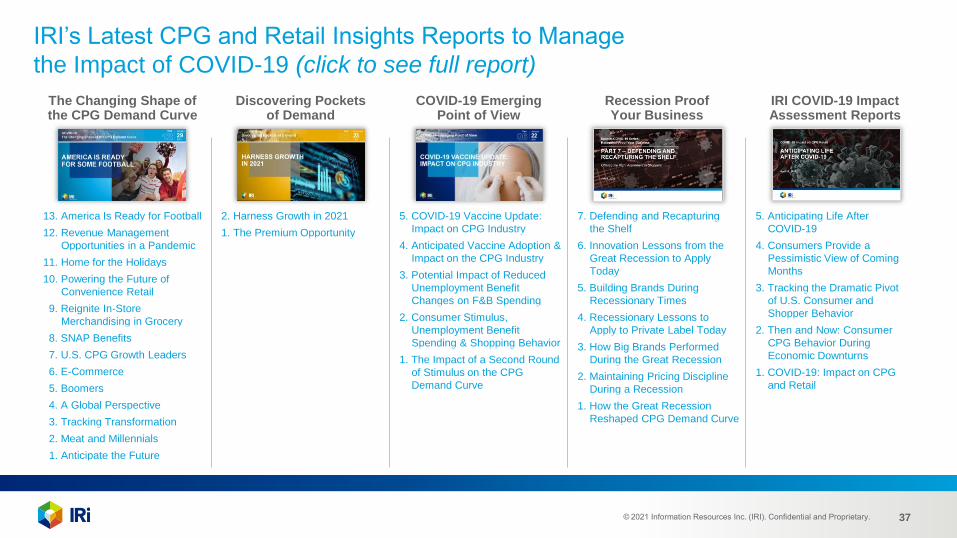
IRI’s Latest CPG and Retail Insights Reports to Manage
the Impact of COVID-19 (click to see full report)
The Changing Shape of the CPG Demand Curve
Discovering Pockets of Demand
COVID-19 Emerging Point of View
Recession Proof Your Business
IRI COVID-19 Impact Assessment Reports
13. America Is Ready for Football
12. Revenue Management
Opportunities in a Pandemic
11. Home for the Holidays
10. Powering the Future of
Convenience Retail
9. Reignite In-Store
Merchandising in Grocery
8. SNAP Benefits
7. U.S. CPG Growth Leaders
6. E-Commerce
5. Boomers
4. A Global Perspective
3. Tracking Transformation
2. Meat and Millennials
1. Anticipate the Future
2. Harness Growth in 2021
1. The Premium Opportunity
5. COVID-19 Vaccine Update:
Impact on CPG Industry
4. Anticipated Vaccine Adoption &
Impact on the CPG Industry
3. Potential Impact of Reduced
Unemployment Benefit
Changes on F&B Spending
2. Consumer Stimulus,
Unemployment Benefit
Spending & Shopping Behavior
1. The Impact of a Second Round
of Stimulus on the CPG
Demand Curve
7. Defending and Recapturing
the Shelf
6. Innovation Lessons from the
Great Recession to Apply
Today
5. Building Brands During
Recessionary Times
4. Recessionary Lessons to
Apply to Private Label Today
3. How Big Brands Performed
During the Great Recession
2. Maintaining Pricing Discipline
During a Recession
1. How the Great Recession
Reshaped CPG Demand Curve
5. Anticipating Life After
COVID-19
4. Consumers Provide a
Pessimistic View of Coming
Months
3. Tracking the Dramatic Pivot
of U.S. Consumer and
Shopper Behavior
2. Then and Now: Consumer
CPG Behavior During
Economic Downturns
1. COVID-19: Impact on CPG
and Retail

© 2021 Information Resources Inc. (IRI). Confidential and Proprietary. 38
The IRI CPG Demand Index™ provides a standard metric for tracking changes in spending on consumer packaged goods.
U.S. Demand Index™ Forecasts are delivered through a proprietary, fully automated forecasting solution that anticipates consumer demand.
Channel Shift Index™ provides a standard metric for tracking changes (migration) in spending on consumer packaged goods across select channels.
The IRI E-Commerce Demand Index™ provides a standard metric for tracking changes in spending on consumer packaged goods purchased online.
Inflation Tracker™ provides the well-known price per unit metric for tracking changes in pricing of consumer packaged goods.
Supply Index™ provides a standard metric for tracking changes in product availability (i.e., in-stock rates) in stores for consumer packaged goods.
Out-of-Stock Levels for Top-Selling Subcategories by Market Area in the U.S.
Top U.S. Topics from IRI Social Pulse™
CPG Economic IndicatorsAccess IRI’s industry-standard metrics for consumer product demand and supply during the pandemic, our CPG inflation tracker and the latest data on category trends, out-of-stock levels, consumer sentiment and more.
Demand Index™ U.S. Demand
Index™ Forecasts
Channel Shift
Index™
E-Commerce
Demand Index™
Inflation
Tracker™ Supply Index™ Out-of-Stock Levels
for Subcategories
U.S. Topics from
IRI Social Pulse™

© 2021 Information Resources Inc. (IRI). Confidential and Proprietary. 39
Want to Be the First to Know?
Registered Users Get New Thought Leadership
from IRI’s Research, Data & Analytics Experts
www.iriworldwide.com/en-US/Insights/Subscribe

© 2021 Information Resources Inc. (IRI). Confidential and Proprietary. 40© 2021 Information Resources Inc. (IRI).
Confidential and Proprietary. 40
CONTACT US FOR MORE
INFORMATION
IRI Global Headquarters
203 N. LaSalle St., Suite 1500
Chicago, IL 60601
+1 312.726.1221
Follow IRI on Twitter: @IRIworldwide