Embed Size (px)
Citation preview
1/2/2015 inmartech98_index_page
http://archive.unols.org/meetings/1998/199810imt/index.html#abstracts 6/26
Scripps Institution of OceanographyMarine Instrument Calibration “You Know it Makes Sense” - Mr. Paul Ridout, OceanScientific International Ltd.Insitu Pressure Calibration - Mr. Sven Ober, Netherlands Institute For Sea Research
14:30 INMARTECH ‘98 - WRAP-UP SESSION Adjourn Shuttle Buses return to Hotels 18:30 Mexican Dinner at SIO Campus *
vINMARTECH '98 ABSTRACTSv
Tuesday 20 October 1998 Wednesday 21 October 1998 Thursday 22 October 1998
Tuesday 20, October, 1998
Tuesday 10:00 Technical Workshop
UNDERWAY SAMPLING SYSTEMSSumner Auditorium
Mr. Anthony F. Amos (University of Texas), Chair v An Interactive Shipboard Scientific Log For Research Vessels - Mr. Anthony F. Amos, TheUniversity of Texas Marine Science Institute Daily logs have been kept on sea-going vessels of all types for centuries. In the relatively short historyof the purely research vessel, the idea that data of a more scientific nature be logged started in thenotebooks of the "naturalists" and now continue in the data banks of shipboard computers. The authorhas devised a scientific log that incorporates some of the needs of a ship's log with that required by theonboard scientists. A few decades ago, all members of the scientific and technical crew were required to
1/2/2015 inmartech98_index_page
http://archive.unols.org/meetings/1998/199810imt/index.html#abstracts 7/26
stand a daily watch to oversee the equipment such as precision depth recorders, magnetometers, etc. Thispractice has largely disappeared on research vessels that are often engaged in multidisciplinary programswhere different expertise is required in each discipline's specialized equipment. Underway environmentaldata is recorded along with positional data at a rapid rate on modern vessels, making the production of alog from these data impractical. This software system runs continuously, acquiring and displayingunderway data, as usual, but allowing the input of information on cruise events such as station numbers,equipment calibrations, special observations, and comments that are appended to the data line. It alsoautomatically calculates sunrise, sunset, and Local Apparent Noon and records those at the instant of theircalculated occurrence. It also displays information on time and distance to the next station. At the end ofeach day, a summary log of the day's events, mean and extreme environmental conditions, and stationpositions is produced as well as a graphical representation of conditions and a daily cruise track. The logcan be provided to the scientific party in hard-copy form or electronically. The system is semi-automatic,but still requires a watch-stander and the cooperation of parties on board in entering the data pertinent totheir operations. On our cruises, the CTD watch usually oversees the underway system.
vIMET - Improved METeorology - Instrumentation - Mr. David Hosom, Upper Ocean ProcessesGroup, Woods Hole Oceanographic Institution The ocean is critical to inter-decadal climate variability because of its ability to store and transport heatand fresh water and release them to the atmosphere through sensible and latent heat fluxes. Knowledgeof various properties at the sea surface is essential to monitoring, understanding, and developing theability to predict climate change. Vertical exchange across the air-sea interface of horizontal momentumand of buoyancy couples the ocean and atmosphere. The sea surface is the interface through which heat,fresh water, momentum, gases, and other quantities are exchanged. It is the bottom boundary of theatmosphere over approximately 70% of the earth's surface and the top surface of the very large oceanicreservoirs of heat and other properties. Observing this coupling is a fundamental need if we are to bothunderstand ocean variability and its interrelation to climate. This requires the observation of surface windvelocity, humidity, air temperature, sea temperature, barometric pressure, incoming shortwave radiation,incoming longwave radiation and precipitation. In planning for WOCE (World Ocean Circulation Experiment) it was recognized that moored buoys andships would provide especially attractive platforms from which to make accurate in-situ measurements ofthe basic surface meteorological observable parameters required to investigate the air-sea fluxes ofmomentum, heat, and mass. Accuracy's of 10 Watts per meter squared were sought in estimates of themean values (averaged over monthly and longer time scales) of each of the four components of the totalheat flux (sensible, latent, shortwave, and longwave). Accuracy's of approximately 1 mm per day weresought in evaporation and precipitation. Woods Hole Oceanographic Institution (WHOI) was funded to evaluate and choose sensors capable ofmeeting the WOCE goals and to develop the IMET system as a flexible data collection system. Eachsensor was incorporated into a module with built-in intelligence that responds to polled commands fromthe central computer and data recording unit. Each module interfaces to an ADDB (addressable digitaldata bus) consisting of +12vdc power and RS485 serial ports. A key component of IMET accuracy is thatthe calibration constants are stored in the module so that the serial digital output is in calibrated units. The calibration constants from each unit are polled and stored on the data file with the data from aspecific time period. Modules having non-linear algorithms will output both calibrated and raw data topermit later corrections. IMET systems are now in use on eight UNOLS ships, six WHOI buoys, one USF (University ofSouthern Florida) buoy, one NOAA ship and the Rutgers University Field Station. These systems have
1/2/2015 inmartech98_index_page
http://archive.unols.org/meetings/1998/199810imt/index.html#abstracts 8/26
proven themselves over the last eight years and now provide the baseline for climate quality data. Thispaper will discuss IMET, data accuracy and Volunteer Observing Ships (VOS) climate data acquisition.
vData - Sensor Calibrations and Data Quality Analysis - Mr. R. Williams, Scripps Institution ofOceanography
v Underway Data Collection System on Board RV PELAGIA; Considerations and Design of a NewSystem - Mr. J. Derksen, Netherlands Institute For Sea Research
Tuesday 13:00 Technical Workshops
GEOPHYSICAL TECHNOLOGIESHubbs Hall
Mr. Paul Henkart (Scripps Institution of Oceanography), Chair
vSeismic Sources in the UNOLS Fleet - Dr. John Diebold, Lamont-Doherty Earth Observatory ofColumbia University Ever since seismic refraction and reflection profiles were first acquired (in the 1930s and 50s,respectively) active seismic techniques have played an important role in marine geophysical dataacquisition by the US fleet. Since their invention in the 1960s, airguns have supplanted the originalexplosive sources, first in reflection work, and more recently, in refraction profiling. Airguns require asignificant initial investment ($30 - $40K ea) and expensive compressors are needed as well. However,they are cost-effective in the long run, are more efficient, and much safer. For example, a single shot byEWING's full 8,500 cu. in. 20-gun array provides as much energy in the seismic band as a single 2,000LB TNT charge. Considering that explosives typically cost between $1 and $2 per pound, and that theairguns can be fired every 20-seconds for an entire 40-day leg, it is difficult to justify using explosives atall, except in cases where very large or deep shots are required. Taken as a class of tools, airguns are very flexible, in that they can be applied to a broad range of seismicproblems. Of the three types of airgun generally available, however, each is somewhat more limited in itsrange of applications. The 20 Bolt airguns in the EWING's array, for example can be configured toproduce a good source for large-scale refraction work (with offsets well in excess of 100 km), deeppenetration multichannel reflection profiles, and medium resolution reflection profiles, but they are notappropriate for high resolution work. Two other types of airgun; the sleeve gun (WesternGeophysical/Haliburton) and the "GI" gun (Seismic Systems, Inc.) are better suited for the shallowtowing necessary to obtain the bandwidth needed for high temporal resolution. The GI gun, in particular,is well suited for use on small and medium-sized vessels, and those with limited compressor capacity,since a single GI gun, with its ability to cancel bubble reverberation, creates a "tuned" signature, whichrequires an array of sleeve guns. We discuss these, and other tradeoffs that ship operators should beaware of when planning or proposing seismic work for the academic community.
1/2/2015 inmartech98_index_page
http://archive.unols.org/meetings/1998/199810imt/index.html#abstracts 9/26
v Sound Receivers - Dr. Graham Kent, Scripps Institution of Oceanography
v Chirp Sonar Design for In-Hull Applications - Dr. Lester R. LeBlanc (Presenter), Professor of OceanEngineering & Dr. Steven G. Schock, Associate Professor of Ocean Engineering, Florida AtlanticUniversity, Department of Ocean Engineering The Chirp Sonar is a linear FM sonar that was developed to support the objectives of remote acousticclassification of seafloor sediments. It is a calibrated wideband digital frequency modulated sonar thatprovides quantitative high-resolution low noise images. It can be operated, either using a tow-vehicle, orusing an in-hull mount. Since the Chirp Sonar system can precisely transmit a specified waveform withwide bandwidth, and its digital receiver is calibrated, the data can be processed to estimate the acousticimpulse response of the seafloor sediment, and sediment attenuation. The processed chirp pulse isdesigned to provide low temporal sidelobes and nearly constant resolution with depth. Because thesystem is wideband, the resulting beampattern has nearly no sidelobes. All of these factors combine tomake the Chirp Sonar an outstanding tool for sea floor exploration. v An Overview of Swath Bathymetry - Dr. Dale Chayes, Lamont-Doherty Earth Observatory
Tuesday 13:00
ROV AND TOWED VEHICLESSumner Auditorium
Mr. Marc Willis (Oregon State University), Chair
vA Typical Cruise with the ROV Jason - Mr. Robert Elder, Woods Hole Oceanographic Institution A description of the unmanned vehicles operated as part of the U.S. Deep Submergence Facility will begiven. A typical deployment of the ROV Jason will be presented with particular attention to supportvessel requirements. A launch and recovery sequence along with operating methods will be discussed. The presentation will also include a look at some of the data products that can be generated with an ROVsuch as Jason.
vRecent MPL Deep Tow Group Seagoing Work - Dr. Fred Spiess/Dr. John Hildebrand/Dr. Christian deMoustier, Scripps Institution of Oceanography The MPL Deep Tow Group operates several vehicles, two of which have been used in major NSF-fundedoperations in 1998. The first operation of the year (January and February) was the Ocean SeismicNetwork Pilot Experiment (OSNPE - Ralph Stephen of WHOI, Chief Scientist) in which the JOI/MPLwireline reentry Control Vehicle (CV) was the primary work platform. This load-carrying ROV was usedto make four entries, including seismometer downhole installation, in ODP hole 843 in 4.4 km of waterabout 100 miles south of Oahu. The CV was also used in the placement and installation documentationfor seismometers placed on or in the sea floor in the same experiment. The site was revisited in June andthe CV used to retrieve all three seismometers and their data recording packages.
1/2/2015 inmartech98_index_page
http://archive.unols.org/meetings/1998/199810imt/index.html#abstracts 10/26
The second operation was a 45 day expedition (May - June) utilizing Deep Tow Fish 6 to carry out anextensive near bottom magnetometer and sidelooking sonar survey oriented to the east Pacific Rise in thetropical Pacific with Dr. Jeff Gee of SIO as Chief Scientist. We will show data from the Gee operation aswell as TV clips of operational aspects of the OSNPE, and comment on operations using other vehiclesduring the year.
vTiburon: MBARI’s ROV for Science Research - Dr. William J. Kirkwood, Monterey Bay AquariumResearch Institute Tiburon is MBARI’s Remotely Operated Vehicle (ROV) which has recently begun operations forscience and exploration of the Eastern Pacific. The vehicle was specified and built by MBARI’s technicalstaff to address missions defined by the science staff. Reviewers from various institutions (Scripps, MIT,ISE, IFREMER and others) modified the specification and system concepts for Tiburon. The ROV iscompletely integrated with MBARI’s SWATH vessel, R/V WESTERN FLYER. The integrated systemhas been performing science missions concurrently with engineering tests. The 1997-1998 year of operation has brought a variety of experiences and issues. Some aspects of thesystem's performance have yielded better than anticipated results. Other aspects have shown potential butrequire fine-tuning. The overall architecture has proven to be robust, but has also shown vulnerabilitywhen efforts are not coordinated. Experience with the integrated system has added knowledge that needsto be applied towards improving and maximizing the system’s utility. The R/V WESTERN FLYER has functioned for more than a year as the platform for supporting Tiburonoperations. The control room was designed explicitly to assist in the efficient operation of sciencemissions. Concepts about Pilot to Chief Scientist communications and coordination with the ship crewhave been tested and validated. Support systems for the ROV and coordinated control have beenaccomplished at the rated depth of 4000 meters. Transects over several kilometers in excess of 3000meters depth have been successful using the R/V WESTERN FLYER’s dynamic positioning system inconjunction with Tiburon’s controls. This presentation discusses the original specification, decisions about architecture and system trades, andhow Tiburon (along with the R/V WESTERN FLYER) have performed against that specification.
vA comparison of Single Body and Two Body Shallow Towed Vehicles- Mr. Mark Rognastad,University of Hawaii In 1995 the National Defense Center of Excellence for Research in Ocean Science (CEROS) beganfunding Raytheon Corp. (then Alliant Techsystems, later Hughes Naval and Maritime Systems) and theHawaii Mapping Research Group (HMRG) of the University of Hawaii to conduct a series ofexperiments in synthetic aperture sonar. The first experiment, a proof of concept test, utilized theHAWAII MR1 sonar system together with a hydrophone array provided by Raytheon. These results werepromising, and a purpose-built tow vehicle was then funded, and has been tested in severalconfigurations. The HAWAII MR1 is a two body system, with a tow vehicle weighing 3500 lbs. in air, but ballasted tobe between 50 and 100 lbs. positively buoyant in water, connected with a neutrally buoyant tether to adepressor with 2000 lbs. of negative buoyancy. In typical use, this depressor is towed at a depth of 100meters, attached to the towing vessel by a steel armored electromechanical cable, at speeds of 7 to 10kts. A drogue line and buoy are fastened to the after end of the tow vehicle, both to improve vehicle
1/2/2015 inmartech98_index_page
http://archive.unols.org/meetings/1998/199810imt/index.html#abstracts 11/26
stability and to aid recovery in the event of loss. Launch and recovery of the vehicle and depressor isaccomplished using a mechanical system designed by Sound Ocean Systems and subsequently modifiedby HMRG.
The synthetic aperture testing required speeds of 2 to 5 kts. and depths of 15 to 25 meters; severalmodifications were made to the MR1 system to improve its performance at slow speed. The buoyancy ofthe vehicle was reduced, and the drogue line shortened to 30 meters. Small (10 cm diam.) drogue chuteswere added to the drogue line to increase drag. With these modifications, the MR1 system performedwell. The initial design for the purpose-built tow vehicle was based on an existing design created at Raytheon,the result of a significant effort on hydrodynamic simulation and model tank testing. The Raytheonvehicle had been used for similar synthetic aperture experiments in Lake Washington and Puget Soundwith good results. It is a single body design, towed from the upper midpoint of the vehicle, and weighsroughly 2300 lbs. in water.
v SeaSoar Metamorphosis - Dr. Lindsay Pender and Mr. Ian Helmond, CSIRO Marine Research,Hobart, Tasmania, Australia Over the past 13 years, we have progressively changed the characteristics of our SeaSoar to improve itsperformance. In this presentation, we will discuss the current configuration, its performance, and therational behind the changes we have made. We will discuss the replacement of the standard hydraulicwing control unit with a low maintenance, low torque electric drive. In order to implement the low torquedrive, new wings were developed and an aileron roll stabilization scheme implemented. These changesresulted in an increased depth range and improved roll stability. We will also discuss ships wake avoidance, communication, and our system control software, whichincludes real time bottom avoidance. The developments outlined can be readily applied to other activelycontrolled towed vehicles.
Wednesday, October 21, 1998 Wednesday 08:30
BOTTOM SAMPLING TECHNIQUESHubbs Hall
vA Large Diameter Piston Corer for Use on UNOLS Research Vessels - Dr. Peter Kalk, Oregon StateUniversity This presentation covers a brief history of marine sediment sampling leading to Kullenberg's invention ofthe piston corer and subsequent modifications to the original. A large diameter piston corer as used todayis examined. UNOLS vessel equipment needed for long piston corers and problems encountered withtoday's corers are reviewed.
1/2/2015 inmartech98_index_page
http://archive.unols.org/meetings/1998/199810imt/index.html#abstracts 12/26
v MultiCoring - Mr. Richard Muller, Moss Landing Marine Laboratory
vGlass Coring and Rock Dredging - Mr. Ronald Comer, Scripps Institution of Oceanography
A history of dredging and glass coring using SIO systems. A discussion of the pros and cons of eachsystem and when to utitlize each system as compared to geologic setting, time constraints, effectiveness,costs, and sampling goals.
Wednesday 08:30
ACOUSTIC, DOPPLER, CURRENT PROFILERSumner Auditorium
Dr. Eric Firing (University of Hawaii), Chair
vFundamental Components of Shipboard and Lowered ADCP Systems - Dr. Eric Firing, University ofHawaii Shipboard and lowered ADCP systems include the following subsystems: the platform or frame; theprofiler itself; a GPS receiver; attitude sensors; the data acquisition system; and data processing software.Among these, the least troublesome is the GPS receiver. Each of the other components can limit theaccuracy of the profiles of water velocity relative to the earth. Choices and problems associated with twoof the subsystems will be emphasized here: the profiler and the attitude sensors. Profiler issues includecoded versus uncoded pulses and phased array transducers versus a single element per beam. Attitudesensor issues include the status of GPS attitude sensing and the possible advantage of using pitch and rollsensors in shipboard systems; and the vulnerability of lowered systems to poor compass performance. v Routine Shipboard ADCP Operation: Benefits, Problems, Methods - Dr. Eric Firing, University ofHawaii The costs of operating a shipboard ADCP are mainly fixed--they are the same whether the unit is on oroff. Benefits of a policy of routine ADCP operation are of two sorts. First, the observations can behighly valuable even if they are not central to the science of a particular cruise. Second, routine operationmakes it much more likely that the system will work correctly on those cruises for which it is crucial. Problems of routine operation--or of maximizing the benefit of routine operation--range from thediplomatic (clearance issues) through the organizational (procedures for instrument operation, checking,and data transfer) and technical (shortcomings of the instrument systems themselves) to the financial(funding for processing and analyzing the data).
vLowered Acoustic Doppler Current Profiler: From an Experimental Instrument to a Standard
1/2/2015 inmartech98_index_page
http://archive.unols.org/meetings/1998/199810imt/index.html#abstracts 13/26
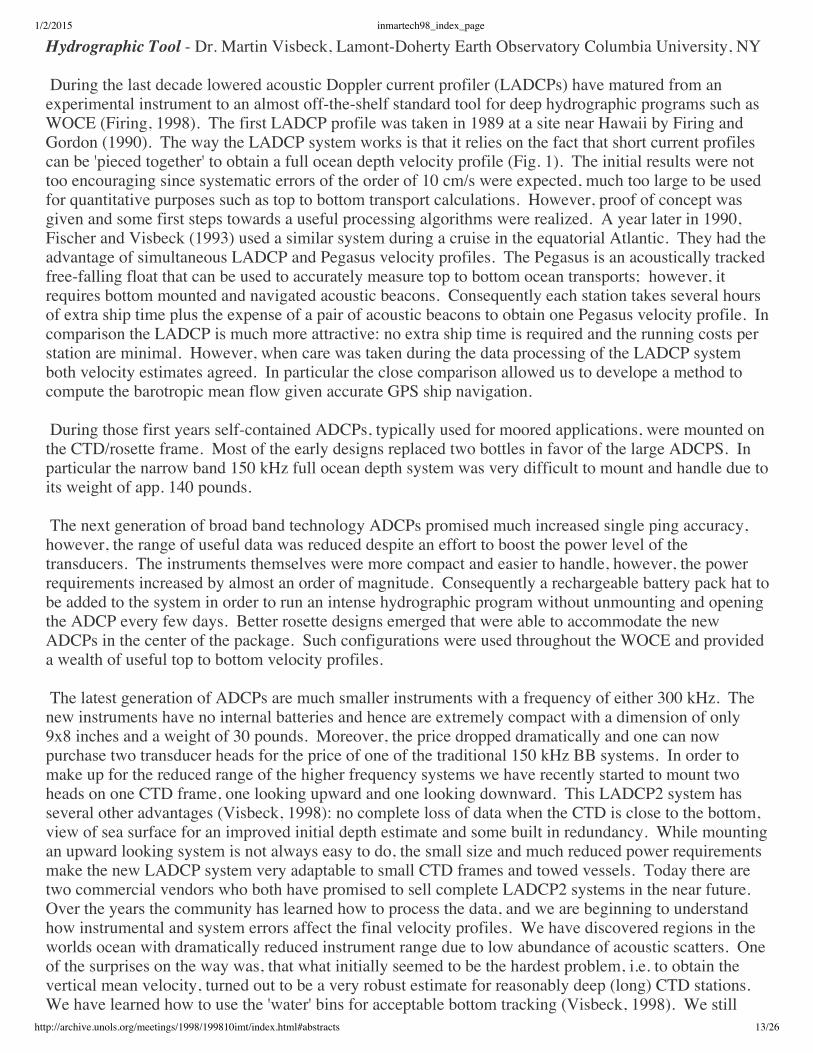
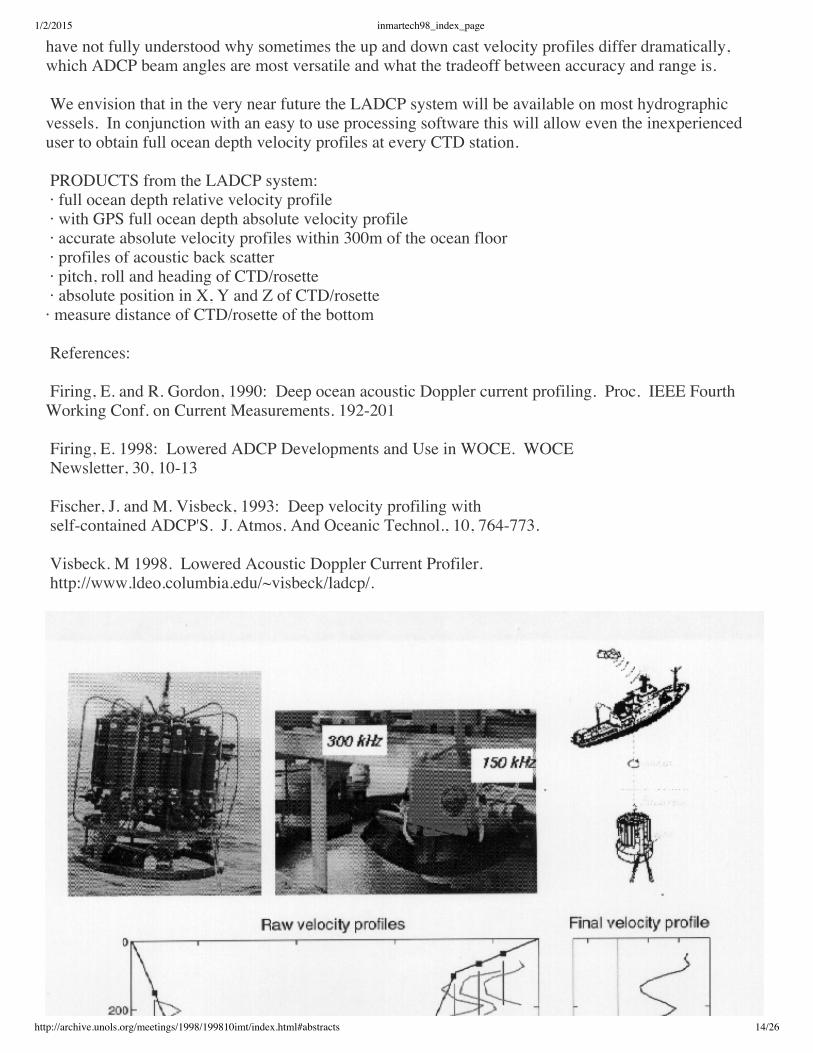
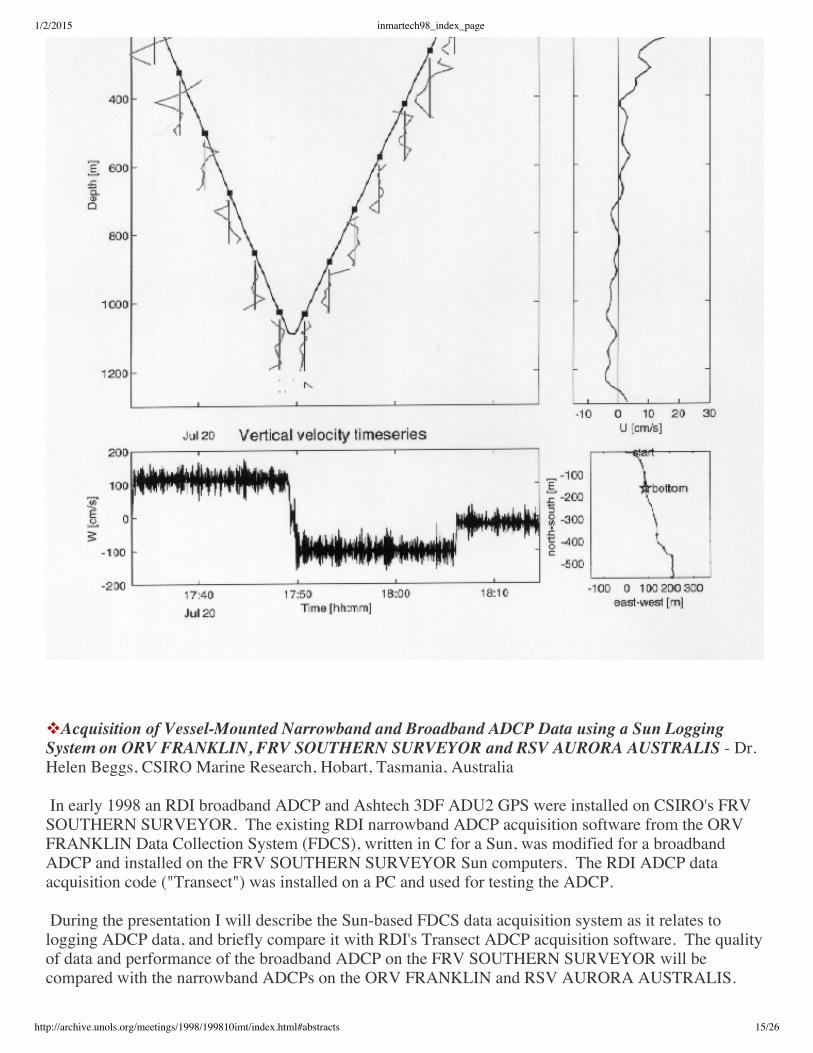
Hydrographic Tool - Dr. Martin Visbeck, Lamont-Doherty Earth Observatory Columbia University, NY During the last decade lowered acoustic Doppler current profiler (LADCPs) have matured from anexperimental instrument to an almost off-the-shelf standard tool for deep hydrographic programs such asWOCE (Firing, 1998). The first LADCP profile was taken in 1989 at a site near Hawaii by Firing andGordon (1990). The way the LADCP system works is that it relies on the fact that short current profilescan be 'pieced together' to obtain a full ocean depth velocity profile (Fig. 1). The initial results were nottoo encouraging since systematic errors of the order of 10 cm/s were expected, much too large to be usedfor quantitative purposes such as top to bottom transport calculations. However, proof of concept wasgiven and some first steps towards a useful processing algorithms were realized. A year later in 1990,Fischer and Visbeck (1993) used a similar system during a cruise in the equatorial Atlantic. They had theadvantage of simultaneous LADCP and Pegasus velocity profiles. The Pegasus is an acoustically trackedfree-falling float that can be used to accurately measure top to bottom ocean transports; however, itrequires bottom mounted and navigated acoustic beacons. Consequently each station takes several hoursof extra ship time plus the expense of a pair of acoustic beacons to obtain one Pegasus velocity profile. Incomparison the LADCP is much more attractive: no extra ship time is required and the running costs perstation are minimal. However, when care was taken during the data processing of the LADCP systemboth velocity estimates agreed. In particular the close comparison allowed us to develope a method tocompute the barotropic mean flow given accurate GPS ship navigation. During those first years self-contained ADCPs, typically used for moored applications, were mounted onthe CTD/rosette frame. Most of the early designs replaced two bottles in favor of the large ADCPS. Inparticular the narrow band 150 kHz full ocean depth system was very difficult to mount and handle due toits weight of app. 140 pounds. The next generation of broad band technology ADCPs promised much increased single ping accuracy,however, the range of useful data was reduced despite an effort to boost the power level of thetransducers. The instruments themselves were more compact and easier to handle, however, the powerrequirements increased by almost an order of magnitude. Consequently a rechargeable battery pack hat tobe added to the system in order to run an intense hydrographic program without unmounting and openingthe ADCP every few days. Better rosette designs emerged that were able to accommodate the newADCPs in the center of the package. Such configurations were used throughout the WOCE and provideda wealth of useful top to bottom velocity profiles. The latest generation of ADCPs are much smaller instruments with a frequency of either 300 kHz. Thenew instruments have no internal batteries and hence are extremely compact with a dimension of only9x8 inches and a weight of 30 pounds. Moreover, the price dropped dramatically and one can nowpurchase two transducer heads for the price of one of the traditional 150 kHz BB systems. In order tomake up for the reduced range of the higher frequency systems we have recently started to mount twoheads on one CTD frame, one looking upward and one looking downward. This LADCP2 system hasseveral other advantages (Visbeck, 1998): no complete loss of data when the CTD is close to the bottom,view of sea surface for an improved initial depth estimate and some built in redundancy. While mountingan upward looking system is not always easy to do, the small size and much reduced power requirementsmake the new LADCP system very adaptable to small CTD frames and towed vessels. Today there aretwo commercial vendors who both have promised to sell complete LADCP2 systems in the near future. Over the years the community has learned how to process the data, and we are beginning to understandhow instrumental and system errors affect the final velocity profiles. We have discovered regions in theworlds ocean with dramatically reduced instrument range due to low abundance of acoustic scatters. Oneof the surprises on the way was, that what initially seemed to be the hardest problem, i.e. to obtain thevertical mean velocity, turned out to be a very robust estimate for reasonably deep (long) CTD stations. We have learned how to use the 'water' bins for acceptable bottom tracking (Visbeck, 1998). We still
1/2/2015 inmartech98_index_page
http://archive.unols.org/meetings/1998/199810imt/index.html#abstracts 14/26
have not fully understood why sometimes the up and down cast velocity profiles differ dramatically,which ADCP beam angles are most versatile and what the tradeoff between accuracy and range is. We envision that in the very near future the LADCP system will be available on most hydrographicvessels. In conjunction with an easy to use processing software this will allow even the inexperienceduser to obtain full ocean depth velocity profiles at every CTD station. PRODUCTS from the LADCP system: · full ocean depth relative velocity profile · with GPS full ocean depth absolute velocity profile · accurate absolute velocity profiles within 300m of the ocean floor · profiles of acoustic back scatter · pitch, roll and heading of CTD/rosette · absolute position in X, Y and Z of CTD/rosette · measure distance of CTD/rosette of the bottom References: Firing, E. and R. Gordon, 1990: Deep ocean acoustic Doppler current profiling. Proc. IEEE FourthWorking Conf. on Current Measurements. 192-201 Firing, E. 1998: Lowered ADCP Developments and Use in WOCE. WOCE Newsletter, 30, 10-13 Fischer, J. and M. Visbeck, 1993: Deep velocity profiling with self-contained ADCP'S. J. Atmos. And Oceanic Technol., 10, 764-773. Visbeck. M 1998. Lowered Acoustic Doppler Current Profiler. http://www.ldeo.columbia.edu/~visbeck/ladcp/.
1/2/2015 inmartech98_index_page
http://archive.unols.org/meetings/1998/199810imt/index.html#abstracts 15/26
vAcquisition of Vessel-Mounted Narrowband and Broadband ADCP Data using a Sun LoggingSystem on ORV FRANKLIN, FRV SOUTHERN SURVEYOR and RSV AURORA AUSTRALIS - Dr.Helen Beggs, CSIRO Marine Research, Hobart, Tasmania, Australia In early 1998 an RDI broadband ADCP and Ashtech 3DF ADU2 GPS were installed on CSIRO's FRVSOUTHERN SURVEYOR. The existing RDI narrowband ADCP acquisition software from the ORVFRANKLIN Data Collection System (FDCS), written in C for a Sun, was modified for a broadbandADCP and installed on the FRV SOUTHERN SURVEYOR Sun computers. The RDI ADCP dataacquisition code ("Transect") was installed on a PC and used for testing the ADCP. During the presentation I will describe the Sun-based FDCS data acquisition system as it relates tologging ADCP data, and briefly compare it with RDI's Transect ADCP acquisition software. The qualityof data and performance of the broadband ADCP on the FRV SOUTHERN SURVEYOR will becompared with the narrowband ADCPs on the ORV FRANKLIN and RSV AURORA AUSTRALIS.
1/2/2015 inmartech98_index_page
http://archive.unols.org/meetings/1998/199810imt/index.html#abstracts 16/26
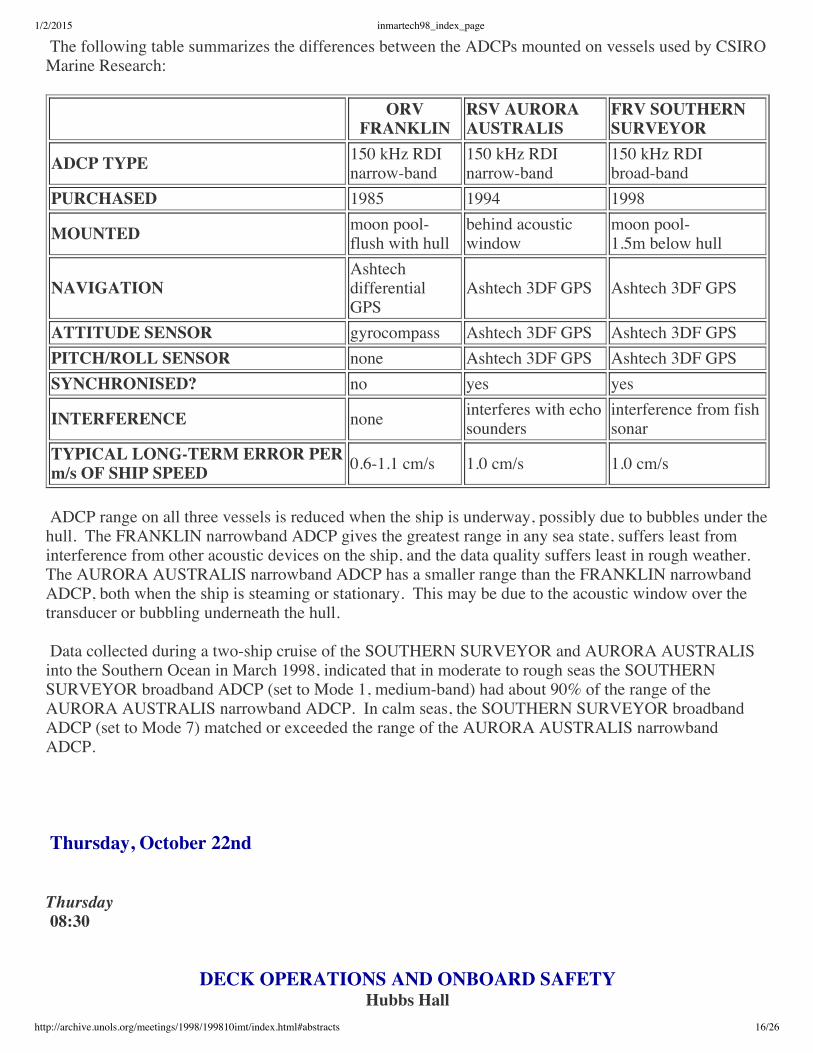
The following table summarizes the differences between the ADCPs mounted on vessels used by CSIROMarine Research:
ORVFRANKLIN
RSV AURORAAUSTRALIS
FRV SOUTHERNSURVEYOR
ADCP TYPE 150 kHz RDI narrow-band
150 kHz RDI narrow-band
150 kHz RDI broad-band
PURCHASED 1985 1994 1998
MOUNTED moon pool- flush with hull
behind acousticwindow
moon pool- 1.5m below hull
NAVIGATIONAshtechdifferentialGPS
Ashtech 3DF GPS Ashtech 3DF GPS
ATTITUDE SENSOR gyrocompass Ashtech 3DF GPS Ashtech 3DF GPSPITCH/ROLL SENSOR none Ashtech 3DF GPS Ashtech 3DF GPSSYNCHRONISED? no yes yes
INTERFERENCE none interferes with echosounders
interference from fishsonar
TYPICAL LONG-TERM ERROR PERm/s OF SHIP SPEED 0.6-1.1 cm/s 1.0 cm/s 1.0 cm/s
ADCP range on all three vessels is reduced when the ship is underway, possibly due to bubbles under thehull. The FRANKLIN narrowband ADCP gives the greatest range in any sea state, suffers least frominterference from other acoustic devices on the ship, and the data quality suffers least in rough weather. The AURORA AUSTRALIS narrowband ADCP has a smaller range than the FRANKLIN narrowbandADCP, both when the ship is steaming or stationary. This may be due to the acoustic window over thetransducer or bubbling underneath the hull. Data collected during a two-ship cruise of the SOUTHERN SURVEYOR and AURORA AUSTRALISinto the Southern Ocean in March 1998, indicated that in moderate to rough seas the SOUTHERNSURVEYOR broadband ADCP (set to Mode 1, medium-band) had about 90% of the range of theAURORA AUSTRALIS narrowband ADCP. In calm seas, the SOUTHERN SURVEYOR broadbandADCP (set to Mode 7) matched or exceeded the range of the AURORA AUSTRALIS narrowbandADCP.
Thursday, October 22nd Thursday 08:30
DECK OPERATIONS AND ONBOARD SAFETYHubbs Hall
1/2/2015 inmartech98_index_page
http://archive.unols.org/meetings/1998/199810imt/index.html#abstracts 17/26
Mr. Woody Sutherland (Scripps Institution of Oceanography), Chair
vResearch Vessel Operators’ Committee (RVOC) Safety Video - A recently completed 20 minute safetyvideo will be viewed. The film was developed by the RVOC Safety Committee and will be distributed toeach of the UNOLS research vessel. It is intended for viewing at the start of a science cruise to provideimportant shipboard safety information to the science party. The film, with an introduction by Dr. RobertGagosian, was shot on board R/V ENDEAVOR with special effects and graphics provided by JamestownMarine.
vOceanographic Research Vessel Deck Safety - Capt. Daniel S. Schwartz and Mr. George White,University of Washington, School of Oceanography The large oceanographic research vessels are away from homeport for extended periods, often operateindependently in remote areas away from shipping lanes (and assistance), and travel great distances. Science packages and instruments deployed in all types of weather from these vessels are unique andvaried; often heavy and/or bulky. Science operations may require small boat operations, working alltimes of the day and night, and are physically and mentally fatiguing. Many researchers are on board avessel for the first time. These parameters make safety on board research ships a critical-indeed primary-shared responsibility of the ship's crew, technicians and the researchers. The commercial fishing industryhas the highest rate of on-the-job fatalities of any occupation: higher even than coal mining. Thesimilarities, at least with respect to exposure to hazard while working on deck, between fishing vesselsand research vessels far outnumber the differences. Humanity, not to mention exposure to unwantedlitigation and expensive liability claims, demands we strive to achieve the lowest possible rates of injuryand loss of life. In addition, safety is cost effective and contributes to mission accomplishment, whileavoiding loss of expensive or irreplaceable scientific instruments and equipment. While there will be noattempt to provide an exhaustive inventory of hazards and safety procedures for research vessel deckoperations, this talk will attempt to outline some of the recurring areas of concern and ways we as acommunity should be addressing them.
vSmall Research Vessel Deck Operations - Mr. Steve Hartz, University of Alaska
vFiber Optic Cable
Thursday 08:30
Shipboard Networking and SeaNetSumner Auditorium
Mr. Barrie Walden (Woods Hole Oceanographic Institution), Chair
vData Collection and Distribution - Mr. Barrie Walden, Woods Hole Oceanographic Institution
1/2/2015 inmartech98_index_page
http://archive.unols.org/meetings/1998/199810imt/index.html#abstracts 18/26
The instrumentation on oceanographic research vessels has passed beyond stand-alone equipment andnow frequently requires sophisticated inter-connectivity. The problem of linking sensors to recordersremains but the “recorder” is likely to be a computer having strict time synchronization requirements,demanding additional data from various sources and, with appropriate connections, having the ability todisplay results in multiple formats on numerous media. To make matters more interesting, the scientificrequirements keep changing and the level of technology continually increases in an attempt to keep pace. Meeting today’s requirements is not difficult if you have a lot of money and you’re not concerned withanything past builder’s trials. However, if you live in the real world where funding is always an issue and“maintainability” is not somebody else’s problem, development of a versatile, reliable, instrumentationinstallation requires careful planning and considerable thought. This presentation will outline themethods employed on the ships operated by the Woods Hole Oceanographic Institution. All of theinstallations have been made within the past five years and the system on R/V ATLANTIS is still “underconstruction”. These systems are not perfect but they work well and provide insight into which areasneed careful attention.
vSeaNet - Extending the Internet to Oceanographic Research Platforms - Mr. Andrew Maffei and Mr.Steve Lerner, Woods Hole Oceanographic Institution The SeaNet Collaborative has been funded to provide hardware, software, and the network infrastructuresupport necessary to connect several US research vessels to the Internet. The high cost of satellite linkshas had a strong influence on the design of this system. A status report on the SeaNet effort, currentlybeing undertaken by Woods Hole Oceanographic Institution, Lamont Doherty Earth Observatory, theNaval Postgraduate School, Omnet, Inc. and Joint Oceanographic Institutions, Inc as well as associatedcorporate partners will be given. Funding is being provided by the US NOPP program.
vSensor Data Acquisition and Display via the Ship Network - Mr. Dennis Shields, NationalOceanographic and Atmospheric Administration The talk will provide a description and demo of the Scientific Computer System (SCS) that is presentlyinstalled on ten NOAA vessels. This system acquires data from a wide variety of ship sensors eitherdirectly or through the network. The network is also used to provide users real-time access to the data,displays and graphs via a client server architecture. SCS is based on the Microsoft Windows NToperating system and is written in C++ for pentium PC's.
v E-mail on the Woods Hole Oceanographic Institution Ships - Mr. James Akens, Woods HoleOceanographic Institution This will be a discussion of the e-mail system used by Woods Hole Oceanographic Institution Ships. This system is Linux based and uses no proprietary software. The code is written in Perl and Expect. Topics to be covered include: initial installation, administration, maintenance tools, billing tools and theoverall cost of operation. Particular emphasis will be given to a discussion of the message filteringsystem. This allows control of recipients and message size from either the ship or shore.
v Direct Connection Network Sensor Interfaces - Mr. Richard Findley, University of Miami
1/2/2015 inmartech98_index_page
http://archive.unols.org/meetings/1998/199810imt/index.html#abstracts 19/26
Making high accuracy measurements from an analog sensor is difficult in a shipboard environment. There are line losses and radio frequency interference problems. Multiple systems may need immediateaccess to data from the same sensor simultaneously. Conversion from raw values to engineering unitsand the application of calibration constants must be accomplished - in real time. To solve these problems the University of Miami Marine Technology Group is implementing the use ofcommercially available high accuracy sensor interfaces directly connected to the ship's computernetwork. A description of available interfaces and specifications will be given along with a live demonstrationusing these interfaces with a graphical programming language.
Thursday 13:00 Technical Workshop
CTD PACKAGESSumner Auditorium
Mr. Woody Sutherland (Scripps Institution of Oceanography), Chair vWOCE Operations - Mr. Frank Delahoyde, Scripps Institution of Oceanography
vSeaBird CTD Data Processing in Coastal Waters - Ms. Kristen Sanborn, Scripps Institution ofOceanography The SeaBird CTD Data Processing in Coastal Waters presentation will address: I. The importance of calibrations of the sensors. II. Problems encountered with the SeaBird Processing Programs and programs STS/ODF have developedto augment the SeaBird Programs. III. Proper documenting of problems that are encountered at sea to aid the final data processing. IV. Changes STS/Oceanographic Data Facility have made to the SeaBird method of data acquisition.
v Data Evaluation and Quality Control for Routine CTD/Hydrographic Data - Dr. James Swift, UCSDScripps Institution of Oceanography Data quality assessment of routine CTD /hydrographic data is learned over years of practice. Somesimple aspects of practice do, however, lead to improved reliability and documentation of data. Theseinclude:
wfor water sample data: verification of the collection depth and unambiguous association of that depth with a unique sampleidentifier, knowing the degree to which the water which issued from the sampling spigot matched the characteristicsof the water from the collection level,