Embed Size (px)
Citation preview
Fish Intercalibration in Rivers, Lakes and TraC
Dr. Fiona Kelly
Andrew Harrison, Lynda Connor, Ronan Matson, Rory Feeney, Emma Morrissey, Ciara Wogerbauer and Kieran Rocks (Roisin
O’Callaghan, Grainne Hanna, Trevor Stafford, Brian Hayden, Glen Wightman, Mo Lordan, Trevor Champ)
Plus MANY staff from the IFI RBD offices
Inland Fisheries Ireland
Overview:
Presentation duration of 30 minutes (approx) to inform you on:
• Rivers
• Summary of FCS2 Ireland
• IC
• Lakes
• Summary of FIL2
• IC
• TRaC
• Summary of TFCI
• IC
WFD Fish Intercalibration
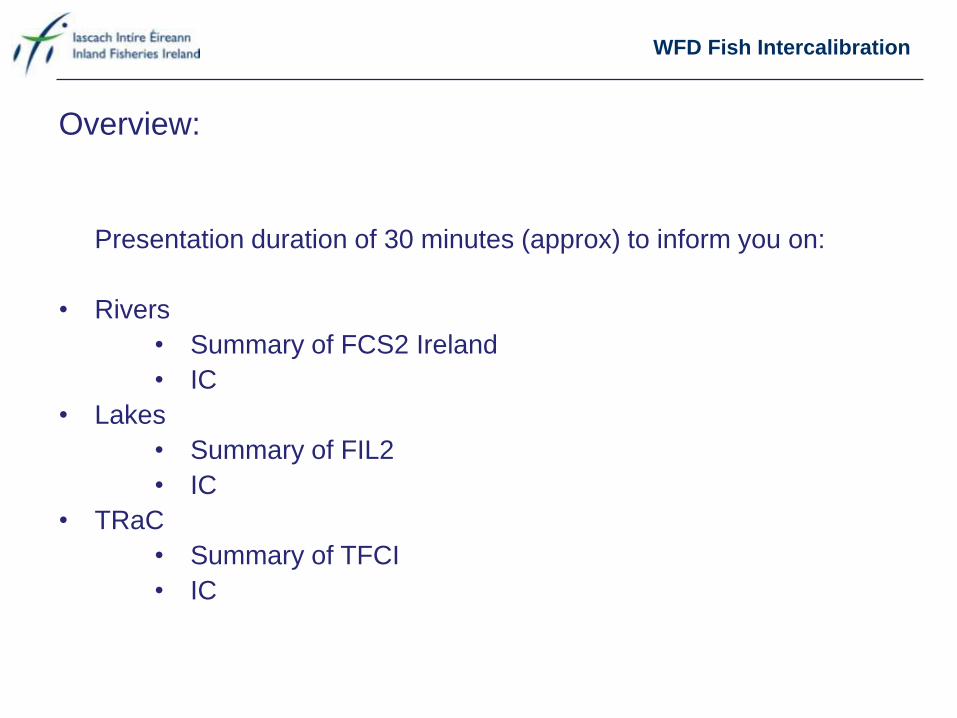
RIVERS: Fisheries Classification Scheme 2 Ireland (FCS2)
WFD Fish Classification Tool - Rivers
Project Management: SNIFFER
Developers: HR Wallingford (David Wyncoll & Valerie Bain)
Data Sources: Inland Fisheries Ireland and NIEA/AFBI
Funding sources: EPA, NIEA & SEPA
TAG: Fiona Kelly, Ronan Matson and Andrew Harrison (IFI),
Jake Gibson and Rosetta Mullan (NIEA), Robert Rosell and
Liam O’ Connor (AFBI), Paddy Boylan (LA), Willie Duncan
and Alistair Duguid (SEPA), Colin Bean (SNH), Iain
Malcolm (MS), Graeme Storey (EA)
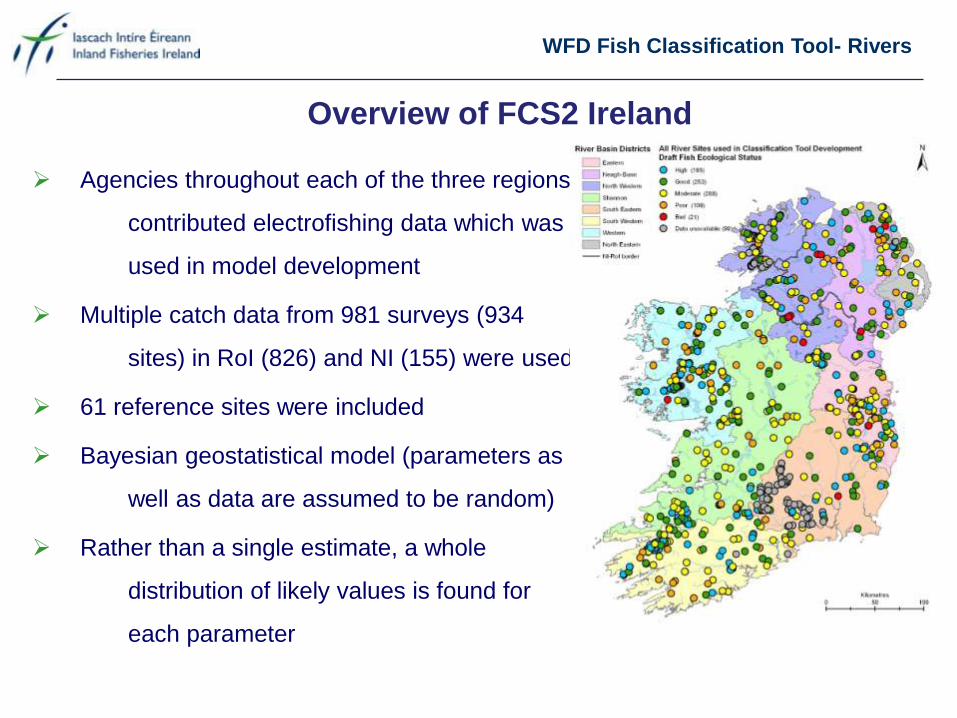
Agencies throughout each of the three regions
contributed electrofishing data which was
used in model development
Multiple catch data from 981 surveys (934
sites) in RoI (826) and NI (155) were used
61 reference sites were included
Bayesian geostatistical model (parameters as
well as data are assumed to be random)
Rather than a single estimate, a whole
distribution of likely values is found for
each parameter
Overview of FCS2 Ireland
WFD Fish Classification Tool- Rivers
Compares fish species metrics (abundance and prevalence) at a given site
(observed) to those predicted (expected) for that site under reference (or
unimpaired) conditions
Uses a range of abiotic and pressure variables (e.g. MRP)
Takes into account geographical location of a site because different fish species
can predominate in different parts of the country
An EQR (more correctly, probability) for abundance and prevalence
(probability of a species being present at a site) for each of 17 fish models is
generated
A site EQR, survey EQR and a WB EQR are generated
Overview of FCS2 Ireland
WFD Fish Classification Tool- Rivers
WFD Fish Classification Tool- Rivers
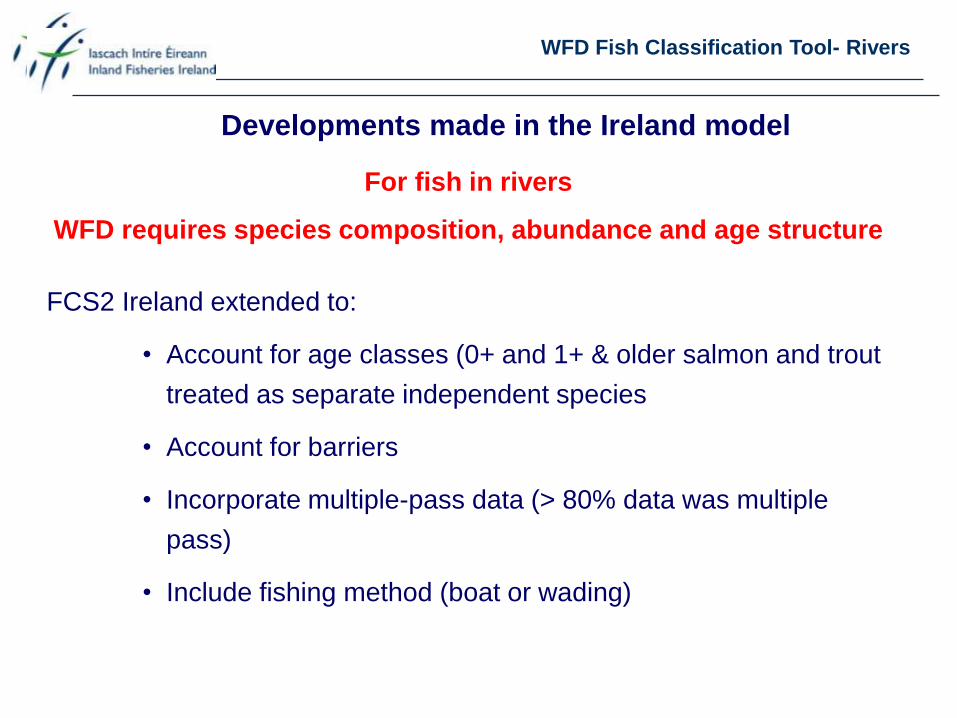
Developments made in the Ireland model
FCS2 Ireland extended to:
• Account for age classes (0+ and 1+ & older salmon and trout
treated as separate independent species
• Account for barriers
• Incorporate multiple-pass data (> 80% data was multiple
pass)
• Include fishing method (boat or wading)
For fish in rivers
WFD requires species composition, abundance and age structure
WFD Fish Classification Tool- Rivers
Species
Expected
prevalence
Observed
total catch
Expected total
catch if present
Expected total
catch
Species
EQR mean
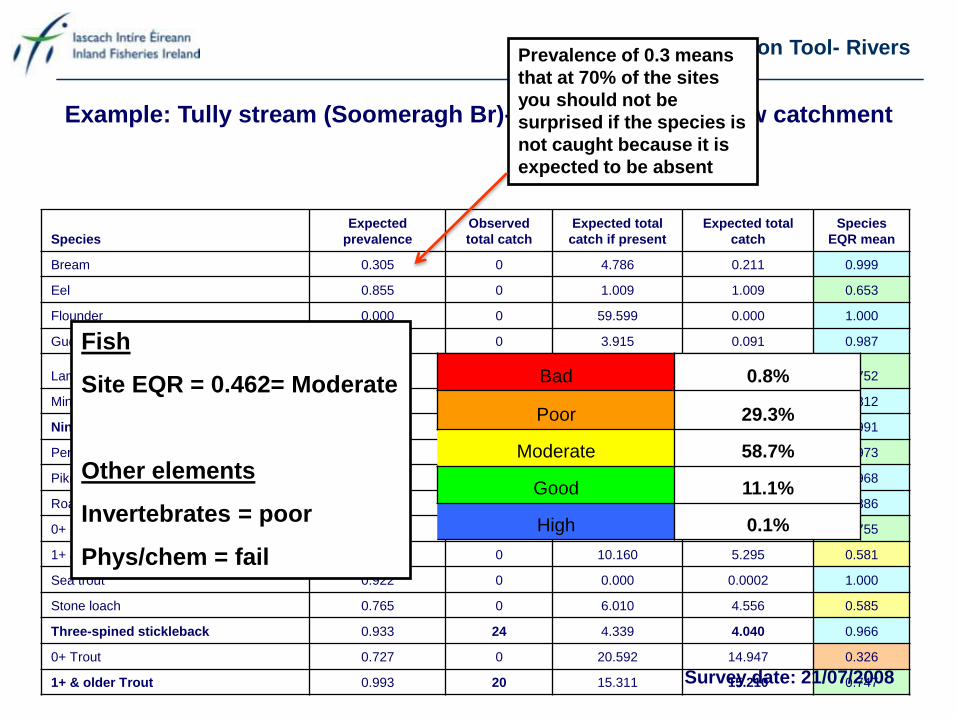
Bream 0.305 0 4.786 0.211 0.999
Eel 0.855 0 1.009 1.009 0.653
Flounder 0.000 0 59.599 0.000 1.000
Gudgeon 0.024 0 3.915 0.091 0.987
Lamprey 0.941 0 1.371 1.266 0.752
Minnow 0.271 0 33.719 8.779 0.812
Nine-spined stickleback 0.097 1 0.686 0.050 0.991
Perch 0.069 0 1.957 0.108 0.973
Pike 0.171 0 0.262 0.041 0.968
Roach 0.230 0 8.453 1.864 0.886
0+ Salmon 0.373 0 9.828 3.473 0.755
1+ & older Salmon 0.524 0 10.160 5.295 0.581
Sea trout 0.922 0 0.000 0.0002 1.000
Stone loach 0.765 0 6.010 4.556 0.585
Three-spined stickleback 0.933 24 4.339 4.040 0.966
0+ Trout 0.727 0 20.592 14.947 0.326
1+ & older Trout 0.993 20 15.311 15.210 0.747
Example: Tully stream (Soomeragh Br)- IR14T020390– Barrow catchment
Survey date: 21/07/2008
Fish
Site EQR = 0.462= Moderate
Other elements
Invertebrates = poor
Phys/chem = fail
Bad 0.8%
Poor 29.3%
Moderate 58.7%
Good 11.1%
High 0.1%
Prevalence of 0.3 means
that at 70% of the sites
you should not be
surprised if the species is
not caught because it is
expected to be absent
WFD Fish Classification Tool- Rivers
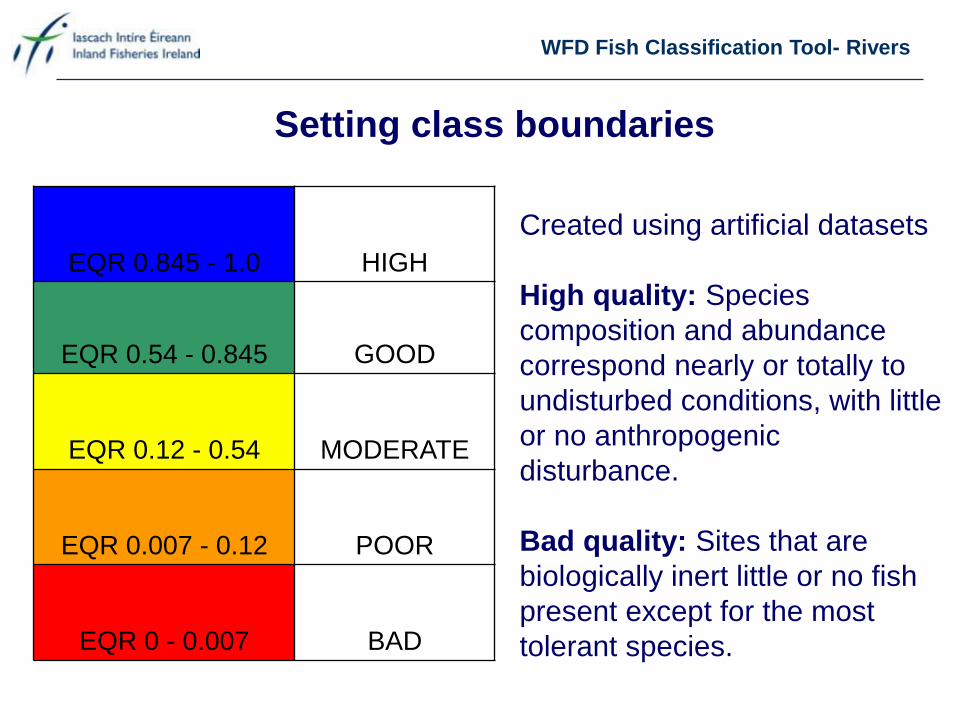
Setting class boundaries
EQR 0.845 - 1.0 HIGH
EQR 0.54 - 0.845 GOOD
EQR 0.12 - 0.54 MODERATE
EQR 0.007 - 0.12 POOR
EQR 0 - 0.007 BAD
Created using artificial datasets
High quality: Species
composition and abundance
correspond nearly or totally to
undisturbed conditions, with little
or no anthropogenic
disturbance.
Bad quality: Sites that are
biologically inert little or no fish
present except for the most
tolerant species.
WFD Fish Intercalibration- Rivers
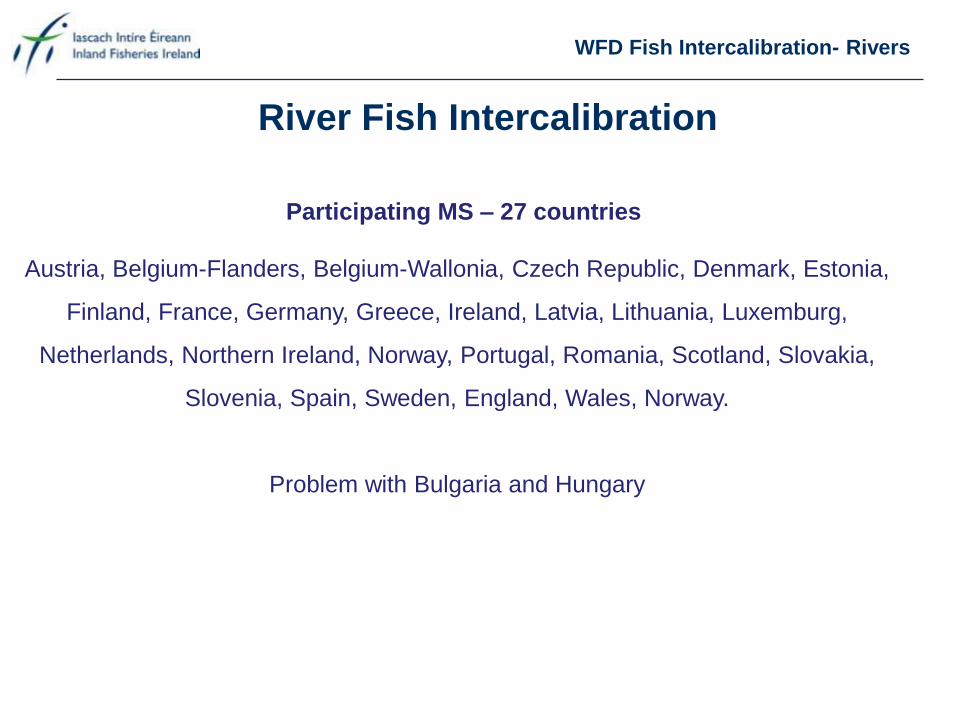
River Fish Intercalibration
Participating MS – 27 countries
Austria, Belgium-Flanders, Belgium-Wallonia, Czech Republic, Denmark, Estonia,
Finland, France, Germany, Greece, Ireland, Latvia, Lithuania, Luxemburg,
Netherlands, Northern Ireland, Norway, Portugal, Romania, Scotland, Slovakia,
Slovenia, Spain, Sweden, England, Wales, Norway.
Problem with Bulgaria and Hungary
WFD Fish Intercalibration - Rivers
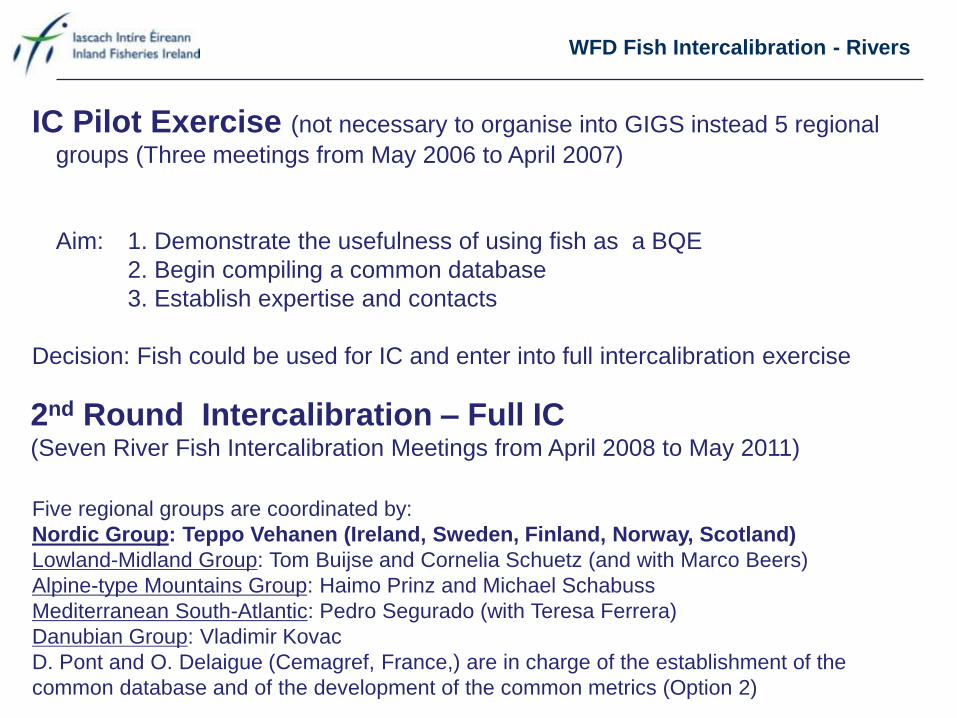
IC Pilot Exercise (not necessary to organise into GIGS instead 5 regional
groups (Three meetings from May 2006 to April 2007)
Aim: 1. Demonstrate the usefulness of using fish as a BQE
2. Begin compiling a common database
3. Establish expertise and contacts
Decision: Fish could be used for IC and enter into full intercalibration exercise
2nd Round Intercalibration – Full IC (Seven River Fish Intercalibration Meetings from April 2008 to May 2011)
Five regional groups are coordinated by:
Nordic Group: Teppo Vehanen (Ireland, Sweden, Finland, Norway, Scotland)
Lowland-Midland Group: Tom Buijse and Cornelia Schuetz (and with Marco Beers)
Alpine-type Mountains Group: Haimo Prinz and Michael Schabuss
Mediterranean South-Atlantic: Pedro Segurado (with Teresa Ferrera)
Danubian Group: Vladimir Kovac
D. Pont and O. Delaigue (Cemagref, France,) are in charge of the establishment of the
common database and of the development of the common metrics (Option 2)
WFD Fish Intercalibration - Rivers
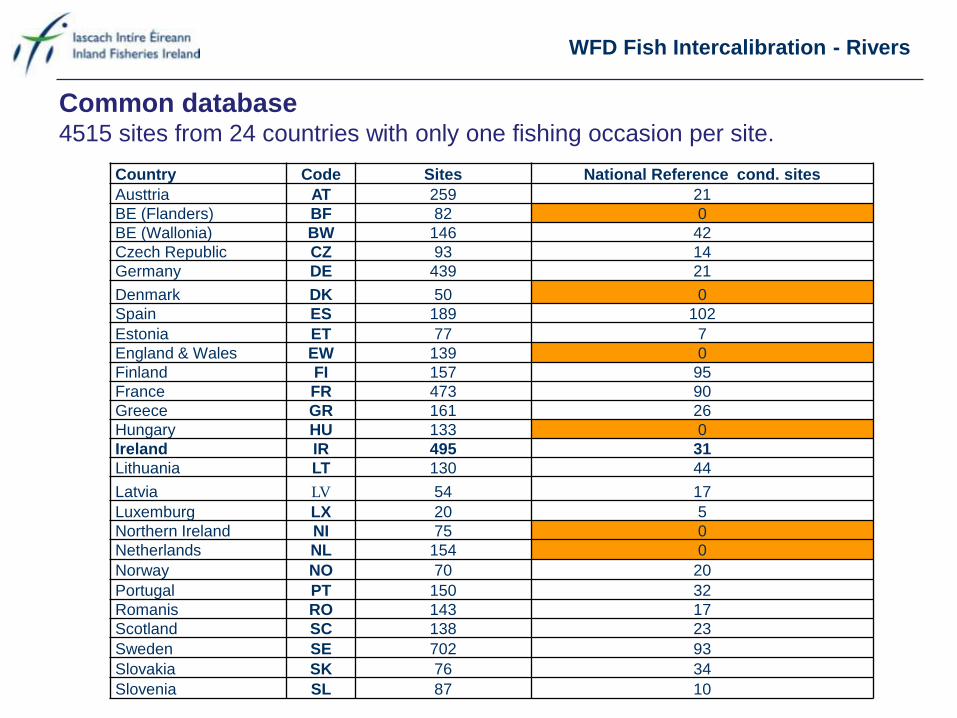
Common database 4515 sites from 24 countries with only one fishing occasion per site.
Country Code Sites National Reference cond. sites
Austtria AT 259 21
BE (Flanders) BF 82 0
BE (Wallonia) BW 146 42
Czech Republic CZ 93 14
Germany DE 439 21
Denmark DK 50 0
Spain ES 189 102
Estonia ET 77 7
England & Wales EW 139 0
Finland FI 157 95
France FR 473 90
Greece GR 161 26
Hungary HU 133 0
Ireland IR 495 31
Lithuania LT 130 44
Latvia LV 54 17
Luxemburg LX 20 5
Northern Ireland NI 75 0
Netherlands NL 154 0
Norway NO 70 20
Portugal PT 150 32
Romanis RO 143 17
Scotland SC 138 23
Sweden SE 702 93
Slovakia SK 76 34
Slovenia SL 87 10
WFD Fish Intercalibration - Rivers
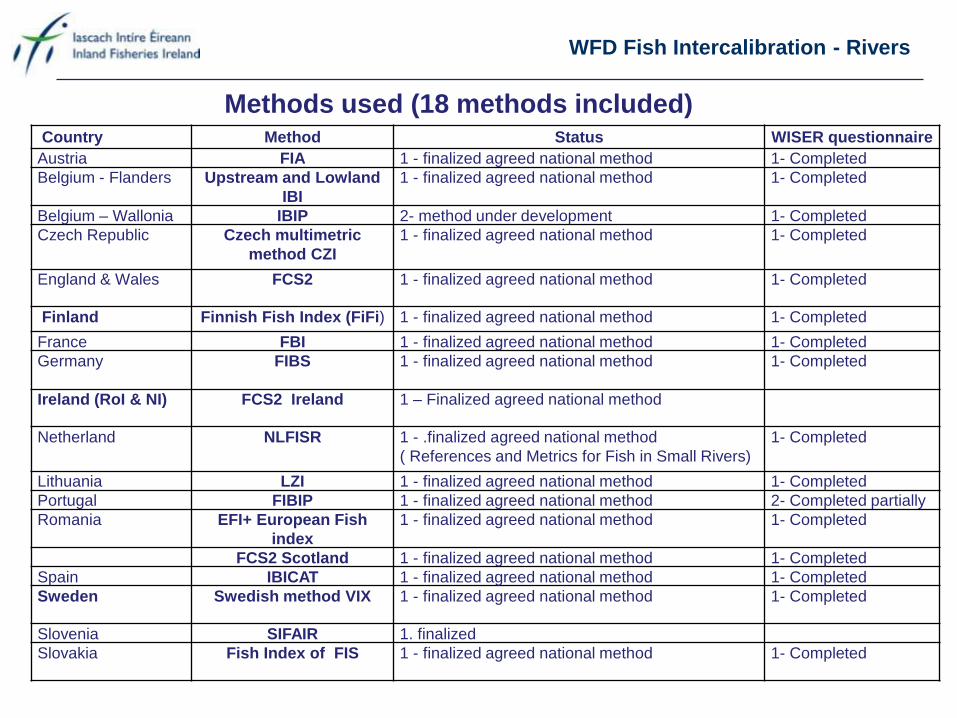
Methods used (18 methods included)
Country Method Status WISER questionnaire
Austria FIA 1 - finalized agreed national method 1- Completed
Belgium - Flanders Upstream and Lowland
IBI
1 - finalized agreed national method 1- Completed
Belgium – Wallonia IBIP 2- method under development 1- Completed
Czech Republic Czech multimetric
method CZI
1 - finalized agreed national method 1- Completed
England & Wales FCS2 1 - finalized agreed national method 1- Completed
Finland Finnish Fish Index (FiFi) 1 - finalized agreed national method 1- Completed
France FBI 1 - finalized agreed national method 1- Completed
Germany
FIBS 1 - finalized agreed national method 1- Completed
Ireland (RoI & NI) FCS2 Ireland 1 – Finalized agreed national method
Netherland NLFISR 1 - .finalized agreed national method
( References and Metrics for Fish in Small Rivers)
1- Completed
Lithuania LZI 1 - finalized agreed national method 1- Completed
Portugal FIBIP 1 - finalized agreed national method 2- Completed partially
Romania EFI+ European Fish
index
1 - finalized agreed national method 1- Completed
FCS2 Scotland 1 - finalized agreed national method 1- Completed
Spain IBICAT 1 - finalized agreed national method 1- Completed
Sweden Swedish method VIX 1 - finalized agreed national method 1- Completed
Slovenia SIFAIR 1. finalized
Slovakia Fish Index of FIS 1 - finalized agreed national method 1- Completed
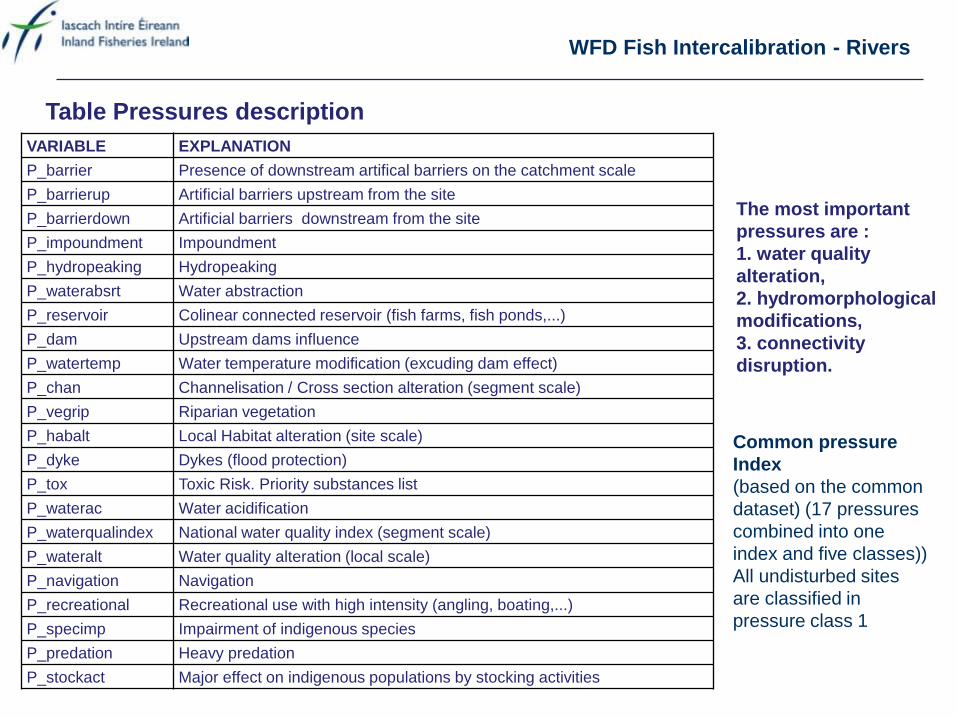
VARIABLE EXPLANATION
P_barrier Presence of downstream artifical barriers on the catchment scale
P_barrierup Artificial barriers upstream from the site
P_barrierdown Artificial barriers downstream from the site
P_impoundment Impoundment
P_hydropeaking Hydropeaking
P_waterabsrt Water abstraction
P_reservoir Colinear connected reservoir (fish farms, fish ponds,...)
P_dam Upstream dams influence
P_watertemp Water temperature modification (excuding dam effect)
P_chan Channelisation / Cross section alteration (segment scale)
P_vegrip Riparian vegetation
P_habalt Local Habitat alteration (site scale)
P_dyke Dykes (flood protection)
P_tox Toxic Risk. Priority substances list
P_waterac Water acidification
P_waterqualindex National water quality index (segment scale)
P_wateralt Water quality alteration (local scale)
P_navigation Navigation
P_recreational Recreational use with high intensity (angling, boating,...)
P_specimp Impairment of indigenous species
P_predation Heavy predation
P_stockact Major effect on indigenous populations by stocking activities
Table Pressures description
WFD Fish Intercalibration - Rivers
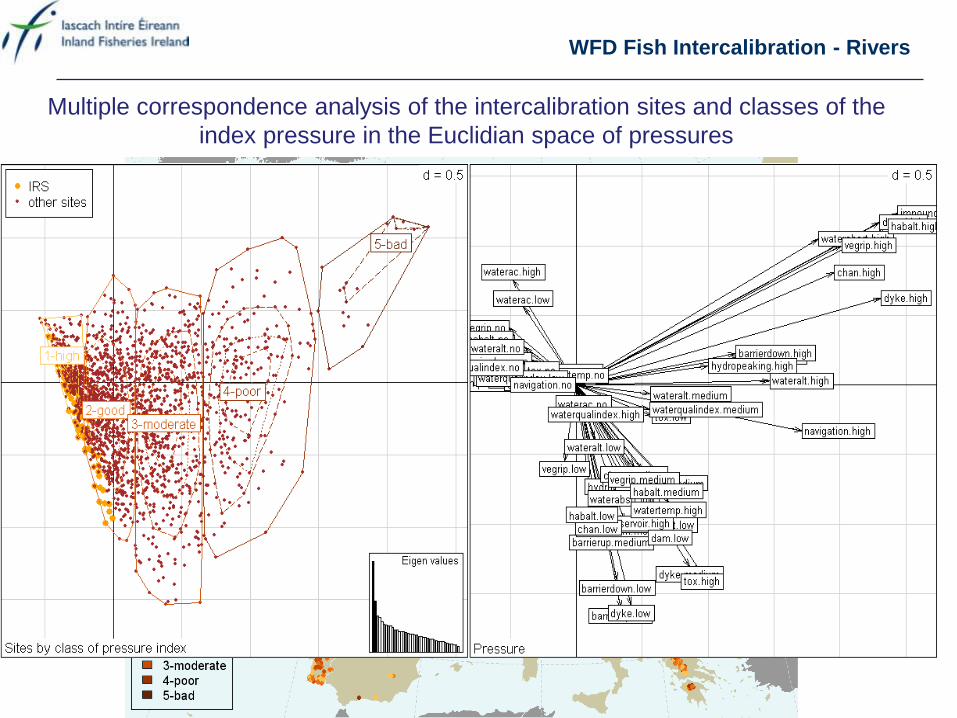
The most important
pressures are :
1. water quality
alteration,
2. hydromorphological
modifications,
3. connectivity
disruption.
Common pressure
Index
(based on the common
dataset) (17 pressures
combined into one
index and five classes))
All undisturbed sites
are classified in
pressure class 1
WFD Fish Intercalibration - Rivers
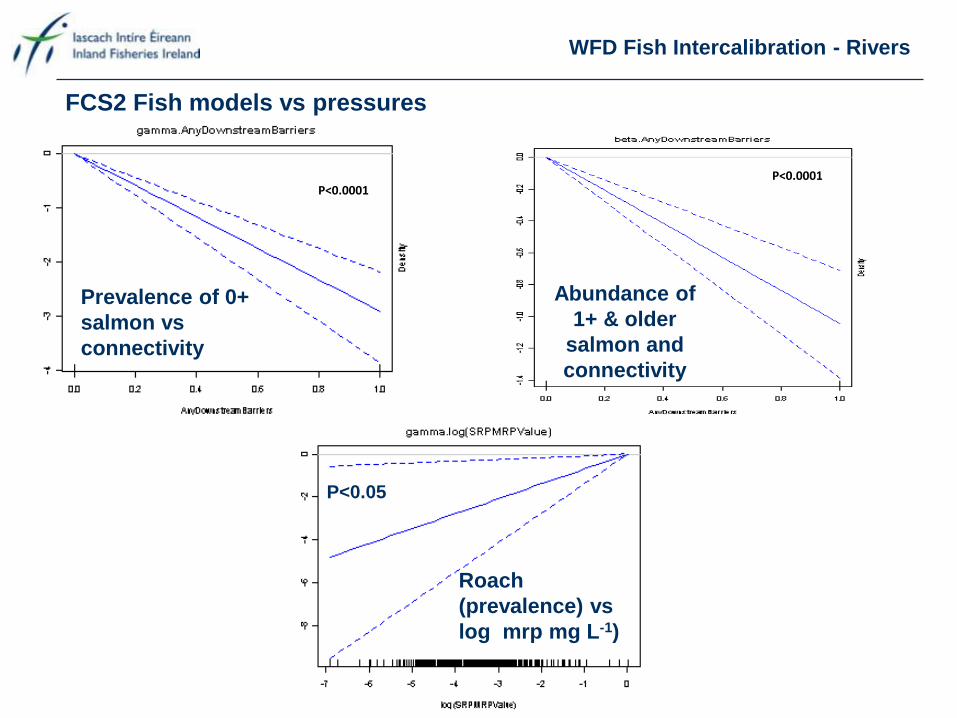
P<0.0001 P<0.0001
Roach
(prevalence) vs
log mrp mg L-1)
FCS2 Fish models vs pressures
Abundance of
1+ & older
salmon and
connectivity
Prevalence of 0+
salmon vs
connectivity
P<0.05
WFD Fish Intercalibration - Rivers
no low medium high
0.2
0.4
0.6
0.8
1.0
P_barrierup
Cannot test
no low medium high
0.2
0.4
0.6
0.8
1.0
P_barrierdown
p = 0.190
no low high
0.2
0.4
0.6
0.8
1.0
P_impoundment
Cannot test
no low high
0.2
0.4
0.6
0.8
1.0
P_hydropeaking
Cannot test
no low medium high
0.2
0.4
0.6
0.8
1.0
P_waterabsrt
Cannot test
no high
0.2
0.4
0.6
0.8
1.0
P_reservoir
Cannot test
no low high
0.2
0.4
0.6
0.8
1.0
P_dam
Cannot test
no high
0.2
0.4
0.6
0.8
1.0
P_watertemp
Cannot test
no low medium high
0.2
0.4
0.6
0.8
1.0
P_chan
p = 0.558
no low medium high
0.2
0.4
0.6
0.8
1.0
P_vegrip
Cannot test
no low medium high
0.2
0.4
0.6
0.8
1.0
P_habalt
p = 0.484
no low medium high
0.2
0.4
0.6
0.8
1.0
P_dyke
Cannot test
no low high
0.2
0.4
0.6
0.8
1.0
P_tox
Cannot test
no low high
0.2
0.4
0.6
0.8
1.0
P_waterac
Cannot test
no low medium high
0.2
0.4
0.6
0.8
1.0
P_waterqualindex
p = 0.000
no low medium high
0.2
0.4
0.6
0.8
1.0
P_wateralt
p = 0.020
no high
0.2
0.4
0.6
0.8
1.0
P_navigation
Cannot test
1-high 2-good 45-pb
0.2
0.4
0.6
0.8
1.0
Press_index_cl2
Cannot test
IR_FCS2_index (all sites)
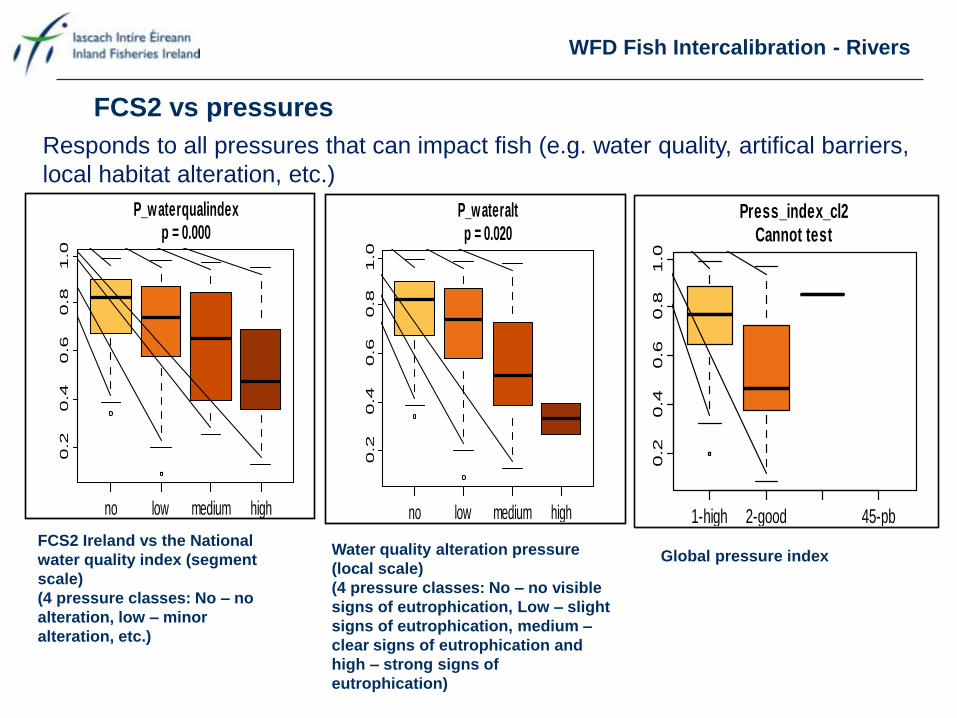
FCS2 vs pressures
no low medium high
0.2
0.4
0.6
0.8
1.0
P_barrierup
Cannot test
no low medium high
0.2
0.4
0.6
0.8
1.0
P_barrierdown
p = 0.190
no low high
0.2
0.4
0.6
0.8
1.0
P_impoundment
Cannot test
no low high
0.2
0.4
0.6
0.8
1.0
P_hydropeaking
Cannot test
no low medium high
0.2
0.4
0.6
0.8
1.0
P_waterabsrt
Cannot test
no high
0.2
0.4
0.6
0.8
1.0
P_reservoir
Cannot test
no low high
0.2
0.4
0.6
0.8
1.0
P_dam
Cannot test
no high
0.2
0.4
0.6
0.8
1.0
P_watertemp
Cannot test
no low medium high
0.2
0.4
0.6
0.8
1.0
P_chan
p = 0.558
no low medium high
0.2
0.4
0.6
0.8
1.0
P_vegrip
Cannot test
no low medium high
0.2
0.4
0.6
0.8
1.0
P_habalt
p = 0.484
no low medium high
0.2
0.4
0.6
0.8
1.0
P_dyke
Cannot test
no low high
0.2
0.4
0.6
0.8
1.0
P_tox
Cannot test
no low high
0.2
0.4
0.6
0.8
1.0
P_waterac
Cannot test
no low medium high
0.2
0.4
0.6
0.8
1.0
P_waterqualindex
p = 0.000
no low medium high
0.2
0.4
0.6
0.8
1.0
P_wateralt
p = 0.020
no high
0.2
0.4
0.6
0.8
1.0
P_navigation
Cannot test
1-high 2-good 45-pb
0.2
0.4
0.6
0.8
1.0
Press_index_cl2
Cannot test
IR_FCS2_index (all sites)
no low medium high
0.2
0.4
0.6
0.8
1.0
P_barrierup
Cannot test
no low medium high
0.2
0.4
0.6
0.8
1.0
P_barrierdown
p = 0.190
no low high0.2
0.4
0.6
0.8
1.0
P_impoundment
Cannot test
no low high
0.2
0.4
0.6
0.8
1.0
P_hydropeaking
Cannot test
no low medium high
0.2
0.4
0.6
0.8
1.0
P_waterabsrt
Cannot test
no high
0.2
0.4
0.6
0.8
1.0
P_reservoir
Cannot test
no low high
0.2
0.4
0.6
0.8
1.0
P_dam
Cannot test
no high
0.2
0.4
0.6
0.8
1.0
P_watertemp
Cannot test
no low medium high
0.2
0.4
0.6
0.8
1.0
P_chan
p = 0.558
no low medium high
0.2
0.4
0.6
0.8
1.0
P_vegrip
Cannot test
no low medium high
0.2
0.4
0.6
0.8
1.0
P_habalt
p = 0.484
no low medium high
0.2
0.4
0.6
0.8
1.0
P_dyke
Cannot test
no low high
0.2
0.4
0.6
0.8
1.0
P_tox
Cannot test
no low high
0.2
0.4
0.6
0.8
1.0
P_waterac
Cannot test
no low medium high
0.2
0.4
0.6
0.8
1.0
P_waterqualindex
p = 0.000
no low medium high
0.2
0.4
0.6
0.8
1.0
P_wateralt
p = 0.020
no high
0.2
0.4
0.6
0.8
1.0
P_navigation
Cannot test
1-high 2-good 45-pb
0.2
0.4
0.6
0.8
1.0
Press_index_cl2
Cannot test
IR_FCS2_index (all sites)
Responds to all pressures that can impact fish (e.g. water quality, artifical barriers,
local habitat alteration, etc.)
FCS2 Ireland vs the National
water quality index (segment
scale)
(4 pressure classes: No – no
alteration, low – minor
alteration, etc.)
Water quality alteration pressure
(local scale)
(4 pressure classes: No – no visible
signs of eutrophication, Low – slight
signs of eutrophication, medium –
clear signs of eutrophication and
high – strong signs of
eutrophication)
Global pressure index
WFD Fish Intercalibration - Rivers
Multiple correspondence analysis of the intercalibration sites and classes of the
index pressure in the Euclidian space of pressures
WFD Fish Intercalibration - Rivers
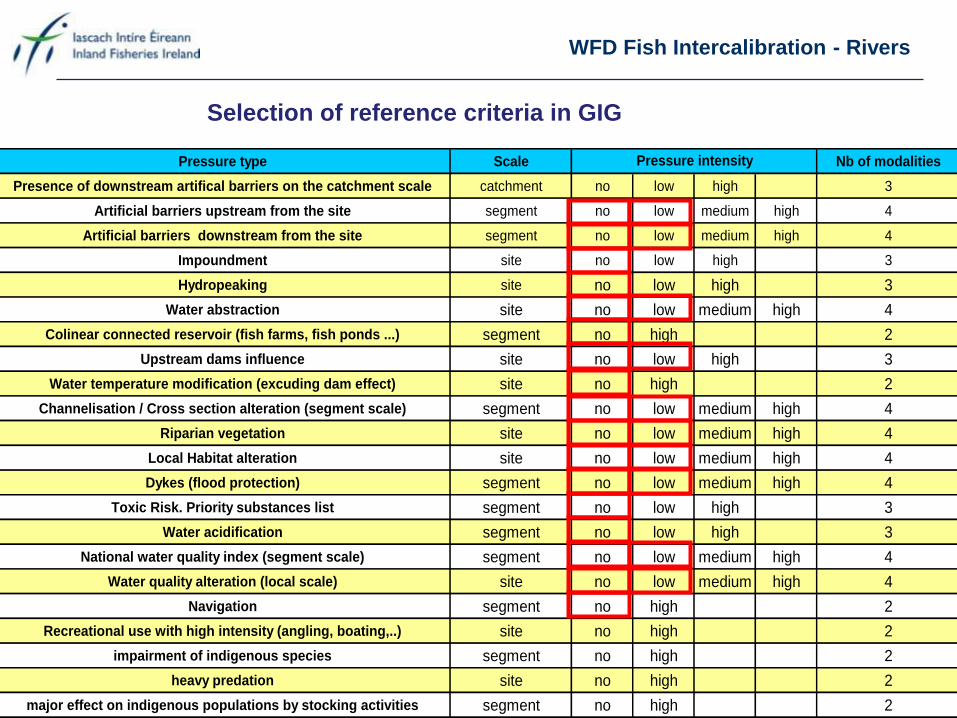
Selection of reference criteria in GIG
Pressure type Scale Nb of modalities
Presence of downstream artifical barriers on the catchment scale catchment no low high 3
Artificial barriers upstream from the site segment no low medium high 4
Artificial barriers downstream from the site segment no low medium high 4
Impoundment site no low high 3
Hydropeaking site no low high 3
Water abstraction site no low medium high 4
Colinear connected reservoir (fish farms, fish ponds ...) segment no high 2
Upstream dams influence site no low high 3
Water temperature modification (excuding dam effect) site no high 2
Channelisation / Cross section alteration (segment scale) segment no low medium high 4
Riparian vegetation site no low medium high 4
Local Habitat alteration site no low medium high 4
Dykes (flood protection) segment no low medium high 4
Toxic Risk. Priority substances list segment no low high 3
Water acidification segment no low high 3
National water quality index (segment scale) segment no low medium high 4
Water quality alteration (local scale) site no low medium high 4
Navigation segment no high 2
Recreational use with high intensity (angling, boating,..) site no high 2
impairment of indigenous species segment no high 2
heavy predation site no high 2
major effect on indigenous populations by stocking activities segment no high 2
Pressure intensity
WFD Fish Intercalibration - Rivers
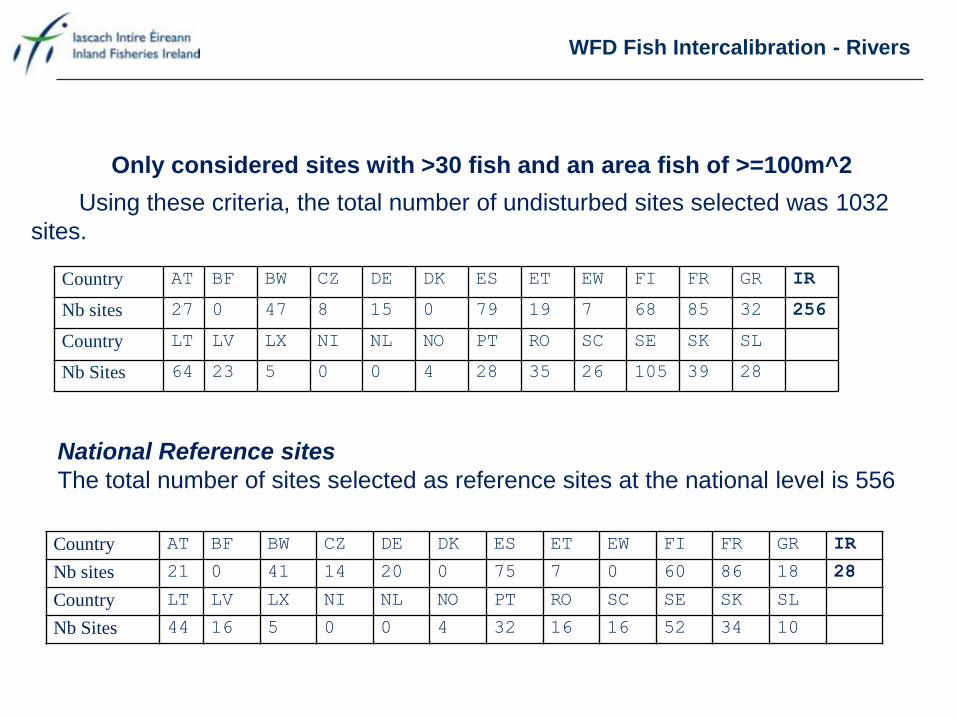
Only considered sites with >30 fish and an area fish of >=100m^2
Country AT BF BW CZ DE DK ES ET EW FI FR GR IR
Nb sites 27 0 47 8 15 0 79 19 7 68 85 32 256
Country LT LV LX NI NL NO PT RO SC SE SK SL
Nb Sites 64 23 5 0 0 4 28 35 26 105 39 28
Using these criteria, the total number of undisturbed sites selected was 1032
sites.
National Reference sites
The total number of sites selected as reference sites at the national level is 556
Country AT BF BW CZ DE DK ES ET EW FI FR GR IR
Nb sites 21 0 41 14 20 0 75 7 0 60 86 18 28
Country LT LV LX NI NL NO PT RO SC SE SK SL
Nb Sites 44 16 5 0 0 4 32 16 16 52 34 10
WFD Fish Intercalibration - Rivers
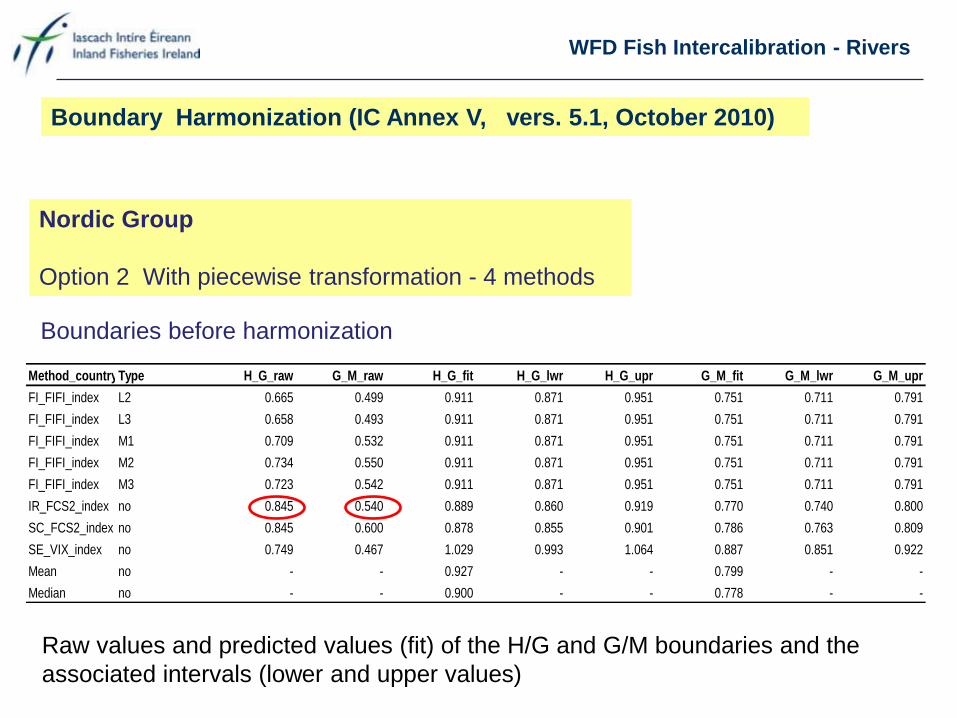
Nordic Group
Option 2 With piecewise transformation - 4 methods
Method_countryType H_G_raw G_M_raw H_G_fit H_G_lwr H_G_upr G_M_fit G_M_lwr G_M_upr
FI_FIFI_index L2 0.665 0.499 0.911 0.871 0.951 0.751 0.711 0.791
FI_FIFI_index L3 0.658 0.493 0.911 0.871 0.951 0.751 0.711 0.791
FI_FIFI_index M1 0.709 0.532 0.911 0.871 0.951 0.751 0.711 0.791
FI_FIFI_index M2 0.734 0.550 0.911 0.871 0.951 0.751 0.711 0.791
FI_FIFI_index M3 0.723 0.542 0.911 0.871 0.951 0.751 0.711 0.791
IR_FCS2_index no 0.845 0.540 0.889 0.860 0.919 0.770 0.740 0.800
SC_FCS2_index no 0.845 0.600 0.878 0.855 0.901 0.786 0.763 0.809
SE_VIX_index no 0.749 0.467 1.029 0.993 1.064 0.887 0.851 0.922
Mean no - - 0.927 - - 0.799 - -
Median no - - 0.900 - - 0.778 - -
Boundaries before harmonization
Raw values and predicted values (fit) of the H/G and G/M boundaries and the
associated intervals (lower and upper values)
Boundary Harmonization (IC Annex V, vers. 5.1, October 2010)
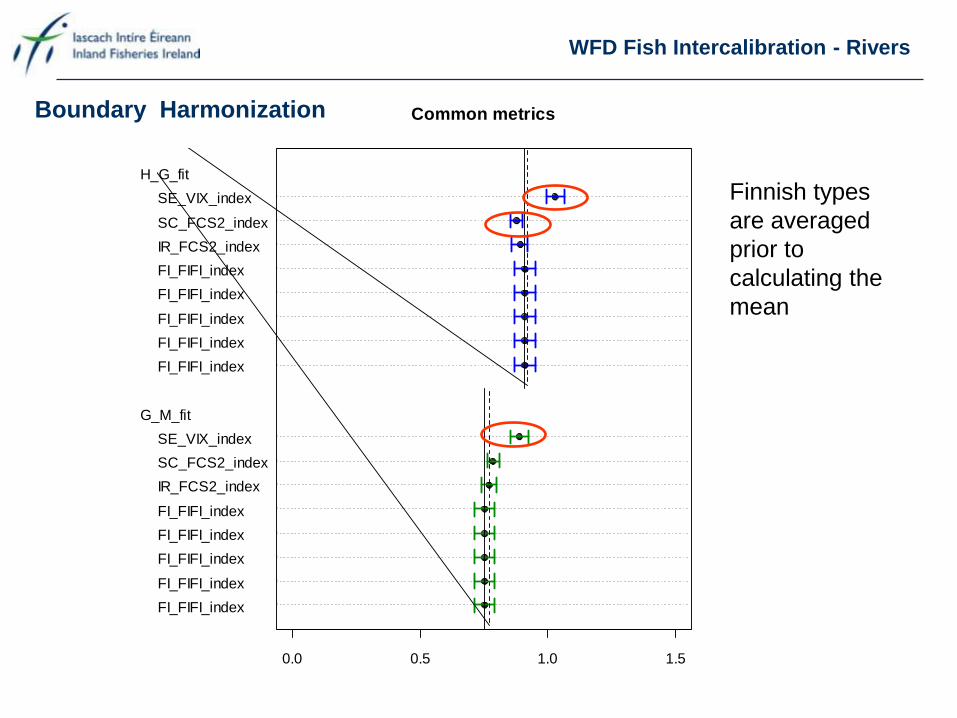
WFD Fish Intercalibration - Rivers
FI_FIFI_index
FI_FIFI_index
FI_FIFI_index
FI_FIFI_index
FI_FIFI_index
IR_FCS2_index
SC_FCS2_index
SE_VIX_index
FI_FIFI_index
FI_FIFI_index
FI_FIFI_index
FI_FIFI_index
FI_FIFI_index
IR_FCS2_index
SC_FCS2_index
SE_VIX_index
H_G_fit
G_M_fit
0.0 0.5 1.0 1.5
Common metrics
Finnish types
are averaged
prior to
calculating the
mean
Boundary Harmonization
WFD Fish Intercalibration - Rivers
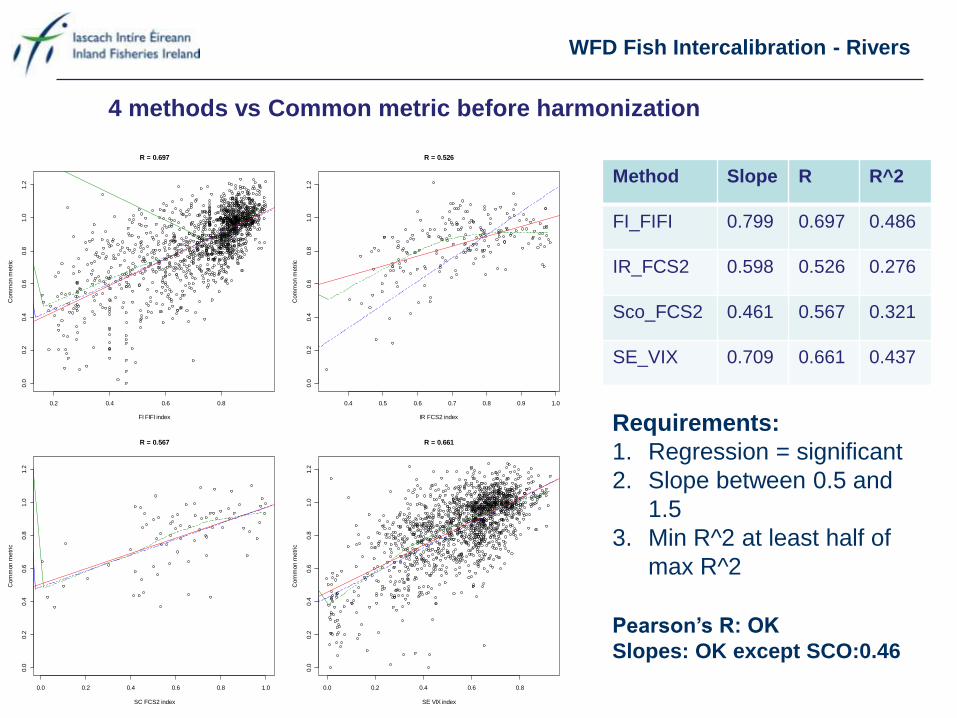
4 methods vs Common metric before harmonization
Method Slope R R^2
FI_FIFI 0.799 0.697 0.486
IR_FCS2 0.598 0.526 0.276
Sco_FCS2 0.461 0.567 0.321
SE_VIX 0.709 0.661 0.437
Pearson’s R: OK
Slopes: OK except SCO:0.46
0.2 0.4 0.6 0.8
0.0
0.2
0.4
0.6
0.8
1.0
1.2
R = 0.697
FI FIFI index
Com
mon m
etr
ic
0.4 0.5 0.6 0.7 0.8 0.9 1.0
0.0
0.2
0.4
0.6
0.8
1.0
1.2
R = 0.526
IR FCS2 index
Com
mon m
etr
ic
0.0 0.2 0.4 0.6 0.8 1.0
0.0
0.2
0.4
0.6
0.8
1.0
1.2
R = 0.567
SC FCS2 index
Com
mon m
etr
ic
0.0 0.2 0.4 0.6 0.8
0.0
0.2
0.4
0.6
0.8
1.0
1.2
R = 0.661
SE VIX index
Com
mon m
etr
ic
Requirements:
1. Regression = significant
2. Slope between 0.5 and
1.5
3. Min R^2 at least half of
max R^2
WFD Fish Intercalibration - Rivers
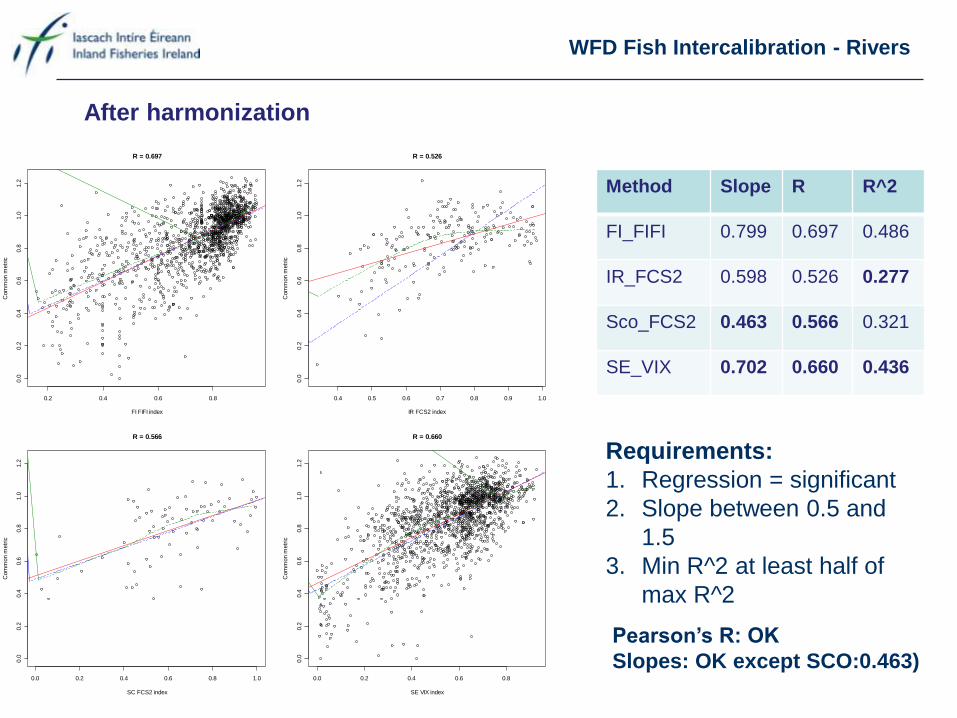
After harmonization
Method Slope R R^2
FI_FIFI 0.799 0.697 0.486
IR_FCS2 0.598 0.526 0.277
Sco_FCS2 0.463 0.566 0.321
SE_VIX 0.702 0.660 0.436
0.2 0.4 0.6 0.8
0.0
0.2
0.4
0.6
0.8
1.0
1.2
R = 0.697
FI FIFI index
Com
mon m
etr
ic
0.4 0.5 0.6 0.7 0.8 0.9 1.0
0.0
0.2
0.4
0.6
0.8
1.0
1.2
R = 0.526
IR FCS2 index
Com
mon m
etr
ic
0.0 0.2 0.4 0.6 0.8 1.0
0.0
0.2
0.4
0.6
0.8
1.0
1.2
R = 0.566
SC FCS2 index
Com
mon m
etr
ic
0.0 0.2 0.4 0.6 0.8
0.0
0.2
0.4
0.6
0.8
1.0
1.2
R = 0.660
SE VIX index
Com
mon m
etr
ic
Requirements:
1. Regression = significant
2. Slope between 0.5 and
1.5
3. Min R^2 at least half of
max R^2
Pearson’s R: OK
Slopes: OK except SCO:0.463)
WFD Fish Intercalibration - Rivers
FI_FIFI_index
FI_FIFI_index
FI_FIFI_index
FI_FIFI_index
FI_FIFI_index
IR_FCS2_index
SC_FCS2_index
SE_VIX_index
FI_FIFI_index
FI_FIFI_index
FI_FIFI_index
FI_FIFI_index
FI_FIFI_index
IR_FCS2_index
SC_FCS2_index
SE_VIX_index
H_G_fit
G_M_fit
0.0 0.5 1.0 1.5
Common metrics
FI_FIFI_index
FI_FIFI_index
FI_FIFI_index
FI_FIFI_index
FI_FIFI_index
IR_FCS2_index
SC_FCS2_index
SE_VIX_index
FI_FIFI_index
FI_FIFI_index
FI_FIFI_index
FI_FIFI_index
FI_FIFI_index
IR_FCS2_index
SC_FCS2_index
SE_VIX_index
H_G_fit
G_M_fit
0.0 0.5 1.0 1.5
Common metrics
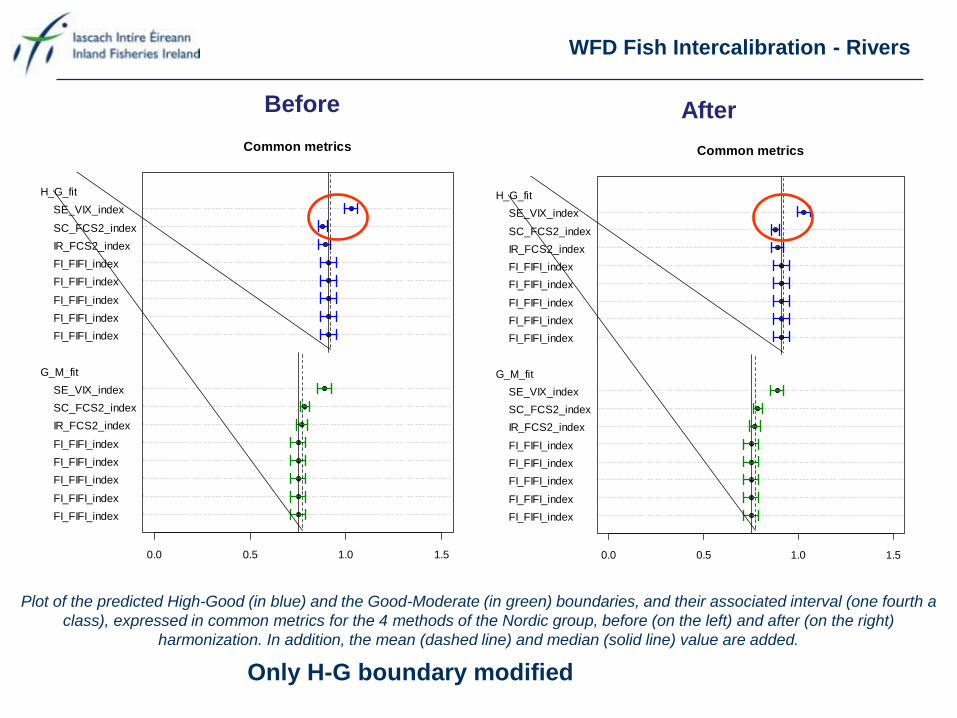
Plot of the predicted High-Good (in blue) and the Good-Moderate (in green) boundaries, and their associated interval (one fourth a
class), expressed in common metrics for the 4 methods of the Nordic group, before (on the left) and after (on the right)
harmonization. In addition, the mean (dashed line) and median (solid line) value are added.
Before After
Only H-G boundary modified
WFD Fish Intercalibration - Rivers
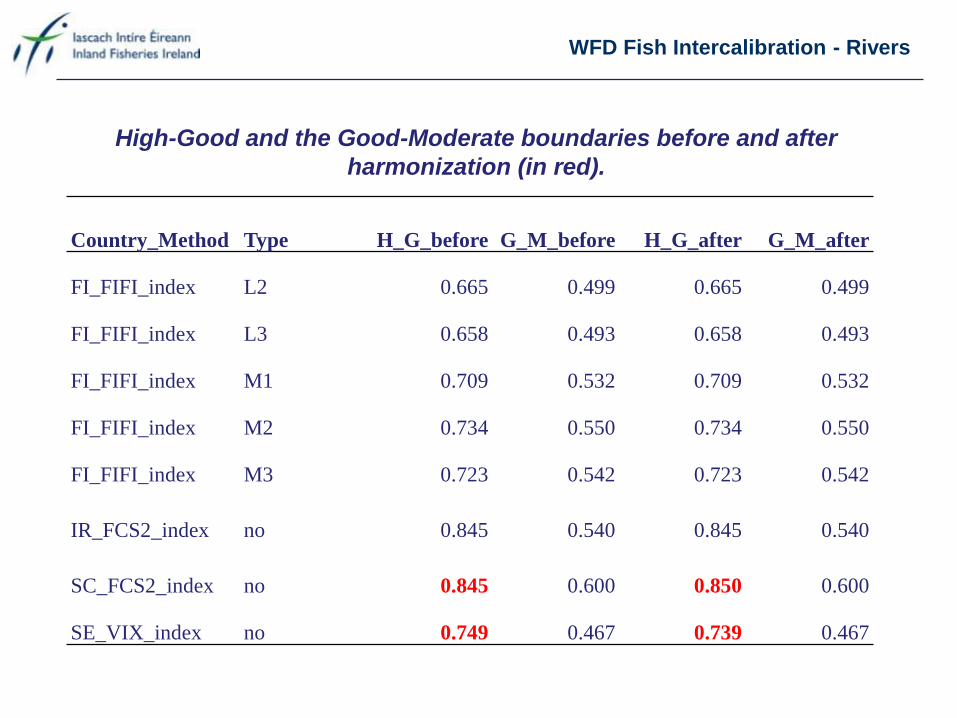
Country_Method Type H_G_before G_M_before H_G_after G_M_after
FI_FIFI_index L2 0.665 0.499 0.665 0.499
FI_FIFI_index L3 0.658 0.493 0.658 0.493
FI_FIFI_index M1 0.709 0.532 0.709 0.532
FI_FIFI_index M2 0.734 0.550 0.734 0.550
FI_FIFI_index M3 0.723 0.542 0.723 0.542
IR_FCS2_index no 0.845 0.540 0.845 0.540
SC_FCS2_index no 0.845 0.600 0.850 0.600
SE_VIX_index no 0.749 0.467 0.739 0.467
High-Good and the Good-Moderate boundaries before and after
harmonization (in red).
WFD Fish Intercalibration - Rivers
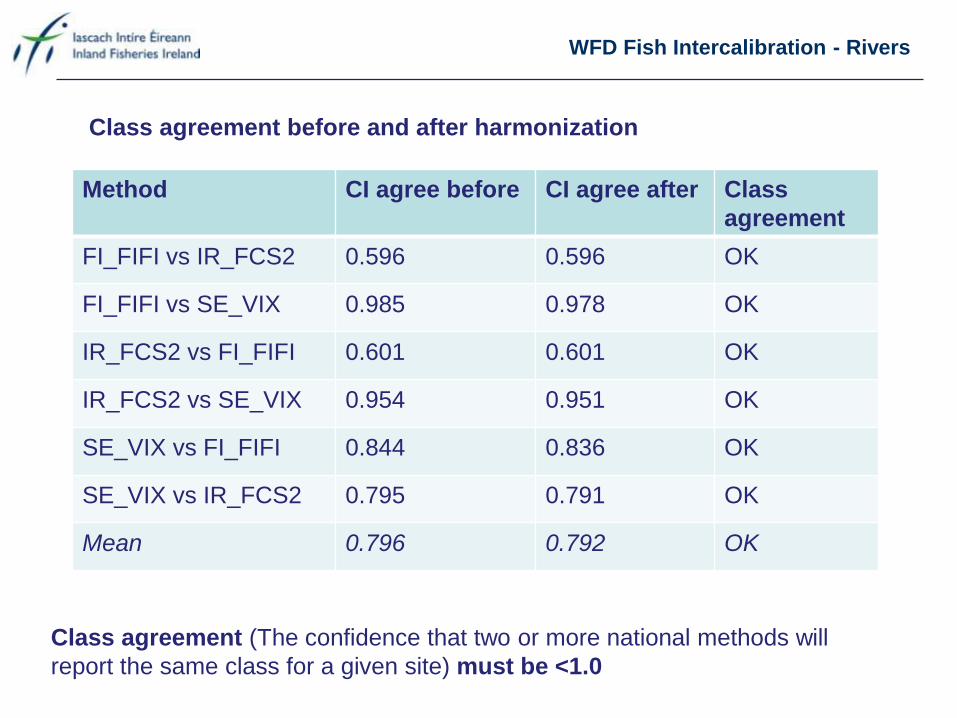
Method CI agree before CI agree after Class
agreement
FI_FIFI vs IR_FCS2 0.596 0.596 OK
FI_FIFI vs SE_VIX 0.985 0.978 OK
IR_FCS2 vs FI_FIFI 0.601 0.601 OK
IR_FCS2 vs SE_VIX 0.954 0.951 OK
SE_VIX vs FI_FIFI 0.844 0.836 OK
SE_VIX vs IR_FCS2 0.795 0.791 OK
Mean 0.796 0.792 OK
Class agreement before and after harmonization
Class agreement (The confidence that two or more national methods will
report the same class for a given site) must be <1.0
WFD Fish Intercalibration - Rivers
Conclusion
No requirement to change boundaries for FCS2
Ireland
Successful intercalibration
Fish in Lakes Classification Tool (FIL2) for Eco Region 17 Summary of development and outputs
Inland Fisheries Ireland – Research and Development Division
Fiona Kelly, Andrew Harrison and Lynda Connor
Agri-Food and Biosciences Institute (AFBI) - Fisheries and Aquatic
Systems Branch
Michelle Allen, Trudyann Kelly and Robert Rosell
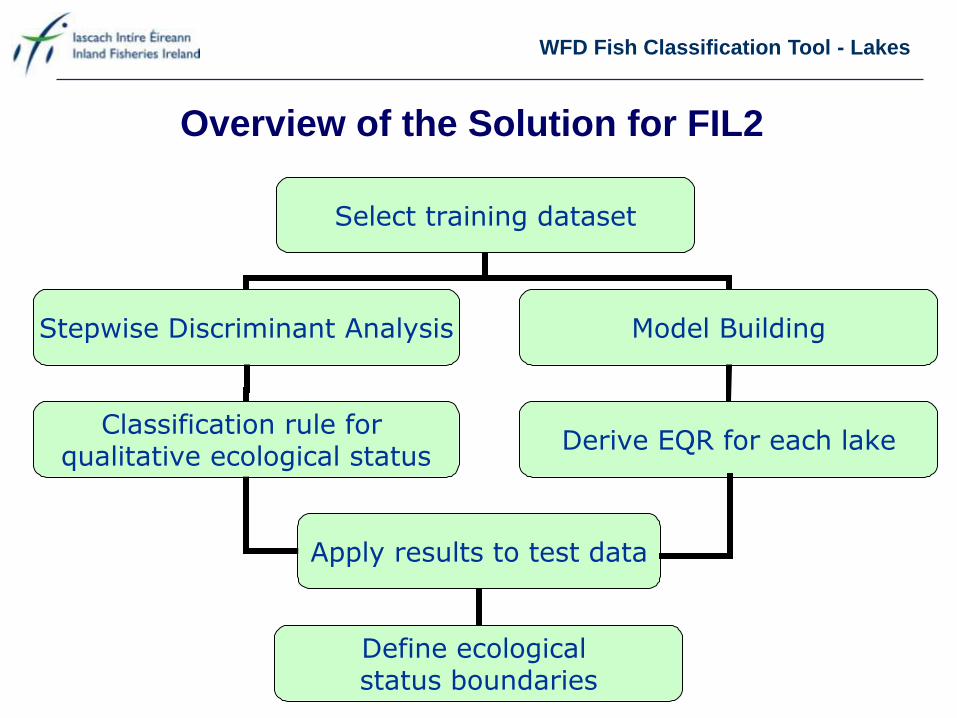
Overview of the Solution for FIL2
Select training dataset
Stepwise Discriminant Analysis Model Building
Classification rule for qualitative ecological status
Derive EQR for each lake
Apply results to test data
Define ecological status boundaries
WFD Fish Classification Tool - Lakes
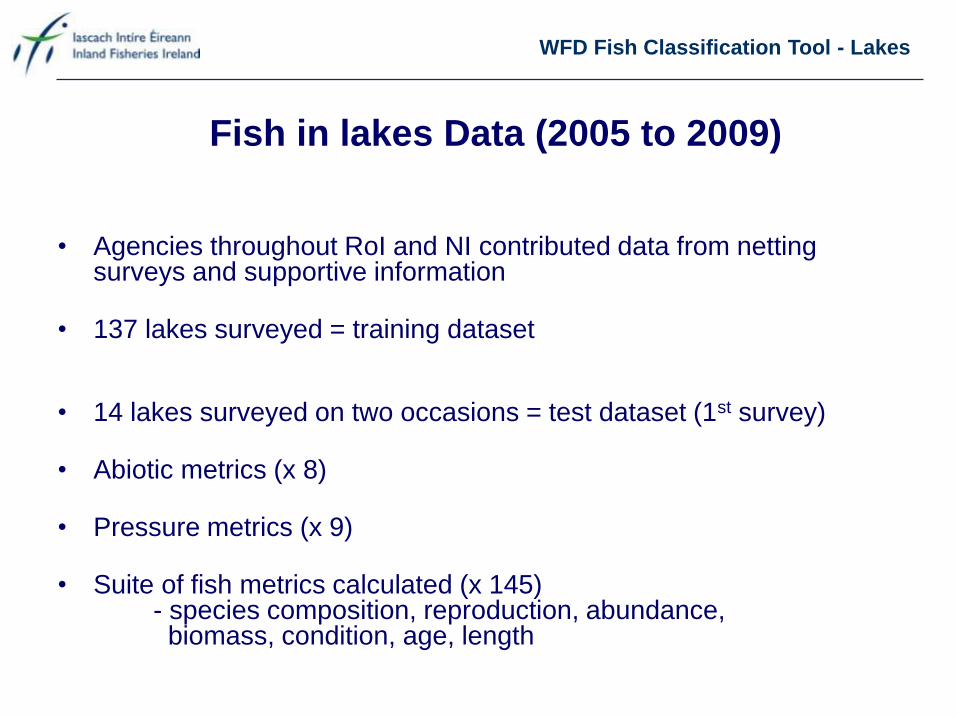
• Agencies throughout RoI and NI contributed data from netting surveys and supportive information
• 137 lakes surveyed = training dataset
• 14 lakes surveyed on two occasions = test dataset (1st survey)
• Abiotic metrics (x 8)
• Pressure metrics (x 9)
• Suite of fish metrics calculated (x 145) - species composition, reproduction, abundance, biomass, condition, age, length
Fish in lakes Data (2005 to 2009)
WFD Fish Classification Tool - Lakes
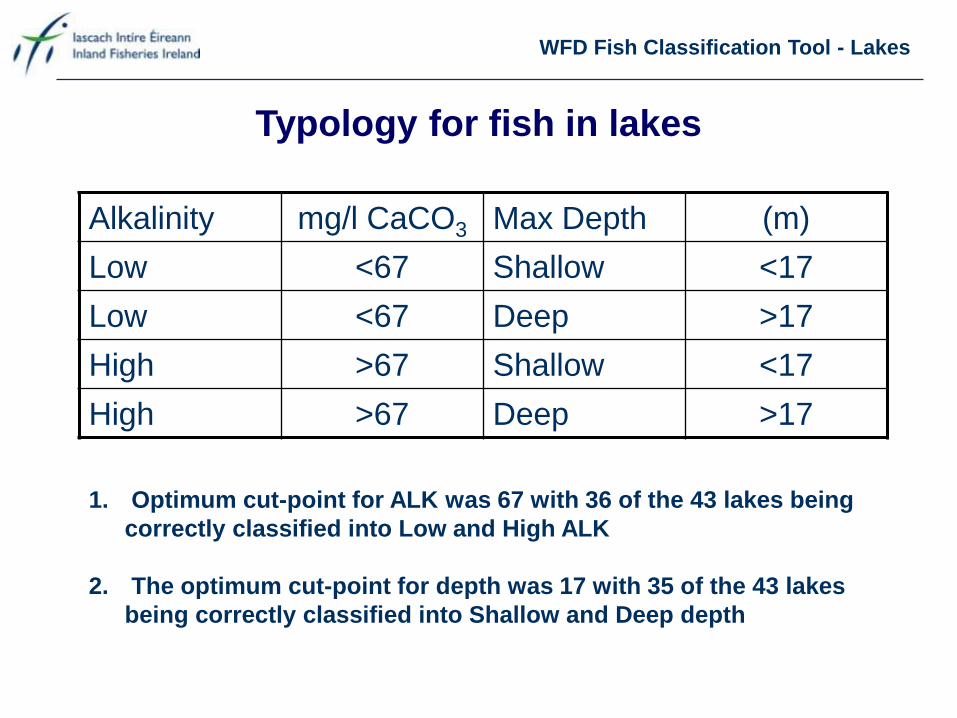
Typology for fish in lakes
Alkalinity mg/l CaCO3 Max Depth (m)
Low <67 Shallow <17
Low <67 Deep >17
High >67 Shallow <17
High >67 Deep >17
1. Optimum cut-point for ALK was 67 with 36 of the 43 lakes being
correctly classified into Low and High ALK
2. The optimum cut-point for depth was 17 with 35 of the 43 lakes
being correctly classified into Shallow and Deep depth
WFD Fish Classification Tool - Lakes
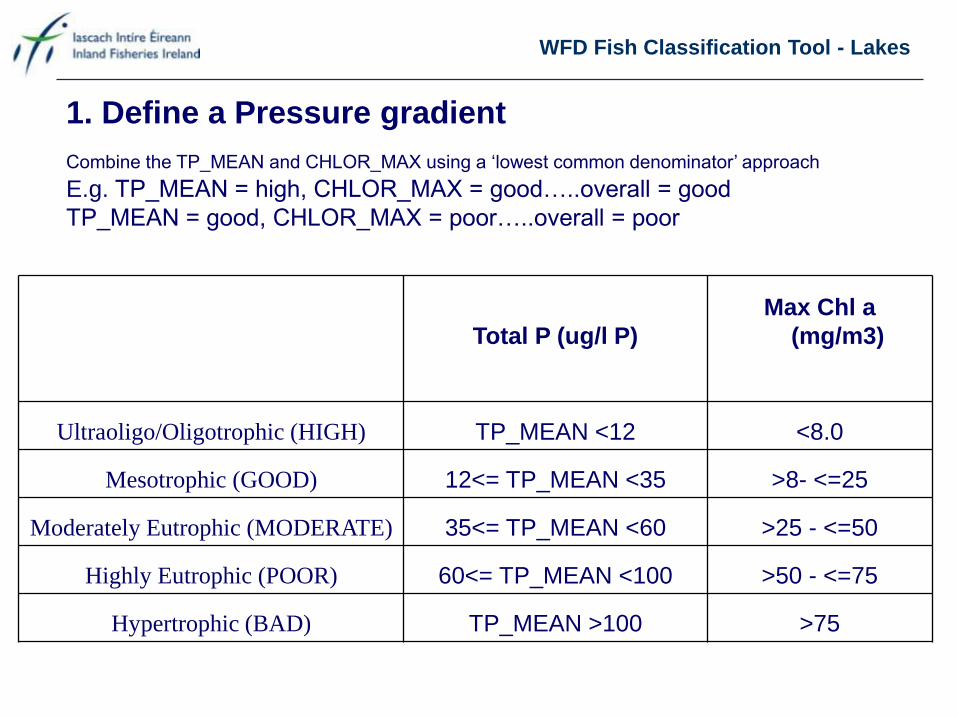
Total P (ug/l P)
Max Chl a
(mg/m3)
Ultraoligo/Oligotrophic (HIGH) TP_MEAN <12 <8.0
Mesotrophic (GOOD) 12<= TP_MEAN <35 >8- <=25
Moderately Eutrophic (MODERATE) 35<= TP_MEAN <60 >25 - <=50
Highly Eutrophic (POOR) 60<= TP_MEAN <100 >50 - <=75
Hypertrophic (BAD) TP_MEAN >100 >75
1. Define a Pressure gradient
Combine the TP_MEAN and CHLOR_MAX using a ‘lowest common denominator’ approach
E.g. TP_MEAN = high, CHLOR_MAX = good…..overall = good
TP_MEAN = good, CHLOR_MAX = poor…..overall = poor
WFD Fish Classification Tool - Lakes
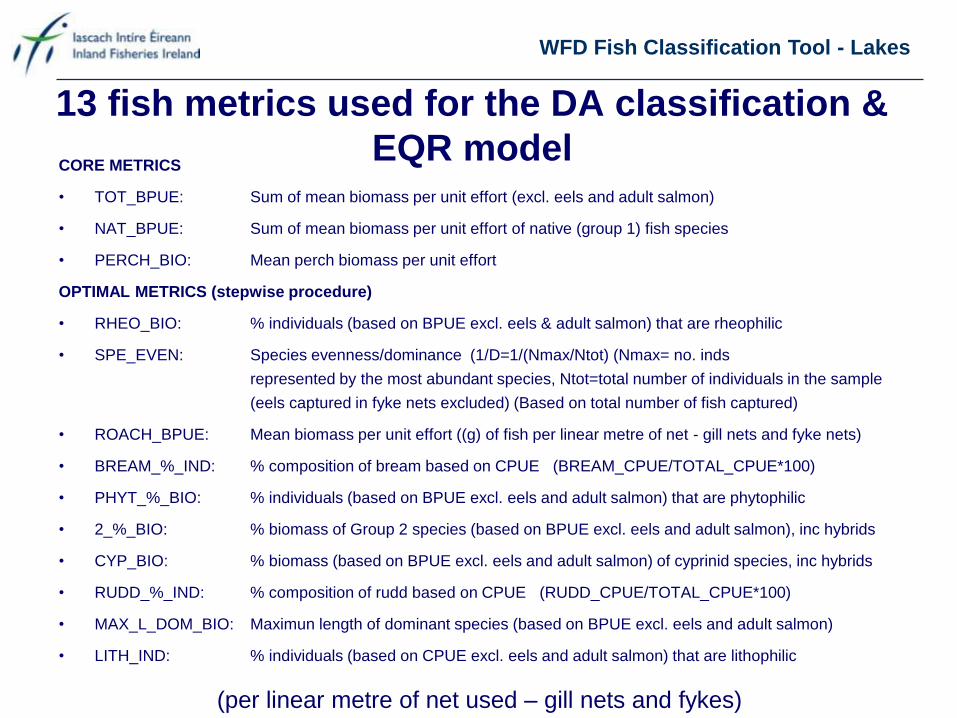
13 fish metrics used for the DA classification &
EQR model CORE METRICS
• TOT_BPUE: Sum of mean biomass per unit effort (excl. eels and adult salmon)
• NAT_BPUE: Sum of mean biomass per unit effort of native (group 1) fish species
• PERCH_BIO: Mean perch biomass per unit effort
OPTIMAL METRICS (stepwise procedure)
• RHEO_BIO: % individuals (based on BPUE excl. eels & adult salmon) that are rheophilic
• SPE_EVEN: Species evenness/dominance (1/D=1/(Nmax/Ntot) (Nmax= no. inds
represented by the most abundant species, Ntot=total number of individuals in the sample
(eels captured in fyke nets excluded) (Based on total number of fish captured)
• ROACH_BPUE: Mean biomass per unit effort ((g) of fish per linear metre of net - gill nets and fyke nets)
• BREAM_%_IND: % composition of bream based on CPUE (BREAM_CPUE/TOTAL_CPUE*100)
• PHYT_%_BIO: % individuals (based on BPUE excl. eels and adult salmon) that are phytophilic
• 2_%_BIO: % biomass of Group 2 species (based on BPUE excl. eels and adult salmon), inc hybrids
• CYP_BIO: % biomass (based on BPUE excl. eels and adult salmon) of cyprinid species, inc hybrids
• RUDD_%_IND: % composition of rudd based on CPUE (RUDD_CPUE/TOTAL_CPUE*100)
• MAX_L_DOM_BIO: Maximun length of dominant species (based on BPUE excl. eels and adult salmon)
• LITH_IND: % individuals (based on CPUE excl. eels and adult salmon) that are lithophilic
(per linear metre of net used – gill nets and fykes)
WFD Fish Classification Tool - Lakes
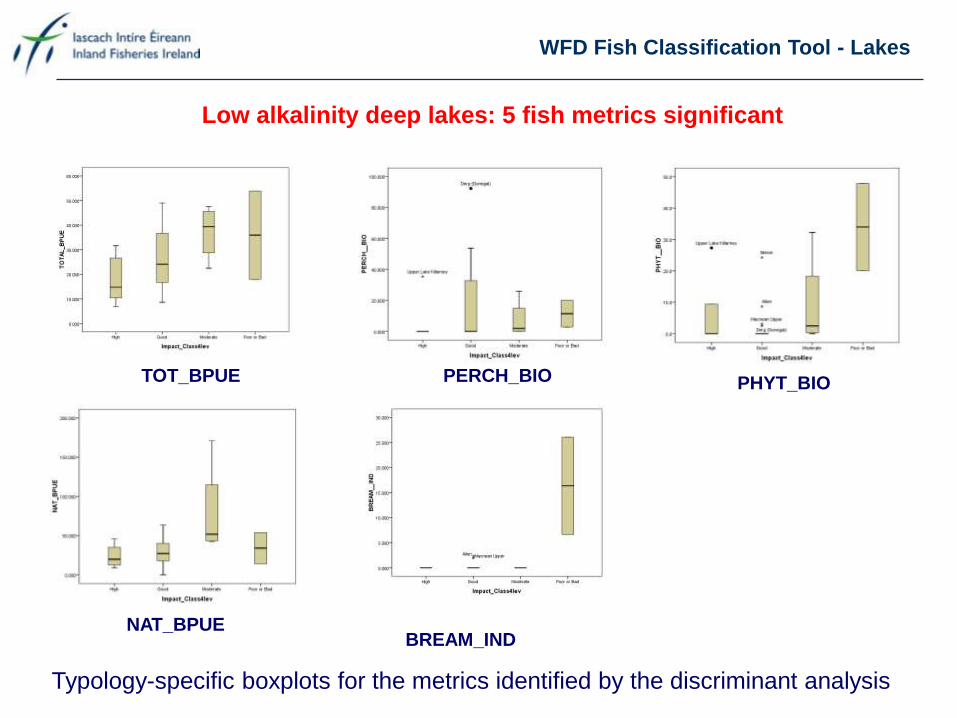
Low alkalinity deep lakes: 5 fish metrics significant
Typology-specific boxplots for the metrics identified by the discriminant analysis
TOT_BPUE
NAT_BPUE
PERCH_BIO PHYT_BIO
BREAM_IND
WFD Fish Classification Tool - Lakes
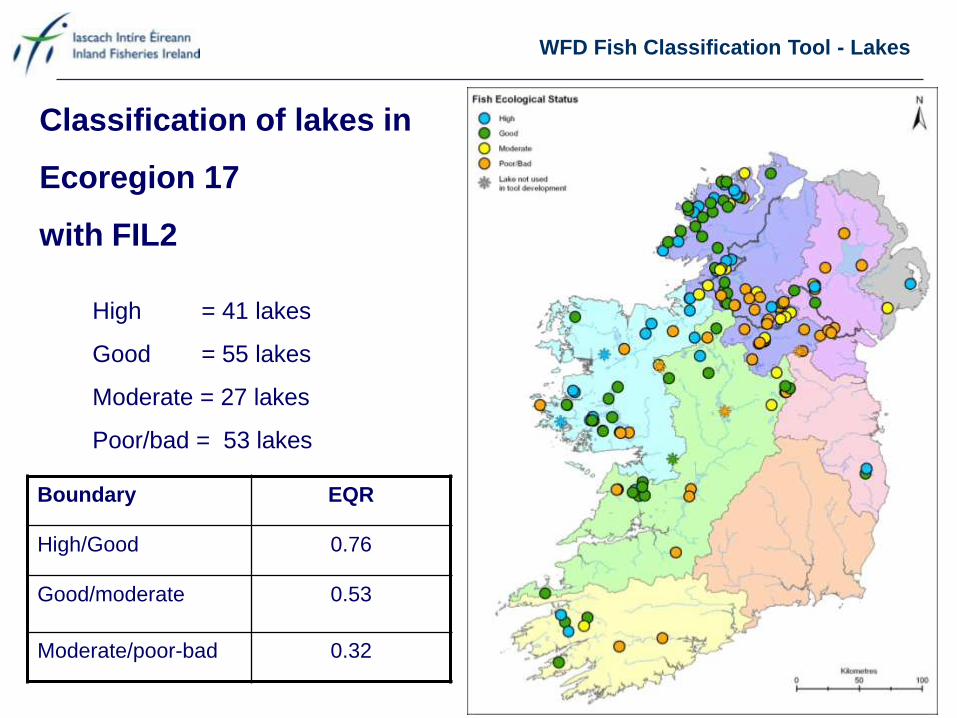
High = 41 lakes
Good = 55 lakes
Moderate = 27 lakes
Poor/bad = 53 lakes
Classification of lakes in
Ecoregion 17
with FIL2
WFD Fish Classification Tool - Lakes
Boundary EQR
High/Good 0.76
Good/moderate 0.53
Moderate/poor-bad 0.32
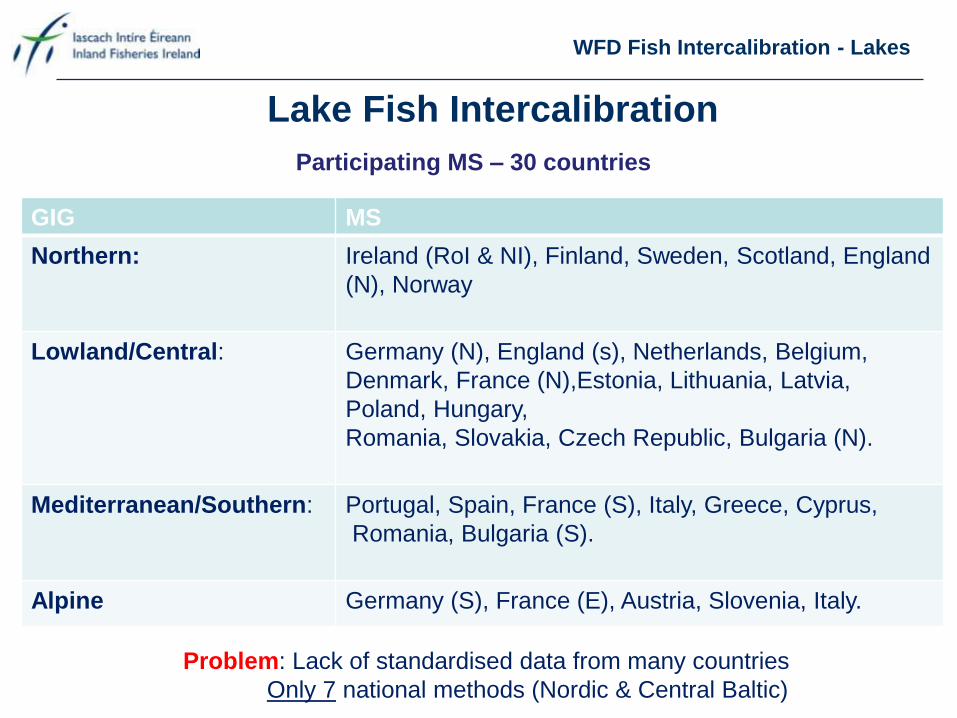
WFD Fish Intercalibration - Lakes
Lake Fish Intercalibration
Participating MS – 30 countries
Problem: Lack of standardised data from many countries
Only 7 national methods (Nordic & Central Baltic)
GIG MS
Northern: Ireland (RoI & NI), Finland, Sweden, Scotland, England
(N), Norway
Lowland/Central: Germany (N), England (s), Netherlands, Belgium,
Denmark, France (N),Estonia, Lithuania, Latvia,
Poland, Hungary,
Romania, Slovakia, Czech Republic, Bulgaria (N).
Mediterranean/Southern: Portugal, Spain, France (S), Italy, Greece, Cyprus,
Romania, Bulgaria (S).
Alpine Germany (S), France (E), Austria, Slovenia, Italy.
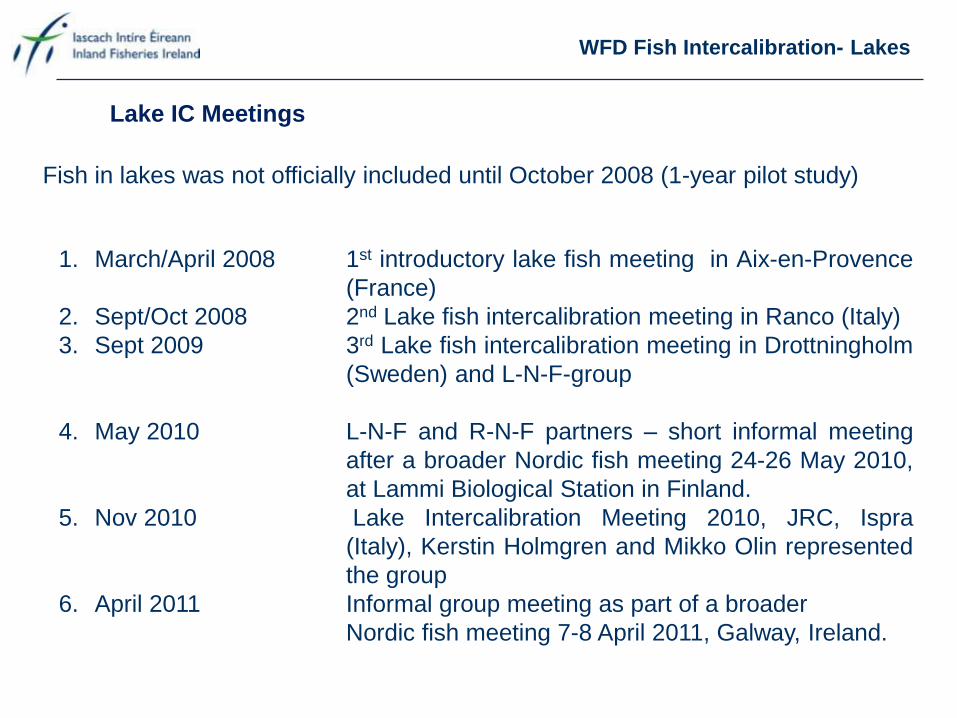
WFD Fish Intercalibration- Lakes
1. March/April 2008 1st introductory lake fish meeting in Aix-en-Provence
(France)
2. Sept/Oct 2008 2nd Lake fish intercalibration meeting in Ranco (Italy)
3. Sept 2009 3rd Lake fish intercalibration meeting in Drottningholm
(Sweden) and L-N-F-group
4. May 2010 L-N-F and R-N-F partners – short informal meeting
after a broader Nordic fish meeting 24-26 May 2010,
at Lammi Biological Station in Finland.
5. Nov 2010 Lake Intercalibration Meeting 2010, JRC, Ispra
(Italy), Kerstin Holmgren and Mikko Olin represented
the group
6. April 2011 Informal group meeting as part of a broader
Nordic fish meeting 7-8 April 2011, Galway, Ireland.
Lake IC Meetings
Fish in lakes was not officially included until October 2008 (1-year pilot study)
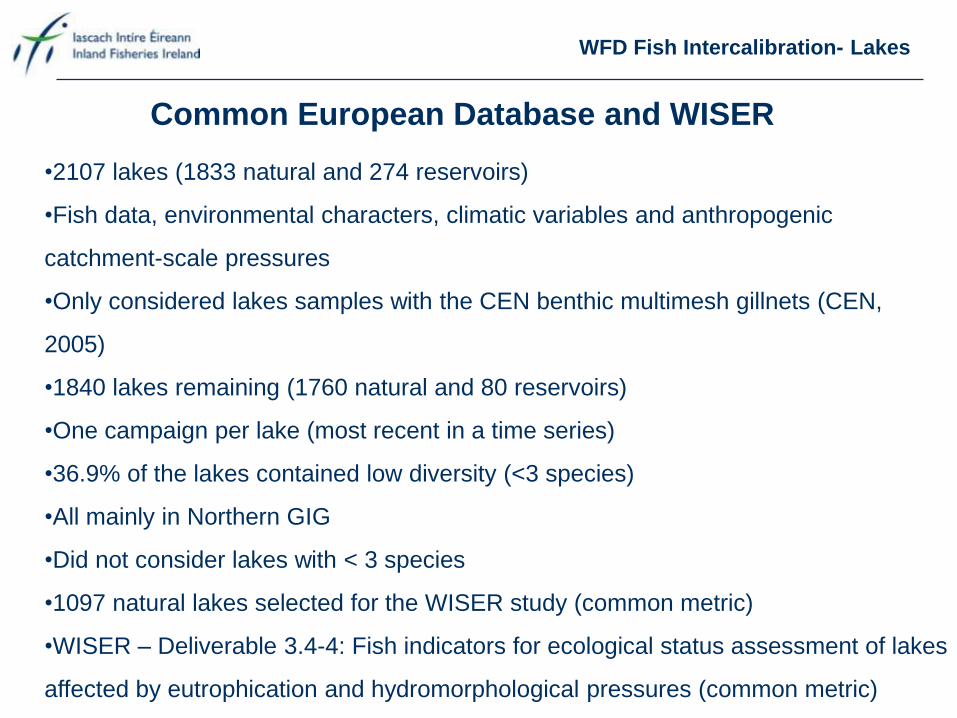
WFD Fish Intercalibration- Lakes
Common European Database and WISER
•2107 lakes (1833 natural and 274 reservoirs)
•Fish data, environmental characters, climatic variables and anthropogenic
catchment-scale pressures
•Only considered lakes samples with the CEN benthic multimesh gillnets (CEN,
2005)
•1840 lakes remaining (1760 natural and 80 reservoirs)
•One campaign per lake (most recent in a time series)
•36.9% of the lakes contained low diversity (<3 species)
•All mainly in Northern GIG
•Did not consider lakes with < 3 species
•1097 natural lakes selected for the WISER study (common metric)
•WISER – Deliverable 3.4-4: Fish indicators for ecological status assessment of lakes
affected by eutrophication and hydromorphological pressures (common metric)
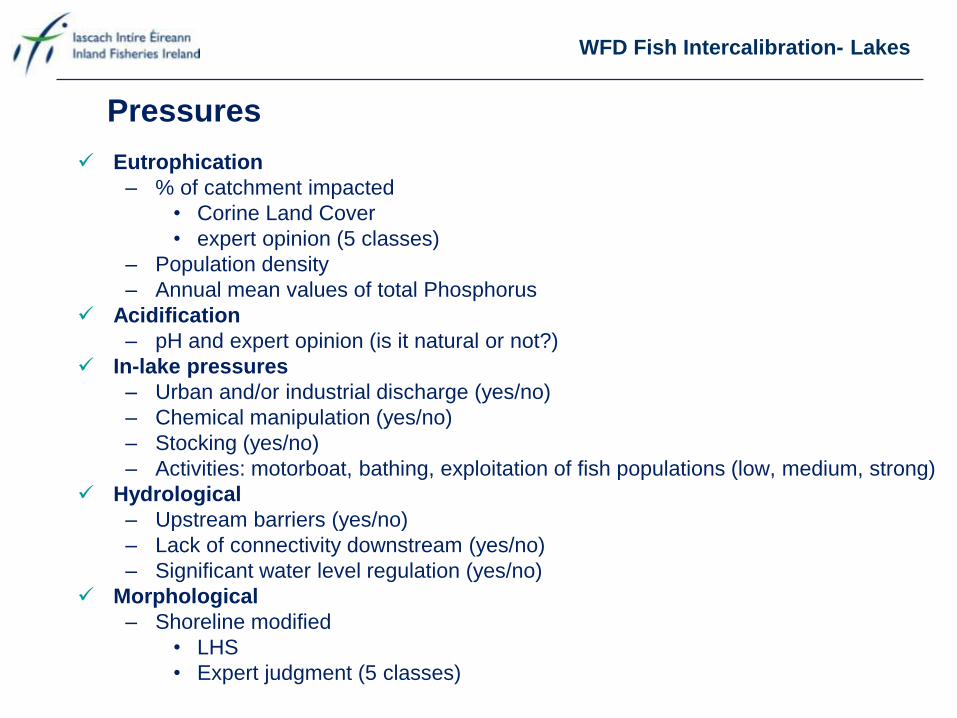
WFD Fish Intercalibration- Lakes
Eutrophication
– % of catchment impacted
• Corine Land Cover
• expert opinion (5 classes)
– Population density
– Annual mean values of total Phosphorus
Acidification
– pH and expert opinion (is it natural or not?)
In-lake pressures
– Urban and/or industrial discharge (yes/no)
– Chemical manipulation (yes/no)
– Stocking (yes/no)
– Activities: motorboat, bathing, exploitation of fish populations (low, medium, strong)
Hydrological
– Upstream barriers (yes/no)
– Lack of connectivity downstream (yes/no)
– Significant water level regulation (yes/no)
Morphological
– Shoreline modified
• LHS
• Expert judgment (5 classes)
Pressures
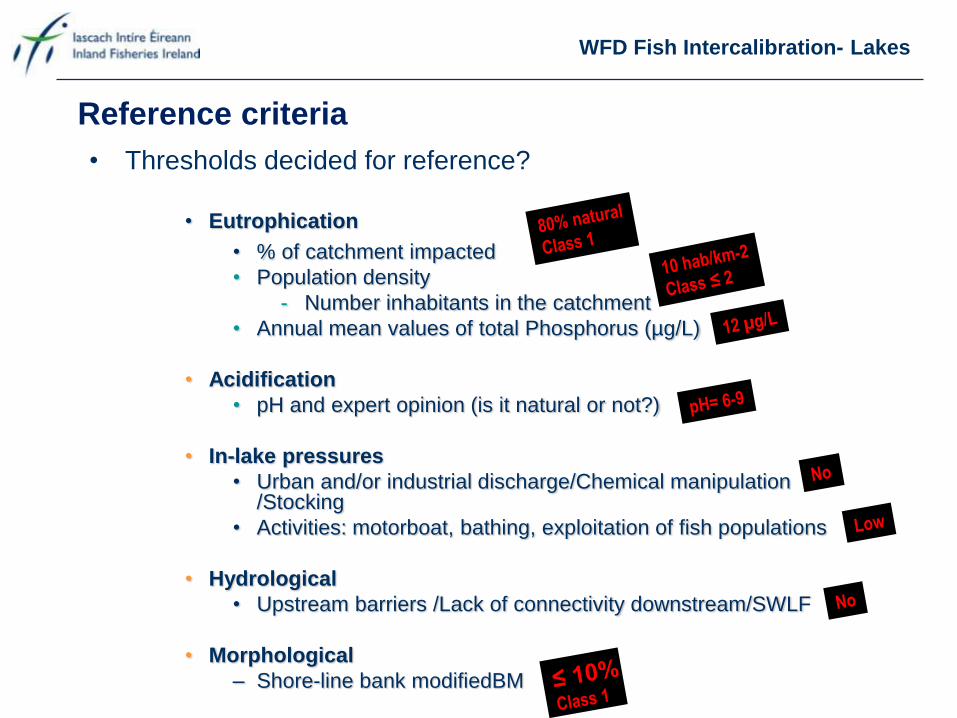
WFD Fish Intercalibration- Lakes
Reference criteria
• Thresholds decided for reference?
• Eutrophication
• % of catchment impacted
• Population density
- Number inhabitants in the catchment
• Annual mean values of total Phosphorus (µg/L)
• Acidification
• pH and expert opinion (is it natural or not?)
• In-lake pressures
• Urban and/or industrial discharge/Chemical manipulation /Stocking
• Activities: motorboat, bathing, exploitation of fish populations
• Hydrological
• Upstream barriers /Lack of connectivity downstream/SWLF
• Morphological
– Shore-line bank modifiedBM
WFD Fish Intercalibration- Lakes
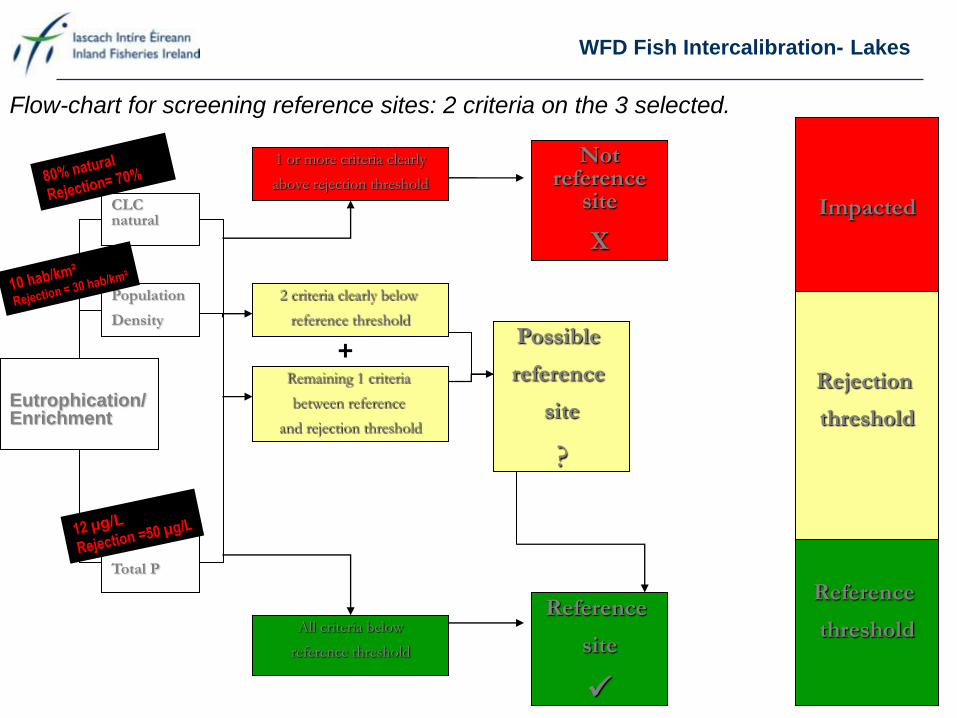
Flow-chart for screening reference sites: 2 criteria on the 3 selected.
Eutrophication/ Enrichment
CLC natural
Reference
threshold
Rejection
threshold
Impacted
Not reference
site
X
Reference
site
Possible
reference
site
?
Population
Density
Total P
+
1 or more criteria clearly
above rejection threshold
Remaining 1 criteria
between reference
and rejection threshold
2 criteria clearly below
reference threshold
All criteria below
reference threshold
WFD Fish Intercalibration- Lakes
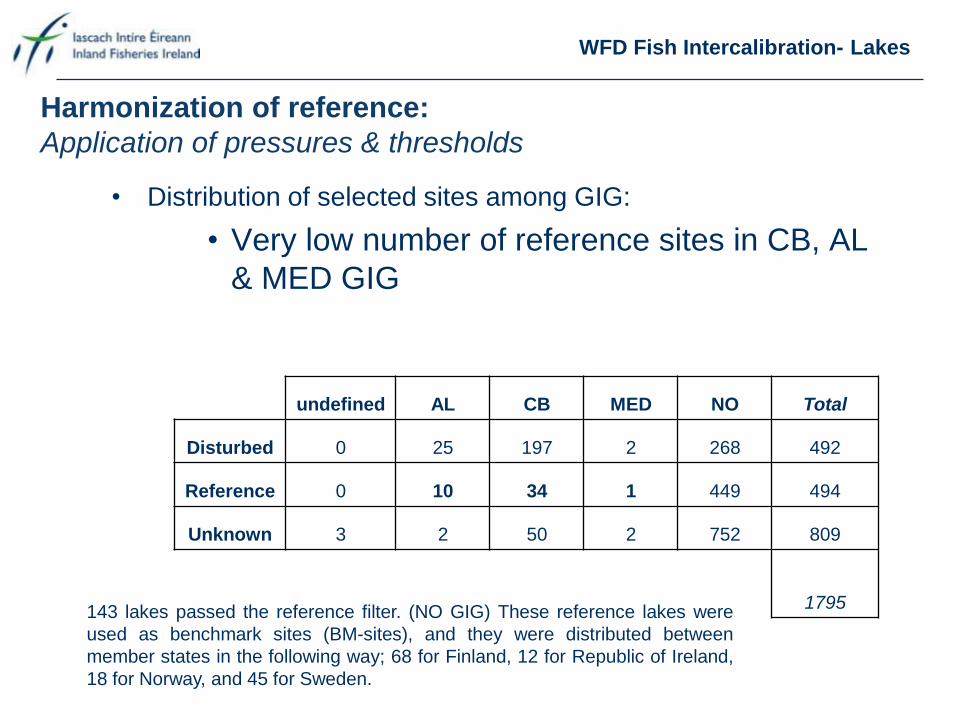
Harmonization of reference:
Application of pressures & thresholds
• Distribution of selected sites among GIG:
• Very low number of reference sites in CB, AL
& MED GIG
undefined AL CB MED NO Total
Disturbed 0 25 197 2 268 492
Reference 0 10 34 1 449 494
Unknown 3 2 50 2 752 809
1795 143 lakes passed the reference filter. (NO GIG) These reference lakes were
used as benchmark sites (BM-sites), and they were distributed between
member states in the following way; 68 for Finland, 12 for Republic of Ireland,
18 for Norway, and 45 for Sweden.
WFD Fish Intercalibration- Lakes
L_N_F Group - PILOT STUDY
•Began October 2008
•Exchange of country specific information on sampling methods and classification
tools
•All MS had fish data from CEN benthic gillnets = standard sampling method
(CEN 2005)
•Comparison of two assessment tools: Swedish (EQR8) and Finnish
(EQR4)indices.
•Two reduced datasets compiled (for EQR8 and EQR4)
•Preliminary analyses of the pilot study have been done on 640 lakes –subset of
Finnish, Swedish & Irish lakes – with publication of a report.
•Clear differences in the classification output of EQR4 and EQR8
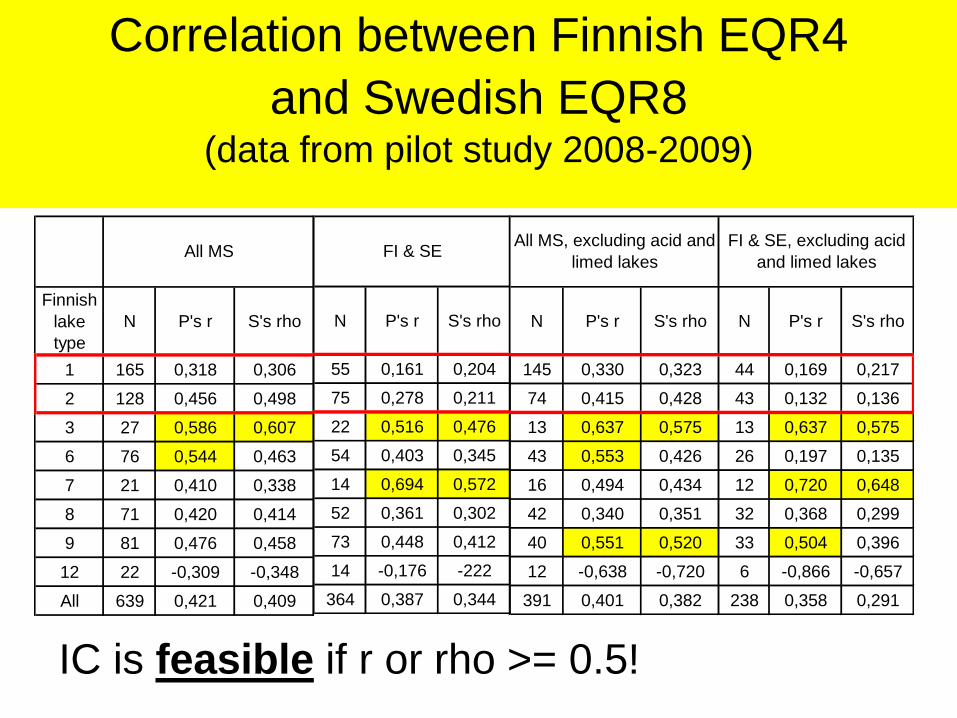
Correlation between Finnish EQR4
and Swedish EQR8 (data from pilot study 2008-2009)
Finnish
lake
type
N P's r S's rho
1 165 0,318 0,306
2 128 0,456 0,498
3 27 0,586 0,607
6 76 0,544 0,463
7 21 0,410 0,338
8 71 0,420 0,414
9 81 0,476 0,458
12 22 -0,309 -0,348
All 639 0,421 0,409
All MS
N P's r S's rho
55 0,161 0,204
75 0,278 0,211
22 0,516 0,476
54 0,403 0,345
14 0,694 0,572
52 0,361 0,302
73 0,448 0,412
14 -0,176 -222
364 0,387 0,344
FI & SE
N P's r S's rho N P's r S's rho
145 0,330 0,323 44 0,169 0,217
74 0,415 0,428 43 0,132 0,136
13 0,637 0,575 13 0,637 0,575
43 0,553 0,426 26 0,197 0,135
16 0,494 0,434 12 0,720 0,648
42 0,340 0,351 32 0,368 0,299
40 0,551 0,520 33 0,504 0,396
12 -0,638 -0,720 6 -0,866 -0,657
391 0,401 0,382 238 0,358 0,291
All MS, excluding acid and
limed lakes
FI & SE, excluding acid
and limed lakes
IC is feasible if r or rho >= 0.5!
WFD Fish Intercalibration- Lakes
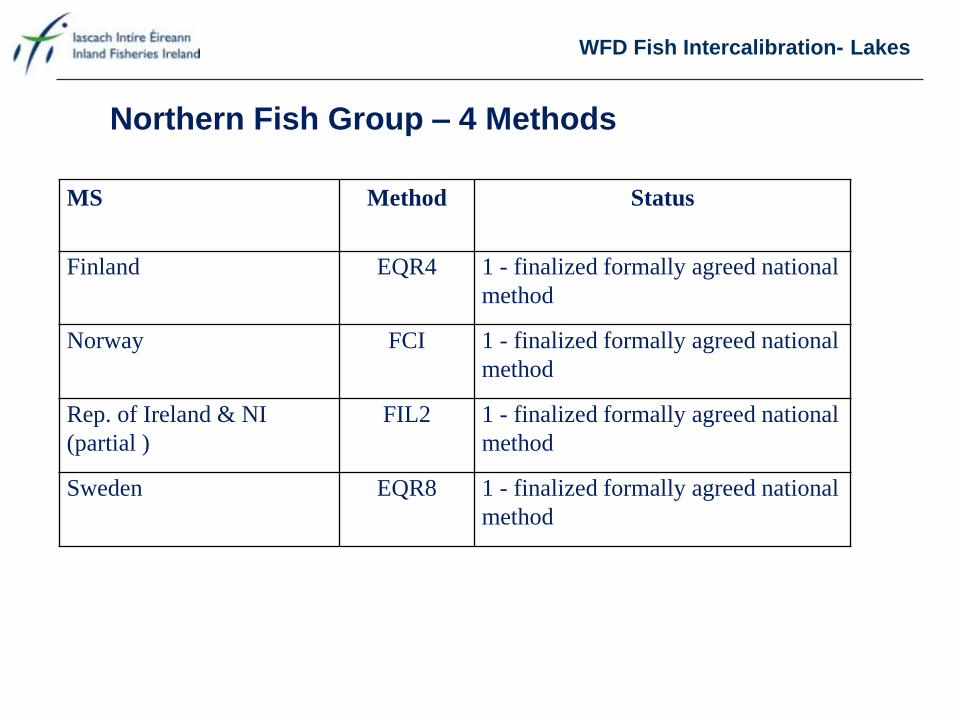
MS Method Status
Finland EQR4 1 - finalized formally agreed national
method
Norway FCI 1 - finalized formally agreed national
method
Rep. of Ireland & NI
(partial )
FIL2 1 - finalized formally agreed national
method
Sweden EQR8 1 - finalized formally agreed national
method
Northern Fish Group – 4 Methods
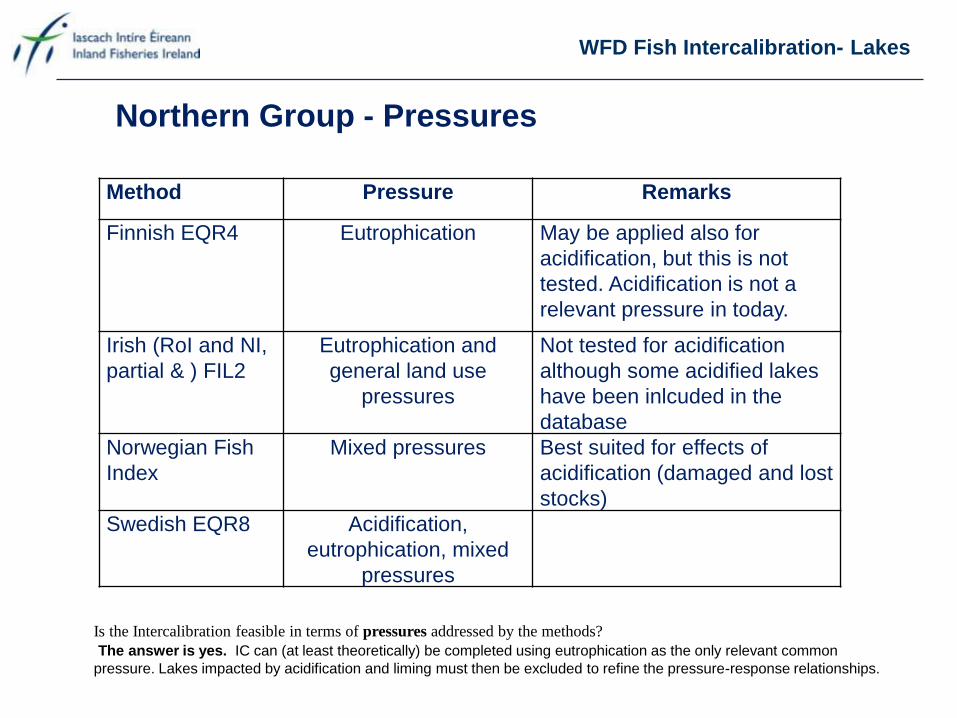
WFD Fish Intercalibration- Lakes
Method Pressure Remarks
Finnish EQR4 Eutrophication May be applied also for
acidification, but this is not
tested. Acidification is not a
relevant pressure in today.
Irish (RoI and NI,
partial & ) FIL2
Eutrophication and
general land use
pressures
Not tested for acidification
although some acidified lakes
have been inlcuded in the
database
Norwegian Fish
Index
Mixed pressures Best suited for effects of
acidification (damaged and lost
stocks)
Swedish EQR8 Acidification,
eutrophication, mixed
pressures
Northern Group - Pressures
Is the Intercalibration feasible in terms of pressures addressed by the methods?
The answer is yes. IC can (at least theoretically) be completed using eutrophication as the only relevant common
pressure. Lakes impacted by acidification and liming must then be excluded to refine the pressure-response relationships.
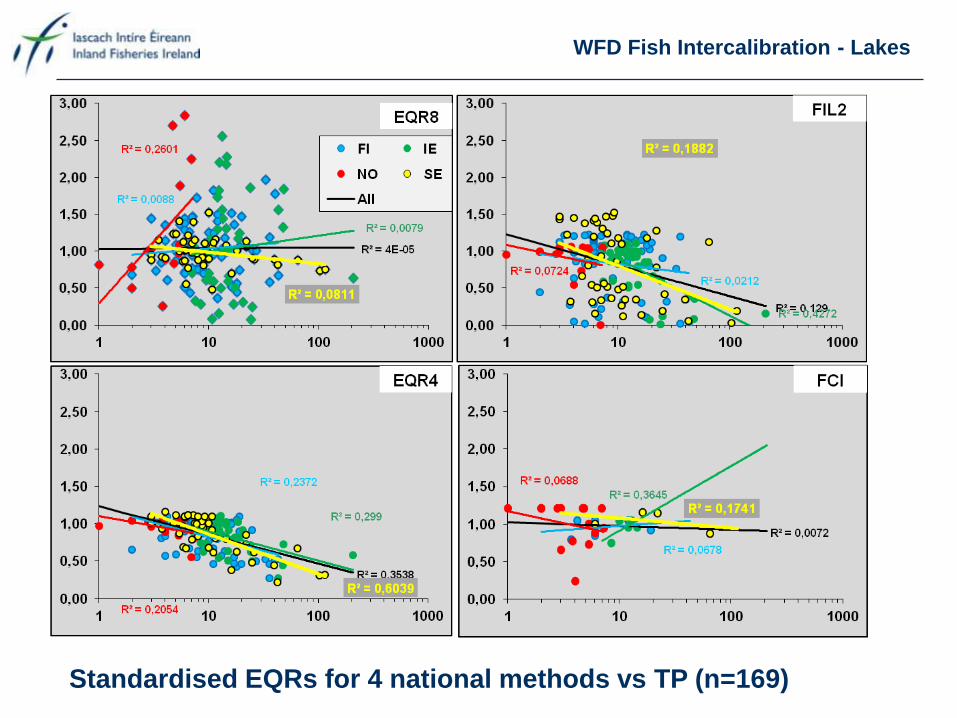
WFD Fish Intercalibration - Lakes
Standardised EQRs for 4 national methods vs TP (n=169)
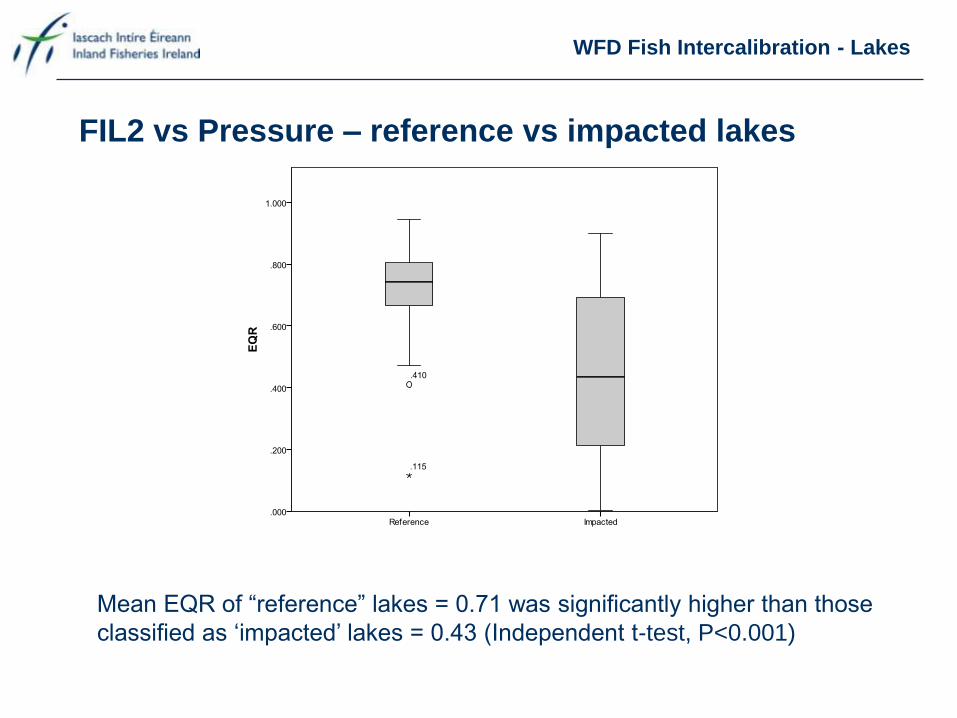
WFD Fish Intercalibration - Lakes
FIL2 vs Pressure – reference vs impacted lakes
Mean EQR of “reference” lakes = 0.71 was significantly higher than those
classified as ‘impacted’ lakes = 0.43 (Independent t-test, P<0.001)
WFD Fish Intercalibration - Lakes
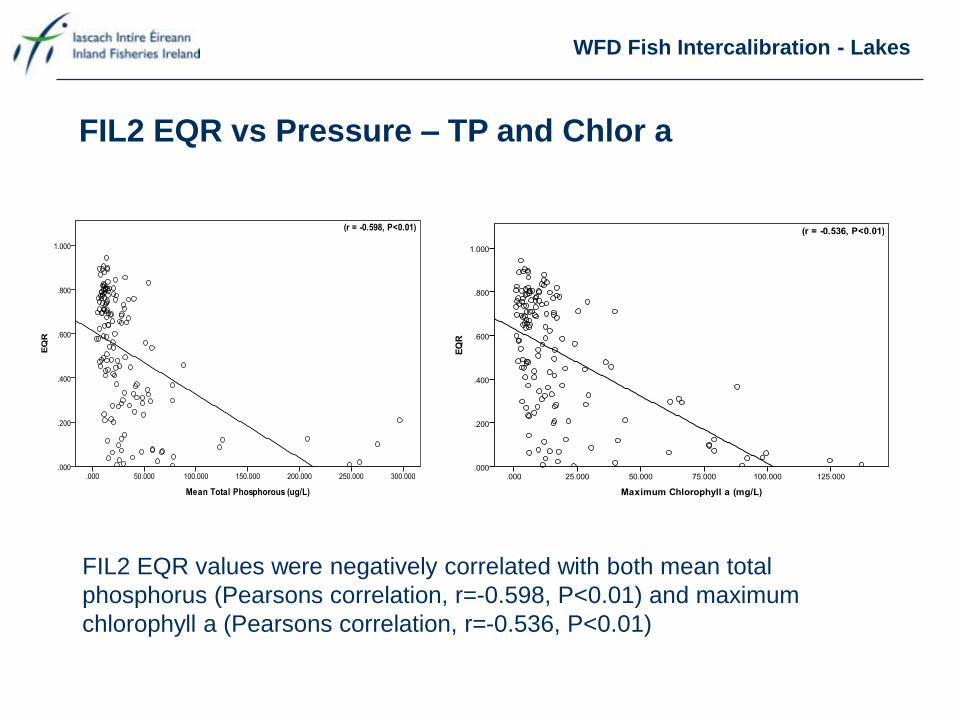
FIL2 EQR vs Pressure – TP and Chlor a
FIL2 EQR values were negatively correlated with both mean total
phosphorus (Pearsons correlation, r=-0.598, P<0.01) and maximum
chlorophyll a (Pearsons correlation, r=-0.536, P<0.01)
WFD Fish Intercalibration- Lakes
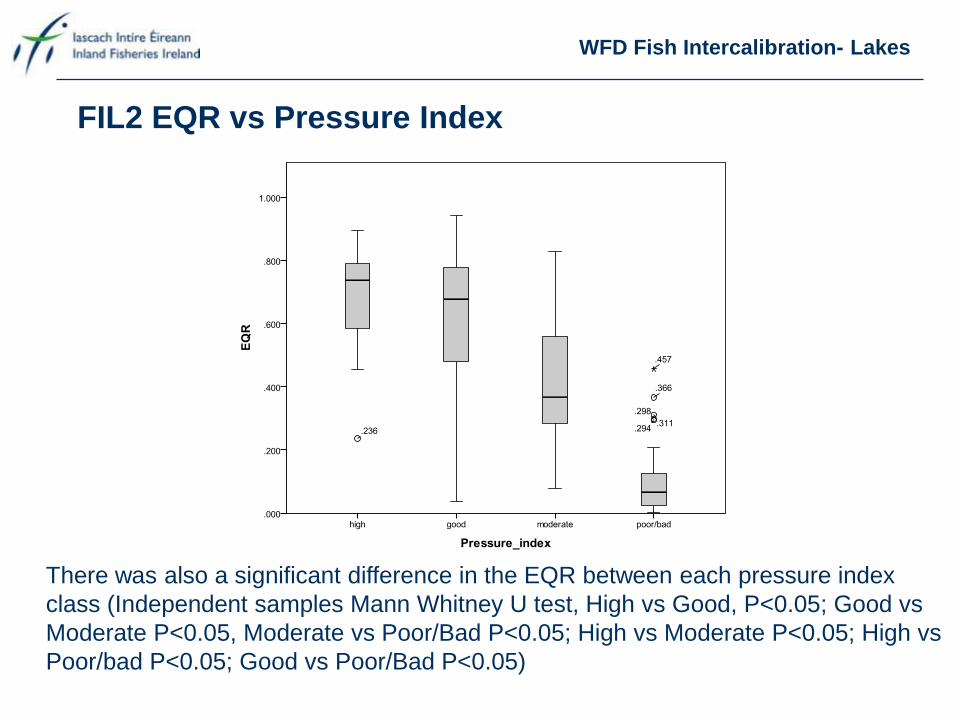
FIL2 EQR vs Pressure Index
There was also a significant difference in the EQR between each pressure index
class (Independent samples Mann Whitney U test, High vs Good, P<0.05; Good vs
Moderate P<0.05, Moderate vs Poor/Bad P<0.05; High vs Moderate P<0.05; High vs
Poor/bad P<0.05; Good vs Poor/Bad P<0.05)
WFD Fish Intercalibration- Lakes
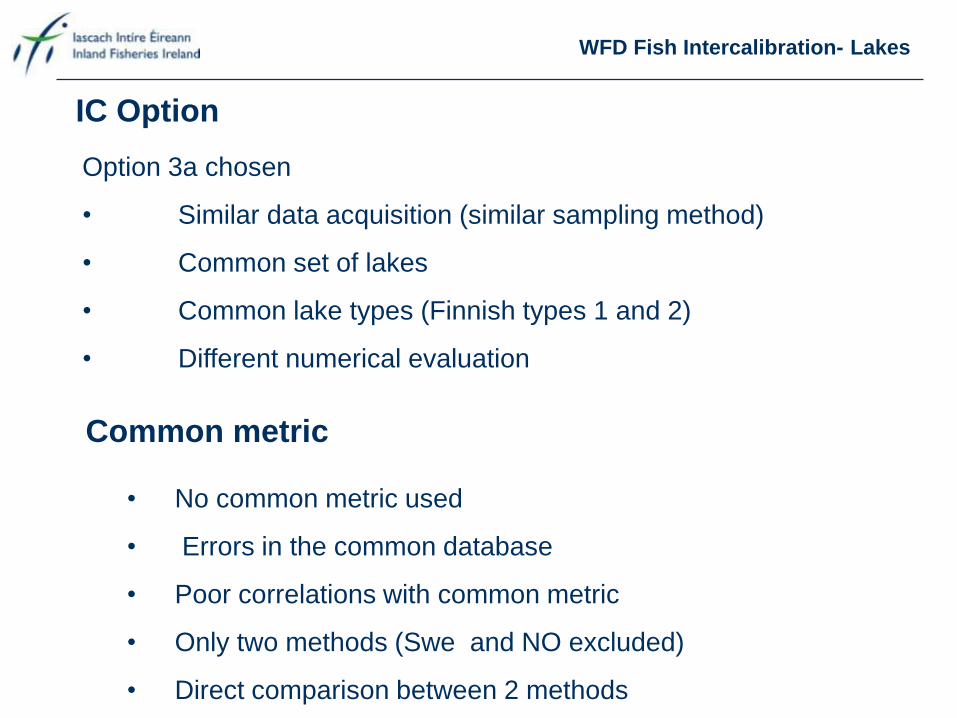
IC Option
Option 3a chosen
• Similar data acquisition (similar sampling method)
• Common set of lakes
• Common lake types (Finnish types 1 and 2)
• Different numerical evaluation
Common metric
• No common metric used
• Errors in the common database
• Poor correlations with common metric
• Only two methods (Swe and NO excluded)
• Direct comparison between 2 methods
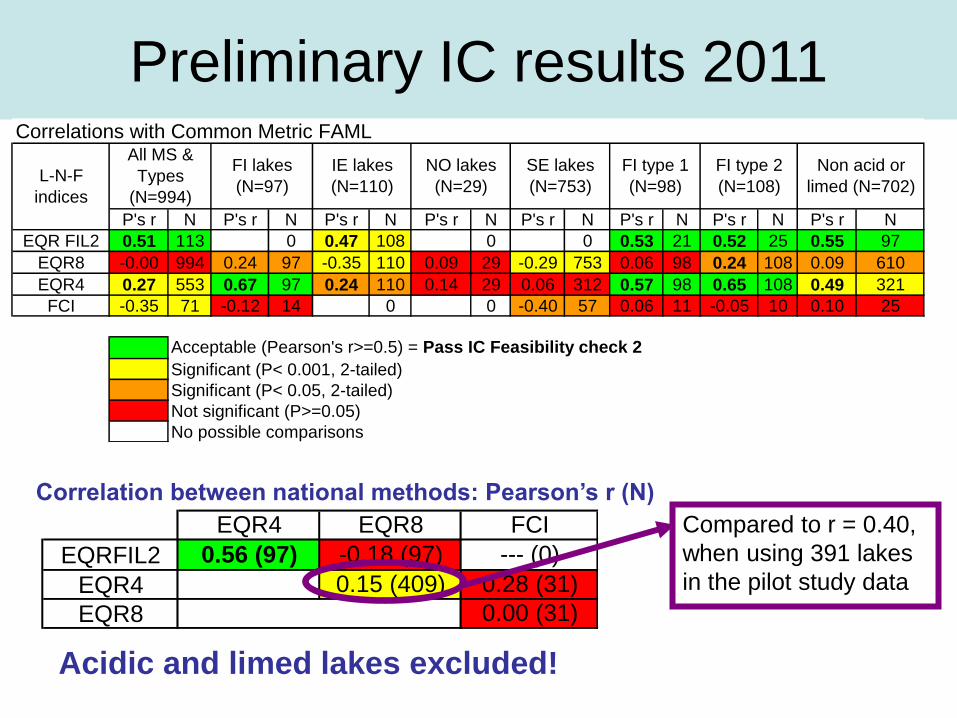
WFD Fish Intercalibration- Rivers Preliminary IC results 2011 Correlations with Common Metric FAML
P's r N P's r N P's r N P's r N P's r N P's r N P's r N P's r N
EQR FIL2 0.51 113 0 0.47 108 0 0 0.53 21 0.52 25 0.55 97
EQR8 -0.00 994 0.24 97 -0.35 110 0.09 29 -0.29 753 0.06 98 0.24 108 0.09 610
EQR4 0.27 553 0.67 97 0.24 110 0.14 29 0.06 312 0.57 98 0.65 108 0.49 321
FCI -0.35 71 -0.12 14 0 0 -0.40 57 0.06 11 -0.05 10 0.10 25
Acceptable (Pearson's r>=0.5) = Pass IC Feasibility check 2
Significant (P< 0.001, 2-tailed)
Significant (P< 0.05, 2-tailed)
Not significant (P>=0.05)
No possible comparisons
Non acid or
limed (N=702)
SE lakes
(N=753)
FI type 1
(N=98)
FI type 2
(N=108)L-N-F
indices
All MS &
Types
(N=994)
FI lakes
(N=97)
IE lakes
(N=110)
NO lakes
(N=29)
Correlation between national methods: Pearson’s r (N)
EQRFIL2
EQR4
EQR8
0.15 (409) 0.28 (31)
0.00 (31)
0.56 (97) --- (0)
FCI
-0.18 (97)
EQR4 EQR8
Acidic and limed lakes excluded!
Compared to r = 0.40,
when using 391 lakes
in the pilot study data
WFD Fish Intercalibration - Lakes
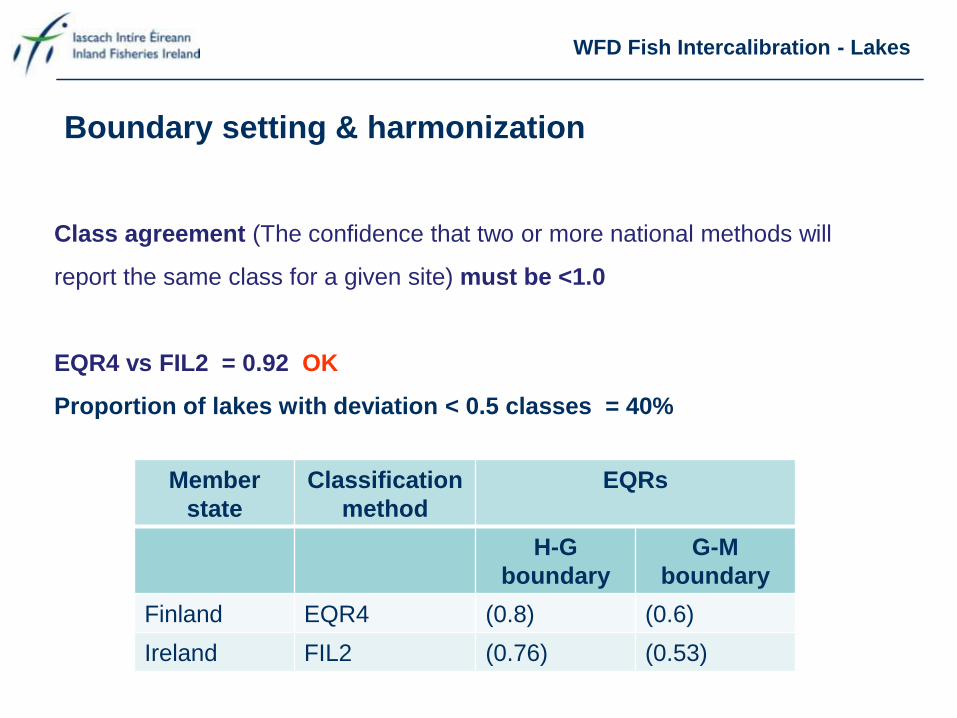
Boundary setting & harmonization
Class agreement (The confidence that two or more national methods will
report the same class for a given site) must be <1.0
EQR4 vs FIL2 = 0.92 OK
Proportion of lakes with deviation < 0.5 classes = 40%
Member
state
Classification
method
EQRs
H-G
boundary
G-M
boundary
Finland EQR4 (0.8) (0.6)
Ireland FIL2 (0.76) (0.53)
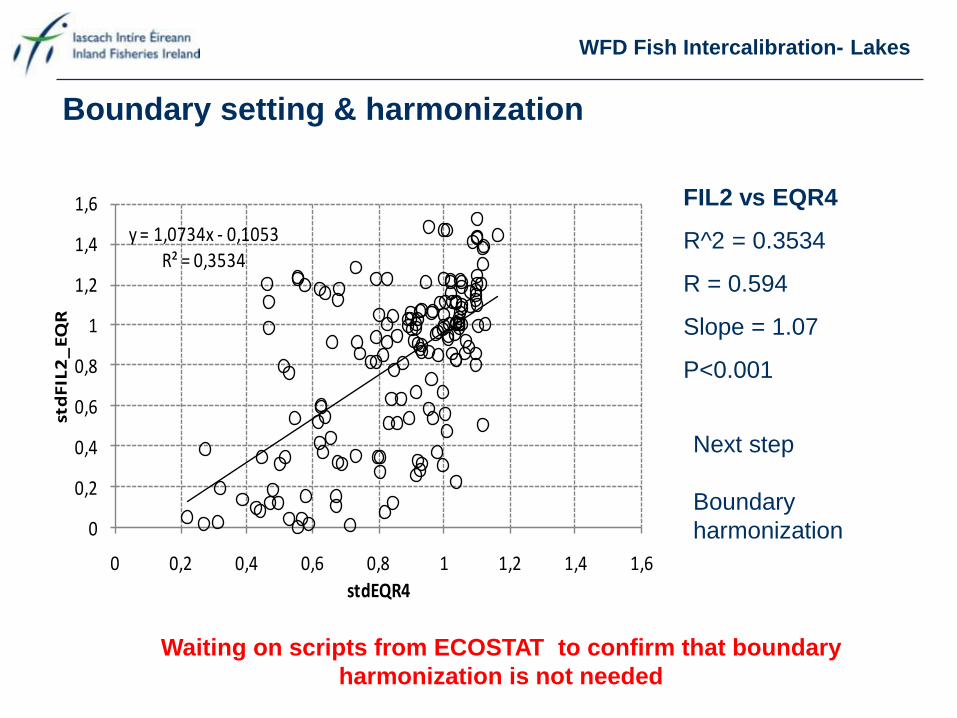
WFD Fish Intercalibration- Lakes
y = 1,0734x - 0,1053R² = 0,3534
0
0,2
0,4
0,6
0,8
1
1,2
1,4
1,6
0 0,2 0,4 0,6 0,8 1 1,2 1,4 1,6
stdFIL2_EQR
stdEQR4
Boundary setting & harmonization
FIL2 vs EQR4
R^2 = 0.3534
R = 0.594
Slope = 1.07
P<0.001
Next step
Boundary
harmonization
Waiting on scripts from ECOSTAT to confirm that boundary
harmonization is not needed
Transitional Fish Classification Index (TFCI) Summary of development and intercalibration
Inland Fisheries Ireland – Research and Development Division
Fiona Kelly and Andrew Harrison
Northern Ireland Environment Agency (NIEA)
Peter Moorehead and Trevor Harrison
Environment Agency (England and Wales)
Steve Coates and Adam Waugh
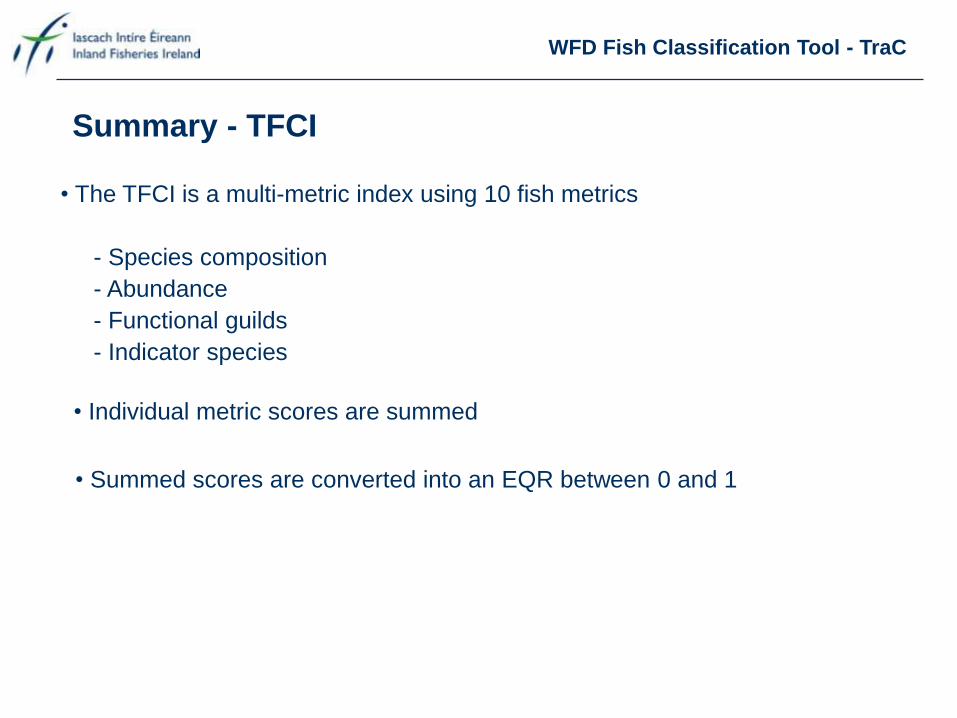
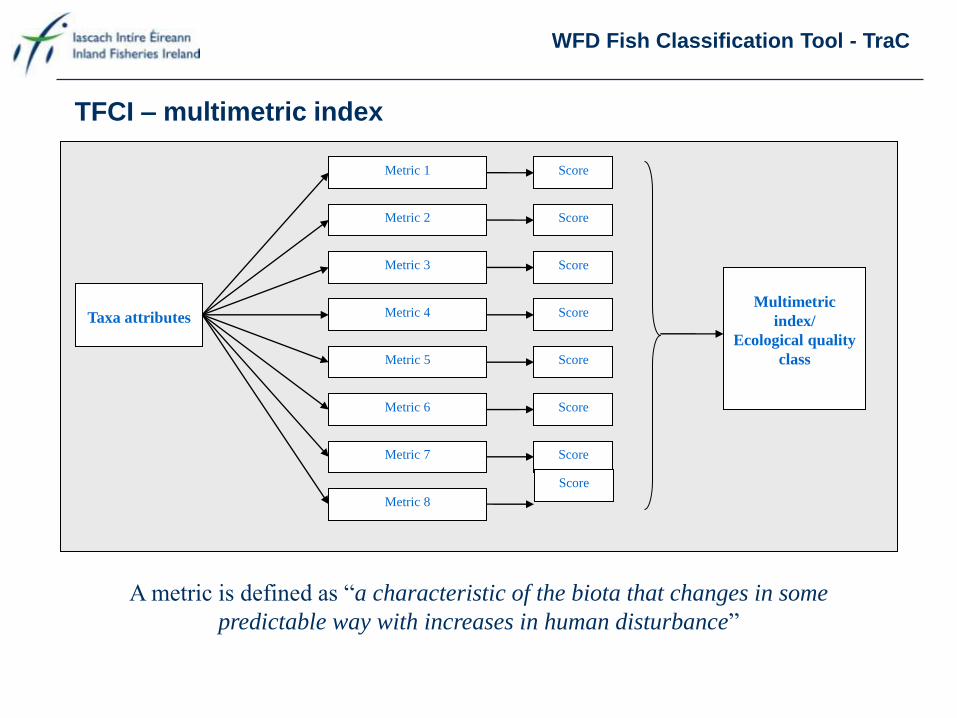
• The TFCI is a multi-metric index using 10 fish metrics
- Species composition
- Abundance
- Functional guilds
- Indicator species
• Individual metric scores are summed
• Summed scores are converted into an EQR between 0 and 1
WFD Fish Classification Tool - TraC
Summary - TFCI
Taxa attributes
Metric 1
Metric 2
Metric 8
Metric 7
Metric 3
Metric 4
Metric 5
Metric 6
Multimetric
index/
Ecological quality
class
Score
Score
Score
Score
Score
Score
Score
A metric is defined as “a characteristic of the biota that changes in some
predictable way with increases in human disturbance”
TFCI – multimetric index
Score
WFD Fish Classification Tool - TraC
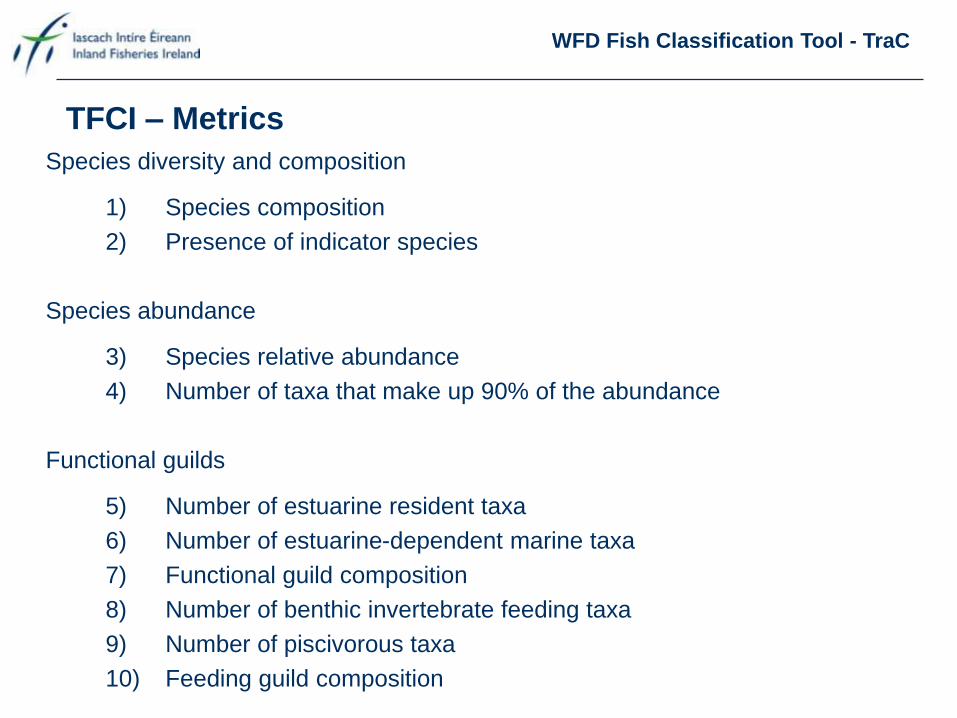
Species diversity and composition
1) Species composition
2) Presence of indicator species
Species abundance
3) Species relative abundance
4) Number of taxa that make up 90% of the abundance
Functional guilds
5) Number of estuarine resident taxa
6) Number of estuarine-dependent marine taxa
7) Functional guild composition
8) Number of benthic invertebrate feeding taxa
9) Number of piscivorous taxa
10) Feeding guild composition
TFCI – Metrics
WFD Fish Classification Tool - TraC
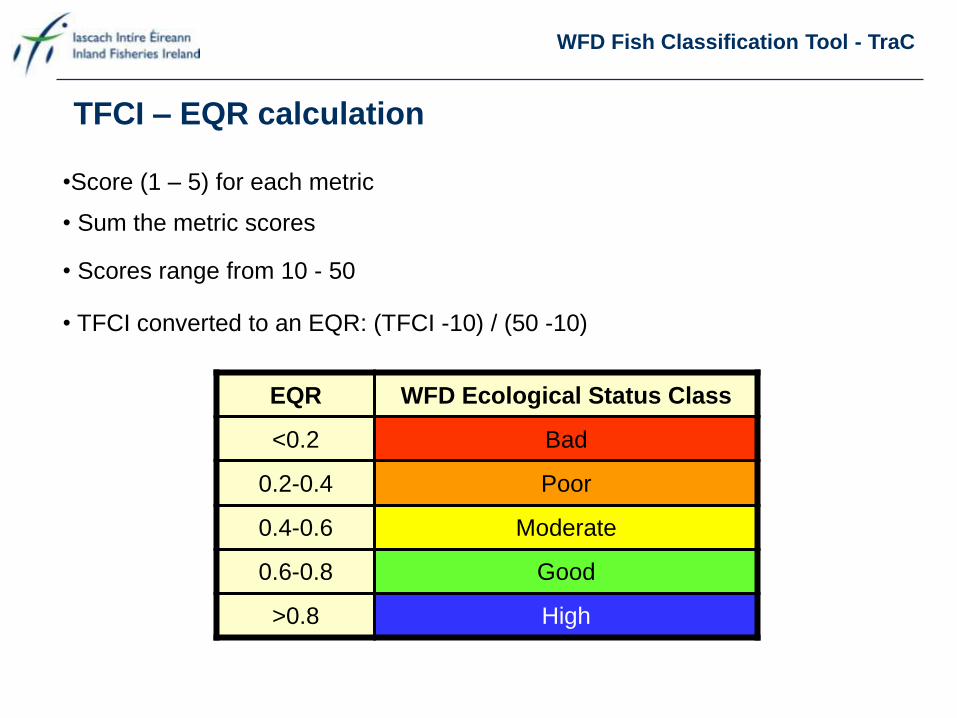
TFCI – EQR calculation
• Sum the metric scores
• TFCI converted to an EQR: (TFCI -10) / (50 -10)
• Scores range from 10 - 50
EQR WFD Ecological Status Class
<0.2 Bad
0.2-0.4 Poor
0.4-0.6 Moderate
0.6-0.8 Good
>0.8 High
•Score (1 – 5) for each metric
WFD Fish Classification Tool - TraC
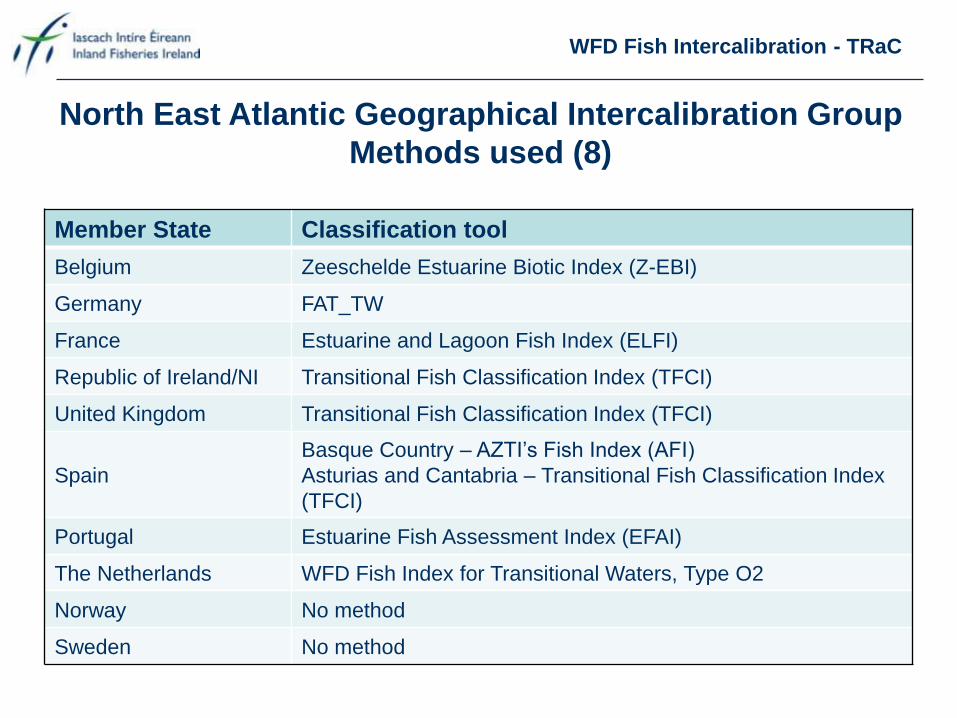
Member State Classification tool
Belgium Zeeschelde Estuarine Biotic Index (Z-EBI)
Germany FAT_TW
France Estuarine and Lagoon Fish Index (ELFI)
Republic of Ireland/NI Transitional Fish Classification Index (TFCI)
United Kingdom Transitional Fish Classification Index (TFCI)
Spain
Basque Country – AZTI’s Fish Index (AFI)
Asturias and Cantabria – Transitional Fish Classification Index
(TFCI)
Portugal Estuarine Fish Assessment Index (EFAI)
The Netherlands WFD Fish Index for Transitional Waters, Type O2
Norway No method
Sweden No method
North East Atlantic Geographical Intercalibration Group
Methods used (8)
WFD Fish Intercalibration - TRaC
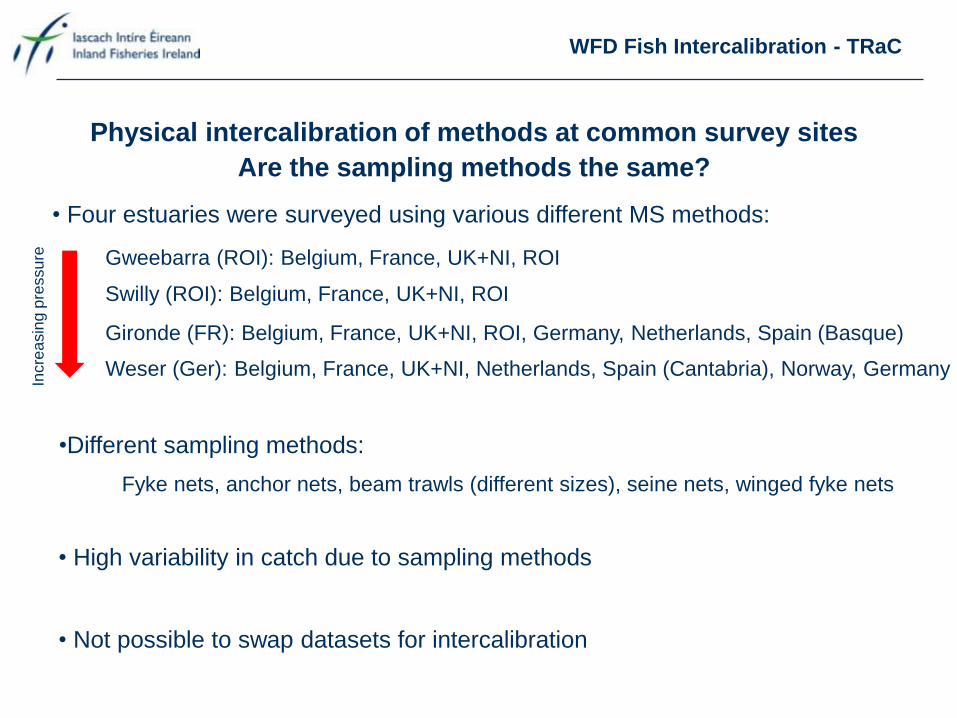
Physical intercalibration of methods at common survey sites
Are the sampling methods the same?
• Not possible to swap datasets for intercalibration
• High variability in catch due to sampling methods
•Different sampling methods:
Fyke nets, anchor nets, beam trawls (different sizes), seine nets, winged fyke nets
• Four estuaries were surveyed using various different MS methods:
Gweebarra (ROI): Belgium, France, UK+NI, ROI
Swilly (ROI): Belgium, France, UK+NI, ROI
Gironde (FR): Belgium, France, UK+NI, ROI, Germany, Netherlands, Spain (Basque)
Weser (Ger): Belgium, France, UK+NI, Netherlands, Spain (Cantabria), Norway, Germany
Incre
asin
g p
ressu
re
WFD Fish Intercalibration - TRaC
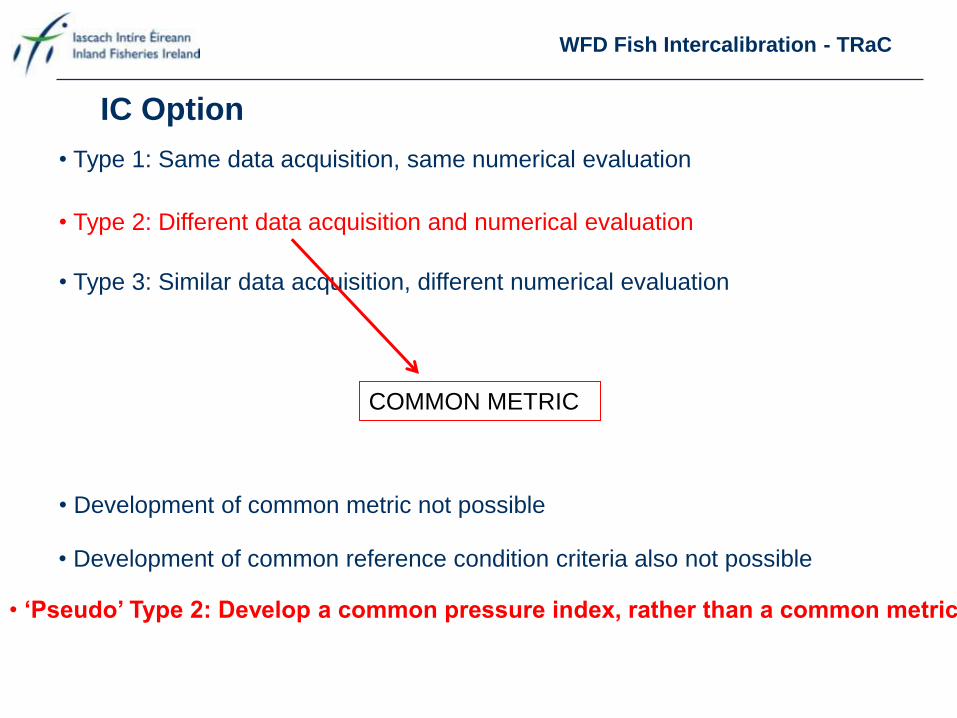
• Type 1: Same data acquisition, same numerical evaluation
• Type 2: Different data acquisition and numerical evaluation
• Type 3: Similar data acquisition, different numerical evaluation
COMMON METRIC
• Development of common metric not possible
• Development of common reference condition criteria also not possible
• ‘Pseudo’ Type 2: Develop a common pressure index, rather than a common metric
IC Option
WFD Fish Intercalibration - TRaC
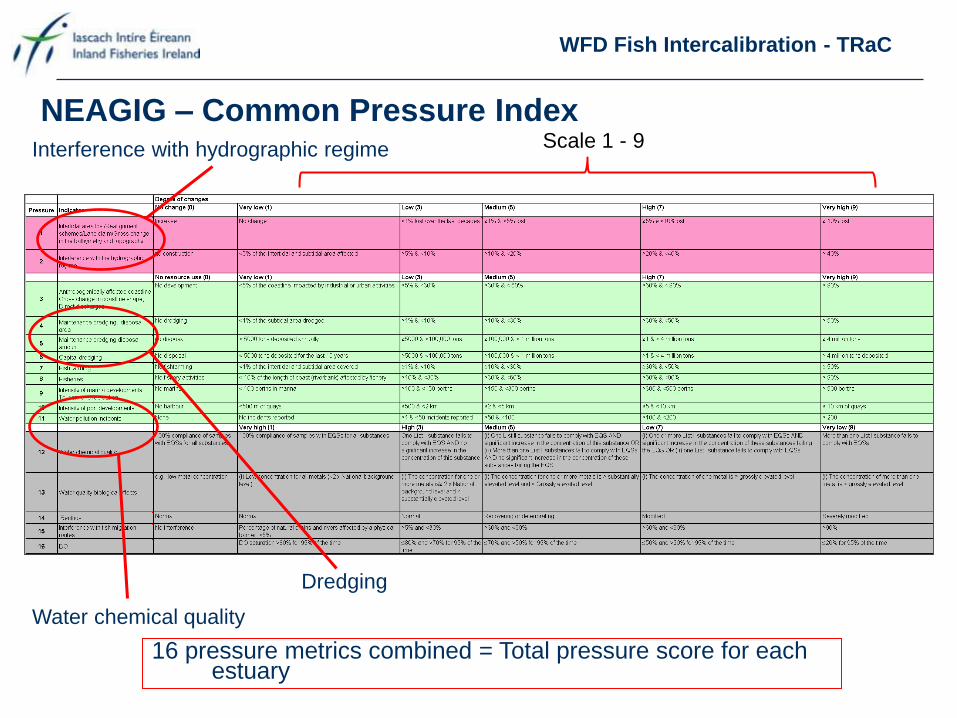
NEAGIG – Common Pressure Index
Water chemical quality
Dredging
Interference with hydrographic regime Scale 1 - 9
16 pressure metrics combined = Total pressure score for each estuary
WFD Fish Intercalibration - TRaC
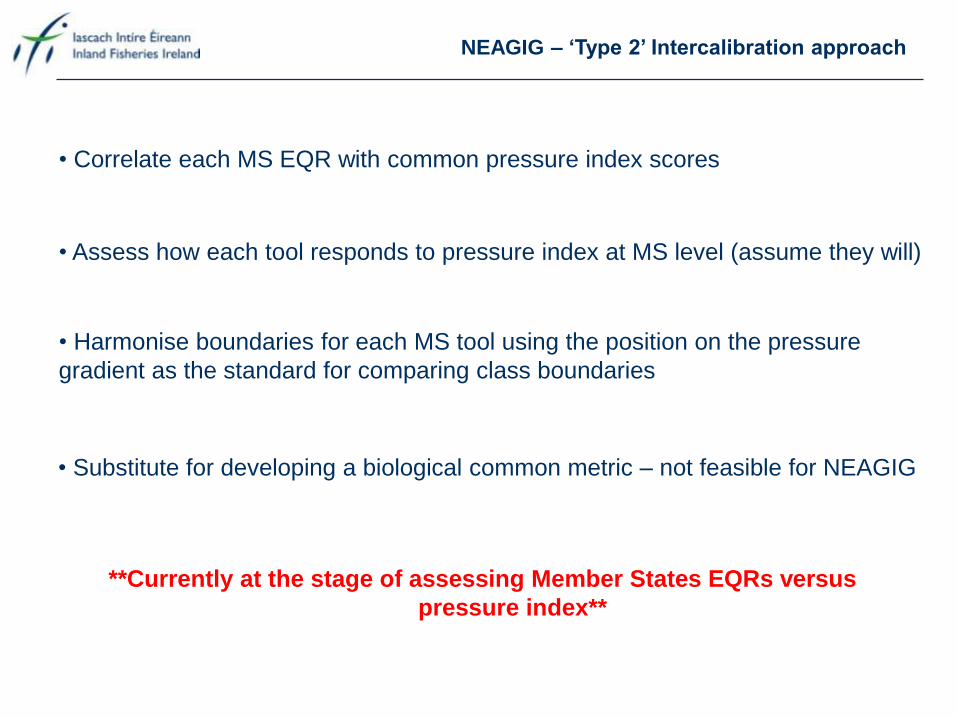
• Correlate each MS EQR with common pressure index scores
• Assess how each tool responds to pressure index at MS level (assume they will)
• Harmonise boundaries for each MS tool using the position on the pressure
gradient as the standard for comparing class boundaries
NEAGIG – ‘Type 2’ Intercalibration approach
• Substitute for developing a biological common metric – not feasible for NEAGIG
**Currently at the stage of assessing Member States EQRs versus
pressure index**
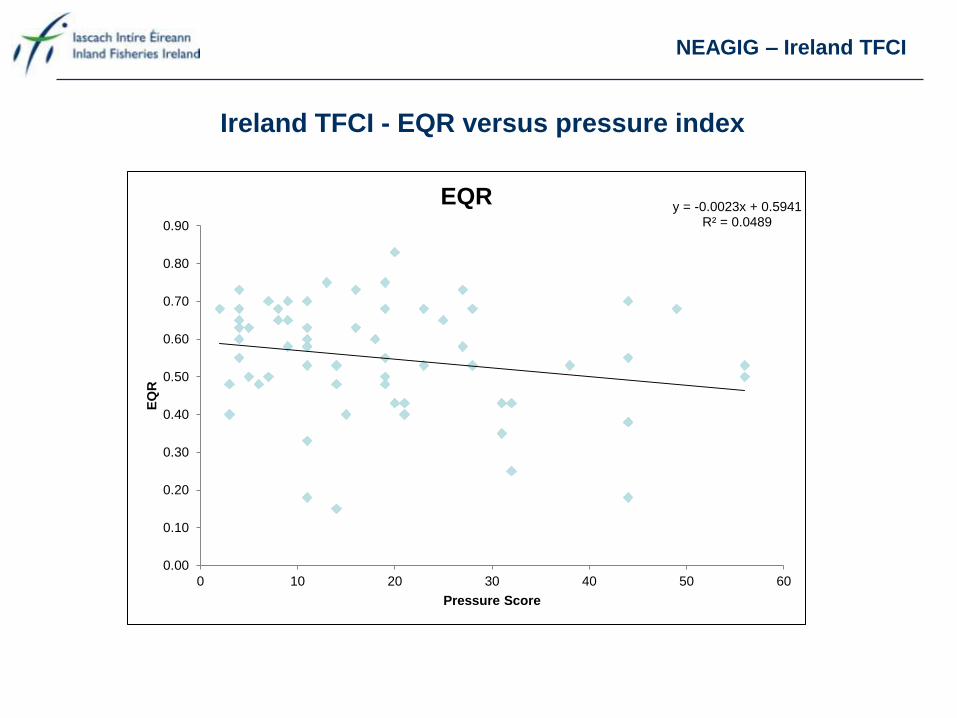
Ireland TFCI - EQR versus pressure index
NEAGIG – Ireland TFCI
y = -0.0023x + 0.5941 R² = 0.0489
0.00
0.10
0.20
0.30
0.40
0.50
0.60
0.70
0.80
0.90
0 10 20 30 40 50 60
EQ
R
Pressure Score
EQR
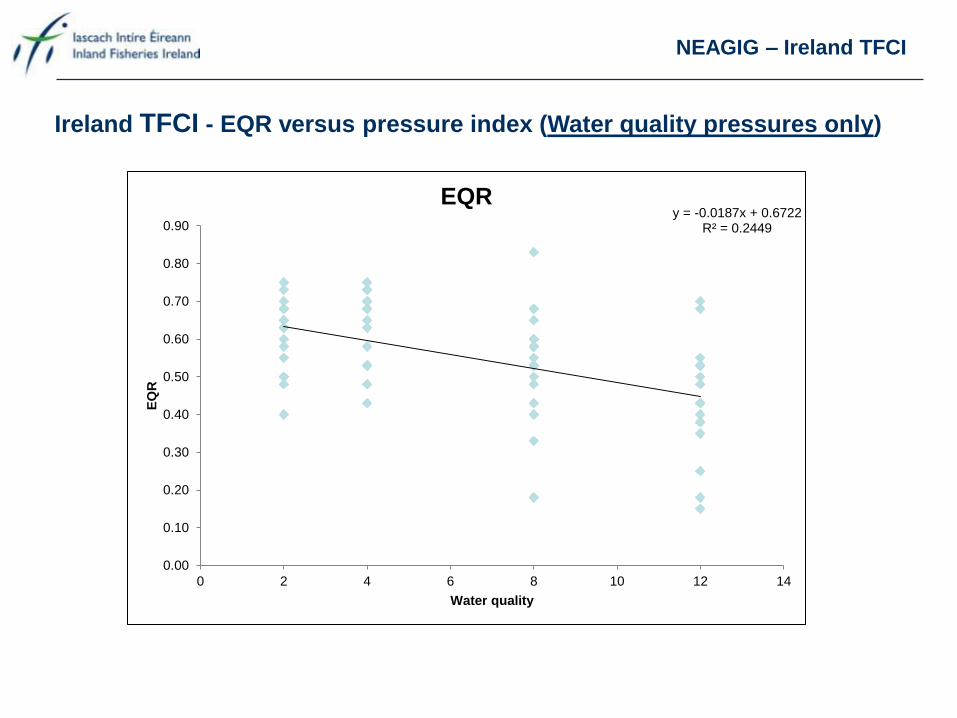
y = -0.0187x + 0.6722 R² = 0.2449
0.00
0.10
0.20
0.30
0.40
0.50
0.60
0.70
0.80
0.90
0 2 4 6 8 10 12 14
EQ
R
Water quality
EQR
Ireland TFCI - EQR versus pressure index (Water quality pressures only)
NEAGIG – Ireland TFCI
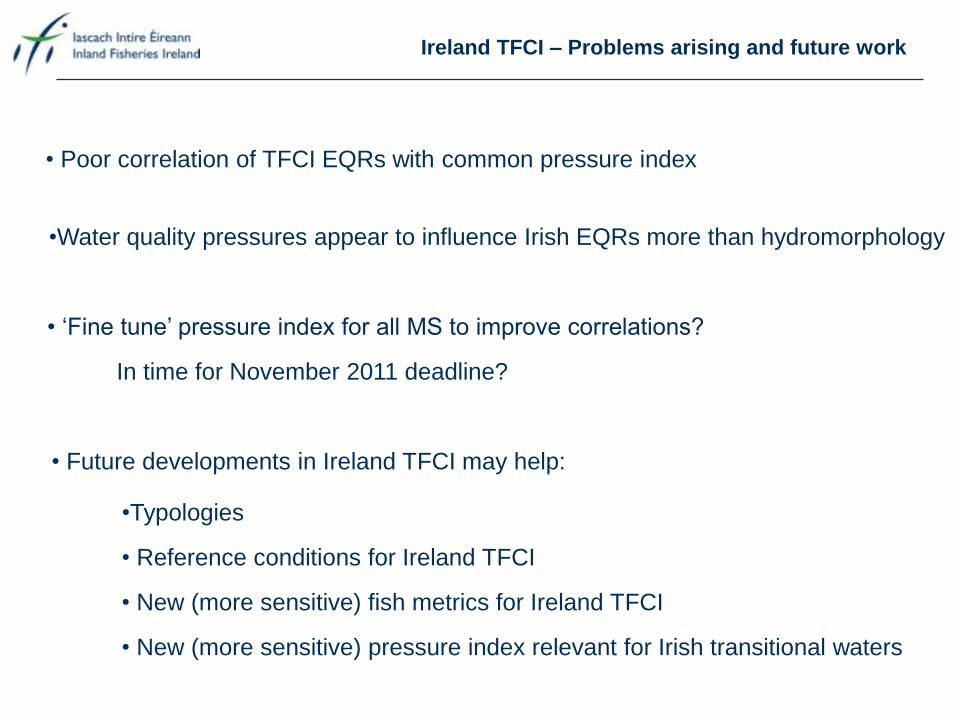
• Poor correlation of TFCI EQRs with common pressure index
•Water quality pressures appear to influence Irish EQRs more than hydromorphology
Ireland TFCI – Problems arising and future work
• Future developments in Ireland TFCI may help:
•Typologies
• Reference conditions for Ireland TFCI
• New (more sensitive) fish metrics for Ireland TFCI
• New (more sensitive) pressure index relevant for Irish transitional waters
• ‘Fine tune’ pressure index for all MS to improve correlations?
In time for November 2011 deadline?
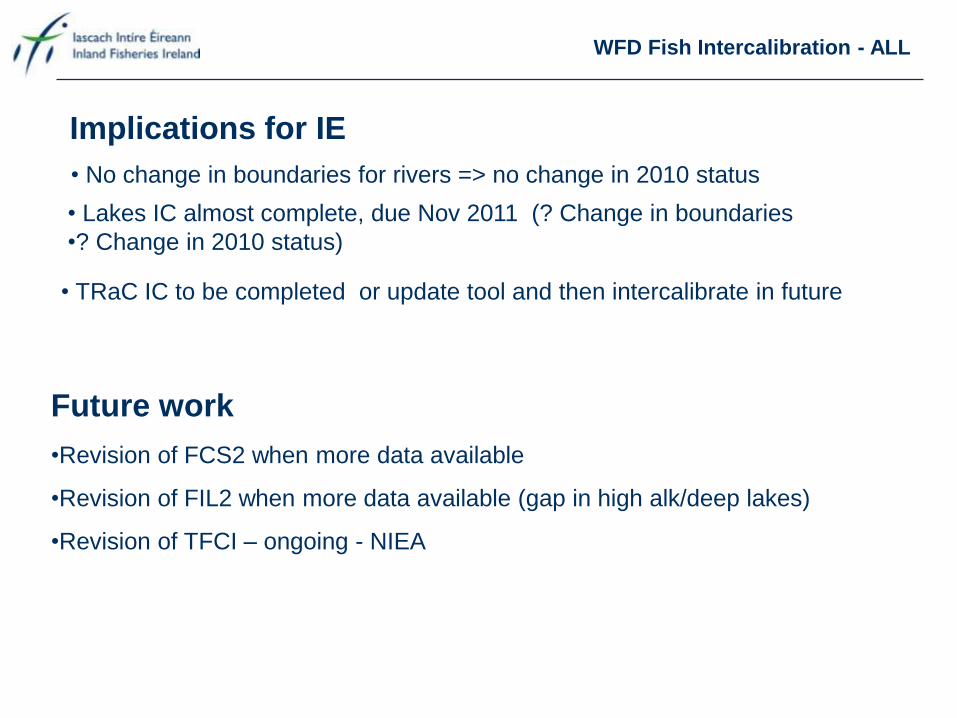
WFD Fish Intercalibration - ALL
Implications for IE
• TRaC IC to be completed or update tool and then intercalibrate in future
Future work
•Revision of FCS2 when more data available
•Revision of FIL2 when more data available (gap in high alk/deep lakes)
•Revision of TFCI – ongoing - NIEA
• No change in boundaries for rivers => no change in 2010 status
• Lakes IC almost complete, due Nov 2011 (? Change in boundaries
•? Change in 2010 status)
Thank you
Thank You