Embed Size (px)
Citation preview
ORI GIN AL PA PER
Inland fields of dispersed cobbles and bouldersas evidence for a tsunami on Anegada, British VirginIslands
Steve Watt • Mark Buckley • Bruce Jaffe
Received: 3 February 2010 / Accepted: 2 May 2011� Springer Science+Business Media B.V. 2011
Abstract Marine overwash from the north a few centuries ago transported hundreds of
angular cobbles and boulders tens to hundreds of meters southward from limestone out-
crops in the interior of Anegada, 140 km east–northeast of Puerto Rico. We examined two
of several cobble and boulder fields as part of an effort to interpret whether the overwash
resulted from a tsunami or a storm in a location where both events are known to occur. One
of the cobble and boulder field extends 200 m southward from limestone outcrops that are
300 m inland from the island’s north shore. The other field extends 100 m southward from
a limestone knoll located 800 m from the nearest shore. In the two fields, we measured the
size, orientation, and spatial distribution of a total of 161 clasts and determined their
stratigraphic positions with respect to an overwash sand and shell sheet deposit. In both
fields, we found the spacing between clasts increased southward and that clast long-axis
orientations are consistent with a transport trending north–south. Almost half the clasts are
partially buried in a landward thinning and fining overwash sand and none were found
embedded in the shelly mud of a pre-overwash marine pond. The two cobble and boulder
fields resemble modern tsunami deposits in which dispersed clasts extend inland as a single
layer. The fields contrast with coarse clast storm deposits that often form wedge-shaped
shore-parallel ridges. These comparisons suggest that the overwash resulted from a tsu-
nami and not from a storm.
Keywords Caribbean � Tsunami � Storm
1 Introduction
Coarse clast deposits formed by storms and tsunamis can produce a valuable record of the
frequency and magnitude of marine overwash events. However, determining whether a
Electronic supplementary material The online version of this article (doi:10.1007/s11069-011-9848-y)contains supplementary material, which is available to authorized users.
S. Watt (&) � M. Buckley � B. JaffeU.S. Geological Survey, 400 Natural Bridges Drive, Santa Cruz, CA 95060, USAe-mail: [email protected]
123
Nat HazardsDOI 10.1007/s11069-011-9848-y
storm or tsunami created a deposit can be very difficult. Comparisons between the char-
acters of different overwash deposits have been used to discriminate between storm or
tsunami origin. Storm and hurricane coarse clast deposits usually form ridges, ridge
complexes (Morton et al. 2008), or cliff top deposits (Williams and Hall 2004) built up as a
result of intense multiple high-frequency waves. Ridges and ridge complexes have sedi-
mentary structures and are densely packed and layered. The deposits typically form shore-
parallel wedges, a few to tens of meters from the shoreline. The deposits can be several
meters high and tens of meters wide and have not been found extending more than a few
hundred meters from shore (Scoffin 1993; Scheffers 2005; Morton et al. 2008; Etienne and
Paris 2010).
Cobbles and boulders transported inland by tsunamis are typically dispersed into
expansive fields in a single layer spaced apart from each other. Modern examples of
dispersed tsunami boulder deposits have been reported in the intertidal in Thailand
(Di Geronimo et al. 2009; Goto et al. 2007), in coastal plain settings in Indonesia (Paris
et al. 2009), and on elevated platforms in Hawaii (Goff et al. 2006; Richmond et al. 2011).
In addition, tsunamis are capable of transporting coarse clast material tens to many hun-
dreds of meters inland (Paris et al. 2009).
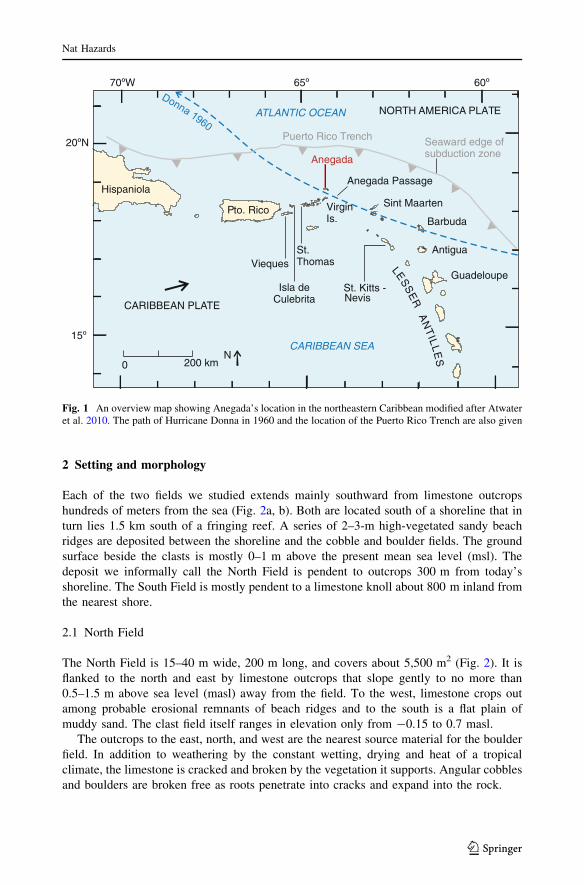
Fields of cobbles and boulders on Anegada, British Virgin Islands, 140 km east–
northeast of Puerto Rico (Fig. 1) form part of the physical evidence for overwash in a
location subject to both tropical storms and tsunamis (Atwater et al. 2010; Pilarczyk and
Reinhardt 2010; and Reinhardt et al. 2011). Unlike many other cobble and boulder deposits
where clasts are derived from a shoreline cliff, ridge, or reef, (Goff et al. 2006; Goto et al.
2007, 2009; Paris et al. 2009; Richmond et al. 2011), the clasts in Anegada are derived
from inland Pleistocene limestone outcrops as much as 1 km from the shoreline. Many of
the cobbles and boulders are embedded in a landward fining and thinning sand and shell
sheet derived from the beach and ridges shoreward of the clast fields (Atwater et al. 2010;
Pilarczyk and Reinhardt 2010).
The timing of the overwash event has been constrained between *1,650 and 1,800
based on radiocarbon dated leaves within the event deposit and the human settlement of the
island in the late 1700s (Atwater et al. 2010). While the timing is constrained, the cause of
the overwash event remains unknown. Anegada is located just south of the Puerto Rico
Trench (Fig. 1), the active boundary between the North American and Caribbean Plates
that is capable of producing large earthquakes and tsunamis (Atwater et al. 2010; Reid and
Taber 1920; Zahibo 2003). The far-field 1755 Lisbon tsunami inundated many Caribbean
islands, and wave heights east of Anegada are estimated to have been 2–6 m (O’Loughlin
and Lander 2003). Anegada is also located along the path of many western traveling
hurricanes. In 1960, Hurricane Donna (likely a Category 3) passed 15 km south of
Anegada (Dunn 1961), but interviews with Anegadian citizens described significant
inundation of Anegada’s south shore but little sediment transport during the event (Atwater
et al. 2010 ESM). Computer simulations of several storm and tsunami scenarios have been
performed by Wei et al. (2010), and boulder transport modeling performed by Buckley
et al. (2011) addresses the capability of storm and tsunami events to generate velocities
sufficient to transport clasts at Anegada.
This paper describes two of Anegada’s coarse clast fields by spatial distribution, weight,
stratigraphic position, and long (A-axis) orientations of their clasts. We compare these
characteristics with those of modern deposits to infer whether the fields represent a tsunami
or a storm. The field methods included differential GPS surveys and measurements of 161
clasts among the two fields. Details on these methods can be found in Online Resource 1.
Nat Hazards
123
2 Setting and morphology
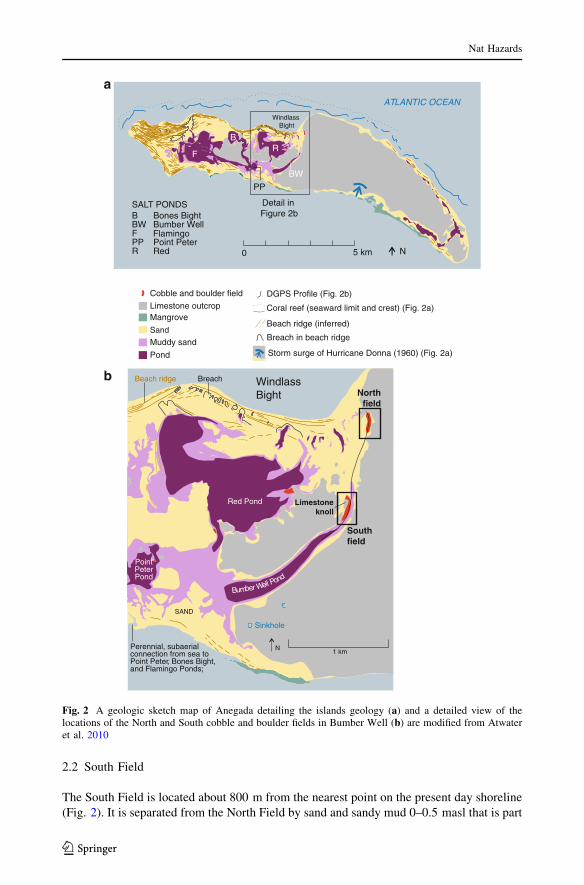
Each of the two fields we studied extends mainly southward from limestone outcrops
hundreds of meters from the sea (Fig. 2a, b). Both are located south of a shoreline that in
turn lies 1.5 km south of a fringing reef. A series of 2–3-m high-vegetated sandy beach
ridges are deposited between the shoreline and the cobble and boulder fields. The ground
surface beside the clasts is mostly 0–1 m above the present mean sea level (msl). The
deposit we informally call the North Field is pendent to outcrops 300 m from today’s
shoreline. The South Field is mostly pendent to a limestone knoll about 800 m inland from
the nearest shore.
2.1 North Field
The North Field is 15–40 m wide, 200 m long, and covers about 5,500 m2 (Fig. 2). It is
flanked to the north and east by limestone outcrops that slope gently to no more than
0.5–1.5 m above sea level (masl) away from the field. To the west, limestone crops out
among probable erosional remnants of beach ridges and to the south is a flat plain of
muddy sand. The clast field itself ranges in elevation only from -0.15 to 0.7 masl.
The outcrops to the east, north, and west are the nearest source material for the boulder
field. In addition to weathering by the constant wetting, drying and heat of a tropical
climate, the limestone is cracked and broken by the vegetation it supports. Angular cobbles
and boulders are broken free as roots penetrate into cracks and expand into the rock.
Virgin Is.
Anegada Passage
ViequesSt. Thomas
Antigua
GuadeloupeSt. Kitts - Nevis
Anegada
NORTH AMERICA PLATE
CARIBBEAN PLATE
CARIBBEAN SEA
Hispaniola
Seaward edge of subduction zone
Pto. Rico
LES
SE
R
AN
TIL
LE
S
Isla de Culebrita
Barbuda
Sint Maarten
ATLANTIC OCEAN
200 km0
Puerto Rico Trench
N
20ºN
70ºW 65º 60º
15º
Fig. 1 An overview map showing Anegada’s location in the northeastern Caribbean modified after Atwateret al. 2010. The path of Hurricane Donna in 1960 and the location of the Puerto Rico Trench are also given
Nat Hazards
123
2.2 South Field
The South Field is located about 800 m from the nearest point on the present day shoreline
(Fig. 2). It is separated from the North Field by sand and sandy mud 0–0.5 masl that is part
and Flamingo Ponds; , Bones Bight, Point Peter
connection from sea to Perennial, subaerial
Windlass Bight
SAND
ONELIMEST
dnoPlleWrebmuB
PondPeterPoint
Red Pond
Beach ridge Breach
Sinkhole
Northfield
South field
Limestoneknoll
N 1 km
b
N
F
BR
Windlass Bight
ATLANTIC OCEAN
PP
BW
Detail in Figure 2b
SALT PONDSB Bones BightBW Bumber WellFPP Point PeterR Red 0 5 km
a
DGPS Profile (Fig. 2b)Cobble and boulder field
Limestone outcrop
Sand
Muddy sand
Pond
Breach in beach ridge
Beach ridge (inferred)Mangrove
Coral reef (seaward limit and crest) (Fig. 2a)
Storm surge of Hurricane Donna (1960) (Fig. 2a)
Flamingo
Fig. 2 A geologic sketch map of Anegada detailing the islands geology (a) and a detailed view of thelocations of the North and South cobble and boulder fields in Bumber Well (b) are modified from Atwateret al. 2010
Nat Hazards
123
of a swale between limestone uplands that slope gently to 1.3 masl to the east and west.
The South Field is in an area of low relief about 225 m long from north to south, 20
to100 m wide east–west and centered around a limestone knoll 1.5 masl. The knoll is the
most likely source for cobbles and boulders in the South Field and is about 90 m long,
25–45 m wide and bordered by a thin drape of muddy sand. South of the knoll microbial
mats mark the intermittent extension of the hypersaline Bumber Well Pond (Reinhardt
et al. 2011). The field lowest elevation, -0.29 masl, is located in the northeast–southwest
trending channel approximately 60 m east of the knoll.
3 Clast size and spacing
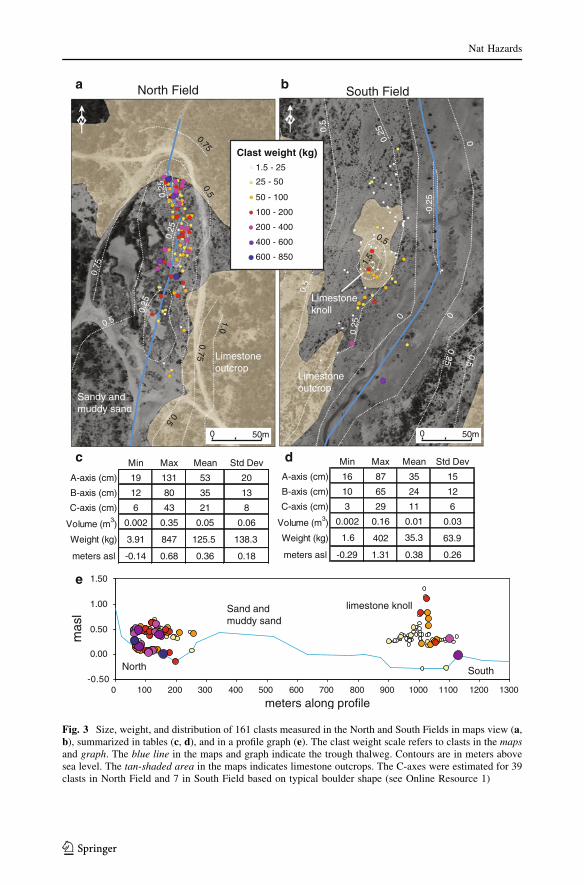
A total of 161 clasts were measured in the North (91) and South Fields (70) (Fig. 3). Clast
weights have a greater range in the North Field (4–850 kg) than the South Field
(1.6–402 kg). Because boulders were partially buried in the sand sheet, the C-axis was
estimated for 39 clasts in the North Field and for 7 clasts in the South Field based on
typical boulder shapes (see Online Resource 1). In both fields, clasts are gray to light gray,
tabular and angular, indicating they have not been transported far from the source or
rounded by surf (Fig. 4). If the main direction of transport was from north to south, the
range of possible transport distances from potential sources spans from about 0 to 200 m in
the North Field and from 0 to 100 m in the South Field. No clast is more than 65 m away
from a potential source in either field.
Cobbles and boulders in the North and South Fields are not deposited in a ridge or other
structure and are dispersed throughout the fields. However, on the north end of North Field,
the number of clasts is greater and they are more densely clustered than in the south end
(Fig. 3). Clasts also tend to be heavier and larger in the northern part of North Field than
the southern end. The weight of clasts generally decreases southward through the North
Field, while the space between them increases.
In the South Field, the majority of the clasts are clustered above the 0.25 m contour
around the limestone knoll and become increasingly dispersed southward (Fig. 3). The
largest clasts tend to be deposited south of the limestone knoll and in the lower elevations
near the channel thalweg. The largest boulder measured in the South Field is partially
buried in the channel thalweg 90 m away from the limestone knoll and 60 m away from
the nearest possible source.
4 Stratigraphic positions
We examined the stratigraphic positions of the clasts to learn whether any were laid down
prior to the overwash event that is recorded by a sheet of sand and shell at Anegada
(Atwater et al. 2010). The sand and shell sheet rests over the shelly mud of a former marine
pond, which in turn overlies the limestone. Though unable to observe the entire undersides
of some boulders, we tried to determine whether any of their keels extended into the pre-
overwash marine pond deposit.
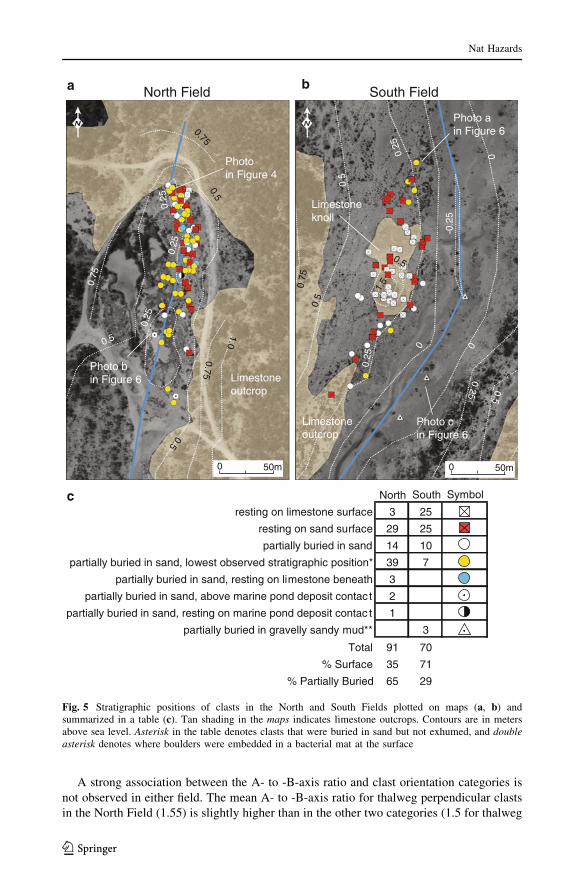
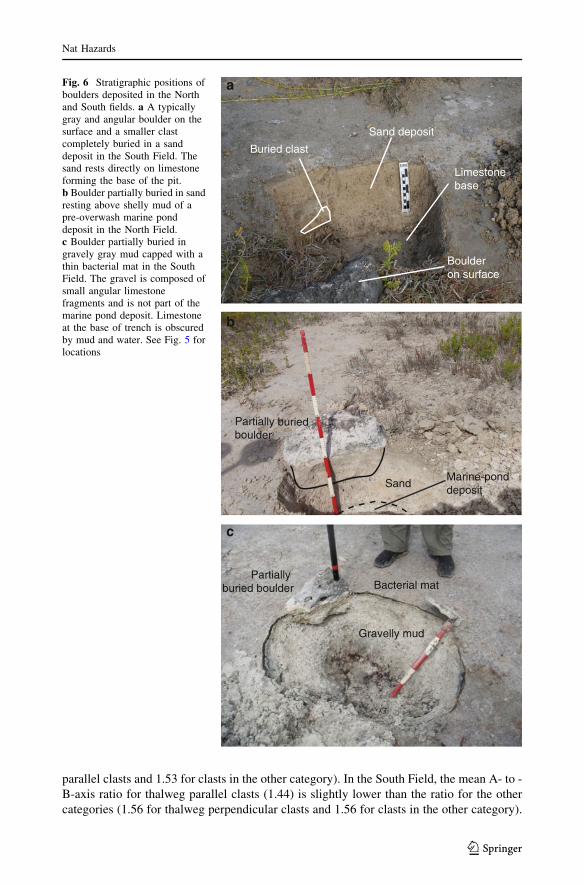
The most exposed clasts in the North and South Fields rest on the surface of exposed
limestone, on the surface of the sand and shell sheet, or are partially embedded within the
sheet (Fig. 5). Many additional clasts in both fields are probably completely buried and not
visible (Fig. 6a). About 2/3 of the clasts in the North Field are embedded in the sand sheet
(Fig. 5). A few partially buried boulders are in contact with the limestone that directly
Nat Hazards
123
-0.50
0.00
0.50
1.00
1.50
0 100 200 300 400 500 600 700 800 900 1000 1100 1200 1300
meters along profile
mas
l
limestone knollSand and muddy sand
North South
North Field
Limestone knoll
Limestone outcrop
South Field
Limestone outcrop
Sandy andmuddy sand
0 50m0 50m
Clast weight (kg)1.5 - 25
25 - 50
50 - 100
100 - 200
200 - 400
400 - 600
600 - 850
0.750.50.
25
0.75
0.25
0.25
1.0
0.75
0.5
0.5
0.5
-0.2
5
0.25
0 0
0.5
1.5
0.25
0.5
0
0.250.
5
Min Max Mean Std Dev
A-axis (cm) 16 87 35 15
B-axis (cm) 10 65 24 12
C-axis (cm) 3 29 11 6
Volume (m3) 0.002 0.16 0.01 0.03
Weight (kg) 1.6 402 35.3 63.9
meters asl -0.29 1.31 0.38 0.26
Min Max Mean Std Dev
A-axis (cm) 19 131 53 20
B-axis (cm) 12 80 35 13
C-axis (cm) 6 43 21 8
Volume (m3) 0.002 0.35 0.05 0.06
Weight (kg) 3.91 847 125.5 138.3
meters asl -0.14 0.68 0.36 0.18
a b
c d
e
Fig. 3 Size, weight, and distribution of 161 clasts measured in the North and South Fields in maps view (a,b), summarized in tables (c, d), and in a profile graph (e). The clast weight scale refers to clasts in the mapsand graph. The blue line in the maps and graph indicate the trough thalweg. Contours are in meters abovesea level. The tan-shaded area in the maps indicates limestone outcrops. The C-axes were estimated for 39clasts in North Field and 7 in South Field based on typical boulder shape (see Online Resource 1)
Nat Hazards
123
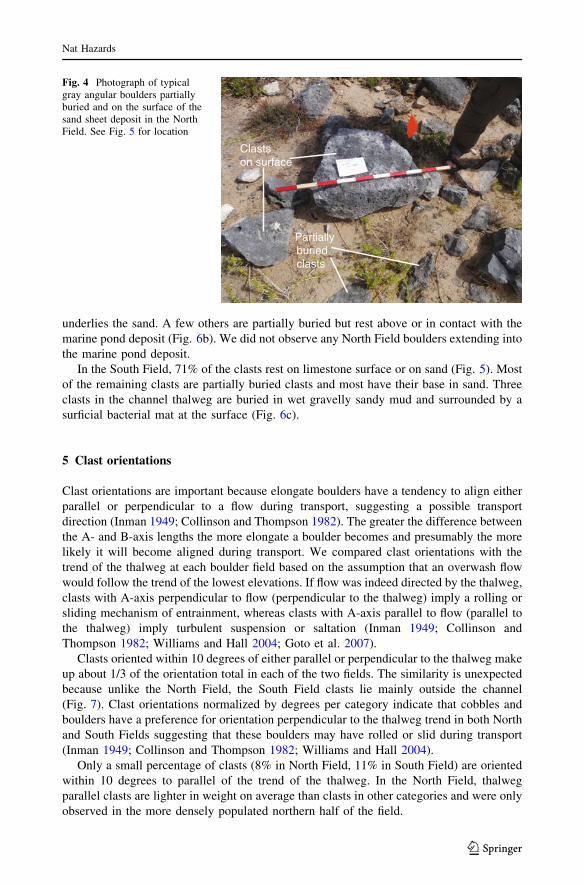
underlies the sand. A few others are partially buried but rest above or in contact with the
marine pond deposit (Fig. 6b). We did not observe any North Field boulders extending into
the marine pond deposit.
In the South Field, 71% of the clasts rest on limestone surface or on sand (Fig. 5). Most
of the remaining clasts are partially buried clasts and most have their base in sand. Three
clasts in the channel thalweg are buried in wet gravelly sandy mud and surrounded by a
surficial bacterial mat at the surface (Fig. 6c).
5 Clast orientations
Clast orientations are important because elongate boulders have a tendency to align either
parallel or perpendicular to a flow during transport, suggesting a possible transport
direction (Inman 1949; Collinson and Thompson 1982). The greater the difference between
the A- and B-axis lengths the more elongate a boulder becomes and presumably the more
likely it will become aligned during transport. We compared clast orientations with the
trend of the thalweg at each boulder field based on the assumption that an overwash flow
would follow the trend of the lowest elevations. If flow was indeed directed by the thalweg,
clasts with A-axis perpendicular to flow (perpendicular to the thalweg) imply a rolling or
sliding mechanism of entrainment, whereas clasts with A-axis parallel to flow (parallel to
the thalweg) imply turbulent suspension or saltation (Inman 1949; Collinson and
Thompson 1982; Williams and Hall 2004; Goto et al. 2007).
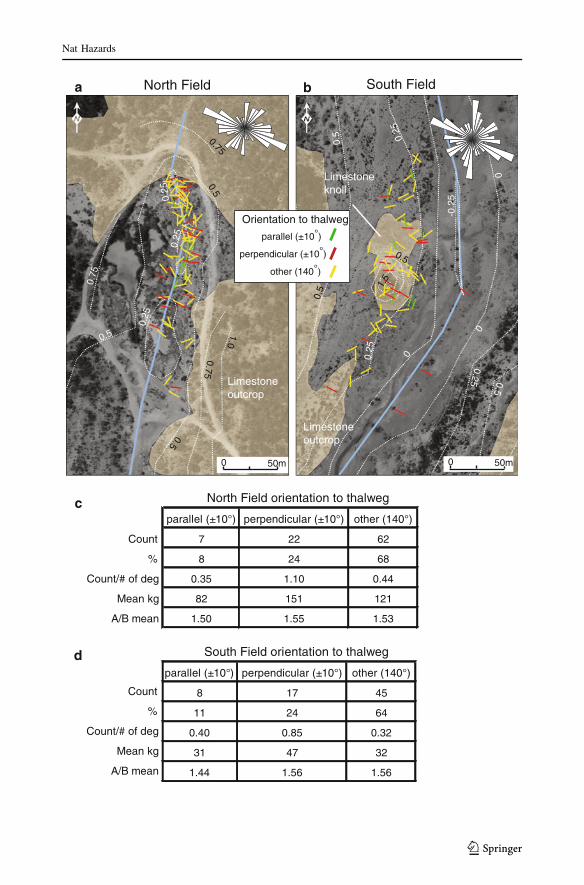
Clasts oriented within 10 degrees of either parallel or perpendicular to the thalweg make
up about 1/3 of the orientation total in each of the two fields. The similarity is unexpected
because unlike the North Field, the South Field clasts lie mainly outside the channel
(Fig. 7). Clast orientations normalized by degrees per category indicate that cobbles and
boulders have a preference for orientation perpendicular to the thalweg trend in both North
and South Fields suggesting that these boulders may have rolled or slid during transport
(Inman 1949; Collinson and Thompson 1982; Williams and Hall 2004).
Only a small percentage of clasts (8% in North Field, 11% in South Field) are oriented
within 10 degrees to parallel of the trend of the thalweg. In the North Field, thalweg
parallel clasts are lighter in weight on average than clasts in other categories and were only
observed in the more densely populated northern half of the field.
Partially buriedclasts
Clasts on surface
Fig. 4 Photograph of typicalgray angular boulders partiallyburied and on the surface of thesand sheet deposit in the NorthField. See Fig. 5 for location
Nat Hazards
123
A strong association between the A- to -B-axis ratio and clast orientation categories is
not observed in either field. The mean A- to -B-axis ratio for thalweg perpendicular clasts
in the North Field (1.55) is slightly higher than in the other two categories (1.5 for thalweg
North South Symbol
resting on limestone surface 3 25
resting on sand surface 29 25
partially buried in sand 14 10
partially buried in sand, lowest observed stratigraphic position* 39 7
partially buried in sand, resting on limestone beneath 3
partially buried in sand, above marine pond deposit contact 2
partially buried in sand, resting on marine pond deposit contac t 1
partially buried in gravelly sandy mud** 3
Total 91 70
% Surface 35 71
% Partially Buried 65 29
a b
c
Photo in Figure 4
Photo a in Figure 6
Photo cin Figure 6
Photo bin Figure 6
North Field South Field
Limestone outcrop
Limestone outcrop
Limestone knoll
0.75
0.75
0.5
0.25
0.75
0.25
0.25
1.0
0.75
0.5
0.5
0.5
-0.2
5
0.25
0 0
0.5
1.5
0.25 0.5
00.25
0.5
0 50m 0 50m
Fig. 5 Stratigraphic positions of clasts in the North and South Fields plotted on maps (a, b) andsummarized in a table (c). Tan shading in the maps indicates limestone outcrops. Contours are in metersabove sea level. Asterisk in the table denotes clasts that were buried in sand but not exhumed, and doubleasterisk denotes where boulders were embedded in a bacterial mat at the surface
Nat Hazards
123
parallel clasts and 1.53 for clasts in the other category). In the South Field, the mean A- to -
B-axis ratio for thalweg parallel clasts (1.44) is slightly lower than the ratio for the other
categories (1.56 for thalweg perpendicular clasts and 1.56 for clasts in the other category).
Bacterial mat
Gravelly mud
Partially buried boulder
c
Limestone base
Sand deposit
Buried clast
Boulder on surface
a
b
Sand
Partially buriedboulder
Marine-pond deposit
Fig. 6 Stratigraphic positions ofboulders deposited in the Northand South fields. a A typicallygray and angular boulder on thesurface and a smaller clastcompletely buried in a sanddeposit in the South Field. Thesand rests directly on limestoneforming the base of the pit.b Boulder partially buried in sandresting above shelly mud of apre-overwash marine ponddeposit in the North Field.c Boulder partially buried ingravely gray mud capped with athin bacterial mat in the SouthField. The gravel is composed ofsmall angular limestonefragments and is not part of themarine pond deposit. Limestoneat the base of trench is obscuredby mud and water. See Fig. 5 forlocations
Nat Hazards
123
6 Interpretations
6.1 Direction of transport
Despite significant barriers to overwash flow such as the offshore fringing reef and 2–3-m
high-sandy beach ridges, characteristics of the North and South cobble and boulder fields
on Anegada including dispersal and fining trends, stratigraphic positions, and orientations
suggest an overwash flow occurred on the north shore of Anegada and continued south-
ward into Bumber Well Pond. Cobbles and boulders in the North Field are larger and
heavier and are more densely clustered in the northern end of the deposit and become
smaller, lighter, and increasingly dispersed from one another over 200 m in the southern
end of the deposit. This depositional pattern is consistent with an overwash flow from the
north and dissipating in strength to the south.
The close proximity of the South Field cobbles and boulders to a limestone knoll
suggests transport distances were shorter in the South Field than the North Field. Shorter
transport distances may suggest lower maximum flow velocity or shorter duration of flow
capable of transporting the clasts in the South Field. This is consistent with a spatially
decelerating overwash flow from north to south. Clasts are densely clustered at the
limestone knoll and disperse with increasing distance south. Opposite to the trend in the
North Field, South Field clasts are larger and heavier southward. The weight trend dif-
ference may be due to the position of the larger clasts prior to the overwash event or to the
complete burial of smaller clasts, which are unaccounted for and misrepresented in the
graphed spatial distribution. Varying topography may play a role where overwash flow
converges around the limestone knoll and is restricted just south of the knoll into Bumber
Well Pond.
Numerous breaches, a landward (southward) thinning and fining sand and shell sheet
deposit, and a high percentage of buried clasts in close proximity to the North Field
indicate that the beach and ridges shoreward of the clast fields are the source for the sand
sheet deposit (Pilarczyk and Reinhardt 2010) and suggests that overwash flow originated in
the north and flowed southward. The stratigraphic positions of clasts within and on the
surface of the sand sheet in both clast fields suggest that the cobbles, boulders, and sand
and shell sheet were deposited at the same time and sometime after an underlying marine
pond deposit. No cobbles or boulders were deposited in or extending from the former
marine pond deposit.
A tendency for thalweg perpendicular A-axis orientation preferences in both cobble and
boulder fields suggest rolling or sliding in a roughly north-to-south thalweg parallel
direction (Inman 1949; Collinson and Thompson 1982; Williams and Hall 2004). Many
clasts are not oriented to thalweg trends, but the fact that preferences are measurable in a
presumably singular overwash event is noteworthy considering some of the variables that
influence clast deposition such as irregular clast shape, uneven topography, and interfer-
ence from other boulders or sand.
Fig. 7 A-axis orientation of clasts measured in North and South Fields depicted on maps (a, b), two rosehistograms (inset in each map) and summarized in a table (c). Contours are in meters above sea level. Theclast axes are categorized by their orientation to the thalweg at each location. The blue line in the mapsrepresents the channel thalweg. The white rose histograms show the over all A-axis orientations in relationto north. The tan shading in the maps indicates limestone outcrops
c
Nat Hazards
123
South FieldNorth Field
Limestone knoll
Limestone outcrop
Limestone outcrop
7 2 2
8 1 5
8 2
2 6
7 4
4 68
11 24 64
0.35 1.10 0.44
0.40 0.85 0.32
82 151 121
31 47 32
1.50 1.55 1.53
1.44 1.56 1.56
North Field orientation to thalweg
South Field orientation to thalweg
parallel (±10°) perpendicular (±10°) other (140°)
parallel (±10°) perpendicular (±10°) other (140°)
A/B mean
Mean kg
Count/# of deg
%
Count
A/B mean
Mean kg
Count/# of deg
%
Count
0.75
0.75
0.5
0.25
0.75
0.25
0.25
1.0
0.75
0.5
0.5
0.5
-0.2
5
0.25 0
0
0.5
1.5
0.25 0.5
0
0.25
0.5
parallel (±10°)
perpendicular (±10°)
other (140°)
Orientation to thalweg
0 50m0 50m
a b
c
d
Nat Hazards
123
6.2 Tsunami versus storm
Characteristics of the cobble and boulder field deposits on Anegada resemble those of
modern tsunami deposits (Paris et al. 2009; Goff et al. 2006; Richmond et al. in press).
Both fields consist of cobbles and boulders in a single layer dispersed over hundreds of
meters and have directional trends in clast spacing and long-axis orientation. In the North
Field, hundreds of angular cobbles and boulders weighing up to 850 kg were transported
tens to possibly hundreds of meters from limestone outcrops 300 m from the shoreline. A
simultaneously deposited landward thinning and fining sand and shell sheet partially buried
well over half of the North Field clasts and extended into the South Field burying many
clasts there. Despite the fact that the South Field is more than 800 m south of the North
Field and nearly a kilometer inland from the nearest point on the north shore, the overwash
flow transported boulders up to 400 kg over 60 m.
The North and South cobble and boulder fields do not resemble modern storm or
hurricane deposits (Morton et al. 2008). The cobble and boulder fields on Anegada are not
formed into shore-parallel wedge-shaped ridges or ridge complexes. The deposits are not
densely packed or layered and are deposited further from the shoreline than typical storm
or hurricane deposits. Sandy beach ridges likely produced by large storms are common on
Anegada’s north shores and northwest of the North and South Fields (Atwater et al. 2010),
but there are no ridges or ridge-like structures composed of coarse clast material deposited
on the island. In addition, repeated flooding caused by intense storm rainfall would not
likely produce flow velocities capable of transporting boulders due to the flat to gently
sloping topography of the island. Flooding caused by rainfall does not explain the breached
beach ridges, the north- to -south flow trends in the deposits, or the high percentage of
buried clasts. If repeated flooding caused by rain storms was capable of transporting sand
and larger clasts, we would expect to see a series of thinner layers in the event deposit,
which were deposited by numerous different storm events over hundreds of years. The
overwash event sand and shell layer appears singular; numerous event layers were not
observed (Atwater et al. 2010).
It is possible that a hurricane more intense then Donna in 1960 could have a greater
impact on Anegada. If the storm surge and waves generated by an exceptional storm were
great enough to breach the 2–3 m dunes seaward of Bumber Well and flow over 1.5 km to
the South Field, a flow pattern similar to a tsunami may be developed. An overwash flow
similar to a tsunami could produce deposit morphologies similar to those usually associ-
ated with tsunamis. However, modeling results of Buckley et al. (2011) show that flow
velocities generated by an exceptional storm are not capable of transporting the largest
clasts measured in the North and South Fields, while flow velocities from a tsunami
simulation are capable of transporting all of the clasts.
7 Conclusions
Fields of cobbles and boulders and a landward thinning and fining sand sheet on Anegada,
British Virgin Islands form part of the physical evidence for overwash in a location subject
to both hurricanes and tsunamis. Characteristics of the North and South cobble and boulder
fields including morphology, directional trends in clast spacing, long-axis orientations, and
stratigraphic positions are analogous to modern tsunami deposits and very different from
those of modern storm deposits. These comparisons alone cannot irrefutably explain the
Nat Hazards
123
origin of the cobble and boulder deposits; however, they indicate the overwash was likely
produced by a tsunami and not a storm or hurricane.
Acknowledgments We would like to thank Cynthia Rolli (British Virgin Island Disaster ManagementAgency) for sharing high-resolution aerial photos of Anegada for our field work and in this manuscript.Critical reviews by Uri Ten Brink and Brian Atwater improved the manuscript. Funding was provided by the‘‘Tsunami Hazards Potential in the Caribbean’’ project of the U.S. Geological Survey and Marine GeologyProgram.
References
Atwater BF, ten Brink US, Buckley M, Halley RS, Jaffe BE, Lopez-Venagas AM, Reinhardt EG, Tuttle MP,Watt S, Wei Y (2010) Geomorphic and stratigraphic evidence for an unusual tsunami or storm a fewcenturies ago at Anegada, British Virgin Islands. Nat Hazards. doi:10.1007/s11069-010-9622-6
Buckley ML, Wei Y, Jaffe BE, Watt SG (2011) Inverse modeling of velocities and inferred cause ofoverwash that emplaced inland fields of boulders at Anegada, British Virgin Islands. Nat Hazards. doi:10.1007/s11069-011-9725-8
Collinson JD, Thompson DB (1982) Sedimentary structures. George Allen and Unwin, London. p 194Di Geronimo I, Choowong M, Phantuwongraj S (2009) Geomorphology and superficial bottom sediments of
Khao Lak coastal area (SW Thailand). Pol J Environ Stud. 18(1):111–121Dunn GE (1961) The hurricane season of 1960. Mon Weather Rev 89:99–108Etienne S, Paris R (2010) Boulder accumulations related to storms on the south coast of the Reykjanes
Peninsula (Iceland). Geomorphology 114:55–70Goff J, Dudley WC, deMaintenon MJ, Cain G, Coney JP (2006) The largest local tsunami in 20th century
Hawaii. Mar Geol 226:65–79Goto K, Chavanich SA, Imamura F, Kunthasap P, Matsui T, Minoura K, Sugawara D, Yanagisawa H (2007)
Distribution, origin, and transport process of boulders deposited by the 2004 Indian Ocean tsunami atPakarang Cape, Thailand. Sediment Geol 202:821–837
Inman DL (1949) Sorting of sediments in the light of fluid mechanics. J Sed Petrol 19:51–70Morton RA, Richmond BM, Jaffe BE, Gelfenbaum G (2008) Coarse-clast ridge complexes of the Caribbean:
a preliminary basis for distinguishing tsunami and storm-wave origins. J Sed Res 78(9):624–637O’Loughlin KF, Lander JF (2003) Caribbean tsunamis: a 500 year history from 1948–1998. Kluwer Aca-
demic, DordrechtParis R, Wassmer P, Sartohadi J, Lavigne F, Barthomeuf B, Desgages E, Grancher D, Baumert Ph, Vautier
F, Brunstein D, Ch Gomez (2009) Tsunamis as geomorphic crisis: lessons from the December 26, 2004tsunami in Lhok Nga, west Banda Aceh (Sumatra, Indonesia). Geomorphology 104(1–2):59–72
Pilarczyk JE, Reinhardt EG (2010) Homotrema rubrum (Lamark) taphonomy as an overwash indicator inmarine ponds from Anegada, British Virgin Islands. Nat Hazards. doi:10.1007/s11069-010-9706-3
Reid HF, Taber S (1920) The Virgin Islands earthquakes of 1867–1868. Bull Seismol Soc Am 10:9–20Reinhardt EG, Pilarczyk JE, Brown A (2011) Probable tsunami origin for a shell and sand sheet from marine
ponds on Anegada, British Virgin Islands. Nat Hazards. doi:10.100/s11069-011-9730-yRichmond BM, Watt SG, Buckley ML, Jaffe BE, Gelfenbaum G, Morton RA (2011) Recent storm and
tsunami coarse-clast deposit characteristics, southeast Hawai’i. Mar Geol 283(1–4):79–89Scheffers A (2005) Coastal response to extreme wave events-hurricanes and tsunami on Bonaire. Essener
Geographische Arbeiten 37:100Scoffin TP (1993) The geological effects of hurricanes on coral reefs and the interpretation of storm
deposits. Coral Reefs 12:203–221Wei Y, ten Brink US, Atwater BF (2010) Modeling of tsunamis and hurricanes as causes of the catastrophic
overwash of Anegada, British Virgin Islands, between 1650 and 1800: Abstract OS42B-03 presented at2010 fall meeting, American Geophysical Union, San Francisco,13–17 Dec 2010
Williams DM, Hall AM (2004) Cliff-top megaclast deposits of Ireland, a record of extreme waves in theNorth Atlantic—storms or tsunamis? Mar Geol 206:101–117
Zahibo N (2003) The 1867 Virgin Island Tsunami; observations and modeling. Oceanol Acta 26:609–621
Nat Hazards
123


![Englishman River Water Service · Sampling and logging of the well LOWER AQUIFER: Thickness: 26ft ; [124 to 150’] SAND, GRAVEL, COBBLES and BOULDERS Some silt and rare lumps of](https://img.pdfslide.us/doc/110x75/5f03f1167e708231d40b87ba/englishman-river-water-service-sampling-and-logging-of-the-well-lower-aquifer-thickness.jpg)