Embed Size (px)
Citation preview
Injury Risk Curves for WorldSIDInjury Risk Curves for WorldSID Considerations for Shoulder, Thorax, Abdomen, & PelvisConsiderations for Shoulder, Thorax, Abdomen, & Pelvis
November 5, 2009November 5, 2009
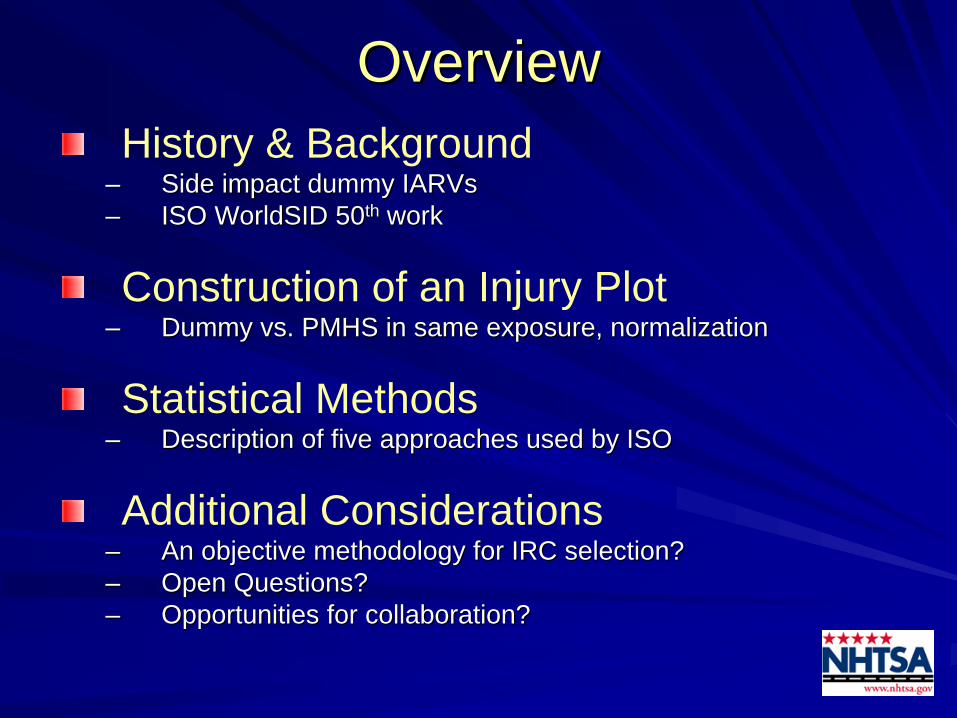
OverviewOverviewHistory & Background
–– Side impact dummy Side impact dummy IARVsIARVs–– ISO WorldSID 50ISO WorldSID 50thth workwork
Construction of an Injury Plot–– Dummy vs. PMHS in same exposure, normalizationDummy vs. PMHS in same exposure, normalization
Statistical Methods –– Description of five approaches used by ISODescription of five approaches used by ISO
Additional Considerations–– An objective methodology for IRC selection?An objective methodology for IRC selection?–– Open Questions?Open Questions?–– Opportunities for collaboration? Opportunities for collaboration?
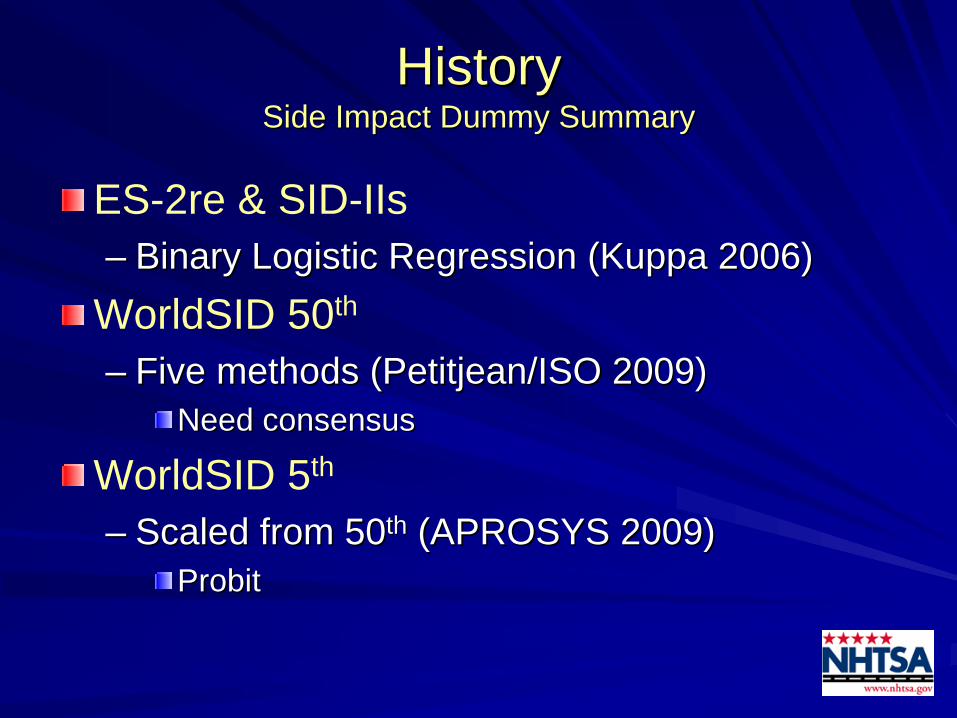
HistoryHistory Side Impact Dummy SummarySide Impact Dummy Summary
ES-2re & SID-IIs–– Binary Logistic Regression (Kuppa 2006)Binary Logistic Regression (Kuppa 2006)
WorldSID 50th
–– Five methods (Five methods (PetitjeanPetitjean/ISO 2009)/ISO 2009)Need consensusNeed consensus
WorldSID 5th
–– Scaled from 50Scaled from 50thth (APROSYS 2009)(APROSYS 2009)ProbitProbit
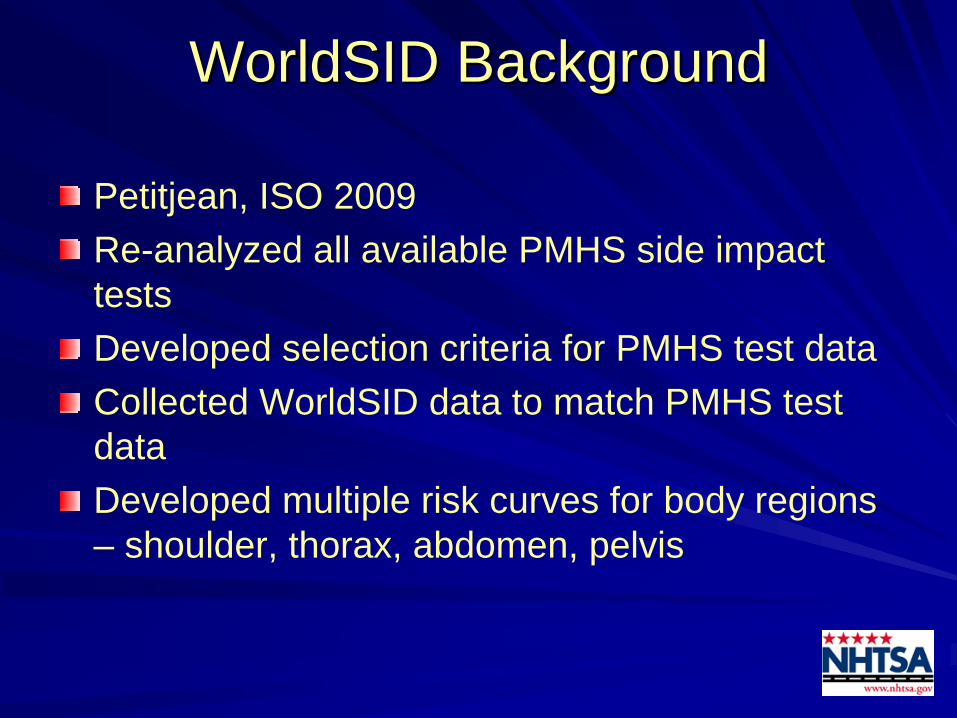
WorldSID BackgroundWorldSID Background
Petitjean, ISO 2009Re-analyzed all available PMHS side impact testsDeveloped selection criteria for PMHS test dataCollected WorldSID data to match PMHS test dataDeveloped multiple risk curves for body regions – shoulder, thorax, abdomen, pelvis
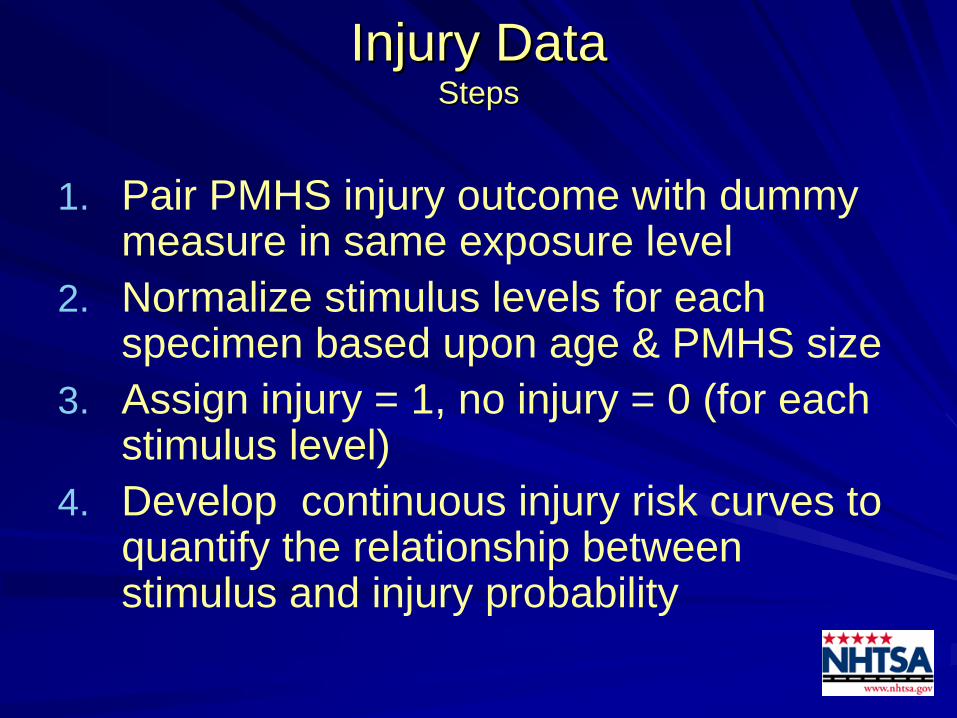
Injury DataInjury Data StepsSteps
1. Pair PMHS injury outcome with dummy measure in same exposure level
2. Normalize stimulus levels for each specimen based upon age & PMHS size
3. Assign injury = 1, no injury = 0 (for each stimulus level)
4. Develop continuous injury risk curves to quantify the relationship between stimulus and injury probability
Injury DataInjury Data ExampleExample
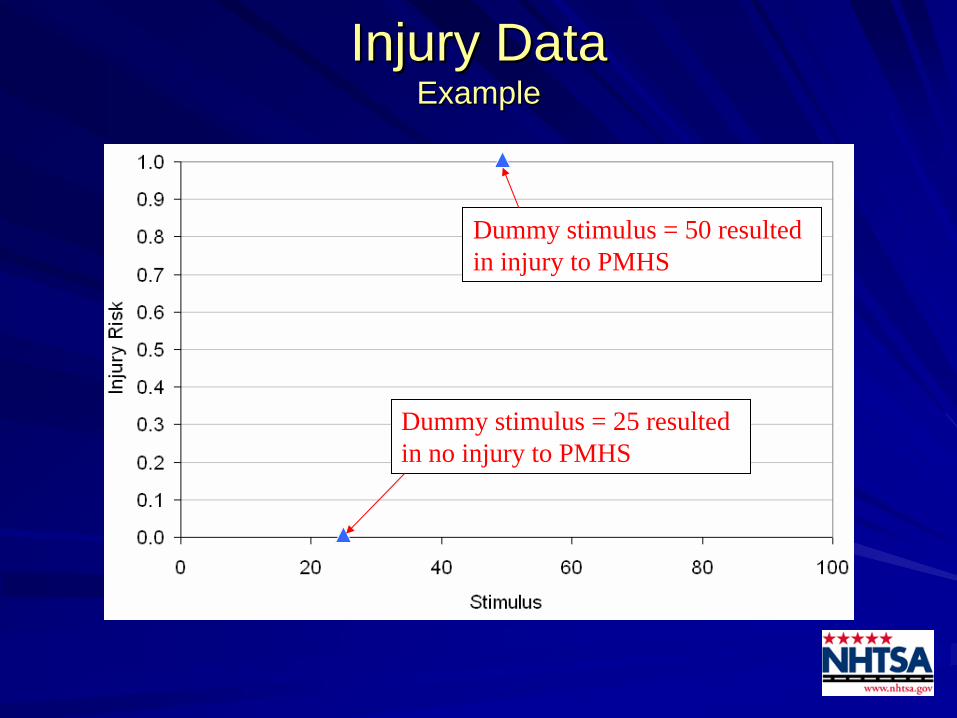
Injury DataInjury Data ExampleExample
Dummy stimulus = 25 resulted in no injury to PMHS
Dummy stimulus = 50 resulted in injury to PMHS
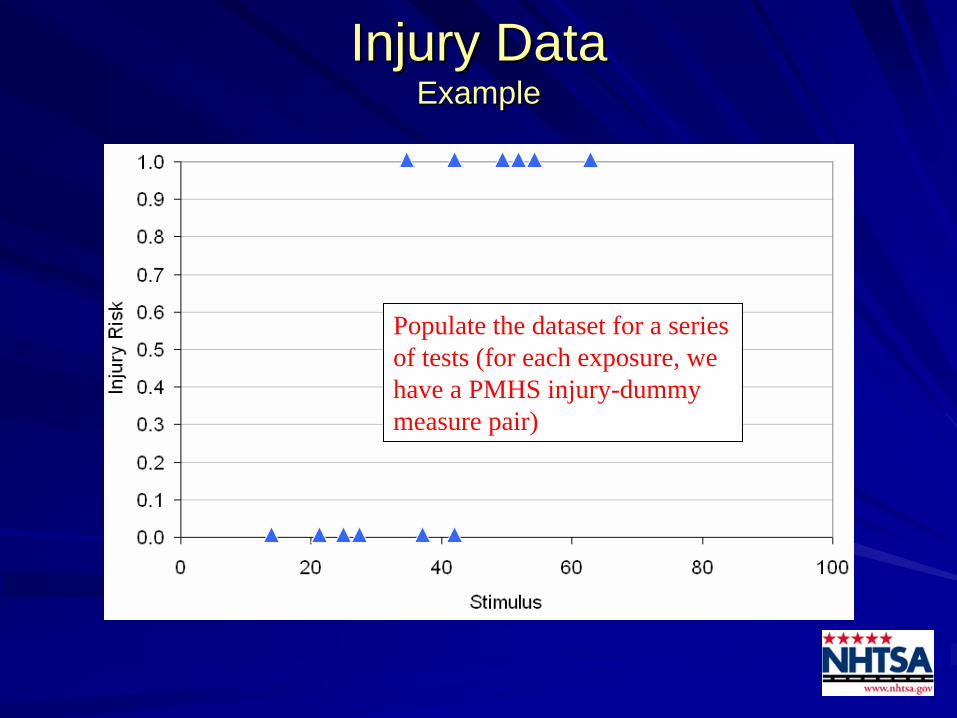
Injury DataInjury Data ExampleExample
Populate the dataset for a series of tests (for each exposure, we have a PMHS injury-dummy measure pair)
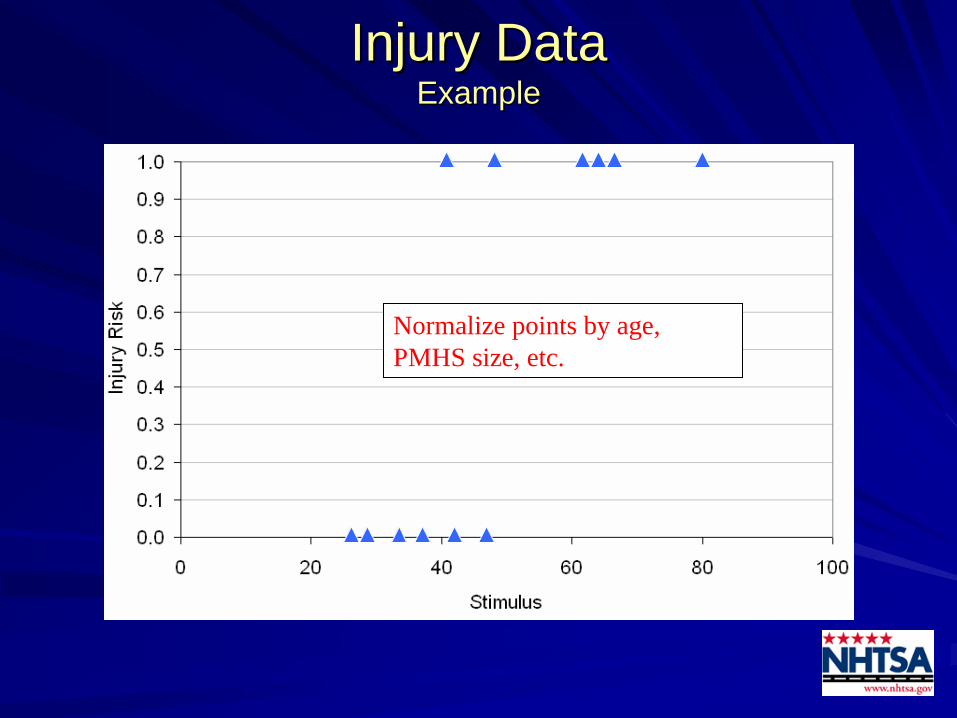
Injury DataInjury Data ExampleExample
Normalize points by age, PMHS size, etc.
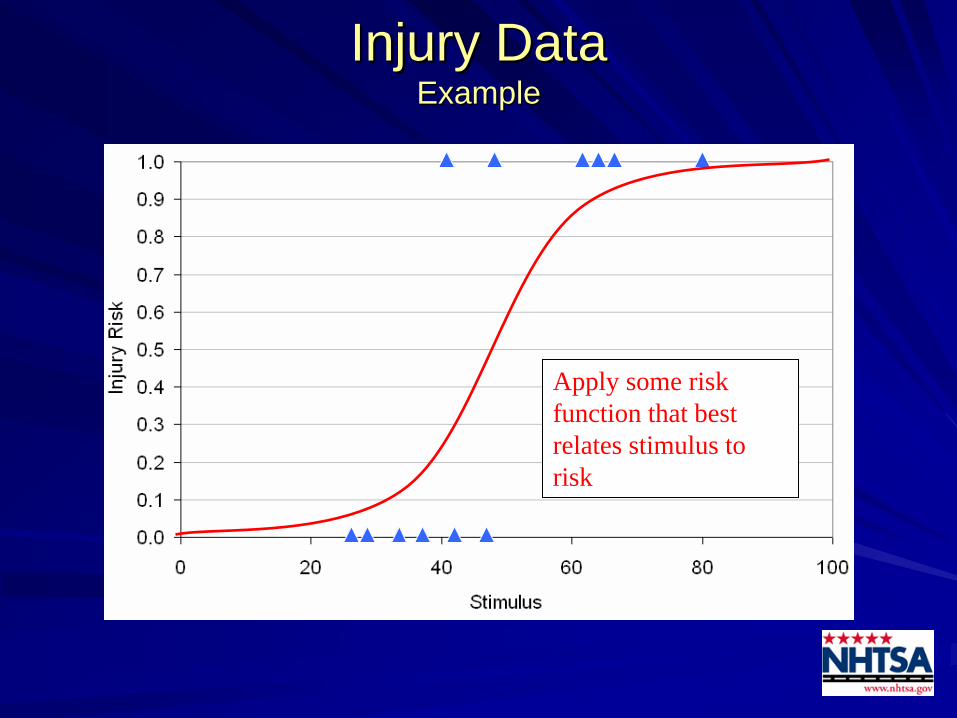
Injury DataInjury Data ExampleExample
Apply some risk function that best relates stimulus to risk
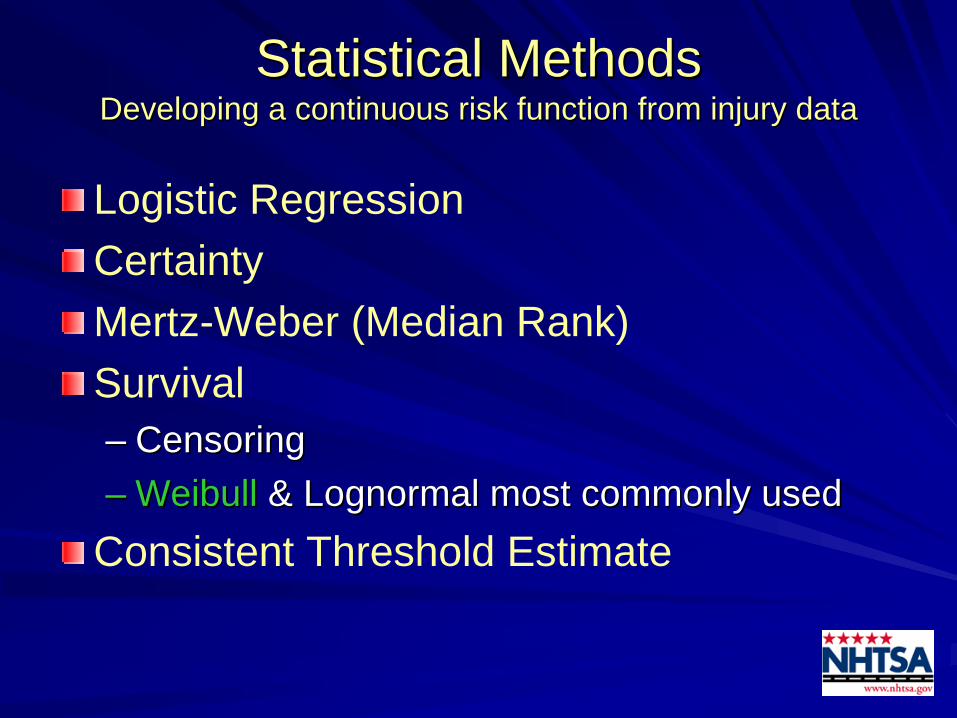
Statistical MethodsStatistical Methods Developing a continuous risk function from injury dataDeveloping a continuous risk function from injury data
Logistic RegressionCertaintyMertz-Weber (Median Rank)Survival–– CensoringCensoring–– WeibullWeibull & Lognormal most commonly used& Lognormal most commonly used
Consistent Threshold Estimate
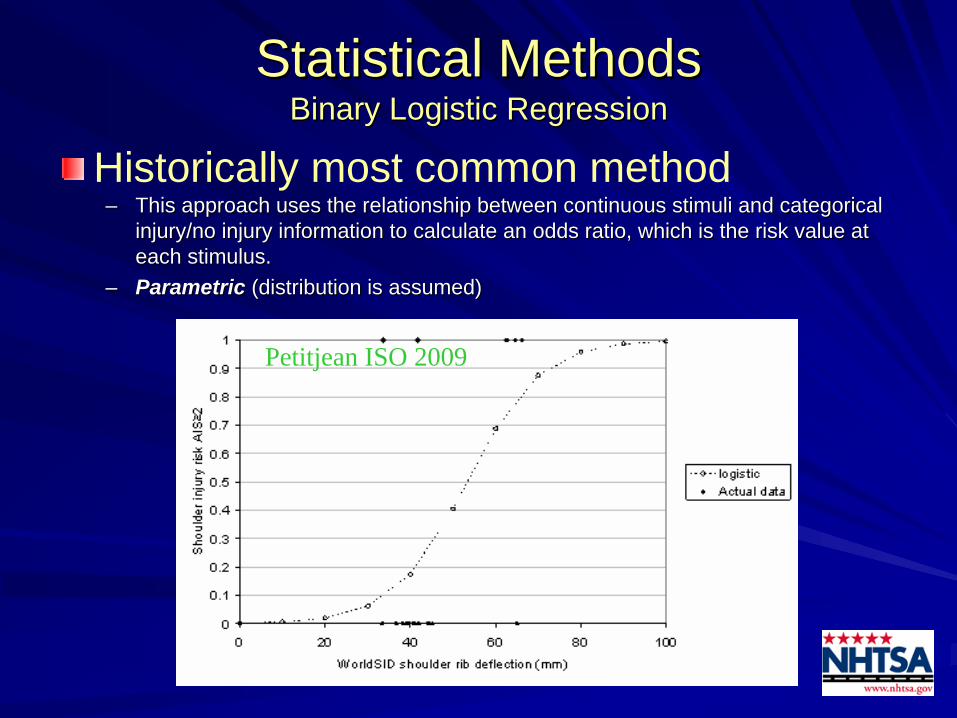
Statistical MethodsStatistical Methods Binary Logistic RegressionBinary Logistic Regression
Historically most common method–– This approach uses the relationship between continuous stimuli aThis approach uses the relationship between continuous stimuli and categorical nd categorical
injury/no injury information to calculate an odds ratio, which iinjury/no injury information to calculate an odds ratio, which is the risk value at s the risk value at each stimulus.each stimulus.
–– ParametricParametric (distribution is assumed)(distribution is assumed)
Petitjean ISO 2009
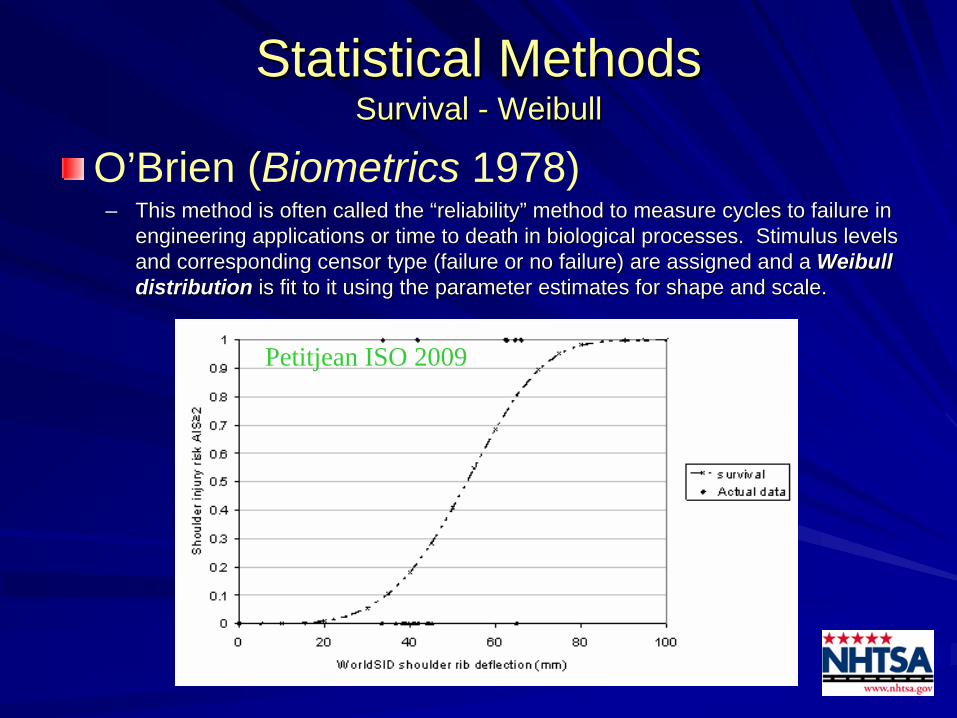
Statistical MethodsStatistical Methods Survival Survival -- WeibullWeibull
O’Brien (Biometrics 1978)–– This method is often called the This method is often called the ““reliabilityreliability”” method to measure cycles to failure in method to measure cycles to failure in
engineering applications or time to death in biological processeengineering applications or time to death in biological processes. Stimulus levels s. Stimulus levels and corresponding censor type (failure or no failure) are assignand corresponding censor type (failure or no failure) are assigned and a ed and a Weibull Weibull distributiondistribution is fit to it using the parameter estimates for shape and scale.is fit to it using the parameter estimates for shape and scale.
Petitjean ISO 2009
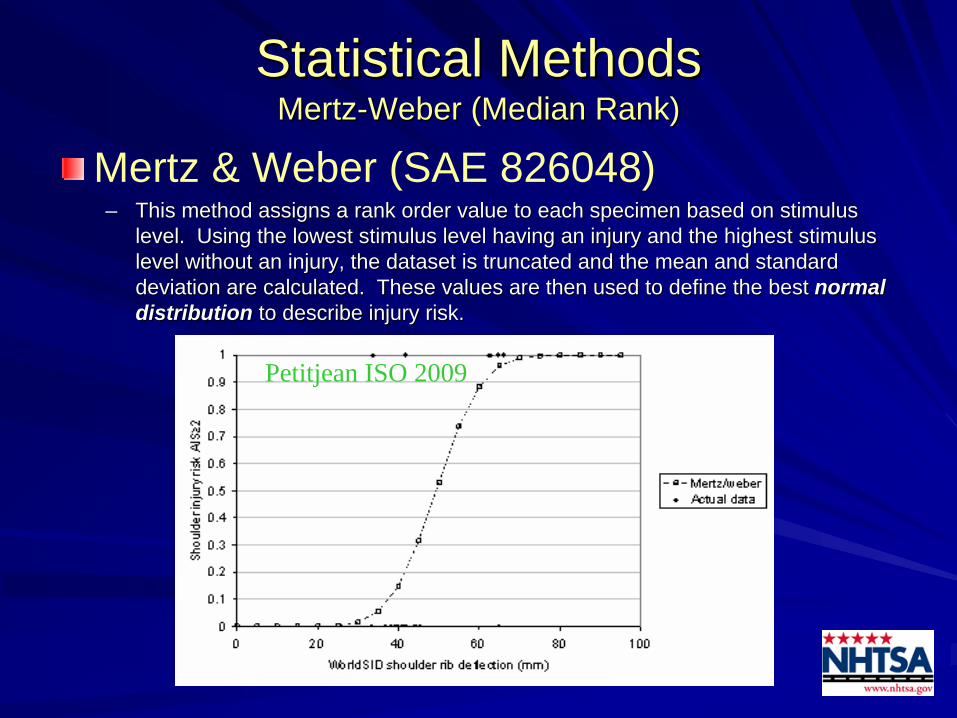
Statistical MethodsStatistical Methods MertzMertz--Weber (Median Rank)Weber (Median Rank)
Mertz & Weber (SAE 826048)–– This method assigns a rank order value to each specimen based onThis method assigns a rank order value to each specimen based on stimulus stimulus
level. Using the lowest stimulus level having an injury and thelevel. Using the lowest stimulus level having an injury and the highest stimulus highest stimulus level without an injury, the dataset is truncated and the mean alevel without an injury, the dataset is truncated and the mean and standard nd standard deviation are calculated. These values are then used to define deviation are calculated. These values are then used to define the best the best normal normal distributiondistribution to describe injury risk.to describe injury risk.
Petitjean ISO 2009
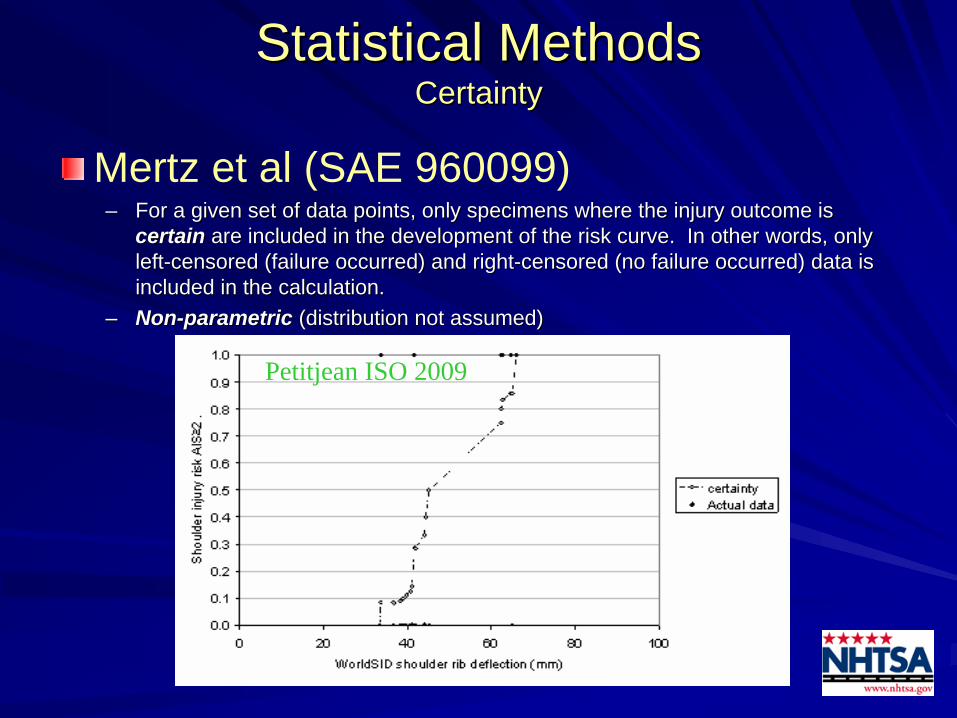
Statistical MethodsStatistical Methods CertaintyCertainty
Mertz et al (SAE 960099)–– For a given set of data points, only specimens where the injury For a given set of data points, only specimens where the injury outcome is outcome is
certaincertain are included in the development of the risk curve. In other woare included in the development of the risk curve. In other words, only rds, only leftleft--censored (failure occurred) and rightcensored (failure occurred) and right--censored (no failure occurred) data is censored (no failure occurred) data is included in the calculation. included in the calculation.
–– NonNon--parametricparametric (distribution not assumed)(distribution not assumed)
Petitjean ISO 2009
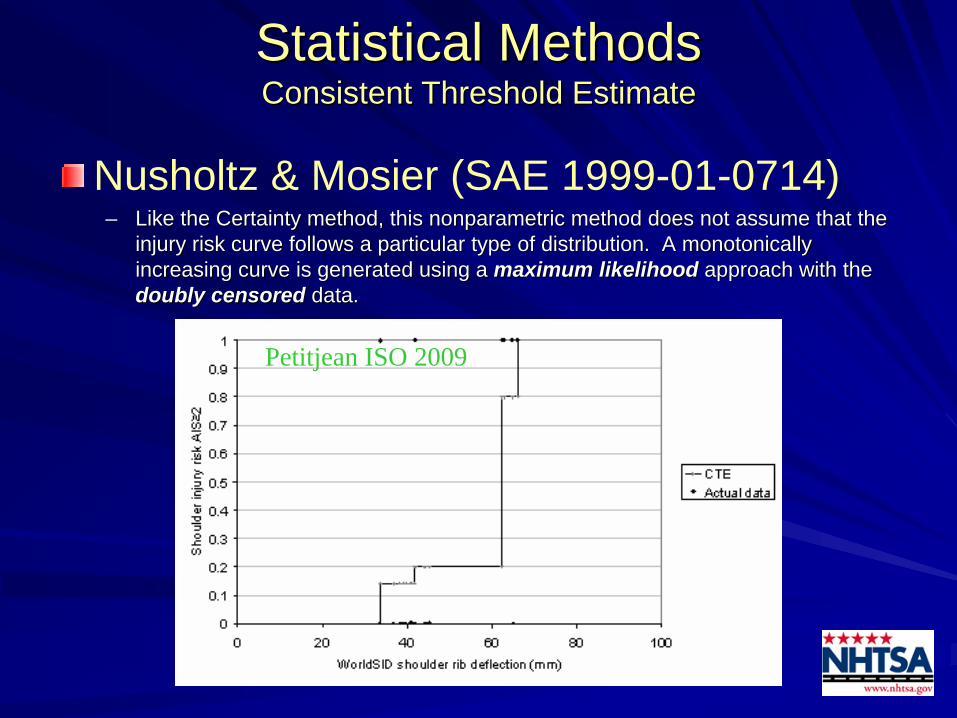
Statistical MethodsStatistical Methods Consistent Threshold EstimateConsistent Threshold Estimate
Nusholtz & Mosier (SAE 1999-01-0714)–– Like the Certainty method, this nonparametric method does not asLike the Certainty method, this nonparametric method does not assume that the sume that the
injury risk curve follows a particular type of distribution. A injury risk curve follows a particular type of distribution. A monotonically monotonically increasing curve is generated using a increasing curve is generated using a maximum likelihoodmaximum likelihood approach with the approach with the doubly censoreddoubly censored data.data.
Petitjean ISO 2009
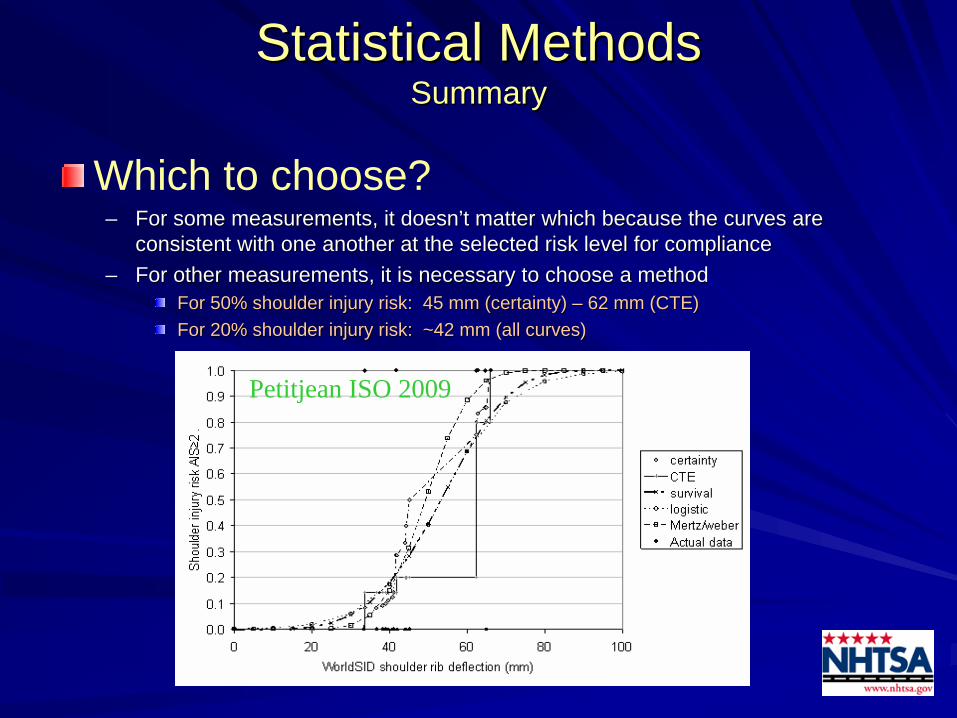
Statistical MethodsStatistical Methods SummarySummary
Which to choose?–– For some measurements, it doesnFor some measurements, it doesn’’t matter which because the curves are t matter which because the curves are
consistent with one another at the selected risk level for complconsistent with one another at the selected risk level for complianceiance–– For other measurements, it is necessary to choose a methodFor other measurements, it is necessary to choose a method
For 50% shoulder injury risk: 45 mm (certainty) For 50% shoulder injury risk: 45 mm (certainty) –– 62 mm (CTE)62 mm (CTE)For 20% shoulder injury risk: ~42 mm (all curves)For 20% shoulder injury risk: ~42 mm (all curves)
Petitjean ISO 2009
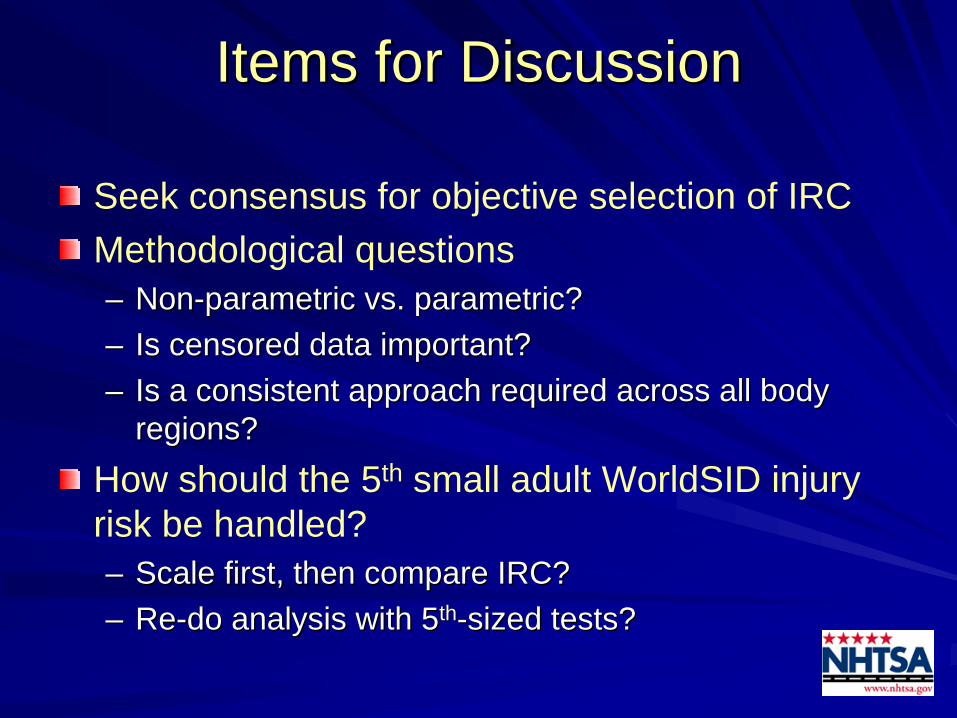
Items for Discussion Items for Discussion
Seek consensus for objective selection of IRCMethodological questions–– NonNon--parametric vs. parametric?parametric vs. parametric?–– Is censored data important?Is censored data important?–– Is a consistent approach required across all body Is a consistent approach required across all body
regions?regions?How should the 5th small adult WorldSID injury risk be handled?–– Scale first, then compare IRC?Scale first, then compare IRC?–– ReRe--do analysis with 5do analysis with 5thth--sized tests?sized tests?
Evaluation SummaryEvaluation Summary
774 - 1215
2535 - 3387
658 - 742
1.10 – 1.64
73.5 – 92.0
1.51 – 1.86
0.80 – 0.92
60.6 – 76.8
51.1 – 62.4
2303 - 2561
59.2 – 74.9
50%
707 - 1034
2334 - 2914
643 - 689
1.06 – 1.41
70.3 – 84.3
1.39 – 1.70
0.55 – 0.78
56.5 – 71.3
48.5 – 57.9
2138 - 2400
54.3 – 63.7
25%
WorldSID 50th
(adjusted to 45YO, range of all methods)
Lower Spine Acceleration AIS 3+ (m/s2)
Thorax VC AIS 4+ (m/s)
Thorax Deflection AIS 4+ (mm)
Abdomen VC AIS 3+ (m/s)
Pelvis Acceleration AIS 3+ (m/s2)
Pelvis Force AIS 3+ (N)
Abdomen Deflection AIS 3+ (mm)
Thorax VC AIS 3+ (m/s)
Thorax Deflection AIS 3+ (mm)
Shoulder Force AIS 2+ (N)
Shoulder Deflection AIS 2+ (mm)
Analytical effort needed to asses all injury risk analysis methods and select the most appropriate method for establishing injury thresholds
Analytical effort needed to asses all injury risk analysis methods and select the most appropriate method for establishing injury thresholds

Thank youThank you
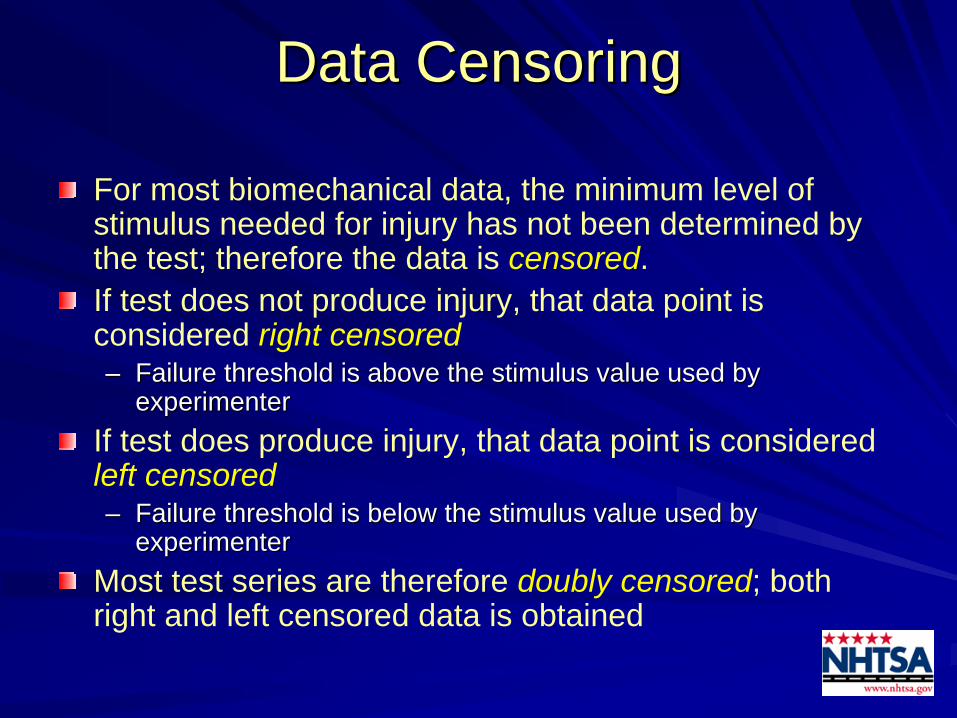
Data CensoringData Censoring
For most biomechanical data, the minimum level of stimulus needed for injury has not been determined by the test; therefore the data is censored.If test does not produce injury, that data point is considered right censored–– Failure threshold is above the stimulus value used by Failure threshold is above the stimulus value used by
experimenterexperimenterIf test does produce injury, that data point is considered left censored–– Failure threshold is below the stimulus value used by Failure threshold is below the stimulus value used by
experimenterexperimenterMost test series are therefore doubly censored; both right and left censored data is obtained
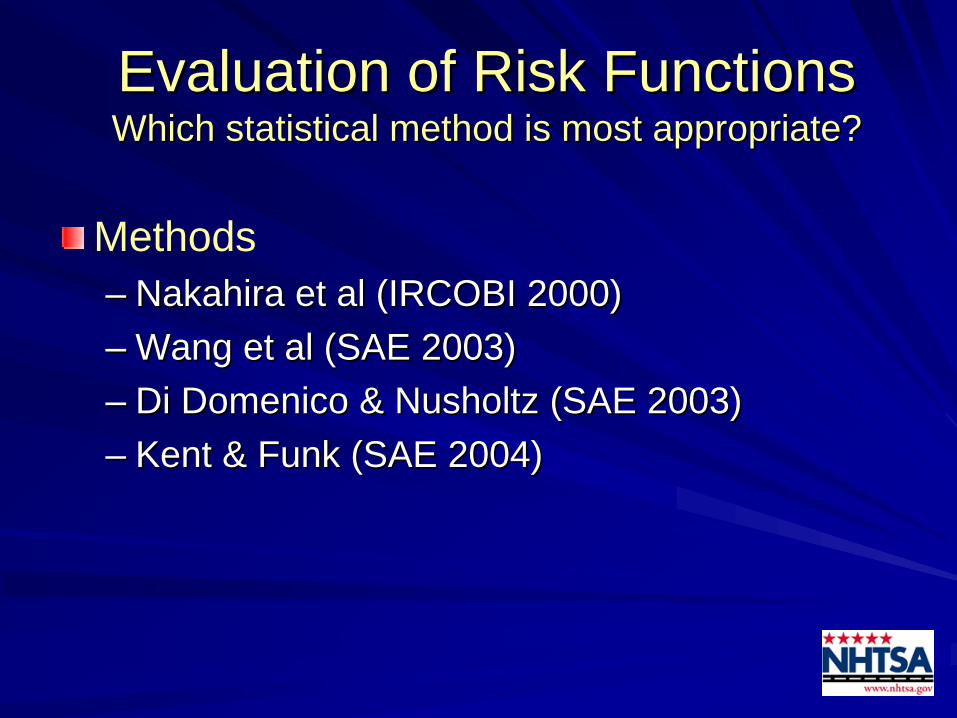
Evaluation of Risk Functions Evaluation of Risk Functions Which statistical method is most appropriate?Which statistical method is most appropriate?
Methods–– NakahiraNakahira et al (IRCOBI 2000)et al (IRCOBI 2000)–– Wang et al (SAE 2003)Wang et al (SAE 2003)–– Di Di DomenicoDomenico & Nusholtz (SAE 2003)& Nusholtz (SAE 2003)–– Kent & Funk (SAE 2004)Kent & Funk (SAE 2004)