Embed Size (px)
Citation preview

Changes in N-acetyltransferase 8 in kidney tubular cell
Injury, recovery and mesenchymal stem/stromal cell treatment
Patrícia Canotilho dos Santos Grácio
Thesis to obtain the Master of Science Degree in
Biomedical Engineering
Supervisors
Professor Sofia de Azeredo Gaspar Pereira
Professor Cláudia Alexandra Martins Lobato da Silva
Examination Committee
Chairperson: Professor José Paulo Sequeira Farinha
Supervisor: Professor Sofia de Azeredo Gaspar Pereira
Members of the Committee: Professor Joana Paiva Gomes Miranda
October 2017

ii

iii
This project was funded by iNOVA4Health - UID/Multi/04462/2013, a program financially supported by
Fundação para a Ciência e Tecnologia / Ministério da Educação e Ciência, through national funds and
co-funded by FEDER under the PT2020 Partnership Agreement.

iv

v
Acknowledgments
To begin with, I have to express my deepest gratitude to Professor Sofia de Azeredo Pereira. First, for
trusting me with this project and for believing that I could go through with it all. Also, for her scientific
guidance, support and, nowhere near less important, for her positive incentive. Her unwavering and
dedicated supervision were instrumental to all that I learned and to all the obstacles I overcame.
To Professor Cláudia Lobato Silva, to whom I am grateful for accepting me under her supervision. But,
I am most thankful for the enthusiasm, support, and reassurance that she showed me throughout the
entire project.
To Professor Emília Monteiro. The Translational Pharmacology group, which I was fortunate to join for
this project, is a result of her hard work. Moreover, she never failed to be welcoming and to show genuine
interest in my work. I truly appreciate it.
Also, I must express my utmost gratitude to Professor Jacinta Serpa. For accepting my intrusion into
her laboratory and, more importantly, for the time and attention. Her help and guidance, whether in
analysing results or in the planning of the next steps were invaluable. She ultimately became a mentor
in this project, and for that, I am in her debt.
I am also so very thankful to Clara Dias. From day one her help and support were tireless. I thank her
for all the scientific and technical skills she taught me, all the planning, explaining, and patience. But, it
was her guidance in my most overwhelming moments that I will never forget.
As well as, to Filipa Coelho, I am so grateful for all her help on the bench, all the techniques she walked
me through all the results she helped analyse and experiments she helped to plan. But much more
importantly, for her ever positive attitude that I sincerely admire and for all the hand-holding.
To Catarina Sequeira the HPLC-whisperer who was kind and patient with me in so many occasions.
Working with her is a lesson in good practice and I thank all her help and relentless effort.
To Armanda Rodrigues and Sofia Nunes, I thank all their help and the time they dedicated teaching me
and also, for the coffee-break-philosophy!
To Ana Rita Pedro I thank for the companionship and the positive spirit that always lightened up the
workload. And to Nuno Coelho I thank for his patience, even on surgery days. And for the reminder that
scientific research will always be better with a chocolate croissant.
Finally, it is to my friends and family that I owe the greatest debt. No words would ever be enough.

vi

vii
Resumo
A doença renal é um grave problema de saúde global, frequentemente consequência de lesões agudas
(hemorragia, septicémia, toxicidade) mas também lesões prolongadas, que pode culminar em fibrose.
Em resposta à lesão, as células tubulares renais (CTR) poderão desdiferenciar, proliferar e re-epitelizar.
Contudo, de momento, a resposta clínica é ineficiente não existindo fármacos capazes de reverter a
progressão da doença renal.
A N-acetiltransferase-8 (NAT8) é uma enzima particularmente expressa no rim e descrita como
renoprotetora, motivando a presente investigação à sua expressão na desdiferenciação/re-epitelização.
O potencial terapêutico das células estaminais mesenquimais (CEMs) no tratamento da doença renal
foi escolhido como ferramenta para averiguar, numa abordagem in vitro, a relevância da NAT8 no
processo de regeneração das CTRs.
Foi analisado o potencial terapêutico do meio condicionado (MC) de CEMs e a possível ligação à
expressão de NAT8. CTRs foram expostas a transforming growth factor-β1 (TGF-β1, estímulo lesivo)
promovendo desdiferenciação e suspensão de TGF-β1 induziu re-epitelização.
Os resultados sugerem uma redução da expressão de NAT8 em resposta a lesão prolongada. Durante
a re-epitelização, inicialmente foi verificada uma redução na NAT8 recuperada no final do ensaio.
Quando administrado após remoção do TGF-β1, o MC-CEM promoveu a re-epitelização de modo
aparentemente independente da NAT8. Contudo, sob lesão continua, o efeito protetor de MC-CEM
coincidiu com marcada recuperação da expressão de NAT8.
Tanto quanto foi possível apurar esta foi a primeira observação do efeito parácrino das CEMs na
expressão de NAT8, em CTR, e da possível importância desta para a manutenção da capacidade
regenerativa na desdiferenciação.
Palavras-chave: Células mesenquimais estaminais (CEM); lesão renal; N-acetil-transferase tipo 8
(NAT8), túbulo renal proximal

viii
ix
Abstract
Kidney disease is a worldwide health concern and a common consequence of acute insults (as
hemorrhage, sepsis, drug toxicity) with unpredictable prognosis and lacking therapeutic options.
Prolonged injury promotes progression to fibrosis and currently, there are no drugs to reverse kidney
disease progression. However, renal tubular epithelial cells (TECs) might dedifferentiate, proliferate and
re-epithelize upon injury.
N-acetyltransferase-8 (NAT8) is an enzyme highly expressed in the kidney and suggested to be
renoprotective. This work assessed the expression of NAT8 throughout dedifferentiation and re-
epithelization. As mesenchymal stem/stromal cells (MSCs)-based therapies have had positive
outcomes, herein these were used as a tool to investigate NAT8’s relevance for tubular repair.
Hence, in an in vitro experimental setup the therapeutic potential of MSCs conditioned media (CM) and
a possible link to NAT8 were investigated. TECs were exposed to transforming growth factor-β1 (TGF-
β1, injury stimulus) promoting dedifferentiation and TGF-β1 withdrawal induced re-epithelization.
Results showed that prolonged injury was associated with a decrease in NAT8. The re-epithelization
was biphasic with a decrease of NAT8 followed by a late rescue. When MSC-CM was used in the
absence of a harmful stimulus it promoted re-epithelization, which was not related to an increase in
NAT8 transcription. Contrastingly, MSC-CM addition under continued TGF-β1 exposure was associated
with marked recovery of NAT8 transcription.
To the best of our knowledge, this is the first report of the paracrine effects of human MSCs on NAT8 in
the kidney and of the relevance of NAT8 to maintain regenerative potential when TECs undergo
dedifferentiation.
Key words: Mesenchymal stem/stromal cell (MSC); N-acetyltransferase 8 (NAT8); Renal injury; Renal
tubular epithelial cell;

x

xi
Table of Figures
Figure 1 Schematic representation of the nephron detailing tubular organization and examples of
different epithelia [12] .............................................................................................................................. 2
Figure 2 (a) Transforming growth factor - β1 (TGF-β1) binds to cellular receptors leading to Smad2/3
phosphorylation. These interact with Smad4 and this complex enters the nucleus. Leading to
transcriptional changes mediating epithelial to mesenchymal transition (EMT); (b) Hepatocyte growth
factor (HGF) interaction with cellular receptors promotes expression of SnoN. A co-repressor that blocks
Smad. Thus mediating suppression of TGF-β1 effects in renal tubular epithelial cells. Adapted from Liu
(2004) [47] ............................................................................................................................................... 8
Figure 3 Xenobiotic detoxification through mercapturic acid pathway (MAP); Xenobiotic
compounds interact with glutathione (1). GSH-conjugates are excreted from cells (2) and transformed
into cysteine-S-conjugates (C-X) by γ-glutamyltranspeptidase (3)) and aminodipeptidase (4). These are
then re-uptaken (5) and further metabolised by NAT8 (6) forming mercapturic acid (NAC-X) or by β-
lyase (7) forming a reactive thiol; X – xenobiotic; GSH – glutathione; GST – glutathione-S-transferase;
GS-X – glutathione conjugates; CG-X – cysteine-glycine-conjugate; C-X cysteine-S-conjugates; γGT –
γ-glutamyltranspeptidase; S-X –reactive thiol; Adapted from Ramsay et Dilda (2014) [111] ............... 17
Figure 4 Working hypothesis: MSCs show anti-fibrotic potential and are capable to promote renal
repair [59]. A connection between (NAT8) and tubular injury has been suggested [114], [119], prompting
the question of whether the action of MSCs might be linked to NAT8. This is the working hypothesis
driving this work. .................................................................................................................................... 21
Figure 5 Experimental design schematics. HK-2 cells will be exposed to TGF-β1 (10 ng/mL) for a
period of time of up to 144 h to induce dedifferentiation. TGF-β1 arrest (upon 48 h or 72h stimulation) is
expected to induce re-epithelization. To assess the phenotype throughout the assay cytokeratin (CK)
and e-cadherin will be evaluated as epithelial markers and vimentin (VM) as a mesenchymal marker.
MSC-CM will be administered in combination to either TGF-β1 arrest or continuous exposure. ......... 22
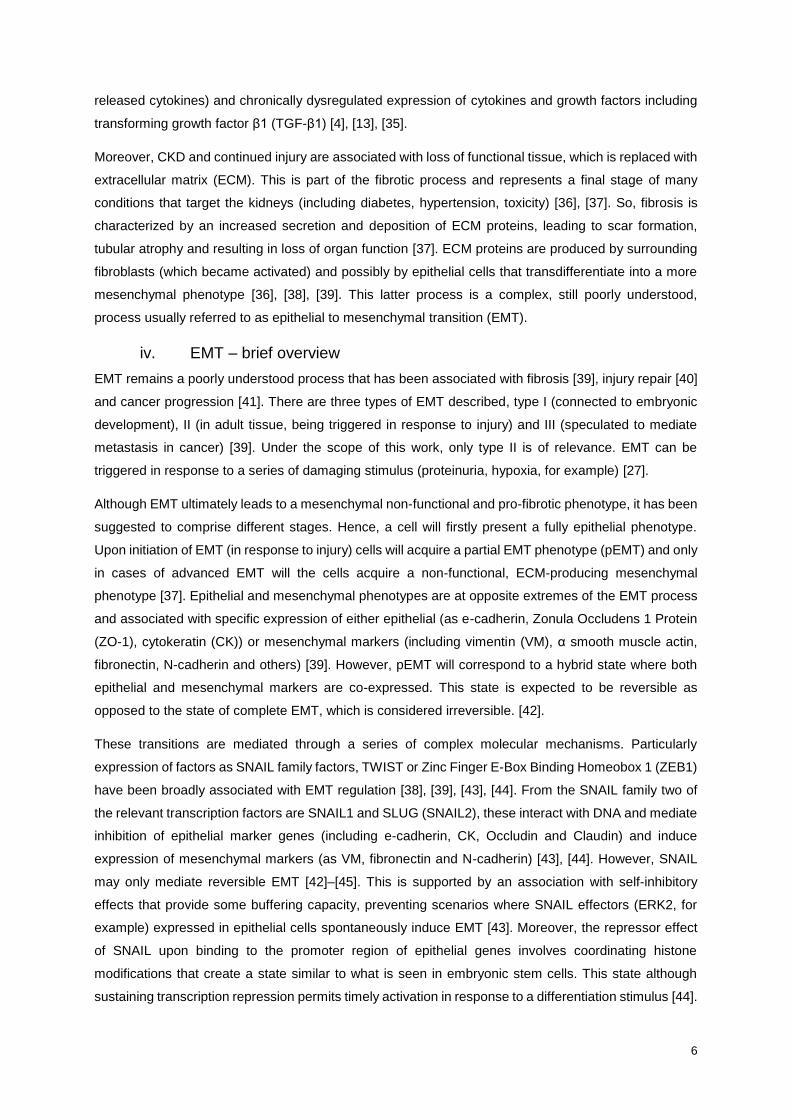
Figure 6 Dedifferentiation assay: schematic overview of experimental conditions; CTRL – control;
DMEM/F-12 Dulbecco's Modified Eagle Medium/Nutrient Mixture F-12; FBS – Fetal bovine serum; TGF-
β1 – Transforming growth factor β1; ..................................................................................................... 23
Figure 7 Re-epithelization assay: schematic overview of experimental conditions; CTRL – control;
DMEM/F-12 Dulbecco's Modified Eagle Medium/Nutrient Mixture F-12; TGF-β1 – Transforming growth
factor β1; ................................................................................................................................................ 24
Figure 8 Mesenchymal stem cell conditioned media treatment (MSC-CM) assay: schematic
overview of experimental conditions; CTRL – control; DMEM/F-12 Dulbecco's Modified Eagle
Medium/Nutrient Mixture F-12; TGF-β1 – Transforming growth factor β1; ........................................... 25
Figure 9 Dedifferentiation assay: Changes in cytokeratin (CK) and vimentin (VM) expression
under TGF-β1 exposure. HK-2 cells were exposed to TGF-β1 (10 ng/mL) in media supplemented with
either 1 or 10% of FBS. CK and VM expression was assessed by flow cytometry. CK+VM-, CK-VM+
and, CK+VM+ populations were quantified as percentage of cell count. Data are expressed as mean ±
SEM relative to control group. Statistical analysis of data was performed using one-way ANOVA test

xii
with Dunnett’s post-test (* p<0.05, ** p<0.01, *** p<0.001, against 24h timepoint) (n=3-6) (vs. 24 h
timepoint). FBS – Fetal Bovine Serum; TGF-β1 – Transforming growth factor β1; .............................. 29
Figure 10 Dedifferentiation assay: cytokeratin (CK) and vimentin (VM) expression under TGF-β1
exposure. HK-2 cells were exposed to TGF-β1 (10 ng/mL) in media supplemented with 10% of FBS.
Expression of CK and VM was assessed by flow cytometry. CK+VM-, CK-VM+ and, CK+VM+
populations were quantified as percentage of cell count. Data are expressed as mean ± SEM and
relative to control group (not exposed to TGF-β1). Statistical analysis of data was performed using one-
way ANOVA test with Dunnett’s post-test (* p<0.05, ** p<0.01, *** p<0.001, against 24h timepoint) (n =
5-11) FBS – Fetal Bovine Serum; TGF-β1 - transforming growth factor β1. ........................................ 31
Figure 11 Dedifferentiation assay: hE-cadherin transcript under TGF-β1 exposure. HK-2 cells
were exposed to TGF-β1 (10 ng/mL) in media supplemented with 10% of FBS. hE-cadherin transcript
levels were quantified by RT-PCR (relative to endogenous reference HPRT). Data are expressed as
mean ± SEM relative to control group. Statistical analysis of data was performed using one-way ANOVA
test with Dunnett’s post-test (*** p< 0.001, vs. 24 h time-point) (n=4-8).TGF-β1 - transforming growth
factor β1. ................................................................................................................................................ 32
Figure 12 Dedifferentiation assay: bright field microscopy imaging of HK-2 cells exposed to TGF-
β1. HK-2 cells were exposed to TGF-β1 (10 ng/mL) in media supplemented with 10% FBS. Cell
morphology was registered at 24 h intervals by bright field microscopy (magnification x 400). TGF-β1 -
transforming growth factor β1. ............................................................................................................... 33
Figure 13 Dedifferentiation assay: NAT8 transcript levels under TGF-β1 exposure. HK-2 cells were
exposed to TGF-β1 (10 ng/mL) in media supplemented with 10% of FBS. NAT8 transcript levels were
quantified by RT-PCR (relative to endogenous reference HPRT). Data are expressed as mean ± SEM
relative to control group. Statistical analysis of data was performed using one-way ANOVA test with
Dunnett’s post-test (* p<0.05 vs. 24 h time-point) (n= 3-6) TGF-β1 - transforming growth factor β1. .. 34
Figure 14 Dedifferentiation assay: quantification of NAT8 expression under TGF-β1 exposure
(from immunofluorescence imaging data). HK-2 cells were exposed to TGF-β1 (10 ng/mL) in media
supplemented with 10% of FBS. Images resulting from NAT8’s immunolabelling were analysed and
fluorescence quantified using image analysis software (ImageJ, SciJava). Data are expressed as mean
± SEM relative to control group. Statistical analysis of data was performed using one-way ANOVA test
with Dunnett’s post-test (** p<0.01 vs. 48 h time-point) (n=2) TGF-β1 - transforming growth factor β1.
............................................................................................................................................................... 35
Figure 15 Re-epithelization assay: bright field microscopy imaging of HK-2 cells following 48 h
(third row) or 72 h (bottom) long exposure to TGF-β1. HK-2 cells were first exposed to TGF-β1 for
48 h (third row) or 72 h (bottom) and then cultured for 72 h or 96 h in either TGF-β1 free-media or
continuously exposed to TGF-β1 (second row). During that period cell morphology was registered by
bright field microscopy (magnification x 400). ....................................................................................... 39
Figure 16 Re-epithelization assay: quantification of NAT8 expression under TGF-β1 exposure
(from immunofluorescence imaging data). HK-2 cells were first exposed to TGF-β1 (10 ng/mL) for 48 h
and then cultured for 96h in either TGF-β1 free-media (orange line, n=2-3) or continuously exposed to
TGF-β1 (black line). Images resulting from immunolabelling of NAT8 were analysed and fluorescence

xiii
quantified using image analysis software (ImageJ, SciJava). Data are expressed as mean ± SEM
relative to control group. Statistical analysis of data was performed using one-way ANOVA test with
Dunnett’s post-test (*** p<0.001 vs. 48 h time-point). TGF-β1 - transforming growth factor β1; .......... 42
Figure 17 MSC-CM treatment assay: bright field microscopy imaging of HK-2 cells following 72
h long exposure to TGF-β1. HK-2 cells were first exposed to TGF-β1 for 72 h and then cultured for 72
h in either TGF-β1 free-media (third column), TGF-β1 free media supplemented with MSC-CM (30%)
(fourth column) or continuously exposed to TGF-β1 (last column). Cell morphology was registered by
bright field microscopy (magnification x 400). TGF-β1 – Transforming growth factor β1; .................... 45
Figure 18 Dedifferentiation – Profile of NAT8 progression in association along with described
phenotypes. The dotted line represents a possible path for a smaller population of cells. Initially, some
cells may retain NAT8 expression without ever experiencing a decrease in its levels. Also, upon mild
injury it is possible that not all cells are capable to recover NAT8 expression. More fragile cells may
directly proceed towards a degenerative pathway. ............................................................................... 48
Figure 19 Dedifferentiation assay: Changes in cytokeratin (CK) and vimentin (VM) expression
under TGF-β1 exposure. HK-2 cells were exposed to TGF-β1 (10 ng/mL) in media supplemented with
either 1% FBS (top) or 10% of FBS (bottom). CK and VM expression was assessed by flow cytometry.
CK+VM-, CK-VM+ and, CK+VM+ populations were quantified as percentage of cell count. Data are
expressed as mean ± SEM. Statistical analysis of data was performed using two-way ANOVA test with
Bonferroni’s post-test (** p<0.01, *** p<0.001, TGF-β1 vs. CTRL). FBS- Fetal bovine serum; TGF-β1 –
Transforming growth factor β1; ............................................................................................................. 66
Panel a Intratubular regeneration models. Dedifferentiation scenario (left) – terminally
differentiated TECs are responsible for regenerating the tubule. Upon injury TECs have the ability to
dedifferentiate (EMT), acquiring markers as CD24, CD133 and vimentin (VM)). Then, dedifferentiated
cells proliferate and differentiate (MET) in order to replenishing functional tissue. Stem/progenitor cell
scenario (right) – an endogenous population of stem cells (intrinsically present in the tubule), which
express markers as CD24, CD133 mediates repair. These cells have an increased survival capacity
and, upon injury will divide and differentiate mediating tubular regeneration. MET – mesenchymal to
epithelial transition. (Adapted from Li e Wingert (2013) [11]); ________________________________ 9
Panel b Dedifferentiation assay: indirect immunofluorescence imaging of HK-2 cells exposed to
TGF-β1. HK-2 cells were exposed to TGF-β1 (10 ng/mL) in media supplemented with 10% FBS. NAT8
immunostaining (in green) and fluorescence microscopy imaging acquisition (magnification x 600) are
presented. Images are representative of two biological duplicates (in blue: nuclear staining, DAPI).
Control condition with omission of primary antibody showed no staining. TGF-β1 - transforming growth
factor β1. _______________________________________________________________________ 35
Panel c Re-epithelization assay: cytokeratin (CK) and vimentin (VM) expression following
exposure to TGF-β1. (A) HK-2 cells were first exposed to TGF-β1 for 48 h and then either cultured for
96 h in either TGF-β1 free-media (orange line, n= 2-3) or continuously exposed to TGF-β1 (black line).
(B) HK-2 cells were first exposed to TGF-β1 for 72 h and then cultured for 72 h in either TGF-β1 free-

xiv
media (green line, n= 4-5) or continuously exposed to TGF-β1 (black line). Expression of CK and VM
was assessed by flow cytometry. CK+VM-, CK-VM+ and, CK+VM+ populations were quantified as
percentage of cell count. Data are expressed as mean ± SEM and relative to control group (not exposed
to TGF-β1). Statistical analysis of data was performed using two-way ANOVA with Bonferroni’s post-
test (* p<0.05, ** p<0.01, *** p<0.001, vs. TGF-β1) TGF-β1 – Transforming growth factor-β1 _____ 37
Panel d Re-epithelization assay: hE-cadherin transcript levels. (TOP) HK-2 cells were first exposed
to TGF-β1 (10 ng/mL) for 48 h and then cultured for 96h in either TGF-β1 free-media (orange line, n=
2-3) or continuously exposed to TGF-β1 (black line). (BOTTOM) HK-2 cells were first exposed to TGF-
β1 for 72 h and then cultured for 72 h in either TGF-β1 free-media (green line, n = 4-6) or continuously
exposed to TGF-β1 (TGF-β1, black line). hE-cadherin transcript levels were quantified by RT-PCR
(relative to endogenous reference HPRT). Data are expressed as mean ± SEM and relative to control
group. Statistical analysis of data was performed using two-way ANOVA test with Bonferroni’s post-test
(* p< 0.05, ** p<0.01, *** p<0.001, vs. TGF-β1) (TGF-β1 – Transforming growth factor – β1) ______ 38
Panel e Re-epithelization assay: NAT8 transcript levels. (Left) HK-2 cells were first exposed to TGF-
β1 (10 ng/mL) for 48 h and then cultured for 96 h in either TGF-β1 free-media (orange line, n= 2-3) or
continuously exposed to TGF-β1 (black line) (Right) HK-2 cells were first exposed to TGF-β1 for 72 h
and then cultured for 72 h in either TGF-β1 free-media (green line, n= 4-6) or continuously exposed to
TGF-β1 (TGF-β1, black line). NAT8 transcript levels were quantified by RT-PCR (relative to endogenous
reference HPRT). Data are expressed as mean ± SEM and relative to control group. Statistical analysis
of data was performed using two-way ANOVA test with Bonferroni’s post-test (* p< 0.05, ** p<0.01, ***
p<0.001, vs. TGF-β1) (TGF-β1 – Transforming growth factor – β1) __________________________ 40
Panel f Re-epithelization assay: NAT8 indirect immunofluorescence imaging of HK-2 cells. HK-2
cells were first exposed to TGF-β1 (10 ng/mL) for 48 h and then cultured for 96 h in either TGF-β1 free-
media or continuously exposed to TGF-β1. NAT8 immunostaining (in green) and fluorescence
microscopy imaging acquisition (magnification x 600) are presented. Images are representative of two
biological duplicates (in blue: nuclear staining, DAPI). Control condition with omission of primary
antibody showed no staining. TGF-β1 - transforming growth factor β1. _______________________ 41
Panel g MSC-CM treatment assay: cytokeratin (CK) and vimentin (VM) expression following
exposure to TGF-β1. HK-2 cells were first exposed to TGF-β1 for 72 h and then cultured for 72 h in
either TGF-β1 free-media (green line), TGF-β1 free media supplemented with MSC-CM (30%) (dark
blue line, n=2-3) or continuously exposed to TGF-β1 (black line). During that period CK and VM
expression was assessed (flow cytometry. Data are expressed as mean ± SEM and relative to control
group mean. Statistical analysis of data was performed using two-way ANOVA test with Bonferroni’s
post-test (* p< 0.05, ** p<0.01, *** p<0.001, vs. TGF-β1 and ## p<0.01 vs. TGF-β1 (72 h) + CTRL (72
h)) TGF-β1 – Transforming growth factor – β1. _________________________________________ 43
Panel h MSC-CM treatment assay: cytokeratin (CK) and vimentin (VM) expression following
exposure to TGF-β1 and co-exposure to MSC-CM (30%). HK-2 cells were first exposed to TGF-β1
for 72 h and then cultured for 72 h in either media supplemented with both TGF-β1 (10 ng/mL) and
MSC-CM (30%) (light blue line) or continuously exposed to TGF-β1 (black line). During that period CK
and VM expression was assessed (flow cytometry). Data are expressed as mean ± SEM and relative to

xv
control group mean. Statistical analysis of data was performed using a two-way ANOVA test with
Bonferroni post-test (* p<0.05, ** p<0.01, *** p<0.001 vs. TGF-β1)(n=2-3) (TGF-β1 – Transforming
growth factor – β1). _______________________________________________________________ 43
Panel i MSC-CM treatment assay: hE-cadherin transcript levels. (TOP)HK-2 cells were first exposed
to TGF-β1 (10 ng/mL) for 72 h and then cultured for 72 h in either TGF-β1 free-media (green line), TGF-
β1 free media supplemented with MSC-CM (30%) (dark blue line) or continuously exposed to TGF-β1
(black line) (n=2-3). (BOTTOM) HK-2 cells were first exposed to TGF-β1 for 72 h and then cultured for
another 72 h in either media supplemented with both TGF-β1 (10 ng/mL) and MSC-CM (30%) (light blue
line) or continuously exposed to TGF-β1 (TGF-β1, black line) (n=2-3)). hE-cadherin transcript level was
quantified by RT-PCR (relative to endogenous reference HPRT). Data are expressed as mean ± SEM
and relative to control group. Statistical analysis of data was performed using a two-way ANOVA test
with Bonferroni’s post-test (** p<0.01, *** p<0.001, vs. TGF-β1 and # p<0.05, ### p<0.001, vs, TGF-β1
(72 h) + CTRL (72 h) TGF-β1 – Transforming growth factor – β1. ___________________________ 44
Panel j MSC-CM treatment assay: NAT8 transcript levels. (left) HK-2 cells were first exposed to
TGF-β1 (10 ng/mL) for 72 h and then cultured for 72 h in either TGF-β1 free-media (green line), TGF-
β1 free media supplemented with MSC-CM (30%) (dark blue line, n= 2-3) or continuously exposed to
TGF-β1 (black line). (right) HK-2 cells were first exposed to TGF-β1 for 72 h and then cultured for
another 72 h in either TGF-β1 free-media (green line), or media supplemented with both TGF-β1 (10
ng/mL) and MSC-CM (30%) (light blue line) n= 2-3) or continuously exposed to TGF-β1 (TGF-β1, black
line). NAT8 transcript level was quantified by RT-PCR (relative to endogenous reference HPRT). Data
are expressed as mean ± SEM and relative to control group. Statistical analysis of data was performed
using two-way ANOVA test with Bonferroni’s post-test (** p<0.01, *** p<0.001, vs. TGF-β1 and # p<0.05,
### p<0.001, vs. TGF-β1 (72 h) + CTRL (72 h)). TGF-β1 – Transforming growth factor – β1. _____ 46

xvi

xvii
Abbreviations
adMSC – Adipose Tissue derived Mesenchymal Stem/Stromal Cell
AKI – Acute Kidney Injury
ANOVA – Analysis of Variance
APC – Allophycocyanin
APIR – Associação Portuguesa de Insuficientes Renais
BACE1 – β-site amyloid precursor protein-cleaving enzyme 1
bmMSC – Bone Marrow derived Mesenchymal Stem/Stromal Cell
BSA – Bovine Serum Albumin
cDNA – Complementary Deoxyribonucleic Acid
CK – Cytokeratin
CKD – Chronic Kidney Disease
CM – Conditioned Media
DAPI – 4',6-diamidino-2-phenylindole
DMEM – Dulbecco's Modified Eagle’s Medium
dNTPs – Deoxynucleotides
DNA – Deoxyribonucleic Acid
DTT – Dithiothreitol
ECM – Extracellular Matrix
EDTA – Ethylenediaminetetraacetic Acid
ER – Endoplasmic Reticulum
ESRD – End-stage Renal Disease
FBS – Fetal Bovine Serum
FOXA1 – Forkhead Box Containing Transcription Factor (Subclass A) 1
GFR – Glomerular Filtration Rate
γGT - γ-glutamyltranspeptidase
GSH – Glutathione

xviii
HGF – Hepatocyte Growth Factor
HK-2 – Human Kidney (cortex/proximal tubule) immortalized cell line
HRPT – Hypoxanthine phosphoribosyltransferase
IGF – Insulin-like Growth Factor
IGFBP7 – Insulin-Like Growth Factor Binding Protein 7
KDIGO - Kidney Disease: Improving Global Outcomes
KDOQI – National Kidney Foundation Kidney Disease Outcome Quality Initiative
MAP – Mercapturic Acid Pathway
MET – Mesenchymal to Epithelial Transition
miRNA – micro Ribonucleic Acid
mRNA – messenger Ribonucleic Acid
MSC – Mesenchymal Stem/Stromal Cell
NAC – N-acetylcysteine
NAT8 – N-acetyltransferase 8
PBS – Phosphate Buffered Saline
PE – phycoerythrin
pEMT – Partial Epithelial To Mesenchymal Phenotype
PFA – Paraformaldehyde
PTEC – Proximal Tubular Epithelial Cell
RNA – Ribonucleic Acid
ROS – Reactive Oxygen Species
RT – Room Temperature
RT-PCR – Reverse Transcription Polymerase Chain Reaction
sCr – Serum Creatinine
SNP – Single Nucleotide Polymorphism
TEC – Tubular Epithelial Cell
TGF-β1 – Transforming Growth Factor β1
TIMP-2 – Tissue Inhibitor of Metalloproteinase 2

xix
UPR – Unfolded Protein Response
VEGF – Vascular Endothelial Growth Factor
VM – Vimentin
ZEB1 – Zinc Finger E-Box Binding Homeobox 1
ZO-1 – Zonula Occludens 1 Protein

xx

1
1. Literature Review
a. Kidney Disease - definition and pathophysiology
i. Implications for overall health
Kidney disease is a worldwide health concern [1]. Acute insults are common in hospital settings as a
result of hemorrhage, sepsis or drug toxicity [2] with unpredictable prognosis and lacking therapeutic
options [3]–[5]. Chronic injury associated with diabetes, aging or hypertension, all growing concerns in
the modern society [6], [7] promotes progression to fibrosis. Current solutions are ineffective and further
understanding of kidney disease pathophysiology that may lead to alternative therapies is of
fundamental interest [4], [8].
The decline in renal function has a widespread effect. In fact, chronic kidney disease (CKD) has been
described as a model of premature aging [9]. Renal dysfunction can, for instance, disturb the
cardiovascular and immune system and it is associated with bone disorders. Such a profound impact is
tied to the pivotal role that kidneys play in homeostasis. Despite their reduced dimension, weighting only
around 150 g each, the kidneys receive over 20% of total cardiac output [10]. Each kidney is composed
by over 1 million nephrons (represented in Figure 1), which are functional units formed by the
glomerulus (an agglomerate of blood capillaries) encased by a capsule (Bowman’s capsule) and a
tubular system. The filtration occurs at the glomeruli and the filtrate then flows onto the proximal tubule,
which is the first of the different segments that compose the tubular structure of the nephron. Each of
these segments has a different role in urine production (reabsorbing and/or secreting various
substance). The urine then leaves the tubule and enters the duct portion of the nephron, where it is
carried into a collecting system that will eliminate urine to the exterior. As an intricate sequence of
reabsorption, secretion and excretion is required for appropriate urine formation, the characteristics of
the contributing cellular populations vary greatly. For that, the nephron comprehends more than a dozen
different epithelial cell types (expressing different membrane transporters, morphology and carrying out
different physiologic functions) [11]. Including podocytes (in Bowman’s capsule), proximal tubule
epithelial cells (PTECs, that from the proximal tubule) and juxtaglomerular cells (located in close vicinity
to the glomerulus and the producers of renin) [10].

2
Figure 1 Schematic representation of the nephron detailing tubular organization and examples of different epithelia [12]
Kidneys carry out a series of biological functions other than the excretory function (that is, clearing the
body of metabolites, by-products of metabolism, xenobiotics, and others) such as regulating electrolyte
imbalance, synthesizing glucose (by performing gluconeogenesis at a rate close to that of the liver),
vitamin D activation and phosphatemia regulation [10]. Phosphatemia and vitamin D availability are key
factors in bone and calcium metabolism. As so, CKD is linked to bone mineral disorders (osteomalacia)
and vascular arterial calcification [10]. By controlling H+ and bicarbonate ion levels, kidneys also play a
role in regulating acid-base imbalance. Dysregulation of which can result in acidosis (when the body’s
pH drops below physiological level) that can impact enzyme activity and therefore overall metabolic
activity. Severe acidosis and excessive potassium retention can be lethal, and are the most serious
threats during AKI episodes [10]. Additionally, the kidneys produce and secrete erythropoietin, which
stimulates red blood cell production. Hence, defective kidney function can also lead to anaemia [10].
Moreover, the kidney regulates blood pressure. Kidneys control circulating blood volume (by adjusting
sodium and water excretion/reuptake) and produce renin. Both increased blood volume and renin
production rise arterial pressure therefore a scenario of renal damage contributes to hypertension.
Which is in fact both cause and consequence of CKD, and the two are often intertwined, propagating a
vicious cycle [10].

3
b. Kidney disease – acute kidney injury (AKI) and chronic kidney
disease (CKD)
Depending on whether the functional impairment is progressive and cumulative or if a loss of kidney
function is rapid and severe, the diseases of the kidney are classified either as chronic (CKD) or acute
(AKI), respectively. These two categories encompass a series of more specific diseases and conditions
afflicting the different structures within the kidney including the associated vasculature and the urinary
tract [10].
i. Acute kidney injury (AKI) – definition and characterization
According to the guidelines of Kidney Disease: Improving Global Outcomes (KDIGO) (2012) [3], AKI is
diagnosed when either of the following conditions is met: increase in serum creatinine (sCr) by ≥ 0.3
mg/dL within 48h or to ≥ 1.5 times baseline (which must have been established in the previous 7 days)
or urine output falls below 0.5 mL/kg/h for 6 hours. More thorough diagnosis involves severity staging
and the identification of the etiology of renal failure. In spite of the clinical benefit provided be these
guidelines to the field allowing the standardization of recommended course of treatment, AKI remains a
serious issue in the global health scenario. AKI is associated with high costs, morbidity and mortality,
impacting 13.3 million patients and leading to 1.7 million deaths a year [13], [14], with no effective
treatment available.
ii. Chronic Kidney Disease (CKD) – definition and characterization
CKD represents a public health problem with rising incidence, costs and significant impact in the lives
of those afflicted, with no cure available. The National Kidney Foundation Kidney Disease Outcome
Quality Initiative (KDOQI) group [15] [16] created guidelines to clearly define CKD and to classify stages
of progression. Accordingly, CKD is defined as abnormalities of kidney structure or function, present for
>3 months, with implications for health. These implications can range in severity and nature. CKD is
associated with a series of symptoms (fatigue, anaemia, and anorexia among others) and increased
risk of many other diseases.[7], [10], [16] Notably, CKD remains today a heavy burden for the society,
with global prevalence estimated to be between 11 to 13% [17]. Also, the most prevalent stage is stage
3 (out of 5 possible stages). CKD has even been “promoted” from subspecialty to global health burden
condition [18]. The rise in CKD within the developed countries, can be particularly traced back to
population aging and a global epidemic of diabetes type 2 [8].
Progressive CKD may lead to a state of end-stage renal disease (ESRD) requiring replacement therapy
which comprises treatments as haemodialysis, haemodiafiltration, peritoneal haemodialysis, or kidney
transplant [7], [8]. According to the Associação Portuguesa de Insuficientes Renais (APIR), Portugal is
one of the countries with highest incidence and prevalence of ESRD requiring replacement therapy. In
2016, 2,406 patients began replacement therapy, a total of 12,258 patients required haemodialysis (a
1.6% increase comparing to 2015) and 2,800 awaited transplant [19]. The replacement therapy
negatively impacts both patients and caregivers by interfering and restricting daily life. Examples include
the imposition of long hours of dialysis and, for those who receive a kidney transplant, the risks of

4
surgery-associated adverse events and of lifelong immunosuppressive therapy. Moreover, replacement
therapy is comparatively expensive. In Portugal it implies that 5% of the State budget adjudicated to
health (400 million euros in a year) is used in the treatment of 0.02% of the population [19].
iii. Risk factors, injury stimulus and mechanisms
Given its central role in metabolism, the kidney is a susceptible target organ for several diseases and
disruptions. Some general risk factors regarding kidney disease include race, age (GFR decreases
naturally with age) and obesity [20]. However, hypertension and diabetes are risk factors for both AKI
and CKD, taking the lead when CKD is concerned [21], [22]. In high income countries AKI is most often
associated with cardiac and postoperative complications and exposure to nephrotoxic agents [2] (with
the highest intra-hospital mortality associated to sepsis, myocardial infarction, pneumonia and
mechanical ventilation) [23][24]. Whereas, in countries with low incomes, dehydration, infection and
pregnancy related complications are important drivers of AKI [2]
Renal damage can be triggered by a number of factors that mediate injury. For one, conditions as
hypertension and atherosclerosis lead to disruption of physiological blood flow and ultimately to
mechanical injury to endothelium. This can result in endothelial activation, one of the initial steps of renal
damage. Also, an infectious or inflammatory stimulus targeting directly the glomerulus (or indirectly via
accumulation of precipitated antigen-antibody complexes) may trigger glomerulonephritis. Additionally,
hyperlipidaemia, diabetes, obesity and smoking have also been connected to renal injury [8], [10].
Genetic conditions and polymorphisms might also influence renal disease. Many genetic determinants
of GFR and CKD have been identified and many others are expected to contribute and have yet to be
discovered [25]. Genetic factors are particularly relevant in tubular injury. In fact, TECs have an active
role in urine formation (reabsorption, secretion) and in xenobiotic kinetics and thus rely heavily on
enzyme activity and membrane transporter expression [10].
Also, proteinuria (excess of protein in filtrate) is suggested to lead to renal damage. It is hypothesized
that proteinuria might lead to tubule obstruction, may implicate increased reabsorption thus exhausting
lysosomal activity to the point of lysosomal rupture. As well as, the exposure of TECs to protein-bound
substances (for example growth-factors, complement components) that may be harmful for the tubular
cells [10], [26].
Another nefarious stimulus is hypoxia which has been showed to induce fibrosis and apoptosis [27]. The
kidney is extremely sensitive to changes in oxygen pressure (under healthy condition this sensitivity is
necessary to regulate erythropoietin release) [10], [28]. Several conditions can create a hypoxic
environment including a structural damage to blood vessels, atherosclerosis, loss of capillary bed and
ischaemic injury [28].
The kidney also has a relevant and active part in drug metabolism. As a matter of fact, approximately
20% of AKI cases in the developed world are caused by drug induced injuries [14]. Drug metabolism
often culminates in the generation of toxic metabolites, exposing the kidney to increased toxicity [29].

5
Although, different stimulus induce particular response mechanisms and pathological processes, shared
features and unifying factors can be drawn across renal injury independently from initiating cause [4],
[13], [27]. For one, cellular and tissue damage trigger the inflammatory process [13], [27] and so,
activation and recruitment of inflammatory cells (as leukocytes and macrophages) and the release of
cytokines, growth factors and other inflammatory agents (pro-inflammatory chemokines or interleukins)
[13]. Additionally, cell damage may also lead to loss of features including, brush border and membrane
transporters, preventing cells from performing their normal function [30], [31]. This may promote initiation
of apoptotic pathways, resulting in cell death and accumulation of cell debris and protein aggregates
that further obstructs tubules and capillaries. Both cellular dysfunction and cell death lead to loss of renal
function. Hence, endothelial and epithelial damage promote the inflammation process and
tubule/capillary obstruction, further disturbing blood flow to the injury area. This promotes further
endothelial and epithelial activation, hypoxia and oxidative stress. In AKI, this vicious cycle is
exacerbated leading to symptom escalation [4], [13]. Also, damage to endothelial and epithelial cells
promotes accumulation of misfolded proteins in the endoplasmic reticulum (ER), inducing ER stress and
an adaptive response termed the unfolded protein response (UPR) [13]. Which consists in decreasing
protein translation, increasing ER folding capacity and ER-associated protein degradation in an attempt
to restore cellular homeostasis. However, a severe or prolonged injury might result in apoptosis and
intense ER stress has been implicated in the induction of renal fibrosis [32]. In addition, UPR can activate
autophagy, a process in which organelles and cytoplasmic structures are degraded [13]. Autophagy is,
in fact, an adaptive process intended to restore homeostasis and known to protect the kidney from injury
[33]. ER stress can also induce mitochondrial dysfunction, to which PTEC are particularly sensitive (as
these rely heavily on aerobic respiration and are not capable to efficiently compensate through glycolysis
[13], [34]). Ultimately, the ER stress, mitochondrial dysfunction, endothelial activation, injury-induced
epithelial apoptosis and necrosis promote the inflammatory process and mediate injury to the tubule [4],
[13].
The referred adaptive mechanisms (including UPR, inflammation and autophagy) intend to restore
homeostasis and, in a favourable scenario, mediate the repair processes, remove overly damaged cells
and are accompanied by a dwindling of the inflammatory process. This will allow endogenous repair
mechanisms to mediate kidney cell and tissue recovery resulting in the gradual recovery of renal function
[4]. However, when the injury is too extensive or prolonged it leads to a maladaptive response
associated with cell and tissue dysfunction and often progressing to CKD [13].
In fact, AKI and CKD have been suggested as being interconnected conditions [35], each a risk factor
for the other. Many pathological mechanisms mediate this interaction, first the shared connection with
cardiovascular diseases as a comorbidity and risk factor [35]. Also, dysregulated adaptive responses
(maladaptive repair) and disordered regeneration following AKI might induce renal dysfunction and
potentiate CKD [35]. And, some pathologic processes continue beyond AKI resolution as endothelial
injury, tubulointerstitial damage, inflammation and dysregulated apoptosis. These processes are
sustained by epigenetic changes, immune cells that infiltrate the kidney during AKI (recruited by
6
released cytokines) and chronically dysregulated expression of cytokines and growth factors including
transforming growth factor β1 (TGF-β1) [4], [13], [35].
Moreover, CKD and continued injury are associated with loss of functional tissue, which is replaced with
extracellular matrix (ECM). This is part of the fibrotic process and represents a final stage of many
conditions that target the kidneys (including diabetes, hypertension, toxicity) [36], [37]. So, fibrosis is
characterized by an increased secretion and deposition of ECM proteins, leading to scar formation,
tubular atrophy and resulting in loss of organ function [37]. ECM proteins are produced by surrounding
fibroblasts (which became activated) and possibly by epithelial cells that transdifferentiate into a more
mesenchymal phenotype [36], [38], [39]. This latter process is a complex, still poorly understood,
process usually referred to as epithelial to mesenchymal transition (EMT).
iv. EMT – brief overview
EMT remains a poorly understood process that has been associated with fibrosis [39], injury repair [40]
and cancer progression [41]. There are three types of EMT described, type I (connected to embryonic
development), II (in adult tissue, being triggered in response to injury) and III (speculated to mediate
metastasis in cancer) [39]. Under the scope of this work, only type II is of relevance. EMT can be
triggered in response to a series of damaging stimulus (proteinuria, hypoxia, for example) [27].
Although EMT ultimately leads to a mesenchymal non-functional and pro-fibrotic phenotype, it has been
suggested to comprise different stages. Hence, a cell will firstly present a fully epithelial phenotype.
Upon initiation of EMT (in response to injury) cells will acquire a partial EMT phenotype (pEMT) and only
in cases of advanced EMT will the cells acquire a non-functional, ECM-producing mesenchymal
phenotype [37]. Epithelial and mesenchymal phenotypes are at opposite extremes of the EMT process
and associated with specific expression of either epithelial (as e-cadherin, Zonula Occludens 1 Protein
(ZO-1), cytokeratin (CK)) or mesenchymal markers (including vimentin (VM), α smooth muscle actin,
fibronectin, N-cadherin and others) [39]. However, pEMT will correspond to a hybrid state where both
epithelial and mesenchymal markers are co-expressed. This state is expected to be reversible as
opposed to the state of complete EMT, which is considered irreversible. [42].
These transitions are mediated through a series of complex molecular mechanisms. Particularly
expression of factors as SNAIL family factors, TWIST or Zinc Finger E-Box Binding Homeobox 1 (ZEB1)
have been broadly associated with EMT regulation [38], [39], [43], [44]. From the SNAIL family two of
the relevant transcription factors are SNAIL1 and SLUG (SNAIL2), these interact with DNA and mediate
inhibition of epithelial marker genes (including e-cadherin, CK, Occludin and Claudin) and induce
expression of mesenchymal markers (as VM, fibronectin and N-cadherin) [43], [44]. However, SNAIL
may only mediate reversible EMT [42]–[45]. This is supported by an association with self-inhibitory
effects that provide some buffering capacity, preventing scenarios where SNAIL effectors (ERK2, for
example) expressed in epithelial cells spontaneously induce EMT [43]. Moreover, the repressor effect
of SNAIL upon binding to the promoter region of epithelial genes involves coordinating histone
modifications that create a state similar to what is seen in embryonic stem cells. This state although
sustaining transcription repression permits timely activation in response to a differentiation stimulus [44].

7
Another aspect, that ties SNAIL family induced EMT to a pEMT state is the fact that SLUG shows lower
affinity for some target promoters and leads to a less complete EMT [43]. Moreover, it has been
suggested that SLUG (and possibly SNAIL) can have different roles depending on EMT stage. In pEMT,
SLUG may actually have a pro-survival anti-apoptotic role and might not repress e-cadherin. [45]. In
fact, SNAIL family is presumed to support cell survival [43], [45]. Summing up, this evidence supports
that SNAIL, as a mediator of partial EMT, would act as a reversible switch [42], since it is required for
induction of EMT but not maintenance of the mesenchymal phenotype [43].
Alternatively, SNAIL increases the synthesis of ZEB1 and ZEB2 [43], [44]. ZEB1 has been associated
with a more pronounced inhibition of e-cadherin expression and other epithelial genes [42]. In turn, ZEB1
strongly induces expression of mesenchymal genes including VM and N-cadherin [42], [46] and it has
been associated with the irreversible mesenchymal phenotype [42]. Hence, whereas SNAIL family is
associate with the reversible switch between epithelial and pEMT, ZEB1 would mediate the irreversible
switch from pEMT to a fully mesenchymal phenotype [42].
Expression of SNAIL and SLUG is induced by hepatocyte growth factor (HGF) [44] and both SNAIL
family and ZEB1 are induced by TGF-β1 stimulation [42], [46]. Interestingly, the balance between these
two growth factors has been suggested to be determinant for the repair/fibrosis outcome.
Both HGF and TGF-β1 are induced following tissue injury [47].These might initiate EMT response in an
early attempt to promote repair but a dysregulation of TGF-β1 expression, leading to a continued TGF-
β1 activity, ultimately promotes fibrosis. Conversely, HGF is associated with inhibition of apoptosis,
suppression of ECM overproduction, attenuated epithelial activation and promotion of kidney cell
proliferation and differentiation [47]. These pro-repair effects may be connected to the ability of HGF to
suppress TGF-β1 influence [47].
One of the pathways underlying EMT induction by TGF-β1 is mediated by Smad phosphorylation. In
particular, TGF-β1 binds to serine-threonine kinase receptors at the cell surface and Smad 2/3 become
phosphorylated, as a downstream effect [47]. This will induce association to Smad4 and translocation
to the nucleus, where changes at transcriptional level are induced (Figure 2 (a)). In TECs, HGF induces
expression of SnoN, a Smad transcriptional co-repressor found downregulated in the fibrotic kidney
(Figure 2 (b)). And, HGF expression leads to repression of TGF-β1 action in TECs is mediated through
SnoN [47], [48].

8
Figure 2 (a) Transforming growth factor - β1 (TGF-β1) binds to cellular receptors leading to Smad2/3 phosphorylation. These interact with Smad4 and this complex enters the nucleus. Leading to transcriptional changes mediating epithelial to mesenchymal transition (EMT); (b) Hepatocyte growth factor (HGF) interaction with cellular receptors promotes expression of SnoN. A co-repressor that blocks Smad. Thus mediating suppression of TGF-β1 effects in renal tubular epithelial cells. Adapted from Liu (2004) [47]
In moderate injury, both TGF-β1 and HGF will be up-regulated but, HGF signalling will prevail and allow
tissue repair and regeneration [47]. In this context, the TGF-β1 role may be linked to ECM remodelling
and suppressing HGF after recovery. However, if the injury is too severe or in the context of chronic
injury, TGF-β1 will progressively increase, thus suppressing and eventually overcoming the effect of
HGF. From this point, TGF-β1 pro-fibrotic influence will prevail [47].
In general, SNAIL and HGF might be linked to a pEMT state, with tissue repairing capacity that could
correspond to the pro-regenerative phenotype acquired by TECs upon injury-induced dedifferentiation
(see section 1.c.i) [49]. Whereas, ZEB1 and dysregulated TGF-β1 will induce the irreversible
mesenchymal phenotype representing the deleterious side of EMT and ultimately leading to fibrosis
[42]–[45], [47], [48].
However, fibrosis is an end-of-the-line response. Initially, a healthy kidney will retain some healing
capacity and will be able to recover from moderate damage (see section 1.c) [11], [50]. With the final
outcome depending on the balance between injury persistence, fibrosis progression, inflammation
resolution and healing capacity [4], [35], [37].
c. Tubular repair mechanisms
Albeit not fully explained, the link between AKI and CKD is undeniable and it is most likely related to
ineffective cellular repair [35]. Thus, the understanding of endogenous repair mechanisms is extremely
relevant in order to secure future therapies that may consolidate appropriate regeneration and prevent
progression or exacerbation of renal damage [8], [13].

9
TECs show endogenous regenerative capacity. However, the mechanism underlying the tubular repair
and the full determinants of a healing vs. fibrotic outcome remains unclear. Nowadays, there are mostly
two contending theories for renal tubular regeneration process, the “dedifferentiation” (Panel a, left) and
“progenitor cell” (Panel a, right) [11], [50].
Panel a Intratubular regeneration models. Dedifferentiation scenario (left) – terminally differentiated TECs are responsible for regenerating the tubule. Upon injury TECs have the ability to dedifferentiate (EMT), acquiring markers as CD24, CD133 and vimentin (VM)). Then, dedifferentiated cells proliferate and differentiate (MET) in order to replenishing functional tissue. Stem/progenitor cell scenario (right) – an endogenous population of stem cells (intrinsically present in the tubule), which express markers as CD24, CD133 mediates repair. These cells have an increased survival capacity and, upon injury will divide and differentiate mediating tubular regeneration. MET – mesenchymal to epithelial transition. (Adapted from Li e Wingert (2013) [11]);
i. Dedifferentiation scenario
This theory suggests that terminally differentiated renal tubular cells, which are functional cells, have
the ability to dedifferentiate after withstanding damage (Panel a left) [51]. Upon dedifferentiation, these
cells might acquire a stem-like phenotype and would express markers as CD24 and CD133, and these
cells would be able to proliferate and replenish the renal tissue [40], [49], [52]. This dedifferentiation
process concurs with loss of epithelial features and acquisition of mesenchymal characteristics, that is,
EMT (see section 1.b.iv). There are several injurious stimulus associated with EMT. This appears to be
independent of aetiology. For example, both cisplatin [53], [54] and hypoxia [28] were described as EMT
promoters. And several other conditions were linked to fibrosis including diabetes, hypertension,
urological obstruction, inflammation and autoimmune disorders [37]. In turn, EMT has been suggested
to have a dual role, initially, in response to moderate injury it would result in reversible dedifferentiation
[42], [49], [52] and cells that undergo this process show properties of stem cells [55], [56]. Further
evidence for the role of pEMT in the kidney repair process was reported by Swetha G. and co-authors
(2011), who observed glomerular parietal cells that undergo EMT in vitro acquired a progenitor-like state
associated with reparative potential. These cells co-expressed epithelial and mesenchymal markers
consistent with pEMT, along with putative stem marker CD24 and pivotal genes involved in mammalian
kidney development [56].The dedifferentiated population would then proliferate and finally re-
differentiate (re-epithelize) and replenish the tissue and mediate functional recovery [49], [52].However,
under continuous or severe injury, EMT could further progress onto an irreversible mesenchymal
phenotype [42], [49]. These cells would produce ECM and mediate fibrosis [38]. According to this, EMT
has a dual role, mediating either healing or fibrosis (and consequently, loss of function), depending upon
the balance between injury and healing stimulus.

10
Some of the evidence backing the dedifferentiation theory arises from studies that have co-localized
CD133, CD24 positive cells with kidney injury molecule-1 (KIM-1) which is a tubular injury marker [40].
Moreover, Kramann and co-authors (2015) found direct evidence that terminally differentiated epithelial
cells might regenerate the tubule in mice [52]. By generating knock-in mice, these authors achieved
inducible expression of a reporter protein cloned under the control of a phosphate transporter (SLC34a1)
reported as specific to terminally differentiated TECs. Hence, they could label terminally differentiated
TECs exclusively. This group first induced labeling of single-cells and confirmed that, after injury, these
would divide and originate labeled clones. Additionally, they confirmed that these cells acquired
expression of VM and upregulated markers as CD133, CD24 and also KIM-1. Then, maximal labelling
(i.e. nearly all TECs would be labeled instead of single-cell) was induced prior to injury and no dilution
was observed during repair. That is, no non-labeled cells significantly contributed to repair.
There are two main weaknesses associated with the dedifferentiation theory, one is that functional
studies showcasing the reparative properties of terminally differentiated TECs were mostly performed
in rodent. And inter-species differences in markers of injury and dedifferentiation, question whether
physiological mechanisms from rodents apply to human [57], [58]. The second, is the presence of a
CD24+/CD133+ population in samples of healthy human kidneys [31], [57]. In healthy rat kidney no
resident population expressing CD24 and CD133 has been found, therefore, contradicting the existence
of an endogenous stem cell pool [31]. This population only appears upon injury and at that point
mediates tubular repair [31]. When comparing morphology, localization and marker expression of the
CD133+/CD24+/VM+ population in rat and human, the results were highly similar [31]. This suggests
that these are equivalent populations and it would be very unlikely that these would be originated by
distinct mechanisms [31]. Their presence in healthy human samples is possibly tied to spontaneous
injury since human nephrons are exposed to greater stress than rodent [59], [60].
Another theory, which has been proposed is that stem cells are recruited from the bone marrow niche.
Hematopoietic and mesenchymal stem/stromal cells (MSCs) would home to the damaged nephron and
then engraft and differentiate into renal epithelium. However, contradictory evidence arises since the
cellular make up of regenerated tubules of mice whose bone marrow-derived cells had been labelled
showed no contribution from these cells [61]. Nonetheless, MSCs have been suggested to promote
regeneration through paracrine effects [11].
ii. Stem cell pool
The basis of this theory is that an endogenous pool of stem cells resides within the nephron (Panel a
right).
Stem cells are unspecialized cells that possess the ability to self-renewal, as when they divide an
identical cell is generated. This property is combined with the ability to originate specialized cells through
cellular differentiation, in response certain stimulus (including mechanical cues, growth factors, cell
density). These properties allow these cells to replenish functional tissues [62].
Stem cells can be classified according to their differentiating potency that is, the potential to originate
different cell types. Stem cells can be totipotent, being able to give rise to every cell type that forms the

11
organism and the extra-embryonic structures; pluripotent, if capable to differentiate into all cells that
form an organism but not the extra-embryonic structures; and also multipotent cells which are able to
differentiate into a more limited number of cell types, usually from the same family/organ. Some adult
tissues also retain a pool of stem cells that have important roles in tissue homeostasis and cellular
renewal. These adult stem cells are usually multipotent. The most well-known example are
hematopoietic stem cells that maintain the erythrocyte, leukocyte and thrombocyte populations [62].
Recent studies have suggested that stem cell pools are present in tissues that were previously
considered terminally differentiated, such as the myocardium [63] or the central nervous system [64].
Multipotent progenitor cells have also been identified within the nephron [65]. Particularly increasing
evidence suggests that the renal tubule harbors a population of progenitor cells [66]. Upon injury, these
stem cells would migrate, proliferate and differentiate into tubular cells and so mediate the regeneration
process [66]. These progenitor/stem cells would have a distinct phenotype from the surrounding fully
differentiated cells and have been associated with markers as CD133, CD24 and VM [66], [67]. This
theory is mostly sustained by the identification of cell populations with the described characteristics in
biopsies of healthy kidneys, suggesting that these are intrinsically present and not formed as a
consequence of injury [11], [31].
d. Kidney disease - diagnosis and treatment
AKI diagnostic gold standard is sCr. Although, this is associated with a temporal delay in diagnosis as
sCr measures the decrease in GFR and is not a direct measure of the injury itself [4], [68]. This aspect
has been hampering the study of interventions addressing the early-stages of AKI [4], [68] because, by
the time diagnostic is possible, the therapeutic window for these interventions may have already passed
[4]. Currently, several markers have been proposed to predict the risk of AKI [69] and to identify patients
at risk of long-term adverse outcomes [70], such as the tissue inhibitor of metalloproteinase 2 (TIMP-2)
and insulin-like growth factor binding protein 7 (IGFBP7), which are expressed in tubular cells under
stress/injury. These markers are used by the NephroCheck test which, in 20 minutes, characterize the
risk of a certain patient to progress towards AKI [71]. However, the cost-benefit of NephroCheck has not
been established so far, and its use has only been approved in a restricted population. Additionally, it is
not intended for AKI diagnosis, where sCr remains the gold standard practice.
AKI treatment is mostly restricted to cessation of exposure to nephrotoxic agents, avoiding
hyperglycemia and closely monitoring progression and hemodynamic function. If electrolyte, fluid or
acid-base balance reach life-threatening levels, then haemodialysis might be performed [3]. These
solutions merely address symptoms and do not actively target the underlying pathophysiological
process. Future treatments should aim to prevent cellular damage, attenuate the inflammatory response
and potentiate effective repair [4].
KDOQI guidelines recommended the use of GFR (evaluated using sCr and an estimating equation) and
albuminuria (measured preferentially as urine albumin-to-creatinine ratio) as reference indicators for the
classification and diagnosis of CKD. Also, abnormalities in urine sediments, electrolytes or renal
structure can be considered as damage markers [15]. Despite being well-established in clinical practice,

12
both GFR and albuminuria are flawed indicators. Since, the test-retest reliability of albuminuria is less
than satisfying [72], [73] and GFR is susceptible to age-related confounds. As mentioned, aging is
associated with a decline in GFR, so a given reduction in an elder patient carries a lower risk of
progressing to ESRD than the same reduction in a younger patient [72]. Additionally, GFR estimating
equations’ accuracy is within 30% of the actual value [74] and varies between the different equations
used (hindering inter-study comparisons). Also, the GFR is not quite appropriate for early-stage CKD
detection and shows low sensitivity to discriminate between stages 1 and 2 [72]. Furthermore, the
currently available indicators cannot efficiently identify CKD cases that will progress to ESRD [6], [8],
[72]. Only a number of the detected cases of CKD progress to ESRD [72]. But when ESRD does
develop, replacement therapy might be required, implicating a serious mortality risk and economic
burden [19]. So, even though, currently there is not enough evidence to support the economic and
clinical benefits of population-wide screening. Both the value of population-wide screening and clinical
care might improve if high risk CKD cases could be promptly detected [72], [75].
Current available evidence from large randomized clinical trials to guide treatment and CKD
management is less than would be desirable [8], [72]. Nevertheless, there are indications that calorie
controlled diets, especially low-sodium intake, exercise, avoidance of weight gain and smoking
withdrawal have positive influences [7]. These recommendations are also true in the case of
cardiovascular complications and diabetes, the most common comorbidities and risk factors for CKD
[6]. If reversible causes for kidney failure such as infection or obstruction are identified, these should
also be swiftly addressed. In addition, treatment of early-stage CKD usually tackles comorbidities,
particularly hypertension. Given that, well-established therapies are available and fatal cardiovascular
complications frequently occur before CKD develops into ESRD [72]. Typically, a pharmacological
approach is pursued for the control of hypertension [7]. A second line of treatment envisages
involvement of specialist to manage CKD-related metabolic complications this may include bone mineral
disorders, renal hyperparathyroidism, acidosis and anaemia. However, marked advance of CKD
(ESRD) requires replacement therapy (dialysis or transplant), which represent serious clinical
implications for the patient and economic burden for the society [6], [19]. The feasibility of kidney
transplant is dependent upon the availability of a matching donor and, even then, implicates surgery
related risks and lifelong immunosuppressive therapy [6]. As for dialysis, it is associated with risk of
infection and it does not effectively replace renal function [6].
Generally speaking, CKD therapy focuses on comorbidity treatment. Although, successful in slowing
CKD’s progression, no available therapeutic option achieves injury reversion. Making matters worse,
only replacement therapy is available for ESRD. Patients with CKD (even at an early-stage) are at higher
risk of death and cardiovascular risk [6], [76], and although only a minor fraction of CKD cases progress
towards ESRD, at that point replacement therapy is essential for survival. Hence, the importance to
understand how to limit CKD progression is clear, considering the severity of the comorbidities
associated, the significant prevalence and, the high mortality among patients receiving replacement
therapy (12.6% in Portugal in 2016 [19]).

13
e. Future therapies
Current studies and experimental therapies attempt to bridge this therapeutic gap by focusing on the
underlying pathophysiological processes. In this regard, new pharmacological targets have been
purposed and are under investigation.
For example, pharmacological inhibition of mitochondrial dysfunction or promotion of mitochondrial
biogenesis are possible therapeutic approaches in AKI. Agents that prevent the dysregulation of UPR
when ER stress is too severe are also being investigated [13]. Moreover, drugs that inhibit endothelial
dysfunction (endothelin receptor agonists) and compounds that protect the integrity of endothelial
glycocalyx (a structure that covers mammalian cells, which might have a role in protein filtration) have
also been studied [77]. Therapies inhibiting complement activation are also being investigated [78], [79].
Fibrosis has been pointed as a common end-stream pathway of CKD (independent of initial injury) so
research has also focused on blocking fibrotic mechanisms. As mentioned, TGF-β1 is considered a
powerful inductor of EMT and fibrosis and its therapeutic neutralization has been investigated, but so
far failed to show benefits in clinical trials [77], [80], [81]. However, inhibition of an epithelial-specific
integrin (αvβ6), which activates TGF-β1 [82], has shown benefits in fibrosis models [83]. Moreover, αvβ6
has a very low expression in the adult healthy kidney and is only expressed in the diseased tubular
epithelium. Therefore, therapies targeting this integrin might have the advantage of spatial selectivity
[83]. These and other, front-line approaches are under investigation as epigenetics and micro RNA
targeting [84] .
i. Use of mesenchymal stem/stromal cells (MSCs) to treat kidney disease
MSCs are multipotent stem cells that can differentiate into mesodermal cell types like osteoblasts,
adipocytes, and chondrocytes. MSC are classically associated with the bone marrow niche (bone
marrow-derived MSC, bMSCs), where they contribute to hematopoietic stem cell regulation.
Nevertheless, MSCs have been identified in numerous other tissues such as connective tissue, adipose
tissue (adipose tissue-derived MSC, adMSCs) [85], skeletal muscle, umbilical cord [86], amniotic fluid
[87] and the kidney, where MSCs are thought to participate in cellular turnover [88].
MSCs have a high homing ability, that is, MSCs will migrate preferentially towards the site of injury and
once there, MSCs are capable of crossing the endothelium thus entering the damaged tissue [59], [89].
However, there is growing consensus that engraftment and differentiation are of less importance in
mediating recovery, than are the paracrine effects of MSCs [59], [60].
Paracrine effects are mediated by a series of biologically active factors, produced and released by
MSCs, such as chemokines and growth factors. Additionally, microvesicles and MSC-derived exosomes
can transport a series of molecules such as: mRNA, miRNA, surface receptors and lipids. The paracrine
effects associated with MSCs include immunomodulation, decreasing apoptotic activity promoting
cellular survival, anti-inflammatory action, promotion of cellular repair, recruitment of tissue-specific
progenitors, reduction of reactive oxygen species (ROS), enhancement of angiogenesis and,
attenuation of the fibrosis process [59], [90].

14
Another characteristic that makes MSCs excellent candidates for cell therapy is their low
immunogenicity, rendering them safe for allogeneic protocols, as adverse reactions and rejection
concerns are negligible [4], [59].
Given their ample beneficial effects it is not surprising that MSCs have been tested for the treatment of
a number of different conditions. For instance, in the treatment of conditions affecting bone and cartilage
[91], [92], to improve cardiac function following myocardial infarction [93] and in the treatment of graft
vs. host disease (a serious complication of allogeneic hematopoietic stem cell transplantion) [94]. MSCs
have also been used to treat quite a few kidney-related conditions, from rejection following transplant
[95] to cisplatin-induced acute renal failure (NCT01275612 [96]).
Renal injury involves a complex combination of factors and pathways but nonetheless, the kidney shows
an elevated recovery potential. These aspects render the kidney a particularly adequate target for MSC
therapy. Supported by the fact that there are 5 completed clinical trials for kidney conditions involving
MSCs and 15 ongoing [97]. Additionally, in vitro and in vivo models of kidney pathologies provided the
evidence and data to support endeavouring clinical trials using MSCs to treat kidney-related conditions.
Kim and collaborators (2012) [98] used adMSCs isolated from human abdominal fat. They showed that
both adMSC and their conditioned media (adMSCs-CM) were capable to have a positive effect in animal
and cellular models of cisplatin-induced AKI. Male Sprague-Dawley rats were either injected with PBS
(control), adMSCs, adMSCs-CM, cisplatin, both cisplatin and adMSCs (1 day later) or both cisplatin and
adMSCs-CM (1 or 2 days later). Survival was significantly prolonged in rats treated with adMSCs. And
protection from cisplatin-induced renal injury was suggested by the attenuation in functional impairment
(lower blood urea nitrogen and sCr) and by histology, which indicated less extensive tubular injury.
Additionally, adMSCs ameliorated inflammatory response. Interestingly, little or no adMSCs engrafted
the renal tissue strongly suggesting that the improvements listed were due to paracrine effects. This
hypothesis was corroborated since adMSCs-CM treated rats also showed, in comparison to cisplatin
treated ones, improved renal function, smaller extent of tubular injury and prolonged survival. Moreover,
the observed recovery due to adMSC administration was too fast to be attributed to tubular regeneration
resulting from adMSC integration. In this same study, an immortalized line of human kidney proximal
tubular cells (HK-2 cells) was used to mimic cisplatin-mediated lesion in vitro. HK-2 cells were first
exposed to cisplatin and then either kept under standard culture conditions (control), co-cultured with
adMSCs or incubated in adMSC-CM. In agreement with the in vivo model, co-culture with adMSCs or
incubation in their conditioned media resulted in increased cell viability along with a reduction in
inflammatory cytokine release. This study provided strong evidence supporting the use of adMSC for
renal therapy moreover, suggesting that their main effects arrive from paracrine effects. Evaluation of
these effects was however, restricted to the kidney and renal function, no assessment of systemic
variations was carried out. The authors believe cell-based therapy to be particularly advantageous for
the treatment of a condition as cisplatin induced AKI since this implicates interplay between many factors
and pathways.
Following the successes of MSC usage in AKI animal models, a group in the United States [4]
implemented a Phase I clinical trial administering allogeneic bone-marrow-derived MSCs to participants

15
at high risk of AKI following on-pump cardiac surgery (that is surgery requiring the heart and lungs of
the patient to be temporarily replaced by a cardiopulmonary bypass machine). Patients were classified
as high risk if additional risk factors including underlying CKD, hypertension, diabetes mellitus and age
older 65 years concurred with the aforementioned surgery. This trial aimed firstly to confirm safety and
feasibility (determined by the absence of adverse events) and secondly to assess preliminary efficacy.
A total of 16 patients enrolled in the trial. MSCs were delivered to the distal thoracic aorta and dose-
escalation protocol was instituted (three doses were administered low, intermediate and high) and
patients were followed up closely for 6 months and up to 3 years.The results supported the safety of
allogeneic MSCs at all doses tested and confirmed protection of renal function (at short- and long-term).
MSC treatment was also associated with a reduction of both the length of hospital stay and time for
readmission.
MSCs have also been studied for the treatment of CKD with positive outcomes. For example, the team
of Villanueva (2013) [99] used an adult male Sprague–Dawley rats with CKD induced by 5/6
nephrectomy to investigate the impact of treatment with adMSCs. In the animals treated with adMSCs
(that were administered immediately following nephrectomy) renal function indicators (sCr and blood
urea nitrogen levels) were close to normal levels in contrast with non-adMSC-treated animals that had
also undergone nephrectomy. In renal sections obtained from non-adMSC-treated animals it was
possible to describe histological alterations evidencing renal chronic renal damage, including dilated
tubules and fibrosis. The tubules in renal sections obtained from rats treated with adMSCs presented
normal morphologies.
Saad an co-authors (2017) conducted a clinical trial [26] studying the effect of intra-arterial injection of
autologous adMSCs to treat atherosclerotic renovascular disease. The atherosclerotic condition
associates with poor kidney perfusion and tissue hypoxia ultimately leading to loss of renal function [26],
[100]. A total of 28 patients enrolled in this study, and adMSC infusion was compared to administration
of standardized medical therapy alone (medically treated group). Results indicated that the treatment is
safe and well tolerated as no adverse events were identified. After 3 months, in the adMSC-treated
group both kidney perfusion and blood flow rose, GFR remained unchanged and fractional hypoxia fell,
whereas in the medically treated group blood flow renal perfusion and fractional hypoxia were unaltered
and GFR declined. The authors suggest the positive outcomes may be related to attenuation of
inflammatory response since a decrease in inflammatory cytokines was observed (albeit not significant).
Vascular changes might account for the improvements, which could be due to MSC ability to release of
pro-angiogenic factors, as VEGF. And, decreased oxidative stress was also suggested as a factor
underlying therapeutic effects. In spite of its limitations, that include limited number of patients and short
follow-up period this study positively underscores the therapeutic potential of adMSCs to treat kidney-
related conditions.
On an interesting note, results from another clinical trial [95] using autologous bmMSCs to improve long-
term outcomes of kidney transplant suggest these have the ability to resolve tubulitis, leaving no signs
of interstitial fibrosis or tubular atrophy. Additionally, no treatment-related serious adverse outcomes
were reported and the results suggest that bmMSCs induced immunosuppression.

16
At the present moment, the use of MSCs remains restricted to experimental therapies and further
research is required before these reach the standardized clinical practice. On one hand, there are many
advantages to their use, as MSCs are easily available, since these can be obtained from a multitude of
tissues, and their low immunogenicity is permissive for allogeneic use and trials and studies up to this
point strongly support MSCs therapy to be safe and feasible [4], [59], [101]. On the other hand, important
aspects remain unclear as a consensual isolation and characterization protocol, source dependent
variability (MSCs obtained present slightly different properties depending on the source of origin),
expansion protocol (regarding adequate passage number, media, oxygen tension, for example). A
further international effort will be necessary towards uniformity [59], [62].
ii. N-acetyltransferase 8
1. Identification
The N-acetyltransferase 8 (NAT8) enzyme is highly expressed in the kidney proximal tubular cells and
to a lesser extent in the liver [102]–[104]. NAT8 subcellular localization has been traced to the membrane
of the ER [102], [105], where it was predicted to be anchored, based on the presence of an hydrophobic
stretch, with its catalytic site turned to the cytoplasm [102], [106].
The physiological role of NAT8 has only recently begun to be understood. In 2010, Veiga-da-Cunha,
[105] identified NAT8 as the enzyme that catalyses the last step in the mercapturic acid pathway (MAP).
This is an important route for detoxification of electrophilic compounds, which exert cellular damage by
interacting with macromolecules (DNA, proteins and lipids). Electrophiles can have exogenous source,
including therapeutic drugs (as cisplatin), industrial chemicals, fuel additives and tobacco [107] or
endogenous sources as leukotriene LTE4, prostaglandins, by-products of lipid metabolism (α, β-
unsaturated carbonyls and nitro-fatty acids) which associate with inflammatory response and oxidative
stress [108], [109].
Electrophiles promptly react with nucleophiles forming covalent adducts. The thiol group of cysteine
residues in proteins is nucleophilic [108]. So, MAP mediated detoxification begins through reaction of
electrophiles with glutathione (GSH) which presents a cysteine-residue (Figure 3 (1)) [108]. These GSH-
conjugates are further excreted from cells (Figure 3 (2)) and extracellularly are transformed into
cysteine-S-conjugates by the action of two extracellular cell surface enzymes, γ-glutamyltranspeptidase
(γGT, Figure 3 (3)) and aminodipeptidase (Figure 3 (4)). γGT is highly expressed at the extracellular
membrane of PTECs showing the relevance of this pathway in the kidney. Cysteine-S-conjugates are
then re-uptaken by the PTECs (Figure 3 (5)) and further metabolism might be mediated by NAT8
(Figure 3 (6)) or β-lyase (Figure 3 (7)) [29]. The first will generally generate chemically stable,
excretable products (mercapturates), whereas the latter has been associated to the production of
reactive thiols, possibly toxic. [29], [53], [108], [110]

17
Figure 3 Xenobiotic detoxification through mercapturic acid pathway (MAP); Xenobiotic compounds interact with glutathione (1). GSH-conjugates are excreted from cells (2) and transformed into cysteine-S-conjugates (C-X) by γ-glutamyltranspeptidase (3)) and aminodipeptidase (4). These are then re-uptaken (5) and further metabolised by NAT8 (6) forming mercapturic acid (NAC-X) or by β-lyase (7) forming a reactive thiol; X – xenobiotic; GSH – glutathione; GST – glutathione-S-transferase; GS-X – glutathione conjugates; CG-X – cysteine-glycine-conjugate; C-X cysteine-S-conjugates; γGT – γ-glutamyltranspeptidase; S-X –reactive thiol; Adapted from Ramsay et Dilda (2014) [111]
NAT8 activity will result in the formation of N-acetylcysteine compounds (mercapturates) subsequently
eliminated in urine. The formation of mercapturates has been suggested as an indicator of occupational
and environmental exposure to toxicants [107].
2. NAT8 involvement in injury repair – supporting evidence
The NAT8 gene (2p13) was associated with blood pressure regulation and renal metabolic pathways in
2008 [47], [48]. Resequencing studies revealed that single nucleotide polymorphisms (SNPs) in the
promoter region of NAT8 (rs10206899 and rs15358) were associated with Cr and cystatin c (cysC)
levels, GFR and CKD [112]–[114]. Juhanson and colleagues (2008) identified SNPs in the promoter
region of NAT8 to be associated with systolic blood pressure and renal function (GFR). In particular,
minor alleles (of the same SNPs) were found to be protective regarding blood pressure and the risk of
kidney injury. The authors hypothesized that this effect was explained by the reduced susceptibility of
the minor alleles to transcriptional suppression, hence guarantying availability of NAT8.
Scarce information exists on literature about this enzyme and its regulation, and its inducers or inhibitors
remain unidentified. The only data available on NAT8 regulation is found on the Gene-Cards ® website
[115], [116] indicating that FOXA1 is implicated in NAT8 regulation [115], [116]. FOXA1 belongs to
subclass A of the Forkhead box containing transcription factor family. Remarkably, FOXA1
downregulation has been associated with EMT (albeit in the context of cancer disease) [117]. Also,
FOXA1 knock-out was associated with nephrogenic disease (however, the direct downstream target
mediating this pathology was not identified) [118].

18
Moreover, recently, NAT8 has been implicated in human TEC injury and regeneration [119]. This
evidence was reported by Omata and co-authors (2016) who established an in vitro experimental design
that intended to identify genes involved in renal re-epithelization. The authors confirmed that in human
PTECs, NAT8 transcript levels were significantly reduced after 48h of exposure to TGF-β1 (3 ng/mL).
TGF-β1 was used as an injury stimulus and promoted dedifferentiation of PTECs, a normal occurrence
in the initial pathophysiology of renal injury, considered an injury response mechanism initiating repair.
After 48 h of exposure, TGF-β1 was then withdrawn and a progressive recovery of NAT8 expression
was registered during the next 24 h. However, these authors also reported that NAT8 knock-down did
not prevent re-epithelization. This might indicate that the recovery process may be independent of the
activity of NAT8, but could also be explained by other factors.
Additionally, NAT8 has been suggested to interact with TGF-β1 receptor (type I) [120] and possibly
Smad4 [121], [122]. Further supporting the involvement of NAT8 in cellular response to TGF-β1 and
subsequently to injury.
Additional evidence supporting a role for NAT8 in healing was provided by Fu and co-authors (2014)
[123], who observed an increased hepatic expression of NAT8 when umbilical cord-derived MSC
therapy was administered to treat ischemic-reperfusion injury. More precisely, female SD rats were
subjected to hepatic ischemia and then treated with MSCs. Then, 6 h and 24 h after this procedure
levels of hepatic enzymes and histological evidence of damage (necrosis, inflammation) were evaluated
to determine the severity of hepatic injury. The results showed that MSC treatment ameliorated
hepatocellular damage and promoted regeneration. Finally, this group found that NAT8 was reduced
upon liver injury and restored following MSC administration. This lead to in vitro study of the effect of
NAT8 knock-down or over-expression in resisting H2O2 treatment. Hepatic cells (L02) overexpressing
NAT8 had increased capacity to resist apoptosis under H2O2 injury, and knock-down of NAT8 resulted
in the opposite effect. This supports a role for NAT8 in increasing the cellular ability to withstand
damaging stimulus.
The study of NAT8 is still in an early-stage and some controversial hypothesis have emerged. For
example, regarding its capacity to acetylate lysine residues. For instance, the team of Mak (2014) [124]
and Puglielli (2009) [125] suggest that NAT8 is capable of intraluminal lysine acetylation. In fact, BACE1
(β-site amyloid precursor protein-cleaving enzyme 1) and CD133 (mentioned as a marker of the stem
or dedifferentiated renal population [31], [52]) have been suggested to be acetylated by NAT8B and
NAT8 (ATase 1 and 2, respectively) with functional implications. Moreover, intraluminal protein
acetylation has been suggested to serve as protein quality control mechanism [126]. However, Veiga-
da-Cunha and co-authors (2010) [105] investigated NAT8 ability to acetylate L-lysine residues and
protein-bound lysine and found that catalytic efficiency was 20-fold lower than for cysteine (S-benzyl-L-
cysteine). Additionally, the mentioned reports of lysine acetylation by NAT8 were either in vitro [125] or
in a line of human epithelial colorectal adenocarcinoma, both very distinct contexts from the PTECs
where NAT8 is physiologically expressed to the greatest extent. Therefore, this potential role for NAT8
remains unclear.

19
On another hand, in a mice model of embryonic hypoxia (VHL knock-out in stromal progenitors), NAT8
was shown to be up-regulated by a 2.98 fold change, rendering NAT8 mRNA the seventh most up-
regulated of the evaluated gene set. In this conditions, tubular differentiation was shown to be impaired
[127]. This is in line with a speculated role for NAT8 in development [104], [114] and reported difficulties
generating a NAT8 knock-out model in rat [123].
All in all, the kidney has a major role in homeostasis, participating in detoxification, being responsible
for filtering the blood and for drug metabolism, regulating blood pressure, controlling osmotic equilibrium
and pH balance. This renders the kidney a good candidate for “monitor of health status” and studying
its physiology, pathophysiology and healing mechanisms might help in understanding synergies
between endogenous disorders and exposure to external harmful stimulus along. And, moreover,
supports the pursuit for effective treatment for a number incurable renal pathologies.

20

21
2. Aims of the present study
a. Objective
The urgent need to understand the mechanisms underlying tubular injury and endogenous repair to
improve available therapies supports the relevance of this work. The main objectives defined were to
investigate changes in the expression of NAT8 throughout (1) tubular injury progression and (2)
throughout re-epithelization. Additionally, it is aimed to (3) use MSC-CM to address the link between
NAT8 and the success of MSC in repairing kidney under injury, while confirming the benefits of paracrine
effects of MSCs on re-epithelization.
b. Working hypothesis
The working hypothesis for this project was that NAT8 would have a role in MSCs therapeutic potential
[59]. This hypothesis-oriented research is supported by the well-established positive outcomes obtained
when administering MSCs to treat kidney disease [4], [59], [94] and by the potential renoprotective role
for NAT8 [114], [119].
Figure 4 Working hypothesis: MSCs show anti-fibrotic potential and are capable to promote renal repair [59]. A connection between (NAT8) and tubular injury has been suggested [114], [119], prompting the question of whether the action of MSCs might be linked to NAT8. This is the working hypothesis driving this work.
To do this, the experimental design illustrated in Figure 5 (in vitro) was established using the HK-2 cell
line. This is an immortalized human proximal tubule epithelial cell line derived from healthy adult human
kidney and retain a series of phenotypical features characteristic of human TECs [128]. This line is
advocated as adequate for the study of human adult mechanisms, including nephrotoxicity and
injury/repair studies [128], [129]. HK-2 cells have been used in studies investigating the role of EMT in
renal injury [38], [128], [130]. TGF-β1 was used to stimulate dedifferentiation process because it is a
main physiological driver of EMT, as it has been shown in human TECs and HK-2 [13], [38], [119] and
it is up-regulated in renal injury [131]. Additionally, similar changes in gene transcription were found in
both HK-2 upon exposition to TGF-β1 and TECs from fibrotic kidneys [38]. Also, exposure to TGF-β1
induced comparable changes in VM and e-cadherin expression in primary human PTECs and in HK-2
cells [132]. Re-epithelization process will be induced by TGF-β1 withdrawal [119] and MSC-CM will be
administered to evaluate paracrine effects. CM of human adMSCs will be used, since the adipose tissue

22
is a validated source of therapy apt-MSCs, previously used in HK-2 based experimental set-ups [98].
To validate injury and re-epithelization, hallmarks of EMT will be evaluated (as VM and e-cadherin
expression [133]). And to reach the goals of this study NAT8 expression will be assessed over time.
Figure 5 Experimental design schematics. HK-2 cells will be exposed to TGF-β1 (10 ng/mL) for a period of time of up to 144 h to induce dedifferentiation. TGF-β1 arrest (upon 48 h or 72h stimulation) is expected to induce re-epithelization. To assess the phenotype throughout the assay cytokeratin (CK) and e-cadherin will be evaluated as epithelial markers and vimentin (VM) as a mesenchymal marker. MSC-CM will be administered in combination to either TGF-β1 arrest or continuous exposure.
23
3. Materials and Methods
a. Cell culture and experimental conditions
A cell line derived from an epithelial line of renal proximal tubule cells (HK-2: ATCC® CRL-2190™) was
obtained from American Type Culture Collection [134]. Cells were cultured in Dulbecco's Modified
Eagle’s Medium/Nutrient Mixture F-12 (DMEM/F-12; 11320033, Gibco) supplemented with 10% Fetal
Bovine Serum (FBS, S 0615, Biochrom), 4 mM L-Glutamine (25030-081, Gibco) and 1% antibiotic-
antimycotic (15240062, Anti-Anti, Invitrogen). Cells were kept at 37 oC, and 5.2% CO2, these conditions
were established using a NUAIRE DH AUTOFLOW incubator. Cell passaging was carried out at 70-
80% confluence, every 3 to 4 days, using trypsin - ethylenediaminetetraacetic acid (EDTA) (0.05%)
(25300-054, Gibco), for cell detachment.
For in vitro experiments, cell number was determined using a Bürker counting chamber. Depending on
the final application, the appropriate number of cells was seeded in DMEM/F-12 (10% FBS) for a 24 h
long period. After this, cells were deprived of FBS for a 16 h long period (starvation) prior to establishing
experimental conditions. In the following assays, unless specifically mentioned otherwise, DMEM/F-12
was supplemented with 10% FBS.
Dedifferentiation assay: cells were seeded and, as depicted below (Figure 6), exposed to control
conditions (DMEM/F-12 supplemented with either 1% or 10% FBS) or to TGF-β1 (DMEM/F-12
supplemented with 10 ng/mL TGF-β1 (100-21, Peprotech [135]) and either 1% or 10% FBS). TGF-β1
was reconstituted in citric acid (10 mM pH 3.0). For induction of dedifferentiation, HK-2 cells were
exposed to 10 ng/mL TGF-β1 for periods of 24, 48, 72 and 96 h. Media was refreshed every 24 h
following a brief rinse with Phosphate Buffered Saline 1× (PBS). Experiments were performed in
triplicates for each condition.
Figure 6 Dedifferentiation assay: schematic overview of experimental conditions; CTRL – control; DMEM/F-12 Dulbecco's Modified Eagle Medium/Nutrient Mixture F-12; FBS – Fetal bovine serum; TGF-β1 – Transforming growth factor β1;

24
Dedifferentiation – re-epithelization assay: Cells were seeded in 12 well-plates and, as depicted
below (Figure 7), exposed to four different conditions: 1) control (CTRL, DMEM/F-12 supplemented
with 10% FBS); 2) TGF-β1 (TGF-β1, DMEM/F-12 supplemented with 10 ng/mL TGF-β1 and 10% FBS);
3) TGF-β1 (10 ng/mL) exposure for 48 h followed by up to 96 h culture in TGF-β1-free media (TGF-β1
(48 h) + CTRL (96 h)); and 4) TGF-β1 (10 ng/mL) exposure for 72 h followed by up to 72 h in TGF-β1-
free media (TGF-β1 (72 h) + CTRL (72 h)). Upon TGF-β1 withdrawal, cells were cultured in DMEM/F-
12 supplemented with 10% FBS (same as control condition). Media was refreshed every 24 h following
a brief rinse with PBS 1×.
Figure 7 Re-epithelization assay: schematic overview of experimental conditions; CTRL – control; DMEM/F-12 Dulbecco's Modified Eagle Medium/Nutrient Mixture F-12; TGF-β1 – Transforming growth factor β1;
Mesenchymal Stem Cell Conditioned Medium (MSC-CM) treatment assay: to study the effect of
MSC-CM on the re-epithelization process a third assay was carried out. Cells were seeded in 12 well-
plates and, as depicted below (Figure 8), exposed to five different conditions: 1) control (CTRL); 2)
exposed to TGF-β1 (TGF-β1), 3) 72 h exposure to TGF-β1 followed by culture in TGF-β1 free DMEM/F-
12 (TGF-β1 (72 h) + CTRL (72 h)), 4) 72 h long exposure to 10 ng/mL TGF-β1 followed by culture in
TGF-β1 free DMEM/F-12 supplemented with 30% MSC-CM (TGF-β1 (72 h) + MSC-CM (72 h)) and 5)
72 h long exposure to 10 ng/mL TGF-β1 followed by culture in DMEM/F-12 supplemented with both 10
ng/mL TGF-β1 and 30% MSC-CM (TGF-β1 (MSC-CM)).
MSC-CM was provided by the Stem Cell Bioengineering and Regenerative Medicine Laboratory,
Técnico Lisboa, Campus TagusPark, Universidade de Lisboa and was obtained from the culture of
adipose tissue derived MSCs from one donor. MSCs were cultivated in a 1000-ml New Brunswick®
BioFlo (Eppendorf®) bioreactor with low glucose DMEM supplemented with 5% of human platelet lysate.
MSCs were kept at 37 oC, with 20% of dissolved oxygen provided by headspace aeration (N2, O2 and
air) and pH 7.3. 20×106 cells were inoculated with 20 g/L of plastic microcarriers [136] in a final volume
of 400 mL (medium was changed when glucose concentration was lower than 3 g/L). After 7 days of

25
culture the supernatant (i.e. MSC-CM) was centrifuged (1500 rpm) and cryopreserved at –80 ºC. Prior
to its use MSC-CM was thawed (on ice) aliquoted and stored at -80 oC until use.
Figure 8 Mesenchymal stem cell conditioned media treatment (MSC-CM) assay: schematic overview of experimental conditions; CTRL – control; DMEM/F-12 Dulbecco's Modified Eagle Medium/Nutrient Mixture F-12; TGF-β1 – Transforming growth factor β1;
b. Flow cytometry
Cells were seeded in 24 well plates (1×10⁵ cells per well), for the dedifferentiation assay and in 12 well
plates (2×10⁵ cells per well) for dedifferentiation – re-epithelization and MSC-CM treatment assays.
Each experimental condition was assayed in triplicates.
Following a brief rinse with PBS 1×, cells were detached with 2 mM PBS-EDTA, harvested and
centrifuged (1200 rpm, 5 min, room temperature (RT)), the supernatant was discarded, and afterward
cells were washed once with PBS 1 ×. Fluorophore labelling was carried out by incubating cell for 30
min with 100 µL of allophycocyanin (APC) conjugated VM antibody (IC2105A, R&D Systems, Inc.) and
phycoerythrin (PE) conjugated CK antibody (ab52469, Abcam) diluted 1:100 in PBS- Bovine Serum
Albumin (BSA, A9647, Sigma) -TRITON X100 0.1% (T8787, Sigma). Then, cells were centrifuged (1200
rpm, 5 min, 4 oC), washed with PBS 1× and re-suspended in PBS-BSA 0.1% (200 µL). Cells were then
examined by flow cytometry (FACScalibur – Becton Dickinson) and for each sample 10,000 events were
acquired using CellQuest (Becton Dickinson). The collected data was analysed using FlowJo® software
[137] and gates were set based on signal measured from a non-labelled sample.

26
c. Real-time relative quantification reverse transcription
polymerase chain reaction (Real time RT -PCR) analysis
i. RNA extraction
An amount of 2×10⁵ cell cells were seeded in 12 well plates. After experimental conditions described in
section Cell culture and experimental conditions, cells were detached using PBS-EDTA (2 mM), washed
with PBS 1× and RNA extraction was carried out accordingly to manufacturer’s instructions of the
RNeasy® Mini Kit commercialized by QIAGEN™ [138] The obtained RNA was stored at -80oC.
ii. cDNA production
RNA concentration was determined based on absorbance at 260 nm, using a Nanodrop 2000 (Thermo
Scientific). RNA was used to obtain cDNA through a reverse transcriptase polymerase chain reaction
(RT-PCR). A volume of 7 µL of a solution containing 1 µg of RNA in bidistilled water (ddH2O) were
incubated with random hexamers (11034731001, Roche, 0.5 µL) at 70 oC for 10 min (denaturation).
Then the temperature was lowered to 4 oC and 12.5 µL of a mixture of Strand Buffer 5X (Y00146,
Invitrogen) (4 µL), 0.1M dithiothreitol (DTT) (Y00147, Invitrogen) (2 µL), 10mM deoxynucleotides
(dNTPs) mix (28-4065-22V, 28-4065-02V, 28-4065-12V and 28-4065-32V, GE Healthcare) (2 µL),
RNAse OUT™ Recombinant RNase Inhibitor 40 U/μl (10777-019, Invitrogen) (1 µL), Superscript II®
200 U/μl (18064-022, Invitrogen) (0.5 µL) and ddH2O (3 µL) was added to each sample. A Biometra®
UNO II thermocycler was used with the following cycle specifications: 42 oC for 90 min (cDNA synthesis),
75 oC for 15 min (inactivation) samples were then cooled down to 4 oC at which temperature samples
were kept for short-term (24 h-48 h) storage, for long-term storage samples were kept at -20 oC.
iii. PCR
Relative quantification real-time RT-PCR technique was used to quantify the RNA present in each
sample relative to an endogenous gene (expressed constitutively), the Hypoxanthine
phosphoribosyltransferase (HRPT) gene.
Relative quantification real-time RT-PCR was performed using Power SYBR® Green PCR Master Mix
(4367659, Applied Biosystems). The primers used for the genes of interest were the following: e-
cadherin (from SIGMA primer sequence: forward 5’ –CCACCAAAGTCACGCTGAATA and reverse 5’ -
GGAGTTGGGAAATGTGAGCAA), NAT8 (from SIGMA and primer sequence: forward 5’–
GGCTCCTTGTCACATCCGC and reverse 5’–GGTTCGAGGCAGCTTCAGC). HPRT (from SIGMA
primer sequence: forward 5’–TGACACTGGCAAAACAATGCA and reverse 5’–
GGTCCTTTTCACCAGCAGCT) was used as the endogenous reference gene. To each sample, a mix
of 3 µL of ddH2O, 0.5 µL of both reverse and forward primers and 4 µL of SYBR Green was added. A
total of 1 µL of sample (cDNA) was used. Samples were analysed in technical triplicates. A
LightCycler®480 II (Roche) was used with the following program: 2 min at 50 oC, 10 min at 95 oC, then
45 cycles of 15 s at 95 oC and 1 min at 60 oC, followed by 15 s at 95 oC, 15 s at 60 oC then continuous
denaturation at 95 oC. Final cooling 40 oC for 10 s.

27
d. Immunofluorescence microscopy
Cells were seeded in an 8 well-chambered slide system (Thermo Fisher) specific for staining and
microscopic examination. For the dedifferentiation – re-epithelization experiment, cells were seeded at
a density of 1×10³ cell/well. Experiments were performed in duplicate for the control and exposed to
TGF-β1 conditions and triplicates for the TGF-β1 (48 h) + CTRL (96 h) condition.
After exposure to experimental conditions media was discarded, cells were washed with PBS 1× and
then fixed with a solution of PBS- paraformaldehyde (PFA) (2%) – Glutaraldehyde (0.1%) for 10 min at
RT. Cells were once again washed with PBS 1× and permeabilized with PBS-BSA (0.1%) – Triton X
100 (1%) for 10 min at RT. Afterward, cells were washed with PBS 1 × and incubated with 50 µL of
primary antibody (anti-NAT8, ab197793, Abcam) diluted 1:100 in PBS-BSA (1%) overnight at 4 oC in an
orbital shaker set for slow agitation.
Cells were washed with PBS 1× 3 times for 5 min, and then incubated with 100 µL of the secondary
antibody Invitrogen™ Alexa Fluor™ 488 (A-11008, Thermo Fisher) diluted 1:1000 in PBS-BSA (1%) for
2 hours, under slow agitation and at RT. After incubation, cells were washed with PBS 1× 3 times for 5
min. Afterward, each sample was stained with 5 µL of VECTASHIELD mounting media with 4',6-
diamidino-2-phenylindole (DAPI, H-1200, VECTOR laboratories). Coverslips were placed on top of the
montage and sealed.
Finally, images were acquired using an inverted microscope (IX53, OLYMPUS), a fluorescence light
source (U-HGLGPS, OLYMPUS) and the CellSens software.
e. Statistical Analysis
Statistical analysis were performed by using one–way ANOVA with Dunnet’s post-test or two-way
ANOVA with Bonferroni’s post-test resorting to GraphPad Prism 5 (GraphPad Software). Statistical
significance was defined as p< 0.05.

28

29
4. Results
a. Dedifferentiation assay – TGF-β1 exposure and EMT induction
i. TGF-β1 exposure induces EMT
Cell dedifferentiation may play a part in the healing process of tubular cells. Dedifferentiation comprises
the acquisition of stem-like phenotype associated partial EMT [40], [49], [55], [56]. EMT represents a
common injury pathway independent of renal damage aetiology [27]. Hence, inducing EMT is a
meaningful representation progression of renal tubular injury. So, this section will address fine-tuning of
the experimental conditions for EMT induction by stimulation with TGF-β1.
To confirm successful EMT induction, a combination of EMT hallmarks should be assessed. In this work
the first approach was to analyse, by flow cytometry, the expression of VM and CK as markers of
mesenchymal and epithelial phenotypes [41], respectively. EMT would be confirmed by a shift from a
predominantly CK positive and VM negative (CK+VM-) population into a CK-VM+.
1. Experimental conditions assessment
a. 1% vs 10% fetal bovine serum comparison
In this first assay, TGF-β1 was added to medium supplemented with either 1% or 10% FBS and
exposure was prolonged up to 96 h. During the time-course VM and CK expression was evaluated every
24 h. The percentage of CK+VM-, CK-VM+ and CK+VM+ cells was assessed for each condition and is
presented (relative to control mean) in Figure 9.
1% FBS CK and VM expression
24 48 72 960
2
4
6
8
* **
**
Time (h)
Ce
lls in
su
bp
op
ula
tio
n
(re
lative
to
co
ntr
ol)
10% FBSCK and VM expression
24 48 72 960
2
4
6
8
CK+VM- CK-VM+ CK+VM+
***
***
*****
***
Time (h)
Ce
lls in
su
bp
op
ula
tio
n
(re
lative
to
co
ntr
ol)
Dedifferentiation assay
Figure 9 Dedifferentiation assay: Changes in cytokeratin (CK) and vimentin (VM) expression under TGF-β1 exposure. HK-2 cells were exposed to TGF-β1 (10 ng/mL) in media supplemented with either 1 or 10% of FBS. CK and VM expression was assessed by flow cytometry. CK+VM-, CK-VM+ and, CK+VM+ populations were quantified as percentage of cell count. Data are expressed as mean ± SEM relative to control group. Statistical analysis of data was performed using one-way ANOVA test with Dunnett’s post-test (* p<0.05, ** p<0.01, *** p<0.001, against 24h timepoint) (n=3-6) (vs. 24 h timepoint). FBS – Fetal Bovine Serum; TGF-β1 – Transforming growth factor β1;

30
Results positively indicate EMT induction as the TGF-β1 exposed group expressed significantly higher
amounts of VM.
In the 10% FBS supplemented condition, the TGF-β1 effect appears to be time-dependent as the
increase in CK-VM+ cells is progressive and sustained overtime. However, in the 1% FBS condition an
initial rise is observed but then followed by a drop in CK-VM+ expression (relative to control).
Additionally, a TGF-β1-independent increase in CK-VM+ cells when HK-2 cells were cultured under 1%
FBS (in the absence of TGF-β1) was observed which could possibly confound assessment of EMT (see
Annex a).
Moreover, cells exposed to TGF-β1 presented a clear enrichment of the CK-VM+ population particularly
at 10% FBS (p <0.01, two-way ANOVA with Bonferroni’s post-test vs. control group) after exposure to
TGF-β1 for 72 h. This tendency further increased in the next 24 h (p< 0.001)). Differently, under 1%
FBS a divergence in the percentage of CK-VM+ cells (control vs. TGF-β1 exposed) was only registered
following 96 h of exposure to TGF-β1 (p<0.01, see Annex a). All in all, differences between TGF-β1
treated and control groups were consistently more significant in the media supplemented with 10% FBS.
Moreover, as cells might resent prolonged serum deprivation [139], 10% FBS might be more permissive
of prolonged culture periods. As so, the 10% FBS supplementation was considered the most appropriate
choice for experimental conditions. Therefore, induction of EMT under 10% FBS was more thoroughly
characterized and culture time extended up to 144 h (as to allow the study of recovery in the 72 h
following 72 h TGF-β1 exposure) (Figure 10).

31
2. Cytokeratin and vimentin expression
Dedifferentiation assay (10% FBS) CK and VM expression
24 48 72 96 120 1440
5
10
15
CK+VM- CK-VM+ CK+VM+
***
******
*** ***
*****
*** ******
***
Time (h)
Ce
lls in
su
bp
op
ula
tio
n
(re
lative
to
co
ntr
ol)
Figure 10 Dedifferentiation assay: cytokeratin (CK) and vimentin (VM) expression under TGF-β1 exposure. HK-2 cells were exposed to TGF-β1 (10 ng/mL) in media supplemented with 10% of FBS. Expression of CK and VM was assessed by flow cytometry. CK+VM-, CK-VM+ and, CK+VM+ populations were quantified as percentage of cell count. Data are expressed as mean ± SEM and relative to control group (not exposed to TGF-β1). Statistical analysis of data was performed using one-way ANOVA test with Dunnett’s post-test (* p<0.05, ** p<0.01, *** p<0.001, against 24h timepoint) (n = 5-11) FBS – Fetal Bovine Serum; TGF-β1 - transforming growth factor β1.
Beyond 96 h of exposure to TGF-β1, the evolution of the CK-VM+ population continued in line with the
previous results and further increased (Figure 10), supporting the successful EMT induction. The CK-
VM+ population was more than five times higher in the TGF-β1 exposed condition after 96 h of
exposition and nearly 15 times higher after 144 h.
3. E-cadherin transcript expression
A hallmark of EMT is the loss of e-cadherin [133]. Therefore, changes in e-cadherin (at the mRNA level)
upon exposure to TGF-β1 were investigated by RT-PCR. An initial flow cytometry approach was
attempted to evaluate e-cadherin expression. However, results were inconclusive, possibly due to
optimization issues as antibody titration and the fact that the antibody was not indicated for flow
cytometry applications. Therefore, RT-PCR was employed. An additional advantage of this approach
was that it allowed to assess EMT at the transcriptional level. This was relevant since NAT8 transcription
was also investigated, and complemented the protein-level characterization (CK and VM) of EMT
induction. The results (relative to control group) are presented in Figure 11.

32
Figure 11 Dedifferentiation assay: hE-cadherin transcript under TGF-β1 exposure. HK-2 cells were exposed to TGF-β1 (10 ng/mL) in media supplemented with 10% of FBS. hE-cadherin transcript levels were quantified by RT-PCR (relative to endogenous reference HPRT). Data are expressed as mean ± SEM relative to control group. Statistical analysis of data was performed using one-way ANOVA test with Dunnett’s post-test (*** p< 0.001, vs. 24 h time-point) (n=4-8).TGF-β1 - transforming growth factor β1.
The reduction in e-cadherin is evident as transcript levels in the TGF-β1 exposed group are consistently
below control group (ratio <1). In fact, after the first 24 h of stimulus e-cadherin mRNA is nearly half of
control group (0.57 ± 0.01). The maximum effect was observed after 144 h of TGF-β1 exposure, when
e-cadherin level was 0.33 ± 0.04 (p<0.001 vs. 24 h) times the level of control group. This decline in e-
cadherin also validates EMT induction.
In spite of the overall decline in e-cadherin expression observed upon TGF-β1 exposure, the evolution
of e-cadherin transcript levels seems to go through two stages. First, there is initial drop detectable as
early as after 24 h of TGF-β1 exposure. Then the levels increase until 72 h of exposure. Beyond 96 h
of exposure, there is an accentuated decrease in e-cadherin transcript.
4. Morphology assessment
Assessment of characteristic morphological alterations is also a used as a common indicator of EMT.
Upon TGF-β1 exposure, cells became more elongated (Figure 12, bottom row) and switched from a
cobblestone-like morphology (characteristic of HK-2 cell line) to a spindle-like morphology characteristic
of a mesenchymal phenotype.
Dedifferentiation assay:
hE-cadherin transcript expression
24 48 72 96 120 1440.0
0.5
1.0
1.5
***
***
Time (h)
hE
-ca
dh
eri
ntr
an
scri
pt
exp
ressio
n
(re
lative
to
co
ntr
ol)

33
Figure 12 Dedifferentiation assay: bright field microscopy imaging of HK-2 cells exposed to TGF-β1. HK-2 cells were exposed to TGF-β1 (10 ng/mL) in media supplemented with 10% FBS. Cell morphology was registered at 24 h intervals by bright field microscopy (magnification x 400). TGF-β1 - transforming growth factor β1.
5. Result summary
Overall, stimulating HK-2 cells with TGF-β1 (10 ng/mL) in media supplemented with 10% FBS for a
period of 72 h succeeded to initiate EMT (in agreement with previous reports [38], [130]). This was
validated by a rise in VM expression, loss in e-cadherin and CK and by the acquisition of spindle-like
morphology. The shift towards a more mesenchymal phenotype appears to be a gradual and time-
dependent process. However, EMT gains evident emphasis beyond 96 h.
ii. EMT correlates with loss of NAT8
The main interest when setting up this model was to clarify whether NAT8 was involved in
dedifferentiation. Since this is conceivably part of the injury/recovery mechanism of renal tubular cells,
a link between dedifferentiation and relevant changes in NAT8 could support its involvement in the
mechanism that dictate renal injury outcome. Thus in this section, the expression of NAT8 throughout
the TGF-β1 exposure time-course was investigated.
1. NAT8 - transcript expression
The transcript levels of NAT8 overtime were assessed by RT-PCR. This revealed that TGF-β1 induced
EMT is associated with a decrease in NAT8 expression as shown in Figure 13. In fact, from 48 h under
TGF-β1 onwards NAT8 transcript levels remain consistently below those of the control group. As a
matter of fact, there is an initial reduction in NAT8 at 48 h (0.71 ± 0.02), which is briefly followed by a
transient rise at 72 h (0.89 ± 0.10). However, evident decrease in NAT8 transcription occurred at 96 h
under TGF-β1 (0.64 ± 0.08) and is sustained until the end of the assay (0.42 ± 0.05, p<0.05 vs. 24 h).
Remarkably, the 96 h also seems to be the exposure time at which EMT indicators become considerably
more pronounced.

34
Figure 13 Dedifferentiation assay: NAT8 transcript levels under TGF-β1 exposure. HK-2 cells were exposed to TGF-β1 (10 ng/mL) in media supplemented with 10% of FBS. NAT8 transcript levels were quantified by RT-PCR (relative to endogenous reference HPRT). Data are expressed as mean ± SEM relative to control group. Statistical analysis of data was performed using one-way ANOVA test with Dunnett’s post-test (* p<0.05 vs. 24 h time-point) (n= 3-6) TGF-β1 - transforming growth factor β1.
2. Immunofluorescence
HK-2 cells exposed to TGF-β1 were labelled with a primary antibody (with affinity towards NAT8) and
then with an immunofluorescent antibody. This allowed characterization of NAT8 protein expression and
distribution at subcellular level, as can be observed in Panel b. Although no co-localization validation
was carried out, the results displayed are consistent with endoplasmic reticulum localization (reticular
and denser close to the nucleus) [140]. Moreover, at each time-point staining appears to be fainter in
HK-2 cells treated with TGF-β1 when compared control. Besides, within visual fields corresponding to
TGF-β1 exposed condition (bottom row), cells with a more mesenchymal appearance (that is the more
elongated cells) seem to show fainter staining, that is lower expression of NAT8, than the more
cobblestone-like cells of that same picture
Dedifferentiation assay:
NAT8 transcript expression
24 48 72 96 120 1440.0
0.5
1.0
1.5
**
Time (h)
NA
T8
tra
nscri
pt
exp
ressio
n
(re
lative
to
co
ntr
ol)

35
Panel b Dedifferentiation assay: indirect immunofluorescence imaging of HK-2 cells exposed to TGF-β1. HK-2 cells were exposed to TGF-β1 (10 ng/mL) in media supplemented with 10% FBS. NAT8 immunostaining (in green) and fluorescence microscopy imaging acquisition (magnification x 600) are presented. Images are representative of two biological duplicates (in blue: nuclear staining, DAPI). Control condition with omission of primary antibody showed no staining. TGF-β1 - transforming growth factor β1.
Fluorescence of several visual fields was quantified using imaging software (ImageJ, SciJava) and
results are presented in Figure 14. These further support what the images in Panel b suggested: NAT8
expression is decreased upon exposure to TGF-β1. Immunofluorescence imaging is not a quantitative
technique per se so this analysis has only limited value. Nonetheless, it would indicate the change in
NAT8 expression attained at 144 h (0.38 ± 0.05) to be significant (p<0.01, vs. 48 h Figure 14).
Figure 14 Dedifferentiation assay: quantification of NAT8 expression under TGF-β1 exposure (from immunofluorescence imaging data). HK-2 cells were exposed to TGF-β1 (10 ng/mL) in media supplemented with 10% of FBS. Images resulting from NAT8’s immunolabelling were analysed and fluorescence quantified using image analysis software (ImageJ, SciJava). Data are expressed as mean ± SEM relative to control group. Statistical analysis of data was performed using one-way ANOVA test with Dunnett’s post-test (** p<0.01 vs. 48 h time-point) (n=2) TGF-β1 - transforming growth factor β1.
This is consistent with NAT8 transcript levels, which are decreased upon exposure to TGF-β1 (as seen
in the previous section). Inclusively, the initial shift in transcription of NAT8 (decline in NAT8 followed by
temporary recovery at 72 h) seems to be patent in the protein expression as well, albeit delayed.
48 72 96 1440.0
0.5
1.0
1.5
**
Dedifferentiation assay: NAT8 expression(immunofluorescence)
Time (h)
NA
T8
exp
ressio
n
(CT
CF
re
lative
to
co
ntr
ol)

36
These results collectively indicate that dedifferentiation is associated with a decrease in NAT8. However,
it would appear that just before dedifferentiation is firmly established, a transient intensification in NAT8
expression occurs.
b. Re-epithelization assay – TGF-β1 withdrawal and re-
epithelization
Culture medium was supplemented with TGF-β1 to induce dedifferentiation, which is postulated to
happen in tubular cell upon injury. However, the kidney reportedly has a high endogenous recovery
capacity possibly mediated by a dedifferentiation – re-epithelization axis. This means that
dedifferentiated cells might have the capacity to return to the epithelial phenotype. To capture this
phenomenon in this in vitro experimental setup, HK-2 cells were exposed to TGF-β1 for periods shown
to disturb epithelial phenotype (48 and 72 h) and then TGF-β1 supply was arrested and media replaced
with fresh culture media. The assay was prolonged up to144 h (48 h TGF-β1 (dedifferentiation) + 96 h
control (re-epithelization) or 72 h TGF-β1 + 72 h control ).
i. TGF-β1 withdrawal and the reversion of the mesenchymal–like
phenotype
1. Cytokeratin and Vimentin expression
As stated before, CK expression is indicative of an epithelial phenotype and increased VM expression
is characteristic of EMT. It was observed that TGF-β1 withdrawal led to the recovery of CK expression
alongside with loss of VM. With expression of CK and VM progressing towards values more close to the
control, as may be confirmed in Panel c. This was true following both 48 h and 72 h-long exposure
periods. In fact, following 72 h in TGF-β1-free conditions the expression of VM fell to values below those
observed if cells were kept under continuous TGF-β1-exposure.

37
Panel c Re-epithelization assay: cytokeratin (CK) and vimentin (VM) expression following exposure to TGF-β1. (A) HK-2 cells were first exposed to TGF-β1 for 48 h and then either cultured for 96 h in either TGF-β1 free-media (orange line, n= 2-3) or continuously exposed to TGF-β1 (black line). (B) HK-2 cells were first exposed to TGF-β1 for 72 h and then cultured for 72 h in either TGF-β1 free-media (green line, n= 4-5) or continuously exposed to TGF-β1 (black line). Expression of CK and VM was assessed by flow cytometry. CK+VM-, CK-VM+ and, CK+VM+ populations were quantified as percentage of cell count. Data are expressed as mean ± SEM and relative to control group (not exposed to TGF-β1). Statistical analysis of data was performed using two-way ANOVA with Bonferroni’s post-test (* p<0.05, ** p<0.01, *** p<0.001, vs. TGF-β1) TGF-β1 – Transforming growth factor-β1
Although reversal of the mesenchymal phenotype appears to unfold in both conditions, it seems to be
more pronounced following the 48 h long exposure to TGF-β1. Since, as seen in Panel c (A) there is a
return of VM expression much closer to basal level (1.49 ± 0.05, p<0.001 vs. TGF-β1 exposed group)
than following 72 h under TGF-β1 (Panel c, B). In this condition, 72 h after TGF-β1 withdrawal, the
proportion CK-VM+ remains somewhat above that of control group (5.01 ± 0.45, p<0.001 vs. TGF-β1
exposed group).
As it can be observed in the sequence of 72 h TGF-β1 injury, it takes 48 h after TGF-β1 removal before
CK-VM+ population is brought below the level of continuous exposure (120 h, Panel c B). In the case
of 48 h TGF-β1 stimulation, this only occurred after 72 h in the absence of TGF-β1 (120 h, Panel c A).
This might indicate that the recovery from 72 h-long injury occurs more rapidly. In addition, CK+VM-
population is already significantly increased 72 h after TGF-β1 withdrawal in the TGF-β1 (72 h) + CTRL
(72 h) condition, whereas it takes 96 h for this in the sequence of a 48 h pulse.
2. E-cadherin transcript expression
Increase of e-cadherin expression upon TGF-β1 withdrawal is also consistent with recovery of epithelial
phenotype [119], [133]. After TGF-β1 withdrawal e-cadherin expression appears to shift towards control
level and away from the inhibited expression observed in the TGF-β1 group. This is patent in Panel d.
CK+VM-
96 120 1440.0
0.5
1.0
1.5
*
**
Time (h)
CK
+V
M-
ce
lls
(re
lative
to
co
ntr
ol)
CK-VM+
96 120 1440
5
10
15
20
TGF-1 TGF-1 (72h) + CTRL (72h)
******
Time (h)
CK
-VM
+ c
ells
(re
lative
to
co
ntr
ol)
CK+VM+
96 120 1440
1
2
3
4
***
**
**
Time (h)
CK
+V
M+
ce
lls
(re
lative
to
co
ntr
ol)
Re-epithelization assay: VM and CK expression
CK+VM-
96 120 1440.0
0.5
1.0
1.5
*
Time (h)
CK
+V
M-
ce
lls
(re
lative
to
co
ntr
ol)
CK-VM+
96 120 1440
5
10
15
20
TGF-1 TGF-1 (48h) + CTRL (96h)
*** ***
Time (h)
CK
-VM
+ c
ells
(re
lative
to
co
ntr
ol)
CK+VM+
96 120 1440
1
2
3
4
*** ***
**
Time (h)
CK
+V
M+
ce
lls
(re
lative
to
co
ntr
ol)
B
A

38
Panel d Re-epithelization assay: hE-cadherin transcript levels. (TOP) HK-2 cells were first exposed to TGF-β1 (10 ng/mL) for 48 h and then cultured for 96h in either TGF-β1 free-media (orange line, n= 2-3) or continuously exposed to TGF-β1 (black line). (BOTTOM) HK-2 cells were first exposed to TGF-β1 for 72 h and then cultured for 72 h in either TGF-β1 free-media (green line, n = 4-6) or continuously exposed to TGF-β1 (TGF-β1, black line). hE-cadherin transcript levels were quantified by RT-PCR (relative to endogenous reference HPRT). Data are expressed as mean ± SEM and relative to control group. Statistical analysis of data was performed using two-way ANOVA test with Bonferroni’s post-test (* p< 0.05, ** p<0.01, *** p<0.001, vs. TGF-β1) (TGF-β1 – Transforming growth factor – β1)
Attending to this indicator, 48 h long exposure seems to be followed by both faster and more pronounced
recovery. For instance, 72 h after TGF-β1 arrest in the TGF-β1 (48 h) + CTRL (96h) cells already express
e-cadherin at elevated level (0.59 ± 0.00, p<0.05, vs. TGF-β1 (144 h)). This was not possible to observe
in the 72 h exposure group.
3. Morphology assessment
Cells exposed to TGF-β1 present a spindle-like morphology, whereas cells in the control group have a
cobblestone-like appearance. Upon withdrawal of TGF-β1, the number of elongated cells seems to
decrease and cells regain a morphology closer to that of the control group, which can be seen in Figure
15. This supports the interpretation that a reversal of the EMT process is taking place.
72 96 120 1440.0
0.5
1.0
1.5
TGF-1 (144h)
** *
***
TGF-1 (48h) + CTRL (96h)
Time (h)
hE
-ca
dh
eri
n t
ran
scri
pt
exp
ressio
n
(re
lative
to
co
ntr
ol)
96 120 1440.0
0.5
1.0
1.5
TGF-1 (144h) TGF-1 (72h) + CTRL (72h)
Time (h)
hE
-ca
dh
eri
ntr
an
scri
pt
exp
ressio
n
(re
lative
to
co
ntr
ol)
Re-epithelization assay: hE-cadherin transcript expression

39
4. Results summary:
Withdrawal of TGF-β1 after 48 or 72 h long exposures is followed by a recovery of the epithelial
phenotype as assessed by decrease in VM expression, up-regulation of e-cadherin expression (and
CK) and supported by morphology changes.
Moreover, the more prolonged the exposure to TGF-β1, the less effective seems to be the recovery of
epithelial phenotype. Supporting that, not surprisingly, longer exposure to TGF-β1 inflicts more severe
damage to cells.
ii. TGF-β1 withdrawal induces changes in NAT8 expression
Given the intention to study the expression of NAT8 through recovery from epithelial damage, transcript
and protein levels of NAT8 in the time following TGF-β1 withdrawal were investigated.
1. NAT8 – transcript expression
Expression of NAT8 is presented in Panel e. The expression levels of this gene seem to go through two
different phases during injury recovery. First, there was a drop in NAT8 transcript level further below
that of HK-2 cells continuously exposed to TGF-β1 (Panel e). In the sequence of a 48 h TGF-β1 pulse
this reduction in NAT8 transcription particularly accentuated 72 h after TGF-β1 withdrawal. Then, there
Figure 15 Re-epithelization assay: bright field microscopy imaging of HK-2 cells following 48 h (third row) or 72 h (bottom) long exposure to TGF-β1. HK-2 cells were first exposed to TGF-β1 for 48 h (third row) or 72 h (bottom) and then cultured for 72 h or 96 h in either TGF-β1 free-media or continuously exposed to TGF-β1 (second row). During that period cell morphology was registered by bright field microscopy (magnification x 400).

40
is a marked shift and NAT8 transcription markedly increases (1.67 ± 0.11, p<0.001 vs. TGF-β1 exposed
group). Following, 72 h injury the behaviour is similar although not as intense, a decrease after 48 h in
TGF-β1 free conditions and a subsequent increase (0.87± 0.13).
Panel e Re-epithelization assay: NAT8 transcript levels. (Left) HK-2 cells were first exposed to TGF-β1 (10 ng/mL) for 48 h and then cultured for 96 h in either TGF-β1 free-media (orange line, n= 2-3) or continuously exposed to TGF-β1 (black line) (Right) HK-2 cells were first exposed to TGF-β1 for 72 h and then cultured for 72 h in either TGF-β1 free-media (green line, n= 4-6) or continuously exposed to TGF-β1 (TGF-β1, black line). NAT8 transcript levels were quantified by RT-PCR (relative to endogenous reference HPRT). Data are expressed as mean ± SEM and relative to control group. Statistical analysis of data was performed using two-way ANOVA test with Bonferroni’s post-test (* p< 0.05, ** p<0.01, *** p<0.001, vs. TGF-β1) (TGF-β1 – Transforming growth factor – β1)
2. Immunofluorescence
Panel f and Figure 16 characterize the expression of NAT8 protein in HK-2 cells cultured under normal
conditions after being exposed to TGF-β1 for 48 h (orange line). In this condition, after 96 h after TGF-
β1 is withdrawn, the EMT would be fully reversed. Accordingly, it can be observed that at that time NAT8
expression (0.88 ± 0.08, p<0.001 vs. TGF-β1 exposed group) is very similar to control level (Figure 16).
However, there was a latency period before the rise in NAT8 effectively occurs. Ultimately, recovery of
epithelial phenotype is associated with rescue of NAT8. But, this only seem be true at a later stage of
recovery.
72 96 120 1440.0
0.5
1.0
1.5
2.0
TGF-1 (144h)
***
TGF-1 (48h) + CTRL (96h)
*
Time (h)
NA
T8
tra
nscrip
t e
xp
ressio
n
(re
lative
to
co
ntr
ol)
96 120 1440.0
0.5
1.0
1.5
TGF-1 (144h) TGF-1 (72h) + CTRL (72h)
Time (h)N
AT
8tr
an
scrip
t e
xp
ressio
n
(re
lative
to
co
ntr
ol)
Re-epithelization assay: NAT8 transcript expression

41
Panel f Re-epithelization assay: NAT8 indirect immunofluorescence imaging of HK-2 cells. HK-2 cells were first exposed to TGF-β1 (10 ng/mL) for 48 h and then cultured for 96 h in either TGF-β1 free-media or continuously exposed to TGF-β1. NAT8 immunostaining (in green) and fluorescence microscopy imaging acquisition (magnification x 600) are presented. Images are representative of two biological duplicates (in blue: nuclear staining, DAPI). Control condition with omission of primary antibody showed no staining. TGF-β1 - transforming growth factor β1.

42
Figure 16 Re-epithelization assay: quantification of NAT8 expression under TGF-β1 exposure (from immunofluorescence imaging data). HK-2 cells were first exposed to TGF-β1 (10 ng/mL) for 48 h and then cultured for 96h in either TGF-β1 free-media (orange line, n=2-3) or continuously exposed to TGF-β1 (black line). Images resulting from immunolabelling of NAT8 were analysed and fluorescence quantified using image analysis software (ImageJ, SciJava). Data are expressed as mean ± SEM relative to control group. Statistical analysis of data was performed using one-way ANOVA test with Dunnett’s post-test (*** p<0.001 vs. 48 h time-point). TGF-β1 - transforming growth factor β1;
c. MSC-CM treatment assay – impact in cell recovery
MSCs have been used in the treatment of renal injury and are postulated to promote PTEC‘s
endogenous repair mechanisms. Reportedly, their therapeutic effects are due to paracrine effects. The
experimental setup established here could be used to monitor the paracrine effects of MSC by adding
MSC-CM to culture following initial injury.
i. MSC-CM potentiates restitution of epithelial phenotype
HK-2 cells exposed to TGF-β1 (10 ng/mL) for 72 h, were further cultured under TGF-β1 free medium
supplemented with 30% MSC-CM. The choice of MSC-CM percentage was based on a 96 h long
exposure of HK-2 cells to different percentages of MSC-CM to investigate normal growth.
1. Cytokeratin and vimentin expression
Panel g compares the two recovery scenarios; in normal media (green line) or in MSC-CM
supplemented medium (dark blue line). It was observed that the reversion of the mesenchymal
phenotype is more effective in the presence of MSC-CM (30%) as there was a more rapid shift towards
a CK+VM- phenotype characteristic of epithelial cells. Also, in every time point investigated the MSC-
CM treated group was consistently associated with less CK-VM+ cells as can be observed in Panel g
(3.65 ± 0.09 with MSC-CM compared to 7.01 ± 0.95 without MSC-CM after 24h in the absence of TGF-
β1).
48 72 96 1440.0
0.5
1.0
1.5
TGF-1 (144h) TGF-1 (48h) + CTRL (96h)
***
Re-epithelization assay: NAT8 expression(immunofluorescence)
Time (h)
NA
T8
exp
ressio
n
(CT
CF
re
lative
to
co
ntr
ol)

43
Panel g MSC-CM treatment assay: cytokeratin (CK) and vimentin (VM) expression following exposure to TGF-β1. HK-2 cells were first exposed to TGF-β1 for 72 h and then cultured for 72 h in either TGF-β1 free-media (green line), TGF-β1 free media supplemented with MSC-CM (30%) (dark blue line, n=2-3) or continuously exposed to TGF-β1 (black line). During that period CK and VM expression was assessed (flow cytometry. Data are expressed as mean ± SEM and relative to control group mean. Statistical analysis of data was performed using two-way ANOVA test with Bonferroni’s post-test (* p< 0.05, ** p<0.01, *** p<0.001,
vs. TGF-β1 and ## p<0.01 vs. TGF-β1 (72 h) + CTRL (72 h)) TGF-β1 – Transforming growth factor – β1.
This is consistent with MSC-CM exerting a promotive effect on the re-epithelization process.
However, following 72 h of TGF-β1 exposure, administration of MSC-CM (30%) without removal of TGF-
β1 did not reverse changes in VM and CK expression (as can be seen in Panel h). In fact, there is an
apparent increase in VM expression when MSC-CM (30%) is introduced together with TGF-β1, although
not statically significant (17.46 ± 0.14 with MSC-CM compared to 14.56 ± 0.78 without MSC-CM after
144 h of continuous TGF-β1 stimulation).
Panel h MSC-CM treatment assay: cytokeratin (CK) and vimentin (VM) expression following exposure to TGF-β1 and co-exposure to MSC-CM (30%). HK-2 cells were first exposed to TGF-β1 for 72 h and then cultured for 72 h in either media supplemented with both TGF-β1 (10 ng/mL) and MSC-CM (30%) (light blue line) or continuously exposed to TGF-β1 (black line). During that period CK and VM expression was assessed (flow cytometry). Data are expressed as mean ± SEM and relative to control group mean. Statistical analysis of data was performed using a two-way ANOVA test with Bonferroni post-test (* p<0.05, ** p<0.01, *** p<0.001 vs. TGF-β1)(n=2-3) (TGF-β1 – Transforming growth factor – β1).
2. E-cadherin transcript expression
Accordingly, adding MSC-CM (30%) to the media, post TGF-β1 withdrawal stimulated recovery of e-
cadherin transcript levels. This recovery was more complete (p< 0.01) after 72 h in TGF-β1 free
CK+VM-
96 120 1440.0
0.5
1.0
1.5
*
*** ## *
Time (h)
CK
+V
M-
ce
lls
(re
lative
to
co
ntr
ol)
CK-VM+
96 120 1440
5
10
15
20
TGF-1 TGF-1 (72h) + CTRL (72h)
TGF-1 (72h) +MSC-CM (72h)
*** ***
Time (h)
CK
-VM
+ c
ells
(re
lative
to
co
ntr
ol)
CK+VM+
96 120 1440
1
2
3
4
*****
Time (h)
CK
+V
M+
ce
lls
(re
lative
to
co
ntr
ol)
MSC-CM treatment: VM and CK expression
CK+VM-
96 120 1440.0
0.5
1.0
1.5
Time (h)
CK
+V
M-
ce
lls
(re
lative
to
co
ntr
ol)
CK-VM+
96 120 1440
5
10
15
20
TGF-1 TGF-1 (MSC-CM)
Time (h)
CK
-VM
+ c
ells
(re
lative
to
co
ntr
ol)
CK+VM+
96 120 1440
1
2
3
4
***
*****
Time (h)
CK
+V
M+
ce
lls
(re
lative
to
co
ntr
ol)
MSC-CM treatment: VM and CK expression

44
conditions suplemented with MSC-CM (0.80 ± 0.01, Panel i, dark blue line) when compared with
recovery under standard culture conditions (0.46 ± 0.04, Panel i, green line).
Panel i MSC-CM treatment assay: hE-cadherin transcript levels. (TOP)HK-2 cells were first exposed to TGF-β1 (10 ng/mL) for 72 h and then cultured for 72 h in either TGF-β1 free-media (green line), TGF-β1 free media supplemented with MSC-CM (30%) (dark blue line) or continuously exposed to TGF-β1 (black line) (n=2-3). (BOTTOM) HK-2 cells were first exposed to TGF-β1 for 72 h and then cultured for another 72 h in either media supplemented with both TGF-β1 (10 ng/mL) and MSC-CM (30%) (light blue line) or continuously exposed to TGF-β1 (TGF-β1, black line) (n=2-3)). hE-cadherin transcript level was quantified by RT-PCR (relative to endogenous reference HPRT). Data are expressed as mean ± SEM and relative to control group. Statistical analysis of data was performed using a two-way ANOVA test with Bonferroni’s post-test (** p<0.01, *** p<0.001, vs. TGF-β1 and # p<0.05, ### p<0.001, vs, TGF-β1 (72 h) + CTRL (72 h) TGF-β1 – Transforming growth factor – β1.
Co-exposure to TGF-β1 and MSC-CM (30%) preceded by a 72 h pulse of TGF-β1 (10 ng/mL) also led
to a significant increase in e-cadherin (0.51 ± 0.01) comparing to continuous exposure (0.33 ± 0.12
p<0.01). Additionally, at the end of the assay (144 h), this recovery in e-cadherin expression was
comparable to that observed when TGF-β1 withdrawal is followed by culture under standard conditions
(0.46 ± 0.04, green line in Panel i bottom).
96 120 1440.0
0.5
1.0
1.5
***###
#
TGF-1 TGF-1 (72h) + CTRL (72h)TGF-1 (72h) + MSC-CM (72h)
Time (h)
hE
-ca
dh
eri
n t
ran
scri
pt
exp
ressio
n
(re
lative
to
co
ntr
ol)
96 120 1440.0
0.5
1.0
1.5
TGF-1 (72h) + CTRL (72h)
**
###
TGF-1 TGF-1 (MSC-CM)
Time (h)
hE
-ca
dh
eri
n t
ran
scri
pt
exp
ressio
n
(re
lative
to
co
ntr
ol)
MSC-CM treatment: hE-cadherin transcript level

45
3. Morphology assessment
Morphologic changes resulting from TGF-β1 administration (flattening and elongation) appear to be
more promptly reverted when MSC-CM is added to the medium as can be observed in Figure 17. In
fact, MSC-CM supplementation after a 72 h insult seems to recover the cobblestone morphology
independently of whether or not TGF-β1 administration is arrested.
Figure 17 MSC-CM treatment assay: bright field microscopy imaging of HK-2 cells following 72 h long exposure to TGF-β1. HK-2 cells were first exposed to TGF-β1 for 72 h and then cultured for 72 h in either TGF-β1 free-media (third column), TGF-β1 free media supplemented with MSC-CM (30%) (fourth column) or continuously exposed to TGF-β1 (last column). Cell morphology was registered by bright field microscopy (magnification x 400). TGF-β1 – Transforming growth factor β1;
4. Results summary
If MSC-CM treatment comes in the sequence of TGF-β1 withdrawal then, this successfully alters CK
and VM expression, e-cadherin transcript expression and morphology. As all these markers showed
pronounced recovery of epithelial phenotype when MSC-CM was supplemented. Also, re-epithelization
under MSC-CM (30%) supplementation was more effective than under normal culture conditions.
MSC-CM treatment under continuous exposure to TGF-β1 is associated with a less evident return to
epithelial phenotype. There was a significant recovery of morphology and e-cadherin expression to
levels comparable to TGF-β1 withdrawal. However, this was not observed for recovery of CK and VM
epithelial expression.
On the whole, there seems to be a more efficient progression towards a more epithelial-like expression
in the presence of MSC-CM (30%) thus supporting a healing role for MSC-CM.
ii. MSC-CM treatment alters NAT8’s expression
NAT8 and MSC-CM have been suggested as renoprotective [94], [114] and evidence supports that
NAT8 might underlie the therapeutic effect of MSCs in liver recovery [123].In line with the previously laid
out approach changes in NAT8 expression in association with MSC-CM treatment were investigated.

46
1. NAT8 transcript expression
It was previously observed that continued exposure to TGF-β1 was associated with a decrease in NAT8
transcript expression. Also, upon TGF-β1 withdrawal, the NAT8 transcript levels presented a declining
tendency in the initial timepoints and then recover. Here it was observed that if MSC-CM is
supplemented to the media at the time of TGF-β1 withdrawal no evident recovery of NAT8 seems to
take place Panel j (left), consistent with what was observed recovery under normal culture conditions
72 h TGF-β1 + 72 h CTRL. However, a completely different scenario is observed when MSC-CM is
added to the media but the injury stimulus is not withdraw. In fact, MSC-CM supplementation in
combination with TGF-β1 (in the sequence of 72 h exposure to TGF-β1 (10 ng/mL)) will restore NAT8
transcript level nearly to baseline levels (0.92 ± 0.03, Panel j right). Once again, adding MSC-CM (30%)
had a similar effect in NAT8 transcription as TGF-β1 withdrawal (0.81 ± 0.01 after 72h with MSC-CM
and TGF-β1 compared to 0.87 ± 0.13 if recovery under control conditions).
96 120 1440.0
0.5
1.0
1.5
TGF-1 TGF-1 (72h) + CTRL (72h)
TGF-1 (72h) + MSC-CM(72h)
#
Time (h)
NA
T8
tra
nscri
pt
exp
ressio
n
(re
lative
to
co
ntr
ol)
96 120 1440.0
0.5
1.0
1.5
TGF-1 TGF-1 (72h) + CTRL (72h)
TGF-1 (MSC-CM)
*##
Time (h)
NA
T8
tra
nscri
pt
exp
ressio
n
(re
lative
to
co
ntr
ol)
MSC-CM treatment assay: NAT8 transcript expression
Panel j MSC-CM treatment assay: NAT8 transcript levels. (left) HK-2 cells were first exposed to TGF-β1 (10 ng/mL) for 72 h and then cultured for 72 h in either TGF-β1 free-media (green line), TGF-β1 free media supplemented with MSC-CM (30%) (dark blue line, n= 2-3) or continuously exposed to TGF-β1 (black line). (right) HK-2 cells were first exposed to TGF-β1 for 72 h and then cultured for another 72 h in either TGF-β1 free-media (green line), or media supplemented with both TGF-β1 (10 ng/mL) and MSC-CM (30%) (light blue line) n= 2-3) or continuously exposed to TGF-β1 (TGF-β1, black line). NAT8 transcript level was quantified by RT-PCR (relative to endogenous reference HPRT). Data are expressed as mean ± SEM and relative to control group. Statistical analysis of data was performed using two-way ANOVA test with Bonferroni’s post-test (* p<0.05, vs. TGF-β1 and # p<0.05, ## p<0.01, vs. TGF-β1 (72 h) + CTRL (72 h)). TGF-β1 – Transforming growth factor – β1.

47
5. Discussion
a. Result analysis
Results from this work suggest a role for N-acetyltransferase 8 in the maintenance of the regenerative
capacity of tubular epithelial cells undergoing injury induced dedifferentiation.
The first indication in this sense was that an initial dedifferentiation stage is associated with a transient
increase in NAT8. Available reports suggest that TECs dedifferentiate upon injury and acquire a
proliferative, anti-apoptotic and regenerative phenotype. This phenotype is characterized by an
increased expression of markers, including VM [31], [40], [52] and such population is believed to
mediated tubular recovery [31], [52]. In parallel, expanding evidence from studies dedicated to EMT
mechanism support that cells undergoing EMT go through different stages: epithelial, partial EMT
(pEMT) and mesenchymal phenotype. Partial EMT is described as a reversible phenotype characterized
by co-expression of epithelial and mesenchymal features [42]. This reversible phenotype attained at
initial EMT could correspond to the regenerative phenotype uncovered in the previously mentioned
kidney regeneration studies [40], [52], [56]. In this work, TGF-β1, a growth factor tied to kidney injury
and a well-established EMT driver, was administered as an injury stimulus to TECs (HK-2). In this
manner, the dedifferentiation was successfully induced as observed by a rise in VM expression (Figure
10), loss in e-cadherin (Figure 11) and CK (Figure 10) and acquisition of spindle-like morphology
(Figure 12). The shift towards a more mesenchymal/dedifferentiated phenotype appears to be a time-
dependent process, with cells presenting a phenotype increasingly different from the epithelium. In fact,
signs of EMT are established within the first 48 h of TGF-β1 exposure. These signs become more
significant in the next 48 h and remarkably accentuate at 120 h of exposure (Figure 10 and Figure 11).
Moreover, the period of established but not marked dedifferentiation (from 48 h to 96 h of exposure), is
characterized by a significant increase in the double positive CK+VM+ population and the expression of
both epithelial and mesenchymal markers is consistent with a partial EMT stage (pEMT) [39], [42].
Remarkably, it is during this period that a transient rise in NAT8 expression is observed both considering
transcript level (Figure 13, observed at 72 h) and estimated protein level (around 96 h, Figure 14). In
spite of presenting a transient recovery, NAT8 expression under injury is consistently found below basal
levels. This behaviour is consistently patent in both mRNA and protein assays strengthening this
evidence. It is possible that cells recover NAT8 expression during initial dedifferentiation or, it might also
be that upon injury, a given subset of cells that are either more resistant to injury or that are capable to
retain NAT8 expression will prevail (Figure 18, dotted line). Another aspect to consider is that there
might be a cellular subpopulation is never able to recover NAT8 expression. This may correspond to a
more vulnerable population that would more promptly progress towards a fibrotic phenotype (Figure 18,
dotted line). Some studies found abrogation of EMT to prevent fibrosis and suggest it as a possible
therapeutic approach [38]. However, the positive outcomes, obtained when blocking EMT, might be
associated with this vulnerable subpopulation being spared from becoming fibrotic when EMT was

48
inhibited. But the application of EMT abrogation as therapy would overlook a possible role for properly
balanced EMT (pEMT) in regeneration[49], [52], as suggested in this work.
Besides, the hypothesized importance of NAT8 for the dedifferentiated cell population is further
supported by the fact that the escalation in dedifferentiation is accompanied with an intensification in
NAT8 loss. When prolonging the exposure for over 96 h, the expression of VM is accentuated (Figure
10) together with consolidated and intensified decrease expression of epithelial markers (Figure 10,
Figure 11). From that point on, NAT8 transcription follows a significant decreasing tendency (as can be
seen in Figure 13). Leading to a markedly reduced expression of NAT8 after a 144 h long exposure
(Figure 14).
This suggests that initial differentiation, tied to regenerative potential, is associated with a transient rise
in expression of NAT8. Conversely, EMT escalation, associated with progression to an irreversible and
pro-fibrotic phenotype, is accompanied by NAT8 loss (Figure 18).
Figure 18 Dedifferentiation – Profile of NAT8 progression in association along with described phenotypes. The dotted line represents a possible path for a smaller population of cells. Initially, some cells may retain NAT8 expression without ever experiencing a decrease in its levels. Also, upon mild injury it is possible that not all cells are capable to recover NAT8 expression. More fragile cells may directly proceed towards a degenerative pathway.
In the kidney, the dedifferentiated cell population is suggested to mediate regeneration by reverting to
terminally differentiated tubular epithelial and thus achieving functional recovery [40], [49], [52]. Here,
re-epithelization was modelled by exposing cells to TGF-β1 (for 48 or 72 h) and then withdrawing TGF-
β1 and proceeding to culture cells under normal media for the remaining time of the assay (which was
extended up to 144 h, 48 h + 96 h or 72 h + 72 h). This was similar to experiments previously performed
in another study [119]. By doing so, re-epithelization was successfully induced following both stimulation
periods; since injury arrest was followed by a recovery of the epithelial phenotype. This is supported by
the decrease in VM expression (Panel c), the up-regulation of e-cadherin expression (Panel d and CK,
Panel c) and by the morphological changes (Figure 15) observed.
NAT8 has been hypothesized to be protective for kidney [114], [119] and liver [123]. Therefore, an
acceptable hypothesis would be that NAT8 could promote re-epithelization. However, transcription
levels suggested otherwise, in both injury scenarios (48 h and 72 h pulses) TGF-β1 withdrawal was

49
immediately followed by a decrease in NAT8 transcript expression (Panel e). Nonetheless, at the end
of the assay (144 h), cells exposed to a 48 h-long injury achieved a significant recovery of epithelial
phenotype and this was associated with an increase in NAT8 mRNA levels (Panel e, left) and protein
expression (Figure 16). A slight recovery of NAT8 transcript expression was also true following a 72 h
long exposure (Panel e, right), even though epithelial recovery was not as pronounced as before (Panel
c, bottom and Panel d, right).
So, there is a decrease in NAT8 levels at first and, while NAT8 levels are still low, it is only possible to
observe a slight recovery of epithelial markers, particularly e-cadherin, whereas, VM expression
becomes significantly reduced. However, at the end of the assay, NAT8 shifted back to basal level or
higher in the case of the shorter period (48 h) of exposure to TGF-β1. This increase in NAT8 was
accompanied by a clear recovery of epithelial markers. As so, initial re-epithelization seems to be
independent of NAT8 expression but complete re-epithelization ultimately associates with NAT8
recovery. Although this does not rule out the involvement of NAT8 in re-epithelization, it suggests that
NAT8 expression might not be required to trigger this process.
Moreover, MSCs have been used in the treatment of renal injury and have been reported as able to
promote proximal TEC‘s endogenous repair mechanisms due to paracrine effects [59]. Here, HK-2 cells
were exposed to TGF-β1 for 72 h and then cultured under TGF-β1 free media supplemented with MSC-
CM to study the reparative potential of MSCs via paracrine effects. This led to an improvement in the
re-epithelization process which progressed rapidly and was more thorough (that is, end phenotype was
more similar to basal) than when TGF-β1 arrest was not followed by MSC-CM supplementation. This
was once again assessed by a decrease in VM and increase in CK expression (Panel g), elevation in
e-cadherin transcription (Panel i, top), and suggested by the recovery of a cobblestone-like phenotype
(Figure 17). This improvement is in line with the available literature, supporting the therapeutic potential
of the paracrine effects of MSCs [59], [60] that also had been reported in similar experimental setups
[141]. These protective effects could be due to the action of soluble factors. For instance, MSCs are
known to release as insulin-like growth factor (IGF) [142], [143] which was reported to be helpful for
MSC-mediated recovery following cisplatin injury in a murine line of proximal TECs [143]. Also, HGF
[47], [48] that has been shown to mediate protection from TGF-β1 induced injury [144].
This improved re-epithelization process was not associated with recovery of NAT8 transcription (Panel
j, left). However, it is important to mention that for this particular condition no protein levels of NAT8
were assessed and should be investigated in future works. Another side-line observation is that although
recovery under normal conditions is ultimately linked to a rise in NAT8 transcription (at 144 h), recovery
under MSC-CM treatment, even though more effective, was not associated with such an increase (at
least within the timeframe of the assays performed here – 144 h).
Overall, if the injury stimulus is withdrawn re-epithelization seems to be initiated independently of NAT8
expression, even if culture media is supplemented with MSC-CM. This supports the speculation that
NAT8 mediates its protective effect by influencing another aspect of the regeneration process rather
than the initiation of re-epithelization. For instance, it could be linked to the protection of TECs while in
the dedifferentiated stage. NAT8 could allow dedifferentiated TECs to retain regenerative capacity, that

50
is, to remain in a state of pEMT without progressing to complete/irreversible EMT. Thus, cells more
capable to maintain NAT8 activity will be more prone to re-epithelization.
Nonetheless, it is important to mention that the decrease in NAT8 transcription in the sequence of TGF-
β1 withdrawal was partially in disagreement with results published in the literature by Omata´s group
(2016). These authors conducted an experiment [119], where NAT8 was reported as progressively
increasing through re-epithelization. Several factors might explain this difference. In the work of Omata
and co-authors (2016), the injury was induced by 48 h exposure to TGF-β1 (3 ng/mL vs. 10 ng/mL in
the present work). This may have resulted in a more pronounced and lasting response in the conditions
tested in the present work. Second, in the work of Omata and co-authors (2016), the epithelial and
mesenchymal markers showed very similar expressions after 48 h, 96 h and 144 h of TGF-β1
stimulation, this might indicate that 3 ng/mL is not enough to model progressive injury. This could also
mean that a pEMT stage is never achieved and so neither would be the regenerative dedifferentiated
phenotype. Additionally, differences inherent to the cellular model used might have accounted for these
disparities. Omata´s team (2016) used primary human TECs [119], whereas in this work HK-2 cells were
used (an immortalized adult TEC line). Omata and his group (2016) did not evaluate protein expression
and NAT8 implication in recovery should not be ruled out without doing so.
Also, Omata´s work (2016) assessed NAT8 expression in the 24 h following TGF-β1 withdrawal. In this
moment, those cells that had undergone dedifferentiation and retained regenerative potential (which
could associate with more NAT8) might be more active since immediately after TGF-β1 arrest, these
cells could proliferate (Panel a, left - proliferation), justifying an increase in NAT8. After that period (24
h), in the timeframe analysed in this work, this population may begin to differentiate (Panel a, left - MET)
accounting for the temporary decrease in NAT8.
Another aspect that supports the proposed role for NAT8 in renal protection is that MSC-CM treatment
under continuous injury induced signs of improvement and did so in association with a clear rescue of
NAT8 from TGF-β1 induced loss.
MSCs have been used in therapy to treat conditions where damage is continuously ongoing, such as
CKD or diabetic kidney disease [59], [99], which means MSCs can ameliorate function and exert a
protective effect even under the presence of the harmful agent. Here, this was tested by exposing cells
to TGF-β1 for 72 h and after this period adding MSC-CM to the media without arresting TGF-β1. That
is, HK-2 cells were cultured under media with TGF-β1 for 72 h followed by another 72 h under media
supplemented with both TGF-β1 and MSC-CM. Doing so, led to higher e-cadherin expression (Panel i,
bottom). Actually, supplementing MSC-CM to the media (Panel i, bottom, blue line) resulted in nearly
the same effect as withdrawing TGF-β1 (Panel i, bottom, green line). Moreover, cell morphology also
better recovered an appearance much similar to normal epithelial cells than in the case when TGF-β1
was withdrawn (Figure 17). The exception lies with VM and CK expression since no increase in the
CK+VM- population was observed. And, there is an apparent increase in the CK-VM+ population (Panel
h, left and middle), although not reaching statistic meaning. Nonetheless, considering the former
markers and the extensive literature backing the benefits of MSC-CM, it is acceptable to suggest that
MSC-CM shows potential to attenuate the action of TGF-β1.

51
Remarkably, Alfarano and associated team (2012) studied the effect of administering bmMSC-CM
combined with TGF-β1 (10 ng/mL) to HK-2 cells for 72 h [141]. Supplying bmMSC-CM to the culture
media inhibited morphological changes and expression of α-smooth muscle actin (α-SMA,
mesenchymal and pro-fibrotic marker), while increasing e-cadherin expression. The authors’ stand that,
in comparison to TGF-β1 stimulation alone, adding bmMSC-CM to the media inhibits complete EMT. In
spite of some differences in experimental design, as the moment of MSC-CM administration and length
of cell culture, these results are in line with what was observed in this work. Furthermore, the results
observed here, that convey signs of improvement/protection from injury, were coupled with rescue of
NAT8 transcription. Which remains markedly and consistently increased for the remainder of the assay
(Panel j, right, light blue line), in comparison to what was observed when cells were continuously
exposed to TGF-β1 alone (Panel j, right, black line) Additionally, this was concurrent with an increase
in the CK+VM+ population (Panel h, right). Expression of both epithelial (CK) and mesenchymal (VM)
markers is suggested as indicative of pEMT stage [42], [49], [56] that is speculated to correspond to
dedifferentiated cells that retain regenerative potential [31], [49], [57]. Together, these led to the
hypothesis that when under continuous injury, MSC mediate their effect by promoting the survival and
maintenance of a dedifferentiated population that is able to replenish the tissue and that NAT8 is part of
the mechanisms underlying this renoprotective effect. But, once more, no protein expression or activity
of NAT8 was evaluated limiting the strength of this conclusion. Evidence of augmented protein
expression NAT8 in the context of MSC treatment has already been published albeit in liver injury. In
this study [123], animals subjected to hepatic ischemia-reperfusion injury were treated with MSCs
collected from the umbilical cord. The expression levels of NAT8 were assessed 6 h and 24 h post injury
and found to be more elevated in MSC treated animals when compared to untreated animals.
Regarding the action of MSC-CM (under continuous TGF-β1 exposure) a possible mediator could be
HGF, which has been shown to counteract the action of TGF-β1 [47], [48]. The molecular mechanism
mediating the attenuation of TGF-β1 in TECs (see section 1.b.iv) is specific to TECs, similarly to
expression of NAT8 which is mostly restricted to these cells. Also interesting is the possible role of HGF
in renal repair. On one hand, in response to a limited injury, both HGF and TGF-β1 will increase
nevertheless, HGF signalling will predominate and mediate tissue regeneration. Since HGF has been
shown to induce SNAIL expression [43], [145] and SNAIL is speculated to mediate the reversible switch
from epithelial to pEMT [42], [43]. It is possible to hypothesize that HGF may mediate kidney repair by
promoting dedifferentiation and sustaining the expression of a pEMT pro-regenerative phenotype
(moreover in this particular scenario, SNAIL activation could justify the slight increase in VM). On the
other hand, if a severe or prolonged injury is applied, then the initial transient increase in HGF will
eventually decline and TGF-β1 will dominate and eventually lead to fibrosis [47]. Thus, the expression
and the role of HGF in response to injury are similar to those being suggested here for NAT8.
Additionally, a similar link between HGF-mediated liver repair [146], [147] correlated with NAT8 increase
was also suggested by Fu and co-authors (2014) [123].

52
All in all, it is possible to suggest that regulation of NAT8 expression is highly context-dependent since
it is downregulated in the presence of TGF-β1 alone, not up-regulated when cells are exposed to MSC-
CM on its own but it is greatly up-regulated when exposed to both TGF-β1 and MSC-CM.
On one hand, the results show that NAT8 is downregulated when severe injury is established associated
with loss of regenerative capacity. On the other hand, throughout injury NAT8 is more expressed in
initial dedifferentiation which, as mentioned, may be associated with the regenerative phenotype [42],
[49], [57] or when MSC-CM is added to the media possibly exerting a protective effect. This supports
the hypothesis of an association between the maintenance of regenerative capacity in the
dedifferentiated TEC population with expression of NAT8.
Data obtained seem to indicate that NAT8 expression is not fundamental for MSC-CM mediated re-
epithelization when the harmful stimulus is withdrawn which could model recovery from acute injury
scenarios to a scenario of as drug-induced injury upon drug withdrawal. Differently, under continued
TGF-β1 exposure, evocative of chronic conditions that potentiate kidney disease as diabetes,
hypertension or chronic toxicant exposure (section 4.c.i) the protective impact of MSC-CM appears to
be highly related to a maintenance of NAT8 transcription.
b. Role of NAT8 in renal protection
Many aspects demand further validation before any of these hypothesis are completely confirmed.
Further work will be necessary to fully understand the role of NAT8 in both renal physiology and repair.
Nonetheless, it is interesting to discuss what this role might be based on the available information.
Currently, NAT8 has been established as the enzyme performing the last step of the mercapturic acid
pathway [105]. This pathway provides a detoxifying mechanism that culminates in chemically stable
metabolites that are readily eliminated in urine [29]. Thus, NAT8 could provide protection from
endogenous and exogenous toxic metabolites that form cysteine-S-conjugates and participate in kidney
injury. This alone might suffice to significantly improve the resistance of dedifferentiated cells to injury.
Another possibility is that NAT8 will play a more regulatory role in the dedifferentiated phenotype. In
fact, N-acetylation has been shown to have a profound impact on protein metabolism (possibly modifying
their half-life, sub-cellular localization and protein-protein interactions) [148] and, changes in N-terminal
acetylation have been linked to hypertension, a relevant risk factor for CKD [149]. In fact, NAT8 has
been shown to acetylate CD133, and this modification is required for successful trafficking of CD133
from ER and Golgi apparatus to the cell membrane [124]. The expression of a mutant CD133 protein
that could not be acetylated significantly abrogated its expression on the cell-surface. Additionally,
knocking-down NAT8 resulted in decreased CD133 protein levels but not transcript levels[124]. CD133
has been identified as a characteristic marker of dedifferentiation and acquisition of a pro-repair, anti-
apoptotic and regenerative phenotype [31], [40], [52]. The fact that CD133 is not expressed on the cell
surface of fully differentiated TECs, in spite of NAT8 being highly expressed leads to the speculation
that NAT8 exerts different functions depending upon the phenotypic context (epithelial or
dedifferentiated (pEMT)).

53
ER stress is induced in response to a number of deleterious agents including oxidative stress, ischemia
and exposure to toxicants [150]. In human tubular epithelial cells, ER stress has been associated with
loss of epithelial characteristics such as e-cadherin expression, cytoskeleton re-organization and
acquisition of an elongated shape, consistent with acquisition of a non-differentiated phenotype and
incomplete EMT [150]. Ultimately ER stress will lead to autophagy and cell death. One of the biological
roles of ER is to ensure appropriate protein folding and to identify and dispose of misfolded proteins.
This quality control process has been suggested to be mediated by intraluminal acetylation carried out
by NAT8 (and NAT8B) [126], [151]. And proteins that are misfolded and fail to pass “quality control”
accumulate in the ER [126].So, both under physiological conditions and upon injury, NAT8 may have a
role in ensuring proper protein expression. Moreover, the accumulation of misfolded proteins results in
ER stress response and might lead to autophagy, as a mechanism to eliminate large aggregates of
misfolded proteins. In this circumstances, NAT8 has been suggested to mediate autophagy activation
[126]. At first impression, this might sound as a pathological process, but autophagy may have a
beneficial preventing accumulation of toxic proteins, organelle homeostasis and possibly prevent the
progression towards a non-functional pro-fibrotic phenotype [126]. Hence, NAT8 might be relevant for
the management of the increasing ER stress associate with tubular injury [126].
c. Limitations and future work
Given the novelty of the research hypothesis herein and that the study of NAT8 is still in its infancy, the
work developed in this dissertation project was exploratory, but it was intended to lay the ground work
for future experiments. With that in mind, there are some aspects which require further validation.
Immunofluorescence allowed to estimate NAT8 expression and supported transcription data from RT-
PCR. However, further validation of these results should be carried out in the future (by Western Blot
technique, for example). This will probably imply microsomal isolation (since NAT8 is anchored to the
membrane of ER), this procedure will require optimization and validation.
Additionally, a more thorough characterization of the changes in dedifferentiation markers under MSC-
CM supplemented culture with no interference from TGF-β1 should be carried out in the future.
Moreover, additional controls should be included in the MSC-CM treatment assay including culturing
cells under MSC-CM without exposure to TGF-β1, supplementing culture media with the original media
used to culture the MSCs (in the same percentage). Also, these experiments should be replicated using
CM collected from culturing MSCs from different sources although, literature does indicate a comparable
performance amongst varying sources.[59]. Also, freshly harvested CM (rather than cryopreserved)
should be used to help exclude interference from cryopreservation and storage. And, apoptosis and
viability assessments should also be performed as this is an important aspect in the context of TEC
injury [13], [27], [35]. Additionally, these are commonly reported in experiments and this and would
facilitate result comparison [98], [123]. Moreover, HGF was speculated as a possible player in mediating
the observed effects of MSC-CM treatment hence, HGF quantification in CM and in culture medium
could be carried. In future assays, NAT8 expression should also be evaluated when cells are treated
directly with HGF (and possibly IGF) and when MSC-CM administration is accompanied by blockage of

54
HGF (using antibodies for instance). These setups would be important to investigate the hypothesized
role for HGF in NAT8 expression.
Moreover, unequivocal and defined classification of the different phenotypes (epithelial, partial
EMT/dedifferentiated cells and mesenchymal/pro-fibrotic) was not carried out. To correct this, first, it
would be beneficial to include other markers associated with renal dedifferentiated and regenerative
capable cells, such as CD133 and CD24 [31], [40], [52], as well as, markers more closely associated
with ECM production and fibrosis, such as α-SMA, fibronectin and collagen deposition [38], [39].
Furthermore, although, a qualitative analysis of CK, VM and e-cadherin expression was attempted in
the present work (to discern between the different EMT stages) it was not overly exhaustive. And a more
structured approach should be undertaken, by setting quantitative ranges for the expression of the given
markers (including CK, VM, e-cadherin and possibly those suggested above) and sorting populations in
agreement to these. Notwithstanding, a more stringent test would be to sort, recover and re-culture cells
specific to each population. Then, test their ability to proliferate and revert back to the healthy epithelial
phenotype. Such an approach has been implemented [42] successfully in the MCF10A (a non-
tumorigenic epithelial cell line derived from mammary gland [152])cell line while resorting to TGF-β1
exposure as EMT inductor. Furthermore, a model in which SNAIL1 and ZEB1 regulate the transitions
between the different stages of EMT has been suggested [42]. SNAL1 up-regulation may mark the
transition from the epithelial phenotype to the reversible state of pEMT (see section 1.b.iv). SNAIL1,
among other effects, would up-regulate ZEB1. ZEB1 expression would control the transition from pEMT
phenotype to a mesenchymal one (irreversible). So, it would also be interesting to assess expression of
SNAIL1 (as well as SLUG, speculated to induce a less complete EMT [43], [45]) and ZEB1 in parallel
with NAT8.
This thorough characterization of different stage of the dedifferentiation process would allow reliable
identification of the pro-regenerative dedifferentiated phenotype. Cells sorted into the different
phenotypes could then be used to investigate differential expression of NAT8.
Perhaps, the most limiting factor for the conclusions suggested in this dissertation is that all the
supporting evidence is but associative. And therefore, only correlation can be claimed, to really clarify
an underlying mechanism functional evidence will be necessary. So, in the future NAT8 knock-down
and overexpression experiments must also be performed and the response to TGF-β1 evaluated in
those conditions. Sorting and re-culturing experiments would also allow to confront regenerative ability
with the expression of NAT8 or lack of thereof. Were this possible, it would be expected that knocking
down NAT8 would lead to impaired regeneration, whereas NAT8 overexpression should grant greater
resistance to injury.
Although, EMT is a common injury mechanism relatively independent from harmful stimuli, it is relevant
to validate this assumption. In order to do so, the experiments performed and described here should be
carried out employing other injury stimulus (exposure to cisplatin, H2O2, hypoxia).
Finally, in future work, it would also be informative to carry out similar assays in primary cells. To rule
out possible line-dependent effects, as HK-2 cell line may have some limitations (particularly regarding

55
drug transporter expression[153]). And, more importantly, it would be relevant to translate this model to
in vivo, this would allow to study NAT8 expression in the context of whole-organism metabolism (a
severe handicap of in vitro models).

56
6. Conclusions and future directions
All in all the main objectives set for this work were achieved and, the results presented here suggest
that NAT8 has a role in maintaining the regenerative capacity of tubular epithelial cells undergoing injury-
induced dedifferentiation. Moreover, NAT8 was nearly fully restored by administration of MSC-CM under
continuous injury supporting a link between this therapy and modulation of NAT8 expression, as
hypothesized. Data obtained strongly support the paracrine benefits of adipose tissue derived MSCs for
tubular renal injury treatment.
At the moment the understanding of the physiological role of NAT8 is limited. The work developed here
added to the studies investigating the temporal changes in NAT8 expression under injury and re-
epithelization [119], [123]. As far as could be established, this is the first report of the paracrine effects
of MSCs on NAT8 in the kidney and using cells of human origin.
To the present date kidney-related diseases remain a heavy burden for society. CKD has global
prevalence estimated to be between 11 to 13% [17] and represents a higher risk of death, cardiovascular
disease and AKI [6], [35], [76]. In turn, AKI is associated with high costs, morbidity and mortality,
impacting 13.3 million patients and leading to 1.7 million deaths a year [13], [14]. These conditions
represent global health concerns and current clinical response is ineffective [1], [2], [5]. The present
project exploited the therapeutic potential of MSC paracrine effects as a tool to clarify the role of NAT8
in renal protection.
These are encouraging results for the application of MSC in the therapy of kidney disease and suggest
that NAT8 might be a candidate target for novel therapeutic approaches. If truly capable to enhance
endogenous repair mechanisms, NAT8 could be targeted in the therapy of renal pathologies
(independent of originating cause diabetes, hypertension, nephrotoxicity, renal stenosis). Particularly,
in AKI episodes both to improve survival and to promote a more complete recovery afterwards (as AKI
will often lead to CKD). Also, to minimize injury due to adverse reactions of nephrotoxicants (since renal
toxicity is sometimes the limiting factor in cisplatin therapy, or for the use of nephrotoxic contrast dies).
Although preliminary, these are promising results and should be regarded as incentive for future work.
This will be of most importance to clarify mechanisms and assess the full clinical potential of regulating
NAT8, alone or as an enhancer of MSC therapy.

57

58
7. References
[1] R. L. Mehta et al., “International Society of Nephrology’s 0by25 initiative for acute kidney injury (zero preventable deaths by 2025): a human rights case for nephrology,” The Lancet, vol. 385, no. 9987, pp. 2616–2643, Jun. 2015.
[2] J. Feehally, “The ISN 0by25 Global Snapshot Study,” Ann. Nutr. Metab., vol. 68, no. Suppl. 2, pp. 29–31, 2016.
[3] “Summary of Recommendation Statements,” Kidney Int. Suppl., vol. 2, no. 1, pp. 8–12, Mar. 2012.
[4] F. E. Tögel and C. Westenfelder, “Kidney Protection and Regeneration Following Acute Injury: Progress Through Stem Cell Therapy,” Am. J. Kidney Dis., vol. 60, no. 6, pp. 1012–1022, Dec. 2012.
[5] F. E. Tögel and C. Westenfelder, “Mesenchymal stem cells: a new therapeutic tool for AKI,” Nat. Rev. Nephrol., vol. 6, no. 3, pp. 179–183, Mar. 2010.
[6] A. Ortiz et al., “Epidemiology, contributors to, and clinical trials of mortality risk in chronic kidney failure,” The lancet, vol. 383, no. 9931, pp. 1831–1843, 2014.
[7] M. T. James, B. R. Hemmelgarn, and M. Tonelli, “Early recognition and prevention of chronic kidney disease,” The Lancet, vol. 375, no. 9722, pp. 1296–1309, 2010.
[8] A. M. El Nahas and A. K. Bello, “Chronic kidney disease: the global challenge,” The Lancet, vol. 365, no. 9456, pp. 331–340, 2005.
[9] P. Stenvinkel and T. E. Larsson, “Chronic Kidney Disease: A Clinical Model of Premature Aging,” Am. J. Kidney Dis., vol. 62, no. 2, pp. 339–351, Aug. 2013.
[10] A. C. Guyton and J. E. Hall, Textbook of medical physiology. Philadelphia: Elsevier Saunders, 2006.
[11] Y. Li and R. A. Wingert, “Regenerative medicine for the kidney: stem cell prospects & challenges,” Clin. Transl. Med., vol. 2, no. 1, p. 11, 2013.
[12] B. Allen, “Anatomy Of Nephron,” thesistut.com. [Online]. Available: /anatomy-of-nephron.html. [Accessed: 12-Oct-2017].
[13] A. Zuk and J. V. Bonventre, “Acute Kidney Injury,” Annu. Rev. Med., vol. 67, no. 1, pp. 293–307, Jan. 2016.
[14] “0by25.” [Online]. Available: https://www.theisn.org/all-articles/616-0by25#acute-kidney-injury-aki. [Accessed: 30-Sep-2017].
[15] “The National Kidney Foundation Kidney Disease Outcomes Quality Initiative (NKF KDOQI ™),” The National Kidney Foundation, 12-Aug-2014. [Online]. Available: https://www.kidney.org/professionals/guidelines. [Accessed: 03-Jun-2017].
[16] P. E. Stevens, “Evaluation and Management of Chronic Kidney Disease: Synopsis of the Kidney Disease: Improving Global Outcomes 2012 Clinical Practice Guideline,” Ann. Intern. Med., vol. 158, no. 11, p. 825, Jun. 2013.
[17] N. R. Hill et al., “Global Prevalence of Chronic Kidney Disease – A Systematic Review and Meta-Analysis,” PLOS ONE, vol. 11, no. 7, p. e0158765, Jul. 2016.
[18] K.-U. Eckardt et al., “Evolving importance of kidney disease: from subspecialty to global health burden,” The Lancet, vol. 382, no. 9887, pp. 158–169, Jul. 2013.
[19] “Respostas Rápidas a Perguntas sobre as Doenças Renais e seus Tratamentos | APIR - Associação Portuguesa de Insuficientes Renais.” .
[20] K. Iseki, “Factors influencing the development of end-stage renal disease,” Clin. Exp. Nephrol., vol. 9, no. 1, pp. 5–14, Mar. 2005.
[21] J. P. Lea and S. B. Nicholas, “Diabetes mellitus and hypertension: key risk factors for kidney disease.,” J. Natl. Med. Assoc., vol. 94, no. 8 Suppl, p. 7S–15S, Aug. 2002.
[22] R. Kazancioğlu, “Risk factors for chronic kidney disease: an update,” Kidney Int. Suppl., vol. 3, no. 4, pp. 368–371, Dec. 2013.
[23] N. M. Selby et al., “Defining the Cause of Death in Hospitalised Patients with Acute Kidney Injury,” PLoS ONE, vol. 7, no. 11, p. e48580, Nov. 2012.
[24] X. Zeng, G. M. McMahon, S. M. Brunelli, D. W. Bates, and S. S. Waikar, “Incidence, Outcomes, and Comparisons across Definitions of AKI in Hospitalized Individuals,” Clin. J. Am. Soc. Nephrol., vol. 9, no. 1, pp. 12–20, Jan. 2014.
[25] C. M. O’Seaghdha and C. S. Fox, “Genome-wide association studies of chronic kidney disease: what have we learned?,” Nat. Rev. Nephrol., vol. 8, no. 2, pp. 89–99, Dec. 2011.
[26] A. Saad et al., “Autologous Mesenchymal Stem Cells Increase Cortical Perfusion in Renovascular Disease,” J. Am. Soc. Nephrol., vol. 28, no. 9, pp. 2777–2785, Sep. 2017.

59
[27] M. Nangaku, “Mechanisms of tubulointerstitial injury in the kidney: final common pathways to end-stage renal failure,” Intern. Med. Tokyo Jpn., vol. 43, no. 1, pp. 9–17, Jan. 2004.
[28] M. Nangaku, “Chronic Hypoxia and Tubulointerstitial Injury: A Final Common Pathway to End-Stage Renal Failure,” J. Am. Soc. Nephrol., vol. 17, no. 1, pp. 17–25, Nov. 2005.
[29] L. H. Lash, “Role of renal metabolism in risk to toxic chemicals.,” Environ. Health Perspect., vol. 102, no. Suppl 11, p. 75, 1994.
[30] R. Thadhani, M. Pascual, and J. V. Bonventre, “Acute Renal Failure,” N. Engl. J. Med., vol. 334, no. 22, pp. 1448–1460, May 1996.
[31] B. Smeets et al., “Proximal tubular cells contain a phenotypically distinct, scattered cell population involved in tubular regeneration: Phenotypically distinct proximal tubular cells,” J. Pathol., vol. 229, no. 5, pp. 645–659, Apr. 2013.
[32] C.-K. Chiang et al., “Endoplasmic reticulum stress implicated in the development of renal fibrosis,” Mol. Med. Camb. Mass, vol. 17, no. 11–12, pp. 1295–1305, 2011.
[33] M. Jiang, Q. Wei, G. Dong, M. Komatsu, Y. Su, and Z. Dong, “Autophagy in proximal tubules protects against acute kidney injury,” Kidney Int., vol. 82, no. 12, pp. 1271–1283, Dec. 2012.
[34] S. Bagnasco, D. Good, R. Balaban, and M. Burg, “Lactate production in isolated segments of the rat nephron,” Am. J. Physiol., vol. 248, no. 4 Pt 2, pp. F522-526, Apr. 1985.
[35] L. S. Chawla, P. W. Eggers, R. A. Star, and P. L. Kimmel, “Acute Kidney Injury and Chronic Kidney Disease as Interconnected Syndromes,” N. Engl. J. Med., vol. 371, no. 1, pp. 58–66, Jul. 2014.
[36] D. Zhou and Y. Liu, “Renal fibrosis in 2015: Understanding the mechanisms of kidney fibrosis,” Nat. Rev. Nephrol., vol. 12, no. 2, pp. 68–70, Dec. 2015.
[37] B. M. Grabias and K. Konstantopoulos, “The physical basis of renal fibrosis: effects of altered hydrodynamic forces on kidney homeostasis,” AJP Ren. Physiol., vol. 306, no. 5, pp. F473–F485, Mar. 2014.
[38] S. Lovisa et al., “Epithelial-to-mesenchymal transition induces cell cycle arrest and parenchymal damage in renal fibrosis,” Nat. Med., vol. 21, no. 9, pp. 998–1009, Aug. 2015.
[39] R. M. Carew, B. Wang, and P. Kantharidis, “The role of EMT in renal fibrosis,” Cell Tissue Res., vol. 347, no. 1, pp. 103–116, Jan. 2012.
[40] T. Kusaba, M. Lalli, R. Kramann, A. Kobayashi, and B. D. Humphreys, “Differentiated kidney epithelial cells repair injured proximal tubule,” Proc. Natl. Acad. Sci., vol. 111, no. 4, pp. 1527–1532, Jan. 2014.
[41] P. Savagner, “The epithelial-mesenchymal transition (EMT) phenomenon,” Ann. Oncol., vol. 21, no. Supplement 7, pp. vii89-vii92, Oct. 2010.
[42] J. Zhang et al., “TGF-β-induced epithelial-to-mesenchymal transition proceeds through stepwise activation of multiple feedback loops,” Sci Signal, vol. 7, no. 345, p. ra91, 2014.
[43] A. G. de Herreros, S. Peiró, M. Nassour, and P. Savagner, “Snail Family Regulation and Epithelial Mesenchymal Transitions in Breast Cancer Progression,” J. Mammary Gland Biol. Neoplasia, vol. 15, no. 2, pp. 135–147, Jun. 2010.
[44] S. Lamouille, J. Xu, and R. Derynck, “Molecular mechanisms of epithelial–mesenchymal transition,” Nat. Rev. Mol. Cell Biol., vol. 15, no. 3, pp. 178–196, Mar. 2014.
[45] P. Leroy and K. E. Mostov, “Slug Is Required for Cell Survival during Partial Epithelial-Mesenchymal Transition of HGF-induced Tubulogenesis,” Mol. Biol. Cell, vol. 18, no. 5, pp. 1943–1952, May 2007.
[46] J. Xu, S. Lamouille, and R. Derynck, “TGF-β-induced epithelial to mesenchymal transition,” Cell Res., vol. 19, no. 2, pp. 156–172, Feb. 2009.
[47] Y. Liu, “Hepatocyte growth factor in kidney fibrosis: therapeutic potential and mechanisms of action,” Am. J. Physiol. - Ren. Physiol., vol. 287, no. 1, pp. F7–F16, Jul. 2004.
[48] J. Yang, C. Dai, and Y. Liu, “A Novel Mechanism by which Hepatocyte Growth Factor Blocks Tubular Epithelial to Mesenchymal Transition,” J. Am. Soc. Nephrol., vol. 16, no. 1, pp. 68–78, Jan. 2005.
[49] S. Ishibe and L. G. Cantley, “Epithelial-mesenchymal-epithelial cycling in kidney repair,” Curr. Opin. Nephrol. Hypertens., vol. 17, no. 4, pp. 379–385, Jul. 2008.
[50] M. Chang-Panesso and B. D. Humphreys, “Cellular plasticity in kidney injury and repair,” Nat. Rev. Nephrol., vol. 13, no. 1, pp. 39–46, Nov. 2016.
[51] F. Anglani et al., “The renal stem cell system in kidney repair and regeneration,” Front. Biosci. J. Virtual Libr., vol. 13, pp. 6395–6405, May 2008.
[52] R. Kramann, T. Kusaba, and B. D. Humphreys, “Who regenerates the kidney tubule?,” Nephrol. Dial. Transplant., vol. 30, no. 6, pp. 903–910, Jun. 2015.

60
[53] M. H. Hanigan and P. Devarajan, “Cisplatin nephrotoxicity: molecular mechanisms,” Cancer Ther., vol. 1, p. 47, 2003.
[54] J. W. Park et al., “Paricalcitol prevents cisplatin-induced renal injury by suppressing apoptosis and proliferation,” Eur. J. Pharmacol., vol. 683, no. 1–3, pp. 301–309, May 2012.
[55] S. A. Mani et al., “The Epithelial-Mesenchymal Transition Generates Cells with Properties of Stem Cells,” Cell, vol. 133, no. 4, pp. 704–715, May 2008.
[56] S. G., V. Chandra, S. Phadnis, and R. Bhonde, “Glomerular parietal epithelial cells of adult murine kidney undergo EMT to generate cells with traits of renal progenitors,” J. Cell. Mol. Med., vol. 15, no. 2, pp. 396–413, Feb. 2011.
[57] D. Lombardi, F. Becherucci, and P. Romagnani, “How much can the tubule regenerate and who does it? An open question,” Nephrol. Dial. Transplant., vol. 31, no. 8, pp. 1243–1250, Aug. 2016.
[58] L. Cheval, F. Pierrat, R. Rajerison, D. Piquemal, and A. Doucet, “Of mice and men: divergence of gene expression patterns in kidney,” PloS One, vol. 7, no. 10, p. e46876, 2012.
[59] A. J. Peired, A. Sisti, and P. Romagnani, “Mesenchymal Stem Cell-Based Therapy for Kidney Disease: A Review of Clinical Evidence,” Stem Cells Int., vol. 2016, pp. 1–22, 2016.
[60] F. Tögel, Z. Hu, K. Weiss, J. Isaac, C. Lange, and C. Westenfelder, “Administered mesenchymal stem cells protect against ischemic acute renal failure through differentiation-independent mechanisms,” Am. J. Physiol. - Ren. Physiol., vol. 289, no. 1, pp. F31–F42, Jul. 2005.
[61] B. D. Humphreys et al., “Intrinsic Epithelial Cells Repair the Kidney after Injury,” Cell Stem Cell, vol. 2, no. 3, pp. 284–291, Mar. 2008.
[62] “Stem Cell Basics I. | stemcells.nih.gov.” [Online]. Available: https://stemcells.nih.gov/info/basics/1.htm. [Accessed: 09-Oct-2017].
[63] A. P. Beltrami et al., “Adult Cardiac Stem Cells Are Multipotent and Support Myocardial Regeneration,” Cell, vol. 114, no. 6, pp. 763–776, Sep. 2003.
[64] R. Galli, A. Gritti, L. Bonfanti, and A. L. Vescovi, “Neural Stem Cells: An Overview,” Circ. Res., vol. 92, no. 6, pp. 598–608, Apr. 2003.
[65] C. Sagrinati et al., “Isolation and characterization of multipotent progenitor cells from the Bowman’s capsule of adult human kidneys,” J. Am. Soc. Nephrol. JASN, vol. 17, no. 9, pp. 2443–2456, Sep. 2006.
[66] M. L. Angelotti et al., “Characterization of Renal Progenitors Committed Toward Tubular Lineage and Their Regenerative Potential in Renal Tubular Injury,” STEM CELLS, vol. 30, no. 8, pp. 1714–1725, Aug. 2012.
[67] D. Lindgren et al., “Isolation and Characterization of Progenitor-Like Cells from Human Renal Proximal Tubules,” Am. J. Pathol., vol. 178, no. 2, pp. 828–837, Feb. 2011.
[68] S. K. Jo, M. H. Rosner, and M. D. Okusa, “Pharmacologic Treatment of Acute Kidney Injury: Why Drugs Haven’t Worked and What Is on the Horizon,” Clin. J. Am. Soc. Nephrol., vol. 2, no. 2, pp. 356–365, Mar. 2007.
[69] A. Vijayan et al., “Clinical Use of the Urine Biomarker [TIMP-2] × [IGFBP7] for Acute Kidney Injury Risk Assessment,” Am. J. Kidney Dis., vol. 68, no. 1, pp. 19–28, Jul. 2016.
[70] J. L. Koyner et al., “Tissue Inhibitor Metalloproteinase-2 (TIMP-2)*IGF-Binding Protein-7 (IGFBP7) Levels Are Associated with Adverse Long-Term Outcomes in Patients with AKI,” J. Am. Soc. Nephrol., vol. 26, no. 7, pp. 1747–1754, Jul. 2015.
[71] “AKI Risk Assessment Test System | The NephroCheck Test Global,” The NEPHROCHECK® Test. [Online]. Available: http://nephrocheck.com/global/aki-risk-assessment/. [Accessed: 01-Oct-2017].
[72] O. J. Wouters, D. J. O’Donoghue, J. Ritchie, P. G. Kanavos, and A. S. Narva, “Early chronic kidney disease: diagnosis, management and models of care,” Nat. Rev. Nephrol., vol. 11, no. 8, pp. 491–502, Jun. 2015.
[73] C. N. Naresh, A. Hayen, A. Weening, J. C. Craig, and S. J. Chadban, “Day-to-day variability in spot urine albumin-creatinine ratio,” Am. J. Kidney Dis. Off. J. Natl. Kidney Found., vol. 62, no. 6, pp. 1095–1101, Dec. 2013.
[74] L. A. Stevens et al., “Evaluation of the Modification of Diet in Renal Disease Study Equation in a Large Diverse Population,” J. Am. Soc. Nephrol., vol. 18, no. 10, pp. 2749–2757, Sep. 2007.
[75] N. R. Powe and L. E. Boulware, “Population-Based Screening for CKD,” Am. J. Kidney Dis., vol. 53, no. 3, pp. S64–S70, Mar. 2009.
[76] M. Jesky, A. Lambert, A. C. F. Burden, and P. Cockwell, “The impact of chronic kidney disease and cardiovascular comorbidity on mortality in a multiethnic population: a retrospective cohort study,” BMJ Open, vol. 3, no. 12, p. e003458, Dec. 2013.
[77] M. D. Breyer and K. Susztak, “The next generation of therapeutics for chronic kidney disease,” Nat. Rev. Drug Discov., vol. 15, no. 8, pp. 568–588, May 2016.

61
[78] C. M. Legendre et al., “Terminal Complement Inhibitor Eculizumab in Atypical Hemolytic–Uremic Syndrome,” N. Engl. J. Med., vol. 368, no. 23, pp. 2169–2181, Jun. 2013.
[79] “Soliris - Summary of Product Characteristics (SPC) - (eMC).” [Online]. Available: http://www.medicines.org.uk/emc/medicine/19966/SPC/soliris#PHARMACODYNAMIC_PROPS. [Accessed: 01-Oct-2017].
[80] “A Study in Participants With Diabetic Kidney Disease - Full Text View - ClinicalTrials.gov.” [Online]. Available: https://clinicaltrials.gov/ct2/show/NCT01113801. [Accessed: 07-Oct-2017].
[81] C. P. Denton et al., “Recombinant human anti-transforming growth factor beta1 antibody therapy in systemic sclerosis: a multicenter, randomized, placebo-controlled phase I/II trial of CAT-192,” Arthritis Rheum., vol. 56, no. 1, pp. 323–333, Jan. 2007.
[82] J. Porte and G. Jenkins, “Assessment of the effect of potential antifibrotic compounds on total and αVβ6 integrin-mediated TGF-β activation,” Pharmacol. Res. Perspect., vol. 2, no. 4, p. e00030, Aug. 2014.
[83] K. Hahm et al., “αvβ6 Integrin Regulates Renal Fibrosis and Inflammation in Alport Mouse,” Am. J. Pathol., vol. 170, no. 1, pp. 110–125, Jan. 2007.
[84] W. Qin et al., “TGF- /Smad3 Signaling Promotes Renal Fibrosis by Inhibiting miR-29,” J. Am. Soc. Nephrol., vol. 22, no. 8, pp. 1462–1474, Aug. 2011.
[85] H. Orbay, M. Tobita, and H. Mizuno, “Mesenchymal Stem Cells Isolated from Adipose and Other Tissues: Basic Biological Properties and Clinical Applications,” Stem Cells International, 2012. [Online]. Available: https://www.hindawi.com/journals/sci/2012/461718/. [Accessed: 09-Oct-2017].
[86] A. Flynn, F. Barry, and T. O’Brien, “UC blood-derived mesenchymal stromal cells: an overview,” Cytotherapy, vol. 9, no. 8, pp. 717–726, Jan. 2007.
[87] P. S. in `t Anker, “Amniotic fluid as a novel source of mesenchymal stem cells for therapeutic transplantation,” Blood, vol. 102, no. 4, pp. 1548–1549, Apr. 2003.
[88] S. Bruno et al., “Isolation and Characterization of Resident Mesenchymal Stem Cells in Human Glomeruli,” Stem Cells Dev., vol. 18, no. 6, pp. 867–880, Feb. 2009.
[89] R. Henschler, E. Deak, and E. Seifried, “Homing of Mesenchymal Stem Cells,” Transfus. Med. Hemotherapy, vol. 35, no. 4, pp. 306–312, Aug. 2008.
[90] M. Morigi and A. Benigni, “Mesenchymal stem cells and kidney repair,” Nephrol. Dial. Transplant., vol. 28, no. 4, pp. 788–793, Apr. 2013.
[91] C. H. Jo et al., “Intra-articular injection of mesenchymal stem cells for the treatment of osteoarthritis of the knee: a proof-of-concept clinical trial,” Stem Cells Dayt. Ohio, vol. 32, no. 5, pp. 1254–1266, May 2014.
[92] E. M. Horwitz et al., Horwitz EM, Prockop DJ, Fitzpatrick LA, Koo WW, Gordon PL, Neel M, Sussman M, Orchard P, Marx JC, Pyeritz RE, Brenner MKTransplantability and therapeutic effects of bone marrow-derived mesenchymal cells in children with osteogenesis imperfecta. Nat Med 5:309-313, vol. 5. 1999.
[93] J. M. Hare et al., “A Randomized, Double-Blind, Placebo-Controlled, Dose-Escalation Study of Intravenous Adult Human Mesenchymal Stem Cells (Prochymal) After Acute Myocardial Infarction,” J. Am. Coll. Cardiol., vol. 54, no. 24, pp. 2277–2286, Dec. 2009.
[94] B. Amorin et al., “Mesenchymal stem cell therapy and acute graft-versus-host disease: a review,” Hum. Cell, vol. 27, no. 4, pp. 137–150, 2014.
[95] M. E. J. Reinders et al., “Autologous Bone Marrow-Derived Mesenchymal Stromal Cells for the Treatment of Allograft Rejection After Renal Transplantation: Results of a Phase I Study,” STEM CELLS Transl. Med., vol. 2, no. 2, pp. 107–111, Feb. 2013.
[96] “Mesenchymal Stem Cells In Cisplatin-Induced Acute Renal Failure In Patients With Solid Organ Cancers - Full Text View - ClinicalTrials.gov.” [Online]. Available: https://clinicaltrials.gov/ct2/show/NCT01275612. [Accessed: 09-Oct-2017].
[97] “Search of: Mesenchymal stem cell | Recruiting, Not yet recruiting, Active, not recruiting, Enrolling by invitation Studies - List Results - ClinicalTrials.gov.” [Online]. Available: https://clinicaltrials.gov/ct2/results?term=Mesenchymal+stem+cell&Search=Apply&recrs=b&recrs=a&recrs=f&recrs=d&age_v=&gndr=&type=&rslt=. [Accessed: 17-Sep-2017].
[98] J. H. Kim et al., “Human adipose tissue-derived mesenchymal stem cells protect kidneys from cisplatin nephrotoxicity in rats,” AJP Ren. Physiol., vol. 302, no. 9, pp. F1141–F1150, May 2012.
[99] S. Villanueva et al., “Human mesenchymal stem cells derived from adipose tissue reduce functional and tissue damage in a rat model of chronic renal failure,” Clin. Sci., vol. 125, no. 4, pp. 199–210, Aug. 2013.
[100] A. Saad et al., “Human Renovascular Disease: Estimating Fractional Tissue Hypoxia to Analyze Blood Oxygen Level–dependent MR,” Radiology, vol. 268, no. 3, pp. 770–778, Sep. 2013.

62
[101] M. M. Lalu et al., “Safety of Cell Therapy with Mesenchymal Stromal Cells (SafeCell): A Systematic Review and Meta-Analysis of Clinical Trials,” PLOS ONE, vol. 7, no. 10, p. e47559, Oct. 2012.
[102] M. Inoue, K. Okajima, and Y. Morino, “Renal transtubular transport of mercapturic acid in vivo,” Biochim. Biophys. Acta BBA - Biomembr., vol. 641, no. 1, pp. 122–128, Feb. 1981.
[103] “Tissue expression of NAT8 - Staining in kidney - The Human Protein Atlas.” [Online]. Available: https://www.proteinatlas.org/ENSG00000144035-NAT8/tissue/kidney. [Accessed: 30-Sep-2017].
[104] K. Ozaki, T. Fujiwara, Y. Nakamura, and E. Takahashi, “Isolation and mapping of a novel human kidney- and liver-specific gene homologous to the bacterial acetyltransferases,” J. Hum. Genet., vol. 43, no. 4, pp. 255–258, Dec. 1998.
[105] M. Veiga-da-Cunha, D. Tyteca, V. Stroobant, P. J. Courtoy, F. R. Opperdoes, and E. Van Schaftingen, “Molecular Identification of NAT8 as the Enzyme That Acetylates Cysteine S -Conjugates to Mercapturic Acids,” J. Biol. Chem., vol. 285, no. 24, pp. 18888–18898, Jun. 2010.
[106] K. Okajima, M. Inoue, Y. Morino, and K. Itoh, “Topological aspects of microsomal N-acetyltransferase, an enzyme responsible for the acetylation of cysteine S-conjugates of xenobiotics,” Eur. J. Biochem., vol. 142, no. 2, pp. 281–286, Jul. 1984.
[107] P. I. Mathias and C. B’hymer, “Mercapturic acids: recent advances in their determination by liquid chromatography/mass spectrometry and their use in toxicant metabolism studies and in occupational and environmental exposure studies,” Biomarkers, vol. 21, no. 4, pp. 293–315, May 2016.
[108] W. Wang and N. Ballatori, “Endogenous Glutathione Conjugates: Occurrence and Biological Functions,” Pharmacol. Rev., vol. 50, no. 3, pp. 335–356, Sep. 1998.
[109] J. R. Koenitzer and B. A. Freeman, “Redox signaling in inflammation: interactions of endogenous electrophiles and mitochondria in cardiovascular disease: Electrophilic signaling in inflammation,” Ann. N. Y. Acad. Sci., vol. 1203, no. 1, pp. 45–52, Aug. 2010.
[110] G.-S. Oh et al., “Cisplatin-induced Kidney Dysfunction and Perspectives on Improving Treatment Strategies,” Electrolytes Blood Press., vol. 12, no. 2, p. 55, 2014.
[111] E. E. Ramsay and P. J. Dilda, “Glutathione S-conjugates as prodrugs to target drug-resistant tumors,” Front. Pharmacol., vol. 5, 2014.
[112] J. C. Chambers et al., “Genetic loci influencing kidney function and chronic kidney disease,” Nat. Genet., vol. 42, no. 5, pp. 373–375, May 2010.
[113] H. C. Ainsworth, C. D. Langefeld, and B. I. Freedman, “Genetic epidemiology in kidney disease,” Nephrol. Dial. Transplant., vol. 32, no. suppl_2, pp. ii159-ii169, Apr. 2017.
[114] P. Juhanson et al., “N-acetyltransferase 8, a positional candidate for blood pressure and renal regulation: resequencing, association and in silico study,” BMC Med. Genet., vol. 9, p. 25, Apr. 2008.
[115] G. Stelzer et al., “In-silico human genomics with GeneCards,” Hum. Genomics, vol. 5, no. 6, pp. 709–717, Oct. 2011.
[116] “GeneCards - Human Genes | Gene Database | Gene Search.” [Online]. Available: http://www.genecards.org/. [Accessed: 07-Oct-2017].
[117] Y. Song, M. K. Washington, and H. C. Crawford, “Loss of FOXA1/2 Is Essential for the Epithelial-to-Mesenchymal Transition in Pancreatic Cancer,” Cancer Res., vol. 70, no. 5, pp. 2115–2125, Mar. 2010.
[118] R. Behr, J. Brestelli, J. T. Fulmer, N. Miyawaki, T. R. Kleyman, and K. H. Kaestner, “Mild Nephrogenic Diabetes Insipidus Caused by Foxa1 Deficiency,” J. Biol. Chem., vol. 279, no. 40, pp. 41936–41941, Oct. 2004.
[119] M. Omata et al., “Hepatocyte Nuclear Factor-1β Induces Redifferentiation of Dedifferentiated Tubular Epithelial Cells,” PLOS ONE, vol. 11, no. 5, p. e0154912, May 2016.
[120] M. Barrios-Rodiles, “High-Throughput Mapping of a Dynamic Signaling Network in Mammalian Cells,” Science, vol. 307, no. 5715, pp. 1621–1625, Mar. 2005.
[121] A. D. Rouillard et al., “The harmonizome: a collection of processed datasets gathered to serve and mine knowledge about genes and proteins,” Database, vol. 2016, p. baw100, 2016.
[122] “Gene Set - NAT8.” [Online]. Available: https://amp.pharm.mssm.edu/Harmonizome/gene_set/NAT8/Pathway+Commons+Protein-Protein+Interactions. [Accessed: 22-Oct-2017].
[123] J. Fu et al., “The Role of N-Acetyltransferase 8 in Mesenchymal Stem Cell-Based Therapy for Liver Ischemia/Reperfusion Injury in Rats,” PLoS ONE, vol. 9, no. 7, p. e103355, Jul. 2014.
[124] A. B. Mak et al., “Post-Translational Regulation of CD133 by ATase1/ATase2-Mediated Lysine Acetylation,” J. Mol. Biol., vol. 426, no. 11, pp. 2175–2182, May 2014.
63
[125] M. H. Ko and L. Puglielli, “Two Endoplasmic Reticulum (ER)/ER Golgi Intermediate Compartment-based Lysine Acetyltransferases Post-translationally Regulate BACE1 Levels,” J. Biol. Chem., vol. 284, no. 4, pp. 2482–2492, Jan. 2009.
[126] Y. Peng and L. Puglielli, “Nϵ-lysine acetylation in the lumen of the endoplasmic reticulum: A way to regulate autophagy and maintain protein homeostasis in the secretory pathway,” Autophagy, vol. 12, no. 6, pp. 1051–1052, Jun. 2016.
[127] K. Gerl et al., “Activation of Hypoxia Signaling in Stromal Progenitors Impairs Kidney Development,” Am. J. Pathol., vol. 187, no. 7, pp. 1496–1511, Jul. 2017.
[128] M. J. Ryan, G. Johnson, J. Kirk, S. M. Fuerstenberg, R. A. Zager, and B. Torok-Storb, “HK-2: An immortalized proximal tubule epithelial cell line from normal adult human kidney,” Kidney Int., vol. 45, no. 1, pp. 48–57, Jan. 1994.
[129] P. Gunness, K. Aleksa, K. Kosuge, S. Ito, and G. Koren, “Comparison of the novel HK-2 human renal proximal tubular cell line with the standard LLC-PK1 cell line in studying drug-induced nephrotoxicity,” Can. J. Physiol. Pharmacol., vol. 88, no. 4, pp. 448–455, Apr. 2010.
[130] J. Yan, S. Yang, J. Zhang, and T. Zhu, “BMP6 reverses TGF-β1-induced changes in HK-2 cells: implications for the treatment of renal fibrosis,” Acta Pharmacol. Sin., vol. 30, no. 7, pp. 994–1000, Jul. 2009.
[131] E. P. Bottinger, “TGF- Signaling in Renal Disease,” J. Am. Soc. Nephrol., vol. 13, no. 10, pp. 2600–2610, Oct. 2002.
[132] P. L. Dudas, R. L. Argentieri, and F. X. Farrell, “BMP-7 fails to attenuate TGF- 1-induced epithelial-to-mesenchymal transition in human proximal tubule epithelial cells,” Nephrol. Dial. Transplant., vol. 24, no. 5, pp. 1406–1416, May 2009.
[133] G. Moreno-Bueno et al., “The morphological and molecular features of the epithelial-to-mesenchymal transition,” Nat. Protoc., vol. 4, no. 11, pp. 1591–1613, Oct. 2009.
[134] “HK-2 ATCC ® CRL-2190TM Homo sapiens kidney, cortex/proximal t.” [Online]. Available: https://www.lgcstandards-atcc.org/Products/All/CRL-2190.aspx?geo_country=ro. [Accessed: 20-May-2017].
[135] “Peprotech Recombinant Human TGF-β1 (HEK293 derived).” [Online]. Available: https://www.peprotech.com/en-GB/Pages/Product/Recombinant_Human_TGF-%CE%B21_(HEK_293_derived)/100-21. [Accessed: 17-Jul-2017].
[136] J. G. Carmelo, A. Fernandes-Platzgummer, M. M. Diogo, C. L. da Silva, and J. M. S. Cabral, “A xeno-free microcarrier-based stirred culture system for the scalable expansion of human mesenchymal stem/stromal cells isolated from bone marrow and adipose tissue,” Biotechnol. J., vol. 10, no. 8, pp. 1235–1247, Aug. 2015.
[137] “FlowJo® | FlowJo, LLC.” [Online]. Available: https://www.flowjo.com/solutions/flowjo. [Accessed: 17-Jul-2017].
[138] “RNA Isolation Kit: RNeasy Mini Kit - QIAGEN Online Shop.” [Online]. Available: https://www.qiagen.com/gb/shop/sample-technologies/rna/total-rna/rneasy-mini-kit/#orderinginformation. [Accessed: 05-Jun-2017].
[139] W. A. Kues, M. Anger, J. W. Carnwath, D. Paul, J. Motlik, and H. Niemann, “Cell Cycle Synchronization of Porcine Fetal Fibroblasts: Effects of Serum Deprivation and Reversible Cell Cycle Inhibitors,” Biol. Reprod., vol. 62, no. 2, pp. 412–419, Feb. 2000.
[140] “Dictionary - Cell: Endoplasmic reticulum - The Human Protein Atlas.” [Online]. Available: https://www.proteinatlas.org/learn/dictionary/cell/endoplasmic+reticulum+3. [Accessed: 22-Sep-2017].
[141] C. Alfarano et al., “Intraparenchymal Injection of Bone Marrow Mesenchymal Stem Cells Reduces Kidney Fibrosis after Ischemia-Reperfusion in Cyclosporine-Immunosuppressed Rats,” Cell Transplant., vol. 21, no. 9, pp. 2009–2019, Sep. 2012.
[142] Z. Wu, Y. Yu, L. Niu, A. Fei, and S. Pan, “IGF-1 protects tubular epithelial cells during injury via activation of ERK/MAPK signaling pathway,” Sci. Rep., vol. 6, Jun. 2016.
[143] B. Imberti et al., “Insulin-Like Growth Factor-1 Sustains Stem Cell–Mediated Renal Repair,” J. Am. Soc. Nephrol., vol. 18, no. 11, pp. 2921–2928, Nov. 2007.
[144] C. E. Hills, G. B. Willars, and N. J. Brunskill, “Proinsulin C-Peptide Antagonizes the Profibrotic Effects of TGF-β1 via Up-Regulation of Retinoic Acid and HGF-Related Signaling Pathways,” Mol. Endocrinol., vol. 24, pp. 822–831, Apr. 2010.
[145] S. Grotegut, D. von Schweinitz, G. Christofori, and F. Lehembre, “Hepatocyte growth factor induces cell scattering through MAPK/Egr-1-mediated upregulation of Snail,” EMBO J., vol. 25, no. 15, pp. 3534–3545, Aug. 2006.

64
[146] J. Liu, G. Pan, T. Liang, and P. Huang, “HGF/c-Met Signaling Mediated Mesenchymal Stem Cell-induced Liver Recovery in Intestinal Ischemia Reperfusion Model,” Int. J. Med. Sci., vol. 11, no. 6, pp. 626–633, Apr. 2014.
[147] A. Giebeler et al., “c-Met Confers Protection Against Chronic Liver Tissue Damage and Fibrosis Progression After Bile Duct Ligation in Mice,” Gastroenterology, vol. 137, no. 1, p. 297–308.e4, Jul. 2009.
[148] H. Aksnes, A. Drazic, M. Marie, and T. Arnesen, “First Things First: Vital Protein Marks by N-Terminal Acetyltransferases,” Trends Biochem. Sci., vol. 41, no. 9, pp. 746–760, Sep. 2016.
[149] H. Aksnes, A. Drazic, and T. Arnesen, “(Hyper)tension release by N-terminal acetylation,” Trends Biochem. Sci., vol. 40, no. 8, pp. 422–424, Aug. 2015.
[150] N. Pallet et al., “Cyclosporine-Induced Endoplasmic Reticulum Stress Triggers Tubular Phenotypic Changes and Death,” Am. J. Transplant., vol. 8, no. 11, pp. 2283–2296, Nov. 2008.
[151] M. Pehar and L. Puglielli, “Lysine acetylation in the lumen of the ER: A novel and essential function under the control of the UPR,” Biochim. Biophys. Acta BBA - Mol. Cell Res., vol. 1833, no. 3, pp. 686–697, Mar. 2013.
[152] H. D. Soule et al., “Isolation and characterization of a spontaneously immortalized human breast epithelial cell line, MCF-10,” Cancer Res., vol. 50, no. 18, pp. 6075–6086, Sep. 1990.
[153] S. E. Jenkinson, G. W. Chung, E. van Loon, N. S. Bakar, A. M. Dalzell, and C. D. A. Brown, “The limitations of renal epithelial cell line HK-2 as a model of drug transporter expression and function in the proximal tubule,” Pflüg. Arch. - Eur. J. Physiol., vol. 464, no. 6, pp. 601–611, Dec. 2012.

65

66
Appendix
a. Dedifferentiation assay: Changes in cytokeratin (CK) and
vimentin (VM) expression under TGF-β1 exposure vs. control condition
CK+VM-
24 48 72 960
5
10
15
20
25
Time (h)
Po
sitiv
e c
ells
(%
)
CK-VM+
24 48 72 960
10
20
30
**
Time (h)
Po
sitiv
e c
ells
(%
)
CK+VM+
24 48 72 960
20
40
60
80
100
Time (h)
Po
sitiv
e c
ells
(%
)CK+VM-
24 48 72 960
10
20
30
Time (h)
Po
sitiv
e c
ells
(%
)
CK-VM+
24 48 72 960
10
20
30
CTRL TGF-1
** ***
Time (h)
Po
sitiv
e c
ells
(%
)
CK+VM+
24 48 72 960
20
40
60
80
100
Time (h)
Po
sitiv
e c
ells
(%
)
Dedifferentiation assay:1 vs. 10% FBS assessment
1% FBS
10% FBS
Figure 19 Dedifferentiation assay: Changes in cytokeratin (CK) and vimentin (VM) expression under TGF-β1 exposure. HK-2 cells were exposed to TGF-β1 in media supplemented with either 1% FBS (top) or 10% of FBS (bottom). CK and VM expression was assessed by flow cytometry. CK+VM-, CK-VM+ and, CK+VM+ populations were quantified as percentage of cell count. Data are expressed as mean ± SEM. Statistical analysis of data was performed using two-way ANOVA test with Bonferroni’s post-test (** p<0.01, *** p<0.001, TGF-β1 vs. CTRL). FBS- Fetal bovine serum; TGF-β1 – Transforming growth factor β1;