Embed Size (px)
Citation preview
1
Injunctive Relief in Sherman Act Monopolization Cases
Robert W. Crandall, Senior Fellow, The Brookings Institution Kenneth G. Elzinga, Professor of Economics, University of Virginia
Journal of Research in Law and Economics
Classification Codes: K21, L41
Keywords: antitrust; monopolization; remedies
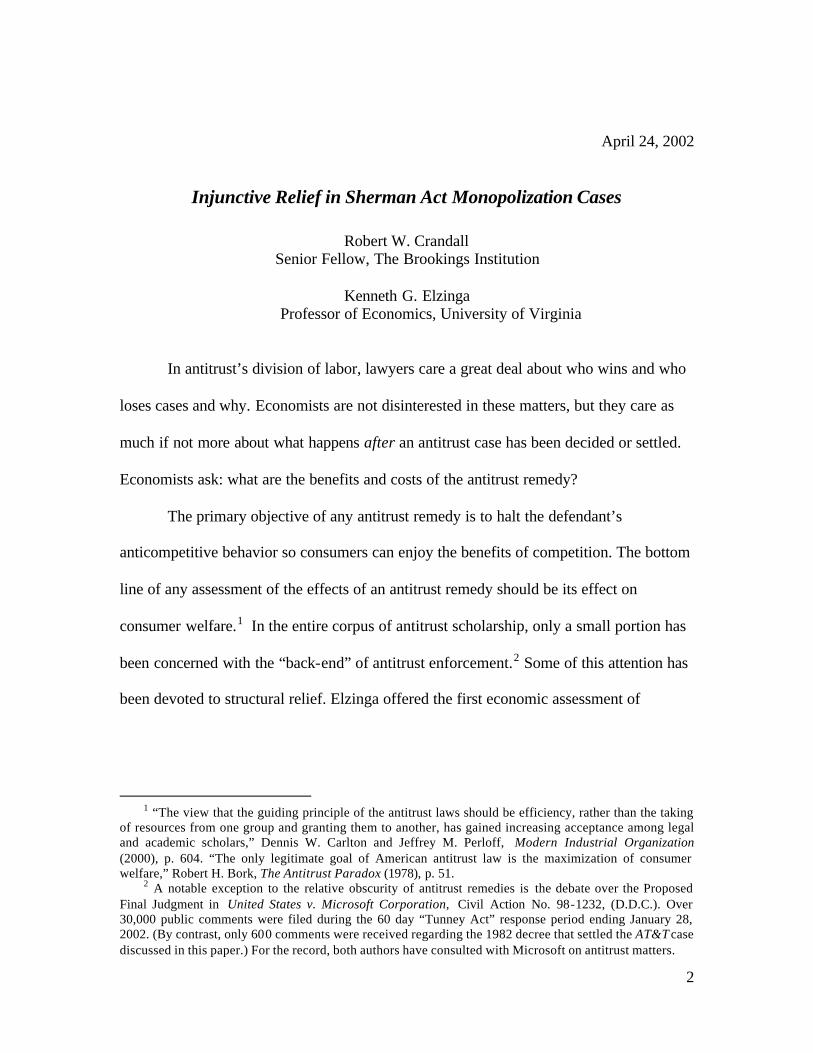
While the popular image of the Sherman Act is that of a “trust-busting” statute, conduct remedies have been more common than structural relief. This paper evaluates the effect on economic welfare of conduct remedies that have resulted from ten prominent Sherman Act monopolization cases. In general, we find that in some cases the behavioral relief has had no consequence other than the cost of litigation and cost of compliance; in other cases, the remedies probably reduced consumer welfare. Cases studied are United Shoe Machinery, AT&T, Std. Oil of California, IBM, United Fruit, Kodak, Safeway, GM, Jerrold, and Blue Chip Stamp.
2
April 24, 2002
Injunctive Relief in Sherman Act Monopolization Cases
Robert W. Crandall Senior Fellow, The Brookings Institution
Kenneth G. Elzinga
Professor of Economics, University of Virginia
In antitrust’s division of labor, lawyers care a great deal about who wins and who
loses cases and why. Economists are not disinterested in these matters, but they care as
much if not more about what happens after an antitrust case has been decided or settled.
Economists ask: what are the benefits and costs of the antitrust remedy?
The primary objective of any antitrust remedy is to halt the defendant’s
anticompetitive behavior so consumers can enjoy the benefits of competition. The bottom
line of any assessment of the effects of an antitrust remedy should be its effect on
consumer welfare.1 In the entire corpus of antitrust scholarship, only a small portion has
been concerned with the “back-end” of antitrust enforcement.2 Some of this attention has
been devoted to structural relief. Elzinga offered the first economic assessment of
1 “The view that the guiding principle of the antitrust laws should be efficiency, rather than the taking
of resources from one group and granting them to another, has gained increasing acceptance among legal and academic scholars,” Dennis W. Carlton and Jeffrey M. Perloff, Modern Industrial Organization (2000), p. 604. “The only legitimate goal of American antitrust law is the maximization of consumer welfare,” Robert H. Bork, The Antitrust Paradox (1978), p. 51.
2 A notable exception to the relative obscurity of antitrust remedies is the debate over the Proposed Final Judgment in United States v. Microsoft Corporation, Civil Action No. 98-1232, (D.D.C.). Over 30,000 public comments were filed during the 60 day “Tunney Act” response period ending January 28, 2002. (By contrast, only 600 comments were received regarding the 1982 decree that settled the AT&T case discussed in this paper.) For the record, both authors have consulted with Microsoft on antitrust matters.
3
divestiture under the amended antimerger law. 3 This assessment was updated by a study
from the Federal Trade Commission. 4 More recently, Crandall presented a critical
empirical assessment of Sherman Act structural remedies.5
While the popular image of the Sherman Act is that of a “trust-busting” statute,
conduct remedies have been more common than structural remedies. This paper evaluates
the effect on economic welfare of conduct remedies that have resulted from a sample of
Sherman Act monopolization cases.
I. Government Victories in Monopolization Cases
In more than 100 years of enforcing the Sherman Act, the U.S. Department of
Justice (DOJ) has succeeded in monopolization cases on 426 occasions, either by
obtaining a court verdict against the defendant(s) or a negotiated consent decree. In a few
cases, structural relief – such as divestiture – has been the result. In most, however, the
government has obtained injunctive relief, requiring various changes in the defendants’
conduct. In many cases, these remedies involve the prohibition of price fixing or market
division, but others involve an attempt by the government to alter the defendant’s
conduct, presumably to eliminate anti-competitive conduct and to allow the market to
evolve towards a more competitive structure.
3 Kenneth G. Elzinga, “The Antimerger Law: Pyrrhic Victories,” Journal of Law and Economics, Vol.
43, April 1969, pp. 43-78. See also Kenneth G. Elzinga and William Breit, The Antitrust Penalties: A Study in Law and Economics. Yale University Press, 1976.
4 A Study of the Commission’s Divestiture Process, Federal Trade Commission, Bureau of Competition, 1999. See also, Robert Pitofsky, “The Nature and Limits of Restructuring in Merger Review,” February 17, 2000, accessible at www.ftc.gov/speeches/pitofsky/restruct.htm
5 Robert W. Crandall, “The Failure of Structural Remedies in Sherman Act Monopolization Cases”, Oregon Law Review, Vol. 80 (1), Spring 2001, pp. 109-98.
4
Of the 423 monopolization cases that the government has either won or entered
into a consent decree with the defendant(s) and for which documentation could be found,6
87 were criminal cases and 336 were civil cases. All 87 criminal cases resulted in fines.
Of the remedies that resulted from the 336 civil cases, 172 were injunctive or conduct
remedies (51.2 percent), 69 required compulsory licensing (20.5 percent), and 95 were
structural remedies (28.3 percent).7 Our research universe in this paper is the 172 cases
that resulted in conduct remedies.
From these 172 cases, we have chosen ten for careful analysis. This is not a
random sample, but rather reflects the importance of the case; each represents a major
DOJ effort to use Section 2 of the Sherman Act to affect a substantial sector of the U.S.
economy, such as grocery retailing, gasoline distribution, telecommunications, or data
processing. Early cases involving small companies that have long since disappeared, such
as United States v. Lay Fish Company (1926), are ignored. Also ignored are the many
conspiracy cases brought under both Sections 1 and 2 of the Sherman Act that resulted in
an injunction dissolving the cartel or barring future conspiracies. We also were
influenced by the availability of data that would permit us to assess the consequences of
the remedy. Conduct remedies for the following monopolization cases are studied in
detail:8
1. United States v. United Shoe Machinery, 1947
2. United States v. AT&T, 1949
6 There were 426 cases in toto, but only 423 for which documentation could be found. See Crandall
(2001), supra note 5. 7 Greater detail may be found in Crandall (2001), supra note 5. 8 The cases are listed in chronological order based on the date that the original complaint was filed by
the government.
5
3. United States v. Standard Oil Co. of California, 1949
4. United States v. International Business Machines, 1952
5. United States v. United Fruit Co., 1954
6. United States v. Eastman Kodak Co., 1954
7. United States v. Safeway Stores Inc., et al., 1955
8. United States v. General Motors Corp., 1956
9. United States v. Jerrold Electronics Corp., et al., 1957
10. United States v. Blue Chip Stamp Co. et al., 1963
II. The Case Studies In each of the cases selected, we examine the available evidence that would assist
us in determining whether the government’s conduct remedy affected market
performance in a manner that increased consumer welfare. Given the passage of time and
incomplete data availability, it is no easy task to reach a dispositive evaluation of each of
the ten cases in our sample. But if government antitrust remedies have favorable
consequences for consumers, there should be some evidence of changes in output or
prices of the relevant products or services. Complex behavioral remedies may also
require the expenditure of substantial resources by the government and the defendants.
These costs should, in principle, be deducted from the consumer gains, if any, that accrue
from the relief. 9
9 These administrative costs of injunctive remedies are generally not available because the DOJ and the
defendants do not generally report the costs of each case.
6
1. United Shoe Machinery 10
United States v. United Shoe Machinery is the earliest case selected. United Shoe
Machinery Corp. (“USM”) began operations in 1899 with the acquisition of five shoe
machinery manufacturers, three of which were dominant sellers in their segment of the
industry. 11 These acquisitions provided USM with a prominent position in the major
segments of shoe machinery manufacturing. The company grew rapidly thereafter,
making several additional acquisitions, and it eventually centralized its manufacturing
operations in one plant in Massachusetts.12
As early as 1911, USM faced a civil suit charging it with violations of Sections 1
and 2 of the Sherman Act.13 USM won the suit, but faced another in 1915, charging that
USM’s equipment leasing practices violated Section 3 of the Clayton Act because of
tying and exclusive-use provisions in the contracts.14 This suit was won by the
government, resulting in a court decree that required USM to modify the terms of its
leases.15
USM manufactured a full line of machines used to produce shoes. By the 1940’s,
the company offered more than 300 types of machines, of which a shoe manufacturer
might need as many as 100 to perform the operations required to produce a shoe.16 As of
10 Much of this material appeared in Crandall (2001) because United Shoe Machinery was eventually
forced to divest some assets. In this article, we focus only on the conduct remedy that resulted from the 1953 case.
11 Carl Kaysen, United States v. United Shoe Machinery Corporation . (Harvard University Press, 1956), p. 6.
12 Id., p. 9. 13 Id., p. 3. 14 Id. 15 Id. 16 Scott E. Masten and Edward A. Snyder, “United States versus United Shoe Machinery Corporation:
On the Merits,” Journal of Law and Economics, Vol. 36, 1993, p. 38.
7
1949, USM had a 91 percent share of major machines and a 74 percent share of minor
machines in shoe manufacturing plants.17
USM offered its shoe machines through a combination of sale and lease
programs, but the overwhelming share of revenues came from leased machines. Shoe
machines were extremely complex and often experienced technical problems or failure.
As a result, in addition to offering machines for sale or lease, USM provided repair and
advisory services, relating to both machines sold by USM and to the shoe making process
in general.
a. The 1947 Sherman Act Suit
A third major antitrust case was brought against USM in 1947, charging USM
with violations of Section 1 and Section 2 of the Sherman Act. The government claimed
that USM had monopolized the shoe machinery market through the strategic design of
leases that impeded the purchase or lease of their competitors’ machines. Specifically, the
government charged that several provisions of USM’s leases were exclusionary. Among
the most important of these provisions were: (i) the ten-year terms of the leases; (ii) the
return charges or deferred payments due upon early termination of a lease; (iii) the
minimum monthly usage charges on machines subject to per-unit payments; and (iv) the
“full-capacity” clause that required lessees to use the machine to the fullest extent
possible in producing all shoes for which the machine is capable of being used.18
b. The Government’s Victory and Proposed Relief
In February 1953, the District Court found that USM had violated Section 2 of the
Sherman Act by illegally monopolizing the shoe machinery market and the market for
17 Several different analyses were performed to determine the market share of USM and its
competitors. These results are taken from Kaysen, supra note 11, p. 52.
8
some shoe machinery supplies.19 The Supreme Court upheld the court’s decision. 20 The
government asked the court to divide USM into three full- line manufacturers and
separate the supply activities from the machinery business. The major obstacle to
structural relief was the fact that USM produced virtually its entire output in a single
manufacturing plant. In addition, the government sought to end USM’s reliance upon
leasing and to dissolve USM’s outstanding leases. This remedy, in conjunction with
modifications in USM’s patent policies and a ban on expansion of USM through
acquisitions, was to reduce barriers to entry. 21
The court declined to order dissolution of USM, but instead structured a decree
that focused on USM’s leasing policy. Under the decree, USM was to offer its machines
for sale as well as lease, but could not make it more advantageous to lease the machines.
In addition, the duration of all new leases had to be five years or less with an option to
return machines after one year. Return charges or deferred payments were banned. USM
was barred from acquiring any shoe machinery factory or shoe supply business, or stock
in such business, for more than $10,000. USM also was severely restricted with respect to
the acquisition of patents.22
The decree was intended to stimulate competition in at least three ways. First, by
stimulating the purchase of machines, the decree might create an active second-hand
market. Second-hand machines would limit USM’s market power in the sale or lease of
new machines and provide potential entrants with valuable info rmation about USM’s
technology. Second, by limiting the terms of the leases and limiting discriminatory
18 Masten and Snyder, supra note 16, p. 57. 19 United States v. United Shoe Machinery, 110 F. Supp. 295 (1953). 20 United States v. United Shoe Machinery, 347 U.S. 521 (1954). 21 Kaysen, supra note 11, pp. 272-73.
9
termination fees, the decree might induce shoe manufacturers to choose competitors’
machines. Third, by creating a second-hand market and stimulating incremental sales of
competitive machines through a relaxation of USM’s leasing terms, the decree might
create an active independent repair sector, freeing shoe manufacturers from reliance on
USM’s service staff.
c. The Effect of the Decree
After ten years, the lower court held hearings on the effectiveness of the decree
and concluded that the decree generally was accomplishing its purposes. Specifically,
Judge Wyzanski found: (1) USM’s market share of lease and sale revenue had fallen
from approximately 85 percent in 1953 to approximately 62 percent in 1963; (2) the
number of new entrants had increased, and machinery shipments of USM’s principal
competitors increased substantially; and (3) a secondhand market had developed.23
Between 1953 and 1963, shoe factories purchased approximately 53,000
previously leased machines from USM. No single firm attained a large market share by
1963, but USM nevertheless lost about one-quarter of its pre-existing share because the
rate of entry increased following the decree. According to Waldman, entry into the
industry increased in three successive three-year periods following the decree
22 Id., p. 283 23 Gordon Parrish, The Experience With Antitrust Relief In Shoe Machinery, Ph.D. dissertation,
Washington State University, Department of Economics, 1973 at 142.

10
FIGURE 1-1 USM’S PROFIT MARGIN AND RATE OF RETURN ON EQUITY, 1944-1961
Sources: Don E. Waldman, Antitrust Action and Market Structure (1978) at 48; Moody’s Manual of Industrial Securities (Moody's Investors Service, various years).
by 11, 19, and 26, respectively. 24 However, Waldman offers no evidence that such entry
was atypical of the pre-decree period, or that the entrants provided much competition for
USM.
During the first two years after the decree was entered, USM’s net income
increased and reached an all-time high, apparently because of the sale of USM machines
that had low book value and because of an increase in lease prices. Moreover, USM’s
rate of return on equity was little affected by the decree. As Figure 1-1 shows, in the first
24 Don E. Waldman, Antitrust Action and Market Structure. Lexington Books, 1978, p. 47.
Operating Profit/Net Sales
Rate of Return on Equity
0.00
0.05
0.10
0.15
0.20
0.25
0.30
0.35
0.40
0.45
1944 1946 1948 1950 1952 1954 1956 1958 1960
11
two years after the remedy, USM’s return on equity rose, but then returned to the levels
of 1945-53.
Waldman argues that the high prices following the decree may have resulted from
USM attempting to placate the court and thereby invite competition. Waldman shows that
the average lease price for USM machines actually rose with declining market
concentration over the 1954-63 period. 25 This increase in prices, designed to attract new
entrants, was surely not conducive to an improvement in consumer welfare.
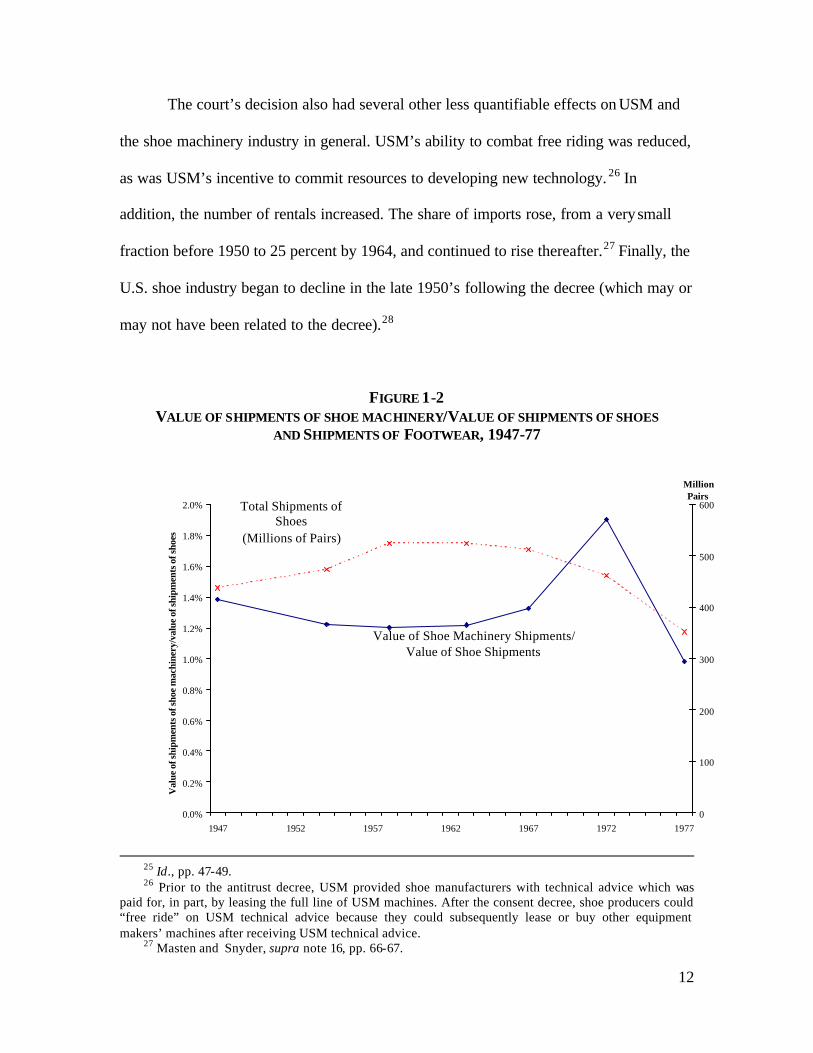
Given the heterogeneity of shoe machinery, there is no readily available index of
shoe machinery prices before and after the decree. An indirect test of the effect of the
decree on prices is possible. If the court’s remedy had succeeded in reducing machinery
prices, shoe manufacturers should have incurred lower machinery expense relative to the
value of shoes produced. Even if these lower costs were fully passed through to
consumers, the ratio of machiners’ expenses to prices should have fallen because the ratio
of capital costs to total costs would have declined. In the short run, a lower price of shoe
machines probably would not result in much substitution of machines for labor. Yet, the
ratio of shoe machinery shipments to shoe shipments declined from 0.014 in 1947 to
0.012 in 1954, but then remained constant at 0.012 in 1958, 1963, and 1967. (See Figure
1-2.) In 1972, this ratio rose sharply—perhaps in response to machine sales following the
revision of the decree in 1968, but then declined just as sharply in 1977. The average
ratio was 0.015 for the 1972-77 years combined, or approximately the same as when the
case was filed. That the value of shoe-machinery shipments did not decline relative to the
value of shoes surely suggests (but does not prove) that the decree did not put downward
pressure on shoe machinery prices.
12
The court’s decision also had several other less quantifiable effects on USM and
the shoe machinery industry in general. USM’s ability to combat free riding was reduced,
as was USM’s incentive to commit resources to developing new technology. 26 In
addition, the number of rentals increased. The share of imports rose, from a very small
fraction before 1950 to 25 percent by 1964, and continued to rise thereafter.27 Finally, the
U.S. shoe industry began to decline in the late 1950’s following the decree (which may or
may not have been related to the decree).28
FIGURE 1-2 VALUE OF SHIPMENTS OF SHOE MACHINERY/VALUE OF SHIPMENTS OF SHOES
AND SHIPMENTS OF FOOTWEAR, 1947-77
25 Id., pp. 47-49. 26 Prior to the antitrust decree, USM provided shoe manufacturers with technical advice which was
paid for, in part, by leasing the full line of USM machines. After the consent decree, shoe producers could “free ride” on USM technical advice because they could subsequently lease or buy other equipment makers’ machines after receiving USM technical advice.
27 Masten and Snyder, supra note 16, pp. 66-67.
0.0%
0.2%
0.4%
0.6%
0.8%
1.0%
1.2%
1.4%
1.6%
1.8%
2.0%
1947 1952 1957 1962 1967 1972 1977
Val
ue o
f shi
pmen
ts o
f sho
e m
achi
nery
/val
ue o
f shi
pmen
ts o
f sho
es
0
100
200
300
400
500
600
MillionPairs
Total Shipments of Shoes
(Millions of Pairs)
Value of Shoe Machinery Shipments/ Value of Shoe Shipments
13
Note: Shipments of shoes includes shipments of all footwear excluding rubber and slippers, and including interplant transfers. Source: U.S. Bureau of the Census, Census of Manufactures, various years.
d. A Concluding Assessment
After the 1964 review, the trial court rejected the government’s plea for further
relief, but the Supreme Court reversed, citing the need for “more definitive means” to
achieve competition because there had not been a sufficient decline in USM’s market
share.29 As a result in 1969, the lower court ordered USM to divest itself of about one-
third of its assets. Shortly after, the U.S. shoe industry went into steep decline. (See
Figure 1-2.) The Supreme Court judged the 1953 decree to have been a failure, and the
lower court essentially acquiesced despite its view that a one-plant firm should not be
broken up even in the mildly-growing market of 1953.
The theory that competition would be increased by offering machines for sale as
well as for lease clearly was in error. USM continued to account for almost two-thirds of
shoe-machinery revenues 16 years after the case was first brought. The price of shoe-
machinery leases during the ten years that the behavioral remedy was in place actually
rose. The decline in market concentration appears to have resulted from the defendant’s
desire to keep an umbrella over prices so as to facilitate entry and to forestall even more
punitive relief when the decree was reviewed on its tenth anniversary.
28 Id., p. 66. 29 United States v. United Shoe Machinery, 266 F. Supp. 328 (D. Mass. 1967); United States v. United
Shoe Machinery, 391 U.S. 244 (1969).
14
2. The 1949 AT&T (Western Electric) Case
The antitrust activism of the early post World War II years was reflected in a case
brought in 1949 against the American Telephone and Telegraph Corporation and its
subsidiary, Western Electric.30 A case filed in 1913 had been resolved through a consent
decree in 1914, but since that time AT&T had been regulated by the Interstate Commerce
Commission (ICC) and – beginning in 1934 – the Federal Communications Commission
(FCC).31 AT&T’s share of the nation’s telephone services market subsequently increased
substantially through mergers approved by the ICC.
a. The Telephone Industry in 1949
Prior to 1984, AT&T’s local operating companies enjoyed monopoly status in
offering local exchange and access services to residential customers and all but the
largest business firms. AT&T’s local companies had franchises that embraced nearly 85
percent of the country’s access lines; the remaining lines were controlled by smaller
independent companies, such as GTE, United, Rochester, and Continental as well as
hundreds of small, rural companies. AT&T also had a dominant position in interstate
(“long distance”) services through its Long Lines division. The FCC began to open the
interstate services market to competition in the late 1960’s, but entry into ordinary dial-up
long distance services did not occur until the mid 1970’s.
AT&T’s Western Electric division dominated the market for telephone
equipment, including transmission, signaling, and swit ching equipment, because its local
operating companies and Long Lines divisions accounted for the overwhelming share of
30 United States v. Western Electric Co., Complaint, Civil Action No. 17-49 (D.N.J. Jan. 14, 1949).
15
purchases. Western Electric also dominated the market for terminal or “customer
premises” equipment that connected subscribers to their local access lines until the FCC
began to liberalize this market in the 1970’s.
Finally, AT&T owned Bell Labs, one of the premier research institutions in the
country. This institution held hundreds of patents in areas that were important for the
development of telephone service, but its activities extended far beyond telephony. Bell
Labs was credited with developing the transistor and fiber optics, as well as making
major breakthroughs in fields as diverse as chemistry, physics, and the physiology of
speech.
b. The Antitrust Complaint
Despite the fact that decades of regulation by the ICC and FCC had guided the
development of telephony in the United States, the DOJ filed a Sherman Act suit in 1949,
alleging that AT&T had attempted to monopolize telecommunications equipment and
services through its control and licensing of telephone equipment and technology. It
identified Western Electric’s exclusive contracts with its operating companies as
anticompetitive arrangements that protected AT&T’s equipment monopoly and increased
the cost of telephone services to consumers.32 The DOJ also claimed that AT&T and
Western Electric impeded competition in local telephone services by refusing to sell
AT&T equipment to independents, requiring independents to apply for licenses to AT&T
31 In 1921, Congress passed the Willis -Graham Act, which gave the FCC authority for telephone-
company merger review. 32 Complaint, supra note 30, ¶ 72-3.
16
patents, or ultimately “forcing” the independents into the Bell System by their selling out
to AT&T. 33
The complaint focused only minimally on an issue the FCC staff had identified
more than a decade earlier: Western Electric’s prices for equipment were essentially
unregulated; therefore, the AT&T operating companies could evade the strictures of rate-
of-return regulation of its service companies by paying inflated prices for Western
Electric equipment.34 This practice did not necessarily contribute to monopoly power, but
certainly could allow AT&T to exploit any market power it enjoyed in the delivery of
telephone services.
The complaint also contended that AT&T impeded competition in
communications through its aggressive pursuit of patents in “alternative methods of
communication.”35 For example, the DOJ claimed that AT&T had patents on important
technologies that it refused to license to telegraph operators or radio stations. The
complaint identified AT&T’s innovations and the control of those innovations as the
source of AT&T’s market power.
While the technological prowess of Bell Labs might have contributed to Western
Electric’s dominant position in equipment, decades of regulatory policy also were to
blame. Had the ICC not approved scores of acquisitions by AT&T, the company would
not have enjoyed its prominent position in the purchase of telephone equipment. Perhaps
local and long distance services were still a natural monopoly in 1949, but regulators had
not yet begun to test this proposition by admitting entry into either type of service. Yet
the 1949 complaint did not identify regulation as a cause of AT&T’s market power. It
33 Id., ¶ 74. 34 Id., ¶ 124-25.

17
merely concludes that “The absence of effective competition has tended to defeat
effective public regulation of rates charged subscribers for telephone service.”36
c. The 1956 Consent Decree
The DOJ and AT&T settled the 1949 Sherman Act case in 1956, entering into a
“Final Judgment” that 26 years later would prove not to be the “final” resolution of
AT&T’s antitrust problems.37 The Final Judgment required AT&T to license all current
and future patents at a reasonable fee. Much more important were the provisions that
limited AT&T to the regulated telephone industry. Western Electric was forbidden from
manufacturing any equipment other than telephone equipment.38 In addition, AT&T
would be confined to the business of furnishing “common carrier communications”
services.39
The DOJ had asked for divestiture of Western Electric from AT&T, but settled for
much less. However, the decree did not include alternative provisions that would control
Western Electric’s relationship with AT&T’s telecommunications services divisions
because the DOJ was persuaded that the Federal Communications Commission had
ample authority to regulate AT&T’s conduct in the telecommunications sector. Thus, the
ultimate “behavioral remedy” in this case was the far-reaching regulatory authority of the
FCC that it assured the DOJ that it would use.40
35 Id., ¶ 90-99. 36 Id., ¶ 124. 37 United States v. Western Electric Co., Final Judgment, Civil Action No. 17-49, (D.N.J., Jan. 24,
1956). 38 Id., Section IV. 39 Id., Section V. 40 Note, Antitrust: Consent Decree: The History and Effect of Western Electric Co. v. United States,
1956 Trade Cas. 71,134 (D.C.N.J. 1956), Cornell Law Q., Vol. 45, 1960, p. 91.
18
The Final Judgment addressed the concern that AT&T (through Bell Labs and
Western Electric) would use its technical prowess to exclude competition from
alternative technologies, thereby insulating its telephony subsidiaries from non-telephony
communications. This contention was surely not at the heart of the 1949 complaint.
Indeed, the government’s contention that AT&T had attempted to suppress competition
from telegraph companies or from other companies in the long-distance distribution of
radio and television signals was a relatively minor component of the complaint. On the
other hand, there was little indication at that time of how the technologies developed by
Bell Labs could be used in other industries, such as office equipment (later, computers).
The DOJ’s decision to limit AT&T, Bell Labs, and Western Electric to the regulated
confines of telephony was unexpected, and would prove to be unfortunate.
The remaining provisions of the decree required AT&T to license patents at
reasonable royalties and, in some cases, on a royalty-free basis. AT&T also was enjoined
from entering into exclusive distribution agreements with its competitors and into
requirements contracts with other telephone companies. It also was barred from
acquiring, in whole or in part, other telephone equipment suppliers or any assets from
such suppliers.
d. The Effects of the Decree
As described above, telephone service in 1949-56 was a regulated monopoly. At
the time, there was no intimation of the prospects for competition, although the FCC had
begun to consider opening up some spectrum for private microwave services. The price
and output of telephone services were both completely under the control of the FCC and
the state regulatory commissions. No antitrust decree could have increased competition in
19
telephone services if the regulators were uninterested in liberalizing the intrastate and
interstate markets.
Moreover, as noted above, the DOJ was persuaded to leave the Western Electric-
AT&T relationship in the hands of the FCC, which had sufficient power under the 1934
Communications Act to control any anticompetitive conduct that developed from this
relationship. The FCC and the states had begun to use their joint regulatory authority to
keep AT&T’s local rates suppressed by shifting a substantial burden of paying for
AT&T’s local fixed network costs to interstate long-distance services. This regulatory
compact apparently appeased the state regulatory authorities and relieved the pressure for
further restrictions on AT&T’s behavior.41 Unfortunately, the “cross subsidies” that were
spawned at this time were eventually to grow and cost consumers billions of dollars per
year in lost benefits from long-distance calling.42
Western Electric’s domination of the telephone equipment market would continue
well after the1956 decree was entered. Regulators continued to approve tariffs that
mandated the use of Western Electric’s terminal equipment.43 It was not until the mid
1970’s that the FCC finally succeeded in prying this market open for competitors despite
the strenuous objections of state regulators.44 Given that AT&T and its operating
companies continued to enjoy a regulated monopoly status in the delivery of intrastate
and interstate services, it was not likely to look kindly on the purchase of transmission
and switching equipment not produced by Western Electric. Indeed, competition in such
41 Geoffrey M. Peters, “Is the Third Time a Charm? A Comparison of the Government’s Major
Antitrust Settlements with AT&T This Century,” Seton Hall Law Review, Vol. 15 (1985), p. 262. 42 See Robert W. Crandall and Leonard Waverman, Who Pays for Universal Service? When Telephone
Subsidies Become Transparent. Brookings, 2000, for a critique of this universal service policy. 43 As late as 1966, the courts affirmed the FCC’s jurisdiction in approving tariffs that limited terminal
equipment competition. See Carter v. AT&T, 365 F.2d 486 (5th Cir. 1966).

20
equipment did not begin in earnest until long distance service competition began in the
1970’s.
Banishing AT&T and its manufacturing subsidiary from all markets except
regulated telephone services and the equipment required to deliver them had little effect
on its telephone monopoly. This monopoly continued until regulators and the courts
began to pry open the long-distance market 20 years later. However, the court- imposed
quarantine meant that AT&T could not enter the new electronics markets, such as
computers or home electronics. Since Bell Labs had invented the transistor and later
developed a major software operating system, it was well positioned to invade the
computer market as it began to develop. Instead, AT&T licensed its UNIX software on a
royalty-free basis and was forced to ignore the computer business altogether.45
No one can be sure if AT&T would have become an important competitor in
either computer hardware or software, but it might have. Had AT&T been allowed to
develop a successful line of computer equipment, it could have negated any need for the
DOJ to bring its mammoth and eventually unsuccessful suit against IBM in 1969. In
addition, UNIX could have become an important operating system for personal
computers, competing with Microsoft in this market. Instead, UNIX developed as an
operating system for servers and work stations.46
Ironically, the Attorney General at that time, Herbert Brownell, viewed the decree
as an important step in unleashing competition in electronics:
44 North Carolina Utilities Commission v. FCC, 552 F. 2d 1036 (1977), cert denied, 434 U.S. 874
(1977). 45For a discussion of the development of UNIX, see http://www.bell-labs.com/history/unix/sharing.html 46 For a discussion of the role of UNIX, see Charles H. Ferguson, High St@kes, No Prisoners: A
Winner’s Tale of the Greed and Glory in the Internet Wars . Random House, 1999, p. 44.
21
“The decree makes available to any citizen all inventions and know-how of the
Bell System. Thus there is a sound basis for the expectation that the judgment will
lead to a further expansion of the electronics art and that new enterprise will be
encouraged to enter that field.”47
Unfortunately, the Attorney General apparently did not think that allowing AT&T the
opportunity for exploiting its intellectual property in areas outside of telephony was
important in applying Bell Labs’ “know how” to other problems. He cut off a major
potential source of innovation for the next 28 years.48
Finally, the decree probably slowed AT&T’s development of a full digital, stored
program control telephone switching machine – essentially a digital computer for
switching telephone calls. In the early 1980’s, Western Electric was so far behind its
rivals in developing such a switch that its New York operating company petitioned
AT&T’s central office for the right to buy Northern Telecom (now Nortel) switches to
serve its large business customers in New York.49 Had AT&T and Western Electric been
permitted to participate in the nascent computer business after 1956, they might have
developed a fully digital switch much sooner.
The effect of the antitrust case on the financial market’s expectations of AT&T’s
future performance was surprisingly muted. Using the standard capital-asset pricing
model, the excess return on AT&T stock was only -1.5 percent over the first month and
the six months following the complaint. The comparable returns following the entering of
47 As quoted in “Note,” supra note 40, p. 92. 48 AT&T would be freed to enter non-telecommunications businesses after the 1984 divestiture that
resulted from the next major AT&T antitrust case.
22
the conduct remedy were a positive 3.9 percent and 2.5 percent, respectively. The
financial markets clearly viewed the decree as favorable to AT&T relative to prior
expectations. Of course, the market could not have known nor been interested in how the
decree might affect AT&T’s ability to participate in the computer, software, and
electronic switching markets 15 to 25 years later.
e. Conclusion
The 1949 Western Electric (AT&T) case did not and could not increase
competition in telephone equipment or services because AT&T’s market position in local
and long-distance services was controlled by federal and state regulators. The
government suit did not address the actual source of AT&T’s monopoly power, but
instead left the FCC with the authority to regulate the activities that were at the heart of
the antitrust complaint. The behavioral remedy required AT&T to license its existing
patents on a royalty-free basis and to confine itself to common carrier
telecommunications. It is possible that this limitation on AT&T’s activities impeded the
development of competition in related industries, such as computers and computer
software. The remedy relegated one of the country’s premier sources of innovation in
electronics and software, Bell Labs, and its parent to the regulated telecommunications
sector. Whether this competition would have developed to a level that would obviate the
1969 case against IBM or the current Microsoft litigation we will never know. However,
it is possible that consumers were deprived of an early source of competition for IBM and
Microsoft.
49 Robert W. Crandall, After the Breakup: U.S. Telecommunications in a More Competitive Era.
Brookings, 1991, p. 81.
23
3. Standard Oil (Cal.)
For decades, “integrated” oil refiners have produced crude oil, refined it into
various petroleum products, and distributed these products. As part of their distribution
chain, integrated refiners invested in wholesale and retail facilities, including retail
gasoline stations. However, only a small share of gasoline was distributed through
refiner-owned gasoline stations in the early part of the 20th century.50
Prior to 1946, most refiners relied primarily on independent retailers to market
their gasoline under the refiner’s trade name. The refiner provided the motor fuel and
motor oil as well as automobile accessories, such as tires, batteries, and accessories
(“TBA”), generally under exclusive contracts that required the retailer to purchase all
such products from the refiner whose brand was displayed by the gasoline station. These
requirements contracts foreclosed competing suppliers of petroleum products and
automobile accessories from marketing their products at retail gasoline outlets affiliated
with these refiners, including Standard Oil of California.
a. The antitrust case
Gasoline retailers can be classified in three ways in terms of property
relationships. “Company-owned” stations are owned and operated by an oil company.
The oil company makes the business decisions for the company-operated station. Other
stations are owned by the oil refiner but leased to an independent service station manager
(“lessee-dealer”). Finally, there are independent stations that have no refiner ownership
(“open-dealer”). In the latter two cases, oil companies supply oil to independent stations,
50 Thomas F. Hogarty, “The Origin and Evolution of Gasoline Marketing,” Research Study # 022,
American Petroleum Institute, October 1, 1981, Section III, P. 17.

24
but they do not make business decisions other than those specified in the supply contract.
All of the major oil companies used exclusive requirements contracts in supplying the
latter two types of stations through World War II.51
In 1946, Standard Stations, a wholly owned subsidiary of Standard Oil of
California, had exclusive requirements contracts with 16 percent of the retail gas stations
in the seven-state Western area52 and sold 23 percent of the total taxable gallons of
gasoline. These exclusive contracts covered mainly gasoline, but some covered TBA.
The contracts were annual, but terminable in six months with 30 days written notice.53
In 1947, the DOJ brought suit against Standard Oil for employing requirements
contracts in selling motor gasoline, oil, and TBA to its dealers, alleging a violation of
Section 1 of the Sherman Act and of Section 3 of the Clayton Act.54 The DOJ alleged
that the use of requirements contracts lessened competition in both interstate and
intrastate commerce because exclusive requirements contracts prevented retail gasoline
marketers from dealing with other suppliers. Requirements contracts were seen as a
means of foreclosing independent refiners from the retail gasoline market, thereby
erecting a barrier to entry into the refining sector. The DOJ contended that the
elimination of requirements contracts would open the market to independent refiners and
encourage “split-pump” stations (stations offering more than one brand of gasoline).
The District Court ruled that the requirements of a potential lessening of
competition or a tendency to establish monopoly were adequately met by proof that the
51 Don E. Waldman, The Economics of Antitrust: Cases and Analysis. Little, Brown and Company,
1986, p.248. 52 Arizona, California, Idaho, Nevada, Oregon, Utah, and Washington. 53 United States v. Standard Oil Co. of California, Complaint, Civil Action No. 6159-B (D. So. Cal.,
1947). 54 Id.
25
contracts covered “… a substantial number of outlets and a substantial amount of
products.”55 The court ruled that “the substantial lessening of competition was an
automatic result, for the very existence of such contracts denies dealers the opportunity to
market the products of competing suppliers and excludes suppliers from access to the
outlets controlled by those dealers.” The Supreme Court concurred that the use of
requirements contracts by Standard Oil foreclosed competition in the petroleum products
and automobile accessories market and therefore Standard Oil had violated Section 3 of
the Clayton Act.56
The decree entered against Standard Oil in the lower court banned the use of
requirements contracts in refiner sales of gasoline, oil, and TBA to independent stations.
Justice Douglas dissented, arguing that the decree would simply encourage vertical
integration by refiners into gasoline retailing, thereby reducing the presence of
independent gasoline refiners and retailers.57
1. The Theory of the Case
The DOJ’s theory of the case was that Standard Oil employed these requirements
contracts to reduce competition in the sale of gasoline, oil, and TBA. These contracts
excluded independent refiners, both in toto and as suppliers to stations that might offer
more than one brand of gasoline. The government claimed that such contracts prevented
“split-pump” stations from developing, thereby reducing competition in refining and
retailing.
55 United States v. Standard Oil Co. of California, 78 F. Supp. 850 (1948). 56 United States v. Standard Oil Co. of California, 337 U.S. 293 (1949). 57 Dissent of Associate Justice William O. Douglas in United States v. Standard Oil Co. of California,
337 U.S. 293 (1949).
26
Requirements contracts serve a useful economic purpose, however, regardless of
their alleged effects on competition. They offer added predictability and stability in a
fluctuating market. Indeed, the lower court decision granted that such contracts may
reduce uncertainty for both the seller (refiner) and the buyer (the station owner/
manager). “In the case of the buyer, they may assure supply, afford protection against
rises in price, enable long-term planning on the basis of known costs, and obviate the
expense and risk of storage in the quantity necessary for a commodity having a
fluctuating demand. From the seller’s point of view, requirements contracts may make
possible the substantial reduction in selling expenses, give protection against price
fluctuations, and – of particular advantage to a newcomer to the field to whom it is
important to know what capital expenditures are justified – offer the possibility of a
predictable market.”58
In addition, such contracts may solve a principal-agent problem and avo id
“double marginalization” in the setting of the downstream price.59 It is in the interest of
refiners for its retailers to exert effort in selling its products and to exact no more than
competitive markups. But station managers may thwart these goals through a lack of
effort or a desire to raise price above a competitive level if the stations enjoy any
advantages of a favorable location. The requirements contract, appropriately written, can
negate any such attempts by the dealer to engage in double marginalization.
If these alternative theories are valid, requirements contracts could actually
improve economic efficiency and reduce consumer prices.
58 United States v. Standard Oil Co. of California, 337 U.S. 293 (1949). 59 Andrea Shepard, “Contractual form, retail price, and asset characteristics in gasoline retailing, Rand
Journal of Economics, vol. 24 (1), Spring 1993, pp. 58-77. For an early analysis of double marginalization,
27
b. The Effect of the Decree on Industry Structure
1. Refining
Large refineries with refining capacity of more than 40,000 barrels/day are
generally vertically integrated into all four sectors of oil industry (production, refining,
transportation, and marketing). Smaller refineries may or may not be integrated into all
four sectors; some are not vertically integrated and some are integrated into less than all
four sectors. Refineries that were vertically integrated into all four sectors controlled 89.1
percent of U.S. refining capacity in 1950, but substantially less of U.S. oil production and
marketing.60
The DOJ’s case was based in part on the theory that the elimination of
requirements contracts would result in the entry of independent refiners into the refining
sector. However, the available data indicate that both the absolute number and the
percentage of independent refiners declined after 1949.
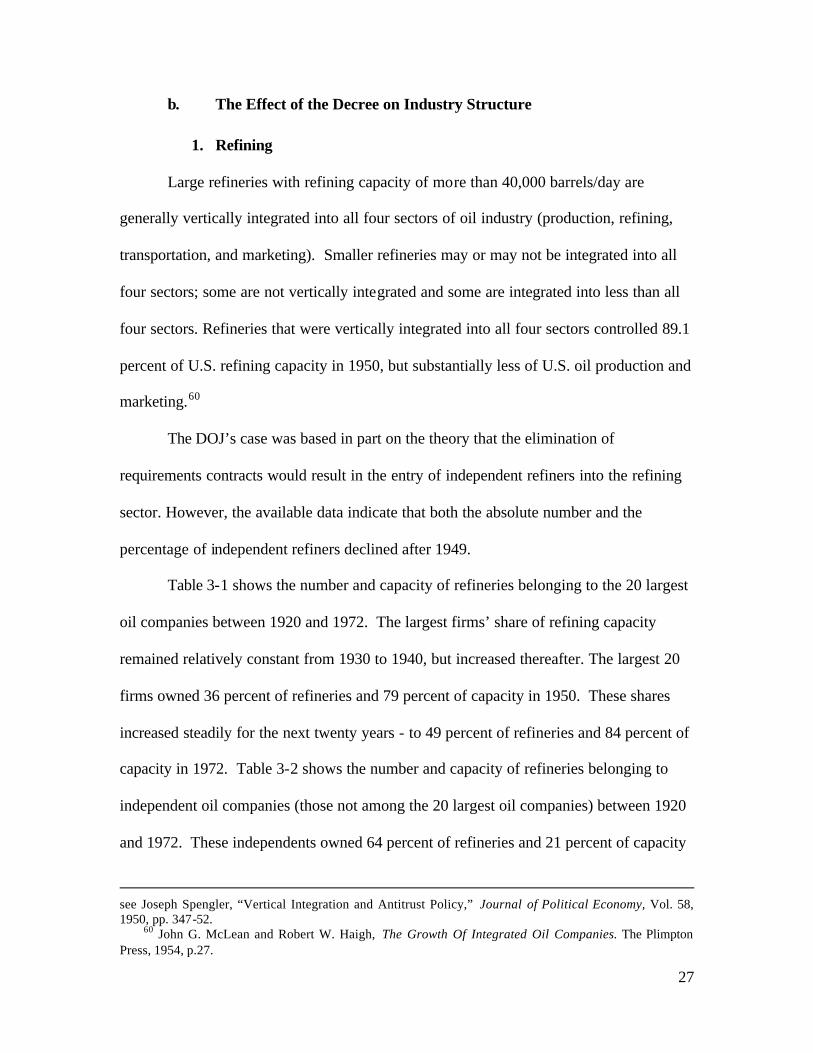
Table 3-1 shows the number and capacity of refineries belonging to the 20 largest
oil companies between 1920 and 1972. The largest firms’ share of refining capacity
remained relatively constant from 1930 to 1940, but increased thereafter. The largest 20
firms owned 36 percent of refineries and 79 percent of capacity in 1950. These shares
increased steadily for the next twenty years - to 49 percent of refineries and 84 percent of
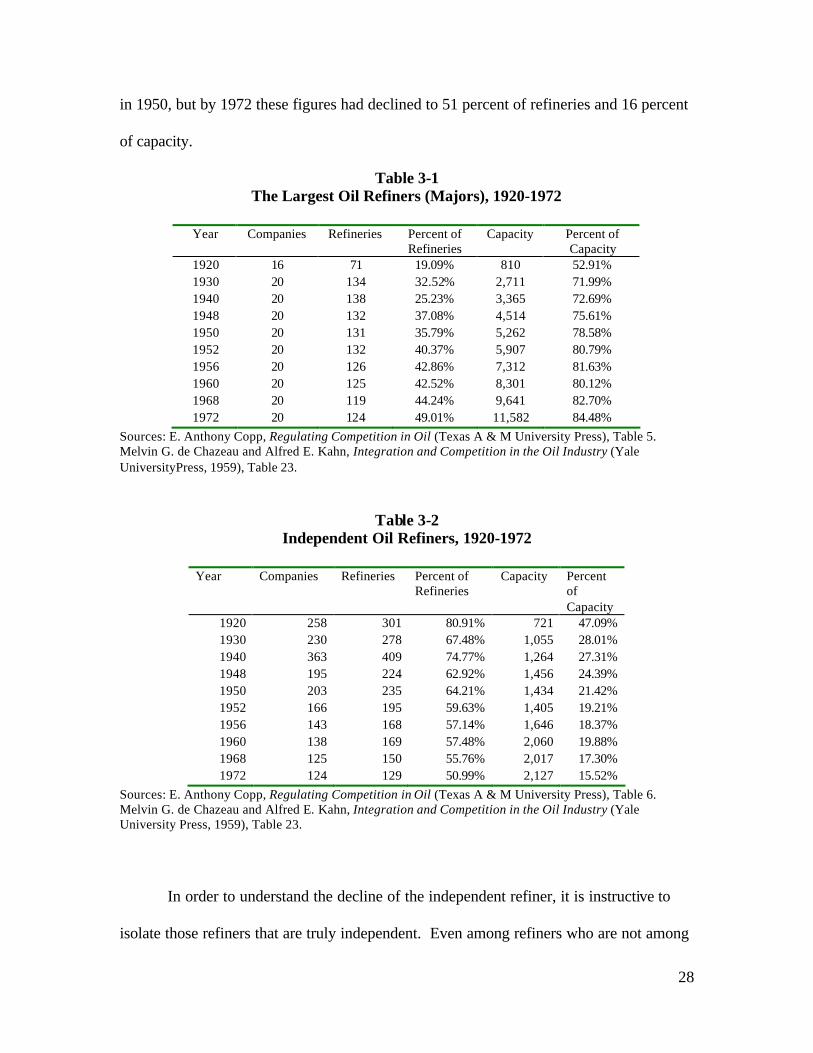
capacity in 1972. Table 3-2 shows the number and capacity of refineries belonging to
independent oil companies (those not among the 20 largest oil companies) between 1920
and 1972. These independents owned 64 percent of refineries and 21 percent of capacity
see Joseph Spengler, “Vertical Integration and Antitrust Policy,” Journal of Political Economy, Vol. 58, 1950, pp. 347-52.
60 John G. McLean and Robert W. Haigh, The Growth Of Integrated Oil Companies. The Plimpton Press, 1954, p.27.
28
in 1950, but by 1972 these figures had declined to 51 percent of refineries and 16 percent
of capacity.
Table 3-1 The Largest Oil Refiners (Majors), 1920-1972
Year Companies Refineries Percent of
Refineries Capacity Percent of
Capacity 1920 16 71 19.09% 810 52.91% 1930 20 134 32.52% 2,711 71.99% 1940 20 138 25.23% 3,365 72.69% 1948 20 132 37.08% 4,514 75.61% 1950 20 131 35.79% 5,262 78.58% 1952 20 132 40.37% 5,907 80.79% 1956 20 126 42.86% 7,312 81.63% 1960 20 125 42.52% 8,301 80.12% 1968 20 119 44.24% 9,641 82.70% 1972 20 124 49.01% 11,582 84.48%
Sources: E. Anthony Copp, Regulating Competition in Oil (Texas A & M University Press), Table 5. Melvin G. de Chazeau and Alfred E. Kahn, Integration and Competition in the Oil Industry (Yale UniversityPress, 1959), Table 23.
Table 3-2 Independent Oil Refiners, 1920-1972
Year Companies Refineries Percent of
Refineries Capacity Percent
of Capacity
1920 258 301 80.91% 721 47.09% 1930 230 278 67.48% 1,055 28.01% 1940 363 409 74.77% 1,264 27.31% 1948 195 224 62.92% 1,456 24.39% 1950 203 235 64.21% 1,434 21.42% 1952 166 195 59.63% 1,405 19.21% 1956 143 168 57.14% 1,646 18.37% 1960 138 169 57.48% 2,060 19.88% 1968 125 150 55.76% 2,017 17.30% 1972 124 129 50.99% 2,127 15.52%
Sources: E. Anthony Copp, Regulating Competition in Oil (Texas A & M University Press), Table 6. Melvin G. de Chazeau and Alfred E. Kahn, Integration and Competition in the Oil Industry (Yale University Press, 1959), Table 23.
In order to understand the decline of the independent refiner, it is instructive to
isolate those refiners that are truly independent. Even among refiners who are not among

29
the major oil companies, there are some that are vertically integrated across the
production, refining, marketing, and transportation sectors. Table 3-3 divides refineries
into integrated and non- integrated and further divides integrated refiners into large and
small. The demise of the independent refiner is even more apparent in Table 3-3.
Between 1949 and 1963, the capacity of independent refiners declined from 19 to 9
percent, mostly due to the growth of the integrated small refiner.
Table 3-3 Integrated and Non-Integrated Ownership of Refineries: 1949-63
Group I: 22 Largest
Companies and Subsidiaries Group II: Other Integrated Companies, (Capacity >=
25,000 b/d)
Group III: Non-Integrated Companies
Year Plants % Plants % Plants % 1949 133 36.3 1 0.3 232 63.4 1952 137 41.3 6 1.8 189 56.9 1955 126 42 15 5 159 53 1958 123 41.4 20 6.7 154 51.9 1961 126 42.4 28 9.4 143 48.2 1963 125 42.7 33 11.3 135 46 Group I: 22 Largest
Companies and Subsidiaries Group II: Other Integrated Companies, (Capacity >=
25,000 b/d)
Group III: Non-Integrated Companies
Year Capacity % Capacity % Capacity % 1949 5.16 80.15 0.03 0.4 1.25 19.45 1952 6.01 82.18 0.08 1.14 1.22 16.68 1955 7.25 84.02 0.28 3.27 1.10 12.71 1958 7.43 82.12 0.41 4.49 1.21 13.39 1961 8.15 83.05 0.69 7.07 0.99 9.88 1963 8.24 83.09 0.77 7.73 0.91 9.18 Source: Robert Love Bryson, Jr., The Evolution of Private Brand Marketers in the Petroleum Industry (1965) (unpublished D.B.A. thesis, Indiana University)
The decline of the independent refiner after 1950 was the result of technological
change in the refining process. With the introduction of catalytic cracking, many of the
non- integrated refineries became obsolete. In addition, the minimum efficient scale of a
30
refinery plant increased, increasing the capital required to build a new refinery. The
DOJ’s attempt to foster growth of independent refiners through a conduct remedy that
banned requirements contracts did not succeed.
2. Retailing
Justice Douglas dissented from the court’s majority opinion, predicting that oil
companies would increase the percentage of stations that were company owned and
operated at the expense of lessee-dealer and independently-operated stations if they were
denied the right to use requirements contracts.61
The method of doing business under requirements contracts at least keeps
the independents alive. They survive as small business units. The
situation is not ideal from either their point of view or that of the nation.
But the alternative that the Court offers is far worse from the point of view
of both. The elimination of these requirements contracts sets the stage for
Standard and the other oil companies to build service station empires of
their own. 62
Douglas’ prediction proved to be accurate. Standard Stations had entered into
exclusive supply arrangements with 5,937 independent stations (in the seven Western
states) as of March 12, 1947.63 As of 1957, the number of independent stations (in the
seven Western states) affiliated with Standard Stations had fallen to 3,919.64 Standard
Stations had 1,040 company operated gas stations in 1957.
61 Both lessee-dealer operated and independent-dealer operated stations were cited as independent gas
stations in the case. 62 Dissent of Associate Justice William O. Douglas in United States v. Standard Oil Co. of California,
337 U.S. 293 (1949) at ¶ 315. 63 Id. 64 Exclusive Dealing in the Petroleum Industry: The Refiner-Lessee Relationship, Richard A. Miller,
Ph.D. dissertation, Yale University, Department of Economics, 1962.

31
In the overall gasoline retailing industry, there was a gradual shift to company
operated stations after the decree as the industry became more vertically integrated. In
the late 1940’s, the company-owned and operated station was extremely rare as Table 3-4
shows. Only about 0.5 percent of gas stations of the six integrated oil companies listed
were company-owned and operated in 1949. The independent gas station was the
dominant gasoline retailer, and the company-owned and operated gas station was
virtually non-existent.
Table 3-4
Types of Service Stations, 1949
Company-Owned and
Operated Lessee-Dealer
Operated Independent-Dealer
Operated Total Gulf Oil Corporation 270 5,613 26,658 32,541 The Texas Company 3 10,371 31,446 41,820 Sinclair Oil Corporation 5 7,079 11,709 18,793 The Ohio Oil Company 10 664 1,115 1,789 Standard Oil Company (Indiana) 49 9,802 6,641 16,492 Standard Oil Company (Ohio) 312 581 3,621 4,514 Total 649 34,110 81,190 115,949
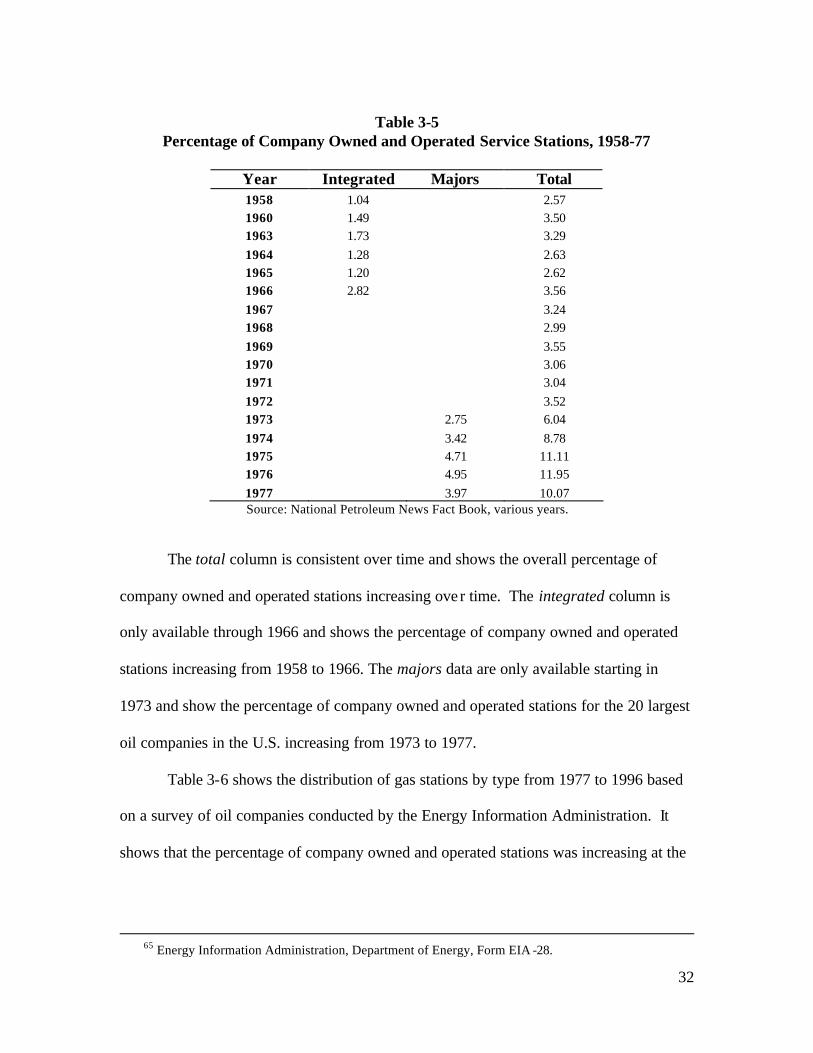
Source: McLean and Haigh, The Growth of Integrated Oil Companies, Table 16-1, p. 486. After 1949, however, the percentage of gas stations that were company owned
and operated began to increase. By 2000, 23 percent of all gas stations were company-
owned and operated (Table 3-6).65 Table 3-5 presents the percentage of company owned
and operated gas stations in the intervening period of 1958 to 1977 based on a survey of
oil companies conducted by National Petroleum News. Because the classification of
companies in this survey changes over time, three percentages are displayed.
32
Table 3-5
Percentage of Company Owned and Operated Service Stations, 1958-77
Year Integrated Majors Total 1958 1.04 2.57 1960 1.49 3.50 1963 1.73 3.29 1964 1.28 2.63 1965 1.20 2.62 1966 2.82 3.56 1967 3.24 1968 2.99 1969 3.55 1970 3.06 1971 3.04 1972 3.52 1973 2.75 6.04 1974 3.42 8.78 1975 4.71 11.11 1976 4.95 11.95 1977 3.97 10.07 Source: National Petroleum News Fact Book, various years.
The total column is consistent over time and shows the overall percentage of
company owned and operated stations increasing ove r time. The integrated column is
only available through 1966 and shows the percentage of company owned and operated
stations increasing from 1958 to 1966. The majors data are only available starting in
1973 and show the percentage of company owned and operated stations for the 20 largest
oil companies in the U.S. increasing from 1973 to 1977.
Table 3-6 shows the distribution of gas stations by type from 1977 to 1996 based
on a survey of oil companies conducted by the Energy Information Administration. It
shows that the percentage of company owned and operated stations was increasing at the
65 Energy Information Administration, Department of Energy, Form EIA -28.
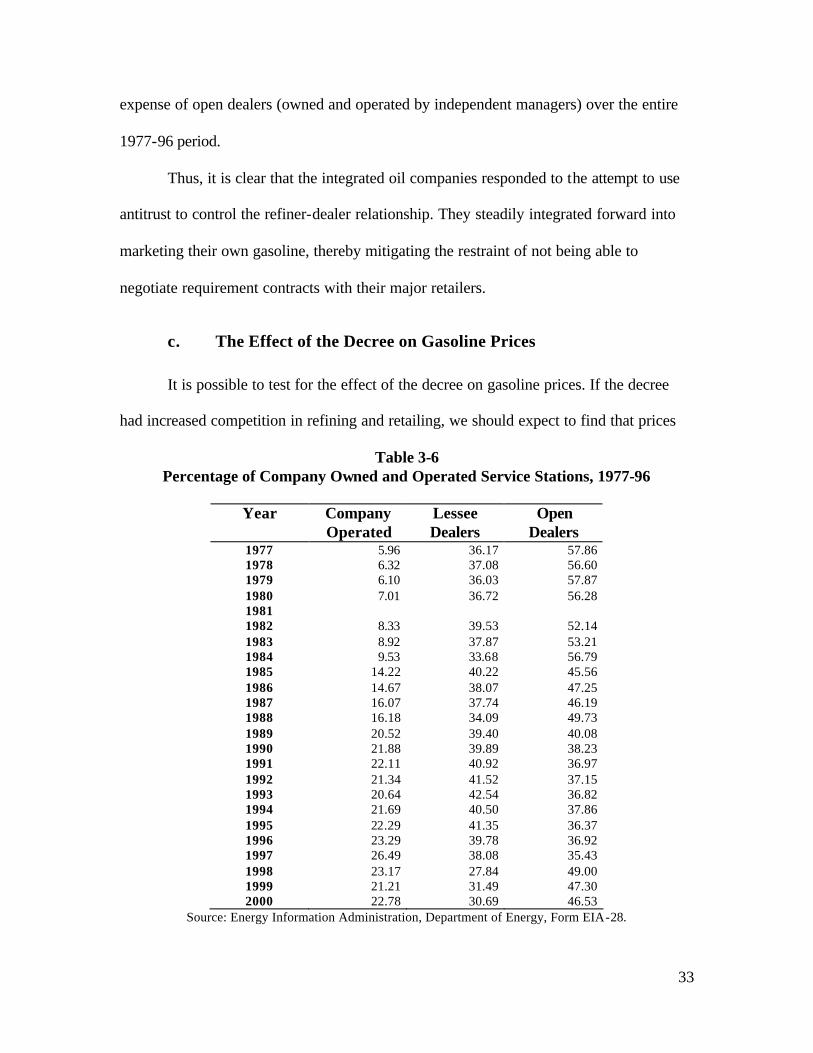
33
expense of open dealers (owned and operated by independent managers) over the entire
1977-96 period.
Thus, it is clear that the integrated oil companies responded to the attempt to use
antitrust to control the refiner-dealer relationship. They steadily integrated forward into
marketing their own gasoline, thereby mitigating the restraint of not being able to
negotiate requirement contracts with their major retailers.
c. The Effect of the Decree on Gasoline Prices
It is possible to test for the effect of the decree on gasoline prices. If the decree
had increased competition in refining and retailing, we should expect to find that prices
Table 3-6 Percentage of Company Owned and Operated Service Stations, 1977-96
Year Company
Operated Lessee Dealers
Open Dealers
1977 5.96 36.17 57.86 1978 6.32 37.08 56.60 1979 6.10 36.03 57.87 1980 7.01 36.72 56.28 1981 1982 8.33 39.53 52.14 1983 8.92 37.87 53.21 1984 9.53 33.68 56.79 1985 14.22 40.22 45.56 1986 14.67 38.07 47.25 1987 16.07 37.74 46.19 1988 16.18 34.09 49.73 1989 20.52 39.40 40.08 1990 21.88 39.89 38.23 1991 22.11 40.92 36.97 1992 21.34 41.52 37.15 1993 20.64 42.54 36.82 1994 21.69 40.50 37.86 1995 22.29 41.35 36.37 1996 23.29 39.78 36.92 1997 26.49 38.08 35.43 1998 23.17 27.84 49.00 1999 21.21 31.49 47.30 2000 22.78 30.69 46.53
Source: Energy Information Administration, Department of Energy, Form EIA-28.
34
of gasoline declined after the decree, after taking into account other influences on prices,
such as the cost of crude oil, gasoline taxes, and the intensity of demand. On the other
hand, if vertical integration into retailing offset the effect of banishing requirements, we
would expect to find no effect of the decree on retail gasoline prices. Table 3-7 provides
the results of a regression analysis of retail gasoline prices (both including and excluding
taxes) on the price of crude oil, sales and excise taxes (“Tax”), the unemployment rate, a
time trend, and a dummy variable that is equal to one for years after the decree. The data
are from 1946 to 1969.66 The post-decree dummy covers the period from 1950 to 1969.67
The regression results confirm that retail gasoline prices rise when the price of
crude oil increases and decline in periods in which the economy is weak and
unemployment is rising. The post-decree dummy variable is not statistically significant in
these regressions, either by itself or when interacted with the crude-oil price, implying
that the conduct remedy did not have an effect on the retail price of gasoline. This
suggests that the requirements contracts had efficiency effects that could be obtained
through forward vertical integration. When the conduct remedy banned requirements
contracts, refiners simply integrated into retail gasoline distribution. The conduct remedy
had neither beneficial nor deleterious effects on consumer welfare. It was largely
irrelevant.
66 The gasoline price, crude oil price, and sales tax data are from American Petroleum Institute’s
Petroleum Facts and Figures. The gasoline price index data are from the Bureau of Labor Statistics Consumer Price Index.
67 The number of motor vehicle registrations and gross domestic product were also included in the original specification, but were dropped due to statistical insignificance and scarce degrees of freedom.
35
There is a growing literature on the effect of contractual relationships between the
refiner and the retailer on retail gasoline prices.68 The recurring conclusion from this
literature is that retail prices are lower at company owned and operated stations and
higher at independent stations. These results confirm the fact that vertical integration or
some alternative, such as requirements contracts, helps to solve the principal-agent
problem in gasoline refining and marketing. Fortunately, the DOJ’s attempt to block one
solution to this problem was overcome by forward integration on the part of refiners.
Had this avenue not been available to the integrated refiners, the behavioral relief in the
1949 decree would likely have led to higher gasoline prices and lower consumer welfare.
d. Conclusion
The Standard Stations conduct remedy did not arrest the decline in independent
refiners’ share of capacity or sales. Moreover, as Justice Douglas predicted in his dissent,
the integrated refiners’ downstream integration into gasoline retailing grew after the
decree. Whether it was because of the decree is not clear. Nevertheless, subsequent
research has shown that forward integration by oil companies into retailing lowers retail
gasoline prices. Unable to solve the principal-agent problem through contracting after the
imposition of the Standard Stations conduct remedy, these companies expanded into
providing the service themselves. Consumers of gasoline and other refined products were
thus saved from a major misunderstanding of market forces that led the DOJ to seek a
decree that banned an efficiency-enhancing form of transaction.
68 See, for example, Andrea Shepard (1993), supra note 59; John Barron and John Umbeck, “The
Effects of Different Contractual Arrangements: The Case of Retail Gasoline Markets,” Journal of Law and Economics, Vol. 27, 1984, pp. 313-28; and Michael J. Vita, “Regulatory Restrictions on Vertical Integration and Control: The Competitive Impact of Gasoline Divorcement Policies,” Federal Trade Commission, Bureau of Economics, Working Paper No. 227, August 1999.

36
Table 3-7 Regression Analysis of the Determinants of the Retail Price of Gasoline, 1946-69
(T-statistics in parentheses) Dependent Variable:
Gasoline Consumer Price Index, 1944-69
(Including tax)
Dependent Variable: Retail Price of Regular Grade
Gasoline, 1944-69 (Excluding tax)
Intercept 8.64 (10.51)
8.55 (10.50)
0.25 (18.49)
0.25 (18.68)
Tax -0.02 (-2.99)
-0.02 (-3.00)
Time Trend 0.45 (26.56)
0.45 (23.68)
-0.003 (-11.34)
-0.003 (-10.16)
Price of Crude Oil 2.33 (7.59)
2.37 (7.70)
0.03 (5.07)
0.03 (5.15)
Unemployment Rate -0.19 (-2.11)
-0.19 (-2.04)
-0.006 (-3.72)
-0.006 (-3.64)
Post-Decree/ CrudeOil Interaction
0.09 (0.97)
0.003 (1.49)
Post-Decree Dummy
0.30 (0.80)
0.01 (1.47)
Adj. R-Squared 0.9884 0.9883 0.9277 0.9275
4. IBM (1952) The 1952 Section 2 case brought by the DOJ against IBM has many similarities
to the United Shoe Machinery case. IBM dominated the “tabulating machine” business
and the related business of tabulating cards, or “punch cards,” long before the
commercial development of the computer. It only leased these machines; it did not offer
them for sale.
a. The Antitrust Suit
The DOJ alleged that IBM had achieved monopoly power in the business
machines market, including tabulating machines, through its lease-only policy, the tying
of service to its leasing agreements, and a restrictive patent policy. In addition, IBM
allegedly enjoyed monopoly power in tabulating cards, which it maintained in part
37
through discriminatory pricing and tying cards to machines. The complaint claimed that
IBM had a 90 percent share of tabulating cards sold in the United States. Although much
of the complaint was addressed to IBM’s position in tabulating machines and tabulating
cards, the government’s complaint addressed IBM’s position in all business machines,
including the burgeoning electronic data processing machines, i.e. computers.
b. The Decree
IBM settled the case in 1956 by agreeing to offer its machines for sale at a reasonable
relationship to its lease rates, limit leases to a period of one year, and to refrain from
tying service or cards to the lease of its machines. IBM also agreed not to buy used
machines and to offer its patents at reasonable royalties. In addition, IBM was required to
offer its data processing services from a separate “service bureau” subsidiary69 and divest
some of its card manufacturing capacity if its share of this market had not fallen to 50
percent or less by 1962. Since its share of tabulating card sales had fallen to only 53
percent by the required date, some divestiture was required. In 1963, therefore, IBM sold
rotary presses capable of producing about 3 percent of industry output.
c. Effects of the Decree
By 1962 the computer was rapidly replacing tabulating machines. Since IBM was
using some of the same leasing and tying practices in selling computers as the antitrust
case was being litigated, the decree also required IBM to abandon its reliance on long-
term leasing and its tying practices in the sale of computers. Given the sharp rise in
computer sales after 1956, the effect of the decree should be assessed in terms of its
69 This service bureau was subsequently sold to Control Data Corporation to settle a private suit.

38
effect on the computer market. We begin, however, with a discussion of the effects on
the price of tabulating cards.
Baldwin contends that the decree worked because it led to an increase in price
competition for tabulating cards between 1959 and 1966.70 Waldman, however, shows
that card prices actually rose after the decree, partly because IBM wished to induce entry
so that it could comply with the decree’s requirement that it reduce its market share in
cards to 50 percent by 1962.71 Neither Waldman nor Baldwin compares the subsequent
decline in tabulating card prices with the general decline in paperboard prices between
1959 and 1966.72 Given the decline in prices of the feedstock for producing the cars, it is
difficult to attribute even the decline in tabulating card prices to the decree.
Much more important was the effect, or lack of effect of the decree on the
computer market. Even if the decree led to greater competition in tabulating cards,
Walkman claims it was a failure because the new firms that entered the business machine
market after the decree failed to achieve sustainable profits and could not wrest market
share from IBM. At the time that the 1952 case was brought, IBM was not even in the
computer market. Its first commercial machine was offered for lease in April, 1953, two
years after Remington Rand introduces Univac I.73
Even though it initially lagged behind Remington in offering computers, IBM’s
share of electronic data processing equipment installed sales base increased steadily after
1955 even with the restrictions imposed by the decree.74 IBM’s revenues soared and its
70 William L. Baldwin, “The Feedback Effect of Conduct on Industry Structure,” Journal of Law and
Economics, Vol. 12, April 1969, p. 137. 71 Waldman (1978), supra note 24, p. 141. 72 U.S. Bureau of Labor Statistics, Producer Price Index, WPU0914. 73 Waldman (1978), p. 134. 74 Waldman (1978), p. 139.
39
rate of return on equity remained very high. Nor is there any evidence that the new
entrants affected the prices of IBM’s machines, but such evidence would be difficult to
muster given the rapid rate of technical change in this sector and the need to adjust prices
for the changing performance of these machines.
The absence of evidence that this extensive decree had any favorable effects on
competition in the electronic data processing machines sector as it evolved from
tabulating machines to computers is particularly troubling because this failure soon led to
further antitrust litigation in the form of private antitrust suits and another major DOJ
investigation. Indeed, IBM vaulted to a dominant position in mainframe computers
during this period, leading the DOJ to file another Section 2 case against the company in
1969. This latter case was eventually dropped in 1982, in no small part because the
market had changed again.75
If there is a lesson in the antitrust actions against IBM it is that federal antitrust
actions lagged market developments and conduct remedies did not catch up with these
developments. The replacement of tabulating machines by computers was well under way
when IBM settled the first case, and IBM was losing its market power in computers in
1969-82 to upstart firms offering mini-computers and personal computers. Competitive
forces eroded IBM's position, leaving antitrust at the gate.
5. United Fruit
The banana industry in Central America was the setting for one of the more
notorious stories in United States business history. The rise and fall of the United Fruit
75 For a critical analysis of the DOJ’s 1969 case, see Franklin M. Fisher, John J. McGowan and Joen E.
Greenwood, Folded, Spindled, and Mutilated: Economic Analysis and United States v. IBM. MIT Press, 1983.

40
Company is sprinkled with tales of political intrigue, corruption, U.S. military
intervention, and – ultimately – revolution. 76 In 1954, the DOJ brought an antitrust suit,
alleging that United Fruit controlled such a large share of the arable land in Central
America that it had been able to monopolize the importation of bananas to the United
States.77
a. The United Fruit Company
The United Fruit Company was formed in 1899 from a combination of two U.S.
companies, which in turn acquired a number of other companies with operations in
Colombia, Honduras, and Costa Rica in the same year. The company subsequently
expanded into Guatemala, Nicaragua, and – to minor extent – Panama. United Fruit made
numerous other acquisitions of firms involved in the banana trade, including competing
banana producers, Central American railway companies, steamship companies and
distributors.
Through these myriad purchases, United Fruit accounted for more than 50 percent
of bananas imported into the United States in 1928. Between 1935 and 1953, United
Fruit’s share of U.S. banana imports by weight allegedly averaged 63 percent, and its
share by weight was 64.8 percent in 1953, the year before the Sherman Act case was
filed.78 United owned or controlled approximately 73 percent of the banana-carrying
76 There is a very large literature on United Fruit’s activities in Central America. For the views of a
United Fruit insider, see Thomas P. McCann, An American Company. Crown Publishers, 1976. For an earlier and even harsher view, see Charles David Kepner, Jr., and Jay Henry Soothill, The Banana Empire: A Case Study in Economic Imperialism. New York: The Vanguard Press, 1935. For a more favorable view of United Fruit’s operations, see Stacy May and Galo Plaza, The United Fruit Company in Latin America. National Planning Association, 1958.
77 United States of America v United Fruit Company, Complaint filed in the U.S. District Court for the Eastern District of Louisiana, Civil Action No. 4560, July 2, 1954. An Amended Complaint was filed January 12, 1956. [Hereafter, “Amended Complaint.”]
78 Amended Complaint, supra note 77, ¶¶ 19-23.
41
ships serving the U.S. and 85 percent of the refrigerated capacity in these ships. The
company allegedly controlled 85 percent of banana-growing land in the “American
Tropics.”79
b. The Antitrust Suit
United Fruit’s sizable share of the importation of bananas into the U.S. attracted
the attention of the DOJ. Although United Fruit’s share of the relevant market, imported
bananas, was somewhat lower than that of earlier monopolization cases, such as
American Tobacco, Standard Oil, and Alcoa, United had engaged in a variety of business
practices that would strengthen the government’s case, brought under both Sections 1 and
2 of the Sherman Act.
The DOJ alleged that United Fruit had acquired control over the supply of
bananas to the United States through its purchase of rivals and acquisition of land in
Central America. The government’s case contains frequent mention that Ecuador was one
country where United Fruit did not enjoy a dominant position. As we shall see, this
turned out to be an important exception.
The DOJ contended that United Fruit solidified and exercised its market power by
controlling transportation and distribution facilities as well. It also contended that United
even engaged in episodes of predatory pricing. While the government complaint provided
no evidence on prices, it alleged that:
“… United’s prices have consistently remained stable and firm through periods of
variation in supply and demand and periods of variation in business activity and
79 Id., ¶ 14.
42
prosperity. United has been able to set its prices without regard to those quoted by
any other importer.”80 (emphasis supplied)
In short, through vertical integration, acquisitions, and exclusive dealing, United Fruit
was seen by the government as a long- lived monopolist that would not be dislodged by
market forces.
The case never went to trial. The Amended Complaint was filed in 1956, and the
government and United Fruit entered into a consent agreement in 1958.
c. The Decree
The Final Judgment, or decree, was entered in 1958, providing the government
with far-reaching injunctive relief. 81 United Fruit was barred from entering into exclusive
dealing arrangements and from acquiring any business involved in the importation of
bananas into the United States. The company also was to close its Banana Selling
Corporation, which had processed and ripened bananas in the United States. It could
continue to process and sell imported ripe bananas. United Fruit also was forbidden to
enter into any agreement with its competitors for the sale of bananas in the U. S. or to
have a joint ownership interest with its competitors in any company that imports or
distributes bananas. A number of other provisions barred a variety of United Fruit’s
allegedly predatory or monopolistic business practices.
The strangest provision of the decree required United Fruit to assist in the
formation of a new competitor by 1966. This “New Company” was to be provided, by
United Fruit, with sufficient producing lands, ships, terminal facilities, and even liquid
80 Complaint, supra note 77, ¶ 27. 81 United States of America v United Fruit Company, Final Judgment, U.S. District Court for the
Eastern District of Louisiana, Civil Action No. 4560, February 4, 1958.
43
assets to allow it to supply 9 million stems of bananas per year to the United States, about
18 percent of the stems supplied in the year before the complaint was brought. There was
no provision for a waiver of this requirement if market conditions did not require
additional competitors by 1966.
d. The Banana Market Before and After the Decree
The Complaint in this case did not explicitly define a relevant market. Rather it
implicitly assumed that the importation of bananas into the U.S. was a stand-alone
market. Left unexplored was whether the relevant market should have included other
fruits.
In the first half of the 20th century, the U. S. obtained its bananas almost entirely
from Central America and South America. The only major competitor facing United Fruit
in Central America was the Standard Fruit Company, which accounted for roughly 15
percent of U.S. imports in 1953. Standard had major operations in many of the same
countries where United Fruit operated.
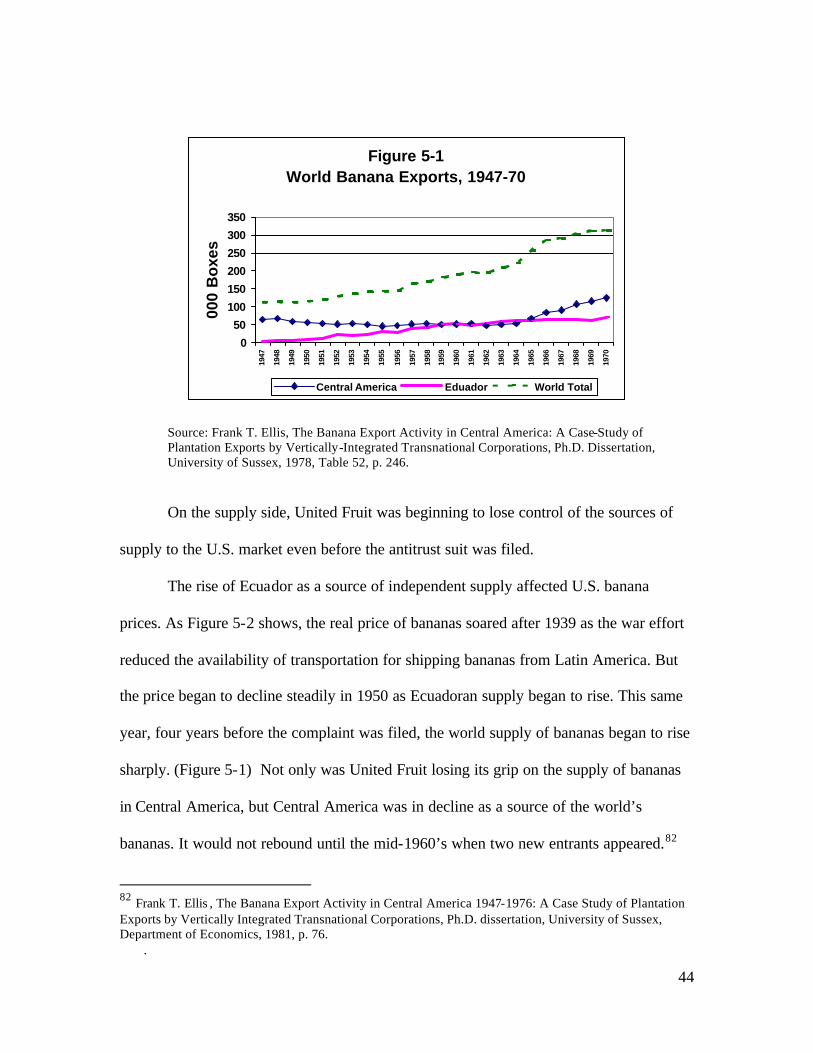
After World War II, United Fruit’s position in the banana market began to weaken
for a number of reasons. The company faced substantial political instability in many of
the countries in which it operated. Its workers began to organize and eventually went on
strike in 1954. In addition, United Fruit could not control the most rapidly-growing
source of bananas, Ecuador, because Ecuador’s government refused to allow foreigners
to own banana-producing land in that country.
Beginning in 1950, Ecuador’s banana output began to soar. By 1957, Ecuador
was exporting twice as many bananas as any Central American country. (See Figure 5-1)
44
Figure 5-1World Banana Exports, 1947-70
0
50
100
150
200
250
300
350
1947
1948
1949
1950
1951
1952
1953
1954
1955
1956
1957
1958
1959
1960
1961
1962
1963
1964
1965
1966
1967
1968
1969
1970
000
Bo
xes
Central America Eduador World Total
Source: Frank T. Ellis, The Banana Export Activity in Central America: A Case-Study of
Plantation Exports by Vertically-Integrated Transnational Corporations, Ph.D. Dissertation, University of Sussex, 1978, Table 52, p. 246.
On the supply side, United Fruit was beginning to lose control of the sources of
supply to the U.S. market even before the antitrust suit was filed.
The rise of Ecuador as a source of independent supply affected U.S. banana
prices. As Figure 5-2 shows, the real price of bananas soared after 1939 as the war effort
reduced the availability of transportation for shipping bananas from Latin America. But
the price began to decline steadily in 1950 as Ecuadoran supply began to rise. This same
year, four years before the complaint was filed, the world supply of bananas began to rise
sharply. (Figure 5-1) Not only was United Fruit losing its grip on the supply of bananas
in Central America, but Central America was in decline as a source of the world’s
bananas. It would not rebound until the mid-1960’s when two new entrants appeared.82
82 Frank T. Ellis , The Banana Export Activity in Central America 1947-1976: A Case Study of Plantation Exports by Vertically Integrated Transnational Corporations, Ph.D. dissertation, University of Sussex, Department of Economics, 1981, p. 76.
.

45
Figure 5-2The Real Consumer Price of Bananas, 1939-70
020406080
100120140160180
1939
1941
1943
1945
1947
1949
1951
1953
1955
1957
1959
1961
1963
1965
1967
1969
1982
-84
= 10
0
Source: U.S. Bureau of Labor Statistics, Consumer Price Index. The decline in U.S. banana prices occurred as U.S. imports of bananas were
declining. As Figure 5-3 shows, total banana imports fell rather substantially between
1947 and 1956 despite the decline in prices. Apparently, at the time bananas were an
“inferior” good, whose consumption declined when income rose strongly.
According to recent studies of United Fruit, it had already begun exiting the
production of bananas immediately after World War II because of Wall Street’s
perception of the risks of remaining in Central America.83 Political upheavals and labor
unrest were at least two major causes of United Fruit’s disquietude. Labor problems
began as early as 1949 in Guatemala, Colombia, and Costa Rica. In 1951-52, United Fruit
suffered a labor strike in Guatemala followed by a ten-week strike in Honduras in 1954
where some of its lands were expropriated by a revolutionary government. In 1959, its
Costa Rica workers struck, and Fidel Castro expropriated its lands in Cuba.
83 Marcelo Bucheli, United Fruit Company in Colombia: Labor Conflicts, Political Relations, and Local Elite (1899-1970), Ph.D. dissertation, Stanford University, Department of History, November 2001, Chapter III.
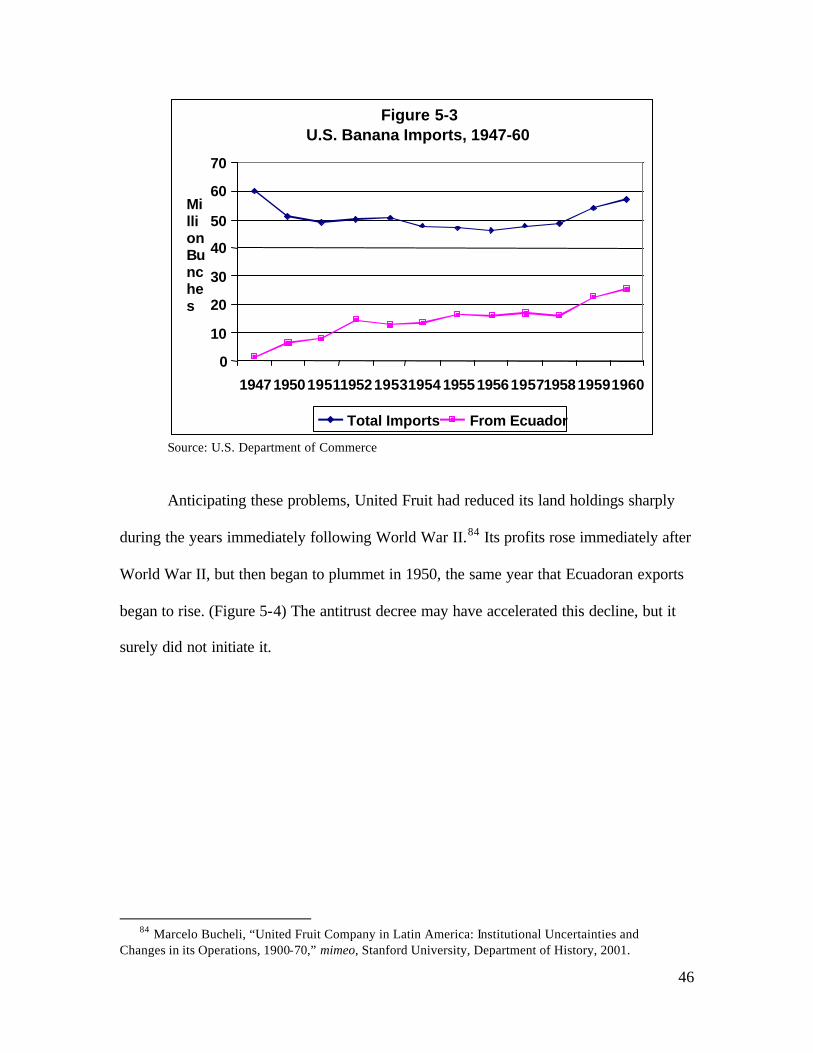
46
Figure 5-3U.S. Banana Imports, 1947-60
0
10
20
30
40
50
60
70
194719501951195219531954 195519561957195819591960
MillionBunches
Total Imports From Ecuador
Source: U.S. Department of Commerce Anticipating these problems, United Fruit had reduced its land holdings sharply
during the years immediately following World War II.84 Its profits rose immediately after
World War II, but then began to plummet in 1950, the same year that Ecuadoran exports
began to rise. (Figure 5-4) The antitrust decree may have accelerated this decline, but it
surely did not initiate it.
84 Marcelo Bucheli, “United Fruit Company in Latin America: Institutional Uncertainties and Changes in its Operations, 1900-70,” mimeo, Stanford University, Department of History, 2001.

47
Figure 5-4United Fruit Company Profits, 1942-65
0
20
40
60
80
100
120
140
1942 1943 1944 1945 1946 1947 1948 1949 1950 1951 1952 1953 1954 1955 1956 1957 1958 1959 1960 1961 1962 1963 1964 1965
Mill
ion
s o
f $U
S
Net Operating Profit Net Income
Source: Company Reports to the Securities and Exchange Commission as reported in Moody’s Industrial Manual.
e. Conclusion
In United States v. United Fruit, the antitrust remedy lagged behind market
developments. The decree was imposed after U.S. banana prices began to decline and
after competition in the supply of bananas had begun to accelerate, particularly in the
form of imports from Ecuador. By the time the decree was entered, United Fruit’s net
income had fallen by more than two-thirds from its 1950 peak to a scant $20 million, and
the company was well on the way to withdrawing from banana production before the case
was decided. The DOJ’s suit might have made sense in the 1930’s or 1940’s, but by 1958
it was simply judicial piling-on.
48
6 . Eastman Kodak (1954) In the 1880’s, George Eastman pioneered the development of a camera that could
be used by amateur photographers. By 1904, he had established a dominant position in
the sale of film, film cameras, and photographic paper.85 The company he founded,
Eastman Kodak, has been the leading manufacturer of photographic film in the U.S. for
about 100 years.
a. Amateur Photography
The amateur photography industry is a “mosaic” of interconnected markets:86
cameras, film, photofinishing, and photofinishing supplies. The interdependence among
these markets and the strategic role of film in amateur photography are crucial to the
understanding of Kodak’s early market position in the amateur photography industry.
Cameras, film, and photofinishing are interdependent in two ways. First, because
they are complements, the demands for cameras, film, and photofinishing are dependent
on the price and availability of each other. Second, and just as important, a photograph
requires that cameras, film, and photofinishing be technically compatible with each other.
The photography industry is functionally organized around film: film dictates the
compatibility requirements that affect the design of cameras and of photofinishing
technology and the specifications of photofinishing inputs (photographic paper,
chemicals, and photofinishing equipment). The central role of film in amateur
photography therefore allows the film manufacturer to affect the interrelated sectors of
49
cameras and photofinishing. A firm with monopoly power in the film sector potentially
could extend its market power to the camera and photofinishing sectors. The importance
of film technology is reflected in the fact that Kodak never licensed its film technology,
even though it occasionally licensed its camera technology.87
b. Kodak’s Market Share
Kodak controlled 90 percent of the U.S. film market as early as 1904, and 88
percent in 1915. In 1932, Forbes estimated that Kodak’s share of U.S. film sales was 84
percent. Over the period 1958 to 1976, Kodak still accounted for 86 percent of film sales,
68 percent of camera sales, and 89 percent of color photographic paper sales.88
Kodak pursued an aggressive research agenda, patenting new inventions that kept
it ahead of rivals and potential entrants. “By the time rivals found ways around the
current technology, Kodak was on to the next technology, which would also be protected
by another patent.”89 In addition, in its formative years, Kodak acquired potential rivals.
Between 1895 and 1899, for example, Kodak purchased three companies (Blair, Boston,
and American) that made cameras as well as film and were threats to Kodak’s film
monopoly.90
c. The Antitrust Case
From its inception until the 1950’s, Kodak had marketed its film at a price that
85 Vrinda Kadiyali, “Eastman Kodak in the Photographic Film Industry: Picture Imperfect?” in Market
Dominance: How Firms Gain, Hold, or Lose It and the Impact on Economic Performance, David I. Rosembaum, ed., 1998, p. 91.
86 Berkey Photo v. Eastman Kodak Co, 457 F. Supp. 404, at 411 (S.D.N.Y. 1978). 87 Kadiyali, supra note 85, p. 97. 88 Id., p. 91. 89 Id., p. 97.
50
included Kodak processing and printing. Kodak’s large share of amateur film sales was
thus extended into photofinishing through the tying arrangement. Its market position in
photofinishing was further secured by Kodak’s refusal to sell paper and chemicals
required to finish its films to independent photofinishers.91
1. The Complaint
The DOJ filed suit against Kodak under Sections 1, 2, and 3 of the Sherman Act
in December 1954. The complaint contended that Kodak’s monopoly power in color film
was sufficient to foreclose competition in the photofinishing sector. But instead of
attacking the source of Kodak’s monopoly power, namely, its supremacy in the
production and sale of color film, the DOJ focused its complaint on Kodak’s practice of
tying photofinishing to the sale of film. The complaint charged that:
“Purchasers of Kodachrome and Kodacolor film have been required to pay
monopoly prices for the processing of Kodachrome film and monopoly
prices for the developing and printing of Kodacolor film … [and] have
been denied the advantage of faster local processing, developing, and
printing service …” 92
Kodak marketed its film at prices that included all charges for processing at its Color
Processing and Printing (CP&P) division and required resellers of its films to do the
same. This was alleged to have completely foreclosed competitors from processing
90 James W. Brock, Market Control in the Amateur Conventional Photography Industry, Ph.D.
dissertation, Michigan State University, Department of Economics, 1981, p. 21. 91 Id., p.362. 92 United States v. Eastman Kodak Co., Complaint, W.D.N.Y. (1954).

51
Kodak film.93
2. The decree
In 1954, the DOJ and Kodak negotiated a consent decree before the case went to
trial. The government had sought the divestiture of Kodak’s nine processing plants, but it
settled for substantially less. The remedy required Kodak to exclude photofinishing
charges from its film price and to license its patents in photofinishing technology. In
addition, Kodak was to reduce its share of the photofinishing market to 50 percent or less
by 1961 or else divest some of its photofinishing plants.
The decree also required Eastman to cancel its “fair trade” – or resale price
maintenance - contracts requiring retailers to sell the film at a price specified by Kodak.
Kodak also was enjoined from entering into similar contracts to control the price of its
color film or print material sold to third parties.94
In addition the judgment imposed on Kodak an obligation to:
• Grant licenses to applicable patents at reasonable royalties;
• Make available manuals describing its commercial color film processing
technology, and to bring out annual supplements for seven years;
• Upon request, send a technical representative to any recipient of a manual to
assist in using the methods set forth in the manual;
• Upon request, permit the recipient to visit the Kodak processing plants for the
purpose of observing and being advised as to the methods, processes,
machines, and equipment used there.
Kodak also was required to sell materials it used or manufactured that were
93 Id. 94 United States v. Eastman Kodak Co., Consent Decree, C.C.H Trade Cases ¶ 67,920 (1954).
52
necessary for processing its amateur color film, and to make available the company’s
plans and specifications relating to machines and equipment used in the commercial
processing of its amateur color film.95
Seven years after the effective date of the judgment, Kodak would be required to
divest itself of sufficient facilities to reduce its share of the domestic capacity for
processing its still color film to 50 percent or less. This requirement could be waived if
Kodak could show the court that purchasers of its still color film had an option to have
such color film processed by an independent processor and that any independent
processors were then processing a substantial volume of Kodak-made still film.96
d. The Effects of the Decree
To assess the effects of the decree, one could analyze the changes it caused in the
structure of the markets for photofinishing and for film. If the decree had the effect
sought by the DOJ, it should have led to a lower price consumers paid for the combined
product.
1. Photofinishing
Soon after the entering of the conduct remedy, there was a wave of entry into
photofinishing. Kodak’s share of U.S. color film photofinishing declined steadily from 96
percent in 1954 to 11 percent in 1975. (See Table 6-1) In 1961, there were 458
independent photofinishers; in 1977, there were 2,177.97 Despite the decline in its market
share, however, Kodak’s Color Processing and Printing (CP&P) remained the largest
95 Id. 96 Id. 97 Brock, supra note 90, pp. 99-101.
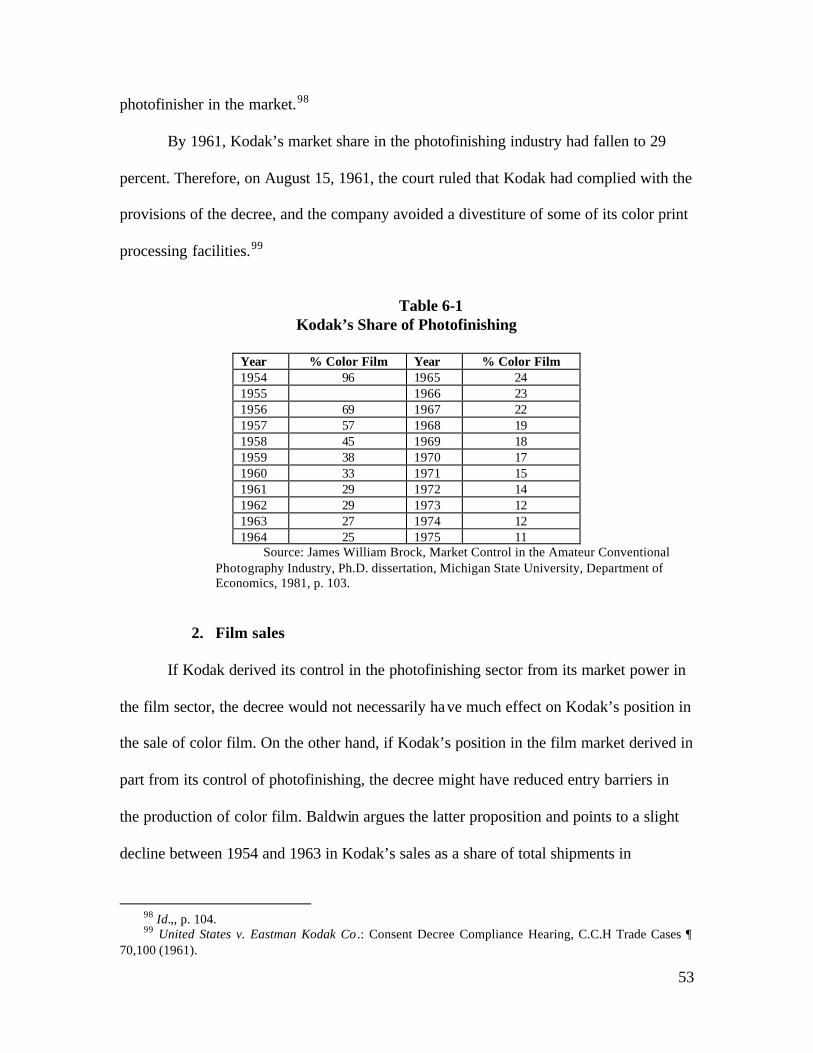
53
photofinisher in the market.98
By 1961, Kodak’s market share in the photofinishing industry had fallen to 29
percent. Therefore, on August 15, 1961, the court ruled that Kodak had complied with the
provisions of the decree, and the company avoided a divestiture of some of its color print
processing facilities.99
Table 6-1
Kodak’s Share of Photofinishing
Year % Color Film Year % Color Film 1954 96 1965 24 1955 1966 23 1956 69 1967 22 1957 57 1968 19 1958 45 1969 18 1959 38 1970 17 1960 33 1971 15 1961 29 1972 14 1962 29 1973 12 1963 27 1974 12 1964 25 1975 11
Source: James William Brock, Market Control in the Amateur Conventional Photography Industry, Ph.D. dissertation, Michigan State University, Department of Economics, 1981, p. 103.
2. Film sales
If Kodak derived its control in the photofinishing sector from its market power in
the film sector, the decree would not necessarily have much effect on Kodak’s position in
the sale of color film. On the other hand, if Kodak’s position in the film market derived in
part from its control of photofinishing, the decree might have reduced entry barriers in
the production of color film. Baldwin argues the latter proposition and points to a slight
decline between 1954 and 1963 in Kodak’s sales as a share of total shipments in
98 Id.,, p. 104. 99 United States v. Eastman Kodak Co .: Consent Decree Compliance Hearing, C.C.H Trade Cases 
70,100 (1961).

54
“Photographic Equipment and Supplies” as reported by the Census of Manufactures.
However, he acknowledges that there was no change in the four-firm concentration ratio
in this industry during this period.100
A more recent study finds that Kodak maintained a large share of U.S. color film
sales until 1980, enjoying upwards of 80 percent of the color film market through the
1970’s.101 (See Table 6-2) Clearly, the decree had little impact on Kodak’s U.S. market
share in film.
Table 6-2 Kodak’s Share of Amateur Photographic Film Sales
Year Film Rolls Year Film Rolls 1955 84 1968 90 1956 84 1969 89 1957 85 1970 87 1958 86 1971 88 1959 86 1972 87 1960 86 1973 87 1961 83 1974 87 1962 82 1975 86 1963 82 1976 86 1964 82 1977 80 1965 85 1978 80 1966 88 1979 80 1967 91 1980 80
Source: Vrinda Kadiyali (1998).
3. Kodak’s sales and profits
Kodak’s continued leadership position in film sales, its integration across the film
and photofinishing sectors, and the perfect complementarities between film and
photofinishing could have allowed Kodak to continue to operate as profitably as before.
Indeed the evidence supports just such a theory. If Kodak had monopoly power in the
100 Baldwin (1969), supra note 70.
55
sale of film, it might be able to extract as much monopoly rent from film as it was
extracting from both film and photofinishing before the decree.102 Indeed, the evidence
supports just such a theory. Kodak’s real sales and operating profits continued to grow
rapidly after 1954, suggesting that the decree did not have a major impact on its
profitability. Multiple regression analysis of both sales and real operating profits for the
period 1950-78 finds no significant change in the trajectory of either variable after 1954,
a result that suggests that Kodak was able to recoup any lost revenues or profits from
finishing through higher film prices.103
Further corroboration of the absence of an effect on Kodak’s profitability is
available from Census of Manufactures data for SIC 3861, “photographic equipment and
supplies.” Kodak’s sales as a ratio of all shipments reported by the Census for industry
3861 declined more slowly after 1954 than in 1950-54. (See Figure 6-1) Nevertheless,
they remained very large relative to total SIC 3861 shipments. 104
In addition, the price-cost margin for all of SIC 3861 actually rose after 1954,
after remaining constant in 1950-54.105 (See Figure 6-2) This suggests that Kodak, with a
large and slowly declining share of the sales of all photographic equipment and supplies,
may have actually enjoyed somewhat more pricing discretion after the decree. This
conclusion is reinforced by the movement in the price-cost margin for Kodak, based on
101 Kadiyali, supra note 85, p. 92. 102 This assumes fixed proportions in film and photofinishing and that independent film finishers could
not integrate backward into the production of film. 103 The regressions use total Kodak sales and Kodak operating profits, both stated in constant dollars,
as the dependent variables. The independent variables are GDP and silver prices in constant dollars, a time trend, and a time trend interacted with a dummy variable equal to 1 for years after 1954. The interaction term is not statistically significant.
104 Kodak’s sales were equal to about 65 percent of total SIC 3861 shipments in the ten years following the decree. Some of Kodak’s sales may have been outside SIC 3861.
105 The price-cost margin is equal to [Shipments – Payroll – Materials Purchased + Change in Inventories]/[Shipments + Change in Inventories].
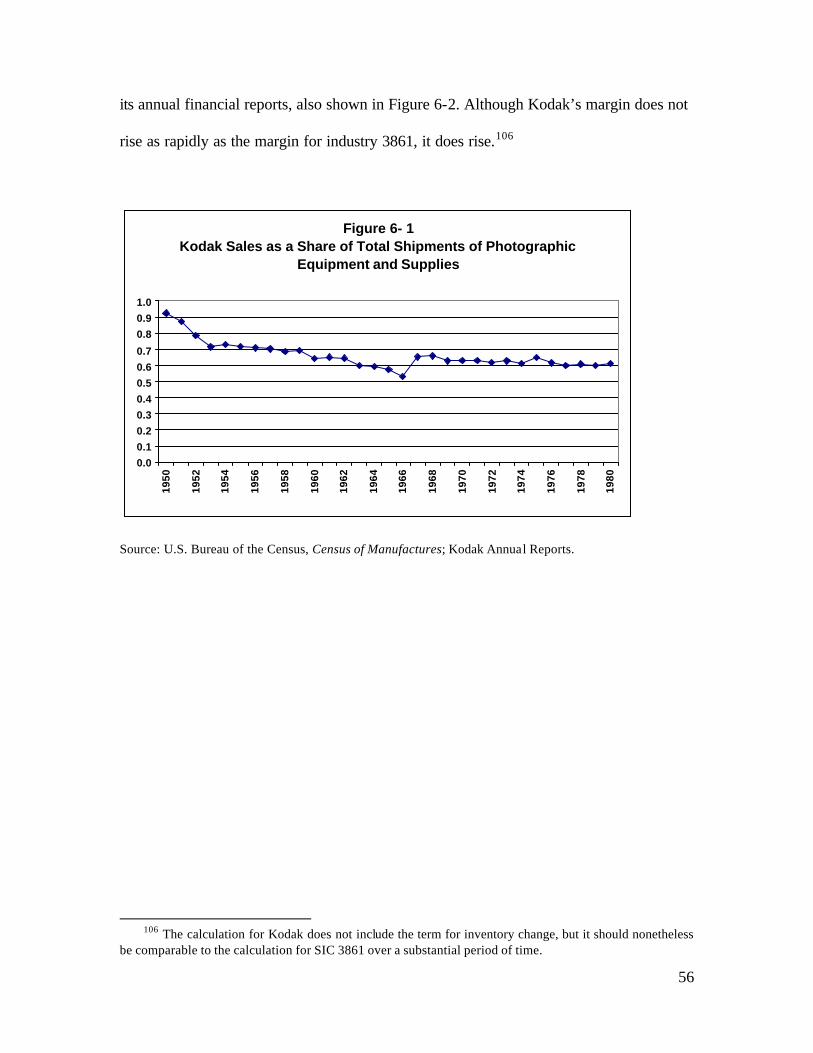
56
its annual financial reports, also shown in Figure 6-2. Although Kodak’s margin does not
rise as rapidly as the margin for industry 3861, it does rise.106
Figure 6- 1Kodak Sales as a Share of Total Shipments of Photographic
Equipment and Supplies
0.0
0.1
0.2
0.3
0.4
0.5
0.6
0.7
0.8
0.9
1.0
1950
1952
1954
1956
1958
1960
1962
1964
1966
1968
1970
1972
1974
1976
1978
1980
Source: U.S. Bureau of the Census, Census of Manufactures; Kodak Annual Reports.
106 The calculation for Kodak does not include the term for inventory change, but it should nonetheless
be comparable to the calculation for SIC 3861 over a substantial period of time.
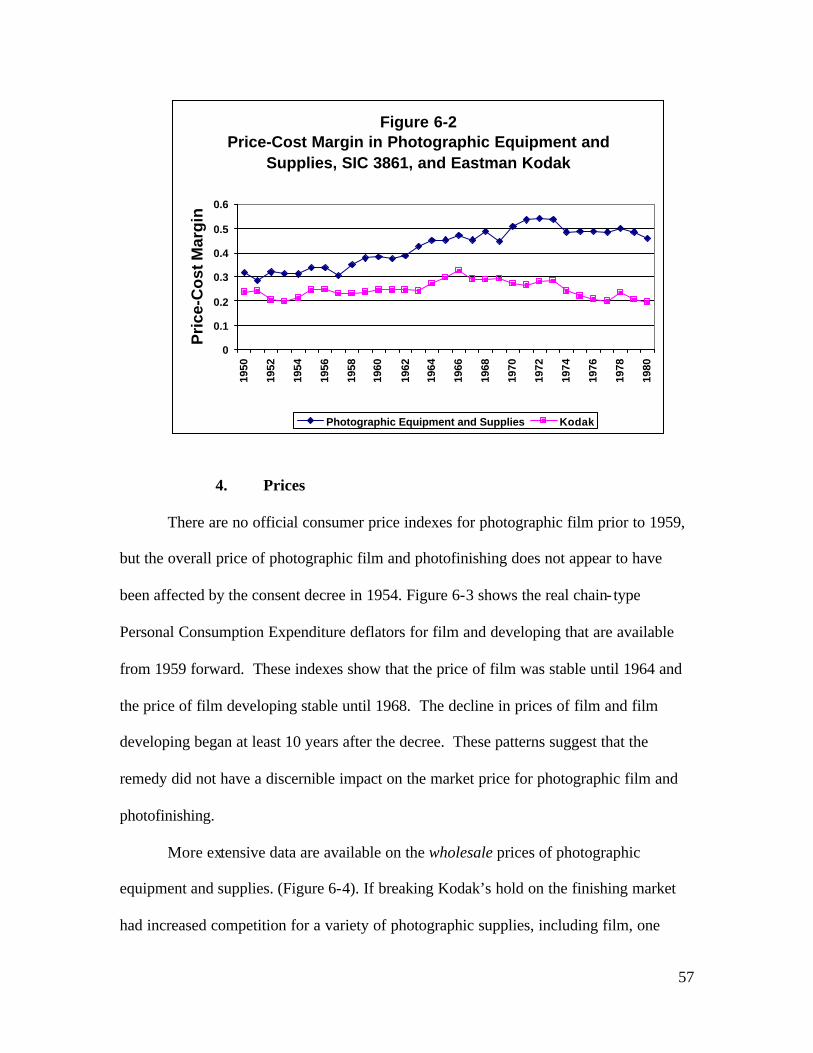
57
Figure 6-2Price-Cost Margin in Photographic Equipment and
Supplies, SIC 3861, and Eastman Kodak
0
0.1
0.2
0.3
0.4
0.5
0.6
1950
1952
1954
1956
1958
1960
1962
1964
1966
1968
1970
1972
1974
1976
1978
1980
Pri
ce-C
ost
Mar
gin
Photographic Equipment and Supplies Kodak
4. Prices
There are no official consumer price indexes for photographic film prior to 1959,
but the overall price of photographic film and photofinishing does not appear to have
been affected by the consent decree in 1954. Figure 6-3 shows the real chain- type
Personal Consumption Expenditure deflators for film and developing that are available
from 1959 forward. These indexes show that the price of film was stable until 1964 and
the price of film developing stable until 1968. The decline in prices of film and film
developing began at least 10 years after the decree. These patterns suggest that the
remedy did not have a discernible impact on the market price for photographic film and
photofinishing.
More extensive data are available on the wholesale prices of photographic
equipment and supplies. (Figure 6-4). If breaking Kodak’s hold on the finishing market
had increased competition for a variety of photographic supplies, including film, one
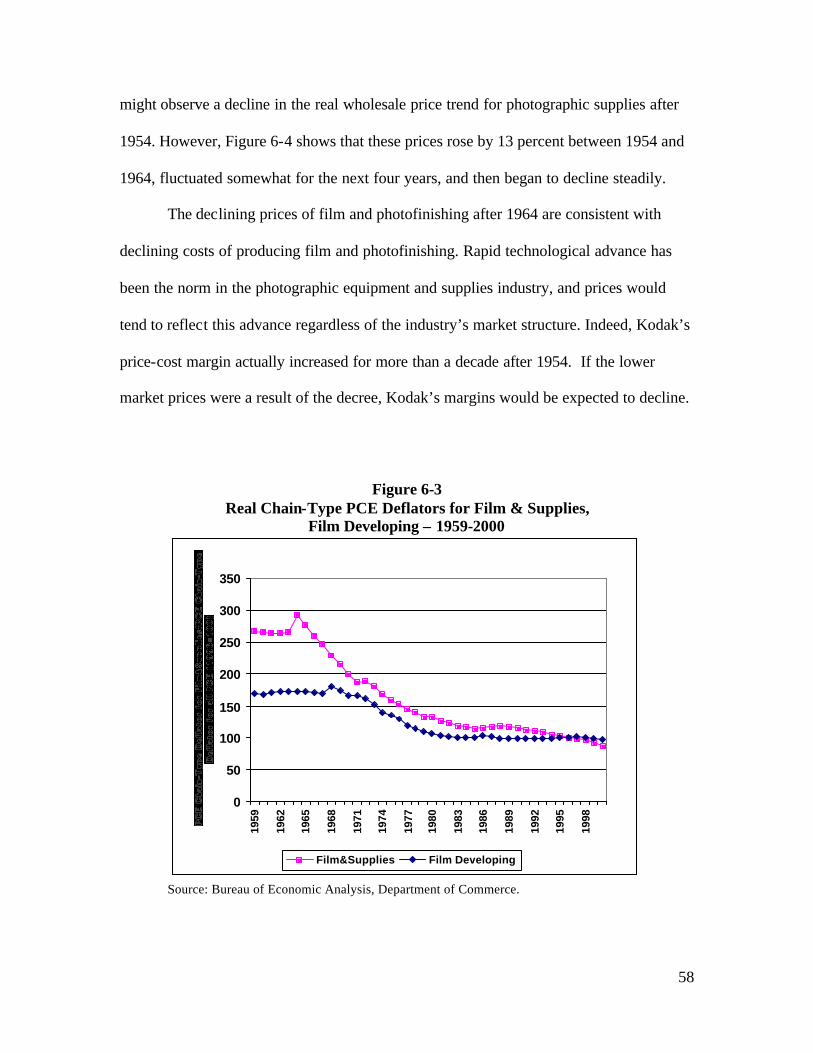
58
might observe a decline in the real wholesale price trend for photographic supplies after
1954. However, Figure 6-4 shows that these prices rose by 13 percent between 1954 and
1964, fluctuated somewhat for the next four years, and then began to decline steadily.
The declining prices of film and photofinishing after 1964 are consistent with
declining costs of producing film and photofinishing. Rapid technological advance has
been the norm in the photographic equipment and supplies industry, and prices would
tend to reflect this advance regardless of the industry’s market structure. Indeed, Kodak’s
price-cost margin actually increased for more than a decade after 1954. If the lower
market prices were a result of the decree, Kodak’s margins would be expected to decline.
Figure 6-3
Real Chain-Type PCE Deflators for Film & Supplies, Film Developing – 1959-2000
Source: Bureau of Economic Analysis, Department of Commerce.
0
50
100
150
200
250
300
350
1959
1962
1965
1968
1971
1974
1977
1980
1983
1986
1989
1992
1995
1998
Film&Supplies Film Developing
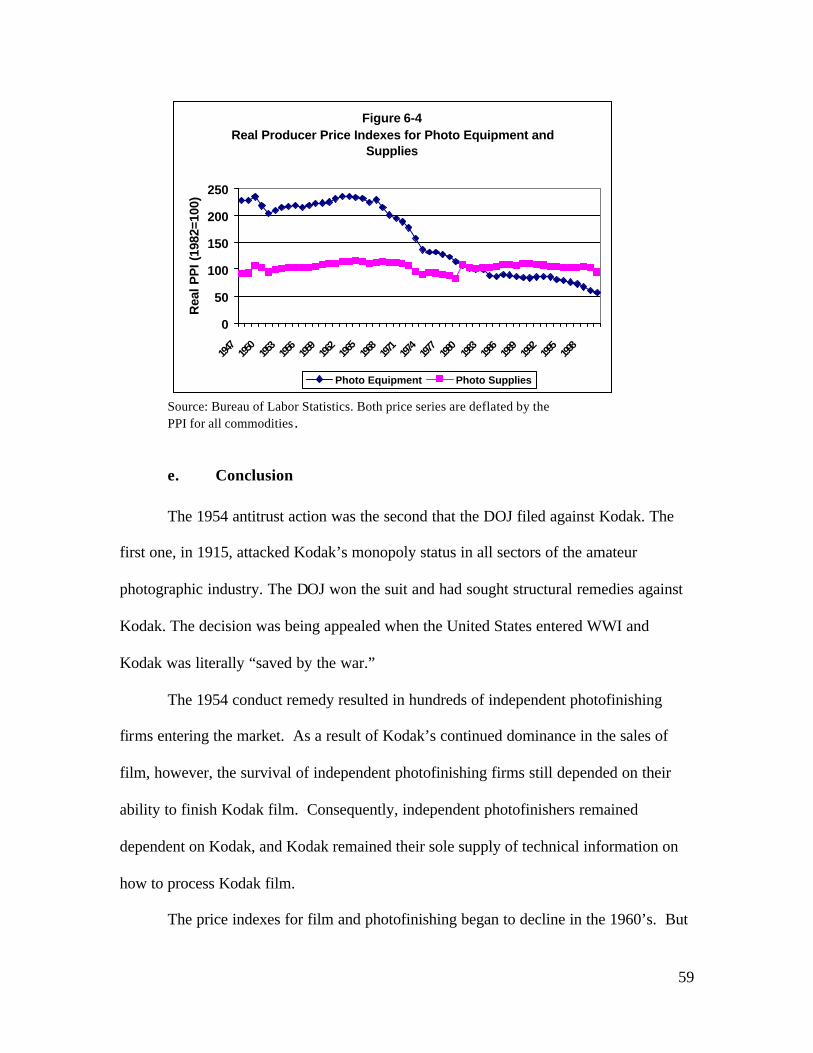
59
Figure 6-4Real Producer Price Indexes for Photo Equipment and
Supplies
0
50
100
150
200
250
1947
1950
1953
1956
1959
1962
1965
1968
1971
1974
1977
1980
1983
1986
1989
1992
1995
1998
Rea
l PP
I (19
82=1
00)
Photo Equipment Photo Supplies
Source: Bureau of Labor Statistics. Both price series are deflated by the PPI for all commodities.
e. Conclusion
The 1954 antitrust action was the second that the DOJ filed against Kodak. The
first one, in 1915, attacked Kodak’s monopoly status in all sectors of the amateur
photographic industry. The DOJ won the suit and had sought structural remedies against
Kodak. The decision was being appealed when the United States entered WWI and
Kodak was literally “saved by the war.”
The 1954 conduct remedy resulted in hundreds of independent photofinishing
firms entering the market. As a result of Kodak’s continued dominance in the sales of
film, however, the survival of independent photofinishing firms still depended on their
ability to finish Kodak film. Consequently, independent photofinishers remained
dependent on Kodak, and Kodak remained their sole supply of technical information on
how to process Kodak film.
The price indexes for film and photofinishing began to decline in the 1960’s. But
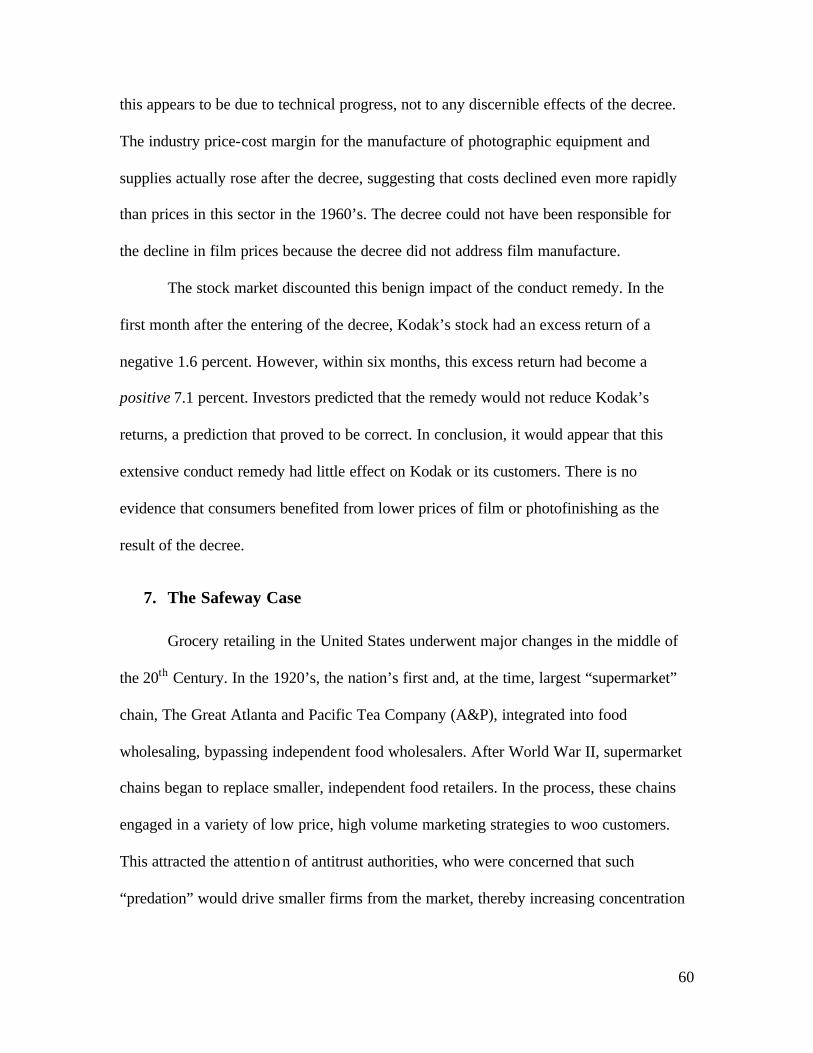
60
this appears to be due to technical progress, not to any discernible effects of the decree.
The industry price-cost margin for the manufacture of photographic equipment and
supplies actually rose after the decree, suggesting that costs declined even more rapidly
than prices in this sector in the 1960’s. The decree could not have been responsible for
the decline in film prices because the decree did not address film manufacture.
The stock market discounted this benign impact of the conduct remedy. In the
first month after the entering of the decree, Kodak’s stock had an excess return of a
negative 1.6 percent. However, within six months, this excess return had become a
positive 7.1 percent. Investors predicted that the remedy would not reduce Kodak’s
returns, a prediction that proved to be correct. In conclusion, it would appear that this
extensive conduct remedy had little effect on Kodak or its customers. There is no
evidence that consumers benefited from lower prices of film or photofinishing as the
result of the decree.
7. The Safeway Case
Grocery retailing in the United States underwent major changes in the middle of
the 20th Century. In the 1920’s, the nation’s first and, at the time, largest “supermarket”
chain, The Great Atlanta and Pacific Tea Company (A&P), integrated into food
wholesaling, bypassing independent food wholesalers. After World War II, supermarket
chains began to replace smaller, independent food retailers. In the process, these chains
engaged in a variety of low price, high volume marketing strategies to woo customers.
This attracted the attention of antitrust authorities, who were concerned that such
“predation” would drive smaller firms from the market, thereby increasing concentration
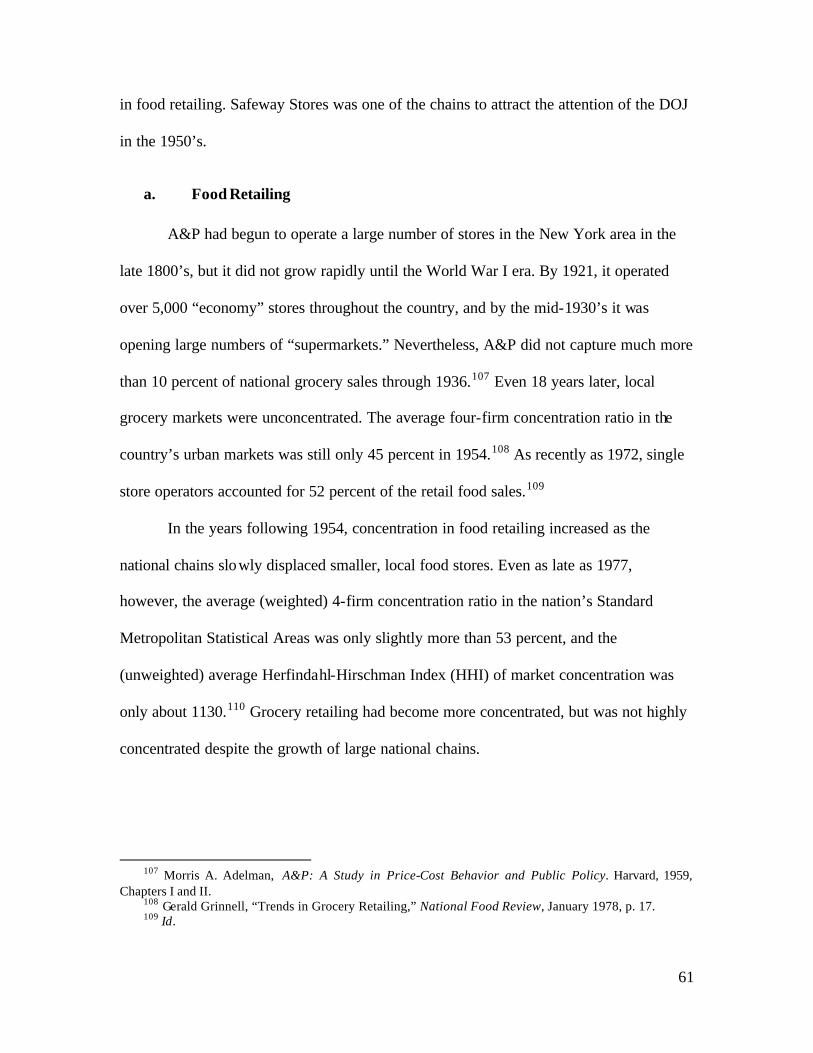
61
in food retailing. Safeway Stores was one of the chains to attract the attention of the DOJ
in the 1950’s.
a. Food Retailing
A&P had begun to operate a large number of stores in the New York area in the
late 1800’s, but it did not grow rapidly until the World War I era. By 1921, it operated
over 5,000 “economy” stores throughout the country, and by the mid-1930’s it was
opening large numbers of “supermarkets.” Nevertheless, A&P did not capture much more
than 10 percent of national grocery sales through 1936.107 Even 18 years later, local
grocery markets were unconcentrated. The average four-firm concentration ratio in the
country’s urban markets was still only 45 percent in 1954.108 As recently as 1972, single
store operators accounted for 52 percent of the retail food sales.109
In the years following 1954, concentration in food retailing increased as the
national chains slowly displaced smaller, local food stores. Even as late as 1977,
however, the average (weighted) 4-firm concentration ratio in the nation’s Standard
Metropolitan Statistical Areas was only slightly more than 53 percent, and the
(unweighted) average Herfindahl-Hirschman Index (HHI) of market concentration was
only about 1130.110 Grocery retailing had become more concentrated, but was not highly
concentrated despite the growth of large national chains.
107 Morris A. Adelman, A&P: A Study in Price-Cost Behavior and Public Policy. Harvard, 1959,
Chapters I and II. 108 Gerald Grinnell, “Trends in Grocery Retailing,” National Food Review, January 1978, p. 17. 109 Id.
62
b. The Antitrust Suit
The antitrust authorities’ concern over the growth of food retailing chains and its
ramifications for the continuation of the small, independent food store dates back at least
to the 1930’s. Adelman provides the details of the passage of the Robinson Patman Act in
response to A&P’s vertical integration and the government’s 1939 decision to bring a
case against A&P alleging violation of Sections 1 and 2 of the Sherman Act.111
These actions did not stem the growth of national supermarket chains. As a result,
the government pressed a variety of othe r antitrust suits, ostensibly designed to prevent
increases in concentration in grocery retailing. One of these was a Section 2 case filed
against Safeway Stores for attempting to monopolize the retail food trade in certain parts
of Texas and New Mexico.112
The DOJ complaint in this case is remarkable for its brevity. It did not allude to
any evidence that Safeway had market power in the two regions singled out in the case –
Safeway’s Dallas and El Paso Divisions. The complaint simply asserted that Safeway had
150 stores in these two regions and that Safeway was the “dominant retailer of food and
food products” there. The offenses alleged to constitute a violation of Section 2 of the
Sherman Act were the fixing of market share “quotas” or goals for its managers in these
regions and engaging in “price wars.” Price wars were simply the pricing of various items
below “invoice cost,” selling some items at prices below the prices realized in other
110 Russell Parker, Concentration, Integration, and Diversification in the Grocery Retailing Industry,
Federal Trade Commission, Washington D.C., March 1986, Tables 3-8 and 4-1. 111 Adelman (1959), supra note 107. United States v. Great Atlantic & Pacific Tea Company, et.al., 67
F. Supp. 626 (E.D. Ill. 1946). 112 United States v. Safeway Stores, Inc., Complaint, Civil Action No. 3173, (N.D. Tex. Nov. 1, 1955)
at ¶ 14. The DOJ also filed a criminal case against Safeway, provoking two of its executives to plead nolo contendere and receiving suspended jail sentences (for price competition!). We believe this may be the first time the DOJ brought a criminal complaint in a Section 2 attempt to monopolize action. We are indebted to Mr. Bernat Rosner for background material on this case.
63
cities, and sustaining losses in some stores. Safeway’s low price policy stemmed from its
policy not to issue trading stamps. When important competitors began to use trading
stamps to attract customers, Safeway elected to meet this marketing ploy by lowering
retail prices, in so doing attracting the attention of the DOJ.
The case did not go to trial. Instead, it was settled by a consent decree in 1957 in
which Safeway agreed not to sell items at unreasonably low prices or below those in its
other stores “for the purpose of attempting to monopolize or monopolizing the sale of
food or food products … or for the purpose or with the natural or probable effect of
destroying competition or eliminating a competitor…”113 (emphasis supplied) This
decree applied not only to Safeway’s operations in the two regions that were the focus of
the complaint, but to the company’s activities in the rest of the country. It was not
terminated until November 30, 1983. For more than 25 years, Safeway operated under a
decree that limited its ability to cut prices if such price cuts would result in the
elimination of a competitor. As a result of the decree, Safeway became a follower of
pricing initiatives by its rivals, rather than a first-mover.114
c. The Impact of the Decree
It is difficult to assess the impact of this decree on competition in grocery retailing,
grocery chain margins, or the price of groceries to consumers because the decree did not
apply to other grocery chains. Safeway’s total sales in 1957 were $2 billion, or only about
5 percent of grocery store sales in the U.S.115 Between 1948 and 1977, Safeway increased
its position from the second largest national grocery chain to the largest, notwithstanding
113 United States v. Safeway Stores, Inc., Consent Decree, Civil Action No. 3173, (N.D. Tex. Dec. 7,
1957). 114 “Local Autonomy Still Preferred by Safeway,” Supermarket News, May 8, 1978, pp. 1, 36.
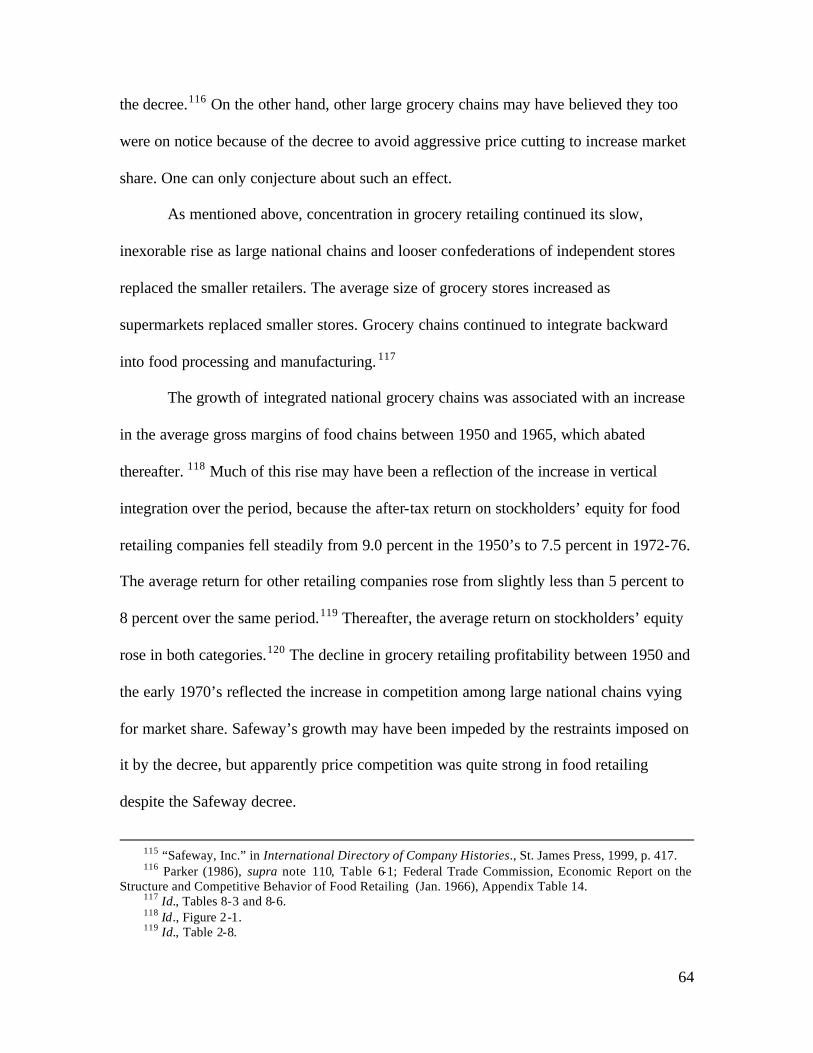
64
the decree.116 On the other hand, other large grocery chains may have believed they too
were on notice because of the decree to avoid aggressive price cutting to increase market
share. One can only conjecture about such an effect.
As mentioned above, concentration in grocery retailing continued its slow,
inexorable rise as large national chains and looser confederations of independent stores
replaced the smaller retailers. The average size of grocery stores increased as
supermarkets replaced smaller stores. Grocery chains continued to integrate backward
into food processing and manufacturing. 117
The growth of integrated national grocery chains was associated with an increase
in the average gross margins of food chains between 1950 and 1965, which abated
thereafter. 118 Much of this rise may have been a reflection of the increase in vertical
integration over the period, because the after-tax return on stockholders’ equity for food
retailing companies fell steadily from 9.0 percent in the 1950’s to 7.5 percent in 1972-76.
The average return for other retailing companies rose from slightly less than 5 percent to
8 percent over the same period.119 Thereafter, the average return on stockholders’ equity
rose in both categories.120 The decline in grocery retailing profitability between 1950 and
the early 1970’s reflected the increase in competition among large national chains vying
for market share. Safeway’s growth may have been impeded by the restraints imposed on
it by the decree, but apparently price competition was quite strong in food retailing
despite the Safeway decree.
115 “Safeway, Inc.” in International Directory of Company Histories., St. James Press, 1999, p. 417. 116 Parker (1986), supra note 110, Table 6-1; Federal Trade Commission, Economic Report on the
Structure and Competitive Behavior of Food Retailing (Jan. 1966), Appendix Table 14. 117 Id., Tables 8-3 and 8-6. 118 Id., Figure 2-1. 119 Id., Table 2-8.
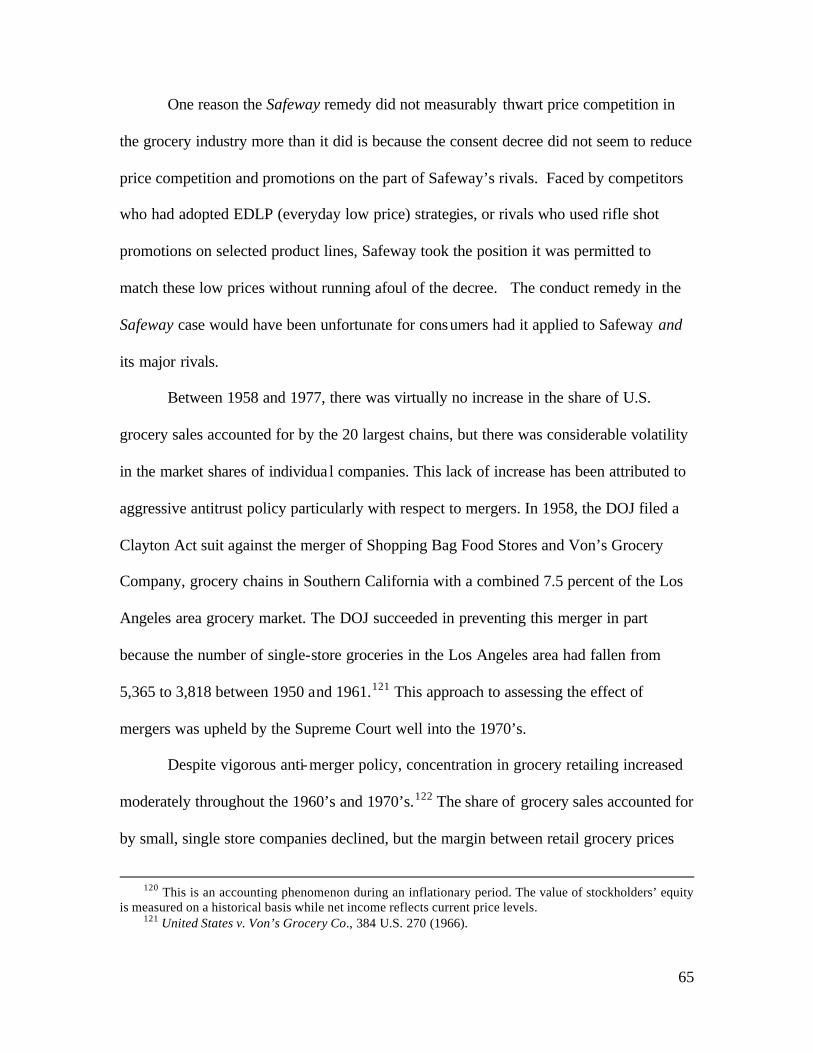
65
One reason the Safeway remedy did not measurably thwart price competition in
the grocery industry more than it did is because the consent decree did not seem to reduce
price competition and promotions on the part of Safeway’s rivals. Faced by competitors
who had adopted EDLP (everyday low price) strategies, or rivals who used rifle shot
promotions on selected product lines, Safeway took the position it was permitted to
match these low prices without running afoul of the decree. The conduct remedy in the
Safeway case would have been unfortunate for consumers had it applied to Safeway and
its major rivals.
Between 1958 and 1977, there was virtually no increase in the share of U.S.
grocery sales accounted for by the 20 largest chains, but there was considerable volatility
in the market shares of individua l companies. This lack of increase has been attributed to
aggressive antitrust policy particularly with respect to mergers. In 1958, the DOJ filed a
Clayton Act suit against the merger of Shopping Bag Food Stores and Von’s Grocery
Company, grocery chains in Southern California with a combined 7.5 percent of the Los
Angeles area grocery market. The DOJ succeeded in preventing this merger in part
because the number of single-store groceries in the Los Angeles area had fallen from
5,365 to 3,818 between 1950 and 1961.121 This approach to assessing the effect of
mergers was upheld by the Supreme Court well into the 1970’s.
Despite vigorous anti-merger policy, concentration in grocery retailing increased
moderately throughout the 1960’s and 1970’s.122 The share of grocery sales accounted for
by small, single store companies declined, but the margin between retail grocery prices
120 This is an accounting phenomenon during an inflationary period. The value of stockholders’ equity
is measured on a historical basis while net income reflects current price levels. 121 United States v. Von’s Grocery Co., 384 U.S. 270 (1966).
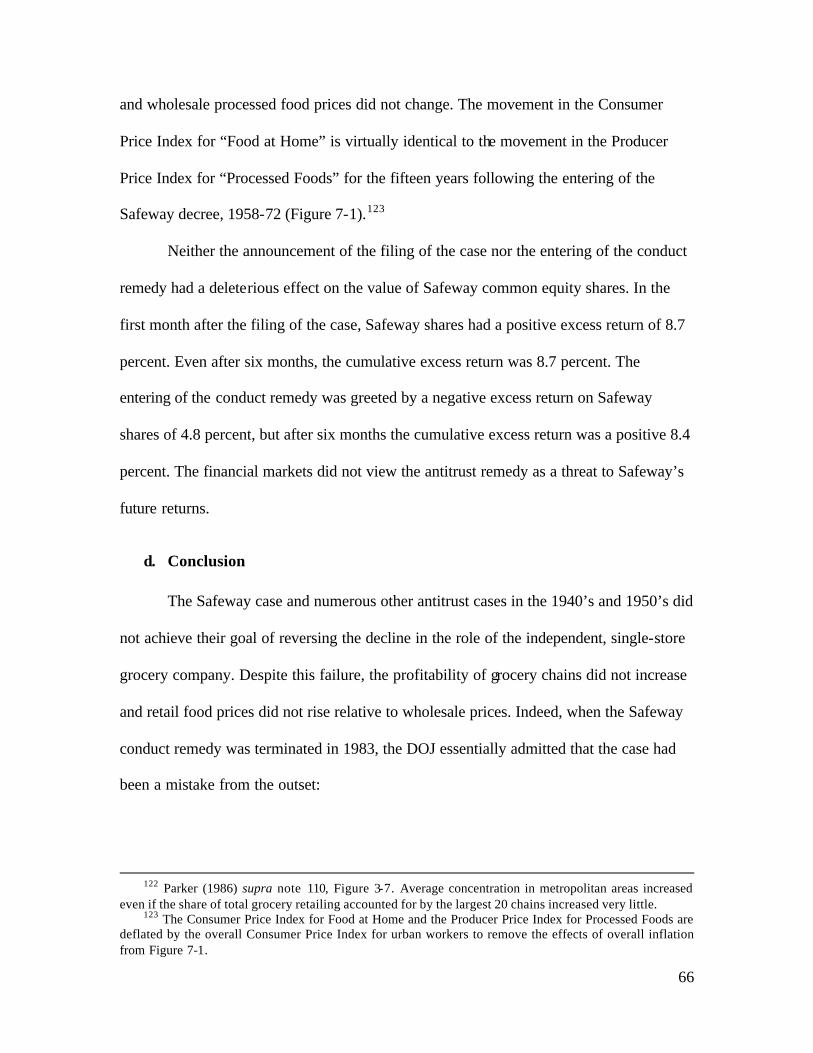
66
and wholesale processed food prices did not change. The movement in the Consumer
Price Index for “Food at Home” is virtually identical to the movement in the Producer
Price Index for “Processed Foods” for the fifteen years following the entering of the
Safeway decree, 1958-72 (Figure 7-1).123
Neither the announcement of the filing of the case nor the entering of the conduct
remedy had a deleterious effect on the value of Safeway common equity shares. In the
first month after the filing of the case, Safeway shares had a positive excess return of 8.7
percent. Even after six months, the cumulative excess return was 8.7 percent. The
entering of the conduct remedy was greeted by a negative excess return on Safeway
shares of 4.8 percent, but after six months the cumulative excess return was a positive 8.4
percent. The financial markets did not view the antitrust remedy as a threat to Safeway’s
future returns.
d. Conclusion
The Safeway case and numerous other antitrust cases in the 1940’s and 1950’s did
not achieve their goal of reversing the decline in the role of the independent, single-store
grocery company. Despite this failure, the profitability of grocery chains did not increase
and retail food prices did not rise relative to wholesale prices. Indeed, when the Safeway
conduct remedy was terminated in 1983, the DOJ essentially admitted that the case had
been a mistake from the outset:
122 Parker (1986) supra note 110, Figure 3-7. Average concentration in metropolitan areas increased
even if the share of total grocery retailing accounted for by the largest 20 chains increased very little. 123 The Consumer Price Index for Food at Home and the Producer Price Index for Processed Foods are
deflated by the overall Consumer Price Index for urban workers to remove the effects of overall inflation from Figure 7-1.
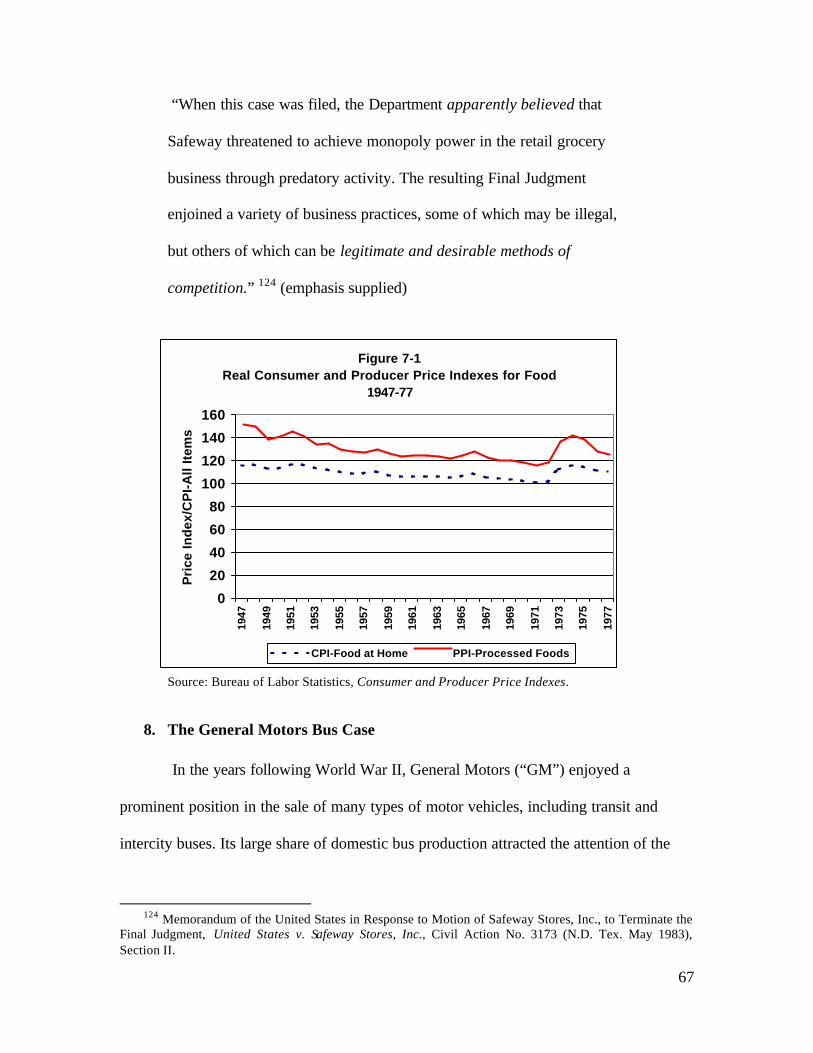
67
“When this case was filed, the Department apparently believed that
Safeway threatened to achieve monopoly power in the retail grocery
business through predatory activity. The resulting Final Judgment
enjoined a variety of business practices, some of which may be illegal,
but others of which can be legitimate and desirable methods of
competition.” 124 (emphasis supplied)
Source: Bureau of Labor Statistics, Consumer and Producer Price Indexes.
8. The General Motors Bus Case
In the years following World War II, General Motors (“GM”) enjoyed a
prominent position in the sale of many types of motor vehicles, including transit and
intercity buses. Its large share of domestic bus production attracted the attention of the
124 Memorandum of the United States in Response to Motion of Safeway Stores, Inc., to Terminate the
Final Judgment, United States v. Safeway Stores, Inc., Civil Action No. 3173 (N.D. Tex. May 1983), Section II.
Figure 7-1Real Consumer and Producer Price Indexes for Food
1947-77
0
20
40
60
80
100
120
140
160
1947
1949
1951
1953
1955
1957
1959
1961
1963
1965
1967
1969
1971
1973
1975
1977
Pri
ce In
dex
/CP
I-A
ll It
ems
CPI-Food at Home PPI-Processed Foods
68
DOJ, which filed a Sherman Act case against GM in 1956, alleging that GM had
monopolized the manufacture of intercity and transit buses.125
a. The Role of the Bus in the United States
There are three major types of buses, but only transit and intercity buses were
included in the DOJ’s Sherman Act suit against GM. These buses are of “integral
construction,” i.e., the body and the chassis are constructed as one unit. School buses,
which have a body-on-chassis construction, were excluded from the antitrust case.
Transit buses are designed for urban service at low speeds with frequent stops;
they have lower floors for greater accessibility and wider aisles for greater passenger
capacity. Intercity buses are designed for lengthy trips; they have high floors, narrow
aisles, comfortable seats, luggage racks, and a toilet.
Transit and intercity buses are traditionally manufactured on an assembly line that
produces about five units per eight-hour shift. These assembly lines may also produce
other vehicles, such as motor homes. Given the small scale of production, many of the
required components are purchased from independent suppliers or produced by a
company’s parts division for a variety of other vehicles, including trucks.
The demand for transit and intercity buses has varied greatly over time,
responding to trends in bus ridership and public financing of transit systems. During the
latter years of World War II, bus production declined substantially as production facilities
were diverted to the war effort. (See Table 8-1.) After the war, production surged as
transit systems sought to replace old transit buses that had depreciated during the war.
125 United States v. General Motors Corporation , Civil Action No. 15816 (D.Mich. 1956).
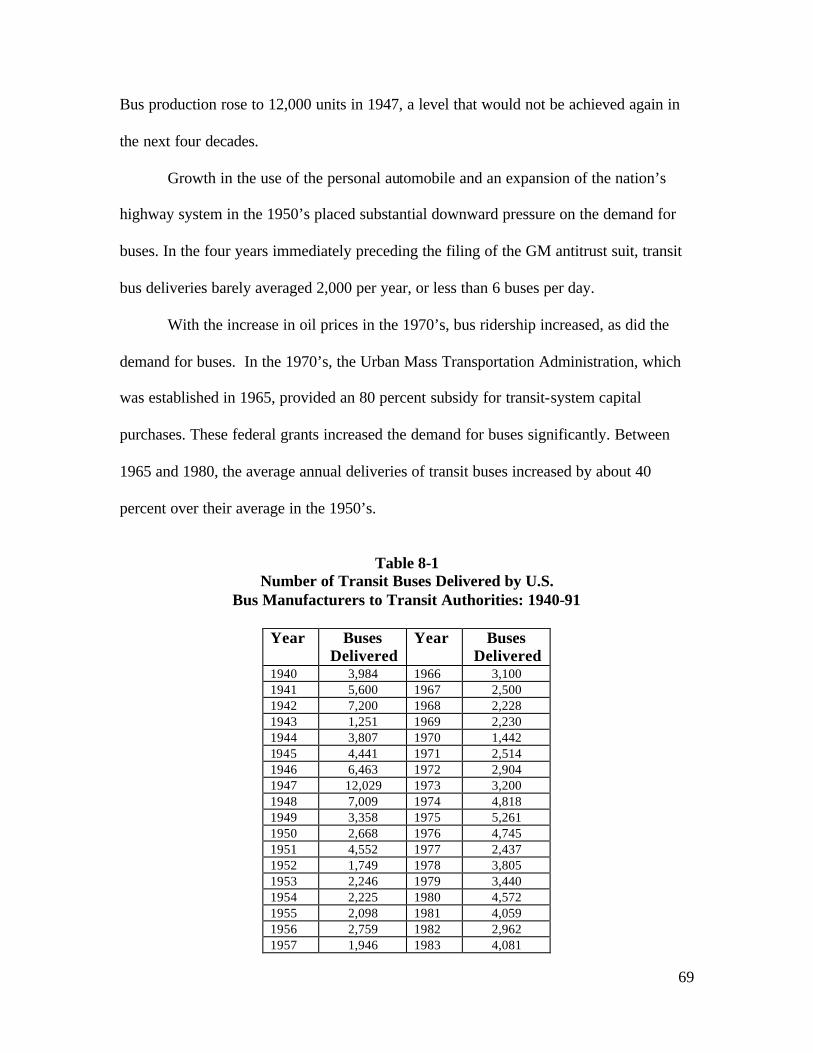
69
Bus production rose to 12,000 units in 1947, a level that would not be achieved again in
the next four decades.
Growth in the use of the personal automobile and an expansion of the nation’s
highway system in the 1950’s placed substantial downward pressure on the demand for
buses. In the four years immediately preceding the filing of the GM antitrust suit, transit
bus deliveries barely averaged 2,000 per year, or less than 6 buses per day.
With the increase in oil prices in the 1970’s, bus ridership increased, as did the
demand for buses. In the 1970’s, the Urban Mass Transportation Administration, which
was established in 1965, provided an 80 percent subsidy for transit-system capital
purchases. These federal grants increased the demand for buses significantly. Between
1965 and 1980, the average annual deliveries of transit buses increased by about 40
percent over their average in the 1950’s.
Table 8-1
Number of Transit Buses Delivered by U.S. Bus Manufacturers to Transit Authorities: 1940-91
Year Buses
Delivered Year Buses
Delivered 1940 3,984 1966 3,100 1941 5,600 1967 2,500 1942 7,200 1968 2,228 1943 1,251 1969 2,230 1944 3,807 1970 1,442 1945 4,441 1971 2,514 1946 6,463 1972 2,904 1947 12,029 1973 3,200 1948 7,009 1974 4,818 1949 3,358 1975 5,261 1950 2,668 1976 4,745 1951 4,552 1977 2,437 1952 1,749 1978 3,805 1953 2,246 1979 3,440 1954 2,225 1980 4,572 1955 2,098 1981 4,059 1956 2,759 1982 2,962 1957 1,946 1983 4,081
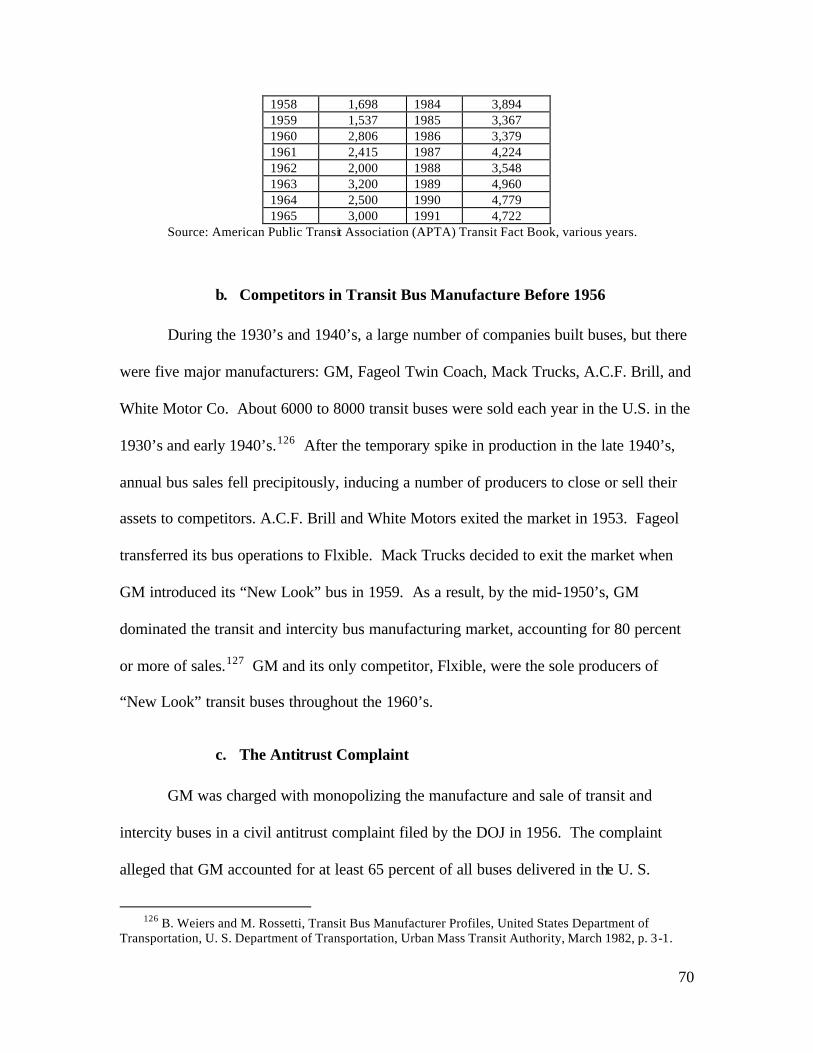
70
1958 1,698 1984 3,894 1959 1,537 1985 3,367 1960 2,806 1986 3,379 1961 2,415 1987 4,224 1962 2,000 1988 3,548 1963 3,200 1989 4,960 1964 2,500 1990 4,779 1965 3,000 1991 4,722
Source: American Public Transit Association (APTA) Transit Fact Book, various years.
b. Competitors in Transit Bus Manufacture Before 1956
During the 1930’s and 1940’s, a large number of companies built buses, but there
were five major manufacturers: GM, Fageol Twin Coach, Mack Trucks, A.C.F. Brill, and
White Motor Co. About 6000 to 8000 transit buses were sold each year in the U.S. in the
1930’s and early 1940’s.126 After the temporary spike in production in the late 1940’s,
annual bus sales fell precipitously, inducing a number of producers to close or sell their
assets to competitors. A.C.F. Brill and White Motors exited the market in 1953. Fageol
transferred its bus operations to Flxible. Mack Trucks decided to exit the market when
GM introduced its “New Look” bus in 1959. As a result, by the mid-1950’s, GM
dominated the transit and intercity bus manufacturing market, accounting for 80 percent
or more of sales.127 GM and its only competitor, Flxible, were the sole producers of
“New Look” transit buses throughout the 1960’s.
c. The Antitrust Complaint
GM was charged with monopolizing the manufacture and sale of transit and
intercity buses in a civil antitrust complaint filed by the DOJ in 1956. The complaint
alleged that GM accounted for at least 65 percent of all buses delivered in the U. S.
126 B. Weiers and M. Rossetti, Transit Bus Manufacturer Profiles, United States Department of
Transportation, U. S. Department of Transportation, Urban Mass Transit Authority, March 1982, p. 3-1.
71
between 1952 and 1955. Moreover, it claimed that between 1925 and 1955 more than 20
manufacturers of buses had withdrawn from the manufacturing business, and no entry
had occurred since 1946.
The complaint charged GM with:
• Pressuring other manufacturers to discontinue bus production;
• Acquiring the power to control bus operating companies and imposing
requirements contracts on them;
• Inducing transit officials to issue bus specifications that favored GM;
• Having a GM officer serve on the board of a competitor;
• Refusing to sell parts, including diesel engines and automatic transmissions, to
competitors;
• Acquiring exclusive rights to various technologies;
• Using its finance subsidiary to offer preferential rates to customers.128
The case never went to trial. GM and the government entered into a consent agreement
in 1965.
d. The Remedy
The conduct remedy that settled the case contained four provisions ostensibly
designed to reduce GM’s market power in bus manufacture. GM was enjoined from:
127 Id. 128 See United States v. General Motors Corporation , Civil Action No. 15816 (D.Mich. 1956).
72
• Allowing an individual owning a material share of any other bus manufacturer or
bus operating company, or any officer or director of such companies, to serve as
one of its officers or directors;
• Entering into exclusive supply contracts with any other bus manufacturer or bus
operating company concerning bus parts or buses.
GM was required to:
• Grant royalty free licenses for patents that it had on the effective date of the
decree and to license for a reasonable royalty any patents obtained during a ten-
year period following the decree;
• Sell buses to any bus operator and sell bus engines or transmissions or any other
parts to any bus manufacturer.129
The decree stipulated additional provisions in the event of certain market
conditions between the second and tenth anniversarie s of the consent decree. If bus
deliveries exceeded their 1964-1965 levels substantially and no additional competitor had
entered the market (or a competitor had exited and had not been replaced by another
competitor), GM could be required to sell a physically separate U.S. plant that
manufactured a substantial number of buses.
e. The Market for Transit Buses After the Decree
129 United States v. General Motors Corporation: Consent Decree, C.C.H Trade Cases ¶71,624 (1965).

73
GM and Flxible accounted for the overwhelming share of bus sales for most of
the 1960’s. In 1965, GM accounted for 85 percent of transit bus shipments, and Flxble
accounted for 15 percent.130 Flxible had introduced a copy of the New Look GM bus in
1962 with a GM diesel engine and, as a result, was able to sell 1,000 buses between 1962
and 1965.
Bus ridership had declined in the 1950’s as many people moved to the automobile
as an alternative to public transportation. In the 1970’s, there was a revival of the bus as
commuters shifted to public transportation in response to the rising price of gasoline.
The increase in bus ridership inevitably increased the demand for buses. (See Table 8-2.)
Since 1970, the demand for new transit buses has been driven primarily by
Federal appropriations, because most new transit buses sold are purchased with UMTA
grants.131 As a result of the surge in federal subsidies that followed the first OPEC oil
shock, shown in Table 8-3, transit bus deliveries increased from 1,442 in 1970 to 5,261 in
1975. (See Table 8-1.) They then receded to less than 2,500 in 1977 before rising again
after the second OPEC oil shock (Table 8-1.) Thereafter, shipments fell again until the
late 1980’s. This erratic pattern in market demand growth was uncongenial for attracting
new entrants into the market.
Table 8-2 Total Bus Passenger Rides per Year
Year Total Passengers (Millions) Year Total Passengers (Millions) 1940 13,098 1978 7,935 1945 23,254 1979 8,461 1950 17,246 1980 8,567 1955 11,529 1981 8,284
130 “GM Bus Suit Settled,” Business Week , December 4, 1965. 131 B. Weiers and M. Rossetti, Entry and Competition in the United States Transit Bus Manufacturing
Industry, United States Department of Transportation , July 1982, p. 1-2.
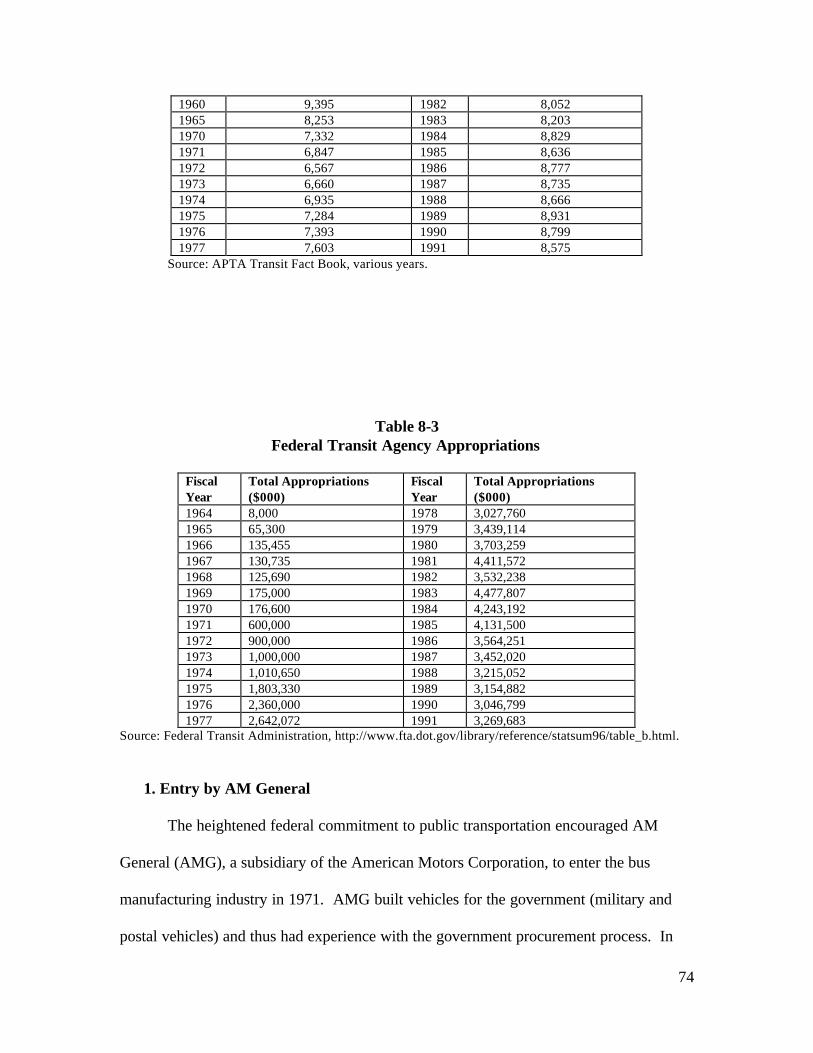
74
1960 9,395 1982 8,052 1965 8,253 1983 8,203 1970 7,332 1984 8,829 1971 6,847 1985 8,636 1972 6,567 1986 8,777 1973 6,660 1987 8,735 1974 6,935 1988 8,666 1975 7,284 1989 8,931 1976 7,393 1990 8,799 1977 7,603 1991 8,575
Source: APTA Transit Fact Book, various years.
Table 8-3 Federal Transit Agency Appropriations
Fiscal Year
Total Appropriations ($000)
Fiscal Year
Total Appropriations ($000)
1964 8,000 1978 3,027,760 1965 65,300 1979 3,439,114 1966 135,455 1980 3,703,259 1967 130,735 1981 4,411,572 1968 125,690 1982 3,532,238 1969 175,000 1983 4,477,807 1970 176,600 1984 4,243,192 1971 600,000 1985 4,131,500 1972 900,000 1986 3,564,251 1973 1,000,000 1987 3,452,020 1974 1,010,650 1988 3,215,052 1975 1,803,330 1989 3,154,882 1976 2,360,000 1990 3,046,799 1977 2,642,072 1991 3,269,683
Source: Federal Transit Administration, http://www.fta.dot.gov/library/reference/statsum96/table_b.html.
1. Entry by AM General
The heightened federal commitment to public transportation encouraged AM
General (AMG), a subsidiary of the American Motors Corporation, to enter the bus
manufacturing industry in 1971. AMG built vehicles for the government (military and
postal vehicles) and thus had experience with the government procurement process. In
75
1971, AMG bought a transit bus design from a Canadian manufacturer called Flyer
Industries.132 AMG redesigned the Canadian bus and named it “Metropolitan.”133 Under
the conditions of the decree, GM provided its Allison transmissions and Detroit Diesel
supplied the bus engines.134 Actual production began in 1974.
The three manufacturers, AM General, Flxible, and GM had roughly equal market
shares in the 1974-1975 period. GM had lost market share, but its total shipments were
virtually identical to its 1952-55 output.135 Within a span of five years, GM had gone
from being the market leader to an equal player in a much larger market comprised of
three companies. AMG’s entry, however, was to prove short lived.
Under a program called Transbus, the Urban Mass Transit Administration signed
contracts with all three bus manufacturers to develop prototypes for a new bus design
based on a study by the National Academy of Engineering. The Transbus design was
supposed to replace the New Look design that had been used since the 1960’s. All three
manufacturers built prototypes, but each declined to produce the Transbus for business
and technical reasons. 136
In the meantime, both GM and Flxible produced a new bus design, called the
Advanced Design Bus (“ADB”), which embodied a substantial amount of the research
and development that went into the Transbus prototype. In 1976, UMTA abandoned the
Transbus concept and endorsed the ADB. Transit authorities could now order ADB
buses, which both GM and Flxble were ready to produce in 1976.
132 Weiers and Rossetti (March 1982), supra note 126, p. 4-51. 133 AM General, Ohio Museum of Transportation, (Oct. 31, 2001), available at
http://otot.org/roster/buses/amg.html. 134 Larry Neal, “AMC’s Got the Right Thing at the Right Time – Again,” Iron Age (Feb. 25, 1974), p.
24. 135 Weiers and Rossetti (March 1982), supra note 126, p. 3-8. 136 Id., p. 3-11.
76
AMG had bought its initial bus design from Flyer Industries of Canada, purchased
its engines from Detroit Diesel, and purchased its transmissions from GM. However, the
consent decree only required GM to license bus designs that were patented within ten
years of the decree, a requirement that expired in 1975. Having patented the Advanced
Design bus in 1976, GM did not have to license this design to AMG. AMG had not
developed a working model by that time, resulting in its loss of federal contracts.137
Lacking its own design, AMG decided to exit the market instead of developing an ADB
bus of its own. 138
Flxible, on the other hand, developed its own version of the ADB and proceeded
with actual production in 1978.139 GM re-emerged as the leader in the domestic bus
manufacturing industry, capturing more than half of domestic sales by 1980.140 Other
than Flxible and GMC, the only other suppliers were GM of Canada and Flyer Industries,
a small manufacturer in Winnipeg, Canada. Thus, 15 years after the conduct remedy was
launched, the structure of the industry was little changed.
The reason for the failure of competition to develop over the 1965-80 period is
clear. The minimum efficient scale in producing transit buses was a large fraction of the
total U.S. market. As a 1982 UMTA study reported, GM and Flxible had production
capacity of about 9,000 buses per year, but orders for only about 4,000. At this scale, the
two dominant manufacturers both could not operate efficiently. Indeed, the 1982 report
concedes that “Neither GMC nor Flxible has prospered since 1978.”141 Yet total
deliveries in 1978-82 were much greater than in 1956-65 when the DOJ was pressing its
137 “Transbus Concept is Abandoned,” Automat, (Aug. 2, 1976), p. 3. 138 Weiers and Rossetti (March 1982), supra note 126, p. 3-11. 139 Id. 140 Weiers and Rossetti (July 1982), supra note 131, Table 1-1.
77
Section 2 case against GM. An attempt to force additional competition among multiple
firms into such a small market with large economies of scale proved to be futile.
There was no further entry into the bus manufacturing industry until 1980-81, or 15
years after the date of the GM decree. Gillig, a California school-bus builder, announced
a standard size transit bus. Crown Coach, a Los Angeles intercity and school-bus builder,
announced that it would produce an articulated transit bus following a design by Ikarus of
Hungary. Neoplan and M.A.N., West German firms, both announced plans to build
production facilities in the U.S. to produce transit buses. This entry was unrelated to the
1965 decree.
2. Intercity Buses
The consent decree applied equally to both transit and intercity buses. Although
there was no immediate entry into the manufacture of transit buses in response to the
decree (AMG did not enter until 1971-72), the intercity bus industry was already
undergoing major change at the time of the decree.142 The two major intercity carriers,
Greyhound and Trailways, began to integrate vertically into intercity bus manufacturing
after 1965. Greyhound, which had purchased its buses from GM, started purchasing
buses from Motor Coach Industries, a subsidiary of Greyhound. Greyhound bought its
last GM bus in 1967. Greyhound eventually began producing buses in the United States,
both for itself and for non-Greyhound customers. The Roswell plant, which produces
most of the buses used by Greyhound itself, opened in 1974. Trailways, which had been
importing buses from Europe, also established a manufacturing plant in 1974.143
141 Id., p. 1-18. 142 Weiers and Rossetti (March 1982), supra note 126, p. 3-6. 143 Id.
78
GM was barred by the decree from entering into long-term exclusive contracts
with Greyhound, thereby depriving it of the assured benefits of scale necessary for
efficient operation. GM therefore exited from intercity bus manufacturing in 1979.
Flxible had abandoned intercity bus manufacturing a decade earlier.
3. The Effects of the Decree on Prices
The 1965 consent decree had very little effect on the supply of buses, which was
(and still is) largely driven by federal funding decisions. The decree assisted the entry of
AMG in 1971-72 because of its provision requiring GM to sell components, such as
diesel engines and transmissions, to its rivals. On the other hand, there were numerous
suppliers of the components required for large vehicles in the 1960’s. Therefore, AMG
may not have required GM’s engines or transmissions. In a few years, however, AMG
was gone and U.S. bus manufacturing returned to status quo ante.
If the decree had any substantial effect on bus output and prices, this effect should
be visible in the average prices of buses. The entry of AMG and the temporary increase
in the number of rivals might be expected to push prices downward. Figure 8-1 shows the
real wholesale price of buses and the real wholesale price of trucks over the entire period
of 1947 to 1978.144 Despite the consent decree and the subsequent entry of AMG into the
domestic bus manufacturing industry, the real price of buses follows the same trend as
the real price of trucks, which were not the subject of antitrust action.
There is no evident response of bus prices to the filing of the suit in 1956, the
entering of the decree in 1965, or the entry of AMG after 1972. The decline in the real
price of buses after 1971 is virtually identical to the decline in the price of trucks, but
79
AMG did not enter as a truck producer. The obvious explanation for the decline in both
price series from 1972 through 1974 was federal price controls. The easing of these
controls in 1975 generated a rebound in both price series.
e. Conclusion
The manufacture of buses has been a small business in the United States for most
of the post-World War II period. In the late 1950’s and early 1960’s, the number of bus
manufacturers declined because of the sharp drop in the demand for transit buses. In this
environment, the DOJ sought to find other explanations for GM’s dominant position in
bus manufacturing, bringing a Section 2 Sherman Act case that focused on GM’s various
business practices. The conduct remedy that settled the case required GM to change its
marketing practices and to sell components to competitors. It did not require divestiture
because GM’s bus manufacturing did not even fully exhaust the capacity of one plant.
Figure 8-1
Real Wholesale Price of Buses and Trucks: 1947-78 Source: Bureau of Labor Statistics, Producer Price Index.
144 The two series in Table 1 are the Producer Price Indexes of “motor coaches and buses” and “motor
trucks and truck tractors,” respectively, deflated by the overall Producer Price Index. The data are generally not available for years after 1978.
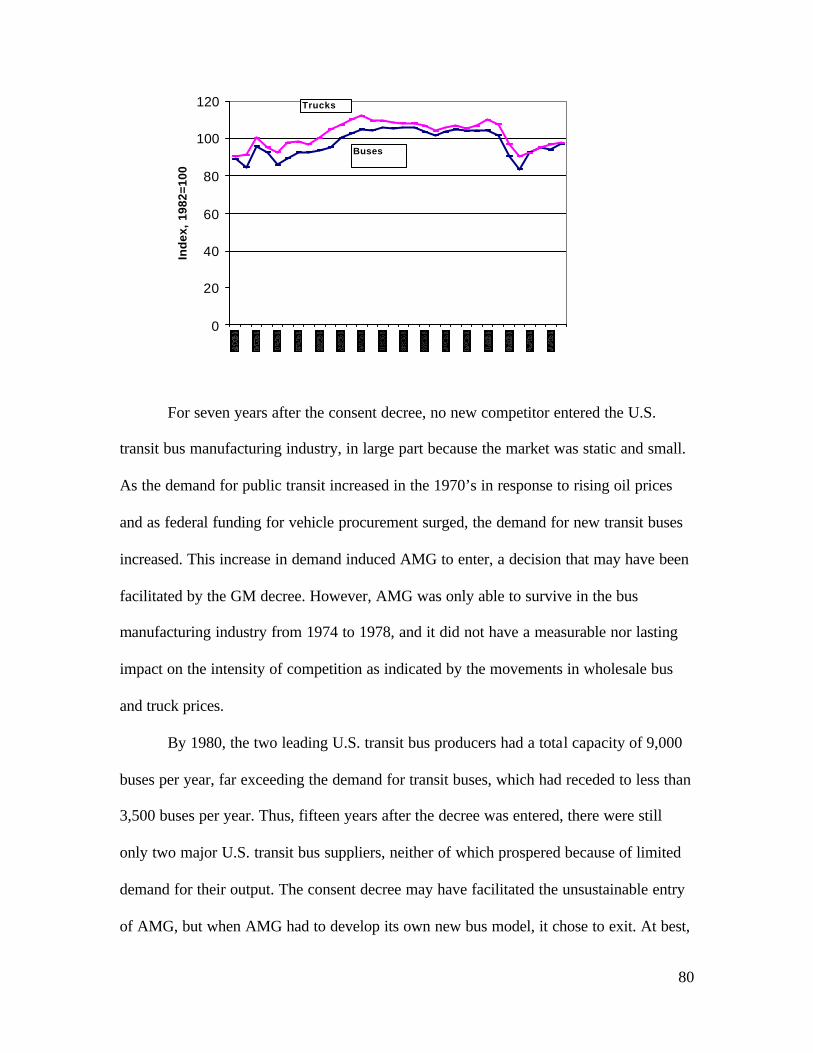
80
For seven years after the consent decree, no new competitor entered the U.S.
transit bus manufacturing industry, in large part because the market was static and small.
As the demand for public transit increased in the 1970’s in response to rising oil prices
and as federal funding for vehicle procurement surged, the demand for new transit buses
increased. This increase in demand induced AMG to enter, a decision that may have been
facilitated by the GM decree. However, AMG was only able to survive in the bus
manufacturing industry from 1974 to 1978, and it did not have a measurable nor lasting
impact on the intensity of competition as indicated by the movements in wholesale bus
and truck prices.
By 1980, the two leading U.S. transit bus producers had a total capacity of 9,000
buses per year, far exceeding the demand for transit buses, which had receded to less than
3,500 buses per year. Thus, fifteen years after the decree was entered, there were still
only two major U.S. transit bus suppliers, neither of which prospered because of limited
demand for their output. The consent decree may have facilitated the unsustainable entry
of AMG, but when AMG had to develop its own new bus model, it chose to exit. At best,
0
20
40
60
80
100
120
Ind
ex,
1982
=100
Buses
Trucks

81
therefore, the decree created a parasite that could not compete with GM and Flxible when
it was required to provide an innovative product design. As a result, the decree did not
increase competition or have a measurable effect on the price of transit buses. It was
largely irrelevant.
9. The Jerrold Electronics Case
Cable antenna television (CATV) systems have their origins in small-scale
attempts to transmit off-air television signals through wires to areas of limited or no off-
air reception. Credit for the first CATV system is generally given to L.E. Parsons, who in
1947 set up a very limited operation in Astoria, Oregon. Soon, similar operations were
flowering in a number of cities in Pennsylvania and Arkansas.145 These early operations
were simply engaged in the retransmission of local television signals. They did not
originate or license programming as the multi-channel cable companies do today.
Jerrold Electronics was a pioneer in developing the technology of such systems
and was responsible for building a large share of the early cable systems. It claimed to
have built 80 percent of all systems by 1954. Jerrold not only built most of the early
systems, but it required that its customers purchase all of the central electronic
components, the subsequent maintenance of these systems, and even secure much of their
financing from Jerrold. By engaging in such extensive “full- line forcing,” Jerrold invited
the interest of the antitrust authorities.
a. The Antitrust Suit
145 Archer S. Taylor, History Between Their Ears: Recollections of Pioneer CATV Engineers. Denver:
The Cable Center, 2000, pp. 10-17.
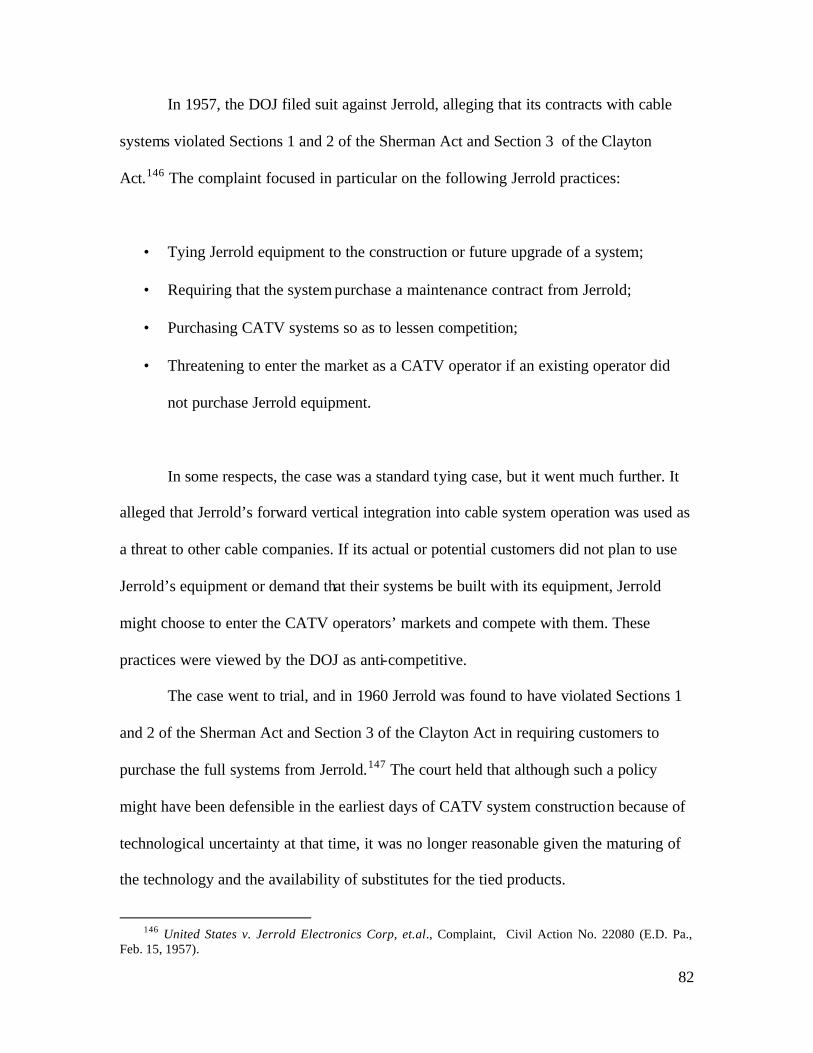
82
In 1957, the DOJ filed suit against Jerrold, alleging that its contracts with cable
systems violated Sections 1 and 2 of the Sherman Act and Section 3 of the Clayton
Act.146 The complaint focused in particular on the following Jerrold practices:
• Tying Jerrold equipment to the construction or future upgrade of a system;
• Requiring that the system purchase a maintenance contract from Jerrold;
• Purchasing CATV systems so as to lessen competition;
• Threatening to enter the market as a CATV operator if an existing operator did
not purchase Jerrold equipment.
In some respects, the case was a standard tying case, but it went much further. It
alleged that Jerrold’s forward vertical integration into cable system operation was used as
a threat to other cable companies. If its actual or potential customers did not plan to use
Jerrold’s equipment or demand that their systems be built with its equipment, Jerrold
might choose to enter the CATV operators’ markets and compete with them. These
practices were viewed by the DOJ as anti-competitive.
The case went to trial, and in 1960 Jerrold was found to have violated Sections 1
and 2 of the Sherman Act and Section 3 of the Clayton Act in requiring customers to
purchase the full systems from Jerrold.147 The court held that although such a policy
might have been defensible in the earliest days of CATV system construction because of
technological uncertainty at that time, it was no longer reasonable given the maturing of
the technology and the availability of substitutes for the tied products.
146 United States v. Jerrold Electronics Corp, et.al., Complaint, Civil Action No. 22080 (E.D. Pa.,
Feb. 15, 1957).
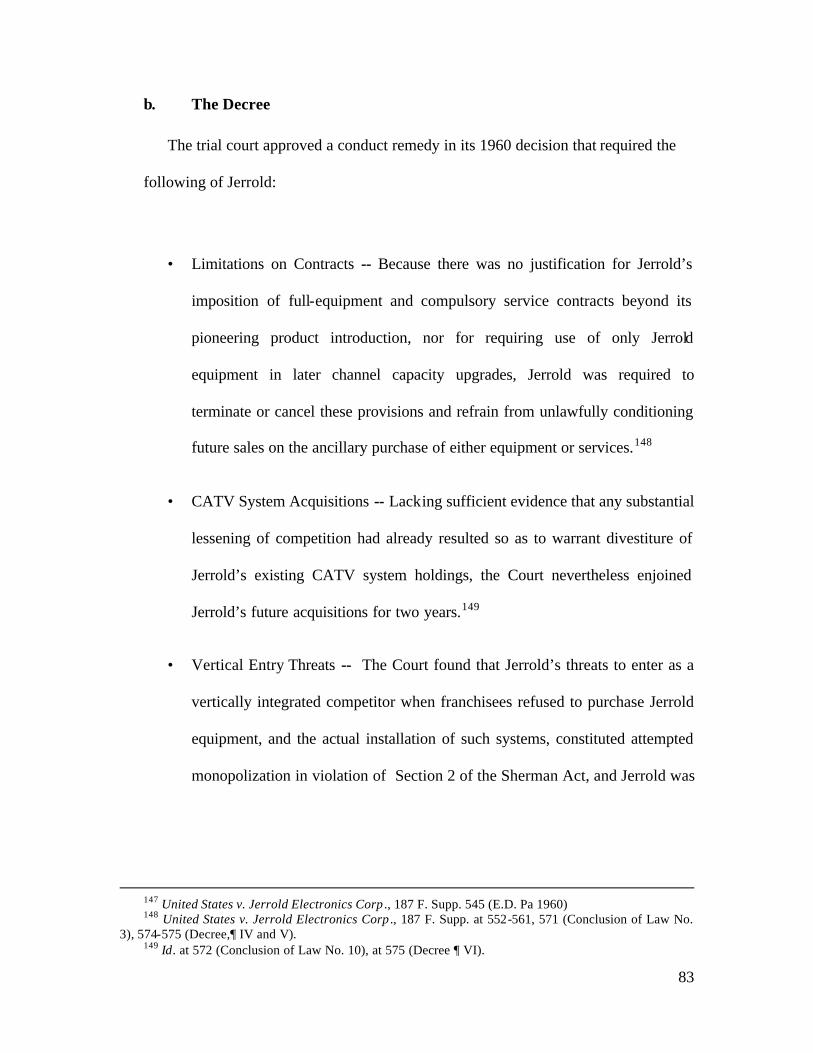
83
b. The Decree
The trial court approved a conduct remedy in its 1960 decision that required the
following of Jerrold:
• Limitations on Contracts -- Because there was no justification for Jerrold’s
imposition of full-equipment and compulsory service contracts beyond its
pioneering product introduction, nor for requiring use of only Jerrold
equipment in later channel capacity upgrades, Jerrold was required to
terminate or cancel these provisions and refrain from unlawfully conditioning
future sales on the ancillary purchase of either equipment or services.148
• CATV System Acquisitions -- Lacking sufficient evidence that any substantial
lessening of competition had already resulted so as to warrant divestiture of
Jerrold’s existing CATV system holdings, the Court nevertheless enjoined
Jerrold’s future acquisitions for two years.149
• Vertical Entry Threats -- The Court found that Jerrold’s threats to enter as a
vertically integrated competitor when franchisees refused to purchase Jerrold
equipment, and the actual installation of such systems, constituted attempted
monopolization in violation of Section 2 of the Sherman Act, and Jerrold was
147 United States v. Jerrold Electronics Corp ., 187 F. Supp. 545 (E.D. Pa 1960) 148 United States v. Jerrold Electronics Corp ., 187 F. Supp. at 552-561, 571 (Conclusion of Law No.
3), 574-575 (Decree,¶ IV and V). 149 Id. at 572 (Conclusion of Law No. 10), at 575 (Decree ¶ VI).
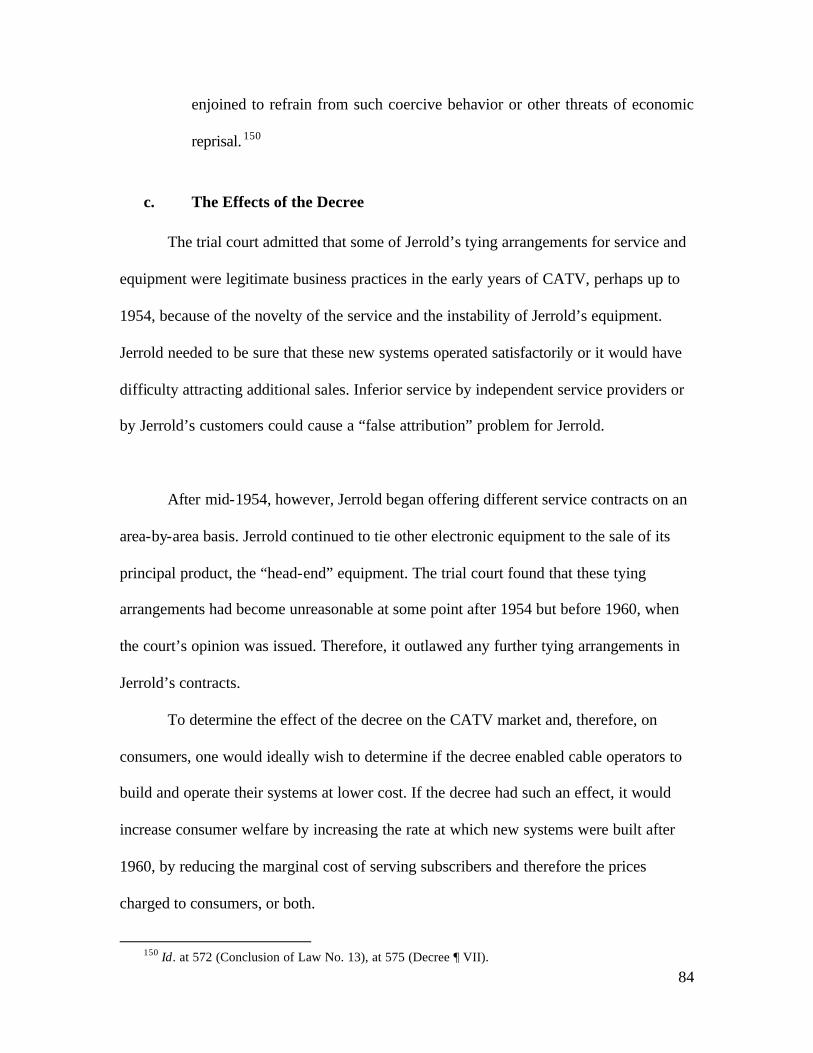
84
enjoined to refrain from such coercive behavior or other threats of economic
reprisal. 150
c. The Effects of the Decree
The trial court admitted that some of Jerrold’s tying arrangements for service and
equipment were legitimate business practices in the early years of CATV, perhaps up to
1954, because of the novelty of the service and the instability of Jerrold’s equipment.
Jerrold needed to be sure that these new systems operated satisfactorily or it would have
difficulty attracting additional sales. Inferior service by independent service providers or
by Jerrold’s customers could cause a “false attribution” problem for Jerrold.
After mid-1954, however, Jerrold began offering different service contracts on an
area-by-area basis. Jerrold continued to tie other electronic equipment to the sale of its
principal product, the “head-end” equipment. The trial court found that these tying
arrangements had become unreasonable at some point after 1954 but before 1960, when
the court’s opinion was issued. Therefore, it outlawed any further tying arrangements in
Jerrold’s contracts.
To determine the effect of the decree on the CATV market and, therefore, on
consumers, one would ideally wish to determine if the decree enabled cable operators to
build and operate their systems at lower cost. If the decree had such an effect, it would
increase consumer welfare by increasing the rate at which new systems were built after
1960, by reducing the marginal cost of serving subscribers and therefore the prices
charged to consumers, or both.
150 Id. at 572 (Conclusion of Law No. 13), at 575 (Decree ¶ VII).
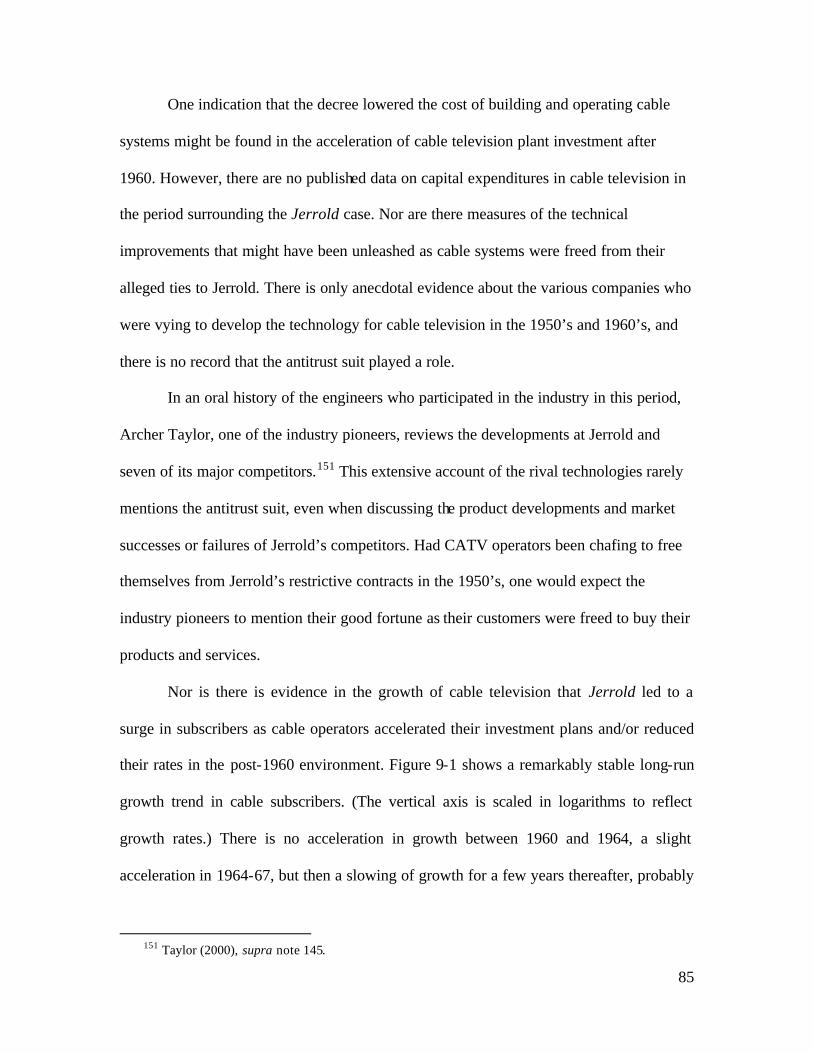
85
One indication that the decree lowered the cost of building and operating cable
systems might be found in the acceleration of cable television plant investment after
1960. However, there are no published data on capital expenditures in cable television in
the period surrounding the Jerrold case. Nor are there measures of the technical
improvements that might have been unleashed as cable systems were freed from their
alleged ties to Jerrold. There is only anecdotal evidence about the various companies who
were vying to develop the technology for cable television in the 1950’s and 1960’s, and
there is no record that the antitrust suit played a role.
In an oral history of the engineers who participated in the industry in this period,
Archer Taylor, one of the industry pioneers, reviews the developments at Jerrold and
seven of its major competitors.151 This extensive account of the rival technologies rarely
mentions the antitrust suit, even when discussing the product developments and market
successes or failures of Jerrold’s competitors. Had CATV operators been chafing to free
themselves from Jerrold’s restrictive contracts in the 1950’s, one would expect the
industry pioneers to mention their good fortune as their customers were freed to buy their
products and services.
Nor is there is evidence in the growth of cable television that Jerrold led to a
surge in subscribers as cable operators accelerated their investment plans and/or reduced
their rates in the post-1960 environment. Figure 9-1 shows a remarkably stable long-run
growth trend in cable subscribers. (The vertical axis is scaled in logarithms to reflect
growth rates.) There is no acceleration in growth between 1960 and 1964, a slight
acceleration in 1964-67, but then a slowing of growth for a few years thereafter, probably
151 Taylor (2000), supra note 145.
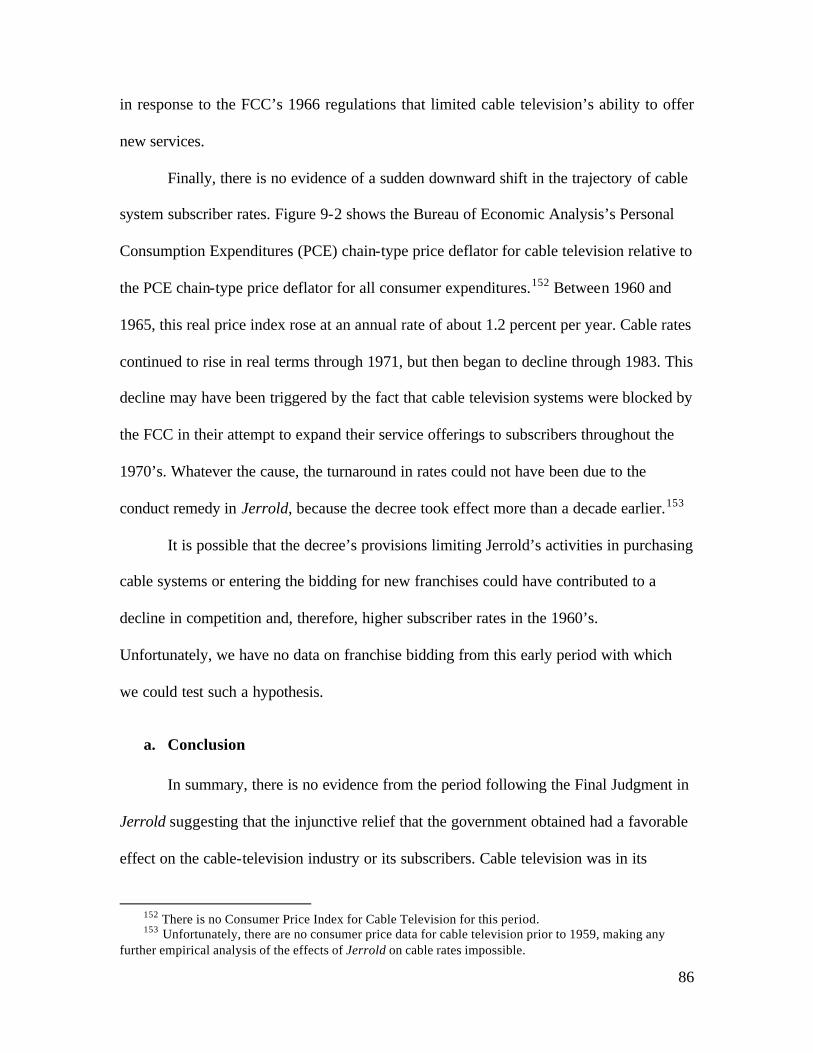
86
in response to the FCC’s 1966 regulations that limited cable television’s ability to offer
new services.
Finally, there is no evidence of a sudden downward shift in the trajectory of cable
system subscriber rates. Figure 9-2 shows the Bureau of Economic Analysis’s Personal
Consumption Expenditures (PCE) chain-type price deflator for cable television relative to
the PCE chain-type price deflator for all consumer expenditures.152 Between 1960 and
1965, this real price index rose at an annual rate of about 1.2 percent per year. Cable rates
continued to rise in real terms through 1971, but then began to decline through 1983. This
decline may have been triggered by the fact that cable television systems were blocked by
the FCC in their attempt to expand their service offerings to subscribers throughout the
1970’s. Whatever the cause, the turnaround in rates could not have been due to the
conduct remedy in Jerrold, because the decree took effect more than a decade earlier.153
It is possible that the decree’s provisions limiting Jerrold’s activities in purchasing
cable systems or entering the bidding for new franchises could have contributed to a
decline in competition and, therefore, higher subscriber rates in the 1960’s.
Unfortunately, we have no data on franchise bidding from this early period with which
we could test such a hypothesis.
a. Conclusion
In summary, there is no evidence from the period following the Final Judgment in
Jerrold suggesting that the injunctive relief that the government obtained had a favorable
effect on the cable-television industry or its subscribers. Cable television was in its
152 There is no Consumer Price Index for Cable Television for this period.
153 Unfortunately, there are no consumer price data for cable television prior to 1959, making any further empirical analysis of the effects of Jerrold on cable rates impossible.

87
infancy when the case was first brought, and it was far from maturity when the decree
was entered in 1960.The decree did not unleash a wave of new investment or innovation
that expanded service and/or reduced consumer rates.
Figure 9-1Cable Television Subscribers, 1955-79
0.1
1
10
100
1955
1957
1959
1961
1963
1965
1967
1969
1971
1973
1975
1977
1979
Mill
ion
Sub
scri
bers
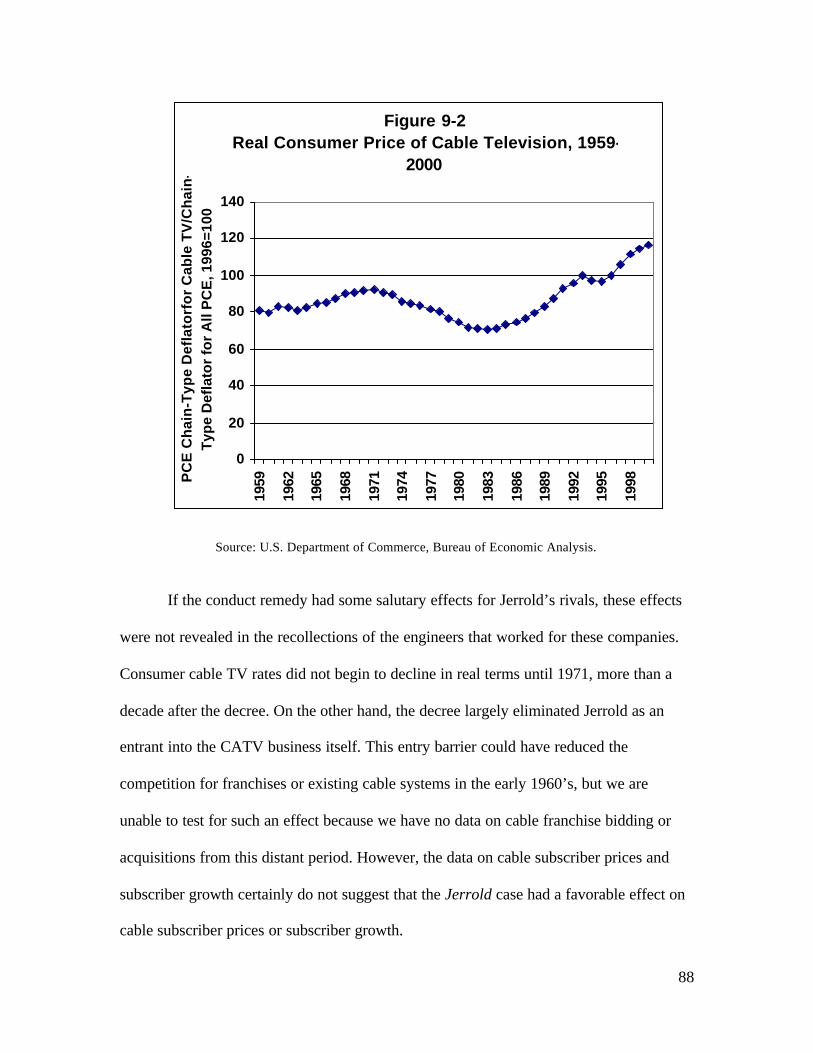
88
Figure 9-2Real Consumer Price of Cable Television, 1959-
2000
0
20
40
60
80
100
120
140
1959
1962
1965
1968
1971
1974
1977
1980
1983
1986
1989
1992
1995
1998P
CE
Ch
ain
-Typ
e D
efla
torf
or
Cab
le T
V/C
hai
n-
Typ
e D
efla
tor
for
All
PC
E, 1
996=
100
Source: U.S. Department of Commerce, Bureau of Economic Analysis.
If the conduct remedy had some salutary effects for Jerrold’s rivals, these effects
were not revealed in the recollections of the engineers that worked for these companies.
Consumer cable TV rates did not begin to decline in real terms until 1971, more than a
decade after the decree. On the other hand, the decree largely eliminated Jerrold as an
entrant into the CATV business itself. This entry barrier could have reduced the
competition for franchises or existing cable systems in the early 1960’s, but we are
unable to test for such an effect because we have no data on cable franchise bidding or
acquisitions from this distant period. However, the data on cable subscriber prices and
subscriber growth certainly do not suggest that the Jerrold case had a favorable effect on
cable subscriber prices or subscriber growth.
89
10. Blue Chip Stamps
Blue Chip Stamps was formed in 1956 in California by Safeway and other leading
grocery chains and one pharmacy chain. Blue Chip was organized to compete
defensively with existing stamp plans – notably S&H Stamps.154 According to one of the
company’s founders, Blue Chip Stamp was formed “largely to combat the edge Sperry &
Hutchinson Co.’s franchised S&H Green Stamps gave competitor chains.”155
a. Trading Stamps – A Marketing Tool
American manufacturers and retailers have used premiums as a promotional
device to attract and retain customer patronage since at least the mid-nineteenth century.
The earliest record of trading stamps in the U.S. dates back to 1891, when Schuster’s
Department Store of Milwaukee, Wisconsin, introduced the Blue Trading Stamp System.
Gummed stamps substituted for the coupons commonly used by manufacturers and
retailers since the middle of the nineteenth century. 156 Customers could paste these
stamps in books that could be redeemed for merchandise.
In 1896 Thomas Sperry, a salesman, developed the concept of a trading stamp
company as an independent business and Sperry and Shelley Hutchison, a businessman,
founded the Sperry and Hutchison Company (“S&H”), which marketed premium
catalogs and stamp books to merchants and provided merchandise for customers who
redeemed the filled books at “premium parlors” or redemption centers. S&H became the
154 Note, Trading Stamps, New York University Law Review, 37:1090, 1101 at f. 55 (1962).
155 “Blue Chip Stamp, Agency Agree on Splitting Firm Into 2 Companies in 1969,” Wall Street Journal , July 22, 1966, p. 22, col. 2.
156 Federal Trade Commission, Economic Report on the Use and Economic Significance of Trading Stamps. 1966, pp. 1-2.
90
dominant stamp plan nationally, but it inspired perhaps 200-500 imitators, most of them
regional. 157
The stamp novelty faded with the outbreak of World War I and retailers’ use of
trading stamps dropped to about two percent of retail trade.158 During the 1920’s, when
prices were stable, merchants’ use of trading stamps remained at only 2-3 percent of total
retail trade. During the Depression, when prices were declining and states began passing
fair-trade laws to deter retailers from cutting prices, the number of retailers offering
trading stamps dropped substantially.
The robust post-war economy of the 1950’s and suburban population growth
revived the popularity of trading stamps. Retailers of all kinds, including dry cleaners,
movie theaters and feed mills, offered stamps to their customers. According to Haring
and Yoder, grocery stores, gasoline stations, and pharmacies were the initial outlets for
trading stamp companies, but food supermarkets were by far the principal users and “an
outstanding factor in creating stamp popularity.”159 Between 1950 and 1963 the total of
trading stamps purchased grew 25-fold.160 Some supermarket chains, including A&P,
began to establish their own trading stamp subsidiaries.
b. The Growth of Blue Chip
The retailers who used Blue Chip stamps included the largest pharmacy chain in
California, Thrifty Drug Stores, and eight grocery chains, with 1962 sales constituting 30
157 Jeff R. Lonto, “The Trading Stamp Story,” posted at http://www.berkshireblues.com/stamps.htm. 158 Federal Trade Commission, supra note 156, p. 2. 159 Albert Haring and Wallace E. Yoder, eds., Trading Stamp Practice and Pricing Policy, Indiana
Business Report No. 27, School of Business, Indiana University, 1958, p. ix, 3, 12; Federal Trade Commission, supra note 154, pp. 12-13.
160 “S&H Green Stamps Try For a New Life on the Internet,” St. Petersburg Times, Mar. 20, 2000, p. 2.
91
percent of all grocery store sales in the state.161 The Blue Chip Stamp, essentially a
carbon copy of S&H, was launched in the San Francisco Bay area in the mid-1950’s.162
It then entered the Los Angeles area – where S&H had been well established for some
time. The entry of Blue Chip Stamps in January 1960 was the first time in local food
retailing history that all the major food chains (including independents such as Von’s,
Ralph’s, Market Basket and others, tha t together owned four hundred area supermarkets)
collaborated to support a new stamp plan. 163
Since stamps were not sold but offered as “premiums” with the sale of groceries,
drug store items, and gasoline, they were essentially a promotional device, similar to the
coupons used by retailers today or frequent- flyer programs used by airlines. The decision
by the retailers who founded Blue Chip Stamps to use them exclusively and to deny them
to their competitors could only be anticompetitive if this decision led to these companies
amassing market power in groceries, drug store items, or retail gasoline.164
c. The Antitrust Case
In 1963 the DOJ filed a civil antitrust action alleging that Blue Chip and nine
retailers who owned 90 percent of its shares had: (1) engaged since 1955 in a conspiracy
in restraint of trade, and (2) monopolized the trading stamp business in California in
violation of Sections 1 and 2 of the Sherman Act.165 The complaint charged, among other
things, that the defendant retailers organized Blue Chip Stamp Company and agreed: (1)
161 The grocery chains were: Alexander’s Markets, Lucky Stores Inc., Market Basket, Purity Stores
Inc., Ralph’s Grocery Co., Safeway Stores Inc., Thriftimart Inc., and Von’s Grocery Co. 162 “Blue Chip bucks S&H in Los Angeles stamp clash,” Printers’ Ink , February 5, 1960.
163 Id. 164 Blue Chip apparently was willing to market stamps to retailers who were not in head-to-head
competition with Blue Chip’s founders. 165 United States v. Blue Chip Stamp Company, et.al., Complaint, Civil Action No. 63-1552S (S.D.
Cal. 1963) at ¶ 29.
92
to refrain from the use of any other trading stamp except by agreement of the group; (2)
that Blue Chip stamps would be sold and distributed at or about cost so as to stop other
stamp companies from effectively competing with Blue Chip; and (3) that Blue Chip
stamps would be issued only in those areas of California agreed to by the group. The
complaint sought an injunction against continuation of the alleged activities and asked
that the defendant retailers be enjoined from using Blue Chip stamps.
The government and defendants engaged in negotiations for several years to settle
this case. Three separate consent decrees were eventually proposed and filed with the
District Court. The DOJ withdrew its consent to the first judgment and the judge
declined to approve the second. Finally the litigation was settled in 1967 when the court
signed a decree filed by the parties, stating that it was “designed to limit the powers of
Blue Chip and to open up and increase competition in the stamp industry in California,
while at the same time preserving the legitimate interests of the users of Blue Chip
stamps” and characterizing the reorganization of Blue Chip as the “most practical way to
increase competition.”166
The decree itself did not provide a plan for reorganizing Blue Chip, but merely
directed the parties to the consent decree to present such a plan to the court. Under the
terms the court approved, the nine chains who jointly established Blue Chip were
allowed, if they wished, to retain 45 percent of the company’s stock. Retailers who were
Blue Chip customers were permitted to purchase another 45 percent, and Blue Chip’s
management was allowed to buy the remaining 10 percent. The reorganized Blue Chip
was required to offe r 55 percent of its shares of common stock and debentures, on a pro
166 United States v. Blue Chip Stamp Co., 272 F.Supp. 432, 440 (C.D. Cal.), aff’d sub. nom Thrifty Shoppers Scrip Co. v. U.S., 389 U.S. 580 (1968)
93
rata basis (determined by the quantity of stamps issued to each of these non-shareholding
users during a designated period), to retailers who had used the stamp service in the past
but who were not shareholders in the old company.
The remedy also prohibited the present and future Blue Chip companies from
refusing service to a retailer because another retailer in the same locality already carried
Blue Chip stamps or because the retailer was already using another brand of trading
stamps. The company was also barred from refusing service because of the rate at which
a retailer chose to dispense Blue Chip stamps.
d. Effect of the Decree
Trading stamps began to decline in popularity at the same time as the decree was
entered. They suffered their first decline in thirteen years in 1967.167 Supermarkets
started to experiment with alternative means of securing consumer patronage, notably by
simply advertising lower prices. Companies such as S&H and Gold Bond began to
diversify into other businesses, while new discount stores such as Target and Kmart
began transforming the retail landscape, competing directly with the stamp industry by
aiming price-cutting efforts at the most popular redemption center items and offering in-
store grocery departments without stamps.
The decline in stamp use is shown in the data on total volume and percentage of
supermarkets using them after 1965. (Table 10-1) By the mid 1970’s, coupons had
surpassed trading stamps as a promotional device for retailers.168 Even at their zenith,
however, the value of trading stamps was never more than a small part of retail sales. In
167 Lonto, supra note 157.
168 Anthony E. Gallo and William T. Boehm, “The Use of Trading Stamps in Food Stores,” Consumer Research, September 1978, p.35.
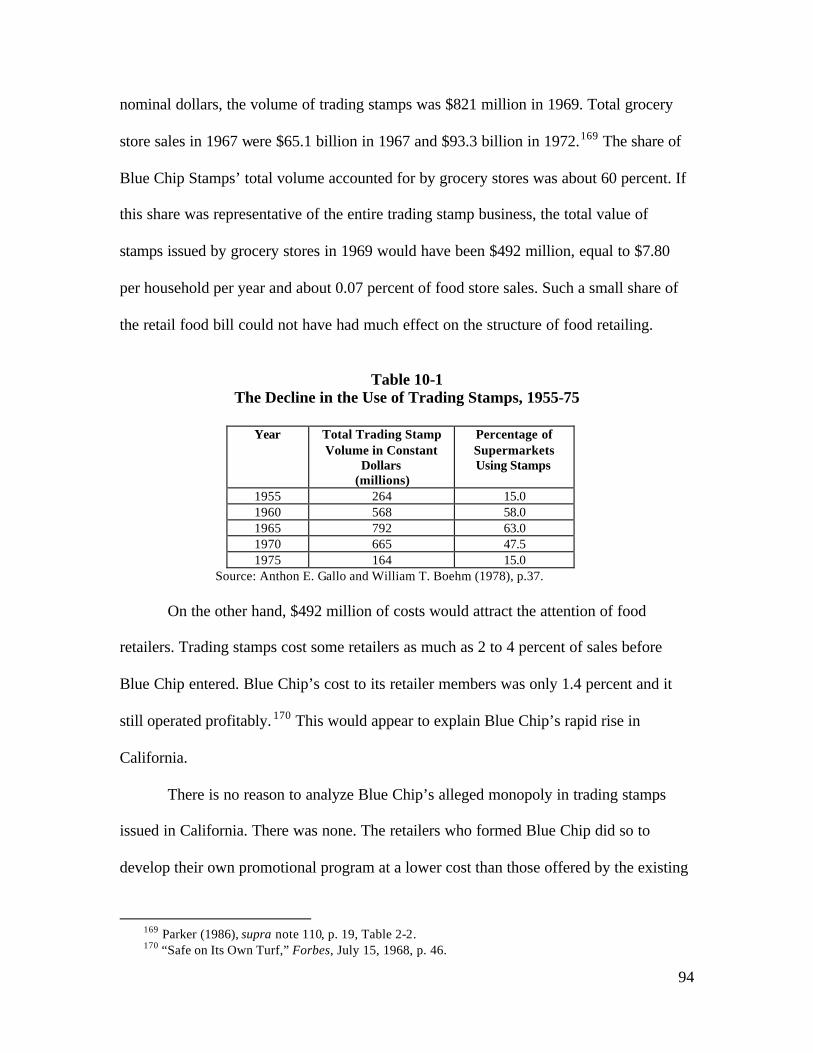
94
nominal dollars, the volume of trading stamps was $821 million in 1969. Total grocery
store sales in 1967 were $65.1 billion in 1967 and $93.3 billion in 1972.169 The share of
Blue Chip Stamps’ total volume accounted for by grocery stores was about 60 percent. If
this share was representative of the entire trading stamp business, the total value of
stamps issued by grocery stores in 1969 would have been $492 million, equal to $7.80
per household per year and about 0.07 percent of food store sales. Such a small share of
the retail food bill could not have had much effect on the structure of food retailing.
Table 10-1
The Decline in the Use of Trading Stamps, 1955-75
Year Total Trading Stamp Volume in Constant
Dollars (millions)
Percentage of Supermarkets Using Stamps
1955 264 15.0 1960 568 58.0 1965 792 63.0 1970 665 47.5 1975 164 15.0
Source: Anthon E. Gallo and William T. Boehm (1978), p.37. On the other hand, $492 million of costs would attract the attention of food
retailers. Trading stamps cost some retailers as much as 2 to 4 percent of sales before
Blue Chip entered. Blue Chip’s cost to its retailer members was only 1.4 percent and it
still operated profitably. 170 This would appear to explain Blue Chip’s rapid rise in
California.
There is no reason to analyze Blue Chip’s alleged monopoly in trading stamps
issued in California. There was none. The retailers who formed Blue Chip did so to
develop their own promotional program at a lower cost than those offered by the existing
169 Parker (1986), supra note 110, p. 19, Table 2-2. 170 “Safe on Its Own Turf,” Forbes, July 15, 1968, p. 46.
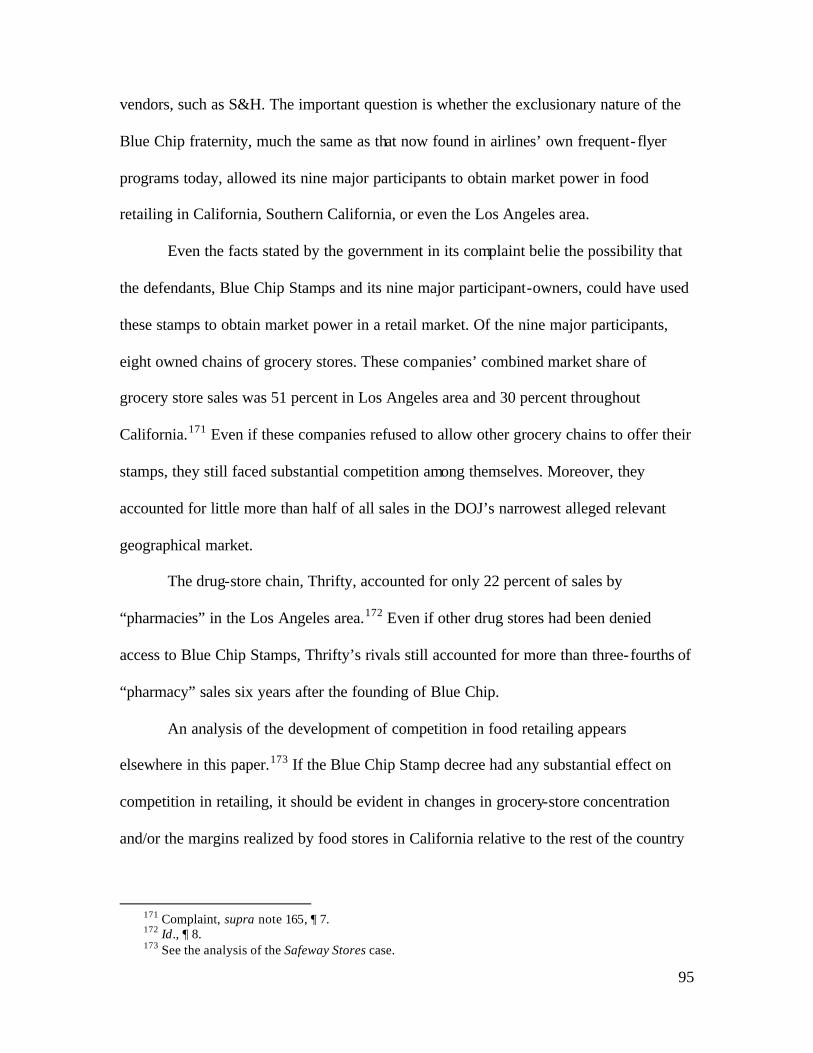
95
vendors, such as S&H. The important question is whether the exclusionary nature of the
Blue Chip fraternity, much the same as that now found in airlines’ own frequent- flyer
programs today, allowed its nine major participants to obtain market power in food
retailing in California, Southern California, or even the Los Angeles area.
Even the facts stated by the government in its complaint belie the possibility that
the defendants, Blue Chip Stamps and its nine major participant-owners, could have used
these stamps to obtain market power in a retail market. Of the nine major participants,
eight owned chains of grocery stores. These companies’ combined market share of
grocery store sales was 51 percent in Los Angeles area and 30 percent throughout
California.171 Even if these companies refused to allow other grocery chains to offer their
stamps, they still faced substantial competition among themselves. Moreover, they
accounted for little more than half of all sales in the DOJ’s narrowest alleged relevant
geographical market.
The drug-store chain, Thrifty, accounted for only 22 percent of sales by
“pharmacies” in the Los Angeles area.172 Even if other drug stores had been denied
access to Blue Chip Stamps, Thrifty’s rivals still accounted for more than three-fourths of
“pharmacy” sales six years after the founding of Blue Chip.
An analysis of the development of competition in food retailing appears
elsewhere in this paper.173 If the Blue Chip Stamp decree had any substantial effect on
competition in retailing, it should be evident in changes in grocery-store concentration
and/or the margins realized by food stores in California relative to the rest of the country
171 Complaint, supra note 165, ¶ 7. 172 Id., ¶ 8. 173 See the analysis of the Safeway Stores case.
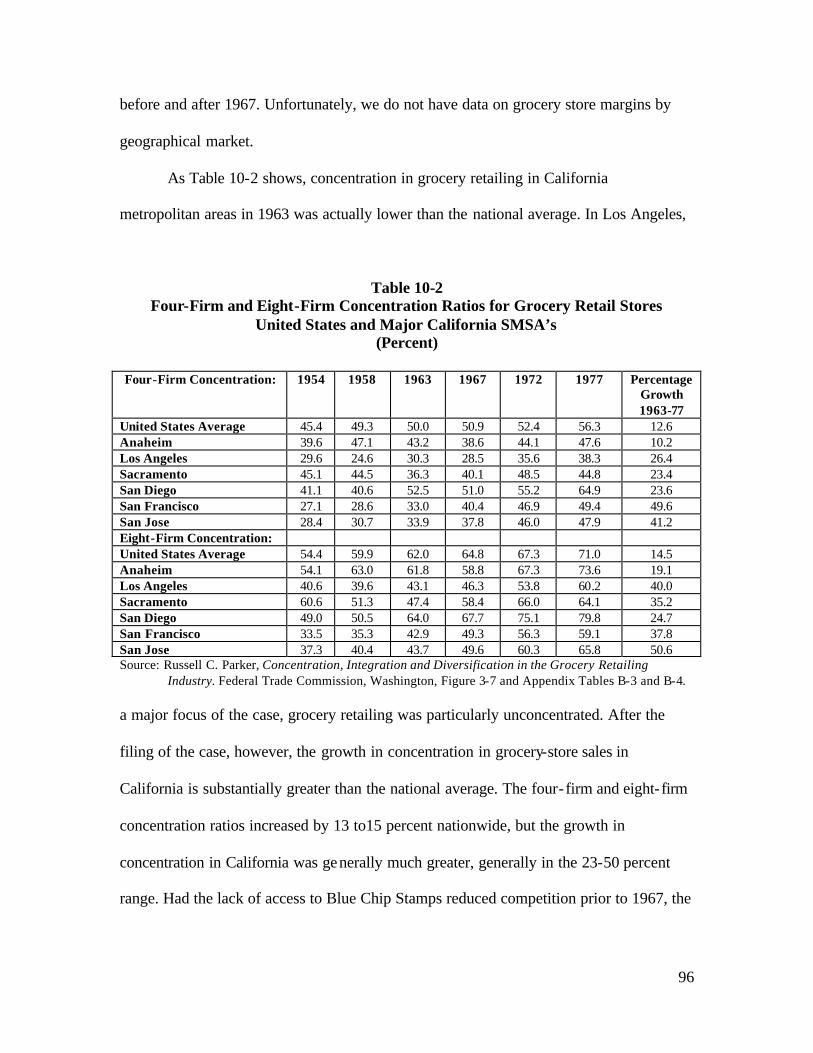
96
before and after 1967. Unfortunately, we do not have data on grocery store margins by
geographical market.
As Table 10-2 shows, concentration in grocery retailing in California
metropolitan areas in 1963 was actually lower than the national average. In Los Angeles,
Table 10-2 Four-Firm and Eight-Firm Concentration Ratios for Grocery Retail Stores
United States and Major California SMSA’s (Percent)
Four-Firm Concentration: 1954 1958 1963 1967 1972 1977 Percentage
Growth 1963-77
United States Average 45.4 49.3 50.0 50.9 52.4 56.3 12.6 Anaheim 39.6 47.1 43.2 38.6 44.1 47.6 10.2 Los Angeles 29.6 24.6 30.3 28.5 35.6 38.3 26.4 Sacramento 45.1 44.5 36.3 40.1 48.5 44.8 23.4 San Diego 41.1 40.6 52.5 51.0 55.2 64.9 23.6 San Francisco 27.1 28.6 33.0 40.4 46.9 49.4 49.6 San Jose 28.4 30.7 33.9 37.8 46.0 47.9 41.2 Eight-Firm Concentration: United States Average 54.4 59.9 62.0 64.8 67.3 71.0 14.5 Anaheim 54.1 63.0 61.8 58.8 67.3 73.6 19.1 Los Angeles 40.6 39.6 43.1 46.3 53.8 60.2 40.0 Sacramento 60.6 51.3 47.4 58.4 66.0 64.1 35.2 San Diego 49.0 50.5 64.0 67.7 75.1 79.8 24.7 San Francisco 33.5 35.3 42.9 49.3 56.3 59.1 37.8 San Jose 37.3 40.4 43.7 49.6 60.3 65.8 50.6 Source: Russell C. Parker, Concentration, Integration and Diversification in the Grocery Retailing Industry. Federal Trade Commission, Washington, Figure 3-7 and Appendix Tables B-3 and B-4.
a major focus of the case, grocery retailing was particularly unconcentrated. After the
filing of the case, however, the growth in concentration in grocery-store sales in
California is substantially greater than the national average. The four-firm and eight- firm
concentration ratios increased by 13 to15 percent nationwide, but the growth in
concentration in California was generally much greater, generally in the 23-50 percent
range. Had the lack of access to Blue Chip Stamps reduced competition prior to 1967, the

97
decree might have increased competition thereafter, as a consequence reducing the
growth in concentration after 1967. It clearly had no such effect.
e. Conclusion
The case against Blue Chip Stamps and its owners is among the last of the
antitrust suits brought in the 1940’s, 1950’s and 1960’s attempting to stem the tide
towards large grocery chains and increasing concentration and integration in grocery
retailing. Beginning with the A&P case and ending with Von’s Groceries, the government
pursued its strategy with very little support from economic analysis. The increase in
market concentration as the grocery business evo lved from a set of local individual stores
to competition among a number of large national chains has not proved to be a threat to
consumer welfare. In the case of Blue Chip Stamps, as with the earlier actions against
A&P, the government attacked a market arrangement that was established to reduce the
cost of distributing groceries. There is no evidence that eliminating the exclusivity of
Blue Chip Stamps improved consumer welfare. Indeed, once again, the government acted
just as the use of the product or service in question – in this case trading stamps – was
starting to slide into economic obscurity.
III. Concluding Observations
Conduct remedies in Sherman Act cases warrant careful consideration to ensure
that they do not replace competition with regulation. The principle put forward by the
Supreme Court’s squares with sound economic policy: making sure that competition
98
prevails is “the key to the whole question of antitrust remedy.”174 Competition,
presumably, is to be the guarantor of enhanced consumer welfare.
We have reviewed ten separate conduct remedies that have been imposed on firms
charged with monopolization and found little evidence that any of them contributed
favorably to consumer welfare. The reasons vary across the cases, but there are some
common themes.
• The DOJ complaint was based on a faulty understanding of the operation of the
relevant market forces. In Blue Chip Stamps and Safeway, for example, antitrust
authorities sought to ban competitive behavior by chain grocery stores. In
Standard Oil of California, the DOJ failed to grasp that requirements contracts
with franchised gasoline stations were an efficient mechanism to ensure effort by
the station owner and to prevent the station owner from raising retail prices.
• The DOJ failed to grasp that the limited size of the market made it impossible to
increase the number of rivals through any antitrust remedy, structural or conduct.
United Shoe Machinery produced a large share of the country’s shoe machines in
one plant. General Motors and Flxible could not operate their bus production
facilities at full capacity. Attempting to induce entry into these industries through
conduct remedies was not likely to succeed.
• The antitrust authorities brought the case after market conditions had changed. At
the time it was charged with monopolization, United Fruit was already
withdrawing from banana production because of problems in Central America and
declining U.S. banana prices. The 1952 case against IBM focused on tabulating
174 United States v. E.I. du Pont, 366 U.S. 316, 326 (1961).
99
machines and punch cards just as computers were beginning to replace the
electro-mechanical tabulation of such cards. Blue Chip was in a market (trading
stamps) moving to obscurity, not monopoly.
• In several cases, the conduct remedy may have impeded competition. In Safeway,
the use of promotional discounts to gain entry or expand market share was banned
as “predatory.” The 1956 AT&T consent decree barred AT&T from exploiting its
nascent comparative advantage in computer hardware and software, two
industries in which the government later brought monopolization cases against
other firms. The Jerrold decree largely prohibited Jerrold from expanding into
cable-system operation.
• In several other cases, such as Jerrold and Standard Oil of California, the DOJ
incorrectly challenged vertical integration as anticompetitive despite efficiency
reasons for such integration.
The overall conclusions from our review of these cases is that the antitrust
authorities (DOJ) often fail to understand the determinants of market structure, but are
nonetheless able to prevail in court or to induce defendants to sign a consent decree,
constraining their future conduct. Without a firm grasp of the economic forces that are
driving changes in market structure, the DOJ cannot be expected to design “relief” that
will result in increased competition, lower prices, and consumer benefits. In the best of
circumstances, the behavioral relief obtained is simply irrelevant and has no economic
consequence other than the cost of the litigation and any costs of compliance. In the 1956
AT&T (Western Electric) decree, the DOJ may have actually reduced consumer welfare
by blocking AT&T from entering related businesses. And in Safeway, DOJ attacked
100
Safeway’s aggressive pricing behavior that clearly would benefit consumers in the short
run and later admitted that such behavior was not necessarily a threat to long-run
competition.
Given the difficulty in perceiving the causes of market changes, the DOJ should
be reluctant to try to design complex remedies to remedy conduct that it does not fully
understand in markets where the trajectory of change is difficult to predict. To do so may
impede technological progress without providing any offsetting consumer benefits.
The bottom line is that we cannot discern positive results for conduct remedies in
the subsequent behavior of prices in any of these case studies. If antimonopoly policy
were consistently successful, surely the effects would sometimes be visible in the prices
consumers pay for the relevant products. These effects cannot be uncovered from the
data, at least in this sample of cases, even by the trained eye of the economist.
References
Adelman, Morris A., 1959. A&P: A Study in Price-Cost Behavior and Public Policy. Harvard.
American Petroleum Institute, 1959. Petroleum Facts and Figures.
Baldwin,William L., April 1969. The Feedback Effect of Conduct on Industry Structure. Journal of Law and Economics 12,137.
Barron, John and Umbeck, John, 1984. The Effects of Different Contractual Arrangements: The Case of Retail Gasoline Markets. Journal of Law and Economics 27, 313-28.
Berkey Photo v. Eastman Kodak Co, 457 F. Supp. 404 (S.D.N.Y. 1978).
101
Bork, Robert H., 1978. The Antitrust Paradox.
Brock, James William, 1981. Market Control in the Amateur Conventional Photography Industry. Ph.D. dissertation, Michigan State University, Department of Economics.
Bucheli, Marcelo, November 2001. United Fruit Company in Colombia: Labor Conflicts, Political Relations, and Local Elite (1899-1970). Ph.D. dissertation, Stanford University, Department of History.
Bucheli, Marcelo, 2001. United Fruit Company in Latin America: Institutional Uncertainties and Changes in its Operations, 1900-70, mimeo, Stanford University, Department of History.
Business Week, December 4, 1965. GM Bus Suit Settled.
Carlton, D. and Perloff, J., 2000. Modern Industrial Organization.
Carter v. AT&T, 365 F.2d 486 (5th Cir. 1966).
Crandall, Robert W., 1991. After the Breakup: U.S. Telecommunications in a More Competitive Era. Brookings.
Crandall, Robert W., Spring 2001. The Failure of Structural Remedies in Sherman Act Monopolization Cases. Oregon Law Review 80 (1), 109-98.
Crandall, R. and Waverman, L., 2000. Who Pays for Universal Service? When Telephone Subsidies Become Transparent. Brookings.
Ellis, Frank T., 1981. The Banana Export Activity in Central America 1947-1976: A
Case Study of Plantation Exports by Vertically Integrated Transnational Corporations, Ph.D. dissertation, University of Sussex, Department of Economics, p. 76.
Elzinga, Kenneth G., April 1969. The Antimerger Law: Pyrrhic Victories. Journal of Law and Economics 43, 43-78.
Elzinga, K. and Breit, W. 1976. The Antitrust Penalties: A Study in Law and Economics. Yale University Press.
Federal Trade Commission, 1966. Economic Report on the Structure and Competitive Behavior of Food Retailing.
102
Federal Trade Commission,1999. Bureau of Competition, A Study of the Commission’s Divestiture Process.
Ferguson, Charles H., 1999. High St@kes, No Prisoners: A Winner’s Tale of the Greed and Glory in the Internet Wars. Random House.
Fisher, F., McGowan, J. and Greenwood, J., 1983. Folded, Spindled, and Mutilated: Economic Analysis and U.S. v. IBM. MIT Press.
Forbes, July 15, 1968. Safe on Its Own Turf. p. 46.
Gallo, A. and Boehm, W., September 1978. The Use of Trading Stamps in Food Stores. Consumer Research.
Grinnell, Gerald. January 1978. Trends in Grocery Retailing. National Food Review.
Hogarty, Thomas F., October 1, 1981. The Origin and Evolution of Gasoline Marketing Research Study # 022. American Petroleum Institute.
International Directory of Company Histories, 1999. Safeway, Inc. St. James Press, p. 417.
Kadiyali, Vrinda, 1998. Eastman Kodak in the Photographic Film Industry: Picture Imperfect? in Market Dominance: How Firms Gain, Hold, or Lose It and the Impact on Economic Performance, David I. Rosembaum, ed.
Kaysen, Carl, 1956. United States v. United Shoe Machinery Corporation. Harvard University Press.
Kepner, C. and Soothill, J., 1935. The Banana Empire: A Case Study in Economic Imperialism. New York, The Vanguard Press.
Lonto, Jeff R. The Trading Stamp Story, posted at http://www.berkshireblues.com/stamps.htm.
Masten, S. and Snyder, E. 1993. United States versus United Shoe Machinery Corporation: On the Merits. Journal of Law and Economics 36.
May, S. and Plaza, G., 1958. The United Fruit Company in Latin America. National Planning Association.
McCann, Thomas P., 1976. An American Company. Crown Publishers.
103
McLean, J. and Haigh, R., 1954. The Growth Of Integrated Oil Companies. The Plimpton Press.
Miller, Richard A. 1962. Exclusive Dealing in the Petroleum Industry: The Refiner-Lessee Relationship. Ph.D. dissertation, Yale University, Department of Economics.
Neal, Larry, Feb. 25, 1974. AMC’s Got the Right Thing at the Right Time – Again. Iron Age, p. 24.
North Carolina Utilities Commission v. FCC, 552 F. 2d 1036 (1977), cert denied, 434 U.S.874 (1977).
Ohio Museum of Transportation, Oct. 31, 2001. AM General, available at http://otot.org/roster/buses/amg.html.
Parker, Russell. March 1986. Concentration, Integration, and Diversification in the Grocery Retailing Industry. Federal Trade Commission, Washington D.C.
Parrish, Gordon, 1973. The Experience With Antitrust Relief In Shoe Machinery. Ph.D. dissertation, Washington State University, Department of Economics.
Peters, Geoffrey M., 1985.Is the Third Time a Charm? A Comparison of the Government’s Major Antitrust Settlements with AT&T This Century. Seton Hall Law Review 15.
Pitofsky, Robert, February 17, 2000. The Nature and Limits of Restructuring in Merger Review. accessible at www.ftc.gov/speeches/pitofsky/restruct.htm
Printers’ Ink, February 5, 1960. Blue Chip bucks S&H in Los Angeles stamp clash.
Shepard, Andrea, Spring 1993.Contractual form, retail price, and asset characteristics in gasoline retailing, Rand Journal of Economics 24 (1), pp. 58-77.
Spengler, Joseph, 1950. Vertical Integration and Antitrust Policy. Journal of Political Economy 58, 347-52.
St. Petersburg Times, Mar. 20, 2000. S&H Green Stamps Try For a New Life on the Internet. p. 2.
Taylor, Archer S., 2000. History Between Their Ears: Recollections of Pioneer CATV Engineers. Denver: The Cable Center.
104
United States v. Blue Chip Stamp Company, Complaint, Civil Action No. 63-1552S (S.D. Cal. 1963).
United States v. Blue Chip Stamp Co., 272 F.Supp. 432, 440 (C.D. Cal.), aff’d sub. nom Thrifty Shoppers Scrip Co. v. U.S., 389 U.S. 580 (1968)
United States v. E.I. du Pont, 366 U.S. 316 (1961).
United States v. Eastman Kodak Co., Complaint, W.D.N.Y. (1954).
United States v. Eastman Kodak Co., Consent Decree, C.C.H Trade Cases ¶ 67,920 (1954).
United States v. Eastman Kodak Co., Consent Decree Compliance Hearing, C.C.H Trade Cases ¶ 70,100 (1961).
United States v. General Motors Corporation, Complaint, Civil Action No. 15816 (D.Mich. 1956).
United States v. General Motors Corporation, Consent Decree, C.C.H Trade Cases ¶71,624 (1965).
United States v. Jerrold Electronics Corp., Consent Decree, 187 F. Supp. 545 (E.D. Pa 1960).
United States v. Jerrold Electronics Corp., Complaint, Civil Action No. 22080 (E.D. Pa., Feb. 15, 1957).
United States v. Safeway Stores, Inc., Complaint, Civil Action No. 3173, (N.D. Tex. Nov. 1, 1955).
United States v. Safeway Stores, Inc., Consent Decree, Civil Action No. 3173, (N.D. Tex. Dec. 7, 1957).
United States v. Safeway Stores, Inc., Memorandum of the United States in Response to Motion of Safeway Stores, Inc., to Terminate the Final Judgment, Civil Action No. 3173 (N.D. Tex. May 1983).
United States v. Standard Oil Co. of California, Complaint, Civil Action No. 6159-B (D. So. Cal., 1947).
United States v. Standard Oil Co. of California, 78 F. Supp. 850 (1948).
105
United States v. Standard Oil, 337 U.S. 293 (1949).
United States of America v United Fruit Company, Complaint, Civil Action No. 4560 (E.D. La., July 2, 1954).
United States of America v United Fruit Company, Amended Complaint, Civil Action No. 4560 (E.D. La., Jan 12, 1956).
United States v. United Fruit Company, Final Judgment, Civil Action No. 4560 (E.D. La., Feb. 4, 1958).
United States v. United Shoe Machinery, 110 F. Supp. 295 (1953).
United States v. United Shoe Machinery, 347 U.S. 521 (1954).
United States v. United Shoe Machinery, 266 F. Supp. 328 (D. Mass. 1967).
United States v. United Shoe Machinery, 391 U.S. 244 (1969).
United States v. Von’s Grocery Co., 384 U.S. 270 (1966).
United States v. Western Electric Co., Complaint, Civil Action No. 17-49 (D.N.J. Jan. 14, 1949).
United States v. Western Electric Co., Final Judgment, Civil Action No. 17-49, (D.N.J., Jan. 24, 1956).
Vita, Michael J., August 1999. Regulatory Restrictions on Vertical Integration and Control: The Competitive Impact of Gasoline Divorcement Policies. Federal Trade Commission, Bureau of Economics, Working Paper No. 227.
Waldman, Don E. 1978. Antitrust Action and Market Structure. Lexington Books.
Waldman, Don E. 1986. The Economics of Antitrust: Cases and Analysis. Little, Brown and Company.
Wall Street Journal, July 22, 1966. Blue Chip Stamp, Agency Agree on Splitting Firm Into 2 Companies in 1969. p. 22, col. 2.
Weiers, B. and Rosetti, M., March 1982. Transit Bus Manufacturer Profiles, United States Department of Transportation, U. S. Department of Transportation, Urban Mass Transit Authority.
106
Weiers, B. and Rossetti, M., July 1982. Entry and Competition in the United States Transit Bus Manufacturing Industry, United States Department of Transportation, Urban Mass Transit Authority.


![Complaint For Injunctive Relief [ 1 ]](https://img.pdfslide.us/doc/110x75/5532fb744a79593c508b47df/complaint-for-injunctive-relief-1-.jpg)