Embed Size (px)
Citation preview

Injection of magnetic helicity and chirality change in sunspot pen
umbral filaments
Jiangtao Su
National Astronomical Observatories of China
Helicity Thinkshop on Solar Physics 12-17 October Beijing

Outline• Introduction: magnetic helicity injection (MHI) an
d solar activities;
• A initial study of relationships between MHI and major flares;
• MHI and chirality change of penumbral filaments in the magnetic polarity inversion line (PIL) region.

Introduction
• Magnetic helicity is a measure of twists, kinks, and interlinkages of magnetic field lines (Berger & Field 1984); It is almost preserved on a timescale less than the global diffusion time scale;
• Because of this conservation property, it has been suggested that Coronal Mass Ejections (CMEs) are needed to avoid the endless helicity accumulation in the corona (Rust 1994, 2001;Low 1996; Kusano et al. 2004; Zhang and Low 2005);
• Zhang et al. (2006) conjectured there is an upper bound on the total magnetic helicity that a force-free field can contain. Thus, the accumulation of magnetic helicity in excess of this upper bound would initiate a CME;

• Recent theoretical work by Amari et al. (2003) suggests that a large enough helicity is a necessary but not sufficient condition for an ejection to occur, and this is supported by the observational work of Nindos & Andrews (2004);
• Whether or not that the corona helicity accumulation is important to the origin and initiation of CMEs is still hotly in debate (Spicer et al. 2003; Rust 2003; Rust & LaBonte 2005;Phillips et al. 2005);
• Therefore, knowledge of the magnetic helicity budgets in the solar active regions is essential for clarifying this issue (Green et al. 2002; Démoulin et al. 2002; Nindos et al. 2003; Mandrini et al. 2004; Georgoulis and LaBonte 2007);
• Untill now, the fundamental cause of solar flares is unkown, but Andrews (2003) has shown that virtually all X-class flares produce a coronal mass ejection (CME);
• Recently, LaBonte et al. (2007) found a necessary condition for the occurrence of an X-flare is that the peak helicity flux has a magnitude > 6×1036 Mx2 s-1, which should be an important flare index used for big flare prediction;

• Moon et al. (2002a,b) believed that the sharp helicity change occurring over short timescales (half hour) can be a significant factor in triggering flares;
• Zhang et al. (2008) also found a sharp variation of the transport rate of magnetic helicity in AR 10930 during a X3.4 flare;
• Kusano et al. (2003) proposed annihilation of magnetic helicity as a triggering mechanism for solar flares. If the helicity is sharply reversed within a magnetic arcade, reconnection quickly grows in the helicity inversion layer, driving explosive dynamics;
• Yokoyama et al. (2003) studied flare activities in AR 8100 and found that most of the flare events occurred about half a day after the helicity injection rate changed its sign;

• However, Sakurai & Hagino (2003) studied two X-class flares ARs and found the total magnetic helicity evolved slowly and did not show abrupt changes at the time of the flares;
• People have found during the flares, the profile of the spectral line being used for the magnetic measurements is distorted and the pulsive helicity changes were spurious (Qiu & Gary2003; Hartkorn & Wang 2004, e.g.);
• Park et al. (2008) investigated the variation of magnetic helicity around the times of 11 X-class flares. They found each of these major flares was preceded by a significant helicity accumulation and the helicity accumulates at a nearly constant rate then becomes nearly constant before the flares.
• In this work, we revisit the relationships between rate of MHI and major x-class flares. With the Hinode data, we find a close relationship between MHI and chirality change in sunspot penumbral filaments.

• Data: MDI/SOHO 96 minute longitudinal magnetograms;
• Method: Local Correlation Tracking (LCT, Chae et al. 2001) used to calculate dHm/dt.
ID Flares AR number Peak Time (UT)
1 X5.7 on 2000 July 14 9077 10:24
2 X1.3 on 2001 Oct 25 9672 15:02
3 X18 on 2003 Oct 28 10486 11:10
4 X4.1 on 2005 Jan 17 10720 09:52
5 X3.4 on 2006 Oct 13 10930 02:40
dHm/dt and major x-class flares
List of the major flares

A X5.7 occurred on 2000 July 14
NOAA 9077Before and after the x5.7 flare, the MHI rate evolves in a direction to decrease the magnitde of the previous MHI rate.
The helicity accumulates at a nearly constant rate (Park 2008), then becomes nearly constant after the flares. For this kind of constant rate, Magara & Tsuneta (2007) thought it is a saturation of helilcity transport.
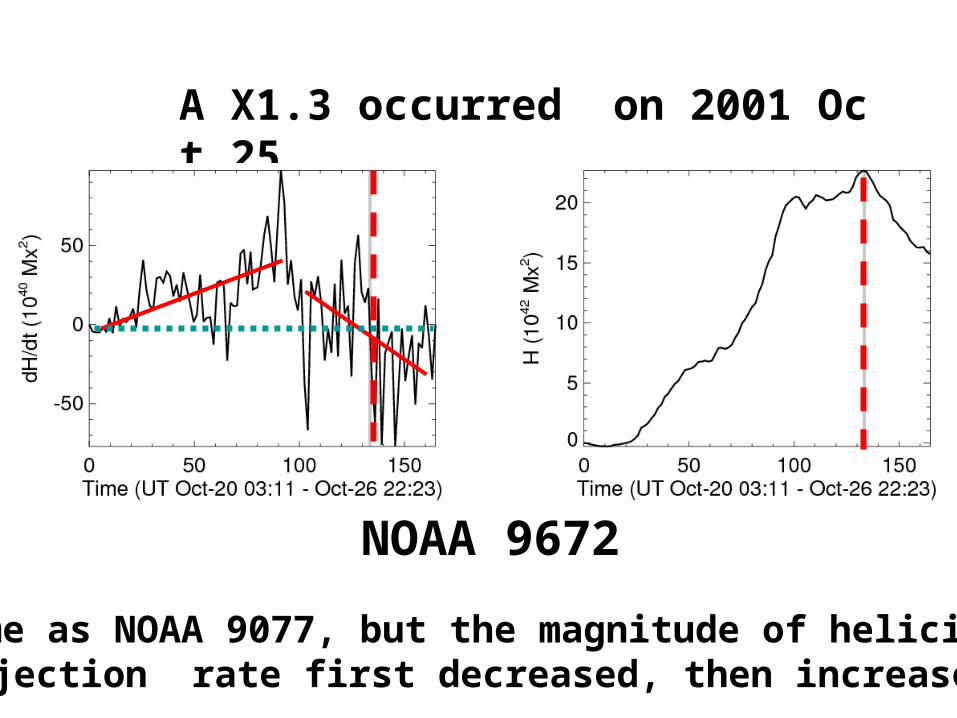
A X1.3 occurred on 2001 Oct 25
NOAA 9672
Same as NOAA 9077, but the magnitude of helicity injection rate first decreased, then increased.

X18 on 2003 Oct 28
After the X18 flare, the helicity injection rate evolves in a direction to decrease the
magnitde of the previous MHI rate
NOAA 10486

X4.1 on 2005 Jan 17
After the flare, the MHI rate changed its sign. It is similar to the active region of NOAA 8100 (Yokoyama et al. 2003).
NOAA 10720
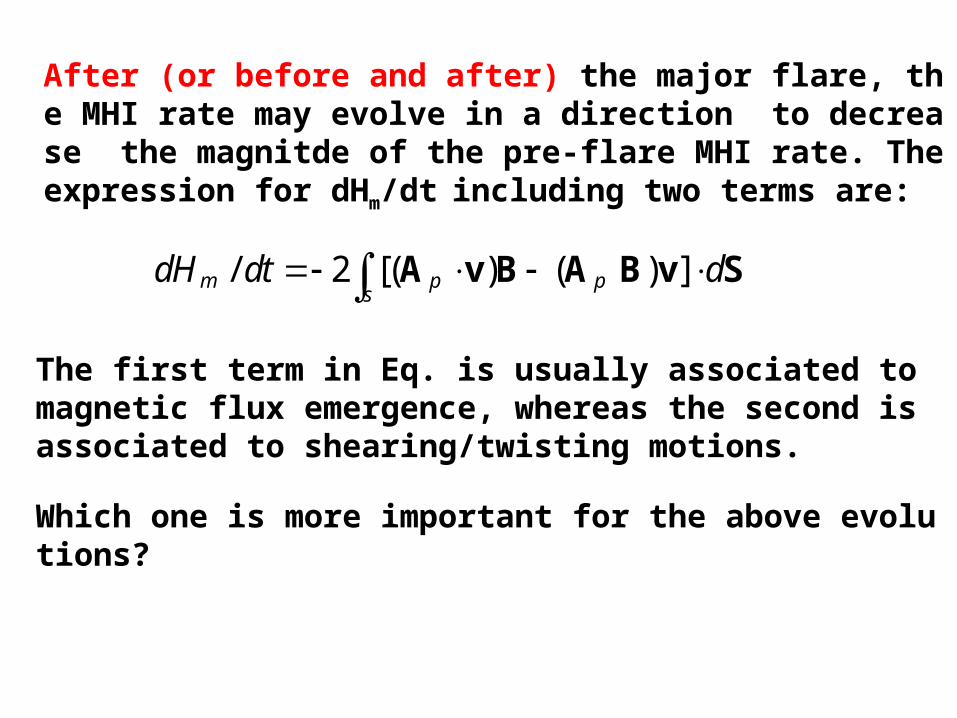
The first term in Eq. is usually associated to magnetic flux emergence, whereas the second is associated to shearing/twisting motions.
Which one is more important for the above evolutions?
/ 2 [( ) ( ) ]m p ps
dH dt d A v B A B v S
After (or before and after) the major flare, the MHI rate may evolve in a direction to decrease the magnitde of the pre-flare MHI rate. The expression for dHm/dt including two terms are:

NO
AA
109
30
For NOAA 10930, three regions are selected to calculate dHm/dt:
(1) Frame1: large negative sunspot;(2) Frame2: two sunspots;(3) Frame3: small positive sunspot.
Frames 1 and 3 exclude the magnetic PIL region;

dhm/dt in PIL region should be nearly equal to the one in Frame2 extracting those in Frames 1 and 3.
PIL region
= Frame2 - Frame1+Frame3
After the flare, the MHI rate in Frames 1 and 3 did not change much, while that in Frame2 evolves in a direction to decrease the magnitde of the previous MHI rate and at last change its sign, which was mainly caused by the change of MHI rate in PIL region.

Using the formula for the MHI rate Magra & Tsuneta (2007) and have obtained the similar results.
2/ /m sdH dt v L ,
Magra & Tsuneta (2007)

MHI and chirality change in sunspot penumbral filaments in NOAA 10930
Averged αz in largepositive sunspot
Averaged αz in small negative sunspot
Su et al. (2009)
X3.
4 fl
are
The penumbral filaments changing their chirality occurred in the rising stage of averged αz (MHI).

Chirality change in the filaments of the PIL region in NOAA 10930
Chirality changed from right- to left-handedness

Right-handed filaments
Left-handed filaments

Splitting of a right-handed filament
Birth of a left-handed Filament
Dec-10
Dec-11
Expanding
Shrinking

Filament screw pinch varying
At Cut4 pinch increasing:
396 , 475, and 1030 km;
At Cut5 pinch decreasing:
2580, 1988, and 806 km.
4 5

z mapsLocal twist

Total positive helicity decreased while total negative helicity increased.

3

Counter-clockwise rotation of the positive sunspot could inject negative helicity to the corona, which may dir
ectly lead to the filament change their chirality.
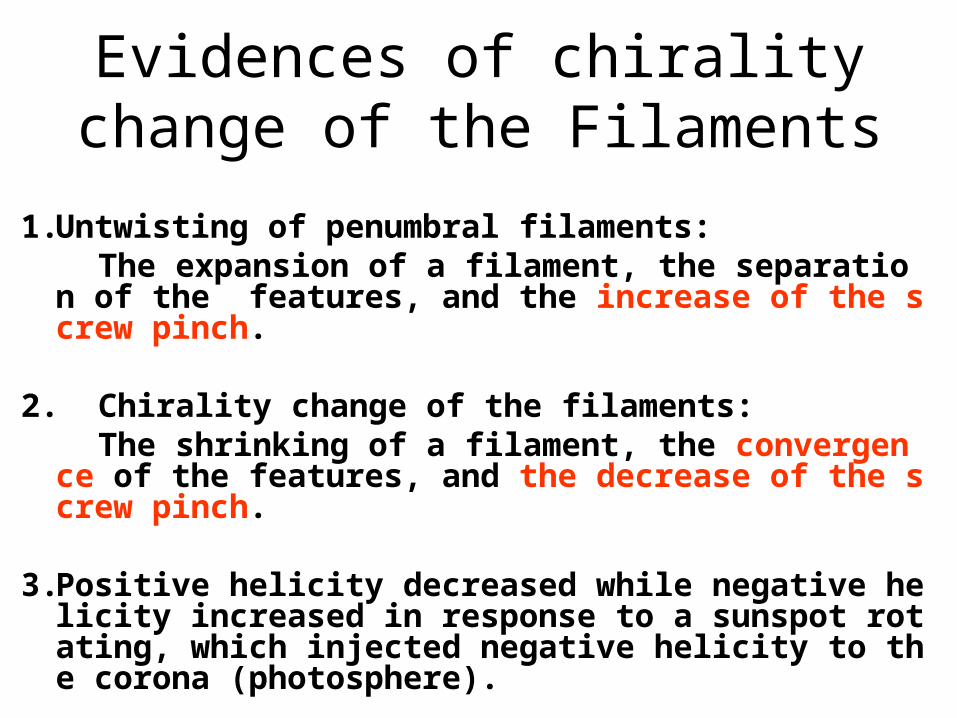
Evidences of chirality change of the Filaments
1. Untwisting of penumbral filaments: The expansion of a filament, the separation of the feat
ures, and the increase of the screw pinch.
2. Chirality change of the filaments: The shrinking of a filament, the convergence of the fea
tures, and the decrease of the screw pinch.
3. Positive helicity decreased while negative helicity increased in response to a sunspot rotating, which injected negative helicity to the corona (photosphere).

Thanks for
your attention!