Embed Size (px)
Citation preview
Injectable Polymer for in vivo Oxygen Sensing
by
Syed M. Imaad
B.S., Electrical EngineeringUniversity of Illinois at Urbana-Champaign, 2010
Submitted to the Department of Electrical Engineering and Computer Science in PartialFulfillment of the Requirements for the Degree of
Masters of Science in Electrical Engineering and Computer Science
at the
MASSACHUSETTS INSTITUTE OF TECHNOLOGY
February 2013
C Massachusetts Institute of Technology 2012. All rights reserved.
APNRES
APR
Signature of Author ......................... . .................Department ofE 'ecurical Engineering and Computer Science
December 28, 2012
C ertified by ...................... ... . .........................Michael J. Cima
David H. Koch Professor of EngineeringThesis Supervisor
A ccepted by ..................................... Les ..ski................
Professor of Electrical Engineering and Computer ScienceChair, EECS Committee on Graduate Students

2

Injectable Polymer for in vivo Oxygen Sensing
by
Syed M. Imaad
Submitted to the Department of Electrical Engineering and Computer Science onDecember 28, 2012 in Partial Fulfillment of the
Requirements for the Degree of Masters of Science inElectrical Engineering and Computer Science
ABSTRACT
This thesis documents the synthesis and characterization of an elastomeric polymer that isoxygen sensitive and can be interrogated using Magnetic Resonance Imaging (MRI) or MagneticResonance (MR) technology to report the oxygen tension in vivo at the site of implant. Thepolymer was tested for its sensitivity in response to oxygen, and the specificity of response tooxygen was verified. Oxygen diffusivity for this class of polymers was measured and correlatedwith the response sensitivity to oxygen to provide a possible explanation for the difference inresponse sensitivities within this class of polymers. Animal experiments were carried out in ratsto test the performance of these sensors in vivo where device response to varying levels ofinspired oxygen was monitored.
Thesis Supervisor: Michael J. CimaTitle: David H. Koch Professor of Engineering
3

4

Acknowledgments
I would like to thank my advisor, Professor Michael J. Cima, for providing me with theopportunity to work on a project that could have immense impact on clinical practice and inimproving human life in the years to come. His guidance and valuable input over the course ofmy research has made it a worthwhile experience.
I would also like to thank the entire Cima Lab for being eagerly helpful and creating a great workenvironment. Special thanks to Vincent Liu and Christophorous Vassiliou for their help inresearch.
In the end I would like to thank my family, especially my parents Ambreen & Syed Tariq, forbeing a constant source of support and always providing me with the freedom to pursue myinterests. They have had a large and perhaps most important role in the development of theindividual I am today.
The work presented herein was made possible due to funding support of the National CancerInstitute's Center of Cancer Nanotechnology Excellence (5 U54 CA151884-03).
5

6

Table of Contents
Chapter 1: Introduction .......................................................................................................... 91.1 Im portance of in vivo oxygen measurem ents............................................................. 91.2 Thesis outline ............................................................................................................... 12
Chapter 2: Literature Review .................................................................................................. 132.1 Clinical gold standards............................................................................................. 132.2 Other methods to measure oxygen in vivo reported in literature ............................. 17
Chapter 3: M agnetic R esonance (M R) Theory.................................................................... 203.1 N uclear spins and the m ain field B0...................................... . . . . . . . . . . . . . . . . . . . . . . . . . . . . . . . . . . 203.2 M R excitation using an RF field B1 ...................................... . . . . . .. . . . . . . . . . . . . . . . . . . . . . . . . . . . 223.3 M R relaxation .............................................................................................................. 233.4 Basic pulse sequences for T, measurem ent ............................................................. 25
Chapter 4: Synthesis and in vitro Characterization.............................................................. 284.1 DDM PS as the oxygen sensing com ponent ............................................................. 284.2 Synthesis of a solid elastom er for use as an oxygen sensor..................................... 304.3 Response of the solid elastom er to oxygen............................................................. 334.4 Specificity of response to oxygen........................................................................... 35
Chapter 5: O xygen Diffusivity M easurem ents...................................................................... 375.1 Protocol for oxygen diffusivity m easurem ents........................................................ 385.2 Results..........................................................................................................................41
Chapter 6: In vivo Performance of the Injectable Polymer .................................................. 496.1 Calibration curve for 7 T M RI................................................................................. 496.2 In vivo response to changes in inspired oxygen....................................................... 51
Chapter 7: Conclusion and Future W ork............................................................................. 547.1 Conclusion ................................................................................................................... 547.2 Recom m endation for future studies ........................................................................ 55
References.....................................................................................................................................57
7

8

Chapter 1: Introduction
1.1 Importance of in vivo oxygen measurements
Oxygen is an important molecule for a number of pathological and therapeutic processes. The
delivery of oxygen to tissues is important in maintaining tissue function and survival [1]. The
restriction in blood supply (hence oxygen) to tissue, more commonly known as ischemia, is
known to be an underlying factor in pathologic conditions like cardiac dysfunction and wound
healing [2].
Compartment Syndrome is yet another serious condition which can occur after ischemia
followed by reperfusion in, for example, the limb. Compartment Syndrome is defined as a
condition in which high pressure within a space reduces perfusion and tissue viability [3]. The
anterior and deep posterior compartments of the leg are those most commonly affected [4].
Figure 1.1 shows a diagram of the four compartments of the leg and their positions, including the
anterior and deep posterior compartments. Common causes, of compartment syndrome include
fractures, crush injuries and gunshot wounds [5]. Acute compartment syndrome can lead to
amputation or even death if not treated early [6]. This is why it is of utmost importance to detect
compartment syndrome at an early stage so it can be treated immediately, avoiding amputation
or fatality. Compartment syndrome can be evaluated by measuring the intramuscular oxygen
tension since compartment syndrome results in a decrease in microcirculation in the muscle
tissue [7]. Measuring the oxygen tension becomes an attractive option for the early diagnosis of
compartment syndrome where there is ischemic risk despite normal compartment pressures.
9

Anterior compartment
Lateral Compartment
Deep Posterior Compartment
Superficial Posterior Compartment
Figure 1.1 The four compartments of the leg (obtained from www.docpods.com/posterior-
compartment-syndrome).
Measurement of the oxygen concentration is also significant in cancer therapy where the amount
of dissolved oxygen in tumor microenvironments directly affects radiation treatment outcome.
Hypoxia in solid tumors results from an imbalance between oxygen supply and consumption [8].
Tumor hypoxia, or depravation of dissolved oxygen in the vicinity of the tumor, is associated
with a decreased radiosensitivity, i.e., greater radiation dose is required to treat hypoxic tumors
and vice versa [9]. Figure 1.2 shows this correlation in a plot of biochemical non-evidence (or no
evidence), or bNED, of disease against the prescription dose of 1251 brachytherapy as reported by
Wang et al [10]. The monitoring of dissolved oxygen can therefore help clinicians in determining
the appropriate radiation dosage that should be administered to a tumor patient. Vaupel et al.
have demonstrated that measurements of oxygen tension using Clark microelectrodes help in
determining the response of tumors to radiation therapy [11].
10

100
80
L 60 *'
40 ,
20
0 J
60 80 100 120 140 160 180 200
Prescription Dose of 1251 Brachytherapy (Gy)
Figure 1.2 The 2-year bNED versus prescription dose of 1251 brachytherapy. Each line
represents a different type of tumor: solid is hypoxic, dashed is non-hypoxic and dotted is
aerated.
Some of the existing methods for determining oxygen concentration in tissues (explored in detail
in Chapter 2) have their own limitations with respect to the inability of repeated measurements,
the invasiveness of the procedure, and/or the inability to leverage existing standard clinical
instrumentation and protocols. This thesis presents the development of a polymer material that
can be formulated into an injectable device for oxygen sensing and overcomes the
aforementioned limitations. The oxygen sensors that have been developed are biocompatible and
synthesized using a similar class of materials used in breast implants. After the initial implant
using a standard biopsy or injection needle, repeated and localized measurements can be made in
a non-invasive manner. Such measurements are made possible by leveraging Magnetic
Resonance Imaging (MRI) using standard pulse sequences. The fact that sensor readout is
performed using a standard clinical imaging modality and protocol should reduce, if not
eliminate, barriers to clinical translation of this diagnostic technology.
11

1.2 Thesis outline
Chapter 1 briefly described the importance of in vivo oxygen measurements, providing a
precursor to Chapter 2 that presents a detailed review of existing technologies for such
measurements. This review includes the existing clinical gold standards for in vivo oxygen
sensing for conditions like compartment syndrome and tumor radiotherapy as well as
technologies developed and reported in literature by other research groups. Chapter 3 explains
some pertinent theoretical concepts related to Magnetic Resonance (MR) and how they apply to
the measurement of oxygen concentration in conjunction with our implanted oxygen sensors. It
presents important pulse sequences like Inversion Recovery (IR) and Saturation Recovery (SR)
that have been used in the experiments performed, and includes pulse diagrams, relevant
equations and essential parameters that are used in quantifying oxygen concentration. Chapter 4
describes the synthesis and response characteristics of the oxygen sensitive material, followed by
Chapter 5 which presents oxygen diffusivity measurements and their correlation to the response
sensitivity of the material to oxygen. Chapter 6 includes results of in vivo experiments obtained
from pilot inspired gas animal studies. The thesis concludes with Chapter 7 by summarizing the
reported work and a recommendation for future studies.
12

Chapter 2: Literature Review
Many different approaches for quantifying in vivo oxygen tension have been reported in
literature. These various methods differ based on their invasiveness, repeatability, localization of
measurement, and the principle of detection. This chapter reviews these approaches and is
divided into two sections. Section 2.1 provides an overview of the existing clinical gold
standards for (i) in vivo oxygen tension measurements in radiotherapy dose administration for
tumor hypoxia; and (ii) compartment syndrome diagnosis. Section 2.2 discusses the development
of in vivo oxygen sensors developed by other research groups based on principles such as
fluorescence quenching, phosphorescence quenching, Electron Paramagnetic Resonance (EPR),
contrast-enhanced Magnetic Resonance Imaging (MRI), Near-Infrared (NIR) spectrometry, and
biopsy based methods. Advantages and potential limitations of these various approaches will be
highlighted in order to better understand the need and importance of the work presented in this
thesis.
2.1 Clinical gold standards
(i) Tumor Hypoxia
The optimal dosage required for radiotherapy depends on the extent of tumor oxygenation, as
discussed in Chapter 1 earlier. The Eppendorf polarographic oxygen electrode based on the Clark
electrode is the clinical gold standard for measuring tumor oxygenation [12]. It is essentially a
needle electrode which comprises of a gold cathode (approximately 12 tm in diameter) that is
insulated using a layer of glass and a silver-silver chloride anode that is attached to the surface of
the skin. The tip of the gold cathode is covered by a Teflon membrane which is oxygen
permeable and prevents biofouling. The oxygen tension is proportional to the concentration of
oxygen which can be measured based on the oxidation-reduction reactions taking place at the
two electrodes. Figure 2.1 shows an Eppendorf polarographic electrode as used for determining
the tumor oxygenation in the neck of a patient with hypopharyngeal cancer [13].
13

Figure 2.1 Use of polarographic electrode with mechanic arm in a cancer patient.
Vaupel et al. have studied the oxygenation of human tumors using computerized oxygen tension
measurements based on the Eppendorf polarographic electrode. They obtained direct oxygen
partial pressure measurements in breast cancers and normal breast tissues. Oxygen partial
pressure values in normal breast were consistent with oxygenation status of normal tissues and
were significantly higher compared to those in breast cancers that were hypoxic [14]. Movsas et
al. have performed a similar study in which they have used the Eppendorf oxygen microelectrode
to characterize the severity of hypoxia in human prostate carcinoma. They compared
measurements from a pathologically involved region of prostate to normal muscle and found that
oxygen measurements from the cancerous prostate were significantly lower than those from
normal muscle [15]. Gatenby et al. have used the same Eppendorf oxygen electrode to study the
effect of radiation therapy on the oxygen distribution in squamous cell carcinomas of the head
and neck. A needle electrode was passed through each tumor under computed tomography (CT)
guidance. They reported increases in tumor oxygen tension for patients that responded
completely to radiotherapy and deduced that oxygen plays a significant role in human tumor
response to radiotherapy [16].
(ii) Compartment Syndrome
The Five P's constitute the classic signs and symptoms of compartment syndrome and are as
follows [17]:
14

1) Pain: Pain in one of the major compartments attributed to compartment syndrome is one
of the most common signs of compartment syndrome and is intensified with movement
or application of pressure.
2) Paresthesia: This is the feeling of a tingling sensation or numbness. There is a loss of
sensation below the compartment syndrome affected area.
3) Passive stretch: Muscles in the affected compartment experience immense pain upon
stretching.
4) Pressure: There is appreciable rigidity in the affected compartment.
5) Pulselessness: Local microvasculature is affected due to compartment syndrome which
results in loss of pulse.
These five signs however manifest themselves during an established compartment syndrome by
which stage it may be too late to perform successful fasciotomy (the preferred surgical technique
to treat compartment syndrome where the fascia is cut open to reduce intracompartmental
pressure). This is why a compartment pressure measurement is used to confirm the initial
diagnosis using the 5 P's and patient history, providing a more objective diagnosis [18]. The two
most commonly used techniques for tissue pressure measurements in compartment syndrome are
the Whitesides infusion technique and the Stryker device [19]. The Whitesides infusion
technique consists of a mercury manometer, two plastic intravenous extension tubes, two 18
gauge needles, a 20 mL syringe attached to a 3-way stopcock, and a bottle of saline. The Stryker
device is based on the same principle as the Whitesides infusion technique but compared to the
latter it is more compact, portable, and allows measurements to be read directly from the display
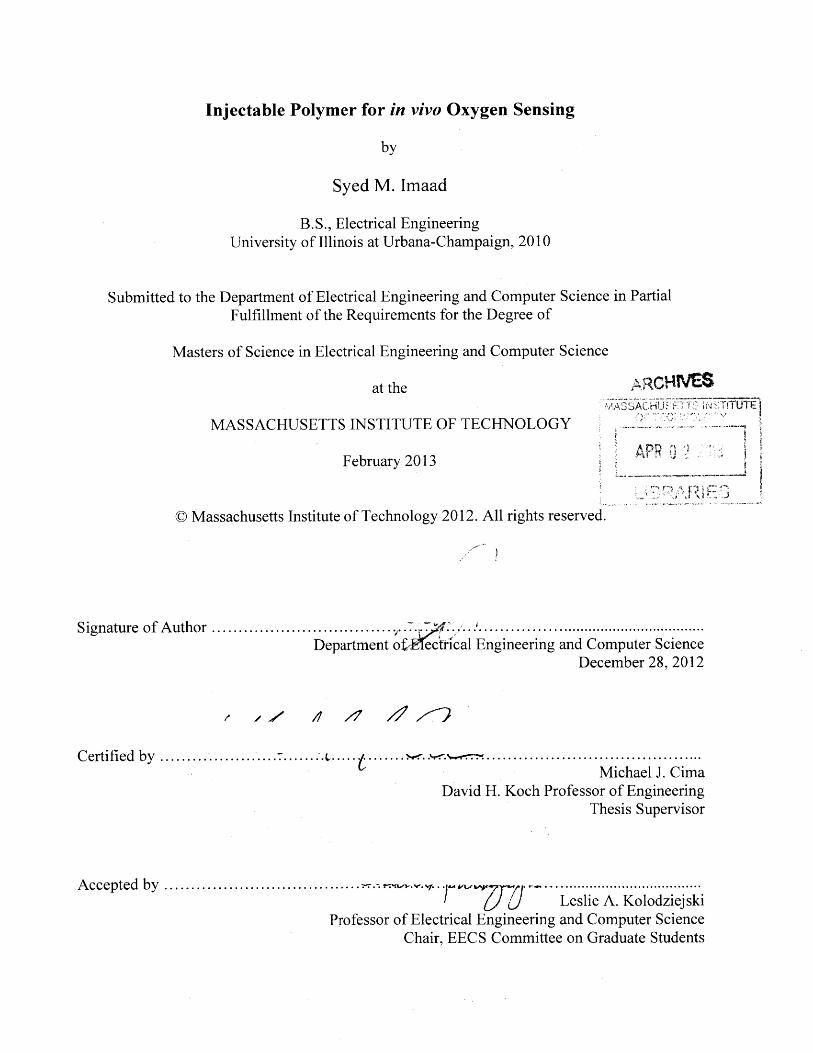
on the device. Figure 2.2 shows a diagram of the apparatus of the Whitesides infusion technique
as well as a picture of the Stryker device used for making intracompartmental tissue pressure
measurements.
15
V~uIW~ ~ 3.Way $"COcIO OWto
Figure 2.2 Clinical instrumentation used for diagnosing compartment syndrome in
patients. Shown is the apparatus for Whitesides infusion technique (left) and the Stryker
device (right).
Mohler et al. have studied the intramuscular pressure and relative oxygenation in the anterior
compartment of the leg in patients suspected of having chronic compartment syndrome before,
during and after exercise. They used an infusion-based technique for measuring intramuscular
pressure and obtained oxygenation values using near infrared spectrometry. In their study they
concluded that patients with chronic compartment syndrome (as confirmed by intramuscular
pressure measurements) had greater relative deoxygenation during exercise as well as delayed
reoxygenation after exercise and as such oxygenation measurements may be useful in diagnosing
patients suspected of having chronic anterior compartment syndrome of the leg [20]. Seekamp et
al. have used catheter-based measurements to study the effects of restricting blood circulation to
the limbs of rats on the oxygen tension and intracompartmental pressure of the limb. They also
conclude that intramuscular oxygen tension measurements could be a useful metric in diagnosing
compartment syndrome especially in cases where there are normal compartment pressures [7].
Even though the abovementioned instrumentation and techniques used for measuring tumor
oxygenation and intracompartmental pressure are widely used in clinical practice, they have their
own limitations. First and foremost is the fact that they are extremely invasive procedures
requiring injection of an electrode or needle each time a measurement needs to be made (which
may be many times over the course of disease progression or therapy). This leads to patient
discomfort and also implies that the measurements made are not repeatable as it is highly likely
16

that a specific site may not be examined each time the procedure is performed. One of the
limitations specific to the polarographic oxygen electrode is that it is susceptible to pressure
artifacts and the signal-to-noise ratio is very poor at low oxygen levels [12]. Similarly for
intracompartmental measurements, Uliasz et al. have shown that the Whitesides infusion
technique is not a reliable method for measuring intracompartmental pressure [21].
The impact of in vivo oxygen measurements on clinical practice and the limitations of current
gold standards have encouraged researchers to develop alternative methods to detect oxygen in
vivo. Some of these methods as well as their advantages and limitations are discussed in the next
section.
2.2 Other methods to measure oxygen in vivo reported in literature
The use of nuclear medicine markers in conjunction with biopsy is one of the more invasive
methods by which tumor hypoxia has been quantified by Chapman et al. Markers of the
iodinated azomycin nucleoside class were used to test hypoxic activity in cell suspension
equilibrated with different oxygen concentrations as well in tumor bearing rats [22]. Apart from
being invasive this method does not yield a direct measurement of oxygen concentration but
indicates hypoxia and is a predictor for tumor radioresistance.
Jiang et al. have used a fluorescence quenching based approach to quantify oxygen
measurements in vitro and in vivo. They synthesized an oxygen-sensitive fluorescence indicator
that was then attached to the distal end of a fiber optic cable which was encased in a catheter
tube. The in vitro response of the sensor was characterized by exposing it to solutions infused
with varying oxygen concentrations in a circulating loop system. In vivo measurements were
performed by inserting the sensor into a collateral circulation system from the carotid artery of
rabbits [23]. This sensor is reversible and has a fast response time of 15 s but involves an
invasive procedure for measurements and is not repeatable. Xiong et al. have also reported the
development of a dissolved oxygen sensor based on dynamic fluorescence quenching. The
sensor was fabricated by dip-coating a silica-Ni-P coating onto a copper-screen substrate which
17

was then doped with an oxygen sensitive ruthenium complex. In vitro tests were carried out by
introducing nitrogen-oxygen mixtures varying from 0% to 100% oxygen (v/v) into a flow-
through cell containing water and the sensor [24]. Signal changes were reversible with response
times of around 200-300 seconds. Although in vivo studies were not performed, it is conceivable
that this approach would also require an invasive procedure for measurements that would not be
repeatable.
Phosphorescence imaging is another technique that has been employed to detect in vivo oxygen
concentrations. Wilson et al. have used a Pd complex-based phosphorescence probe infused into
the femoral artery of a cat as a complex with bovine serum albumin. The response of the probe to
occlusion and reperfusion of the middle cerebral artery is recorded using a video camera. This
technique allows noninvasive measurements for detecting oxygen but is more of a surface
detection scheme limited to depths of less than 1 mm [25]. Babilas et al. have shown oxygen
dependent phosphorescence quenching using transparent planar sensor foils. The sensors
consisted of a Pt complex immobilized in a polystyrene matrix that was spread onto a polyester
support. Transcutaneous p0 2 measurements were taken before, during and after ischemia that
was established using a tourniquet positioned on the upper arm of human subjects [26].
Professor Harold Swartz of Dartmouth Medical School has pioneered the use of electron
paramagnetic resonance (EPR) spectroscopy for tissue oximetry. Williams et al. have recently
reported on the use of India ink for EPR oximetry. Ongoing studies include those on human
subjects for the measurement of subcutaneous pO2 in the feet to assist in developing procedures
for the treatment of peripheral vascular disease as well as tumor oximtery [27]. The technique
involves injection of an oxygen sensitive dye, i.e. India ink, into the tissue of interest that can be
read using a noninvasive and repeatable procedure. EPR spectroscopy is a promising technique
for tissue oximetry but it is not used as MRI or NMR methods in clinical practice.
Magnetic Resonance Imaging (MRI) based methods have been used in the past to study tissue
hypoxia and tumor oxygenation. These methods have primarily focused on the use of oxygen
sensitive contrast agents such as hexafluorobenzene whose T, relaxation (discussed in Chapter 3)
changes with oxygen and can be read using 19F MRI [28]. The method involves injection of the
18

contrast agent in the tissue of interest and allows for noninvasive and repeatable measurements.
The varying clearance rates of these compounds could be a potential concern especially for
longer term studies.
19

Chapter 3: Magnetic Resonance (MR) Theory
This chapter provides a basic overview of the magnetic resonance phenomenon from a classical
perspective, although a detailed understanding requires a quantum mechanical approach. The
chapter begins by discussing nuclear spins and how they are manipulated in the presence of a
main magnetic field B, with a radiofrequency excitation field B1 to generate relaxation of
magnetic spins. The chapter closes by describing two basic pulse sequences, saturation recovery
(SR) and inversion recovery (IR), that have been used in the experiments detailed in subsequent
chapters.
3.1 Nuclear spins and the main field B,
The phenomenon of magnetic resonance pertains to atoms with an odd number of nucleons
(protons and/or neutrons) possessing a nuclear spin angular momentum. A nucleus has a net
positive charge and can be thought of as spinning about its axis. The nucleus thus acts as a small
magnet along the direction of the spinning axis (Figure 3.1). Hydrogen or 1H with a lone proton
is the most abundant atom with nuclear spin in the human body and is what most of MR imaging
is catered to (including our own studies) although other atoms such as carbon (13 C), fluorine (19F)
and phosphorous (3 1P) have also been imaged using MRI [28], [29], [30].
N
Figure 3.1 Nuclei with an odd number of nucleons are constantly spinning and can be
thought of as tiny magnets possessing nuclear spin angular momentum.
20

The earth's magnetic field is too weak (approximately 5 G) and has practically no influence on
these atomic or molecular 'spins'. This implies that in the absence of an external magnetic field
the spins in a sample of material are oriented randomly with no preferential direction leading to
zero net magnetization. In the presence of an externally applied static magnetic field Bo,
however, most spins will align parallel to the direction of the magnetic field resulting in a non-
zero net magnetization (Figure 3.2). The main field Bo also has the effect of causing the nuclear
spins to precess at a specific frequency called the Larmor frequency. The Larmor frequency
varies with the type of atom as well as the strength of the main magnetic field as shown by the
equation,
wo = yBO (3.1)
which can also be written as
fo = BO (3.2)
where wo orfo is the Larmor frequency, y is the gyromagnetic ratio that is a constant different for
each atom, and Bo is the main magnetic field.
z
y>x
MO
B
Net Magnetization = 0 Net Magnetization = M, 2
Figure 3.2 A sample consists of randomly pointing nuclear spins with zero net
magnetization in the absence of a magnetic field. In the presence of an external field B",
however, these spins align themselves along the direction of the applied field generating a
net magnetization in the same direction.
21

3.2 MR excitation using an RF field B1
The nuclear spins orient themselves parallel to the main field B, which is the lower energy state.
A subset of the spin population can also orient itself anti-parallel to B, which is the higher energy
state. The relative distribution of nuclear spins in these two energy states in the absence of the
excitation field B1 is described by the Boltzmann equation,
Nanti-parauiei _ -y_, (3.3)= eale kT =e 21rkT(3)
Nparauiei
where Nparallei is the number of nuclei in the lower energy state, Nanti-parallei is the number of
nuclei in the higher energy state, JE is the difference in energy levels of the two populations, y is
the gyromagnetic ratio, BO is the main magnetic field, k is the Boltzmann constant, and T is the
absolute temperature. Under equilibrium conditions and at room temperature this ratio is slightly
less than 1 implying that there is a small excess of spins in the parallel or low energy state. It is
the presence of these spins that gives rise to the net magnetization parallel to Bo.
These spins need to be perturbed from equilibrium in order to obtain an MR signal. This is
achieved by using an RF pulse which generates a magnetic field B1 in the transverse (xy) plane
and is perpendicular to the main field BO which points in the longitudinal or z direction. The RF
pulse must be operating at the resonant frequency of the spins, i.e., the Larmor frequency co0 in
order to excite the nuclear spins. Excitation can be thought of as rotating the magnetization
vector MO into the transverse plane as it precesses about the longitudinal axis at the Larmor
frequency (Figure 3.3). The magnetization vector does not necessarily have to be tipped 90' into
the transverse plane. It can be tipped about by some arbitrary angle which depends on the
strength and duration of the RF pulse B1.
22

Z
-7
z
y
x
RF pulse B1 in xy-plane at wo
y
x
wo
Figure 3.3 Excitation of spins is achieved using an RF pulse that generates a magnetic field
B1 in the transverse plane. The magnetization vector is tipped about by a certain angle (90*
in the figure shown).
The RF pulse essentially provides the energy separating the two spin populations causing a
transition of spins between the two states. It is in this excited state that a signal called the free
induction decay (FID) can be picked up in the transverse plane.
3.3 MR relaxation
The spins or more specifically the net magnetization will eventually return to the initial thermal
equilibrium state through a process called MR relaxation. The transverse component of
magnetization (My) decays to zero whereas the longitudinal component (A) reaches the
equilibrium magnetization M. Figure 3.4 shows these relaxation processes in terms of the net
magnetization vector.
23

Z
/
Removal of B,relaxation
x
Figure 3.4 The nuclear spins return to thermal equilibrium once the RF pulse B1 is
terminated. As shown in the above figure, the transverse or xy component of the
magnetization vector decays from Mo to zero while the longitudinal or z component
increases from 0 to Mo.
The longitudinal relaxation is characterized by the time constant T, which is also known as the
spin-lattice time constant. Recovery of the longitudinal component of magnetization is described
by
(3.4)dM _ _Mz - Mo
dt T1
the solution of which is
(3.5)Mz = Mo + (Mz(0) - Mo)e-1
where M(O) = Mo for a 900 excitation.
The time constant characterizing the decay of the transverse component of magnetization is
referred to as T2 which is also called the spin-spin time constant. It is described by
(3.6)dMx, Mydt T2
whose solution is
24
z
VI4/'
__> X

t - (3.7)Mx, = Mxy (0) e T2
where My(O) = M, for a 90' excitation.
3.4 Basic pulse sequences for T, measurement
The material synthesized and presented in this thesis for use as an implantable oxygen sensor has
a T, that is dependent on the partial pressure of oxygen. Thus, oxygen tension determination for
in vitro characterization as well as for in vivo measurements requires extraction of the T, time
constant of the material. This section describes two pulse sequences that have been used in our
work.
(i) Saturation Recovery
The saturation recovery sequence is composed of a series of 90' pulses. These pulses are
separated by a repetition time denoted by TR. The effect of the 90' pulse is to flip the
magnetization vector into the transverse plane such that the longitudinal component of
magnetization is 'saturated' to zero. The magnetization recovers exponentially to the equilibrium
magnetization MO with a time constant of T after the pulse is applied. Figure 3.5 shows a basic
saturation recovery sequence. The image intensity is proportional to the longitudinal
magnetization, M, right before the application of the second 900 pulse when steady-state is
achieved, i.e.,
TR (3.8)I oc Mz = MO(1 - e Ti)
where I is image intensity.
25

90 * 90 * 90 * 90 *
TR -A
Mz
Figure 3.5 A basic saturation recovery sequence comprising of a series of 900 pulses
separated by TR. Longitudinal magnetization goes to zero upon application of the pulse
and followed by T, relaxation.
(ii) Inversion Recovery
The inversion recovery sequence is so named because it consists of an initial 180' pulse that
inverts the initial magnetization. The longitudinal magnetization relaxes with time constant T,
until a 900 pulse is applied after a time delay of TI. This 90' pulse forces the longitudinal
magnetization to zero after which it recovers once again following T, relaxation until another
1800 pulse is applied a time delay of TR after the first 1800 pulse, and so on. Figure 3.6 depicts
this scheme. The image intensity is proportional to the longitudinal magnetization, A, right
before the application of the second 90' pulse when steady-state is achieved, i.e.,
TI TR (3.g)I oc Mz = MO (1 - 2e Ti+e T)
where I is the image intensity.
26

1800
A90*
180 0
1 900
1800
900
t
|+- TI ->
I- TR -|
Mz
Figure 3.6 A basic inversion recovery sequence and the corresponding time course of
longitudinal magnetization.
27
y

Chapter 4: Synthesis and in vitro Characterization
4.1 DDMPS as the oxygen sensing component
Dodecamethylpentasiloxane (DDMPS) was selected as the material of choice due to its
sensitivity to oxygen and corresponding MR-responsiveness. DDMPS is a linear siloxane
molecule and belongs to the larger family of organosilicon compounds. It is a colorless liquid at
room temperature with low viscosity and consists of a linear chain of five silicon atoms bonded
together with oxygen atoms between them (Figure 4.1). It is the fifth in the series of linear
siloxane molecules after hexamethyldisiloxane (HMDSO), octamethyltrisiloxane (OMTSO) and
decamethyltetrasiloxane (DMTSO), in order of increasing number of silicon (and oxygen) atoms.
DDMPS and DDMPS-derived materials have been used in products such as antiperspirants,
deodorants, lotions, cosmetics etc. and as such are biocompatible [31].
CH3 CH3 CH3 CH3 CH3I I I I I
CH3 - Si -0- Si- 0- Si- 0- Si- 0- Si- CH3I I I I I
CH3 CH3 CH3 CH3 CH3
Figure 4.1 Molecular structure of dodecamethylpentasiloxane (DDMPS).
DDMPS is sensitive to oxygen in that its longitudinal relaxation time constant T, varies with
oxygen percentage. Figure 4.2 shows the variation in T, with time as DDMPS is exposed to a
nitrogen/oxygen mixture of gas with varying percentages of oxygen. T, measurements were
made using the Bruker Minispec which is a 0.47 T benchtop relaxometer manufactured by the
Bruker Corporation. 1-2 mL of DDMPS (97%, Sigma-Aldrich) was pipetted into a 10 mm NMR
tube (Norell, Inc.) and placed into the Bruker Minispec magnet. The sample was allowed to
equilibrate to the magnet temperature of 40'C for few minutes before T, measurements were
made spaced 1 min apart. A two-gas gas mixer (Columbus Instruments) was used to
28

electronically set and control the gas composition that was fed into the head space over the
DDMPS in the NMR tube at a flow rate of 50 cc/min.
0% 5% 10% 15% 21%
4500
4000
3500
3000
'0 2500
2000
1500
1000
500
00 10 20 30 40 50 60 70
Time (mins)80
Figure 4.2 Time course measurements
nitrogen/oxygen gas mixture for DDMPS.
of T, with varying percentage of oxygen in a
0% oxygen implies 100% nitrogen.
These results suggest a response time of around a minute and an equilibration time of around 5
minutes. The equilibration time will vary, however, depending on several factors other than the
material itself such as amount of sample, gas flow rate etc. It is pertinent to mention here why
DDMPS and not any of the other linear siloxanes HMDSO, OMTSO or DMTSO were
considered for use as the oxygen sensing component. Although HMDSO, OMTSO and DMTSO
show a larger dynamic range or % change in T, from 21% to 0% oxygen (see Chapter 5), the fact
that these siloxanes are more volatile than DDMPS makes the selection of the latter worth the
tradeoff. Figure 4.3 below shows the T, sensitivity (measured as the % change in T, between 0%
and 21% 02) versus volatility (measured by the evaporation rate of each liquid siloxane in an
open vial at 37*C).
29

300% a
250%
+ HMDSO200%
A MOMTSO
A DMTSO150% 1X
X DDMPS
100%--
1.0E+0 1.E+01 .0E .0E+03
Volatlty (mgfhr)
Figure 4.3 T, response sensitivity plotted against volatility for each of the liquid siloxanes.
4.2 Synthesis of a solid elastomer for use as an oxygen sensor
The use of liquid DDMPS alone for reporting tissue oxygenation in vivo, though possible, has its
limitations. Clearance with time of the injected liquid, or its emulsion, and the failure to
accurately monitor a specific site repeatedly due to potential perfusion of the liquid in tissue are
but some of the reasons why using liquid DDMPS may not be beneficial. One way to address
this is to enclose DDMPS within a biocompatible plastic reservoir using an oxygen permeable
membrane, based on an approach used by Ling et al. to detect cardiac biomarkers in vivo [32].
Although this approach is possible, a standalone polymer that could be molded into different
shapes and sizes is a more attractive proposition.
A standalone polymer with DDMPS in a polydimethylsiloxane (PDMS) network was
synthesized to address the aforementioned limitations, where the former is the oxygen sensitive
component and the latter provides structural integrity. PDMS belongs to the family of
organosilicon compounds commonly known as silicones. Figure 4.4 shows the molecular
structure of PDMS which consists of n repeating units of [SiO(CH 3)2].
30

CH3 CH3 CH3I I I
CH3 - Si- 0 Si -O Si- CH3I I I
CH3 CH3 CH3
Figure 4.4 Molecular structure of polydimethylsiloxane (PDMS).
PDMS is a transparent, non-toxic, biocompatible and biodurable elastomer that has been used
extensively for various biomedical applications. It has been used, for example, in blood-
oxygenator membranes, shunts, catheters, hand and foot joint implants, breast implants and
testicular implants among other applications [33]. Silicones like PDMS are also known to have a
high permeability to oxygen which is a key requirement for our application since this ensures
rapid response and equilibration times (see Chapter 5).
Synthesis of the oxygen sensitive solid elastomer is accomplished by mixing 70% by weight of
DDMPS (97%, Sigma-Aldrich) and 30% by weight of PDMS (Sylgard 184, Dow Coming). The
two components were vigorously mixed in a vial until the PDMS completely dissolved resulting
in a clear liquid. This was possible due to the miscibility of DDMPS in uncured PDMS given
that both belong to the same class of materials, i.e., siloxanes. The PDMS portion of this mixture
comprised of a 10:1 w/w ratio of base to curing agent. The DDMPS-PDMS mixture was poured
into a plastic petri dish that was coated with a thin film of Teflon to allow for release of the
elastomer once cured. This small petri dish was then placed in a larger plastic petri dish that also
contained a small aluminum weighing boat filled with pure DDMPS (Figure 4.5). The DDMPS
filled boat was used to ensure a vapor saturated environment in the large petri dish so as to
prevent any loss of DDMPS from the 70% DDMPS / 30% PDMS mixture inside the smaller
petri dish during thermal cure. The large petri dish and its contents were then transferred to a lab
oven maintained at 80'C and cured for 1.5 hrs.
31

DDMPS 70% DDMPS / 30% PDMS
Figure 4.5 Petri dish setup for curing elastomer while ensuring vapor saturated conditions
at the same time.
A soft, transparent and elastomeric mold was retrieved upon completion of thermal curing. This
solid elastomeric material will be referred to as 70% DDMPS-PDMS. Weight measurements
taken before and after thermal cure were the same verifying that no loss of DDMPS had occurred
and that the vapor saturation scheme was indeed effective. The synthesis process for 70%
DDMPS-PDMS makes it possible to synthesize sensors of various shapes and sizes as may be
required for particular implantation site. This can be achieved by using appropriate Teflon
molds. Figure 4.6 below shows a large disc of 70% DDMPS-PDMS that was prepared in a petri
dish and smaller disc-shaped devices that were punched out from this larger disc. Devices of
different sizes were obtained using biopsy punches (KAI Medical) of various diameters.
-1~i X < P..4C AS NIA
Figure 4.6 70% DDMPS-PDMS mold prepared using the synthesis protocol outlined
earlier (left) and devices with diameters ranging from 1-4 mm punched out from the larger
mold (right).
32
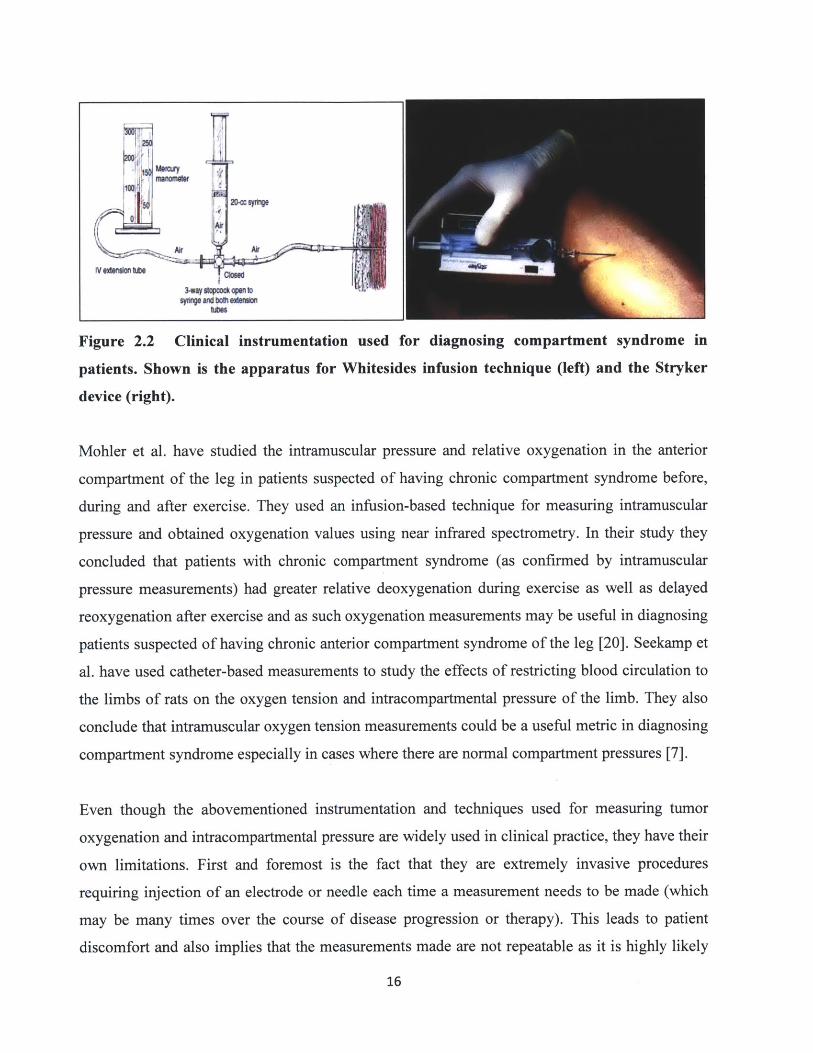
4.3 Response of the solid elastomer to oxygen
The response of 70% DDMPS-PDMS to oxygen was measured using the same instruments and
setup used for measuring the response of pure DDMPS (see Section 4.1). Three discs were
punched out from a mold of 70% DDMPS-PDMS using a 4 mm biopsy punch. These discs were
placed in a 10 mm NMR tube which was then placed inside the Minispec magnet and allowed to
equilibrate to the magnet temperature of 40'C for few minutes before T, measurements were
made spaced 10 min apart. An initial measurement was taken under ambient conditions (air or
21% oxygen) and then the devices were exposed to 0%, 5%, 10%, 15% and 21% oxygen in that
order. The devices were exposed to different oxygen concentrations by using a nitrogen/oxygen
gas mixer system with the output of the gas mixture set to a flow rate of 50 cc/min. Figure 4.7
shows a plot of the device response as it was exposed to a mixture of nitrogen and oxygen gases
with varying oxygen concentrations.
-A
2500
2300
2100
1900
1700
1500
1300
1100
900
700
So00
2% 5% 10%
60 120 10 240
Tim (ns)
21%
300
Figure 4.7 T, response of 70% DDMPS-PDMS devices tracked over
oxygen concentrations. % values indicate the oxygen concentration
exposed to during that period. 0% oxygen implies 100% nitrogen.
time for different
the devices were
33

Measurements were found to be stable for each interval of specific oxygen concentration. The
device response equilibrated within 10 minutes which suggests a response time of well under 10
minutes. Separate measurements showed the response time to be around a minute and an
equilibration time of 6 minutes. As mentioned previously, the equilibration time will vary
depending on factors other than the material itself such as gas flow rate, size of device etc. This
does not, however, mean that the value of this metric is meaningless since it gives an order of
magnitude sense for the response and equilibration times of the material. The response was
found to be completely reversible as established by cycling the gas mixture between 0% and
21% oxygen levels several times (Figure 4.8). Ty measurements for different oxygen
concentrations were used to generate a calibration curve correlating the longitudinal relaxation
rate, 1/T, to the oxygen concentration, % 02 (Figure 4.9). This calibration curve can be used to
extrapolate oxygen concentration for a given Ty measurement of the device at 0.47 T.
2500 -
ta 2000 -
1500 -
1000 .
0 50 100 150 200 250 300Time (min)
Figure 4.8 Reversibility of response for 70% DDMPS-PDMS. Gas was cycled between 0%
oxygen (top plateau) and 21% oxygen (bottom plateau) showing complete reversibility.
34

Figure 4.9 Calibration curve for 70% DDMPS-PDMS using the Minispec at 0.47 T.
Regression analysis was performed on the calibration curve using Excel to determine: (i) the
limit of detection (LOD) which was found to be 1.06% 02; and (ii) the limit of quantification
(LOQ) which was calculated to be 3.21% 02. It is pertinent to mention here that the
physiologically relevant oxygen levels are 0-4% (hypoxic tissue), 4-7% (venous blood), 7-12%
(regular tissue) and 12-20% (arterial blood). The 70% DDMPS-PDMS sensors show response in
all these ranges and with a lower LOQ of around 3% can also detect hypoxic tissue.
4.4 Specificity of response to oxygen
It is important to ascertain that the response of the device has high specificity to oxygen, i.e., it
does not respond to other gases. This is because any response attributable to some gas other than
oxygen can lead to false readings and spurious extrapolation of the actual concentration of
oxygen based on the recorded T, measurement. Oxygen and carbon dioxide are the two major
gases present in blood and are of interest for blood gas measurements. Values at sea level for the
partial pressure of oxygen, PaO2, are in the range of 75-100 mmHg and those for carbon dioxide,
PaCO 2, are in the range of 38-42 mmHg [34]. These partial pressure values roughly translate to
10-13% for oxygen and 5-5.5% for carbon dioxide given an atmospheric pressure of 760 mmHg
at sea level.
35
0.0009
y = 2E-05x + 0.00040.0008 R2 0.9989
0.0007
* 0.0006
0.0004
0.0004
0.0003 + - - - - - -r - - - ------ - ,
0 5 10 15 20 25
Oxygen Concentration (%)

A test for response of the devices to carbon dioxide was performed by preparing disc shaped
devices and exposing them to CO2. Three disc shaped devices were punched out from a mold of
70% DDMPS-PDMS using a 4 mm biopsy punch and placed into a 10 mm NMR tube. The tube
was placed in the Minispec magnet and allowed to equilibrate to the magnet temperature of 40*C
for few minutes before T, measurements were taken. An initial measurement was taken under air
followed by three measurements each at nitrogen (0% 02 or 0% C0 2) and 100% carbon dioxide
respectively. A gas mixer system was used to switch between nitrogen and carbon dioxide gases.
Measurements were taken every 10 minutes. Figure 4.10 shows a bar chart comparing the initial
measurement in air and the measurements taken at 0% and 100% carbon dioxide levels. The
results clearly show that there is no significant difference in T, response of the 70% DDMPS-
PDMS between 0% and 100% carbon dioxide levels. It can safely be assumed then that much
lower carbon dioxide levels present in vivo as mentioned above will not affect the response of the
device to oxygen either.
2500
2000
1500
(U)
1000 -
500
0
Air (21% 02) Nitrogen (0% 02 or 100% Carbon DioxideC02)
Figure 4.10 Comparison of the T, response of 70% DDMPS-PDMS when exposed to air
(21% 02), nitrogen (0% 02 and 0% C0 2) and 100% CO 2 levels. The material responds to
oxygen (Air vs. Nitrogen) whereas there is no response to CO 2 (Nitrogen vs. C0 2). This
shows that 70% DDMPS-PDMS has a specific response to 02.
36

Chapter 5: Oxygen Diffusivity Measurements
Oxygen is highly permeable in silicones and siloxanes, and is characterized by large
permeabilities in these materials [35]. The polymer material synthesized and presented in this
thesis for use as an injectable oxygen sensor is composed of a siloxane,
dodecamethylpentasiloxane (DDMPS), within a polydimethylsiloxane (PDMS) matrix. DDMPS
belongs to a family of linear siloxanes that also include hexamethyldisiloxane (HMDSO),
octamethyltrisiloxane (OMTSO) and decamethyltetrasiloxane (DMTSO) among others. Table
5.1 shows the molecular structure and weight of each of these four linear siloxanes.
Mol. wt.Siloxane Molecular Structure
(g/mol)
CH3 CH3 CH3
OMVTSO cH,- Si -o0- sI - 0 -si - c43 236.53
CH3 CH3 CH3 CH3
DMTSO CH3- Si -- Si- O- Si-cHi- CH3 31 69CH3 CH3 CH3 CH
CH3 CH3 CH3 CH3 CH3
DDMPS CH3 - SI -0- Si- 0- Si- 0- Si 0 Si- CH3 38484CH3 CH3 CH3. CH3 CHS
Table 5.1 Molecular structures and weights of the four linear siloxanes used for diffusivity
measurements and analysis.
Oxygen diffusivity in the sensor materials is important to know not only to ascertain the response
and equilibration times but also to explain the changes in T observed in response to oxygen. We
hypothesized that the diffusivity of oxygen in these materials dictates their sensitivity in T,
37

response to oxygen, with higher oxygen diffusivities resulting in higher T, sensitivities and vice
versa which was found to be the case (see section 5.2). This can be thought of as follows: an
oxygen molecule moving in a material with higher oxygen diffusivity will cause a larger number
of protons to relax compared to one moving in a material with lower oxygen diffusivity leading
to the differences in T, sensitivities.
Oxygen diffusivity measurements were carried out in each of the four liquid siloxanes mentioned
above as well as in the corresponding solid 70% Siloxane-PDMS composite blends. The
measured diffusion coefficients were correlated with the percentage change in T, in response to
oxygen so as to try to better understand the mechanisms behind the Tz response of these
materials. Various methods have been reported in literature in order to determine the diffusion
coefficient of gases in polymers. Some of these include luminescence quenching [36], electron
spin resonance [37], and sorption/desorption [38]. Our approach involved using MR intensity
measurements for obtaining oxygen diffusivities. The (defined) variation in T, of these materials
with oxygen was leveraged in order to track the change in intensity with time at a fixed depth
upon exposing these materials to oxygen. The protocol for oxygen diffusion measurements is
described in detail next.
5.1 Protocol for oxygen diffusivity measurements
(i) Equilibrating samples at 0% oxygen:
Diffusion experiments were carried out by starting with samples initially at 0% oxygen and by
exposing them to air at time t = 0. This was achieved for liquid siloxane samples by purging gas-
tight GC vials with lab nitrogen for 5 minutes. In the case of solid 70% Siloxane-PDMS samples,an uncured mixture prepared in gas-tight GC vials was purged with lab nitrogen for 5 minutes
followed by thermal cure at 80'C for 1.5 hrs. The nitrogen gas used for purging the samples was
vapor saturated with the respective liquid siloxane by bubbling through this siloxane in a cold
finger to prevent loss of the 70% by weight siloxane component during the curing process. T,
measurements were taken in the end to ensure that the samples were indeed equilibrated at 0%
oxygen.
38
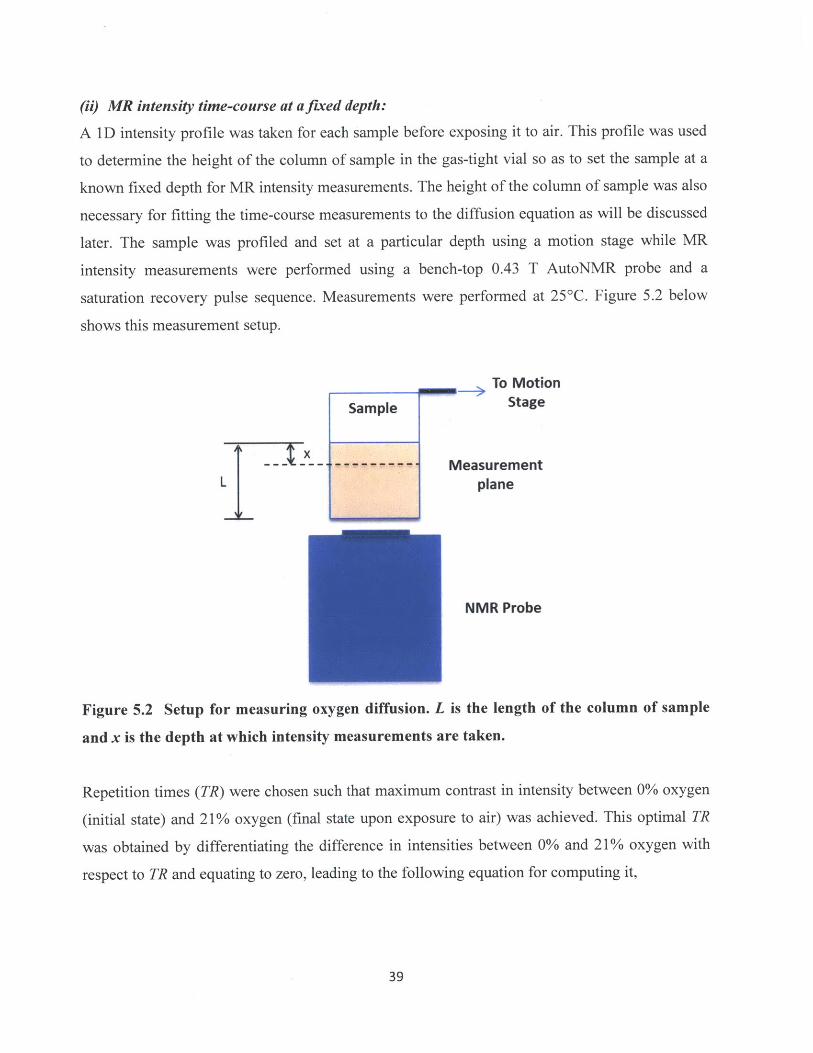
(ii) MR intensity time-course at a fixed depth:
A 1 D intensity profile was taken for each sample before exposing it to air. This profile was used
to determine the height of the column of sample in the gas-tight vial so as to set the sample at a
known fixed depth for MR intensity measurements. The height of the column of sample was also
necessary for fitting the time-course measurements to the diffusion equation as will be discussed
later. The sample was profiled and set at a particular depth using a motion stage while MR
intensity measurements were performed using a bench-top 0.43 T AutoNMR probe and a
saturation recovery pulse sequence. Measurements were performed at 25'C. Figure 5.2 below
shows this measurement setup.
To Motion
Sample Stage
--------- MeasurementL plane
NMR Probe
Figure 5.2 Setup for measuring oxygen diffusion. L is the length of the column of sample
and x is the depth at which intensity measurements are taken.
Repetition times (TR) were chosen such that maximum contrast in intensity between 0% oxygen
(initial state) and 21% oxygen (final state upon exposure to air) was achieved. This optimal TR
was obtained by differentiating the difference in intensities between 0% and 21% oxygen with
respect to TR and equating to zero, leading to the following equation for computing it,
39

In( )2
TRopt = 11 (5.1)
T110 T110
where T 121 is the T, of the material at 21% oxygen and T 1i0 is the Ti of the material at 0%
oxygen.
(iii) Conversion of intensity measurements to % 02:
The acquired time-course measurements were first converted from intensity to % 02
(concentration) in order to extract oxygen diffusion coefficients for the various samples. Since
MR intensity is related to T, by the saturation recovery equation and the inverse of T, is linearly
related to % 02, this conversion was easily made using the equations,
TR
I =IO(1 - e Ti) (5.2)
1-a + b(% 02) (5.3)
where I, is the equilibrium intensity approximated by measuring intensity at a high TR, while a
and b are coefficients that were determined experimentally.
(iv) Fitting to diffusion equation:
Diffusion through an isotropic medium is characterized by Fick's second law of diffusion which
is described by the following equation,
-c = D (5.4)at ax2
where x is distance, t is time, C is the concentration of the diffusing species and D is the
diffusion coefficient.
40

The solution for this equation in the case of an infinitely long sample for which C(x)= 0 for x < 0
and t = 0 while C(x) = C, outside the sample for all t > 0 is given by the following equation [39],
xC = Cerfc( (5.5)
where erf c is the complementary error function. This equation implies that for Fickian diffusion
the diffusion distance varies linearly with the square root of time, i.e., x oc VfT. Oxygen is
diffusing through a finite sample in our setup and therefore Equation 5.5 does not hold. A finite
sample implies a zero flux condition at the bottom of the vial. The solution for this case can be
thought of as the combination of an image source (a distance L below the sample) as a result of a
single reflection at the boundary, along with the real source (at x = 0) so as to achieve zero-flux
at the bottom of the vial. This leads to the following equation,
( x x +2LC = C,[erfc + erfc + ] (5.6)
where L is the length of the sample as shown in Figure 5.2 earlier. The % 02 vs. time data from
the previous step was fitted to this equation to retrieve the diffusion coefficient D for each
sample.
5.2 Results
Figures 5.3 shows the changes in MR intensity and percentage oxygen with time for the liquid
siloxane samples hexamethyldisiloxane (HMDSO), octamethyltrisiloxane (OMTSO),
decamethyltetrasiloxane (DMTSO) and dodecamethylpentasiloxane (DDMPS), as the samples
were exposed to air from their initially equilibrated state of 0% oxygen. Measurements were
performed at a depth of 2.5 mm from the surface of the sample for each of the four liquid
siloxanes. The results suggest equilibration times on the order of several minutes at the specified
depth for each of the samples, increasing from about 4 minutes in the case of HMDSO to around
10 minutes for DDMPS. This suggests a decrease in oxygen diffusivity as we go from HMDSO
41

to DDMPS as can also be deduced from Figure 5.7 where the initial rate of increase in
percentage oxygen decreases from HMDSO to DDMPS. This is also verified by the extracted
oxygen diffusivity values in Table 5.2.
Similar time-course measurements for MR intensity and percentage oxygen for the 70%
Siloxane-PDMS solid elastomeric samples are shown in Figures 5.4 for HMDSO, OMTSO,
DMTSO, and DDMPS as the siloxane component respectively. The changes were tracked for
samples initially equilibrated at 0% oxygen that were exposed to air at time t = 0. Measurements
were made at a depth of 1.5 mm from the surface of the sample for each of the four 70%
Siloxane-PDMS materials. The equilibration times of these solid samples at the specified depth
are easily on the order of several hours, in stark contrast to the liquid samples. The initial slopes
of the percentage oxygen time-course plots suggest a decrease in diffusivity from 70% HMDSO-
PDMS to 70% DDMPS-PDMS as is verified by the extracted oxygen diffusivity values in Table
5.2. A quick glance of this table also shows that the oxygen diffusivity values for the 70%
Siloxane-PDMS solid samples are about an order of magnitude lower than those for liquid
siloxane samples which explains the longer equilibration times for the solid samples. This is not
surprising as the cross-linked PDMS network of the 70% Siloxane-PDMS composites is a barrier
to the diffusion of oxygen therefore resulting in lower oxygen diffusivities and longer
equilibration times. The diffusion coefficient of oxygen in these composite materials, however, is
larger than that of bare PDMS as is shown in Table 5.2. The oxygen diffusivity in PDMS was
determined using the same protocol as for the other samples.
Many polymers exhibit non-Fickian diffusion that cannot be described using Fick's law. Glassy
polymers are one such example. Elastomeric rubber polymers, however, obey Fickian diffusion.
This difference is due to the fact that rubber polymers respond instantaneously to changes in
external conditions whereas glassy polymers do not, the latter showing time-dependent behavior
[40]. To ensure Fickian diffusion of oxygen in our 70% Siloxane-PDMS elastomeric solid
samples the diffusion distance was plotted against the square root of time. Such a plot if linear
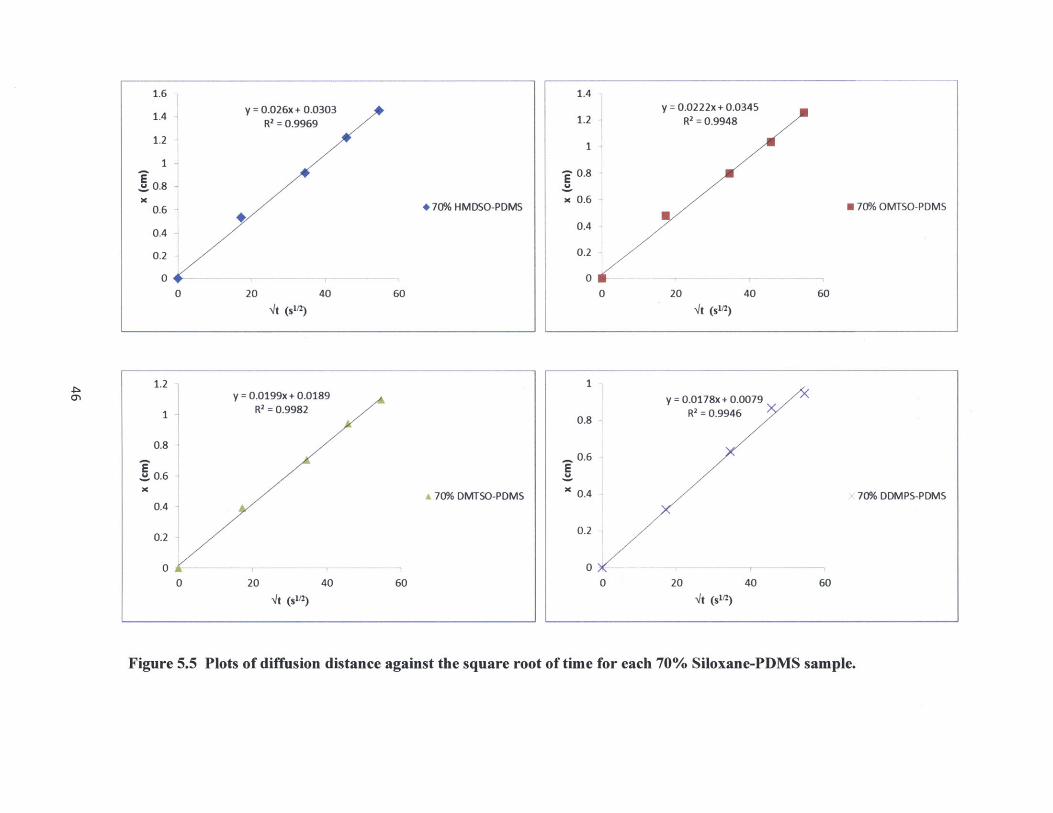
would confirm the Fickian behavior of diffusion. Figure 5.5 shows these plots for 70% Siloxane-
PDMS samples for each siloxane HMDSO, OMTSO, DMTSO and DDMPS. The plots were
indeed linear confirming that the diffusion of oxygen in these polymers follows Fickian
42

behavior. The line gradients of these plots decrease as we go from 70% HMDSO-PDMS to 70%
DDMPS-PDMS which can be explained due to the decrease in oxygen diffusivity in the same
direction. All measurements were taken with samples initially equilibrated at 0% oxygen and
exposed to air (21% oxygen) at time t = 0.
The percentage change in T, values for the liquid siloxane samples and 70% Siloxane-PDMS
elastomers were plotted against the respective oxygen diffusivities in these materials (Figure
5.6). This metric, i.e., % change in T, can be thought of as the response sensitivity to oxygen for
the different materials. The percentage change in T, was defined as,
% change in T1 = * 100% (5.7)T1121
where T 12 1 is the T, at 21% oxygen and Tzio is the T, at 0% oxygen. Figure 5.6 shows a clear
trend of increasing % change in T1 with oxygen diffusivities for both the liquid and solid
elastomer materials. In other words, as we go from the smaller siloxane molecule HMDSO to the
larger DDMPS, oxygen diffusivities decrease and are accompanied by a decrease in % change in
T1. The solid elastomer samples follow a similar trend where as we go from the sample with 70%
weight fraction of the smaller siloxane HMDSO to one with the same weight fraction of
DDMPS, we see a decrease in oxygen diffusivity and a decrease in % change in T1.
43

35
30
* HMDSOE 25
M OMTSOC
DMTSO
20 X DDMPS
150 100 200 300 400 500 600 700
Time (s)
25 -
20 -
15* HMDSO
O 10 - +OMTSO
DMTSO
5 ~X DDMPS
0
100 200 300 400 500 600 700
-5Time (s)
Figure 5.3 Plots showing variation in intensity (top) and percentage oxygen (bottom) for
each liquid siloxane sample on the same axes.
44

30
25
*70% HMDSO-PDMS
U 70% OMTSO-PDMS
20 70% DMTSO-PDMS
X 70% DDMPS-PDMS
150 500 1000 1500
Time (s)
14
12
10
8 *70% HMDSO-PDMS
0 *70% OMTSO-PDMS
70% DMTSO-PDMS4
X 70% DDMPS-PDMS2
0500 1000 1500
-2Time (s)
Figure 5.4 Plots showing variation in intensity (top) and percentage oxygen (bottom) for
each 70% Siloxane-PDMS elastomeric solid sample on the same axes.
45
y = 0.0222x+ 0.0345R2 = 0.9948
1.6
y = 0.026x + 0.03031.4 R2 = 0.9969
1.2
1
, 0.8
0.6 +70% HMDSO-PDMS
0.4
0.2
00 20 40 60
qt (sI/2)
U 70% OMTSO-PDMS
60
y = 0.0199x + 0.0189R2 = 0.9982
70% DMTSO-PDMS
0 20 40 60
t (sl/2)
1
0.8
0.6E
x 0.4
0.2
0
y = 0.0178x+ 0.0079R2 = 0.9946
70% DDMPS-PDMS
0 20 40
t (sl/2)
60
Figure 5.5 Plots of diffusion distance against the square root of time for each 70% Siloxane-PDMS sample.
1.4
1.2 ,
20 40
4t (s'/)
1
-0.8E Ox 0.6
0.4
0.2
0
C.)
0
1.2
1
0.8
Ew 0.6
0.4
0.2
0

52SamleDiffusivity (x 10 cm /s)
HMDSO 52.7
OMTSO 40.2
DMTSOI 33.6
DDMPS 26.8
70% HMDSO-PDMS 4.22
70% OMTSO-PDMS 2.95
70% DMTSO-PDMS 2.14
70% DDMPS-PDMS 1.59
PDMS 0.316
Table 5.2 Diffusion coefficients for oxygen in each sample as obtained by fitting to the
diffusion equation (Equation 5.6).
47

300% -
250% -I--
C
2009/6*HMDSOP 200% -OTS
U DOMTSO
150% X DMTSO
X DDMPS
100%
3. E 4.0&-4 ,5.E-04 6 . -04
Diffusivity (cm 2/s)
250% -
"44200% -
-, *70% HMDSO-PDMS150%-
M 0 M*70% OMTSO-PDMS
70% DMTSO-PDMS
100% - X XK70% DDMPS-PDMS
50% - I5.OE-06 1.5E-05 2.5E-05 3.5E-05 4.5E-05
Diffusivity (cm 2/s)
Figure 5.6 Correlation of % change in T, against oxygen diffusivity for liquid siloxane
(top) and 70% Siloxane-PDMS (bottom) samples.
48
Chapter 6: In vivo Performance of the Injectable Polymer
A pilot animal study using an inspired gas model was conducted for the validation of in vivo
oxygen sensing using 70% DDMPS-PDMS. The goals of this study were to determine whether
70% DDMPS-PDMS devices implanted in a live rat responded to inspired gas with varying
oxygen concentrations and if the response was reversible or not.
6.1 Calibration curve for 7T MRI
Measurements and imaging were performed on a 7 T Small Animal MRI system (Varian, Inc.).
Note that this field strength is much higher compared to 0.47 T, the field strength of the Bruker
Minispec relaxometer at which in vitro measurements were made. In Chapter 3 on MR Theory, it
was mentioned that the Larmor frequency of the nuclear spins is proportional to the magnetic
field strength (Equations 3.1 and 3.2). This implies that at larger field strengths, the nuclear spins
have a larger Larmor frequency. It will take longer for relaxation to occur at higher field
strengths, i.e., a higher TI, since T, involves the exchange of energy between the nuclei and
surrounding lattice, and greater energy exchange is required at higher frequencies [41]. The
linear calibration curve mapping the inverse of Tz to % oxygen obtained using measurements
performed on the 0.47 T Minispec is not valid for the 7 T MRI due to this increase in T1 at higher
field strengths. A separate calibration curve mapping the inverse of T, to the % oxygen at 7 T on
the MRI was, therefore, obtained.
The MRI was first tuned to a ball containing doped water followed by frequency and power
prescans using the same ball. A 70% DDMPS-PDMS disc approximately 4 mm in diameter was
pushed to the base of a vial which was covered using parafilm. A thin tube connected to the
output of the gas mixer system as well as a temperature probe were pushed through the parafilm
and placed right over the 70% DDMPS-PDMS disc. The vial was then placed at an appropriate
distance into the cradle which was then pushed into the MRI coil. This distance was chosen such
that the vial was in the sensitive detection region of the coil. A fan module and heating unit were
49

used to heat the bore and maintain the temperature of the vial and its contents at 37*C. The
VnmrJ software was used to acquire images and process data. Basic scout images were obtained
to locate the vial and select an appropriate slice for imaging and Tz mapping. The gas mixer was
set to the desired oxygen concentration and the vial flushed with the particular gas mixture for 30
min before imaging. The fsems imaging protocol was then used along with inversion recovery to
obtain a series of images at different TI's (inversion times) which were then processed to extract
the Tz values at the particular oxygen concentration. Figure 6.1 below shows the calibration
curve and equation relating the inverse of Tz to the oxygen concentration as measured at 7 T.
This calibration curve can be used to extrapolate the oxygen concentration at a given site for a
particular measured T, value. Note the values of the inverse of T, which are lower than those
shown in Figure 4.8 for a 0.47 T system which is expected since the T, at higher field strengths is
also higher.
0.0006
E%Mw
y = 1E-05x + 0.0003R2=0.959
0.0005
0.0004
0.0003
10 15
Oxygen Concentration (%)
Figure 6.1 Calibration curve for 70% DDMPS-PDMS using the Varian MRI at 7 T.
50
0.0002
0.00010 5 20 25

6.2 In vivo response to changes in inspired oxygen
An inspired gas model in rodents was used to validate the response of the oxygen sensing
polymer, 70% DDMPS-PDMS. The basic idea was to record changes in T, of a 70% DDMPS-
PDMS device implanted in the hind leg muscle of a rat in response to changes in inspired
oxygen. All procedures and protocols involving animals were approved by MIT's Committee on
Animal Care (CAC) beforehand. The experimental protocol and the results obtained are
described in detail next.
The synthesis procedure for 70% DDMPS-PDMS allows for devices of different shapes and
sizes to be made as mentioned in Chapter 4. Tubular shaped devices were fabricated so that they
could be easily injected using a 16.5 gauge needle. 16 gauge PTFE tubes (Small Parts Inc.) were
filled with an uncured mixture of 70% DDMPS-PDMS and placed inside a petri dish. A small
aluminum boat filled with pure DDMPS was also placed inside the petri dish so as to ensure that
DDMPS vapors saturated the petri dish during thermal cure. The petri dish was covered and
placed inside a lab oven at 80'C for 1.5 hours. Upon completion of thermal cure, the PTFE tubes
were sliced open using a scalpel blade and tube-shaped 70% DDMPS-PDMS solid elastomers
approximately 1 mm in diameter were extracted. A 3 mm long piece was cut out and loaded into
a 16.5 gauge needle for implantation (Figure 6.2).
Figure 6.2 A 70% DDMPS-PDMS device (1 mm in diameter, 3 mm long) being loaded into
a 16.5 gauge needle.
51

Each of four male, Sprague-Dawley rats weighing approximately 350 g was implanted with one
70% DDMPS-PDMS device with dimensions of 1 mm in diameter and 3 mm in length. Hair was
removed from the leg in which the device was to be implanted so as to help in properly inserting
the needle and injecting the device into the muscle by depressing a plunger attached to the
needle. The rats were anesthetized using 1.5% isoflurane in oxygen at a flow rate of 1.5 L/min
during the entire procedure. The rats were shifted to and secured in the MRI cradle once
implanted with a device. Anesthesia at 1.5% isoflurane in oxygen was administered via a nose
cone. Respiration rate and rectal temperature were measured using a respiration pad placed on
the chest and a rectal probe respectively. Temperature was maintained at 37'C using a fan
module and a heating unit.
A frequency prescan using a large ball containing doped water was performed before placing the
rat inside the MRI. The rat was then placed inside the MRI and the MRI tuned to the rat followed
by a power prescan routine. Basic scout images were acquired to locate the slice with the device.
The T, value at a given inspired gas condition was evaluated by using an fsems inversion
recovery sequence with images acquired at multiple Ti's. The high T2 value for the 70%
DDMPS-PDMS material allowed acquisition of images at higher TE's (echo times).This enabled
suppression of the water signal from adjacent tissue as can be seen in Figure 6.3. A baseline
measurement with oxygen as the inspired gas was taken initially following which the anesthesia
carrier gas, and hence the inspired gas, was switched to medical air (21% oxygen). 20 minutes
after switching the inspired gas, multiple measurements for T, were taken so as to ensure that the
value had stabilized. The anesthesia carrier gas was then switched back to oxygen and once again
multiple T, measurements were taken 20 minutes after the switch. Isoflurane was dialed down to
0% upon completion of measurements and the rats were allowed to breathe oxygen with warm
air blowing over them until they recovered from anesthesia. Figure 6.3 shows the results from
this pilot study. The in vivo response of the devices was as expected. Higher oxygen content led
to a lower T, value and higher image intensity whereas lower oxygen content (air) resulted in a
lower Ty and therefore lower image intensity. The response was found to be completely
reversible as well.
52

Sensor results (n=4)4
Oxygen
Air
3.5
3
2.5
1.5
0.5
0-Oxygen Air Oxygen
Figure 6.3 MRI images of the 70% DDMPS-PDMS device implanted in the hind leg muscle
of a rat and the T, response to inspired gas with different oxygen concentration.
53
II

Chapter 7: Conclusion and Future Work
7.1 Conclusion
The work presented in this thesis has detailed the synthesis and characterization of a polymer,
70% DDMPS-PDMS, which responds to oxygen by altering its longitudinal relaxation time
constant T, (an MR property). This solid elastomeric material is comprised of a blend of two
siloxanes, DDMPS and PDMS, in a specific weight ratio. DDMPS is the component that confers
oxygen sensitivity whereas PDMS provides structural integrity to the polymer. The synthesis
procedure allows for easy molding of the polymer into various shapes and sizes. In vitro
measurements showed that the material had a large dynamic range especially in the
physiologically relevant oxygen concentration ranges. T, response to oxygen was found to be
completely reversible. The specificity of response to oxygen was tested by measuring the T,
response to carbon dioxide, the other major gas found in blood and hence the body. The
measurements obtained showed no difference in T, between 0% and 100% carbon dioxide thus
establishing that 70% DDMPS-PDMS does not respond to carbon dioxide.
DDMPS belongs to the family of linear siloxanes also including HMDSO, OMTSO and
DMTSO. All of these siloxanes show large T, changes in response to changes in oxygen levels.
Oxygen diffusivities of these four liquid siloxanes as well as their solid elastomer 70% Siloxane-
PDMS counterparts were measured in order to better understand the underlying mechanisms
behind the different T, responses to oxygen for each of these materials. Intensity based MR
measurements at a specific depth of sample were taken upon exposing samples initially
equilibrated at 0% oxygen to air. Intensity time-course measurements were converted to
percentage oxygen time-course using the saturation recovery and 1/T vs. % oxygen calibration
equations. The oxygen diffusivities for the liquid siloxanes and their 70% Siloxane-PDMS solid
counterparts were correlated against the oxygen response sensitivities as represented by
percentage change in T, to oxygen. It was found that larger oxygen diffusivities corresponded to
larger percentage changes in T, response for both the liquid and solid siloxane materials.
54

The 70% DDMPS-PDMS material was tested in vivo by recording the changes in T, of a device
implanted in the hind leg of a rat in response to inspired gas of varying oxygen concentrations. A
tubular shaped device, 1 mm in diameter and 3 mm long, was obtained using a 16 gauge PTFE
tube as a mold. In each of four rats, a single device was injected in the hind leg using a 16.5
gauge needle. Inspired gas was varied by cycling the anesthesia carrier gas from oxygen to air
and back to oxygen. T, measurements taken using a 7 T MRI system were as expected with a
higher oxygen content resulting in a lower Ty and a higher image intensity, and vice versa. The
response was found to be completely reversible as well.
7.2 Recommendation for future studies
Alternative formulations of the 70% DDMPS-PDMS material may be considered so as to further
ease sensor implantation in vivo without comprising the T; response to oxygen. One such
formulation could be a suspension of 70% DDMPS-PDMS microparticles in water. Although
mechanisms of microparticle agglomeration into a solid depot in vivo will need to be
investigated, this could be a particularly attractive proposition given that a much finer gauge
needle could be used. Siloxane based chemistries may further be explored to achieve covalent
cross-linking of oxygen sensitive siloxanes to a PDMS or PDMS-like backbone. Such a
covalently bound, cross-linked polymer would have the advantage of being thermally stable and
without the potential issue of losing the volatile oxygen sensitive components over longer
periods of time.
A pilot study of the in vivo T, response to inspired gas with varying oxygen concentrations
directly after implantation was presented in this thesis. A longer study is underway which would
enable us to track the changes in T, response to inspired oxygen over time. Such a study would
be helpful in assessing the stability of the device (response) for longer implantation times. The
effect of the device on surrounding tissue due to a long-term implant will also be studied via
histology upon completion of the study. Animal models for compartment syndrome and tumor
hypoxia will need to be developed in the future so as to test the performance of the material for
oxygen sensing in these clinically important conditions as well.
55

56

References
[1] R.M. Leach and D.F. Treacher. "Tissue Hypoxia." British Medical Journal, vol. 317, pp.1370-1373, 1998.
[2] H.K. Said, N.K. Roy, A.N. Gurjala, and T.A. Mustoe. "Quantifying tissue level ischemia:hypoxia response element-luciferase transfection in a rabbit ear model." Wound Repairand Regeneration, vol. 17, pp. 473-439, 2009.
[3] "Compartment syndrome (CS) and the role of fasciotomy in extremity war wounds," inthe Joint Theater Trauma System Clinical Practice Guideline. [Online]. Available:www.usaisr.amedd.army.mil/assets/cpgs/Compartment Syndrome andFasciotomy 9 Mar 12.pdf . March, 2012.
[4] M. T. Jobe. "Compartment syndromes and Volkmann contracture," in Campbell'sOperative Orthopaedics, 11 t" ed., vol. 4. S.T. Canale and J.H. Beaty, Ed. Philadelphia:Mosby, 2008, pp. 4259-4273.
[5] C. Middleton. "Compartment syndrome: the importance of early diagnosis." NursingTimes, vol. 99, pp. 30-32, 2003.
[6] K.G.B. Elliott and A.J. Johnstone. "Diagnosing acute compartment syndrome." JournalofBone & Joint Surgery, vol. 85, pp. 625-632, 2003.
[7] A. Seekamp, M. Van Griensven, H. Blankenburg and G. Regel. "Intramuscular partialoxygen tension monitoring in compartment syndrome-an experimental study."European Journal of Emergency Medicine, vol. 4, pp. 185-192,1997.
[8] P. Vaupel and L. Harrison. "Tumor hypoxia: causative factors, compensatorymechanisms, and cellular response." The Oncologist, vol. 9, pp. 4-9, 2004.
[9] L.B. Harrison, M. Chadha, R.J. Hill, K. Hu and D. Shasha. "Impact of tumor hypoxia andanemia on radiation therapy outcomes." The Oncologist, vol. 7, pp. 492-508, 2002.
[10] J.Z. Wang, X.A. Li and N.A. Mayr. "Dose escalation to combat hypoxia in prostatecancer: a radiobiological study on clinical data." British Journal of Radiology, vol. 79,pp. 905-911, 2006.
[11] P.W. Vaupel, D.K. Kelleher and M. Gunderoth, Ed. Tumor Oxygenation. New York:Fischer, 1995.
[12] H.B. Stone, J.M. Brown, T.L. Phillips and R.M. Sutherland. "Oxygen in human tumors:correlations between methods of measurement and response to therapy." RadiationResearch, vol. 136, pp. 422-434, 1993.
57

[13] E.F. Di Martino, B. Gagel, 0 Schramm, P. Maneschi and M. Westhofen. "Evaluation oftumor oxygenation by color duplex sonography: a new approach." Otolaryngology Head& Neck Surgery, vol. 132, pp. 765-769, 2005.
[14] P. Vaupel, K. Schlenger, C. Knoop and M. Hockel. "Oxygenation of human tumors:evaluation of tissue oxygen distribution in breast cancers by computerized 02 tensionmeasurements." Cancer Research, vol. 51, pp. 3316-3322, 1991.
[15] B. Movsas, J.D. Chapman, A.L. Hanlon, E.M. Horwitz, W.H. Pinover, R.E. Greenberg,C. Stobbe and G.E. Hanks. "Hypoxia in human prostate carcinoma: an Eppendorf pO2study." American Journal of Clinical Oncology, vol. 24, pp. 458-461, 2001.
[16] R.A. Gatenby, H.B. Kessler, J.S. Rosenblum, L.R. Coia, P.J. Moldofsky, W.H. Hartz andG.J. Broder. "Oxygen distribution in squamous cell carcinoma metastases and itsrelationship to outcome of radiation therapy." International Journal of RadiationOncology Biology Physics, vol. 14, pp. 831-838, 1988.
[17] C. Bittenbender. "Compartment syndrome vs. crush syndrome," presented at the 1 0 th mtConf. NCEMSF, Washington D.C., USA, 2003.
[18] D.E. Detmer, K. Sharpe, R.L. Sufit and F.M. Girdley. "Chronic compartment syndrome:diagnosis, management, and outcomes." American Journal of Sports Medicine, vol. 13,pp. 162-170, 1985.
[19] R.B. Heppenstall. "An update in compartment syndrome investigation and treatment."University ofPennsylvania Orthopedic Journal, vol. 10, pp. 49-57, 1997.
[20] L.R. Mohler, J.R. Styf, R.A. Pedowitz, A.R. Hargens and D.H. Gershuni. "Intramusculardeoxygenation during exercise in patients who have chronic anterior compartmentsyndrome." Journal ofBone & Joint Surgery, vol. 79, pp. 844-849, 1997.
[21] A. Uliasz, J.T. Ishida, J.K. Fleming and L.G. Yamamoto. "Comparing the methods ofmeasuring compartment pressured in acute compartment syndrome." American JournalofEmergency Medicine, vol. 21, pp. 143-145, 2003.
[22] J.D. Chapman, L.R. Coia, C.C. Stobbe, E.L. Engelhardt, M.C. Fenning and R.F.Schneider. "Prediction of tumor hypoxia and radioresistance with nuclear medicinemarkers." British Journal of Cancer, vol. 74, pp. S204-S208.
[23] J. Jiang, L. Gao, W. Zhong, S. Meng, B. Yong, Y. Song, X. Wang and C. Bai."Development of fiber optic fluorescence oxygen sensor in both in vitro and in vivosystems." Respiratory Physiology & Neurobiology, vol. 161, pp. 160-166, 2008.
[24] X. Xiong, D. Xiao and M.M. Choi. "Dissolved oxygen sensor based on fluorescencequenching of oxygen-sensitive ruthenium complex immobilized on silica-Ni-P compositecoating." Sensors and Actuators B, vol. 117, pp. 172-176, 2006.
58

[25] D.F. Wilson, S. Gomi, A. Pastuszko and J.H. Greenberg. "Microvascular damage in thecortex of cat brain from middle cerebral artery occlusion and reperfusion." Journal ofApplied Physiology, vol. 74, pp. 580-589, 1993.
[26] P. Babilas, P. Lamby, L. Prantl, S. Schreml, E.M. Jung, G. Liebsch, O.S. Wolfbeis, M.Landthaler, R.M. Szeimies and C. Abels. "Transcutaneous p02 imaging duringtourniquet-induced forearm ischemia using planar optical oxygen sensors." Skin Researchand Technology, vol. 14, pp. 304-311, 2008.
[27] B.B. Williams, N. Khan, B. Zaki, A. Hartford, M.S. Ernstoff and H.M. Swartz. "Clinicalelectron paramagnetic resonance (EPR) oximetry using India ink." AdvancedExperimental Medical Biology, vol. 662, pp. 149-156, 2010.
[28] S. Hunjan, R.P. Mason, A. Constantinescu, P. Peschke, E.W. Hahn and P.P. Antich.
"Regional tumor oximetry" 19F NMR spectroscopy of hexafluorobenzene." InternationalJournal of Radiation Oncology Biology Physics, vol. 41, pp. 161-171, 1998.
[29] K. Golman, L.E. Olsson, 0. Axelsson, S. Mansson, M. Karlsson and J.S. Petersson."Molecular imaging using hyperpolarized 13C." British Journal of Radiology, vol. 76, pp.S118-S127, 2003.
[30] Y. Wu, T.G. Reese, H. Cao, M.I. Hrovat, S.P. Toddes, R.A. Lemdiasov and J.L.Ackerman. "Bone mineral imaged in vivo by 3 1P solid state MRI of human wrists."Journal ofMagnetic Resonance Imaging, vol. 34, pp. 623-633, 2011.
[31] "Pure silicone fluid 2cSt dodecamethylpentasiloxane," in CLEARCO ProductInformation Catalogue. [Online]. Available: www.clearcoproducts.com/pdf/volatile/NP-PSF-2cSt.pdf . (Accessed Dec. 2012).
[32] Y. Ling, T. Pong, C. Vassiliou, P.L. Huang and M.J. Cima. "Implantable magneticrelaxation sensors measure cumulative exposure to cardiac biomarkers." NatureBiotechnology, vol. 29, pp. 273-277, 2011.
[33] J. Curtis and A. Colas. "Medical applications of silicones," in Biomaterials Science, 2 "ded. B.D. Ratner, A.S. Hoffman, F.J. Schoen and J.E. Lemons, Ed. Philadelphia: Elsevier,2004, pp. 697-707.
[34] "Blood gases," on MedLine Plus, U.S. National Library of Medicine, National Institutesof Health. [Online]. Available: www.nlm.nih.gov/medlineplus/ency/article/003855.htm .(Accessed Dec. 2012).
[35] H. Zhang and A. Cloud. "The permeability characteristics of silicone rubber," presentedat SAMPE Fall Technical Conf., Dallas, TX, 2006.
59

[36] S. Chowdhury, V.R. Bhethanabotla and R. Sen. "Measurement of diffusion coefficient ofoxygen in FRP using luminescence quenching," presented at ACMA Composites &Polycon, Tampa, FL, 2007.
[37] T.Y. Katircioglu, H.Y. Kaptan and 0. Guven. "Determination of oxygen diffusioncoefficient of poly(methacrylonitrile) II and the calculation of diffusion activationenergy." Journal ofApplied Polymer Science, vol. 74, pp. 1108-1118, 1999.
[38] K.F. Webb and A.S. Teja. "Solubility and diffusion of carbon dioxide in polymers."Fluid Phase Equilibria, vol. 158, pp. 1029-1034, 1999.
[39] J. Crank. The Mathematics ofDiffusion. Oxford, UK: Oxford, 1956.
[40] J. Crank. The Mathematics ofDiffusion. Oxford, UK: Oxford, 1975.
[41] D.G. Nishimura. Principles ofMagnetic Resonance Imaging. CA, USA: Lulu, 2010.
60