Embed Size (px)
Citation preview
Initiative for Policy Dialogue Working Paper Series
October 2009
Korea’s Tax System: A Growth-Oriented Choice
Joosung Jun
Tax
No part of this working paper may be reproduced or utilized in any form or by any means, electronic or mechanical, including photocopying, recording, or by information storage or
retrieval system, without permission from the Initiative for Policy Dialogue.
Korea’s Tax System: A Growth-Oriented Choice
Joosung Jun
Ewha University
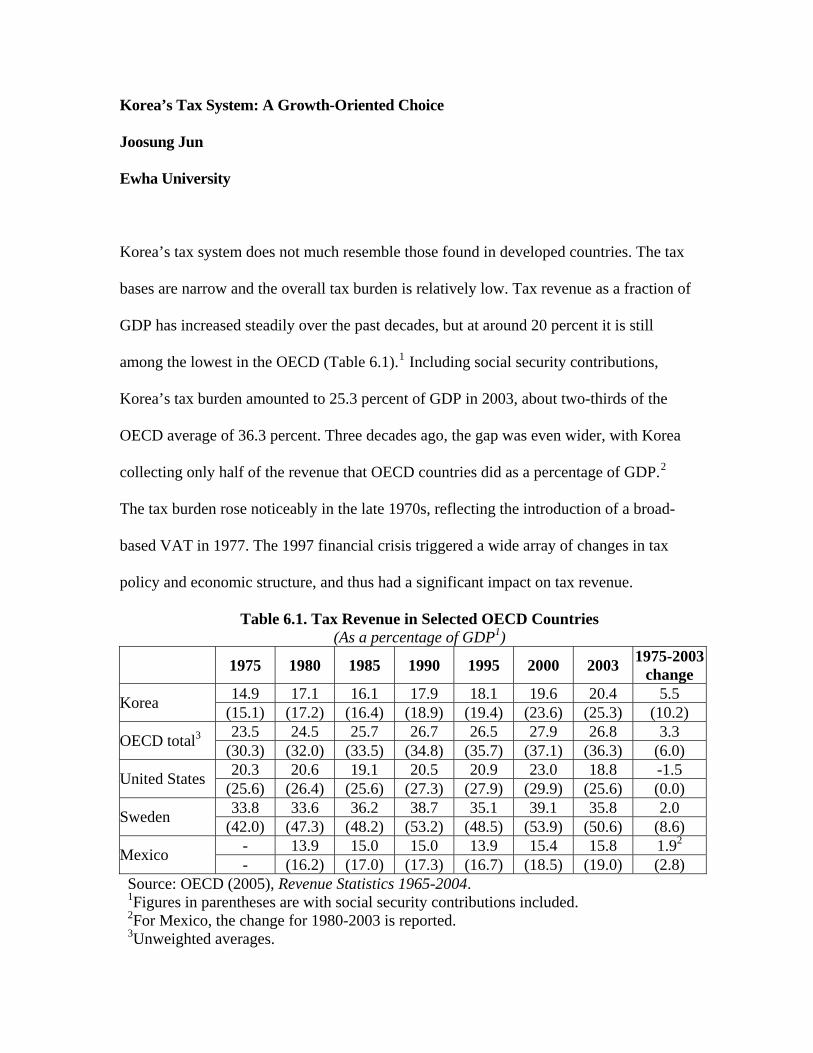
Korea’s tax system does not much resemble those found in developed countries. The tax
bases are narrow and the overall tax burden is relatively low. Tax revenue as a fraction of
GDP has increased steadily over the past decades, but at around 20 percent it is still
among the lowest in the OECD (Table 6.1).1 Including social security contributions,
Korea’s tax burden amounted to 25.3 percent of GDP in 2003, about two-thirds of the
OECD average of 36.3 percent. Three decades ago, the gap was even wider, with Korea
collecting only half of the revenue that OECD countries did as a percentage of GDP.2
The tax burden rose noticeably in the late 1970s, reflecting the introduction of a broad-
based VAT in 1977. The 1997 financial crisis triggered a wide array of changes in tax
policy and economic structure, and thus had a significant impact on tax revenue.
Table 6.1. Tax Revenue in Selected OECD Countries (As a percentage of GDP1)
1975 1980 1985 1990 1995 2000 2003 1975-2003
change 14.9 17.1 16.1 17.9 18.1 19.6 20.4 5.5
Korea (15.1) (17.2) (16.4) (18.9) (19.4) (23.6) (25.3) (10.2) 23.5 24.5 25.7 26.7 26.5 27.9 26.8 3.3
OECD total3 (30.3) (32.0) (33.5) (34.8) (35.7) (37.1) (36.3) (6.0) 20.3 20.6 19.1 20.5 20.9 23.0 18.8 -1.5
United States (25.6) (26.4) (25.6) (27.3) (27.9) (29.9) (25.6) (0.0) 33.8 33.6 36.2 38.7 35.1 39.1 35.8 2.0
Sweden (42.0) (47.3) (48.2) (53.2) (48.5) (53.9) (50.6) (8.6)
- 13.9 15.0 15.0 13.9 15.4 15.8 1.92 Mexico
- (16.2) (17.0) (17.3) (16.7) (18.5) (19.0) (2.8) Source: OECD (2005), Revenue Statistics 1965-2004. 1Figures in parentheses are with social security contributions included. 2For Mexico, the change for 1980-2003 is reported. 3Unweighted averages.
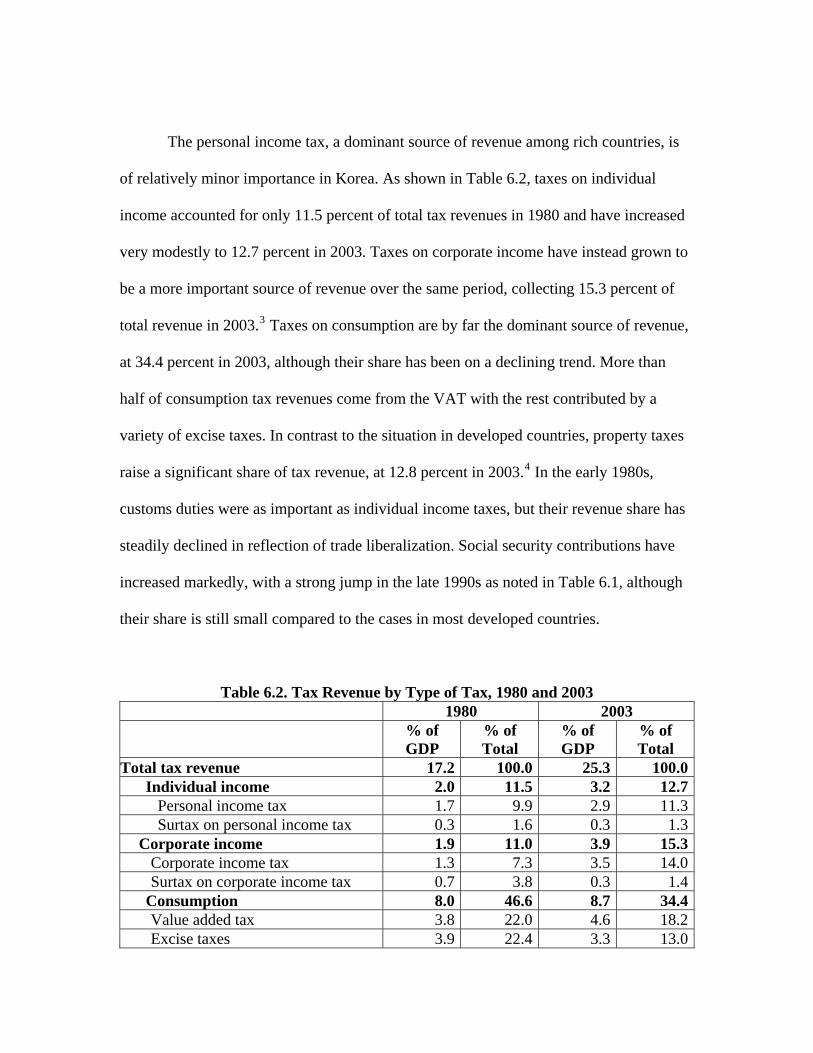
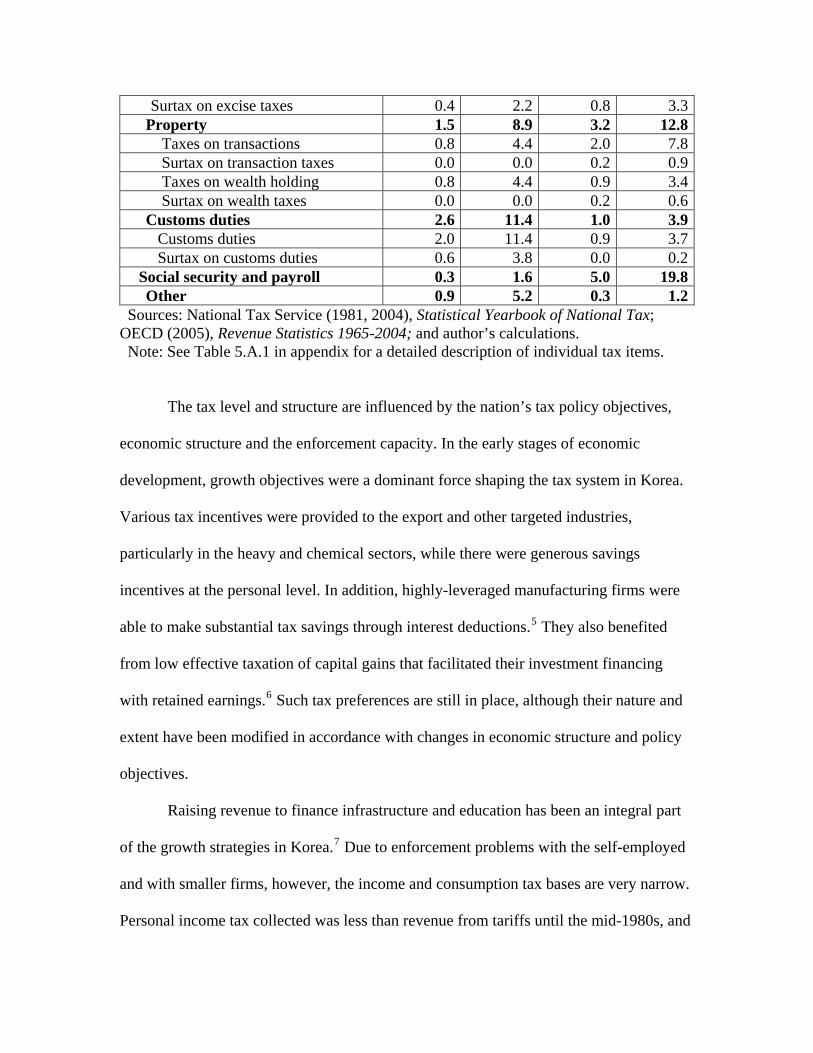
The personal income tax, a dominant source of revenue among rich countries, is
of relatively minor importance in Korea. As shown in Table 6.2, taxes on individual
income accounted for only 11.5 percent of total tax revenues in 1980 and have increased
very modestly to 12.7 percent in 2003. Taxes on corporate income have instead grown to
be a more important source of revenue over the same period, collecting 15.3 percent of
total revenue in 2003.3 Taxes on consumption are by far the dominant source of revenue,
at 34.4 percent in 2003, although their share has been on a declining trend. More than
half of consumption tax revenues come from the VAT with the rest contributed by a
variety of excise taxes. In contrast to the situation in developed countries, property taxes
raise a significant share of tax revenue, at 12.8 percent in 2003.4 In the early 1980s,
customs duties were as important as individual income taxes, but their revenue share has
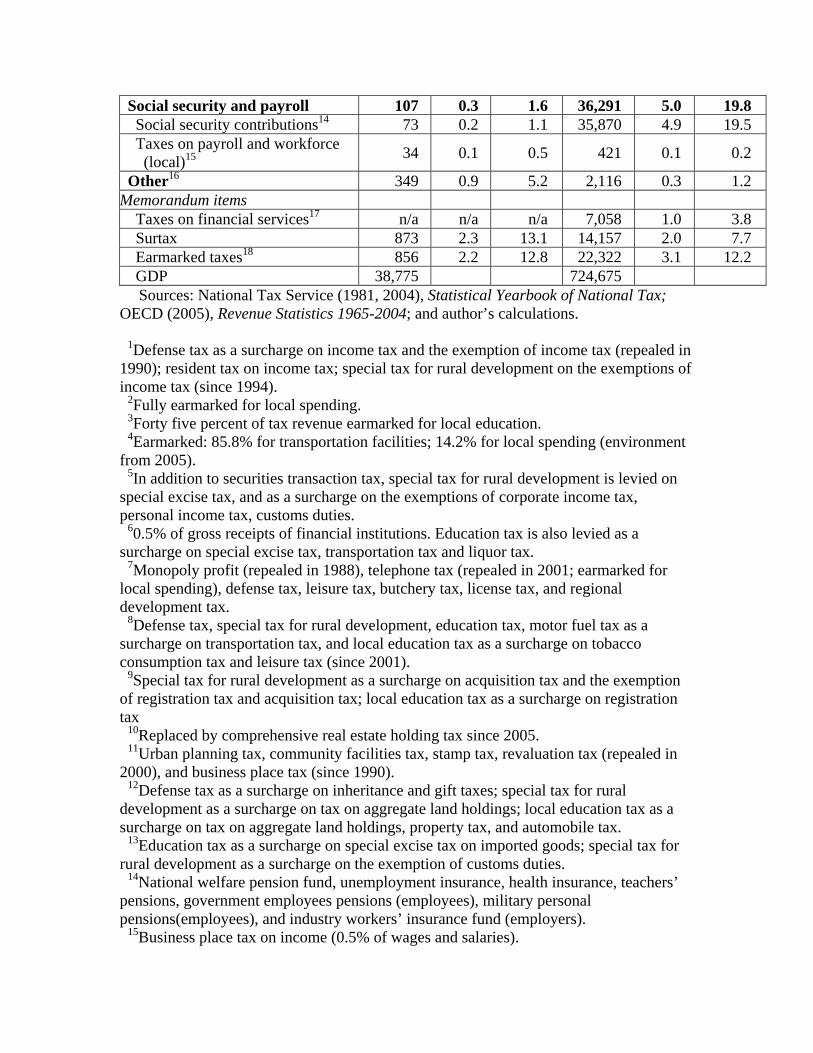
steadily declined in reflection of trade liberalization. Social security contributions have
increased markedly, with a strong jump in the late 1990s as noted in Table 6.1, although
their share is still small compared to the cases in most developed countries.
Table 6.2. Tax Revenue by Type of Tax, 1980 and 2003 1980 2003
% of GDP
% of Total
% of GDP
% of Total
Total tax revenue 17.2 100.0 25.3 100.0Individual income 2.0 11.5 3.2 12.7 Personal income tax 1.7 9.9 2.9 11.3 Surtax on personal income tax 0.3 1.6 0.3 1.3
Corporate income 1.9 11.0 3.9 15.3 Corporate income tax 1.3 7.3 3.5 14.0 Surtax on corporate income tax 0.7 3.8 0.3 1.4
Consumption 8.0 46.6 8.7 34.4 Value added tax 3.8 22.0 4.6 18.2 Excise taxes 3.9 22.4 3.3 13.0
Surtax on excise taxes 0.4 2.2 0.8 3.3Property 1.5 8.9 3.2 12.8 Taxes on transactions 0.8 4.4 2.0 7.8 Surtax on transaction taxes 0.0 0.0 0.2 0.9 Taxes on wealth holding 0.8 4.4 0.9 3.4 Surtax on wealth taxes 0.0 0.0 0.2 0.6
Customs duties 2.6 11.4 1.0 3.9 Customs duties 2.0 11.4 0.9 3.7 Surtax on customs duties 0.6 3.8 0.0 0.2
Social security and payroll 0.3 1.6 5.0 19.8Other 0.9 5.2 0.3 1.2
Sources: National Tax Service (1981, 2004), Statistical Yearbook of National Tax; OECD (2005), Revenue Statistics 1965-2004; and author’s calculations. Note: See Table 5.A.1 in appendix for a detailed description of individual tax items.
The tax level and structure are influenced by the nation’s tax policy objectives,
economic structure and the enforcement capacity. In the early stages of economic
development, growth objectives were a dominant force shaping the tax system in Korea.
Various tax incentives were provided to the export and other targeted industries,
particularly in the heavy and chemical sectors, while there were generous savings
incentives at the personal level. In addition, highly-leveraged manufacturing firms were
able to make substantial tax savings through interest deductions.5 They also benefited
from low effective taxation of capital gains that facilitated their investment financing
with retained earnings.6 Such tax preferences are still in place, although their nature and
extent have been modified in accordance with changes in economic structure and policy
objectives.
Raising revenue to finance infrastructure and education has been an integral part
of the growth strategies in Korea.7 Due to enforcement problems with the self-employed
and with smaller firms, however, the income and consumption tax bases are very narrow.
Personal income tax collected was less than revenue from tariffs until the mid-1980s, and
most of the corporate and value-added taxes have been paid by a limited number of large
corporations. Until recently, the revenue contribution of the VAT, which is the most
broad-based tax, seldom exceeded 4 percent of GDP.8
To compensate for this revenue shortfall, the Korean government made extensive
use of earmarked taxes, which appeared to arouse less resistance from taxpayers. Its lack
of enforcement capacity also led the government to impose flat-rate withholding taxes on
most capital incomes and to tax property transactions more heavily than property
holdings.9 About two-thirds of property-related revenue comes from transaction taxes
(Table 6.2), which face less resistance from the taxpayer than holding taxes. Also
noticeable has been the wide use of surtaxes, levied on top of other taxes payable. Such
“hidden taxes” amounted to about 8 percent of total revenue in 2003.10
Overall, the Korean tax system has not evolved along the lines found in
developed countries. Efficiency and equity have been emphasized as the guiding
principles in most tax debates, but actual tax policy has focused more on specific policy
objectives: promoting savings, investment, and R&D, as well as securing sufficient
revenue to finance pubic infrastructure and education. Korea’s tax policy has thus been
highly growth-oriented. At the same time, the tax structure appears to have been
influenced by various enforcement problems. It is argued in this paper that many of the
tax incentives provided might have served not so much the purpose of promoting targeted
activities as keeping taxpayers from disappearing into the informal sector. Generous non-
tax compensations have also been available for heavily-taxed large corporations. To the
extent that these preferences have supported tax base protection by mitigating evasion
pressures, the revenue and efficiency costs associated with them in most discussions of
Korean tax policy have been overstated.
In a word, tax design in Korea has reflected its own unique policy objectives and
economic structure, which differ significantly from those in other countries. Unless these
underlying factors change, more conventional tax policies observed among developed
countries should be considered with caution.
This paper provides a critical review of Korea’s tax system, summarizing its key
statutory features and emphasizing the ways in which enforcement problems as well as
policy objectives influence tax design. We begin by describing the basic structure of the
tax system. The following section then examines the implications of growth objectives
and tax enforcement for tax design. We next consider the impact of the 1997 financial
crisis on the nation’s economic structure and policy objectives and the resulting changes
in the tax revenue structure. The final section concludes by summarizing key challenges
facing the system.
The Basic Structure
The Korean tax system is highly complex, as illustrated in Table 6.3,11 with taxes being
collected both at the national and the local level. National taxes consist of three groups:
internal taxes, three officially earmarked taxes,12 and customs duties. As of 2003, the
personal and corporate income taxes and the VAT accounted for about half of total tax
revenue or 70 percent of national taxes.13 While only 22.4 percent of tax revenue was
collected at the local level, local governments accounted for more than half of total
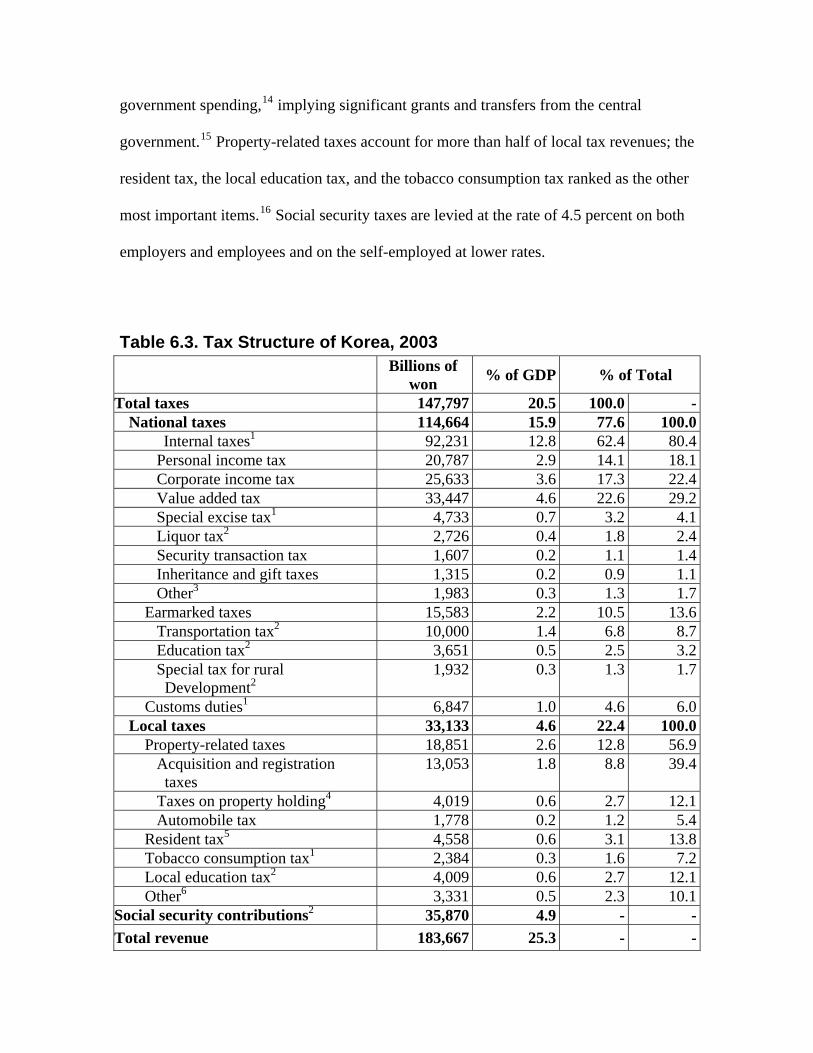
government spending,14 implying significant grants and transfers from the central
government.15 Property-related taxes account for more than half of local tax revenues; the
resident tax, the local education tax, and the tobacco consumption tax ranked as the other
most important items.16 Social security taxes are levied at the rate of 4.5 percent on both
employers and employees and on the self-employed at lower rates.
Table 6.3. Tax Structure of Korea, 2003
Billions of
won % of GDP % of Total
Total taxes 147,797 20.5 100.0 -National taxes 114,664 15.9 77.6 100.0
Internal taxes1 92,231 12.8 62.4 80.4 Personal income tax 20,787 2.9 14.1 18.1 Corporate income tax 25,633 3.6 17.3 22.4 Value added tax 33,447 4.6 22.6 29.2 Special excise tax1 4,733 0.7 3.2 4.1 Liquor tax2 2,726 0.4 1.8 2.4 Security transaction tax 1,607 0.2 1.1 1.4 Inheritance and gift taxes 1,315 0.2 0.9 1.1 Other3 1,983 0.3 1.3 1.7 Earmarked taxes 15,583 2.2 10.5 13.6 Transportation tax2 10,000 1.4 6.8 8.7 Education tax2 3,651 0.5 2.5 3.2 Special tax for rural Development2
1,932 0.3 1.3 1.7
Customs duties1 6,847 1.0 4.6 6.0Local taxes 33,133 4.6 22.4 100.0 Property-related taxes 18,851 2.6 12.8 56.9 Acquisition and registration taxes
13,053 1.8 8.8 39.4
Taxes on property holding4 4,019 0.6 2.7 12.1 Automobile tax 1,778 0.2 1.2 5.4 Resident tax5 4,558 0.6 3.1 13.8 Tobacco consumption tax1 2,384 0.3 1.6 7.2 Local education tax2 4,009 0.6 2.7 12.1 Other6 3,331 0.5 2.3 10.1
Social security contributions2 35,870 4.9 - -
Total revenue 183,667 25.3 - -
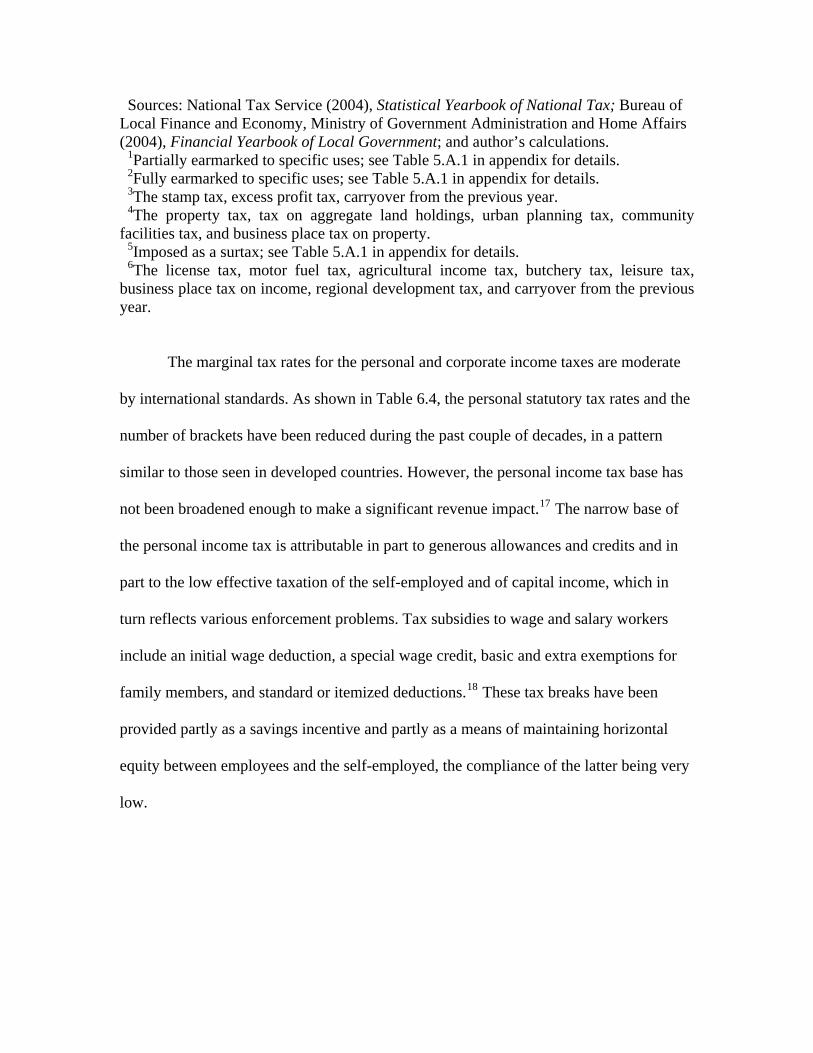
Sources: National Tax Service (2004), Statistical Yearbook of National Tax; Bureau of Local Finance and Economy, Ministry of Government Administration and Home Affairs (2004), Financial Yearbook of Local Government; and author’s calculations. 1Partially earmarked to specific uses; see Table 5.A.1 in appendix for details. 2Fully earmarked to specific uses; see Table 5.A.1 in appendix for details. 3The stamp tax, excess profit tax, carryover from the previous year. 4The property tax, tax on aggregate land holdings, urban planning tax, community facilities tax, and business place tax on property. 5Imposed as a surtax; see Table 5.A.1 in appendix for details. 6The license tax, motor fuel tax, agricultural income tax, butchery tax, leisure tax, business place tax on income, regional development tax, and carryover from the previous year.
The marginal tax rates for the personal and corporate income taxes are moderate
by international standards. As shown in Table 6.4, the personal statutory tax rates and the
number of brackets have been reduced during the past couple of decades, in a pattern
similar to those seen in developed countries. However, the personal income tax base has
not been broadened enough to make a significant revenue impact.17 The narrow base of
the personal income tax is attributable in part to generous allowances and credits and in
part to the low effective taxation of the self-employed and of capital income, which in
turn reflects various enforcement problems. Tax subsidies to wage and salary workers
include an initial wage deduction, a special wage credit, basic and extra exemptions for
family members, and standard or itemized deductions.18 These tax breaks have been
provided partly as a savings incentive and partly as a means of maintaining horizontal
equity between employees and the self-employed, the compliance of the latter being very
low.
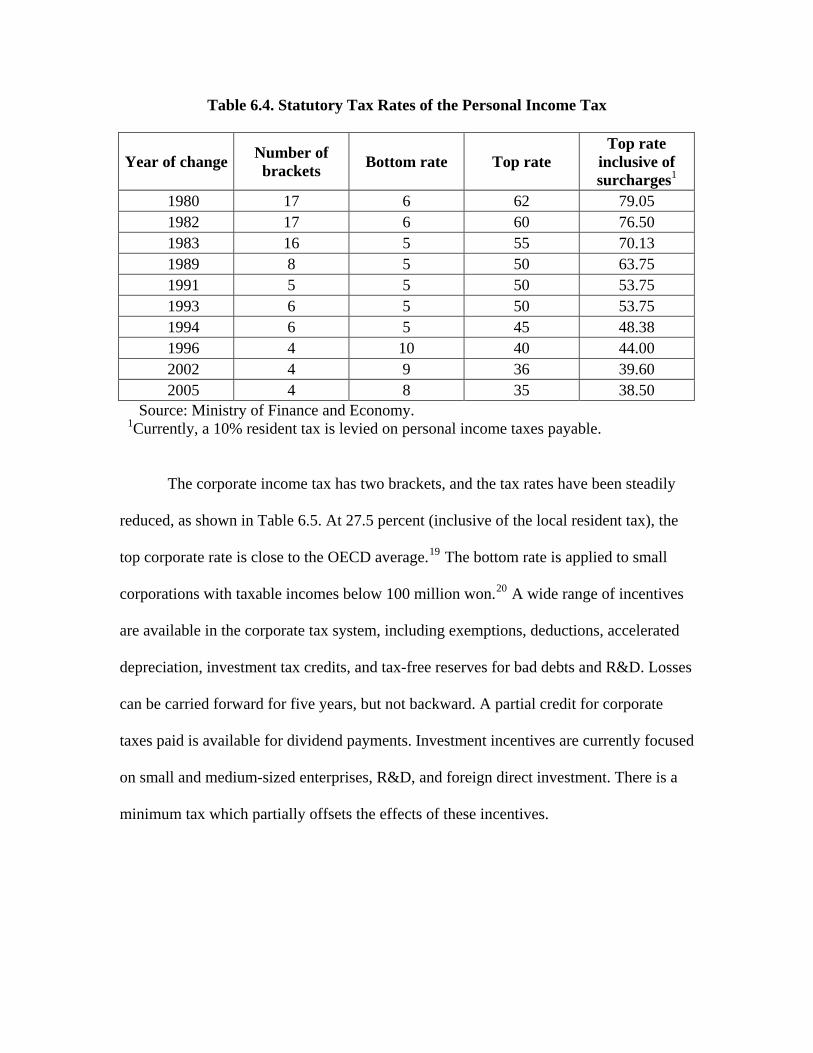
Table 6.4. Statutory Tax Rates of the Personal Income Tax
Year of change Number of brackets
Bottom rate Top rate Top rate
inclusive of surcharges1
1980 17 6 62 79.05 1982 17 6 60 76.50 1983 16 5 55 70.13 1989 8 5 50 63.75 1991 5 5 50 53.75 1993 6 5 50 53.75 1994 6 5 45 48.38 1996 4 10 40 44.00 2002 4 9 36 39.60 2005 4 8 35 38.50
Source: Ministry of Finance and Economy. 1Currently, a 10% resident tax is levied on personal income taxes payable.
The corporate income tax has two brackets, and the tax rates have been steadily
reduced, as shown in Table 6.5. At 27.5 percent (inclusive of the local resident tax), the
top corporate rate is close to the OECD average.19 The bottom rate is applied to small
corporations with taxable incomes below 100 million won.20 A wide range of incentives
are available in the corporate tax system, including exemptions, deductions, accelerated
depreciation, investment tax credits, and tax-free reserves for bad debts and R&D. Losses
can be carried forward for five years, but not backward. A partial credit for corporate
taxes paid is available for dividend payments. Investment incentives are currently focused
on small and medium-sized enterprises, R&D, and foreign direct investment. There is a
minimum tax which partially offsets the effects of these incentives.
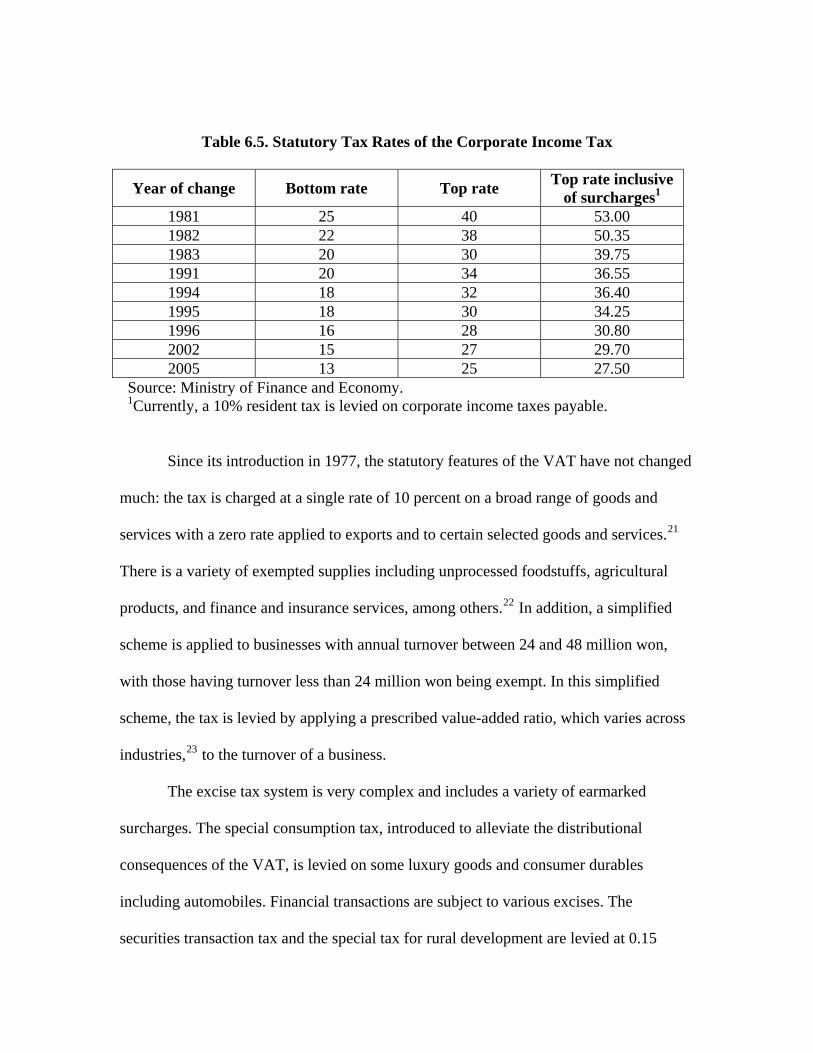
Table 6.5. Statutory Tax Rates of the Corporate Income Tax
Year of change Bottom rate Top rate Top rate inclusive
of surcharges1 1981 25 40 53.00 1982 22 38 50.35 1983 20 30 39.75 1991 20 34 36.55 1994 18 32 36.40 1995 18 30 34.25 1996 16 28 30.80 2002 15 27 29.70 2005 13 25 27.50
Source: Ministry of Finance and Economy. 1Currently, a 10% resident tax is levied on corporate income taxes payable.
Since its introduction in 1977, the statutory features of the VAT have not changed
much: the tax is charged at a single rate of 10 percent on a broad range of goods and
services with a zero rate applied to exports and to certain selected goods and services.21
There is a variety of exempted supplies including unprocessed foodstuffs, agricultural
products, and finance and insurance services, among others.22 In addition, a simplified
scheme is applied to businesses with annual turnover between 24 and 48 million won,
with those having turnover less than 24 million won being exempt. In this simplified
scheme, the tax is levied by applying a prescribed value-added ratio, which varies across
industries,23 to the turnover of a business.
The excise tax system is very complex and includes a variety of earmarked
surcharges. The special consumption tax, introduced to alleviate the distributional
consequences of the VAT, is levied on some luxury goods and consumer durables
including automobiles. Financial transactions are subject to various excises. The
securities transaction tax and the special tax for rural development are levied at 0.15
percent each on the value of stock transactions on the Korea Stock Exchange.24 The
education tax is imposed on the gross receipts of financial institutions, at 0.5 percent.
Earmarking is important in Korea. The three national earmarked taxes alone
provided 10.6 percent of total and 13.6 percent of national taxes. In addition, the revenues
from the special excise tax on automobile sales and the liquor tax are also earmarked to
finance certain specific expenditure needs.25 At the local level, the revenues from the
local education tax and about half of revenues from the tobacco tax are earmarked to
finance local education. Bird and Jun (2005) estimated the total revenue from earmarked
taxes to be 3.5 percent of GDP or 17.2 percent of total taxes collected, or about as much
as the corporate income tax. In addition to these earmarked taxes, a fixed proportion of
internal tax revenue is earmarked for central government grants.26 If these grants are
taken into account, almost 35 percent of total tax revenue was earmarked in 2003.27
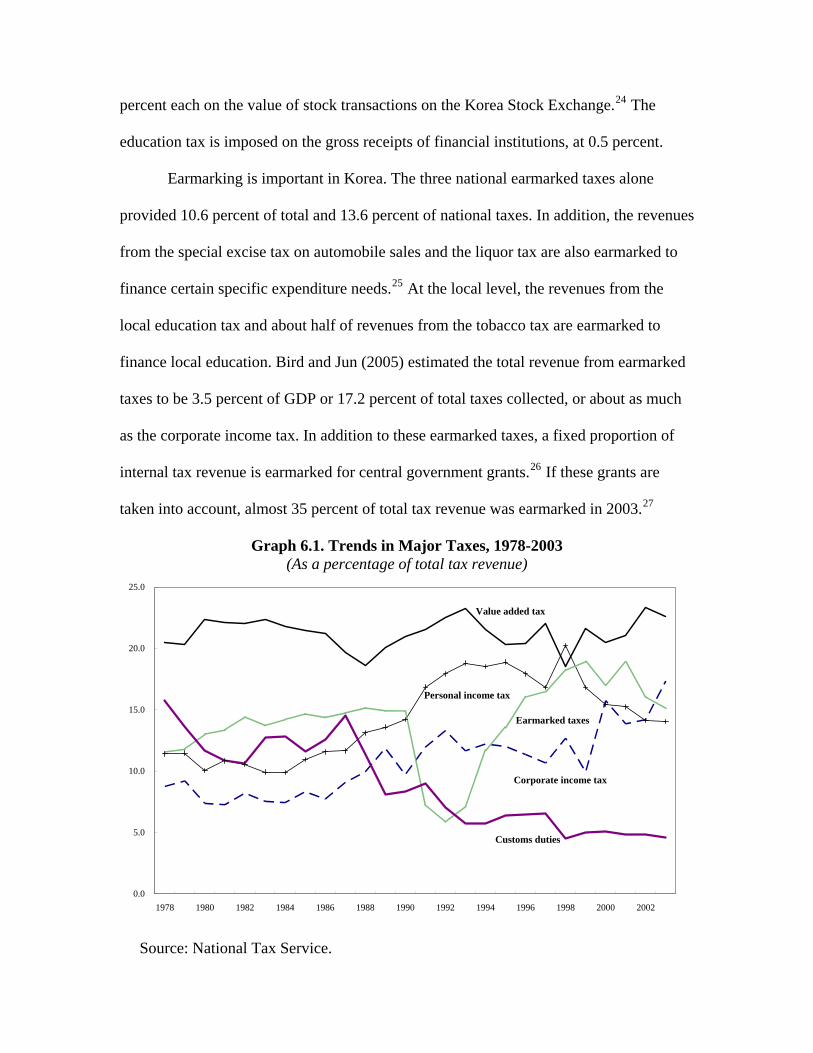
Graph 6.1. Trends in Major Taxes, 1978-2003 (As a percentage of total tax revenue)
Personal income tax
Corporate income tax
Value added tax
Earmarked taxes
Customs duties
0.0
5.0
10.0
15.0
20.0
25.0
1978 1980 1982 1984 1986 1988 1990 1992 1994 1996 1998 2000 2002
Source: National Tax Service.
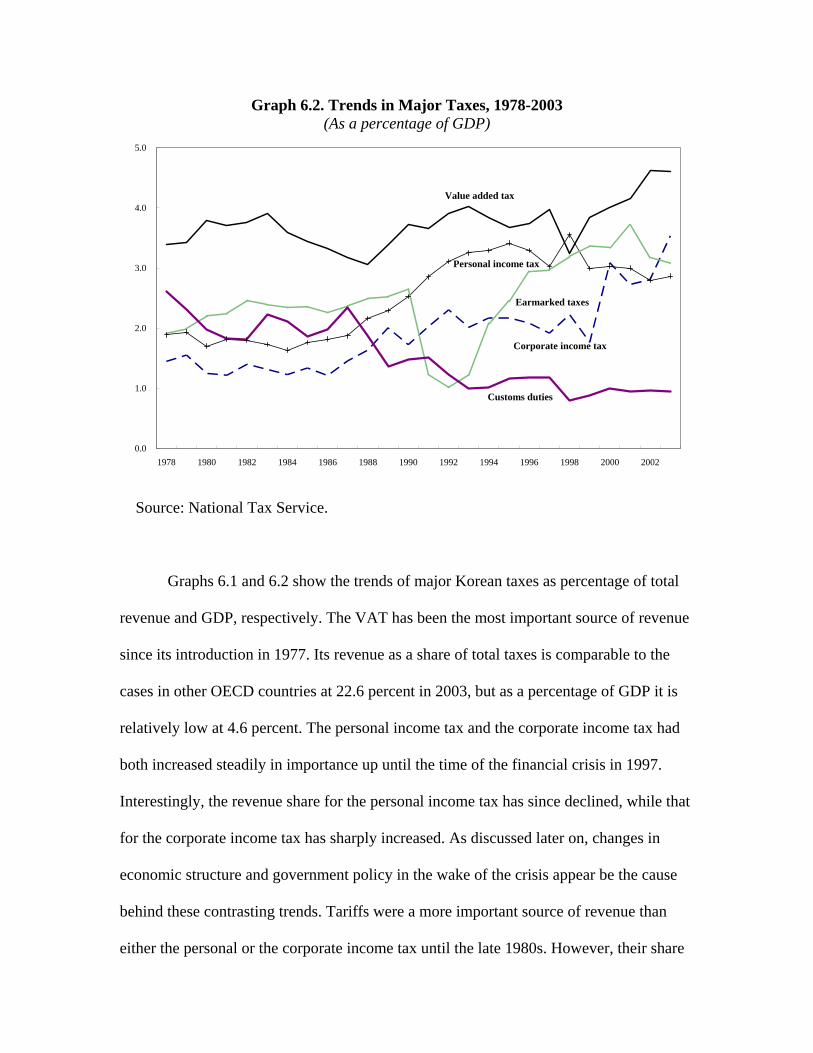
Graph 6.2. Trends in Major Taxes, 1978-2003 (As a percentage of GDP)
Personal income tax
Corporate income tax
Value added tax
Earmarked taxes
Customs duties
0.0
1.0
2.0
3.0
4.0
5.0
1978 1980 1982 1984 1986 1988 1990 1992 1994 1996 1998 2000 2002
Source: National Tax Service.
Graphs 6.1 and 6.2 show the trends of major Korean taxes as percentage of total
revenue and GDP, respectively. The VAT has been the most important source of revenue
since its introduction in 1977. Its revenue as a share of total taxes is comparable to the
cases in other OECD countries at 22.6 percent in 2003, but as a percentage of GDP it is
relatively low at 4.6 percent. The personal income tax and the corporate income tax had
both increased steadily in importance up until the time of the financial crisis in 1997.
Interestingly, the revenue share for the personal income tax has since declined, while that
for the corporate income tax has sharply increased. As discussed later on, changes in
economic structure and government policy in the wake of the crisis appear be the cause
behind these contrasting trends. Tariffs were a more important source of revenue than
either the personal or the corporate income tax until the late 1980s. However, their share
has since fallen sharply in accordance with the acceleration of free trade arrangements
during the 1990s. The graphs also show that with the exception of a few years in the early
1990s, earmarked taxes have been an important source of revenue throughout the period
shown.28
Growth Objectives and Tax Enforcement
In the setting of tax policy objectives in Korea, growth has come before redistribution.
Generous savings and investment incentives were provided to promote domestic capital
formation. Raising revenue to finance public infrastructure and education was another
central concern of tax policy. In contrast, the fiscal system has played a very limited role
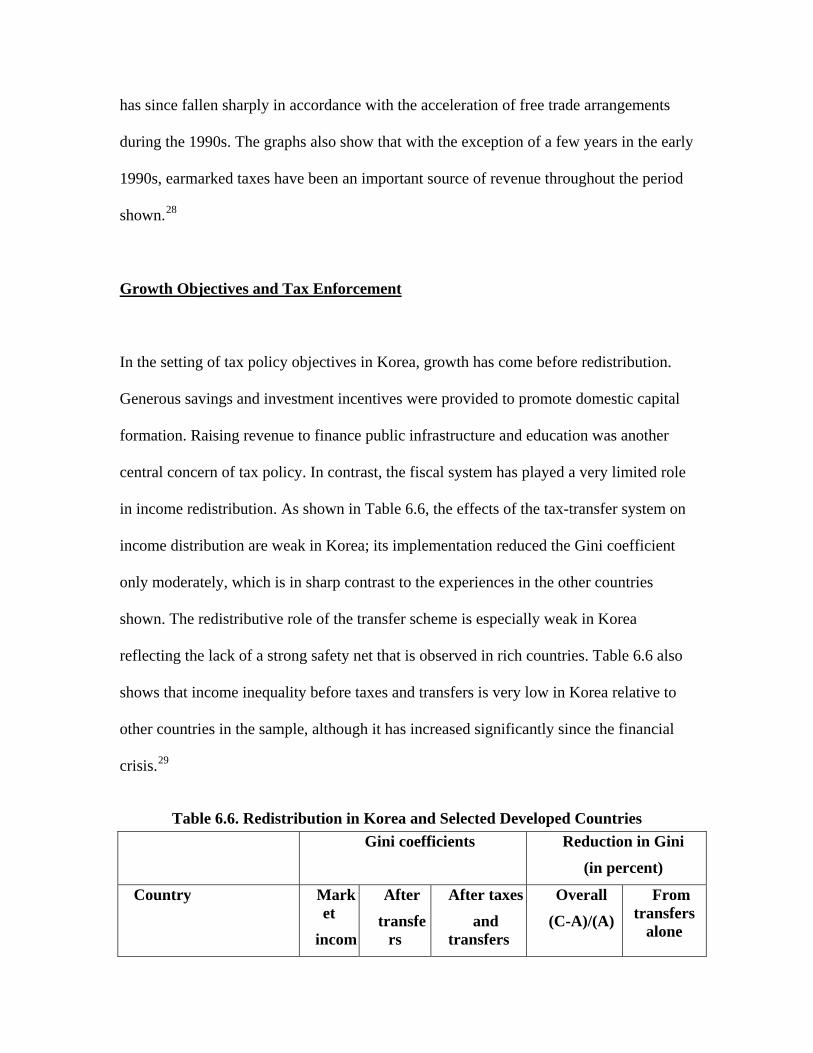
in income redistribution. As shown in Table 6.6, the effects of the tax-transfer system on
income distribution are weak in Korea; its implementation reduced the Gini coefficient
only moderately, which is in sharp contrast to the experiences in the other countries
shown. The redistributive role of the transfer scheme is especially weak in Korea
reflecting the lack of a strong safety net that is observed in rich countries. Table 6.6 also
shows that income inequality before taxes and transfers is very low in Korea relative to
other countries in the sample, although it has increased significantly since the financial
crisis.29
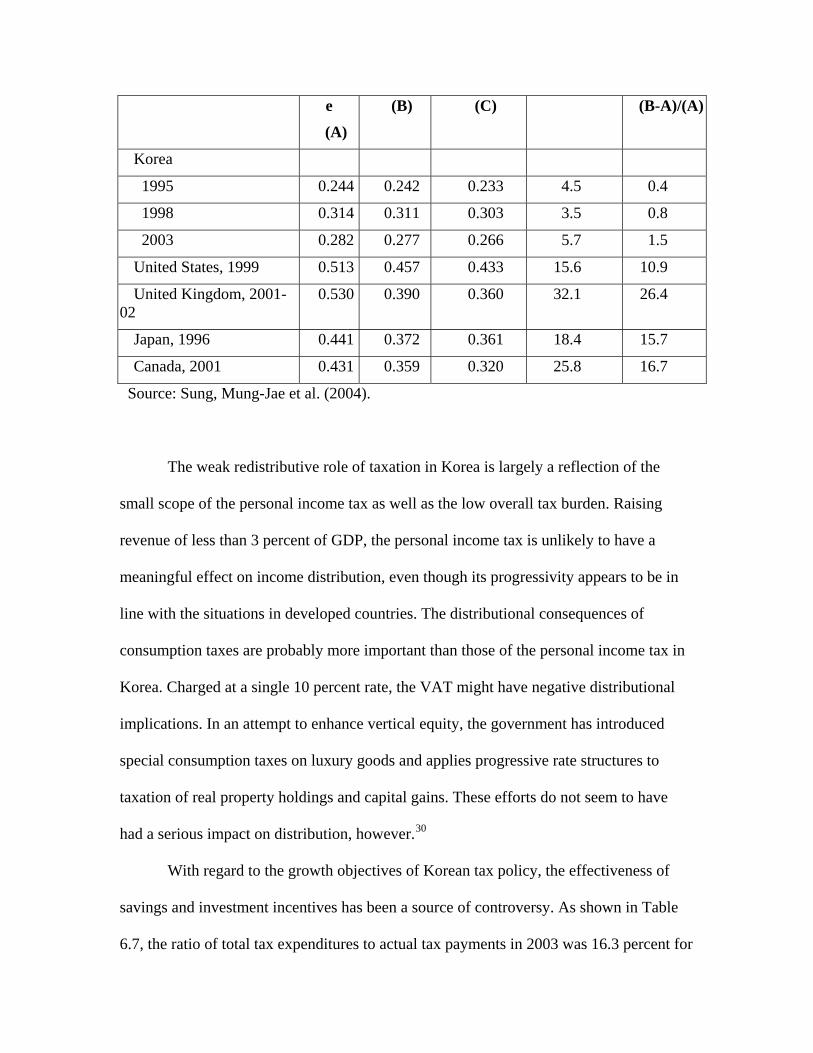
Table 6.6. Redistribution in Korea and Selected Developed Countries
Gini coefficients Reduction in Gini
(in percent)
Country
incomtransfe
rs
transfers (C-A)/(A) transfers
Market
After After taxes
and
Overall From
alone
e
(A)
(B) ) (B-A)/(A)(C
Korea
1995 0.244 0.242 0.233 4.5 0.4
1998 0.314 0.311 0.303 3.5 0.8
2003 0.282 0.277 0.266 5.7 1.5
United States, 1999 0.513 0.457 0.433 15.6 10.9
United Kingdom, 2001-02
0.530 0.390 0.360 32.1 26.4
Japan , 1996 0.441 0.372 0.361 18.4 15.7
Canada, 2001 0.431 0.359 0.320 25.8 16.7
Source: Sung, Mung-Jae et al. (2004).
The weak redistributive role of taxation in Korea is largely a reflection of the
small scope of the personal income tax as well as the low overall tax burden. Raising
revenue of less than 3 percent of GDP, the personal income tax is unlikely to have a
meaningful effect on income distribution, even though its progressivity appears to be in
line with the situations in developed countries. The distributional consequences of
consumption taxes are probably more important than those of the personal income tax in
Korea. Charged at a single 10 percent rate, the VAT might have negative distributional
implica
30
s of
6.7, the ratio of total tax expenditures to actual tax payments in 2003 was 16.3 percent for
tions. In an attempt to enhance vertical equity, the government has introduced
special consumption taxes on luxury goods and applies progressive rate structures to
taxation of real property holdings and capital gains. These efforts do not seem to have
had a serious impact on distribution, however.
With regard to the growth objectives of Korean tax policy, the effectivenes
savings and investment incentives has been a source of controversy. As shown in Table
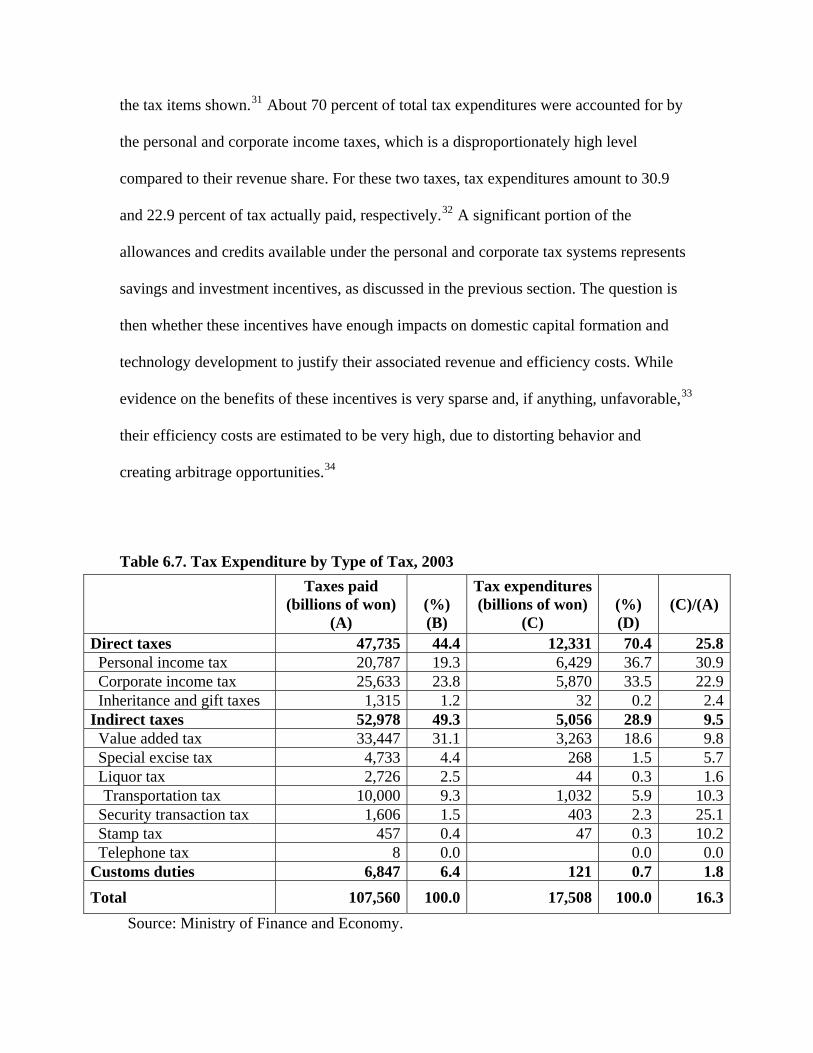
the tax items shown.31 About 70 percent of total tax expenditures were accounted
the personal and corporate income taxes, which is a disproportionately high level
compared to their revenue share. For these two taxes, tax expenditures amount to 30.9
and 22.9 percent of tax actually paid, respectively.
for by
nd
their associated revenue and efficiency costs. While
vidence on the benefits of these incentives is very sparse and, if anything, unfavorable,33
their efficiency costs are estimated to be very high, due to distorting behavior and
creating arbitrage opportunit
enditure by Typ , 2
Taxes pa(billions o
(A) ((
Tax expenditur(billions of
(C) ((
(C)/(
32 A significant portion of the
allowances and credits available under the personal and corporate tax systems represents
savings and investment incentives, as discussed in the previous section. The question is
then whether these incentives have enough impacts on domestic capital formation a
technology development to justify
e
ies.34
Table 6.7. Tax Exp e of Tax 003
id
f won)
%) B)
es won)
%) D)
A)
Direct taxes 4 4 12 7 27,735 4.4 ,331 0.4 5.8 Personal income tax 2 1 6,4 3 30,787 9.3 29 6.7 0.9 C x 2 3orporate income ta 25,633 3.8 5,870 3.5 22.9 Inheritance and gift taxes 1,315 1.2 32 0.2 2.4 Indirect taxes 52 4 5,0 2,978 9.3 56 8.9 9.5 Value added tax 33,44 3 3,263 17 1.1 8.6 9.8 Special excise tax 4,733 4.4 268 1.5 5.7 Liquor tax 2,726 2.5 44 0.3 1.6
Transportation tax 10,000 9.3 1,032 5.9 10.3 Sec 1.5 403 2.3 25.1 urity transaction tax 1,606 Stamp tax 457 0.4 47 0.3 10.2 Tel 8 0.0 0.0 0.0 ephone tax Customs duties 6,847 6.4 121 0.7 1.8
Total 107,560 100.0 17,508 100.0 16.3
Source: Ministry of Finance and Economy.
Tax Ba
eir
ight
o
the VA
.
he
for
em
le. Gordon and Li (2005) explore various policy choices for
se Protection
If tax allowances and credits do not sufficiently encourage savings and investment
behavior, why then would the government keep these incentives in place despite th
implied revenue and efficiency costs? One thought is that some of these tax breaks m
have been intended, from the beginning, to have inframarginal impacts for equity
purposes. Yet, another possible explanation is that, in the face of enormous evasion
pressures, the government might be using these incentives, along with certain nontax
benefits, as a means of preventing erosion of the tax base into the informal sector. The
government might well perceive these base protection effects to be large enough t
justify the associated costs. As a clue, some tax incentives in the personal income tax and
T system have been intended to facilitate enforcement itself,35 raising the
possibility of a similar line of policy intention prevailing through the whole tax system
From the early stages of economic development, raising sufficient revenue to
finance public infrastructure has been a primary concern of tax policy in Korea. T
government’s ability to collect taxes, however, depends on the extent of information
available to it on the earnings of firms and individuals. It is very unlikely for the
government to know exactly the taxable sales and incomes of businesses operating in the
informal sector or the cash economy. Tax enforcement hinges critically on use of the
financial sector by firms, since cash-only transactions leave no paper trail necessary
the collection and checking of relevant information. The design of a country’s tax syst
is then likely to be influenced by the size of its cash economy, since unobservable
transactions are not taxab
protect ating
l
nt
han half of civilian workers in Korea were self-employed in
the ear e 1980s
ing the government’s tax base, given monitoring difficulties with firms oper
in the informal sector.36
The size of the informal sector in Korea is non-negligible by international
standards. According to Schneider (2004), the estimate for Korea for 2002-03 is 28.8
percent of GDP, a much higher level than in developed countries.37 In particular,
informal financial markets (curb markets) have played an important role in investment
financing for small businesses, while the state-controlled banks have been more focused
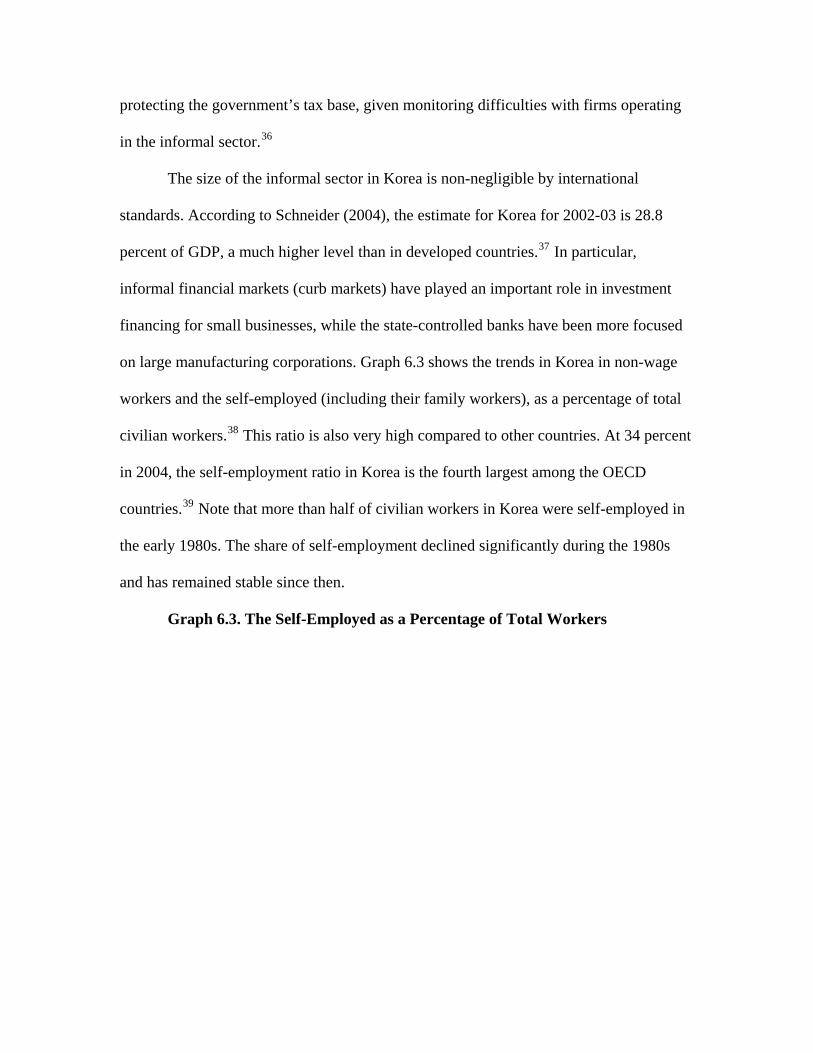
on large manufacturing corporations. Graph 6.3 shows the trends in Korea in non-wage
workers and the self-employed (including their family workers), as a percentage of tota
civilian workers.38 This ratio is also very high compared to other countries. At 34 perce
in 2004, the self-employment ratio in Korea is the fourth largest among the OECD
countries.39 Note that more t
ly 1980s. The share of self-employment declined significantly during th
and has remained stable since then.
Graph 6.3. The Self-Employed as a Percentage of Total Workers
Wage workers 1
60
Self-employed
Unpaid workers
0
10
20
30
40
50
1980 1982 1984 1986 1988 1990 1992 1994 1996 1998 2000 2002 2004
0
10
20
30
40
50
60
70
Source: Korea National Statistical Office. 1Wage workers include regular, temporary and daily workers. 2Unpaid workers include the self-employed and their unpaid family workers.
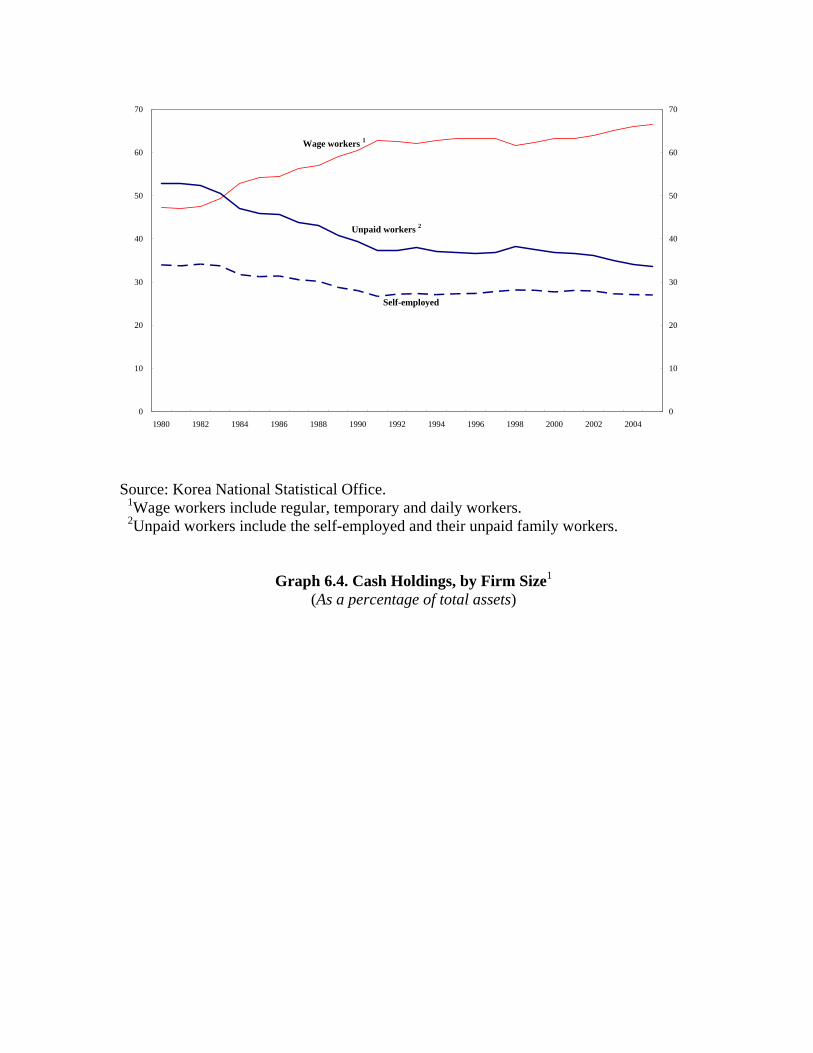
Graph 6.4. Cash Holdings, by Firm Size1
70
2
(As a percentage of total assets)
Large Firms
Chaebols
SMEs
0.00
0.04
0.08
1996 1997 1998 1999 2000 2001 2002
Source: Author’s calculations using KIS-VA1Cash, cash equivalents and short-term financial instrum
0.12
0.16
0.00
0.04
0.08
0.12
0.16
0
LUE firm database.
ents are included. 2The sample consists of firms registered with the Financial Supervisory Service. An SME is defined as a company with 300 or fewer employees. A Chaebol is a large
combined assets exceed a certain limit. The Korea Fair Trade chaebols each year. Large firms include chaebol
firms.
ss
s
41
0.20 0.2
business group whoseCommission announces the list of
Smaller businesses tend to rely more on cash transactions. While evidence on
such informal transactions is hard to obtain, Graph 6.4 reveals that smaller firms tend to
hold greater amounts of cash relative to their assets.40 As a percentage of total assets,
cash holdings of small and medium-sized firms have exceeded those of large firms by
about 5 percentage points in recent years, with the ratios for the chaebols, large busine
groups in Korea, being even lower. Interestingly, the cash-holding ratios for smaller firm
have shown a declining trend in recent years.
To sum up, the size of the informal sector and the share of self-employment in
Korea are quite high by international standards, and the tendency to hold cash appears
be higher for smaller firms. Considering this, the narrow bases for the personal income
tax, the VAT, and the corporate income tax are likely to reflect enforcement problems o
the Korean tax system. As noted in the preceding section, generous tax breaks in the
personal income tax system are often justified by a need to subsidize wage and salar
workers vis-à-vis the self-employed and the owners of financial capital who are taxed
relatively lightly. The low effective taxation of the self-employed and capital income in
large part reflects enforcement difficulties.
to
f
y
Person
dens
ver
e moderate taxation of financial income also reflects difficulties in gathering
formation for tax enforcement. Before the introduction of the real name system for
ownership of financial assets in 1993, it was practically impossible to subject financial
al Income Tax
The business incomes of the self-employed do not receive preferential treatment as do
wages and salaries, but statutory loopholes and a weak bookkeeping culture, along with a
limited auditing capacity, lead to a very low level of compliance. To alleviate the bur
of bookkeeping for small businesses, the government allows those within certain turno
limits to use an estimation method for their tax calculation, which typically reduces their
effective tax burdens. Accordingly, the self-employed have a very strong incentive to
underreport their turnover, which also leads to underreporting of taxable income at the
personal level.
Th
in
income to global taxation re either exempt or
t to final withholding taxes at varying rates. in r
d on have be xable under the glob
inco ng natu capital i e taxation is
ver illion won of dividends and interest ill subject to a
44
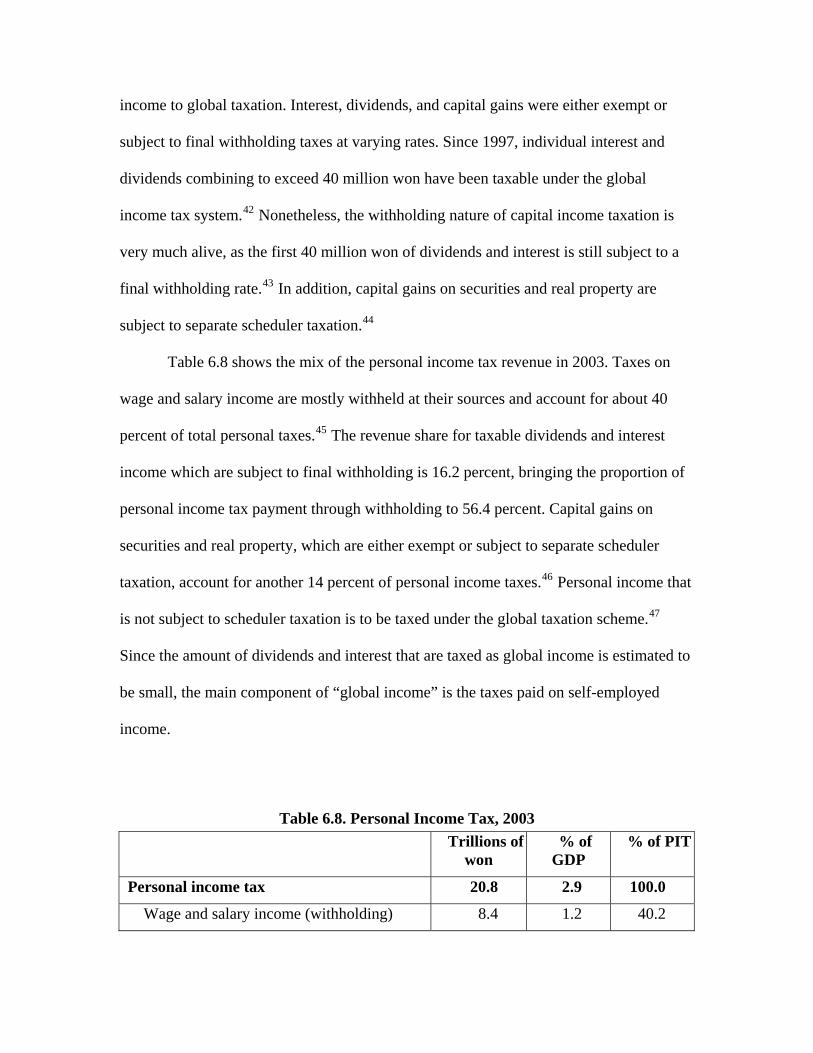
Table 6.8 shows the mix of the personal income tax revenue in 2003. Taxes on
wage a
f
47
o
won GDP
. Interest, dividends, and capital gains we
subjec Since 1997, dividual inte est and
ividends combining to exceed 40 million w en ta al
me tax system. Nonetheless, the withholdi42 re of ncom
y much alive, as the first 40 m is st
final withholding rate. In addition, capital gains on securities and real property are 43
subject to separate scheduler taxation.
nd salary income are mostly withheld at their sources and account for about 40
percent of total personal taxes.45 The revenue share for taxable dividends and interest
income which are subject to final withholding is 16.2 percent, bringing the proportion o
personal income tax payment through withholding to 56.4 percent. Capital gains on
securities and real property, which are either exempt or subject to separate scheduler
taxation, account for another 14 percent of personal income taxes.46 Personal income that
is not subject to scheduler taxation is to be taxed under the global taxation scheme.
Since the amount of dividends and interest that are taxed as global income is estimated t
be small, the main component of “global income” is the taxes paid on self-employed
income.
Table 6.8. Personal Income Tax, 2003
Trillions of % of % of PIT
Personal income tax 20.8 2.9 100.0
Wage and salary income (withholding) 8.4 1.2 40.2
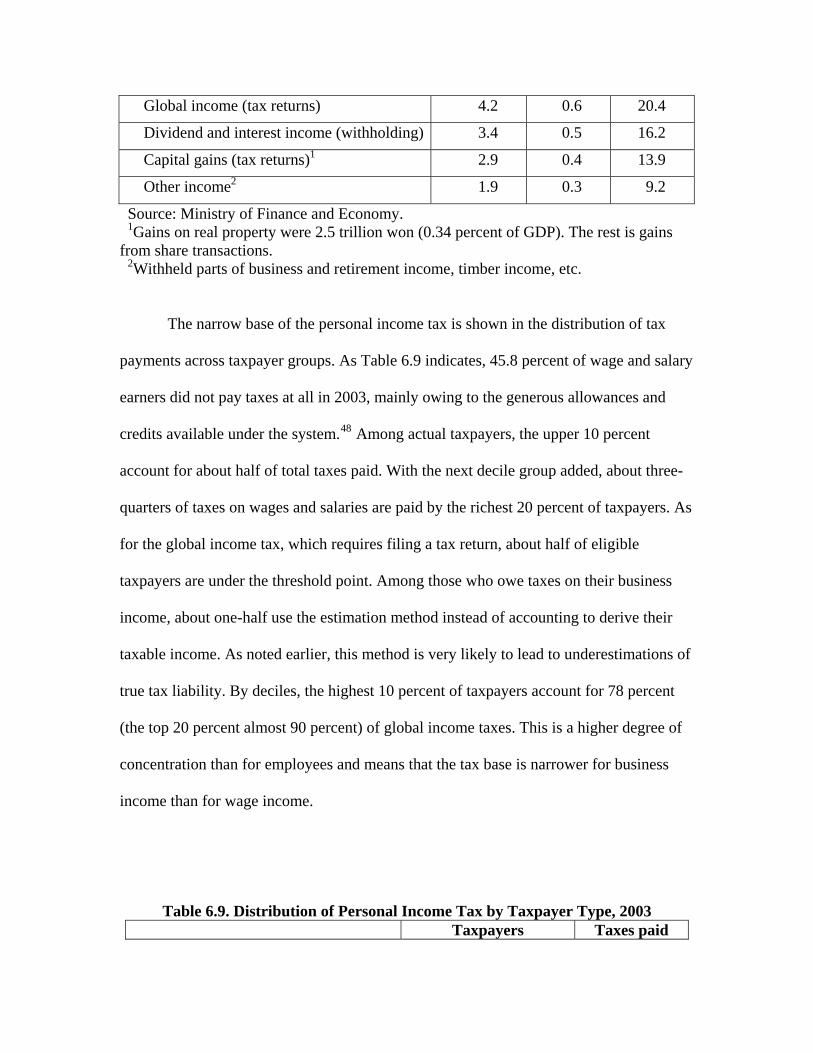
Gl 4 obal income (tax returns) 4.2 0.6 20.
Dividend and interest income (withholdin 0.5 g) 3.4 16.2
Capital gains (tax returns)1 2.9 0.4 13.9
Other income2 1.9 0.3 9.2
Source: Ministry of Finance and Economy. roperty were 2.5 trillion won (0.34 percent of GDP). The rest is gains fr ment incom er income, etc.
f the personal income ta wn e distrib of tax
paym indicates, 45.8 percent of wage and salary
48
p added, about three-
by the richest 20 percent of taxpayers. As
e tax, which requires filing a tax return, about half of eligible
income
1Gains on real pom share transactions.
2 siness and retireWithheld parts of bu e, timb
The narrow base o x is sho in th ution
ents across taxpayer groups. As Table 6.9
earners did not pay taxes at all in 2003, mainly owing to
c edits available under
the generous allowances and
r the system. Among actual taxpayers, the upper 10 percent
account for about half of total taxes paid. With the next decile grou
quarters of taxes on wages and salaries are paid
for the global incom
taxpayers are under the threshold point. Among those who owe taxes on their business
income, about one-half use the estimation method instead of accounting to derive their
taxable income. As noted earlier, this method is very likely to lead to underestimations of
true tax liability. By deciles, the highest 10 percent of taxpayers account for 78 percent
(the top 20 percent almost 90 percent) of global income taxes. This is a higher degree of
concentration than for employees and means that the tax base is narrower for business
than for wage income.
Table 6.9. Distribution of Personal Income Tax by Taxpayer Type, 2003 Taxpayers Taxes paid
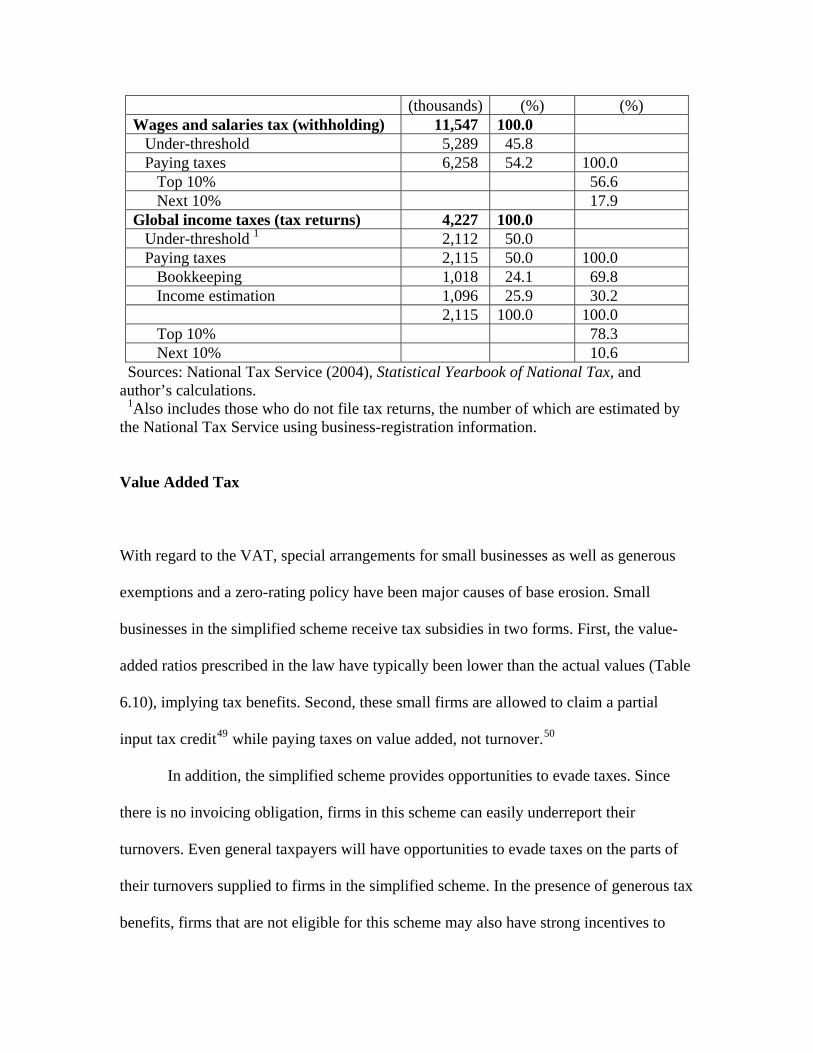
(thousands) (%) (%) Wages and salaries tax (withholding) 11,547 100.0 Under-threshold 5,289 45.8 Paying taxes 6,258 54.2 100.0 Top 10% 56.6 Next 10% 17.9 Global income taxes (tax returns) 4,227 100.0 Under-threshold 1 2,112 50.0 Paying taxes 2,115 50.0 100.0 Bookkeeping 1,018 24.1 69.8 Income estimation 1,096 25.9 30.2 2,115 100.0 100.0 Top 10% 78.3 Next 10% 10.6
Sources: National Tax Service (2004), Sta ational and
eturns, the number of which are estimated by sing business-registration information.
Tax
VAT, special arrangements for small businesses as well as generous
a zero-rating policy have been major causes of base erosion. Small
ower than the actual values (Table
artial
put tax credit while paying taxes on value added, not turnover.50
e
benefits, firms that are not eligible for this scheme may also have strong incentives to
tistical Yearbook of N Tax, author’s calculations. 1Also includes those who do not file tax rthe National Tax Service u
Value Added
With regard to the
exemptions and
businesses in the simplified scheme receive tax subsidies in two forms. First, the value-
added ratios prescribed in the law have typically been l
6.10), implying tax benefits. Second, these small firms are allowed to claim a p
49in
In addition, the simplified scheme provides opportunities to evade taxes. Sinc
there is no invoicing obligation, firms in this scheme can easily underreport their
turnovers. Even general taxpayers will have opportunities to evade taxes on the parts of
their turnovers supplied to firms in the simplified scheme. In the presence of generous tax
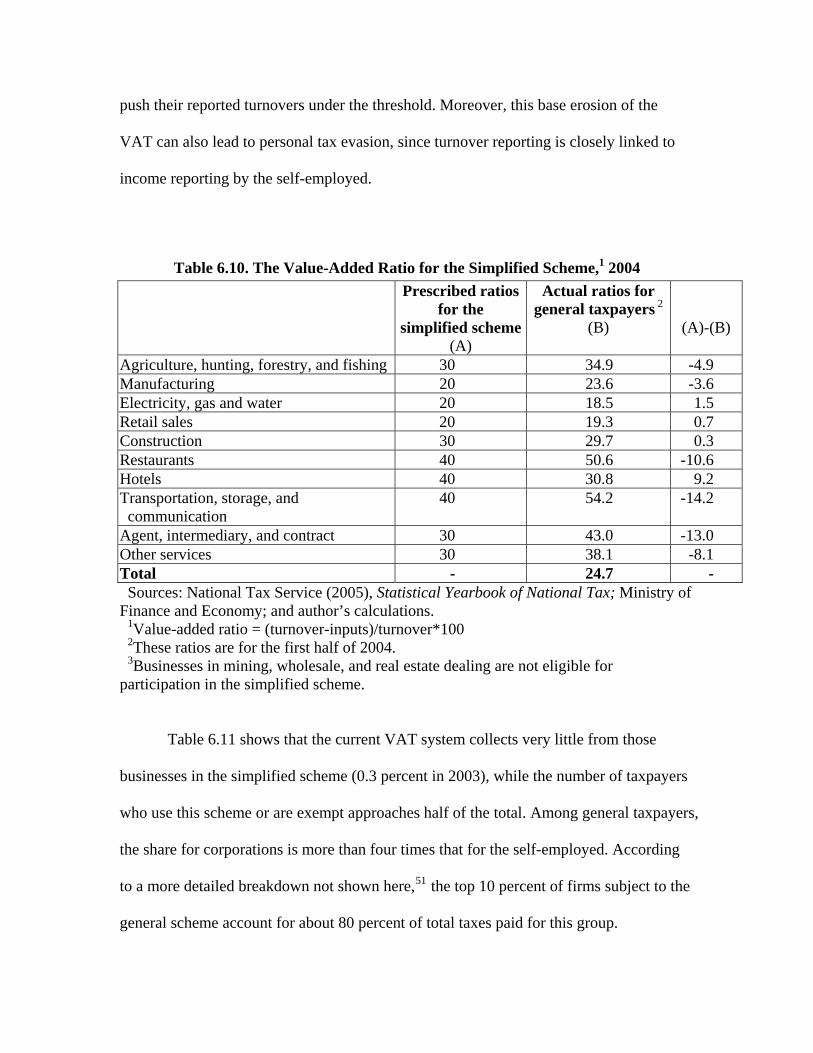
push their reported turnovers under the threshold. Moreover, this base erosion of the
VAT can also lead to personal tax evasion, since turnover reporting is closely linked to
come reporting by the self-employed.
Table 6.10. The Value-Added Ratio for the Simplified Scheme,1 2004
resc ratios e
simplified scheme
al ratios g axpaye
(A)-(B)
in
P ribedfor th
(A)
Actu for eneral t rs 2
(B)
Agriculture, hunting, forestry, and fi 4.9 -4.9 shing 30 3Manufacturing 3.6 -3.6 20 2Electricity, gas and water 20 18.5 1.5 Retail sales 20 19.3 0.7 Construction 30 29.7 0.3 Restaurants 40 50.6 -10.6 Hotels 40 30.8 9.2 Transportation, storage, and 40 54.2 -14.2 communication Agent, intermediary, and contract 30 43.0 -13.0 Other services 30 38.1 -8.1 Total - 24.7 - Sources: National Tax Service (2005), Statistical Yearbook of National Tax; Mini
1Value-added ratio = (turnover-inputs)/turnover*100
3Businesses in mining, wholesale, and real estate dealing are not eligible for
Table 6.11 shows that the current VAT system collects v
stry of Finance and Economy; and author’s calculations.
2These ratios are for the first half of 2004.
participation in the simplified scheme.
ery little from those
usinesses in the simplified scheme (0.3 percent in 2003), while the number of taxpayers
pt approaches half of the total. Among general taxpayers,
e share for corporations is more than four times that for the self-employed. According
b
who use this scheme or are exem
th
to a more detailed breakdown not shown here,51 the top 10 percent of firms subject to the
general scheme account for about 80 percent of total taxes paid for this group.
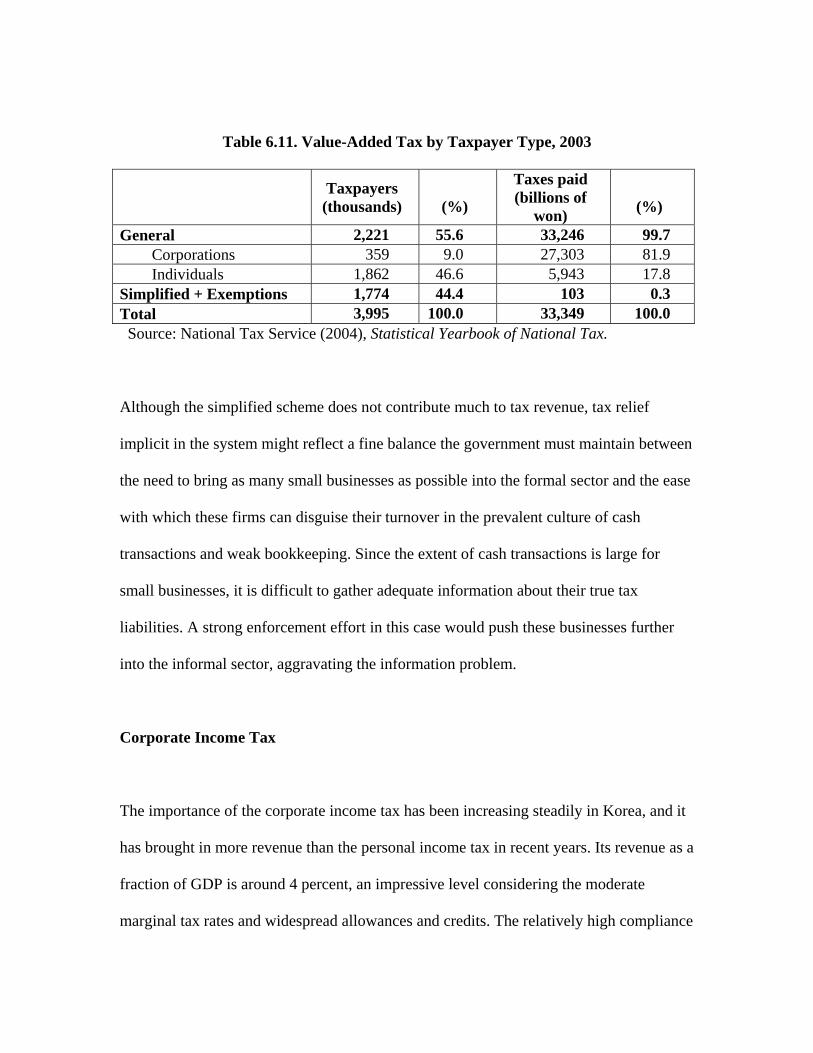
Table 6.11. Value-Added Tax by Taxpayer Type, 2003
Taxpayers (thousands)
(%)
Taxes paid
won)
(%)
(billions of
General 2,221 55.6 33,246 99.7 Corporations 359 9.0 27,303 81.9 Individuals 1,862 46.6 5,943 17.8
Simplified + Exemptions 1,774 44.4 103 0.3 Total 3,995 100.0 33,349 100.0 Source: National Tax Service (2004), Statistical Yearbook of National Tax.
Although the simplified scheme does not contribute much to tax revenue, tax relief
implicit in the system might reflect a fine balance the government must maintain between
e need to bring as many small businesses as possible into the formal sector and the ease
with w
transactions and weak bookkeeping. Since the extent h tra rge
A strong enforcement effor se wo h these bus ses fur
avating th ation problem.
Tax
orea, and it
in more revenue than the personal income tax in recent years. Its revenue as a
fraction of GDP is around 4 percent, an impressive level considering the moderate
marginal tax rates and widespread allowances and credits. The relatively high compliance
th
hich these firms can disguise their turnover in the prevalent culture of cash
of cas n lasactions is for
small businesses, it is difficult to gather adequate information about their true tax
liabilities. t in this ca uld pus ines ther
into the informal sector, aggr e inform
Corporate Income
The importance of the corporate income tax has been increasing steadily in K
has brought
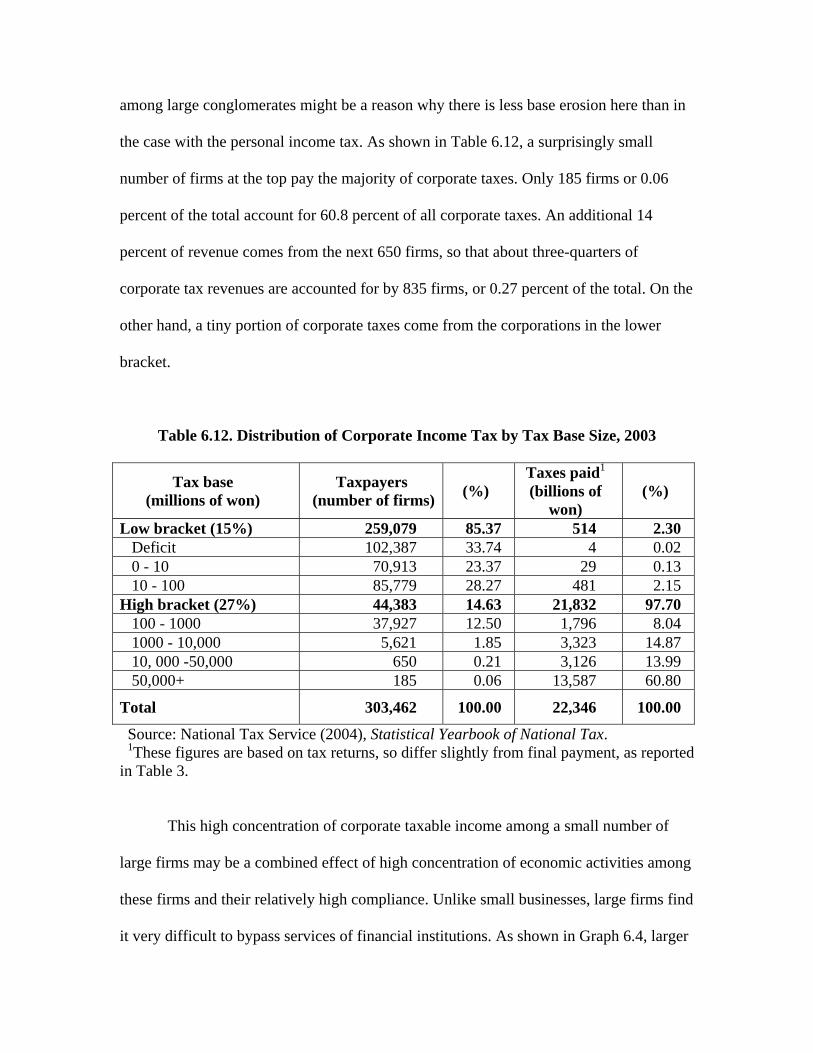
among large conglomerates might be a reason why there is less base erosion here than in
the case with the personal income tax. As shown in Table 6.12, a surprisingly small
number of firms at the top pay the majority of corporate taxes. Only 185 firms or 0.0
percent of the total account for 60.8 percent of all corporate taxes. An additional 14
percent of revenue comes from the next 650 firms, so that about three-quarters of
corporate tax revenues are accounted for by 835 firms, or 0.27 percent of the total. On th
other hand, a tiny portion of corporate taxes come from the corporations in the lower
bracket.
6
e
Table 6.12. Distribution of Corporate Income Tax by Tax Base Size, 2003
Tax base axes paid1
llions of (%) (millions of won)
won)
Taxpayers (number of firms)
(%) (biT
Low bracket (15%) 259,079 85.37 514 2.30 Deficit 102,387 33.74 4 0.02 0 - 10 70,913 23.37 29 0.13 10 - 100 85,779 28.27 481 2.15 High bracket (27%) 44,383 14.63 21,832 97.70 100 - 1000 37,927 12.50 1,796 8.04 1000 - 10,000 5,621 1.85 3,323 14.87 10, 000 -50,000 650 0.21 3,126 13.99 50,000+ 185 0.06 13,587 60.80
Total 303,462 100.00 22,346 100.00
Source: National Tax Service (2004), Statistical Yearbook of National Tax. 1These figures are based on tax returns, so differ slightly from final payment, as reported in Table 3.
This high concentration of corporate taxable income among a small number of
large firms may be a combined effect of high concentration of economic activities among
these firms and their relatively high compliance. Unlike small businesses, large firms find
very difficult to bypass services of financial institutions. As shown in Graph 6.4, larger it
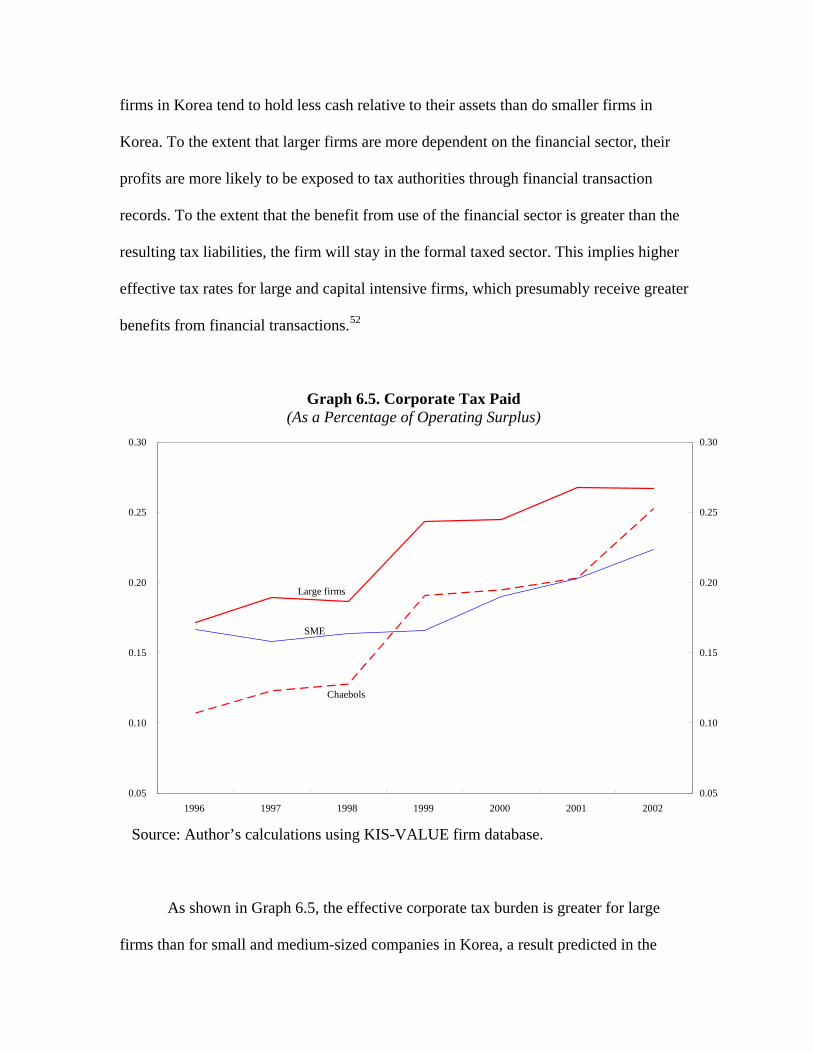
firms in
r
the
(As a Percentage of Operating Surplus)
Korea tend to hold less cash relative to their assets than do smaller firms in
Korea. To the extent that larger firms are more dependent on the financial sector, thei
profits are more likely to be exposed to tax authorities through financial transaction
records. To the extent that the benefit from use of the financial sector is greater than
resulting tax liabilities, the firm will stay in the formal taxed sector. This implies higher
effective tax rates for large and capital intensive firms, which presumably receive greater
benefits from financial transactions.52
Graph 6.5. Corporate Tax Paid
Chaebols
SME
Large firms
0.05
0.10
0.15
1996 1997 1998 1999 2000 2001
0.20
2002
0.05
0.10
0.15
0.20
0.25
0.30
Sourc
firms than for small and medium-sized companies in Korea, a result predicted in the
0.25
0.30
e: Author’s calculations using KIS-VALUE firm database.
As shown in Graph 6.5, the effective corporate tax burden is greater for large
above discussion.53 Surprisingly, the effective tax rates for large conglomerates classified
as chaebols are lower than those for other large firms. Since economic activities are
highly concentrated among these top manufacturing firms, however, their revenue sha
could still be high, as suggested in Table 6.12. Their relatively low effective tax rat
likely due to the following factors. First, these firms are highly capit
res
es are
al-intensive and
xport-oriented, so they usually benefit more from generous investment incentives as
well as export subsidies.54 ged than other large
firms, and thus reap more tax benefits from interest deductions. This is because directed
informal sector. This prediction appears to fit well with the experience in Korea.
The Korean government has not been as enthusiastic in inviting multinationals
into the country as have other developing countries. As shown in Graph 6.6, foreign
direct investment as a percentage of GDP has been much lower in Korea than in most
other countries. Foreign capital has instead been typically imported in the form of loans,
which were in the past redirected through state-controlled banks to domestic firms. What
e
Second, they are typically more levera
loans from state-owned or controlled banks with explicit and implicit loan-guarantees55
as well as the practice of cross-guaranteeing loans among chaebol affiliates have made
bankruptcy risks associated with debt financing very low.
These tax and nontax benefits from the government and the state-controlled banks
seem to have played a critical role in protecting the corporate tax base, since firms have
had to remain in the formal sector and use banks to receive such benefits. While these
subsidies lead to some revenue and efficiency costs, the government also gains in part
from the extra revenue on new investment induced by investment incentives or
subsidized loans and in part by keeping marginal firms from disappearing into the
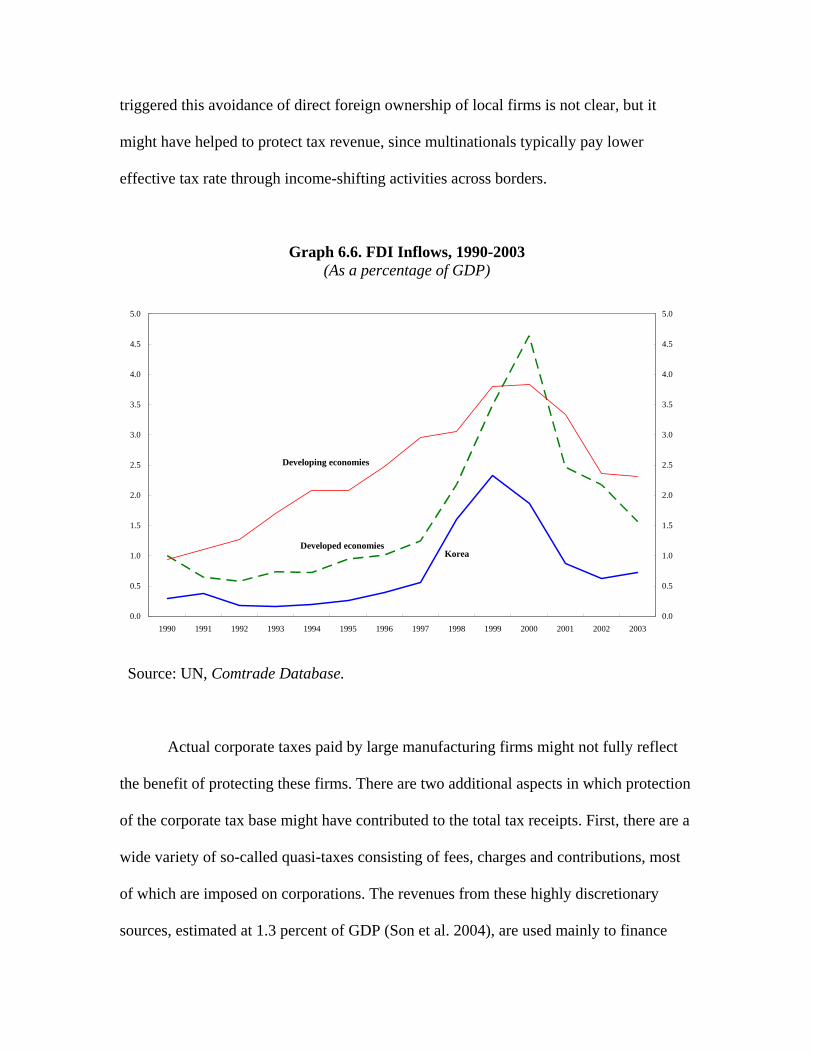
triggered this avoidance of direct foreign ownership of local firms is not clear, but it
might have helped to protect tax revenue, since multinationals typically pay lower
effective tax rate through income-shifting activities across borders.
Graph 6.6. FDI Inflows, 1990-2003 (As a percentage of GDP)
Deve0
loped economKorea
0.0
0.5
1.
1.
2.0
2.5
3.0
4.5
1990 1991 92 1993 1994 199 2000 2001 2002 2003
0.0
0.5
1.
2.5
3.0
3.5
4.0
4.5
ase.
t
ion
ere are a
ide variety of so-called quasi-taxes consisting of fees, charges and contributions, most
f which are imposed on corporations. The revenues from these highly discretionary
urces, estimated at 1.3 percent of GDP (Son et al. 2004), are used mainly to finance
ies
Developing economies
5
3.5
4.0
5.0 5.0
19 5 1996 1997 1998 1999
0
1.5
2.0
omtrade DatabSource: UN, C
Actual corporate taxes paid by large manufacturing firms might not fully reflec
the benefit of protecting these firms. There are two additional aspects in which protect
of the corporate tax base might have contributed to the total tax receipts. First, th
w
o
so
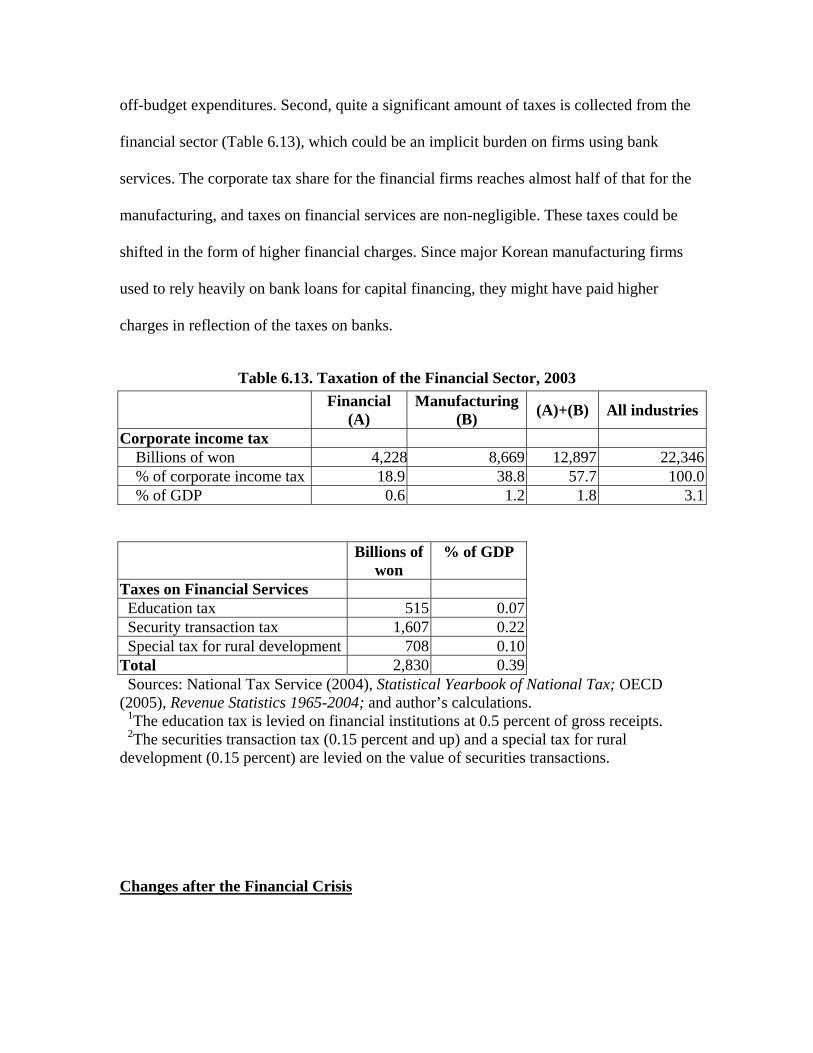
off-budget expenditures. Second, quite a significant amount of taxes is collected from the
nancial sector (Table 6.13), which could be an implicit burden on firms using bank
Table 6.13. Taxation of the Financial Sector, 2003
(A) (B)
fi
services. The corporate tax share for the financial firms reaches almost half of that for the
manufacturing, and taxes on financial services are non-negligible. These taxes could be
shifted in the form of higher financial charges. Since major Korean manufacturing firms
used to rely heavily on bank loans for capital financing, they might have paid higher
charges in reflection of the taxes on banks.
Financial Manufacturing(A)+(B) All industries
Corporate income tax Billions of won 4,228 8,669 12,897 22,346% of corporate income tax 18.9 38.8 57.7 100.0% of GDP 0.6 1.2 1.8 3.1
Billions of won
% of GDP
Taxes on Financial Services Education tax 515 0.07Security transaction tax 1,607 0.22Special tax for rural development 708 0.10
Total 2,830 0.39 Sources: National Tax Service (2004), Statistical Yearbook of National Tax; OECD (2005), Revenue Statistics 1965-2004; and author’s calculations. The education tax is levied on financial institutions at 0.5 percent of gross rec 2The securities transaction tax (0.15 percent and up) and a special tax for rural development (0.15 percent) are levied on the value of securities transactions.
1 eipts.
Changes after the Financial Crisis
After the outbreak of the financial crisis, the most immediate concern of tax policy was t
alleviate the adverse effects from the crisis and to promote structural adjustments. Th
government introduced various tax measures to boost economic activity, mitiga
distributional consequences, facilitate restructuring of the corporate and financial sectors,
and encourage foreign direct investment and capital inflows.
Wage and salary earners received tax relief in the form of increased deductions
and a cut in the marginal tax rates.
o
e
te adverse
ced by
or
on taxes have been reduced or eliminated.58 To stimulate investment,
tax ince
rary
t
n
s
ree
al structures for most Korean firms changed
56 The tax burden on the self-employed was redu
introduction of a tax credit for formal bookkeeping and expanding the allowances f
credit card sales. Global taxation of capital income was suspended in 1999 and 2000 to
prevent negative impacts on the financial markets,57 and the personal capital gains tax
rate were reduced to boost the real estate market. To encourage private consumption,
special consumpti
ntives were provided to small and medium-sized enterprises, including tax
exemptions on capital gains and stock options in venture capital businesses. Tempo
investment tax credits were reinstated, and eligibility for them was expanded. In an effor
to promote inflows of foreign investment, tax preferences were introduced and
expanded.59 With regard to restructuring, the focus of changes in the tax code was o
reducing the costs of asset and equity transactions and debt payments.60 Tax relief wa
also provided for financial sector restructuring.61
While these tax changes were mostly focused on short-tem policy objectives,
changes in the economic structure triggered longer-run and probably much more
important impacts of the crisis on the level and structure of tax revenue. There are th
particular cases in point. First, the capit
dramat
elow
e tax
ng
ly have negative consequences on corporate tax revenue,
since n
ctural
anced techniques from foreign-owned
banks w , but
ically in a few years after the crisis, with the debt-equity ratios of large
manufacturing corporations dropping from around 500 percent before the crisis to b
200 percent in the early 2000s. This change had an immediate impact on the effectiv
rates as depicted in Graph 6.5,62 leading to a sharp increase in revenue from the corporate
income tax after the crisis (Graphs 6.1 and 6.2). The long-run implications for tax
revenue of this change in the corporate capital structure are unclear, however. The
elimination of preferential treatment for debt-financing means such as cross-guaranteei
and directed loans will possib
ew investment and production could be curtailed unless firms can obtain adequate
equity financing.
Second, financial sector restructuring can have strong implications for the scope
of the informal sector by facilitating use of banks among small businesses. As the
function of the financial sector improves, the benefits that firms receive from using this
sector will increase. Indeed, the financial sector in Korea has undergone drastic stru
changes, resulting in more market-based operations and a sharp increase in foreign
ownership. In particular, competition and adv
ill not only increase the overall profitability of the Korean financial sector
also provide more value added to businesses. To the extent that these changes improve
financial intermediation among existing users of the financial sector and pull businesses
that used to rely on cash transactions or the curb markets into the formal sector, the
government can collect more revenue.
Lastly, restrictions on the inflow of foreign capital were substantially reduced,
making Korean markets more open. The revenue implications of increased foreign
ownership of local assets and firms are unclear. A more open economy will expand
business opportunities and taxable profits accordingly. At the same time, however, the
scope for tax evasion and avoidance will increase, since transactions through foreig
financial intermediaries are not easily observable. In addition, multinationals can sh
profits among their affiliates by manipu
n
ift
lating transfer pricing, and thus report smaller
domestic taxable incomes.
The above-mentioned changes in the Korean economic structure have conflicting
implications for tax enforcement, nue impacts are uncertain. A
better functioning finan y lea in size of al
sector, whereas a more open economy will lead to increased opportunities for tax
avoidance. Nonetheless, these tural changes have had a clear impact on the focus of
tax enf nue. In the aftermath of the cr e
govern plemented several measures to enhance tax compliance, with a particular
attention given to the self-em sector.
se of credit cards was introduced, under which
taxpaye ,
63
64
e
65
y
and their long-run reve
cial sector will likel d to a reduction the inform
struc
orcement and the structure of tax reve isis, th
ment im
ployed
I 1999, an incentive for un
rs became able to deduct parts of their credit card usage in excess of a threshold
up to a certain limit. A similar incentive was available for sales by the self-employed
paid by credit cards. These incentives for credit card usage appear to have had an
important role in increasing the fraction of consumption expenditures paid for by credit
cards, as shown in Table 6.14. Between 1999 and 2002, this ratio increased about thre
times. Boosted by this success, the government introduced a similar incentive for cash
transactions based upon receipts in 2005. Apart from such incentive measures, the
government also reduced the scope of the simplified scheme under the VAT in 2000 b
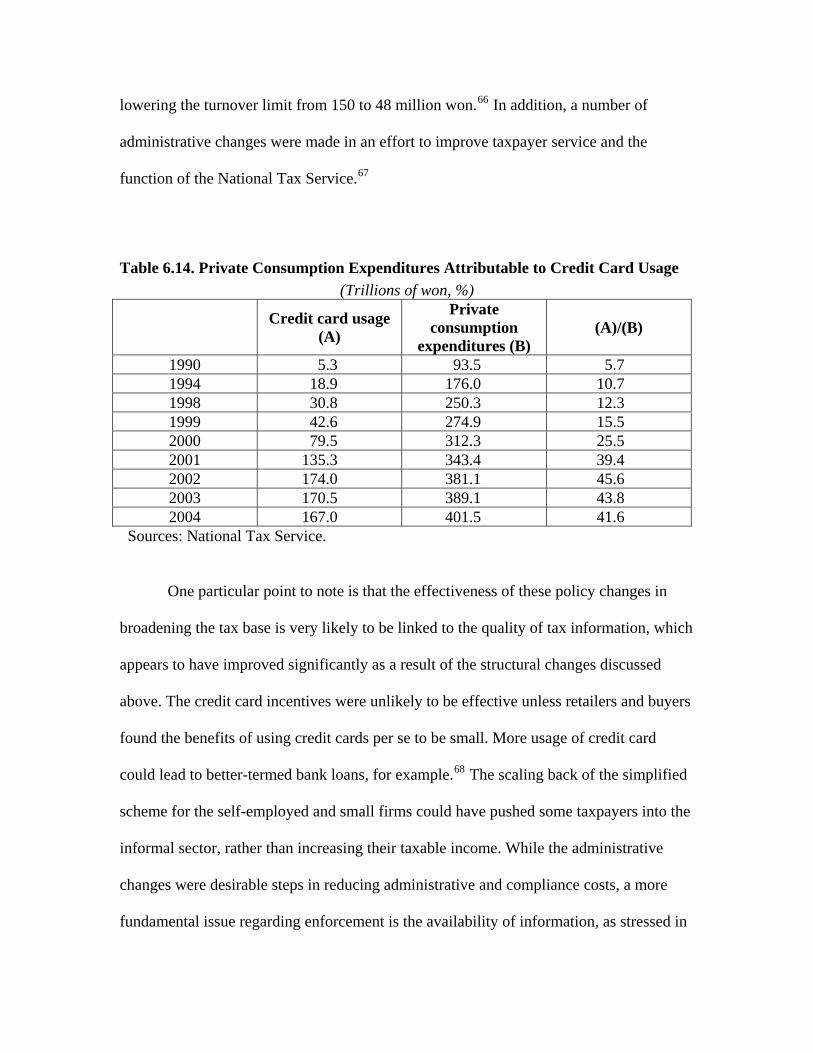
lowering the turnover limit from 150 to 48 million won.66 In addition, a number of
administrative changes were made in an effort to improve taxpayer service and the
function of the National Tax Service.67
Table 6.14. Private Consumption Expenditures Attributable to Credit Card Usage
Private
expenditures (B)
(Trillions of won, %)
Credit card usage (A)
consumption (A)/(B)
1990 5.3 93.5 5.7 1994 18.9 176.0 10.7 1998 30.8 250.3 12.3 1999 42.6 274.9 15.5 2000 79.5 312.3 25.5 2001 135.3 343.4 39.4 2002 174.0 381.1 45.6 2003 170.5 389.1 43.8 2004 167.0 401.5 41.6
Sources: N
ational Tax Service.
One particular point to note is that the effectiveness of these policy changes in
broadening the tax base is very likely to be linked to the quality of tax information, which
appears to have improved significantly as a result of the structural changes discussed
above. The credit card incentives were unlikely to be effective unless retailers and buyers
found the benefits of using credit cards per se to be small. More usage of credit card
could lead to better-termed bank loans, for example.68 The scaling back of the simplified
scheme for the self-employed and small firms could have pushed some taxpayers into the
informal sector, rather than increasing their taxable income. While the administrative
changes were desirable steps in reducing administrative and compliance costs, a more
fundamental issue regarding enforcement is the availability of information, as stressed in
this paper. The self-assessment scheme, for example, will be of little value unless
taxpaye information is adequately available.
tion
the
aph
nt
r
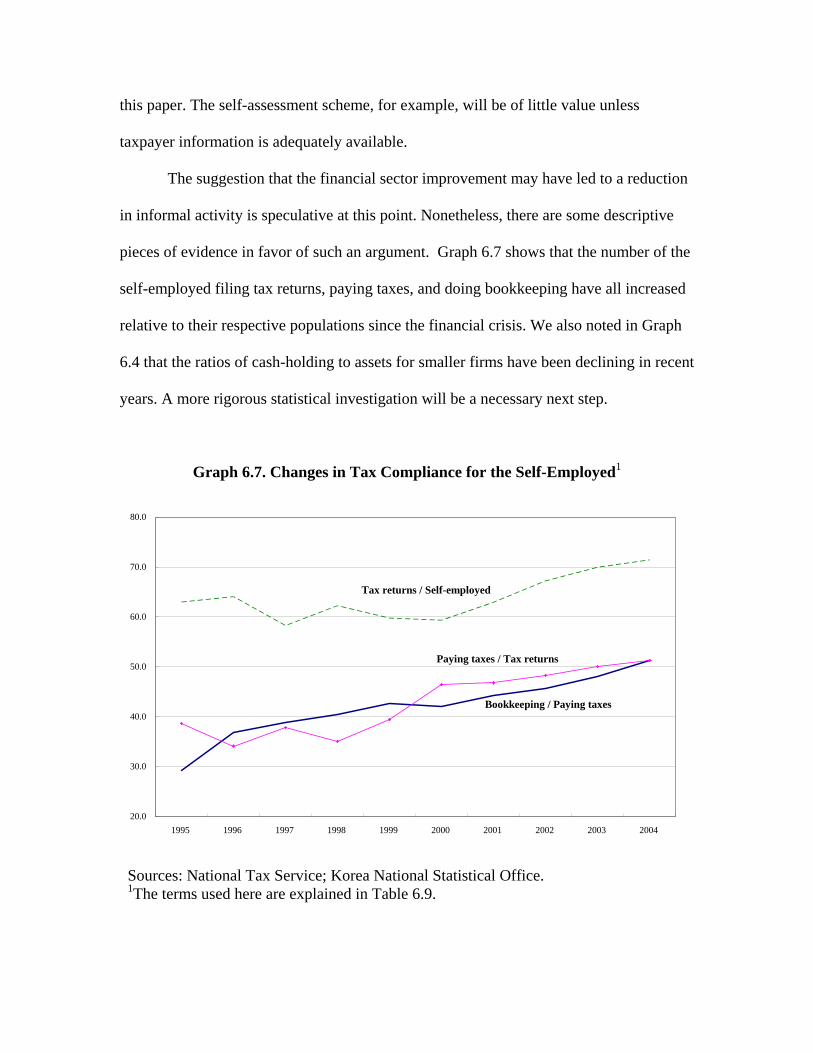
The suggestion that the financial sector improvement may have led to a reduc
in informal activity is speculative at this point. Nonetheless, there are some descriptive
pieces of evidence in favor of such an argument. Graph 6.7 shows that the number of
self-employed filing tax returns, paying taxes, and doing bookkeeping have all increased
relative to their respective populations since the financial crisis. We also noted in Gr
6.4 that the ratios of cash-holding to assets for smaller firms have been declining in rece
years. A more rigorous statistical investigation will be a necessary next step.
Graph 6.7. Changes in Tax Compliance for the Self-Employed1
20.0
30.0
40.0
50.0
60.0
70.0
1996 1997 1998 1999 2000 2001 2002 2003 2004
Bookkeeping / Paying taxes
Paying taxes / Tax returns
Tax returns / Self-employed
Sources: National Tax Service; Korea National Statistical Office. 1The terms used here are explained in Table 6.9.
80.0
1995
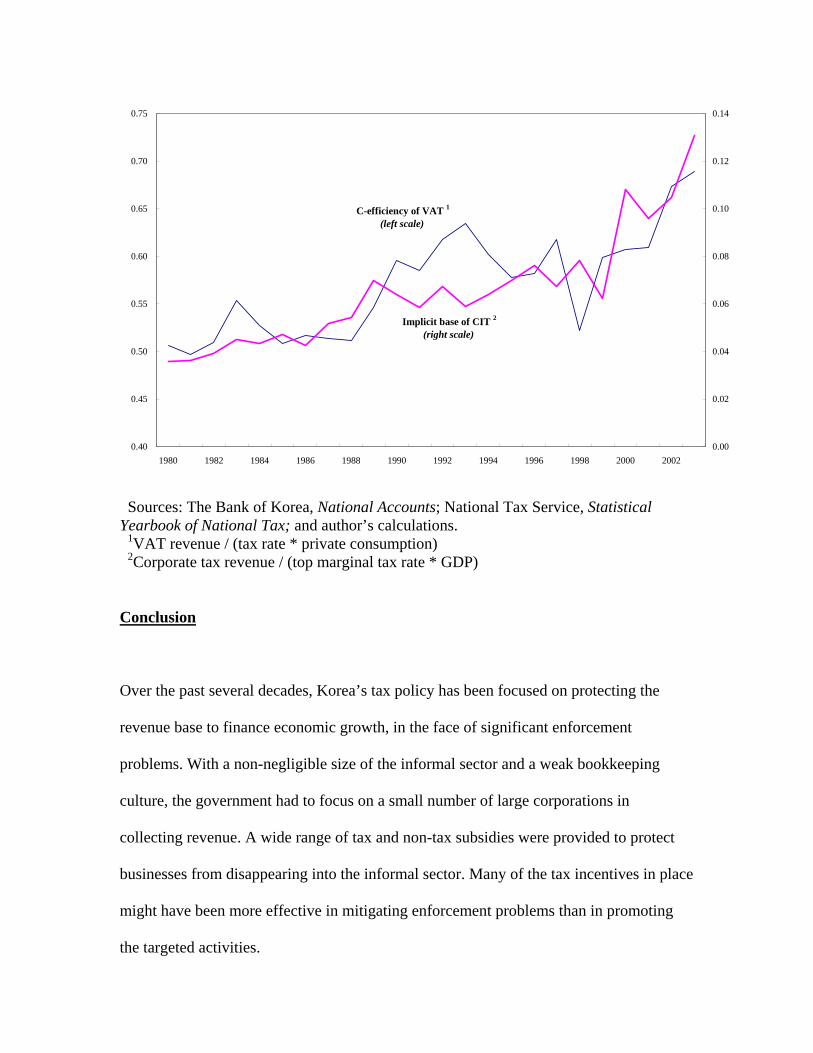
In summary, the of GDP
increase in the level of tax revenue as a percentage
(Table 6.1) and the sharp change in revenue structure since the financial crisis (Graphs
6.1 and 6.2) reflect changes in both the tax rates and bases. Structural changes in the
corporate and financial sectors appear to have had base-broadening effects by reducing
interest deduction for most corporations and encouraging use of the financial sector
instead of cash transactions for the self-employed and small firms. As shown in Graph
6.8, the ratio of the VAT base to private consumption and the ratio of the corporate tax
base to GDP have both increased sharply since the financial crisis. The improvement of
financial services may also have increased the effectiveness of policy measures aimed at
enhancing compliance, such as the deduction for credit card usage, by making more
businesses sensitive to marginal incentives available in the financial sector.
Graph 6.8. Efficiency Ratios, Korea, 1980-2003
C-efficiency of VAT 1
(left scale)
Implicit base of CIT 2
(right scale)
0.40
0.45
0.50
0.60
0.65
0.55
0.70
19
0.00
0.02
0.04
0.06
0.08
0.10
0.12
0.14
Yearbook of National Tax; and author’s calculations.
Corporate tax revenue / (top marginal tax rate * GDP)
0.75
80 1982 1984 1986 1988 1990 1992 1994 1996 1998 2000 2002
Sources: The Bank of Korea, National Accounts; National Tax Service, Statistical
1VAT revenue / (tax rate * private consumption)
2
Conclusion
Over the past several decades, Korea’s tax policy has been focused on protecting the
revenue base to finance economic growth, in the face of significant enforcement
problem
the targeted activities.
s. With a non-negligible size of the informal sector and a weak bookkeeping
culture, the government had to focus on a small number of large corporations in
collecting revenue. A wide range of tax and non-tax subsidies were provided to protect
businesses from disappearing into the informal sector. Many of the tax incentives in place
might have been more effective in mitigating enforcement problems than in promoting
To the extent that this base-protection effect has been significant, the revenue and
efficiency costs associated with these tax preferences in most tax debates appear to be
overstated. Statutory loopholes and lenient enforcement, which have been criticized as
sources of inefficiency and tax evasion, often reflect a rational response by the
government caught between evasion pressures and base-broadening needs. The
proportional taxation of capital income and the simplified scheme for taxation of the self-
employ t some
rent
.
e
n
the
y
e
oning financial sector. To the
xtent that businesses come to receive more benefits from using the financial sector, the
lative size of the informal sector will shrink. Indeed, the base for the VAT, the most
ed are representative cases in point. The government has also had to adop
unconventional means of raising revenue, such as earmarked taxes and surcharges.
All of these factors have made the tax revenue structure in Korea quite diffe
from what is observed in developed countries. The personal income tax is of relatively
minor importance in Korea, and the bases for the corporate and VAT are quite narrow
Earmarked taxes and property transaction taxes both account for significant shares of
total tax revenue. Unless these underlying factors change greatly, a drastic reshaping of
the tax structure is unlikely to be either feasible or desirable. A shift to the more
conventional tax policies observed among developed countries could possibly generat
more revenue and efficiency costs than theories suggest.
The financial crisis in Korea provides an interesting case study of how tax desig
can be affected by a change in the economic structure. In the aftermath of the crisis,
Korean corporate and financial sectors underwent drastic restructuring, and the econom
was made more open. These structural changes led to a lower-leveraged capital structur
for most corporations and a more open and better-functi
e
re
important source of revenue, appears to mproving in the years since the crisis.
The long-run re er. A
reduction in debt financing may lead to declines in new investment and production
addition, an increase in capital mobility w ad t opp ties vo
e potential costs of r ficati nd th ing
pid agin he K n popu n an atur
iority for taxation is to expand the revenue base in an
base- ning venti res inclu
nnecessary” deducti exe ons i ers ome,
AT systems.69 Re g the e of e
m, with var eff cies as ated ese t
er, s hese instrum ay a
erosion into nfor ector, and this offsets their
seful urgen is to an
ation is mo adil er re of th
ore efficient sh of i ation ng g ent
ectio anci entive co and
rd self-assessm ly b re e whe
taxpay in the form ecto
Appendix
have been i
venue implications of these changes are inconclusive, howev
. In
ill le o more ortuni for tax a idance.
Considering th e-uni on a e soar welfare
expenditures stemming from the ra g of t orea latio d the m ing
of public pensions, the top pr
efficient and equitable manner. For broade , con onal p criptions de
the elimination of “u ons and mpti n the p onal inc
corporate income, and V ducin scop armarked and transaction
taxes is also a favorite menu ite ious in icien soci with th axes
being cited. As emphasized in this paper, howev ome of t ents pl role
in protecting the tax base from the i mal s
revenue and efficiency costs. Probably a more u and t task create
environment in hich tax informw re re y available. Furth form e
financial sector as well as m aring nform amo overnm
agencies will be a step in the right dir n. Fin al inc s for mpliance
administrative changes towa ent will also like e mo ffective n
ers find it useful to remain al s r.
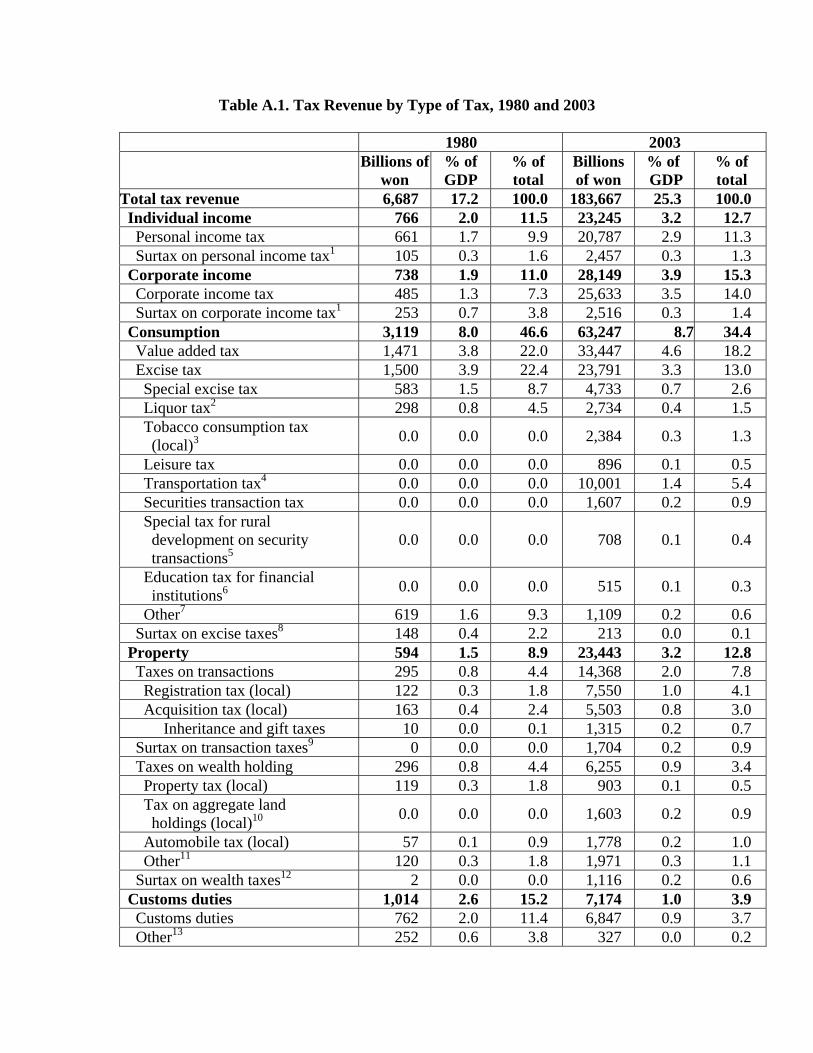
Table A.1. Tax Revenue b pe o , 198 200
1980 2003
y Ty f Tax 0 and 3
Billion wo
%G
%to
Bof w
%G
%to
s ofn
of DP
of tal
illions on
of DP
of tal
Total tax revenue 6,6 1 10 183 2 1087 7.2 0.0 ,667 5.3 0.0 Individual income 1 2 1766 2.0 1.5 3,245 3.2 2.7 Personal income tax 661 1.7 9.9 20,787 2.9 11.3 Surtax on personal income tax1 105 0.3 1.6 2,457 0.3 1.3 Corporate income 15.3 738 1.9 11.0 28,149 3.9 Corporate income tax 485 1.3 7.3 25,633 3.5 14.0 Surtax on corporate income tax1 0.7 3.8 0.3 1.4 253 2,516 Consumption 3,119 8.0 46.6 63,247 8.7 34.4 Value added tax 1,471 3.8 22.0 33,447 4.6 18.2 Excise tax 1,500 3.9 22.4 23,791 3.3 13.0 Special excise tax 583 1.5 8.7 4,733 0.7 2.6 Liquor tax2 298 0.8 4.5 2,734 0.4 1.5 Tobacco consumption tax
0.0 0.0 0.0 2,384 0.3 1.3 (local)3 Leisure tax 0.0 0.0 0.0 896 0.1 0.5 Transportation tax4 0.0 0.0 0.0 10,001 1.4 5.4 Securities transaction tax 0.0 0.0 0.0 1,607 0.2 0.9 Special tax for rural development on security transactions5
0.0 0.0 0.0 708 0.1 0.4
Education tax for financial institutions6
0.0 0.0 0.0 515 0.1 0.3
Other7 619 1.6 9.3 1,109 0.2 0.6 Surtax on excise taxes8 148 0.4 2.2 213 0.0 0.1 Property 594 1.5 8.9 23,443 3.2 12.8 Taxes on transactions 295 0.8 4.4 14,368 2.0 7.8 Registration tax (local) 122 0.3 1.8 7,550 1.0 4.1 Acquisition tax (local) 163 0.4 2.4 5,503 0.8 3.0
Inheritance and gift taxes 10 0.0 0.1 1,315 0.2 0.7 Surtax on transaction taxes9 0 0.0 0.0 1,704 0.2 0.9 Taxes on wealth holding 296 0.8 4.4 6,255 0.9 3.4 Property tax (local) 119 0.3 1.8 903 0.1 0.5 Tax on aggregate land
0.0 0.0 holdings (local)10
0.0 1,603 0.2 0.9
Automobile tax (local) 57 0.1 0.9 1,778 0.2 1.0 Other11 120 0.3 1.8 1,971 0.3 1.1 Surtax on wealth taxes12 2 0.0 0.0 1,116 0.2 0.6 Customs duties 1,014 2.6 15.2 7,174 1.0 3.9 Customs duties 762 2.0 11.4 6,847 0.9 3.7 Other13 252 0.6 3.8 327 0.0 0.2
Social security and payroll 107 0.3 1.6 36,291 5.0 19.8 Social security contributions14 73 0.2 1.1 35,870 4.9 19.5 Taxes on payroll and workforce
0.5 (local)15
34 0.1 421 0.1 0.2
Other16 349 0.9 5.2 2,116 0.3 1.2 Memorandum items Taxes on financial services17 n/a n/a n/a 7,058 1.0 3.8 Surtax 873 2.3 13.1 14,157 2.0 7.7 Earmarked taxes18 856 2.2 12.8 22,322 3.1 12.2 GDP 38,775 724,675 Sources:OECD
National Tax Service (1981, 2004), Statistical Yearbook of National Tax; (2005), Revenue Statistics 1965-2004; and author’s calculations.
1Defense tax as a surcharge on income tax and the exemption of income tax (repealed in 1990); resident tax on income tax; special tax for rural development on the exemptions of
3 earmarked for local education.
rtation facilities; 14.2% for local spending (environment
the exemptions of corporate income tax,
6
s7
ax, motor fuel tax as a
c9 ent as a surcharge on acquisition tax and the exemption
sition tax; local education tax as a surcharge on registration
11 stamp tax, revaluation tax (repealed in
12
d
15Business place tax on income (0.5% of wages and salaries).
income tax (since 1994). 2Fully earmarked for local spending. Forty five percent of tax revenue 4Earmarked: 85.8% for transpofrom 2005). 5In addition to securities transaction tax, special tax for rural development is levied on special excise tax, and as a surcharge on personal income tax, customs duties. 0.5% of gross receipts of financial institutions. Education tax is also levied as a urcharge on special excise tax, transportation tax and liquor tax.
Monopoly profit (repealed in 1988), telephone tax (repealed in 2001; earmarked for local spending), defense tax, leisure tax, butchery tax, license tax, and regional development tax. 8Defense tax, special tax for rural development, education tsurcharge on transportation tax, and local education tax as a surcharge on tobacco onsumption tax and leisure tax (since 2001).
Special tax for rural developmof registration tax and acquitax 10Replaced by comprehensive real estate holding tax since 2005. Urban planning tax, community facilities tax,2000), and business place tax (since 1990). Defense tax as a surcharge on inheritance and gift taxes; special tax for rural evelopment as a surcharge on tax on aggregate land holdings; local education tax as a
surcharge on tax on aggregate land holdings, property tax, and automobile tax. 13Education tax as a surcharge on special excise tax on imported goods; special tax for
rural development as a surcharge on the exemption of customs duties. 14National welfare pension fund, unemployment insurance, health insurance, teachers’ pensions, government employees pensions (employees), military personal pensions(employees), and industry workers’ insurance fund (employers).
16Taxes on previous year base.
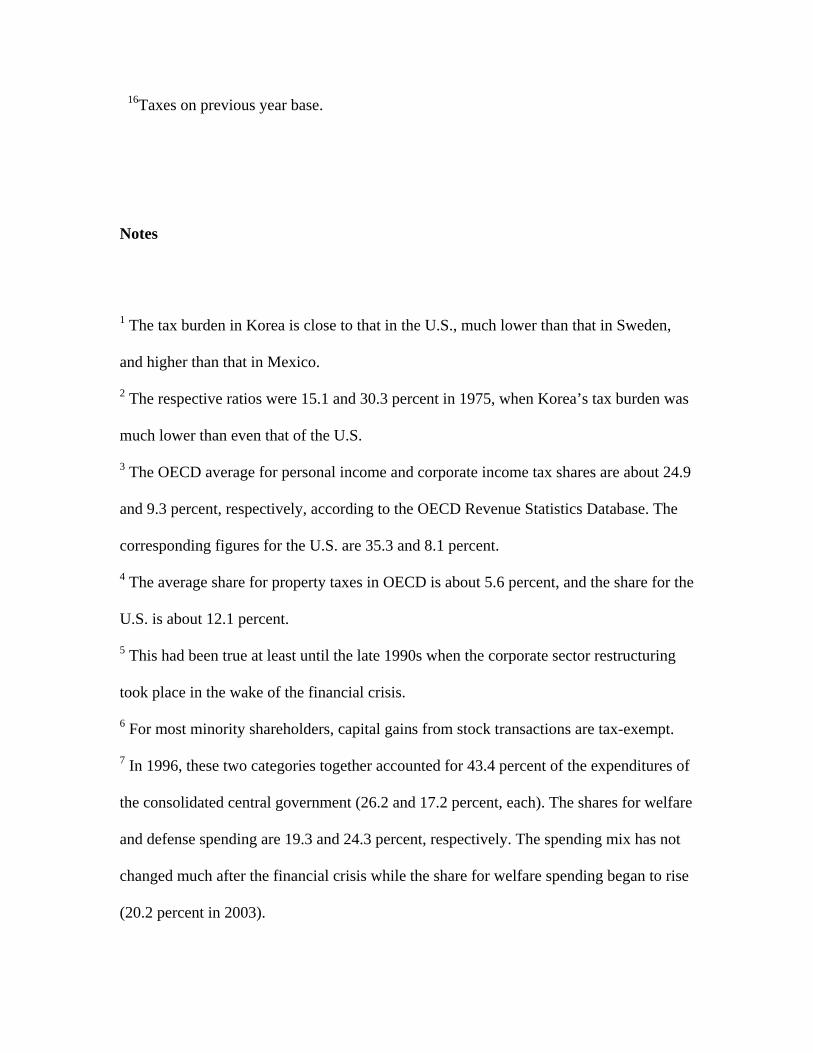
The tax burden in Korea is close to that in the U.S., much lower than that in Sweden,
and higher than that in Mexico.
The respective ratios were 15.1 and 30.3 percent in 1975, when Korea’s tax burden was
much lower than even that of the U.S.
The OECD average for personal income and corporate income tax shares are about 24.9
and 9.3 percent, respectively, according to the OECD Revenue Statistics Database. The
corresponding figures for the U.S. are 35.3 and 8.1 percent.
The average share for property taxes in OECD is about 5.6 percent, and the share for the
U.S. is about 12.1 percent.
5 This had been true at least until the late 1990s when the corporate sector restructuring
took place in the wake of the financial crisis.
For most minority shareholders, capital gains from stock transactions are tax-exempt.
In 1996, these two categories together accounted for 43.4 percent of the expenditures of
the consolidated central government (26.2 and 17.2 percent, each). The shares for welfare
and defense spending are 19.3 and 24.3 percent, respectively. The spending mix has not
changed much after the financial crisis while the share for welfare spending began to rise
(20.2 percent in 2003).
Notes
1
2
3
4
6
7
sive of social security contributions in 2003.
use the former faces
x, have also been partly motivated by the objective of curbing housing-price
r rural
s is provided in the appendix.
ral
opment. While the transportation tax is imposed on the sales of petroleum products,
and rates. Local governments
h as
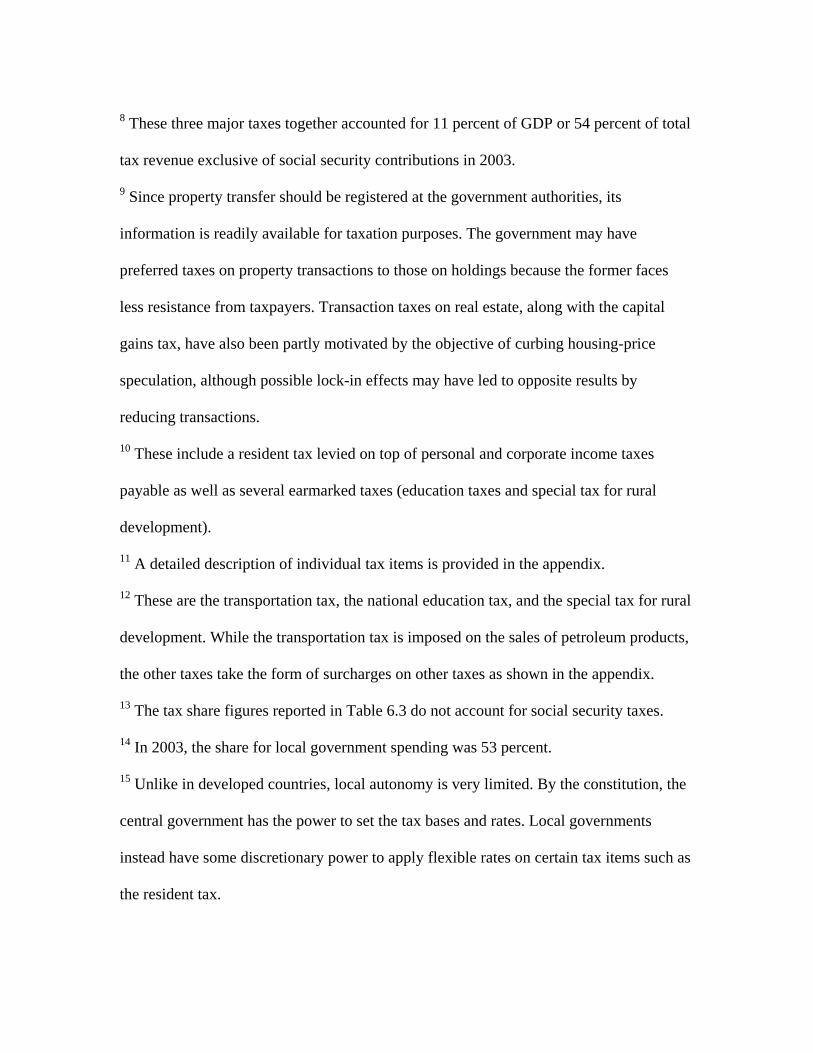
8 These three major taxes together accounted for 11 percent of GDP or 54 percent of total
tax revenue exclu
9 Since property transfer should be registered at the government authorities, its
information is readily available for taxation purposes. The government may have
preferred taxes on property transactions to those on holdings beca
less resistance from taxpayers. Transaction taxes on real estate, along with the capital
gains ta
speculation, although possible lock-in effects may have led to opposite results by
reducing transactions.
10 These include a resident tax levied on top of personal and corporate income taxes
payable as well as several earmarked taxes (education taxes and special tax fo
development).
11 A detailed description of individual tax item
12 These are the transportation tax, the national education tax, and the special tax for ru
devel
the other taxes take the form of surcharges on other taxes as shown in the appendix.
13 The tax share figures reported in Table 6.3 do not account for social security taxes.
14 In 2003, the share for local government spending was 53 percent.
15 Unlike in developed countries, local autonomy is very limited. By the constitution, the
central government has the power to set the tax bases
instead have some discretionary power to apply flexible rates on certain tax items suc
the resident tax.
about 45 percent of total local tax revenues. The resident tax
s with dependents.
l
rean rate was 29.7 percent.
and
d
of specified categories, and others.
re higher for securities listed on the KOSDAQ
and for unlisted securities.
16 Taxes on transactions involving real estate and automobiles are a dominant type of
property taxation, providing
is levied on top of personal and corporate income taxes payable.
17 Tax brackets are not indexed for inflation, resulting in a downward base-broadening
effect.
18 Additional exemptions are available for family members 65 years or older and six
years old or younger, for handicapped, and for female heads of familie
Itemized deductions are available for insurance premiums, medical expenses, educationa
expenses, interest and mortgage loans for housing, and charitable donations.
19 According to OECD revenue statistics, the unweighted average was 30.7 percent in
2003 when the Ko
20 This low level of threshold allows only very small firms to be eligible for the lower
rate.
21 Indirect exports: certain machinery and materials for agriculture, fishery, livestock
forestry industries; services supplied by ships and aircraft in international traffic; an
social infrastructure and building projects supplied to government authorities.
22 Basic necessities, social welfare services, certain goods and services of cultural content,
personal services
23 As of 2005, the ratios include 20 percent to manufacturing, utilities, and retail; 30
percent to agriculture, fisheries, construction, and real-estate rental; and 40 percent to
transportation, warehousing, communication, restaurants, and hotels.
24 The securities transactions tax rates a
ds
ing and local education.
e
many of which are operated through on- or
t of GDP
sed often differs. The Korean measures are based on income of urban working
nd capital income, which are likely
P, but their impact on distribution
is limited.
25 Revenue from the liquor tax is earmarked to finance local spending, while the procee
from the special excise taxes on automobile sales are split into transportation facilities,
local spend
26 Fifteen percent for local expenditures and 13 percent for local education in 2003; thes
ratios were increased to 19.13 and 19.4 percent in 2005, respectively.
27 Customs duties imposed on railroad-related imports are also earmarked to an account
for railroad facilities. In addition to taxes, numerous fees, charges and levies are
earmarked to various government activities,
off-budget funds.
28 During the 1980s, the defense tax, imposed as a surcharge on a wide range of income
and consumption taxes, was the most significant example of earmarking, deriving
revenues of up to about 2 percent of GDP. When this tax was repealed in 1991, the
government initially struggled to make up the lost revenue. It did so essentially by
introducing new earmarked taxes such as the transportation tax and the special tax for
rural development. Revenue from earmarked sources has reached about 3 percen
in recent years.
29 Comparison of the Gini coefficient across countries is tricky because the definition of
income u
households, and do thus not include self-employed a
to be more unequal than wage income.
30 Properties transactions are taxed more heavily than property holdings. Taxes on real
property gains are non-negligible at 0.3 percent of GD
m tax base and take many forms: exclusions, exemptions,
ere were no tax
arges.
f
ences might largely be inframarginal and not inducing much new savings.
est contribution of tax policy
ency costs is also very limited and unreliable.
berg 1996),
.
ict tariff protection and directed credits for the taxed sector as well as other
r the OECD is 16.3 percent. The ratio for Mexico is 33.2, for the U.S.
rkers.
31 Tax expenditures are defined in the Korean tax laws as revenue losses caused by the
exclusion of some item fro
deductions, credits, a preferential rate of tax, or a deferral of liability. Th
expenditures for the education taxes and the special tax for rural development, which are
mostly collected as surch
32 The VAT is the next largest tax-expenditure item.
33 Since Korea is already a country with high savings, it is often argued that the impact o
tax prefer
According to unpublished government studies, the effects of most investment incentives
are very limited. The World Bank (1993) reports a very mod
to economic growth, i.e. about 6 percent of total GDP growth for the period 1962-82.
34 Domestic evidence on the effici
Considering empirical estimates from the U.S. (e.g., Feldstein and Feen
however, these costs could be very large since the tax bases are narrower in Korea than in
the U.S.
35 These incentives are discussed in a later section.
36 State-owned banks will allow the government easier access to information about firms
They also pred
instruments hindering activity in the untaxed sector.
37 The average fo
8.4, and for Sweden 18.3.
38 The broadly-defined self-employed includes unpaid family wo
ent.
0 firms
ed on a stock exchange or registered with the Financial Supervisory
03 and had declined to 14 percent in 2005.
n 10
come are not required to file tax returns for
ion won of capital gains taxes, 2.5 trillion won (86 percent) are
ct
39 According to OECD (2006), Turkey, Greece, and Mexico are the top three. The OECD
average is 17.4 perc
40 These figures are calculated from the author’s firm data base, consisting of 2,34
which are either list
Service.
41 Of course, this is not a direct evidence on the extent of cash transactions, since firms
may hold cash for reasons other than transactions purposes.
42 Global taxation of capital income was suspended during 1998-2000 to prevent negative
impacts on the financial markets.
43 It was 15 percent as in 20
44 Final withholding rates depend upon the sources of gains, characteristics of ownership,
and holding periods, with share gains at 10 to 30 percent and real property gains at 9 to
70 percent in 2005. Gains from share transactions are tax-exempt for most minority
shareholders (having share ownerships less than 3 percent and share values less tha
billion won).
45 Those who have only wages and salary in
global taxation.
46 Out of 2.9 trill
accounted for by real property gains. The rest is for share gains.
47 The self-employed and salary and wage earners with other income sources are subje
to global taxation.
48 Employees find it very difficult to evade taxes since their income is taxed on a
withholding basis.
er.
on data available from the National Tax Service.
rporate income.
state-owned or under strict government control before the
contributions were
49 This amounts to the product of the prescribed value-added rate and input taxes paid.
50 In a normal case, input tax credits are available only for taxes due on total turnov
51 Author’s calculation based
52 See Gordon and Li (2005) for a formal model. Capital-intensive firms are presumed to
be closely tied to the financial sector, for example, because their needs to raise capital
make bank loans valuable.
53 The effective tax rates for small firms are not as low as institutions forecast before the
financial crisis, possibly implying a tax shifting between personal and co
Note that the relative tax burden on personal income dropped due to sharply increased
personal allowances after the crisis, implying a reduced incentive to shift personal
income into corporate income.
54 Export subsidies were repealed in 1999.
55 Korean banks were either
financial crisis.
56 Deductions for earned income, educational expenses, and charitable
raised, and deductions for pension income were introduced. The elderly and disabled
received additional deductions and tax-exempt savings opportunities. Income tax rates
were reduced by 10 percent across the board, from 10-40 percent to 9-36 percent,
effective from 2002.
57 Instead, withholding taxes were imposed on all dividends and interest at the source.
58 In 1999, special excise taxes on electronic goods, food and beverages, and other
necessities were eliminated.
ent Zone were made exempt from personal and corporate
ree years.
;
tion taxes were exempted on transactions
ld to
eir
en for
inating
anded sample shows similar results.
of
5 percent of income, up to 5 million won. For a rough illustration, a person who earns
0 million won a year and exhausts the deduction limit can reduce the effective tax rate
y 10 percent of the marginal tax rate. This appears to be a strong incentive. The size of
this incentive was increased further in the years following its adoption and has begun to
be scaled down recently.
59 Foreign investors and firms investing in high-technology or investing more than $100
million in a Foreign Investm
income taxes for seven years and granted a 50 percent reduction for a further th
Additional tax incentives for such investments were made available by local governments
in the form of reduced property, acquisition, and registration taxes.
60 Taxes on revaluation profits following mergers and acquisitions have been deferred
taxes on capital gains on asset and equity transactions for restructuring were put off;
acquisition, registration, and securities transac
related to restructuring; and taxes on capital gains accruing to assets that were so
repay debt were exempted.
61 To facilitate the closures of non-viable financial institutions, proceeds from th
liquidations, mergers, or sales of assets were exempted from taxation.
62 The author’s analysis of the sources of changes in the corporate effective burd
listed Korean companies confirmed that the changes in the debt ratio were the dom
factor raising corporate tax burn after the crisis (see Jun 2004). A follow-up and on-going
study using an exp
63 As of 2005, a taxpayer can deduct 20 percent of credit card consumption in excess
1
5
b
A tax credit for credit card sales has been available since 1994. In 2000, the
3
to 5 mi
65 Like
audit tr ons. When a merchant issues a cash-receipt, the transaction is
lectronically reported to the tax authorities.
underre
million scheme.
These include adoption of a self-assessment system and Charter of Taxpayers’ Rights,
informa
68 Most to those customers with high levels of
redit card usage.
References
Bird, R.M. and Jun, J. (2005). “Earmarking in Theory and Korean Practice.” Paper
presented to Asian Excise Tax Conference, Singapore.
64
government increased the credit rate from 1 to 2 percent and the maximum credit from
llion won. In 2004, the credit rate was reduced back to 1 percent.
the case with credit card incentives, the purpose of this scheme is to create an
ail of retail transacti
e
66 In addition, the government introduced a penalty (a 10 percent surcharge) for
porting of taxable income, and an incentive (a 10 percent tax credit, up to 1
won) for bookkeeping by those operating under the simplified
67
overhaul of the organizational structure of the National Tax Service, and use of
tion technology in tax processing and in maintaining a taxpayer database.
Korean banks provide preferred rate loans
c
69 See Dalsgaard (2000) and Ministry of Finance and Economy (2005), for example.
years. Seoul:
Bureau of Local Finance and Economy Ministry of Government Administration
cs Department Working Papers No. 271, Paris: OECD
(Organization for Economic Cooperation and Development).
Gordon “Tax Structure in Developing Countries: Many Puzzles
and a Possible Explanation.” NBER Working Paper No. 11267. Paris: NBER
t of Increased Tax Rates on Taxable
Income and Economic Efficiency: A Preliminary Analysis of the 1993 Tax Rate
Press.
Jun, J. native Measures of Effective
Corporate Tax Rates.” Korean Journal of Public Economics, 9/1. The Korean
Ministr 2005). “Directions of Tax Reform.” Unpublished.
Seoul: Ministry of Finance and Economy. (September). (Mimeo).
Bureau of Local Finance and Economy Ministry of Government Administration and
Home Affairs. Financial Yearbook of Local Government. Various
and Home Affairs.
Dalsgaard, T. (2000). “The Tax System in Korea: More Fairness and Less Complexity
Required.” OECD Economi
, R. and Li, W. (2005).
(National Bureau of Economic Research).
Feldstein, M. and Feenberg, D. (1996). “The Effec
Increase.” Tax Policy and the Economy, J. Poterba (ed.). Cambridge: MIT
(2004). “Firm Characteristics and Tax Burden: Alter
Association of Public Finance (in Korean). (May).
y of Finance and Economy (
______ y.
ational Statistical Office (2006). Economically Active Population Survey. Seoul: Korea
ational Tax Service. Statistical Yearbook of National Tax. Various years. Seoul:
National Tax Service.
OECD (2005). Revenue Statistics 1965-2004. Paris: OECD.
________ (2006). Fact Book 2006. Paris: OECD
Schneider, F. (2005). “Shadow Economies of 145 Countries all over the World:
Estimation Results over the Period 1999 to 2003.” Discussion Paper. University
of Linz: Department of Economics, Linz, Austria.
Son, W., Jung, J., Kim, H.J. and Kim, S.H. (2004). “Quasi-taxes on Businesses and Their
Policy Implications.” Korea Institute of Public Finance (in Korean). Seoul: Korea
Institute of Public Finance.
__. “Korean Taxation.” Various years. Seoul: Ministry of Finance and Econom
N
National Statistical Office.
N
Sung, Mung-Jae, Park, H.S. and Jun, B.M. (2004). “The Effects of Tax Policy on Income
Distribution and Resource Allocation.” Korea Institute of Public Finance (in
Korean). Seoul: Korea Institute of Public Finance.
World Bank (1993). “The East-Asian Miracle: Economic Growth and Public Policy.”
New York, NY: Oxford University Press.