Embed Size (px)
Citation preview
J. theor. Biol. (1970) 26, 399-4 15
Initiation of Slime Mold Aggregation Viewed as an Instability
EVELYN F. KELLER AND LEE A. SEGELf
Biomathematics LXvision, Graduate School of Medical Sciences, Cornell University, and Sloan-Kettering Institute, New York, N. Y., U.S.A.
(Received 13 May 1969, and in revised form 8 August 1969)
The chemotactic interaction of amoebae, as mediated by acrasin, is evidenced in a variety of ways, the most dramatic of which is aggregation. In this paper we present a mathematical formulation of the general inter- action, and provide a detailed analysis of the aggregation process. By analogy with many problems in the physical world, aggregation is viewed as a breakdown of stability caused by intrinsic changes in the basic parameters which characterize the system. This point of view provides a description of aggregation which does not require that any cells be distinguished, but rather assumes a homogeneous population.
1. Introduction
In the morphogenetic development of many species of cellular slime mold (Acrasiales) some interesting effects of long-range intercellular interaction can be observed. The interaction may be of a repulsive or attractive nature, depending on the stage of the cells’ life cycle. Immediately following germination, the cells disperse as if acting under a mutual repulsion. When a source of food (bacteria) is present, the cells move toward it with a high positive chemotactic index. After exhausting their food supply, the amoebae first tend to distribute themselves uniformly over the space available to them, but later they begin to aggregate in a number of “collecting points” or centers. At each center a slug forms, migrates and eventually forms a multi- cellular fruiting body.
It has been known for some time that aggregation is mediated by a chemical substance, which has been called acrasin, and that the acrasin is degraded by an extracellular enzyme which has been called acrasinase. [A survey of results up to 1966 can be found in Bonner (1967).]
Particular interest in slime mold morphogenosis has been excited by the recent identification of a chemical which appears to act as acrasin in
t On leave during 1968-69 academic year from Department of Mathematics, Rensselaer Polytechnic Institute.
399
400 E. F. KELLER AND L. A. SEGEL
Dictyostelium discoideum (Konijn, Van de Meene, Bonner & Barkley, 1967). This substance is adenosine 3’, 5’-cyclic monophosphate (3’, 5’-cyclic AMP). The same species has also been found to produce a phosphodiesterase which acts as an acrasinase by converting 3’,5’-cyclic AMP to chemo- tactically inactive 5’-AMP (Chang, 1968). These discoveries have encouraged us to try to deduce the co-operative behavior of a population of amoebae from their individual properties. It should be emphasized, however, that our theory requires the chemical identity of acrasin only when assigning values to certain parameters.
This paper reports the results of a study of aggregation which is premised on the simplest possible assumptions consistent with the known facts. In our analysis aggregation develops as a consequence of a magnification of certain of the inhomogeneities which inevitably perturb a uniform distribution of amoebae. Such an instability is a consequence of changes in the properties of the individual cell. That changes of the required nature have recently been quantified lends credibility to our model.
In deducing the aggregative behavior of slime mold amoebae from their individual properties we are exhibiting a specific mechanism for a particular morphogenetic process. This has added significance if, as some believe, aggregation is a representative phenomenon in morphogenesis.
2. Formnlation
The concentration (mass per unit area) of amoebae is described by a continuous function a@, y, t) where x and y represent the spatial co-ordinates and t represents the time. Similarly, the concentration of acrasin and acrasin- ase are described by continuous functions p(x, y, t) and q(x, y, t), respectively. The basic processes which are described in our equations are:
(a) Acrasin is produced by the amoebae at a rate f(p) per amoeba. To allow for possible dependence of acrasin production on the ambient con- centration of acrasin (Shaffer, 1956), f is allowed to depend on p.
(b) Acrasinase is produced by the amoebae at a rate g(p, q) per amoeba. Here g is permitted to depend on the ambient concentrations of both acrasin and acrasinase.
(c) Acrasin and acrasinase react to form a complex C (of concentration c) which dissociates into the free enzyme plus the degraded product. That is
p+q$Ckfq+product. k-1
(d) Acrasin, acrasinase and the complex diffuse according to Fick’s law.
SLIME MOLD AGGREGATION 401
(e) Amoeba concentration changes as a result of an oriented chemotactic motion in the direction of a positive gradient of acrasin and a random motion analogous to diffusion.
We do not include in this list the interaction of amoebae and bacteria. Although equations for this process can also be formulated, it is possible to separate the effect of bacteria from the mutual interaction of amoebae. This is demonstrated by the observation that in the absence of bacteria, germinating cells can proceed directly to aggregation (Bonner, 1967).
The acquisition of stickiness is another factor which we shall ignore. This is permissible only when clumping is negligible, as is generally true in the earlier stages of aggregation. In some species clumping is not appreciable even in later stages where dense clouds of distinct cells have appeared (Shaffer, 1962, Figs 11 and 12).
The next step is to incorporate processes (a) to (e) into equations for u, ~1, c and p. To do this consider an arbitrary fixed region A in the plane on which the amoebae are located. Balance of amoeba mass requires
a ;ii II adxdy = j/[email protected]@)*nds
A A s (2.1)
where Q@‘(x, y, t) is the mass of amoeba created per unit area per unit time, J’“‘(x, y, t) is the flux of amoeba mass and n is the unit exterior normal to S, the boundary of A. [#“I has dimensions mass per unit length per unit time.] The above equation implies?
aa/& = Q@) -V .J@).
Entirely analogous equations hold for p, c and q. We ignore reproduction so Q (u) = 0. Q@, QCp), Q(g) have contributions
from chemical reaction described by the law of mass action. Q@) and Q(“’ also have contributions reflecting the production of acrasin and acrasinase by the amoebae. The flux terms are of diffusive type:
J“” = D,Vp - D,Va Jcp) = - D,Vp, J(‘) = - D,Vc, J(“) = - D,,Vtj, (2.2)
where D,, D, and D, can be taken to be constants. The amoeba flux J’“’ contains a contribution which is proportional to the acrasin gradient, in
t Assuming necessary smoothness, application of the divergence theorem to (2.1) gives
SJ [i?a/i%- Q’“‘+ V J’“‘] dx dy = 0. A
I f this equation is to hold for arbitrary A then the integrand must vanish, yielding the desired differential equation.
402 E. F. KELLER AND L. A. SEGEL
analogy with the dependence of heat flux on temperature gradient (Fourier’s law of cooling) and the dependence of solute flux on concentration gradient (Fick’s law). Assuming that threshold effects can be ignored, it can be shown that a gradient-proportional response is inevitable for sufficiently weak changes in the acrasin level. The reasoning used is the same as the reasoning behind Newton’s and Fick’s laws. Similarly, the term D,Va represents a diffusion-like contribution to J,, due to random motion. In (2.2) D,(p, a) is
a measure of the vigor of the random motion of the individual amoebae and D,(p, a) is a measure of the strength of the influence of the acrasin gradient on the flow of amoebae. (The signs in (2.2) are chosen so that D, and D, will be positive, since amoebae flow toward a relatively high value of acrasin concentration and a relatively low value of amoeba concentration.) A possible form of D,(p, a) is
D, = ha/p (2.3)
where 6 is a constant. The factor Q derives from the fact that the flux of amoebae must be proportional to their density. The factor p- ’ is in accordance with the plausible assumption (Shaffer, 1956) that the amoebae are sensitive to the relative acrasin gradient p-‘VP.
We are thus led to the following equations? for p, q, c and a:
aa 5 = -VQ,Vp)+VQ,va), (2.4)
ap 5 = -klprl+k_,c+uf(p)+D,V2p,
ac at = k,pq -(k-, + kz)c+ D,V’c,
alt - = -k,p?+(k-,fk2)c+Qg(p,tt)+DgVZtl. at
(2.5)
(2.6)
(2.7)
Here kl, k- I and k, are the rate constants for the acrasin-acrinase reaction. Equations (3) to (7) completely describe our model. Given initial values
of p, c, q and a, these equations can in principle be solved to give p, c, q and u for all later times.
t In two dimensions
v .(DVf) = $(D 2) + $(D ;).
if D is constant this reduces to
DV'f= D[a'flf/aX2+aaf/aY%
SLIME MOLD AGGREGATION 403
3. Aggregation: A Simplified Model In this paper we shall devote our main attention to the aggregation process.
Our basic point of view is to regard aggregation as a manifestation of in- stability in a uniform distribution of amoebae and acrasin. We assume throughout a homogenous population of cells. Early in the life cycle of the amoebae the properties of the cells are supposed to be such that a uniform distribution is stable. Random non-uniformities which inevitably occur in a real system, decay. At some point in the life cycle of all cells, however, the characteristics of the individual cell change in such a way as to make a uniform distribution unstable. Any spontaneous perturbation can then trigger aggregation. We do not attempt to offer an explanation of the mechanisms for changes in the individual cell, but rather analyze the effects on a popula- tion of cells which result from such changes.
Instabilities of the kind which we shall consider have recently received some attention as possible mechanisms for certain kinds of structure or pattern formation in the biological world (Turing, 1952; Prigogine & Nicolis, 1967). On the other hand, instabilities in the physical world are common and numerous examples have been extensively studied. Particularly relevant are the patterns (BCnard cells) formed due to the instability of top-heavy fluid layers (Chandrasekhar, 1961; Segel, 1966).
In such a preliminary investigation as this it is useful for the sake of clarity to employ the simplest reasonable model. To this end, we make further simplifications which allow the problem to be reduced to two equations for p and a. We stress that these simplifications, while reasonable, are made principally to avoid obscuring essential features with heavy calculations. Preliminary analysis of less simplified equations confirms our belief that our further assumptions do not distort the central aspects of our analysis.
We make Haldane’s assumption that the complex is in a steady state with regard to the chemical reaction:
k,pq-(k-,+kJc = 0. (3.1)
We also assume that the total concentration of enzyme (both free and bound) is a constant, qO:
q+c = qo. (3.2)
It is simplest to view (3.1) and (3.2) as an alternative to (2.6) and (2.7) but a demonstration that our assumption is a first step in a formal approximation procedure can be made along the lines laid out by Heineken, Tsuchiya & Aris (1967).
Any process that depends critically on the production and diffusion of q
404 E. F. KELLER AND L. A. SEGEL
would preclude (3.2)t. Nevertheless, it is plausible that in the preaggregation stage the production rate of acrasinase may be assumed to be small and that inhomogeneities in the concentration of acrasinase are negligible.
It follows at once from (3.1) and (3.2) that
9 = llom +Ol where K = k,/(k- I + k2). With (3.1) and (3.3) (2.5) becomes
+/i% = - k(p)p + uflp) + D,V$, where
k(P) = rloW/l~ + KP). Rewriting (2.4)
(3.3)
(3.4a)
(3.4b)
&z/& = -V*(D,Vp)+V.(D,Va), (3.5)
we see that (3.4) and (3.5) form a simplified problem consisting of two equations for a and p.
4. Stability of the Uniform State
A uniform state for the amoebae and acrasin prior to aggregation appears to be consistent with observation [see Plates I and II in Banner & Hoffman (1963)]. (3.4) and (3.5) possess an equilibrium solution of the form
a = ao, P = p. (p. and a0 constants).
At equilibrium the uniform values of a and p are related by
aof = k(pobo.
(4.1)
(4.2)
We now look for solutions of (4.1) and (4.2) near equilibrium. Of particular importance is the time dependence of these solutions. If the solutions decrease with time, then any random perturbation which might occur in the equi- librium state would decay. If, on the other hand, we found a solution which increased with time, the appearance of any spontaneous perturbation would mark the onset of instability. The perturbation would grow until the system could no longer be described by equilibrium or near-equilibrium equations.
Near equilibrium, we assume that the right-hand sides of equations (3.4a) and (3.5) can be replaced by Taylor expansions in p and a around the equilibrium point (po, ao). That is, we consider small perturbations of a0 and p.
a = a,+ii(x, y, t) Iii1 -4 a0 (4.3) P = po+ie Y, 0 liq @ PO (4.4)
t It is conceivable, for example, that a mechanism for repulsion might be the relatively rapid diffusion of acrasin compared to acrasinase (Banner et al., 1969). Analysis of the equations appropriate for that process will be described in a subsequent paper.
SLIME MOLD AGGREGATION 405
and expand any term in which a and p appear as follows:
F(p, a) = F(p,, a,)+ f?f ( > ap
jq-u, I’? t)+ 2 ( >
3(x, J, t) + . . . . PO, (10 PO. 110
As long as d and p are small we can ignore higher order terms (denoted by . ..) containing factors such as C2, @, p2, Z3, etc. The linear equations which result are
ap - = - lip + a,f ‘(p&j +f(p&i + D,Vy& at (4.5)
a5 at = -D,(ao, po)V2ij+D2(&3, POW% GW
where a prime denotes a derivative and
fi = k(p,) + pok’h)~ (4.7) We look for solutions to (4.5) and (4.6) of the form
ii = i2 cos (q1x+q2y) en’, f? = /I cos (q,x+q,y) en’ (4.8) where ci, j?, ql, q2 and tr are constants.? (Assuming solutions proportional to sin (qlx +q2y) leads to the same results.): Substituting (4.8) into (4.5) and (4.6) we obtain
(F - o>B +f(Po)~ = 0, (4.9a) D,q2jv-(D2q2++3 = 0, (4.9b)
where it is understood that D, and D, are evaluated at a = a,,, p = p,,, and
q2 - q:+q;: F =:f’(p,&-&q2D,. (4.10) Equations (4.9) for b and ci have a non-trivial solution if and only if the determinant of the coefficients vanishes. It follows that
cr2--o(F-q’D,)-(q2f(p,)D,+q2D2F) = 0. (4.11) Equation (4.11) has the form
a2+ba+c = 0, the roots of this equation are real, since b2 > 4c, and will both be negative if and only if b > 0 and c > 0, or
F < q*b F < -f(~&lDz. (4.12a, b) Sincef(p,), D, and D2 are positive, if (4.12b) is satisfied then (4.12a) will be satisfied. For a given value of q, the sole condition for stability (a < 0) is
t It is here assumed that the amoebae are in an infinite domain. See Appendix B for an analysis of the aggregation of amoebae confined to a finite domain such as a droplet.
: To see how information on arbitrary perturbations can be deduced from the special solution (4.8), the reader is referred to Appendix A.
406
thus
E. F. KELLER AND L. A. SEGEL
4f(Po)+~2f’(Po)~o < D2(ft+Q12). (4.13) Instability will occur if the left side of (4.13) exceeds the right side. This will first occur for disturbances associated with a zero value of ~1. (BY solving (4.11) one can also show that unstable disturbances with q = 0 always grow fastest.) The final instability condition therefore is
W(Po) + uof’(Po) > l -- D,k ____ * E
Using (4.2) this can be rewritten as
DlPO ___ -~ > I. %a0
+ aol’(PoJ E
With the special hypothesis (2.3), equation (4.15) becomes
W2 + aof’(~o)/k ’ 1.
(4.14)
(4.15)
(4.16) Near marginal stability (when CJ = 0), we have from (4.8) and (4.9b)-
neglecting cr in the latter and choosing co-ordinates so that the “streaks” of high and low density are parallel to the y-axis-that
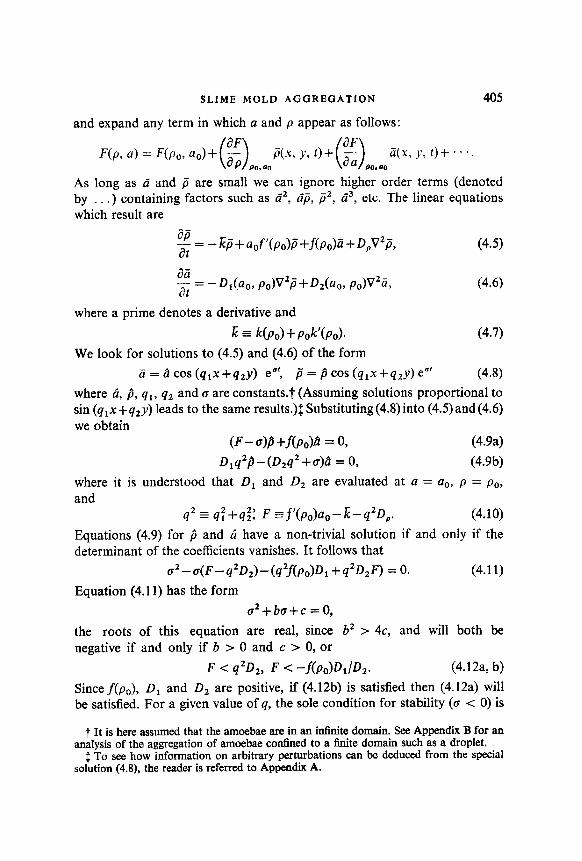
p = p. +.zD2 cos qx exp (at), a = a, +&D1 cos qx exp (ot), where E is a small parameter left indeterminate by linear theory (see Fig. 1).
5. Analysis of the Instability Condition
A better understanding of the instability condition (4.14) can be obtained by an examination of some of its qualitative features. Given any initial perturbation, there are factors which tend to make it decay and factors which tend to make it grow. Instability occurs when the latter outweigh the former. The two terms in (4.14) indicate two quite different and independent possible sources of instability. It is worthwhile examining them separately.
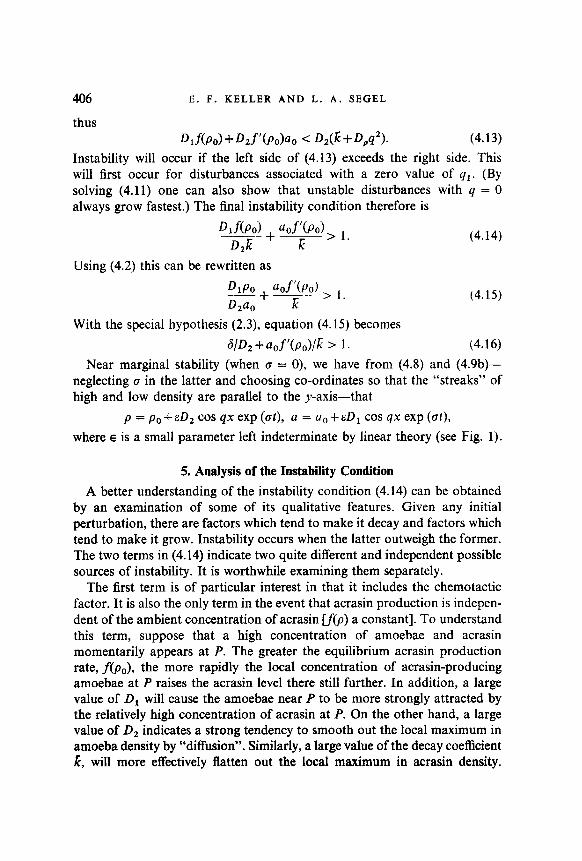
The first term is of particular interest in that it includes the chemotactic factor. It is also the only term in the event that acrasin production is indepen- dent of the ambient concentration of acrasin u(p) a constant]. To understand this term, suppose that a high concentration of amoebae and acrasin momentarily appears at P. The greater the equilibrium acrasin production rate, f(po), the more rapidly the local concentration of acrasin-producing amoebae at P raises the acrasin level there still further. In addition, a large value of D, will cause the amoebae near P to be more strongly attracted by the relatively high concentration of acrasin at P. On the other hand, a large value of D2 indicates a strong tendency to smooth out the local maximum in amoeba density by “diffusion”. Similarly, a large value of the decay coefficient k, will more effectively flatten out the local maximum in acrasin density.
SLIME MOLD AGGREGATION 407
- / ao
--X
FIG. 1. Top: Graph showing sinusoidal perturbation of acrasin density a and amoeba density p [cf. equation (4.17)]. Bottom: Corresponding “streaks” of relatively high amoeba concentration (more heavy circles) and acrasin concentration (heavier shading). The arrows in this schematic diagram show the direction of amoeba motion. Superposition of “streaks” can give “clouds” as shown in Fig. 3.
Whenf’(p,)a,/k is negligible compared to one, it is thus the relative pre- dominance of the combined effects of diffusion and decay on the one hand, and acrasin production and the chemotactic response on the other hand, which determine the stability or instability of a uniform distribution of amoebae and acrasin (see Fig. 2). Since k is characteristic of the acrasin and not of the cell which produces it, the cellular development which would precipitate aggregation must be reflected in an increase in D, orf(p,) or a decrease in D,.
1.R. 26
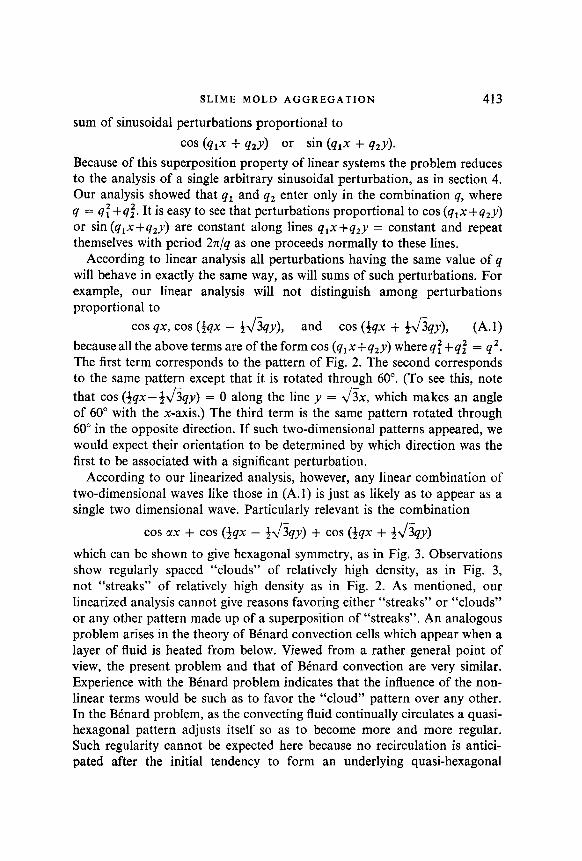
408 E. F. KELLER AND L. A. SEGEL
Acrasln decays
More amoebae:more acrasm
craw attracts amoebae
+ Amoebae’diffuse”
FIG. 2. Reaction to local concentration of amoebae (heavy circles) and acrasin (shading) when acrasin production rate is constant. Heavy arrows indicate tendencies to increase the local concentration still further. Dashed arrows indicate tendencies to return local con- centration to equilibrium values. Instability occurs if the former tendency outweighs the latter.
The second term in (4.14) illustrates another mechanism for instability. The inequality aoS’(~,J > & implies that a small increase in acrasin level causes an increase in acrasin output which outweighs its more rapid decay. This would lead immediately to an instability in the level of acrasin. If D, = 0, then this would be the only mechanism for instability. However, if D, = 0, the amoeba are unaffected by the acrasin level, and aggregation would not be observed. It is only by virtue of a non-vanishing D, that an instability in acrasin level can lead to a breakdown of the uniform distribution of amoebae.
Our simplified model predicts that instability will commence at q = 0 and hence at infinite wavelength. [The quantity q is the wavenumber of the perturbation (4.8) and 2x/q is its wavelength (see Appendix A).] It can be seen from (4.11) with 0 = 0 that the stabilizing effect of amoeba diffusion and the destabilizing effect of chemotaxis both decrease with q but the ratio of the two effects is unity. Equation (4.13) shows that the stabilizing effect of acrasin diffusion also decreases as q decreases. The latter merely reflects the fact that a local maximum and a local minimum of acrasin concentration cancel each other by diffusion less quickly if they are further apart. Perturbations of infinite wavelength are most likely to grow because they are unaffected by acrasin diffusion. [Note that D, does not appear in the instability condition (4*14).]
SLIME MOLD AGGREGATION 409
Taken literally, our physically unrealistic prediction of infinite territory size casts doubts on the correctness of our other predictions. Experience with other stability problems, however, indicates that there is no cause for alarm. The prediction q = 0, correctly interpreted, indicates that the wavelength at the onset of aggregation is so large (in some sense) that it cannot be quanti- tated in a crude model. Prediction of a finite territory size should emerge from analysis of a more refined model. Preliminary calculations based on the full set of equations described in section 2 indicate that this is so.
A threshold in the chemotactic response of the amoeba would be a mechan- ism which would have the effect of limiting territory size. To make a crude estimate of this effect, let us assume that the amoebae are not sensitive to acrasin gredients unless the spatial average of lVp/pl is larger than some constant u. From (4.4) and (4.8) this assumption requires
4D > w. or 1 = 27c/q > 2np^/(ap,).
The instability condition (4.13) is modified to
W(Po) + aof’ D2E lz > l+Dpa$.
Note the dependence on the perturbation amplitude fi. This dependence was absent in (4.13). Without a threshold, both stabilizing and destabilizing effects are proportional to perturbation amplitudes. Their ratio is therefore independent of these amplitudes.
The existence of a threshold is generally believed to be crucial in any realistic model of the behavior of amoebae. The fact that the chemotactic effect is long range suggests that the amoebae are able to respond to quite small gradients in acrasin. This in turn implies that the threshold may be very low. The necessity of a low threshold has caused some concern in the minds of many investigators because of the difficulty in imagining plausible biochemical mechanisms for the detection of extremely small differences in concentration over the dimensions of a single cell.
This difficulty can be resolved if one takes account of the fact that instantaneous estimates of the local concentration made by a receptor in a cell of such small dimensions would inevitably exhibit a great deal of fluctua- tion.? The cell might then respond to local fluctuations in concentration and concentration gradient in much the same way as a Brownian particle does.
t One example of such a mechanism is as follows: suppose that the formation of a pseudopod at a particular site were triggered by an unusually high value of the local concentration. Fluctuations of the required magnitude might be rare, but they would occur, with the frequency of occurrence increasing with the average concentration at that site. The net motion of the cell would depend on the relative frequency of pseudopod formation at different sides of the cell, and would thus be proportional to the average con- centration gradient.
410 E. F. KELLER AND L. A. SEGEL
One would then expect the motion of the cell to reflect the randomness of the underlying fluctuations. The amount of fluctuation (and consequently the degree of randomness in the resulting motion) would be reduced if the cell’s estimates of the local concentration were made over some time interval, with the magnitude of the reduction being proportional to the length of the time interval. In this way, one can visualize a chemotactic response in arbitrarily small gradients.
6. Discussion We have shown theoretically that a homogeneous distribution of amoebae
will become unstable if the cells suffer a sufficient increase in (a) their sensitivity to a given acrasin gradient, (b) their rate of acrasin production, or (c) the amount that a high ambient acrasin level stimulates their rate of acrasin production. Definitive qualitative evidence for the applicability of our theory would be provided if one or more of (a) to (c) were observed around the time when aggregation commences.
A preliminary version of this work was communicated to Professor J. T. Bonner who informed us that his group had just shown (Bonner et al., 1969) that both sensitivity to acrasin and its production rate rise lOGfold in D. discoideum during a period spanning the beginning of aggregation. Moreover, those non-aggregating mutants which have been investigated do not show such a rise. Shaffer (1958) had earlier given a qualitative demon- stration that acrasin sensitivity and production rise when aggregation commences.
Because our theory makes a prediction as to the relation between various parameters at the onset of instability, it can be subjected to quantitative test. In view of the simplifying assumptions we have introduced good quantitative agreement with experiment would not be expected. Nevertheless, it should be possible to obtain qualitative agreement between the predictions of this paper and observed conditions. Now that acrasin and acrasinase have been identified, many of the measurements required are quite feasible. The sensitivity parameter D, is perhaps the most difficult to measure. Although it should be possible to impose a given acrasin gradient in the agar, it might be difficult to estimate how much this gradient would be modified by the cell’s acrasinase. As explained in Appendix B, one way to circumvent such difficulties is to examine aggregation in small drops.
We identify territory size with the wavelength of the most unstable distur- bance. We have shown, crudely, that finite spacing may be due to the exis- tence of a threshold and have mentioned preliminary work on more refined models which shows that finite spacing can also arise from the interaction of the amoebae with acrasin and acrasinase. There is no doubt that a spacing
SLIME MOLD AGGREGATION 411
substance is unnecessary, but doubt remains as to whether the amoebae realize this ! Even qualitative comparison of territory size predictions with experiment must await analysis of less simplified models. [We might remark, however, that some degree of satisfaction can be felt even with the prediction of infinite territory size made by our crudest model. This is due to the fact that aggregation sometimes seems to commence with a barely perceptible swirl extending over the entire Petrie dish (Bonner, private communication).] It will be interesting to see whether the theory can explain observations such as that of Bonner & Dodd (1962) that preparations in growth plates (Bonner & Hoffman, 1962) have aggregation territories whose size seems independent of cell density.
Waves of fast inward movement (pulses) are frequently observed during aggregation. Shaffer has suggested an explanation involving a series of directional impulses paced by the center (Bonner, 1967, pp. 51, 111, ff.) As Bonner remarks, Shaffer’s explanation is a way of resolving the seeming inconsistency between the existence of chemotaxis and the frequent failure to demonstrate that the center is especially active in producing acrasin. We suggest that the pulses may be a manifestation of so-called overstability in which the breakup of equilibrium occurs in an oscillatory manner. Such a phenomenon frequently occurs in homogeneous mechanical systems subject to two or more forces of different types (e.g. a rotating fluid layer heated from below) (Chandrasekhar, 1961). Verification of this hypothesis must await further analysis of our original model. Preliminary work indicates that overstability can in principle occur in the present system due to the interplay between acrasin and acrasinase. Further investigation is required before we can ascertain whether ordinary instability sometimes, or always, occurs first.
7. ConcIusions
Our explicit analysis is of highly simplified equations for the change of amoeba density and acrasin density which take into account (a) the decay in acrasin activity, (b) the production of acrasin by the amoeba, (c) the diffusion of acrasin, (d) the diffusive-like random motion of the amoebae, (e) a superimposed chemotactic attraction toward relatively high concen- trations of acrasin. We show mathematically that aggregation inevitably commences when cell properties such as sensitivity and acrasin production rate increase sufficiently. That such increases have been observed (Shaffer, 1958; Bonner et al., 1969) lends strong support to our point of view.
The analysis given here shows that the following properties are unnecessary to explain the onset of aggregation and the non-random spacing of centers: (a) markedly special properties of the centers; (b) acquisition of stickiness; (c) abrupt changes in cellular physiology; (d) orienting impulses paced by
412 E. F. KELLER AND L. A. SEGEL
the center; (e) a spacing substance. It remains to be seen whether these properties nonetheless play important roles in initiating aggregation.
Our central contribution is the idea that the onset of slime mold aggregation can be regarded as an instability of the uniform distribution established when the amoeba cease feeding. The merit of this point of view is independent of the particular simplifying assumptions which our model employs. Indeed, preliminary calculations indicate that if a somewhat less simplified model is used then the same type of analysis may be able to explain the frequent appearance of pulses and the various observations concerning territory size.
We are grateful to J. T. Bonner and D. S. Barkley for advice and encouragement, This work was supported in part by NC1 Grant CA 08748 and by a leave of absence grant to Segel by Rensselaer Polytechnic Institute.
REFERENCES BONNER, J. T. (1967). “The Cellular SIime Molds,” 2nd ed. Princeton: Princeton University
Press. BONNER, J. T. & DODD, M. R. (1962). Biol. BUN. 122, 13. BONNER, J. T. & HOFFMAN, M. E. (1963). J. Embryol. exp. Morphol. 11, 571. BONNER, J. T., BARKLEY, D. S., HALL, E. M., KONIJN, T. M., MASON, J. W., O’KEEFE, G.
& WOLFE, P. B. (1969). Submitted to Develop. Biol. CIUNDRASEKHAR, S. (1961). “Hydrodynamic and Hydromagnetic Stability.” Oxford:
Clarendon Press. CHANG, Y. Y. (1968). Science, N.Y. 160, 57. HEINEKEN, F. G., TSUCHIYA, H. M. & ARIS, R. (1967). M&z. Biosciences 1, 95. KONLIN, T. M. (1965). Develop. Biol. 12, 487. KONIJN, T. M., VAN DE MEENE, J. G., BONNER, J. T. & BARKLEY, D. S. (1967). Proc. nutn.
Acad. Sci. U.S.A. 58, 1152. KONIIN, T. M. (1968). Biol. Bull. 134, 302. PRIGOGINE, I. & NICOLIS, G. (1967). J. them. Phys. 46, 3542. SEGEL, L. A. (1966). In “Non-equilibrium Thermodynamics, Variational Techniques, and
Stability,” p. 165. (R. Donnelly, R. Herman and I. Prigogine, eds.). Chicago: University of Chicago Press.
SHAFFER, B. M. (1956). J. exp. Biol. 33, 645. SHAFFER, B. M. (1957). Am. Nat. 91, 19. SHAFFER, B. M. (1958). Q. J. Microsc. Sci. 99, 103. SHAFFER, B. M. (1962). Adv. Morphogenesis 2, 109. TURING, A. M. (1952). Phil. Trans. R. Sot. Series B, 237, 37.
APPENDIX A Further Discussion of Stability Theory
We wish to determine the circumstances under which disturbances of the homogeneous state will amplify and to ascertain the size and shape of the disturbances which are most likely to be amplified. If variations from equilibrium are small, squares and higher powers of such variations (perturbations) can be ignored and the problem is reduced to the solution of linear equations. Therefore Fourier integral theory shows that any “reasonable” perturbations can be regarded as composed of the weighted
SLIME MOLD AGGREGATION 413
sum of sinusoidal perturbations proportional to
cos (41x + w) or sin (w + 40). Because of this superposition property of linear systems the problem reduces to the analysis of a single arbitrary sinusoidal perturbation, as in section 4. Our analysis showed that q1 and q2 enter only in the combination q, where q = q: +qi. It is easy to see that perturbations proportional to cos (qlx+q,y) or sin (q1x+q2y) are constant along lines q,x+q,y = constant and repeat themselves with period 2n/q as one proceeds normally to these lines.
According to linear analysis all perturbations having the same value of q will behave in exactly the same way, as will sums of such perturbations. For example, our linear analysis will not distinguish among perturbations proportional to
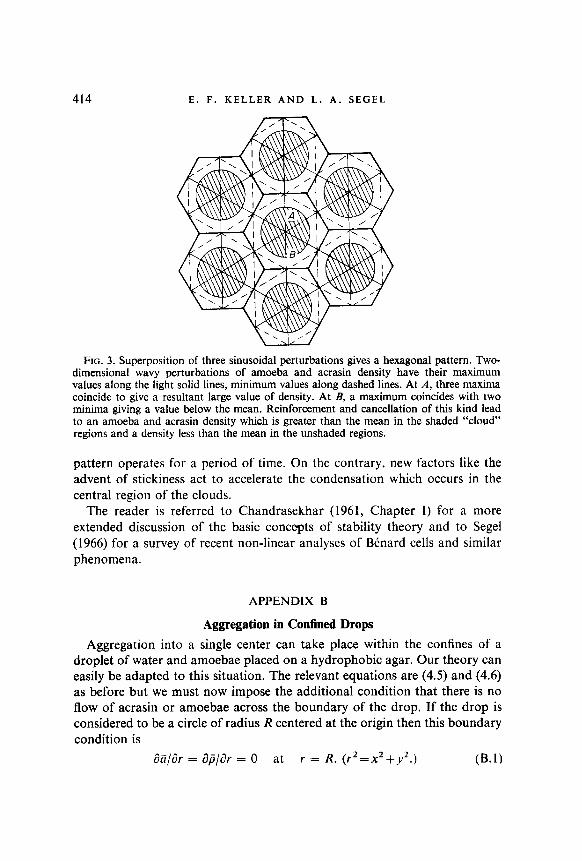
~0s qx, cos (+qx - t&y), and ~0s (km + 3&y), 64.1) becauseall the above terms are of the form cos (q1x+q2y) where qf +qz = q2. The first term corresponds to the pattern of Fig. 2. The second corresponds to the same pattern except that it is rotated through 60”. (To see this, note that cos (+qx- $&qy) = 0 along the line y = 43x, which makes an angle of 60” with the x-axis.) The third term is the same pattern rotated through 60” in the opposite direction. If such two-dimensional patterns appeared, we would expect their orientation to be determined by which direction was the first to be associated with a significant perturbation.
According to our linearized analysis, however, any linear combination of two-dimensional waves like those in (A.1) is just as likely as to appear as a single two dimensional wave. Particularly relevant is the combination
cos ax + cos (&qx - &5qy) + cos(+qx + &hqy)
which can be shown to give hexagonal symmetry, as in Fig. 3. Observations show regularly spaced “clouds” of relatively high density, as in Fig. 3, not “streaks” of relatively high density as in Fig. 2. As mentioned, our linearized analysis cannot give reasons favoring either “streaks” or “clouds” or any other pattern made up of a superposition of “streaks”. An analogous problem arises in the theory of BCnard convection ceils which appear when a layer of fluid is heated from below. Viewed from a rather general point of view, the present problem and that of BCnard convection are very similar. Experience with the Benard problem indicates that the influence of the non- linear terms would be such as to favor the “cloud” pattern over any other. In the BCnard problem, as the convecting fluid continually circulates a quasi- hexagonal pattern adjusts itself so as to become more and more regular. Such regularity cannot be expected here because no recirculation is antici- pated after the initial tendency to form an underlying quasi-hexagonal
414 E. F. KELLER AND L. A. SEGEL
FIG. 3. Superposition of three sinusoidal perturbations gives a hexagonal pattern. Two- dimensional wavy perturbations of amoeba and acrasin density have their maximum values along the light solid lines, minimum values along dashed lines. At A, three maxima coincide to give a resultant large value of density. At E, a maximum coincides with two minima giving a value below the mean. Reinforcement and cancellation of this kind lead to an amoeba and acrasin density which is greater than the mean in the shaded “cloud” regions and a density less than the mean in the unshaded regions.
pattern operates for a period of time. On the contrary. new factors like the advent of stickiness act to accelerate the condensation which occurs in the central region of the clouds.
The reader is referred to Chandrasekhar (1961, Chapter I) for a more extended discussion of the basic concepts of stability theory and to Segel (1966) for a survey of recent non-linear analyses of BPnard cells and similar phenomena.
APPENDIX B
Aggregation in Confined Drops
Aggregation into a single center can take place within the confines of a droplet of water and amoebae placed on a hydrophobic agar. Our theory can easily be adapted to this situation. The relevant equations are (4.5) and (4.6) as before but we must now impose the additional condition that there is no flow of acrasin or amoebae across the boundary of the drop. If the drop is considered to be a circle of radius R centered at the origin then this boundary condition is
Zi/dr = &i/h = 0 at r = R. (rZ=x2+y2.) (B.1)
SLIME MOLD AGGREGATION 415
The appropriate solution to (4.5) and (4.6) is
5 = d J,(qr)e”‘, f7 = p J,(qr)e”‘,
where JO denotes the zeroth order Bessel function of the first kind. By (B. 1)
f [JcmL. = 0, so qR = 3.8 and q2 = 45/A, 03.2)
where A = nR2 is the area of the drop. Using (B.2) we see from (4.13) that the instability condition (4.15) should be replaced by
where we have made the abbreviations
B = D,f(p,) + D,f’(p,) a,, @ = D2k, ‘I’ = 45DJk. (B.3)
(B.3) reduces to (4.15) when A + co, as it should. We denote by B, the value of B at which the left side of (B.3) first exceeds
the right:
B, E @ [I + ‘PA-‘]. (B.4) Instability is thus predicted to commence when B first exceeds its critical vallre B,. (B.4) shows that B, increases as A decreases so that aggregation should commence later when amoebae of a given density are confined in a smaller drop. It would not appear difficult to check this qualitative pre- diction.?
Direct quantitative checks of (B.4) are possible in principle but various manipulations can simplify the task of experimental verification. For example, let Bi” and B(‘) denote the critical values of B corresponding to drops having areas A, akd A,, respectively. Then
c l+YA;’ B(l) B(2) - 1 +YA;” (B-5)
c To verify (B.5) it is no longer necessary to measure 0. Further, suppose that the drop areas are small compared to the normal area of the aggregation territory. Then (B.5) can be approximated by
B:” A 2 B(2) = -A;’
c u3.6)
To verify (B.6) one needs only to measure the ratio Bi’)/BL2), which is particularly advantageous if the term involvingf’(p,) is negligible. It appears that measurements of parameter values for aggregation in small drops may offer the best way to provide a quantitative test of our theoretical results.
i Konijn has recently pointed out to us that observations of delayed aggregation in small drops were reported in one of his latest papers (Konijn, 1968).