Embed Size (px)
Citation preview
Ambit Capital and / or its affiliates do and seek to do business including investment banking with companies covered in its research reports. As a result, investors should be aware that Ambit Capital may have a conflict of interest that could affect the objectivity of this report. Investors should not consider this report as the only factor in making their investment decision.
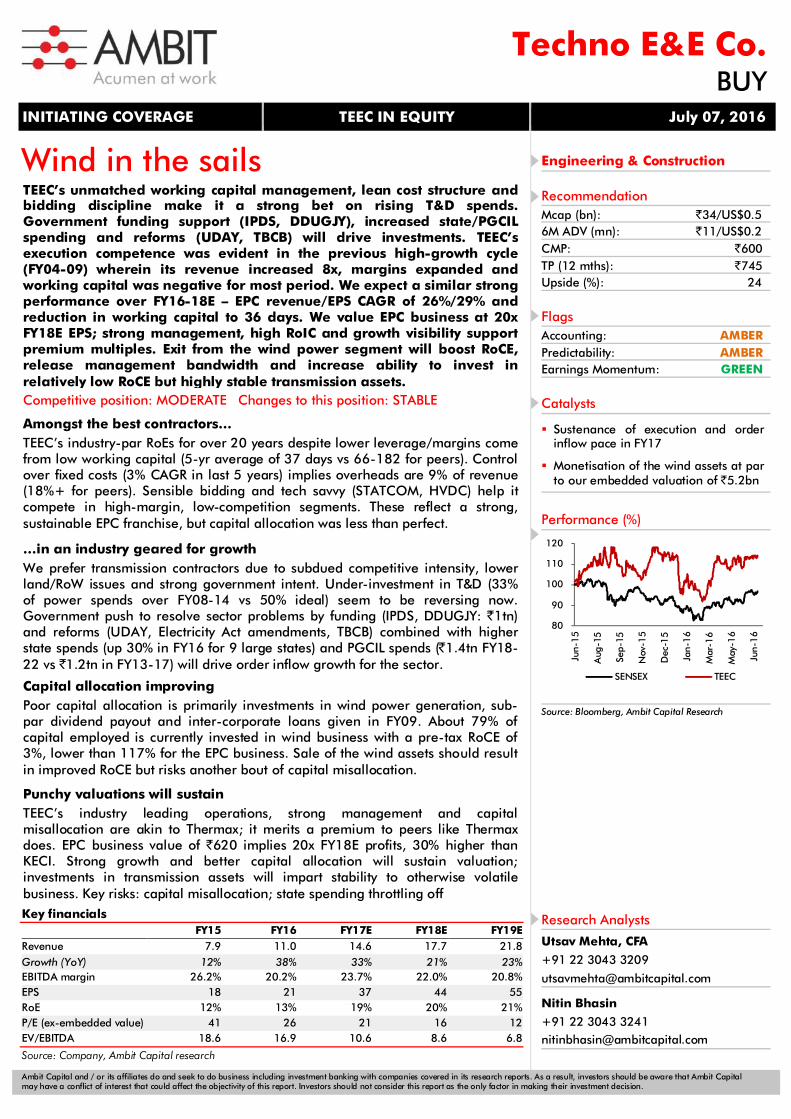
Wind in the sails
TEEC’s unmatched working capital management, lean cost structure and bidding discipline make it a strong bet on rising T&D spends. Government funding support (IPDS, DDUGJY), increased state/PGCIL spending and reforms (UDAY, TBCB) will drive investments. TEEC’s execution competence was evident in the previous high-growth cycle (FY04-09) wherein its revenue increased 8x, margins expanded and working capital was negative for most period. We expect a similar strong performance over FY16-18E – EPC revenue/EPS CAGR of 26%/29% and reduction in working capital to 36 days. We value EPC business at 20x FY18E EPS; strong management, high RoIC and growth visibility support premium multiples. Exit from the wind power segment will boost RoCE, release management bandwidth and increase ability to invest in relatively low RoCE but highly stable transmission assets. Competitive position: MODERATE Changes to this position: STABLE Amongst the best contractors… TEEC’s industry-par RoEs for over 20 years despite lower leverage/margins come from low working capital (5-yr average of 37 days vs 66-182 for peers). Control over fixed costs (3% CAGR in last 5 years) implies overheads are 9% of revenue (18%+ for peers). Sensible bidding and tech savvy (STATCOM, HVDC) help it compete in high-margin, low-competition segments. These reflect a strong, sustainable EPC franchise, but capital allocation was less than perfect.
…in an industry geared for growth We prefer transmission contractors due to subdued competitive intensity, lower land/RoW issues and strong government intent. Under-investment in T&D (33% of power spends over FY08-14 vs 50% ideal) seem to be reversing now. Government push to resolve sector problems by funding (IPDS, DDUGJY: `1tn) and reforms (UDAY, Electricity Act amendments, TBCB) combined with higher state spends (up 30% in FY16 for 9 large states) and PGCIL spends (̀ 1.4tn FY18-22 vs `1.2tn in FY13-17) will drive order inflow growth for the sector. Capital allocation improving Poor capital allocation is primarily investments in wind power generation, sub-par dividend payout and inter-corporate loans given in FY09. About 79% of capital employed is currently invested in wind business with a pre-tax RoCE of 3%, lower than 117% for the EPC business. Sale of the wind assets should result in improved RoCE but risks another bout of capital misallocation. Punchy valuations will sustain TEEC’s industry leading operations, strong management and capital misallocation are akin to Thermax; it merits a premium to peers like Thermax does. EPC business value of `620 implies 20x FY18E profits, 30% higher than KECI. Strong growth and better capital allocation will sustain valuation; investments in transmission assets will impart stability to otherwise volatile business. Key risks: capital misallocation; state spending throttling off
INITIATING COVERAGE TEEC IN EQUITY July 07, 2016
Techno E&E Co.BUY
Engineering & Construction
Recommendation Mcap (bn): `34/US$0.5 6M ADV (mn): `11/US$0.2 CMP: `600 TP (12 mths): `745 Upside (%): 24
Flags Accounting: AMBER Predictability: AMBER Earnings Momentum: GREEN
Catalysts
Sustenance of execution and order inflow pace in FY17
Monetisation of the wind assets at par to our embedded valuation of `5.2bn
Performance (%)
Source: Bloomberg, Ambit Capital Research
80
90
100
110
120
Jun-
15
Aug
-15
Sep-
15
Nov
-15
Dec
-15
Jan-
16
Mar
-16
May
-16
Jun-
16
SENSEX TEEC
Research Analysts
Utsav Mehta, CFA
+91 22 3043 3209
Nitin Bhasin
+91 22 3043 3241 [email protected]
Key financials FY15 FY16 FY17E FY18E FY19E Revenue 7.9 11.0 14.6 17.7 21.8 Growth (YoY) 12% 38% 33% 21% 23% EBITDA margin 26.2% 20.2% 23.7% 22.0% 20.8% EPS 18 21 37 44 55 RoE 12% 13% 19% 20% 21% P/E (ex-embedded value) 41 26 21 16 12 EV/EBITDA 18.6 16.9 10.6 8.6 6.8
Source: Company, Ambit Capital research
Techno E&E Co.
July 07, 2016 Ambit Capital Pvt. Ltd. Page 2
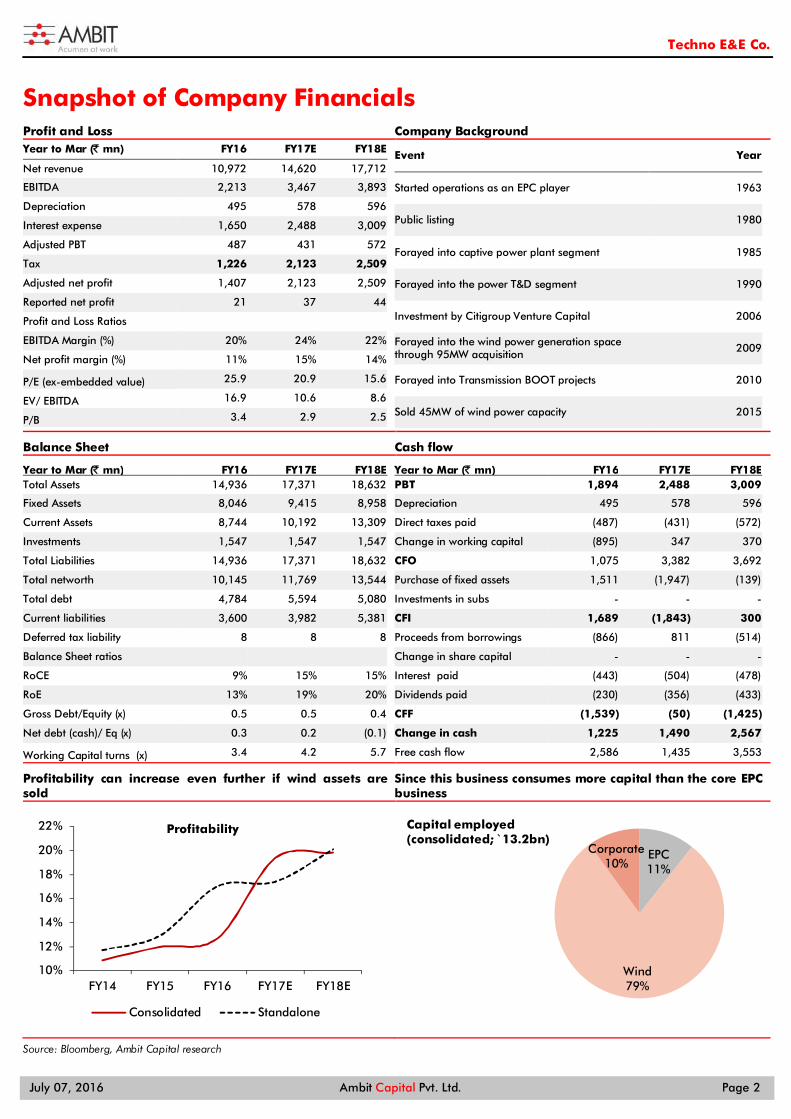
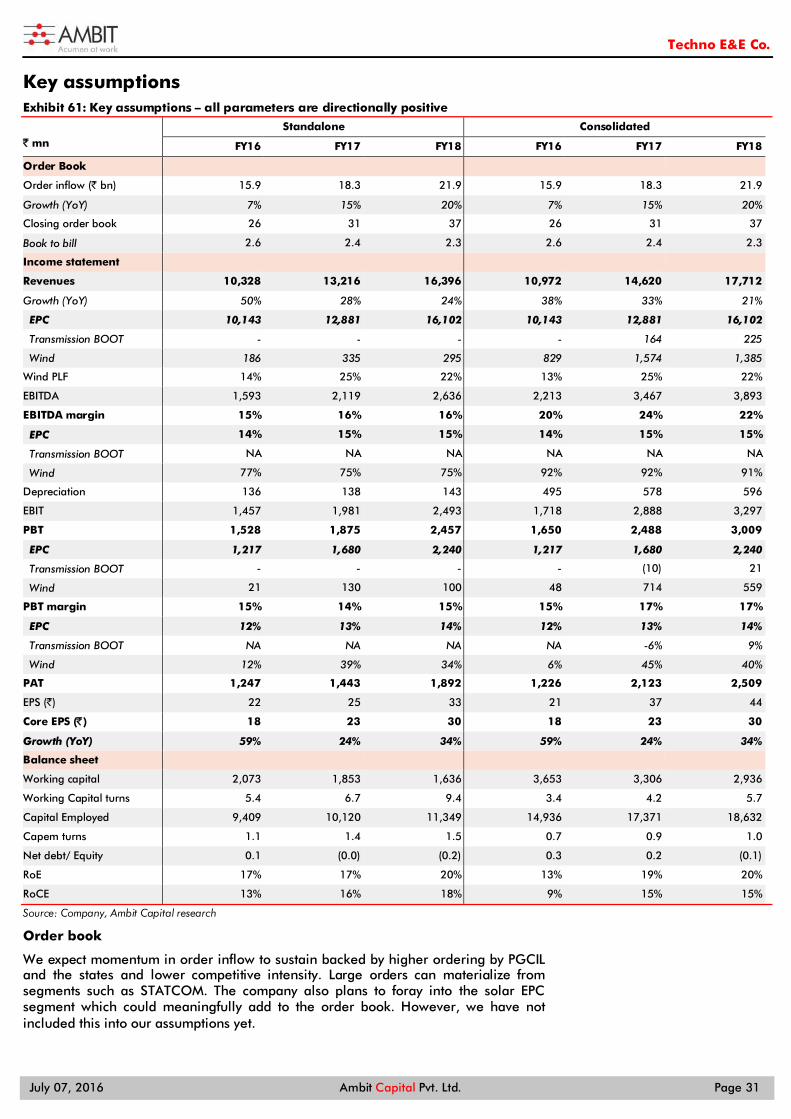
Snapshot of Company Financials Profit and Loss Company Background Year to Mar (̀ mn) FY16 FY17E FY18E
Net revenue 10,972 14,620 17,712
EBITDA 2,213 3,467 3,893
Depreciation 495 578 596
Interest expense 1,650 2,488 3,009
Adjusted PBT 487 431 572
Tax 1,226 2,123 2,509
Adjusted net profit 1,407 2,123 2,509
Reported net profit 21 37 44
Profit and Loss Ratios
EBITDA Margin (%) 20% 24% 22%
Net profit margin (%) 11% 15% 14%
P/E (ex-embedded value) 25.9 20.9 15.6
EV/ EBITDA 16.9 10.6 8.6
P/B 3.4 2.9 2.5
Event Year
Started operations as an EPC player 1963
Public listing 1980
Forayed into captive power plant segment 1985
Forayed into the power T&D segment 1990
Investment by Citigroup Venture Capital 2006
Forayed into the wind power generation space through 95MW acquisition 2009
Forayed into Transmission BOOT projects 2010
Sold 45MW of wind power capacity 2015
Balance Sheet Cash flow
Year to Mar (̀ mn) FY16 FY17E FY18E Total Assets 14,936 17,371 18,632
Fixed Assets 8,046 9,415 8,958
Current Assets 8,744 10,192 13,309
Investments 1,547 1,547 1,547
Total Liabilities 14,936 17,371 18,632
Total networth 10,145 11,769 13,544
Total debt 4,784 5,594 5,080
Current liabilities 3,600 3,982 5,381
Deferred tax liability 8 8 8
Balance Sheet ratios
RoCE 9% 15% 15%
RoE 13% 19% 20%
Gross Debt/Equity (x) 0.5 0.5 0.4
Net debt (cash)/ Eq (x) 0.3 0.2 (0.1)
Working Capital turns (x) 3.4 4.2 5.7
Year to Mar (̀ mn) FY16 FY17E FY18E PBT 1,894 2,488 3,009
Depreciation 495 578 596
Direct taxes paid (487) (431) (572)
Change in working capital (895) 347 370
CFO 1,075 3,382 3,692
Purchase of fixed assets 1,511 (1,947) (139)
Investments in subs - - -
CFI 1,689 (1,843) 300
Proceeds from borrowings (866) 811 (514)
Change in share capital - - -
Interest paid (443) (504) (478)
Dividends paid (230) (356) (433)
CFF (1,539) (50) (1,425)
Change in cash 1,225 1,490 2,567
Free cash flow 2,586 1,435 3,553
Profitability can increase even further if wind assets are sold
Since this business consumes more capital than the core EPC business
Source: Bloomberg, Ambit Capital research
10%
12%
14%
16%
18%
20%
22%
FY14 FY15 FY16 FY17E FY18E
Profitability
Consolidated Standalone
EPC11%
Wind79%
Corporate10%
Capital employed(consolidated; ̀ 13.2bn)
Techno E&E Co.
July 07, 2016 Ambit Capital Pvt. Ltd. Page 3
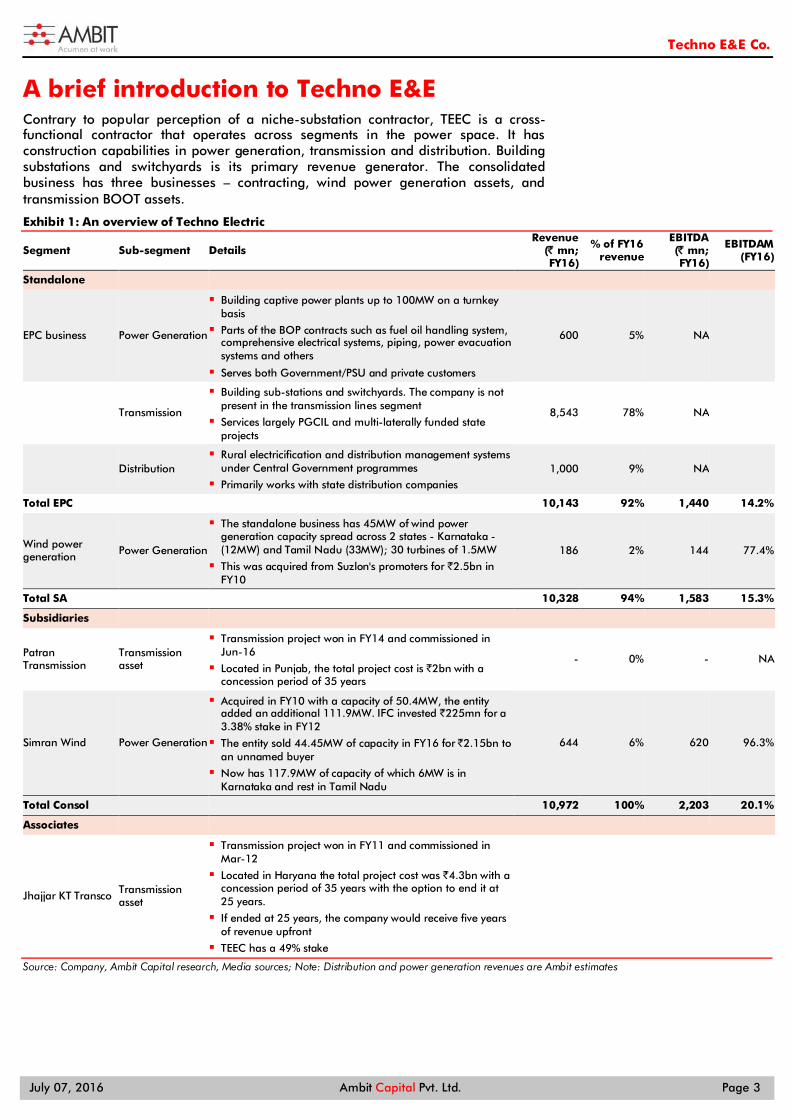
A brief introduction to Techno E&E Contrary to popular perception of a niche-substation contractor, TEEC is a cross-functional contractor that operates across segments in the power space. It has construction capabilities in power generation, transmission and distribution. Building substations and switchyards is its primary revenue generator. The consolidated business has three businesses – contracting, wind power generation assets, and transmission BOOT assets.
Exhibit 1: An overview of Techno Electric
Segment Sub-segment Details Revenue
(̀ mn; FY16)
% of FY16 revenue
EBITDA (̀ mn; FY16)
EBITDAM (FY16)
Standalone
EPC business Power Generation
Building captive power plants up to 100MW on a turnkey basis
Parts of the BOP contracts such as fuel oil handling system, comprehensive electrical systems, piping, power evacuation systems and others
Serves both Government/PSU and private customers
600 5% NA
Transmission
Building sub-stations and switchyards. The company is not present in the transmission lines segment
Services largely PGCIL and multi-laterally funded state projects
8,543 78% NA
Distribution Rural electricification and distribution management systems
under Central Government programmes
Primarily works with state distribution companies 1,000 9% NA
Total EPC 10,143 92% 1,440 14.2%
Wind power generation Power Generation
The standalone business has 45MW of wind power generation capacity spread across 2 states - Karnataka - (12MW) and Tamil Nadu (33MW); 30 turbines of 1.5MW
This was acquired from Suzlon's promoters for `2.5bn in FY10
186 2% 144 77.4%
Total SA 10,328 94% 1,583 15.3%
Subsidiaries
Patran Transmission
Transmission asset
Transmission project won in FY14 and commissioned in Jun-16
Located in Punjab, the total project cost is `2bn with a concession period of 35 years
- 0% - NA
Simran Wind Power Generation
Acquired in FY10 with a capacity of 50.4MW, the entity added an additional 111.9MW. IFC invested `225mn for a 3.38% stake in FY12
The entity sold 44.45MW of capacity in FY16 for ̀ 2.15bn to an unnamed buyer
Now has 117.9MW of capacity of which 6MW is in Karnataka and rest in Tamil Nadu
644 6% 620 96.3%
Total Consol 10,972 100% 2,203 20.1%
Associates
Jhajjar KT Transco Transmission asset
Transmission project won in FY11 and commissioned in Mar-12
Located in Haryana the total project cost was `4.3bn with a concession period of 35 years with the option to end it at 25 years.
If ended at 25 years, the company would receive five years of revenue upfront
TEEC has a 49% stake
Source: Company, Ambit Capital research, Media sources; Note: Distribution and power generation revenues are Ambit estimates
Techno E&E Co.
July 07, 2016 Ambit Capital Pvt. Ltd. Page 4
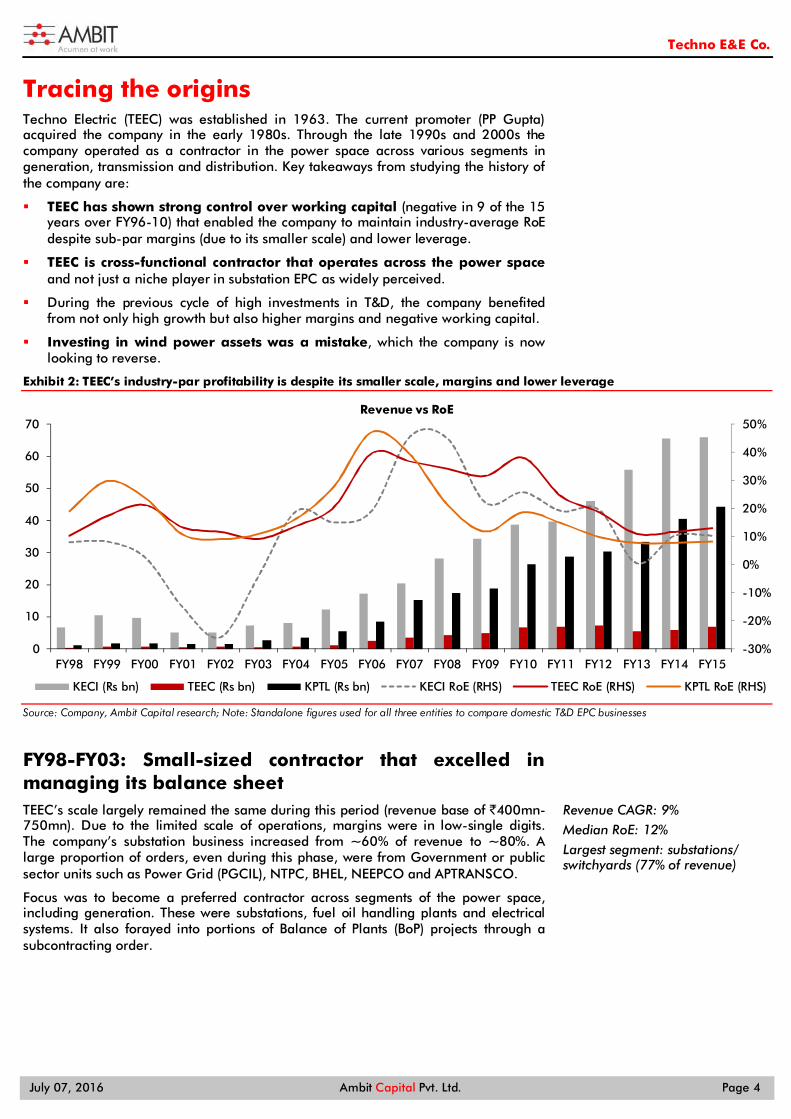
Tracing the origins Techno Electric (TEEC) was established in 1963. The current promoter (PP Gupta) acquired the company in the early 1980s. Through the late 1990s and 2000s the company operated as a contractor in the power space across various segments in generation, transmission and distribution. Key takeaways from studying the history of the company are:
TEEC has shown strong control over working capital (negative in 9 of the 15 years over FY96-10) that enabled the company to maintain industry-average RoE despite sub-par margins (due to its smaller scale) and lower leverage.
TEEC is cross-functional contractor that operates across the power space and not just a niche player in substation EPC as widely perceived.
During the previous cycle of high investments in T&D, the company benefited from not only high growth but also higher margins and negative working capital.
Investing in wind power assets was a mistake, which the company is now looking to reverse.
Exhibit 2: TEEC’s industry-par profitability is despite its smaller scale, margins and lower leverage
Source: Company, Ambit Capital research; Note: Standalone figures used for all three entities to compare domestic T&D EPC businesses
FY98-FY03: Small-sized contractor that excelled in managing its balance sheet TEEC’s scale largely remained the same during this period (revenue base of `400mn-750mn). Due to the limited scale of operations, margins were in low-single digits. The company’s substation business increased from ~60% of revenue to ~80%. A large proportion of orders, even during this phase, were from Government or public sector units such as Power Grid (PGCIL), NTPC, BHEL, NEEPCO and APTRANSCO.
Focus was to become a preferred contractor across segments of the power space, including generation. These were substations, fuel oil handling plants and electrical systems. It also forayed into portions of Balance of Plants (BoP) projects through a subcontracting order.
-30%
-20%
-10%
0%
10%
20%
30%
40%
50%
0
10
20
30
40
50
60
70
FY98 FY99 FY00 FY01 FY02 FY03 FY04 FY05 FY06 FY07 FY08 FY09 FY10 FY11 FY12 FY13 FY14 FY15
Revenue vs RoE
KECI (Rs bn) TEEC (Rs bn) KPTL (Rs bn) KECI RoE (RHS) TEEC RoE (RHS) KPTL RoE (RHS)
Revenue CAGR: 9% Median RoE: 12% Largest segment: substations/ switchyards (77% of revenue)
Techno E&E Co.
July 07, 2016 Ambit Capital Pvt. Ltd. Page 5
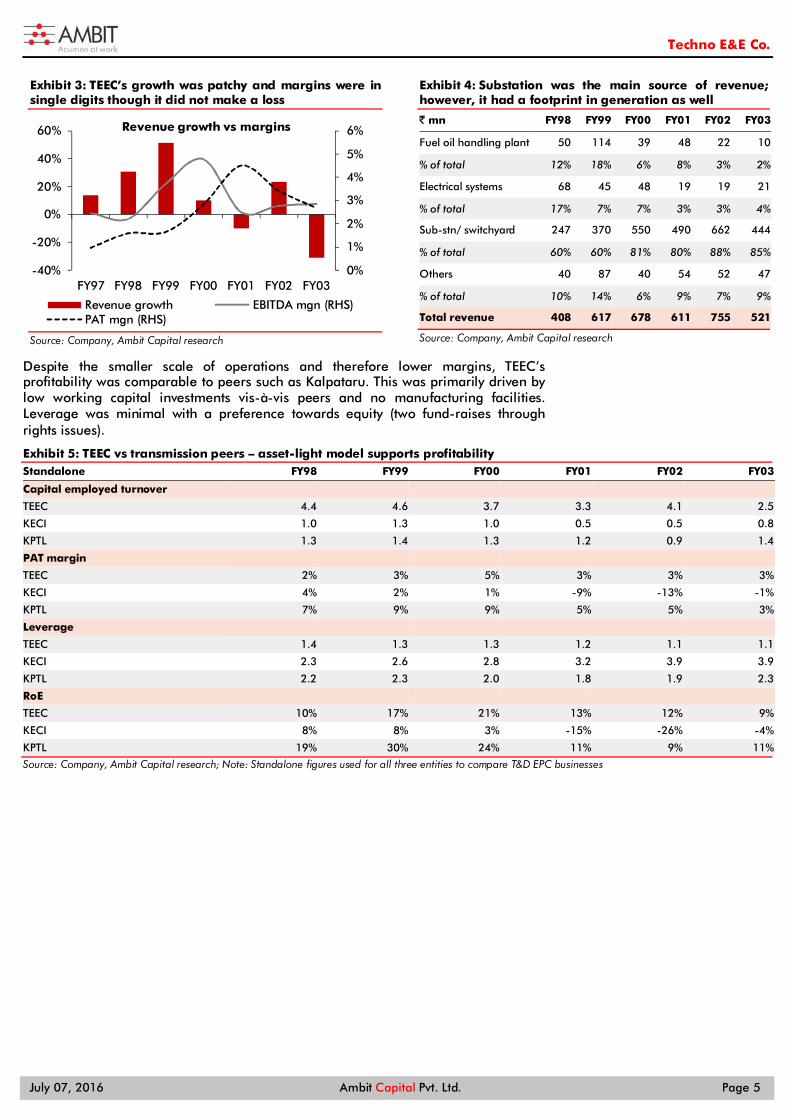
Exhibit 3: TEEC’s growth was patchy and margins were in single digits though it did not make a loss
Source: Company, Ambit Capital research
Exhibit 4: Substation was the main source of revenue; however, it had a footprint in generation as well
` mn FY98 FY99 FY00 FY01 FY02 FY03
Fuel oil handling plant 50 114 39 48 22 10
% of total 12% 18% 6% 8% 3% 2%
Electrical systems 68 45 48 19 19 21
% of total 17% 7% 7% 3% 3% 4%
Sub-stn/ switchyard 247 370 550 490 662 444
% of total 60% 60% 81% 80% 88% 85%
Others 40 87 40 54 52 47
% of total 10% 14% 6% 9% 7% 9%
Total revenue 408 617 678 611 755 521
Source: Company, Ambit Capital research
Despite the smaller scale of operations and therefore lower margins, TEEC’s profitability was comparable to peers such as Kalpataru. This was primarily driven by low working capital investments vis-à-vis peers and no manufacturing facilities. Leverage was minimal with a preference towards equity (two fund-raises through rights issues).
Exhibit 5: TEEC vs transmission peers – asset-light model supports profitability Standalone FY98 FY99 FY00 FY01 FY02 FY03
Capital employed turnover TEEC 4.4 4.6 3.7 3.3 4.1 2.5
KECI 1.0 1.3 1.0 0.5 0.5 0.8
KPTL 1.3 1.4 1.3 1.2 0.9 1.4
PAT margin TEEC 2% 3% 5% 3% 3% 3%
KECI 4% 2% 1% -9% -13% -1%
KPTL 7% 9% 9% 5% 5% 3%
Leverage TEEC 1.4 1.3 1.3 1.2 1.1 1.1
KECI 2.3 2.6 2.8 3.2 3.9 3.9
KPTL 2.2 2.3 2.0 1.8 1.9 2.3
RoE TEEC 10% 17% 21% 13% 12% 9%
KECI 8% 8% 3% -15% -26% -4%
KPTL 19% 30% 24% 11% 9% 11%
Source: Company, Ambit Capital research; Note: Standalone figures used for all three entities to compare T&D EPC businesses
0%
1%
2%
3%
4%
5%
6%
-40%
-20%
0%
20%
40%
60%
FY97 FY98 FY99 FY00 FY01 FY02 FY03
Revenue growth vs margins
Revenue growth EBITDA mgn (RHS)PAT mgn (RHS)
Techno E&E Co.
July 07, 2016 Ambit Capital Pvt. Ltd. Page 6
FY04-FY10: Industry growth boosts revenue The Electricity Act of 2003 was an inflection point for companies in the T&D space, including generation companies. The quantum of investments in transmission and distribution multiplied, boosted by new regulations and schemes (Accelerated Power Development and Reforms Programme and Rural Electrification Scheme). Bifurcation of the debt saddled state electricity bodies into separate, functional units aided further investments, especially in distribution. As shown in the exhibit below, peers also grew at a fast pace in this period.
Exhibit 6: KECI’s warranted optimism in the FY05 annual report
The Accelerated Power Development and Reforms Programme ("APDRP") has been put in place by the Government and projects worth over `.170 billion have already been approved under this scheme. The Government has also announced plans to add around 107,000 MW of additional power generation capacity by the year 2012 and evolved a transmission plan for strengthening regional grids as well as creating a national grid, which can support this target.
An investment of about `. 71,000 crores (`710bn) is envisaged in power transmission under central sector and Transmission and Distribution of electricity generated is being accorded a high national priority in view of the significant capacity additions. The Government has launched Rajiv Gandhi Grameen Vidyutikaran Yojana ("RGGVY"), a Rural Electrification Scheme involving an expenditure of `. 16,000 crores
Source: Company
TEEC forayed into captive power plant and distribution segments during this phase. Its scale in distribution expanded significantly – by FY07, 58% of revenue came from the power distribution contracting segment driven primarily by projects in Andhra Pradesh and Bihar. Captive power/BOP projects were sporadic, resulting in small surges in revenue; substation reduced to 27% of revenue.
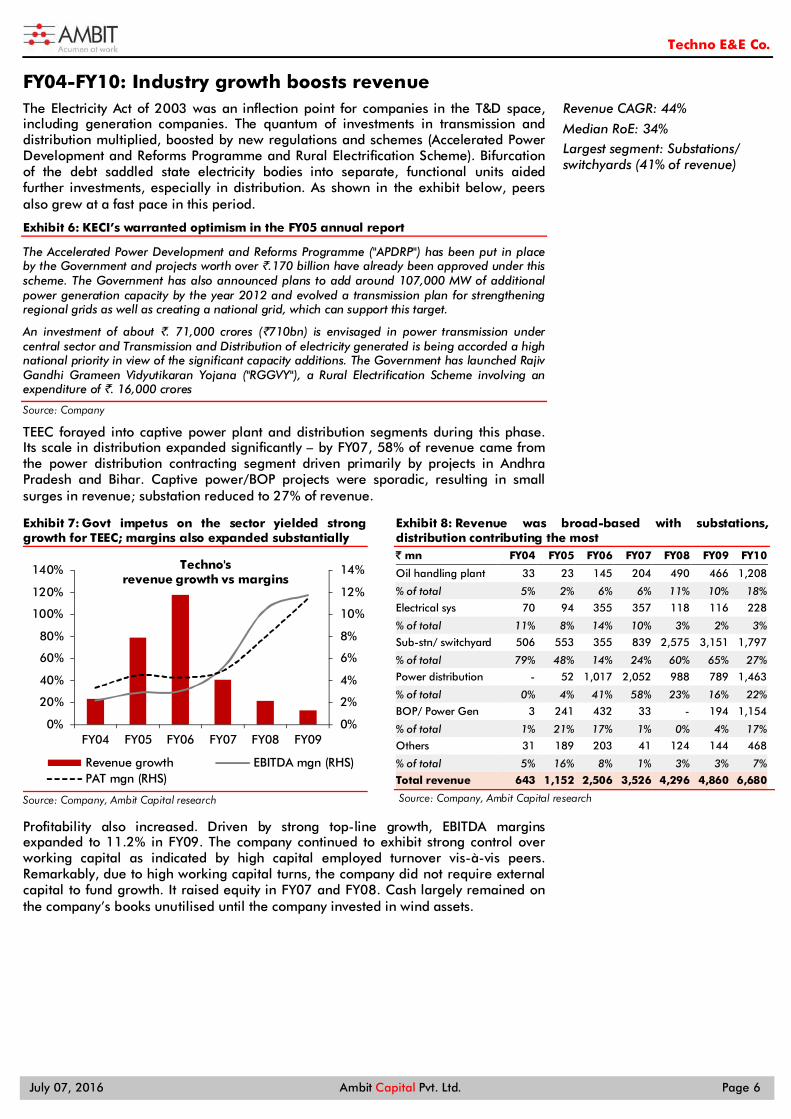
Exhibit 7: Govt impetus on the sector yielded strong growth for TEEC; margins also expanded substantially
Source: Company, Ambit Capital research
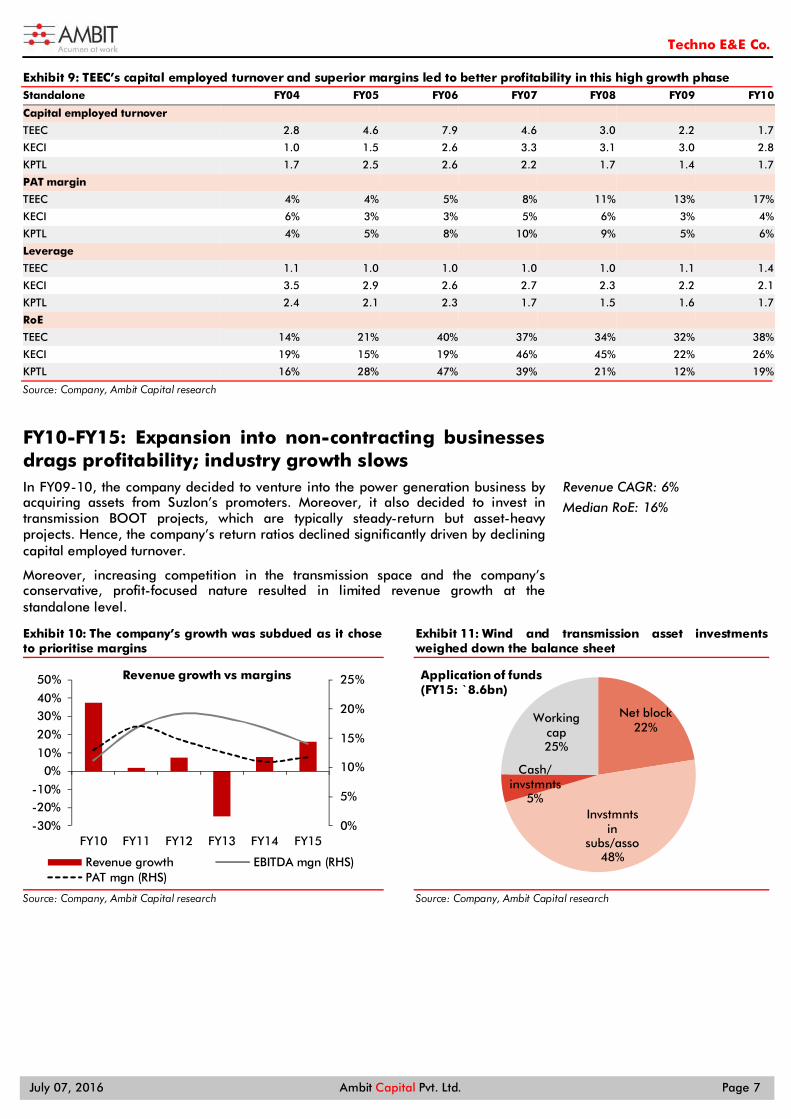
Exhibit 8: Revenue was broad-based with substations, distribution contributing the most ` mn FY04 FY05 FY06 FY07 FY08 FY09 FY10
Oil handling plant 33 23 145 204 490 466 1,208
% of total 5% 2% 6% 6% 11% 10% 18%
Electrical sys 70 94 355 357 118 116 228
% of total 11% 8% 14% 10% 3% 2% 3%
Sub-stn/ switchyard 506 553 355 839 2,575 3,151 1,797
% of total 79% 48% 14% 24% 60% 65% 27%
Power distribution - 52 1,017 2,052 988 789 1,463
% of total 0% 4% 41% 58% 23% 16% 22%
BOP/ Power Gen 3 241 432 33 - 194 1,154
% of total 1% 21% 17% 1% 0% 4% 17%
Others 31 189 203 41 124 144 468
% of total 5% 16% 8% 1% 3% 3% 7%
Total revenue 643 1,152 2,506 3,526 4,296 4,860 6,680
Source: Company, Ambit Capital research
Profitability also increased. Driven by strong top-line growth, EBITDA margins expanded to 11.2% in FY09. The company continued to exhibit strong control over working capital as indicated by high capital employed turnover vis-à-vis peers. Remarkably, due to high working capital turns, the company did not require external capital to fund growth. It raised equity in FY07 and FY08. Cash largely remained on the company’s books unutilised until the company invested in wind assets.
0%
2%
4%
6%
8%
10%
12%
14%
0%
20%
40%
60%
80%
100%
120%
140%
FY04 FY05 FY06 FY07 FY08 FY09
Techno's revenue growth vs margins
Revenue growth EBITDA mgn (RHS)PAT mgn (RHS)
Revenue CAGR: 44%
Median RoE: 34% Largest segment: Substations/ switchyards (41% of revenue)
Techno E&E Co.
July 07, 2016 Ambit Capital Pvt. Ltd. Page 7
Exhibit 9: TEEC’s capital employed turnover and superior margins led to better profitability in this high growth phase Standalone FY04 FY05 FY06 FY07 FY08 FY09 FY10
Capital employed turnover TEEC 2.8 4.6 7.9 4.6 3.0 2.2 1.7
KECI 1.0 1.5 2.6 3.3 3.1 3.0 2.8
KPTL 1.7 2.5 2.6 2.2 1.7 1.4 1.7
PAT margin TEEC 4% 4% 5% 8% 11% 13% 17%
KECI 6% 3% 3% 5% 6% 3% 4%
KPTL 4% 5% 8% 10% 9% 5% 6%
Leverage TEEC 1.1 1.0 1.0 1.0 1.0 1.1 1.4
KECI 3.5 2.9 2.6 2.7 2.3 2.2 2.1
KPTL 2.4 2.1 2.3 1.7 1.5 1.6 1.7
RoE TEEC 14% 21% 40% 37% 34% 32% 38%
KECI 19% 15% 19% 46% 45% 22% 26%
KPTL 16% 28% 47% 39% 21% 12% 19%
Source: Company, Ambit Capital research
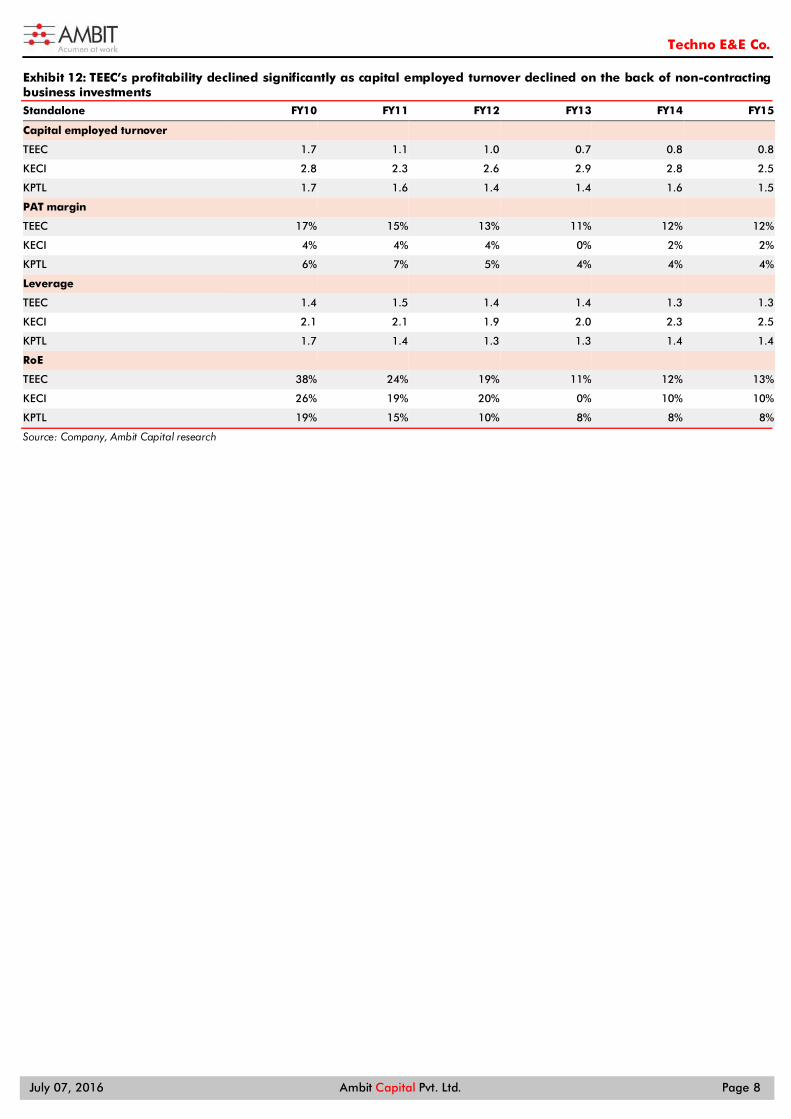
FY10-FY15: Expansion into non-contracting businesses drags profitability; industry growth slows In FY09-10, the company decided to venture into the power generation business by acquiring assets from Suzlon’s promoters. Moreover, it also decided to invest in transmission BOOT projects, which are typically steady-return but asset-heavy projects. Hence, the company’s return ratios declined significantly driven by declining capital employed turnover.
Moreover, increasing competition in the transmission space and the company’s conservative, profit-focused nature resulted in limited revenue growth at the standalone level.
Exhibit 10: The company’s growth was subdued as it chose to prioritise margins
Source: Company, Ambit Capital research
Exhibit 11: Wind and transmission asset investments weighed down the balance sheet
Source: Company, Ambit Capital research
0%
5%
10%
15%
20%
25%
-30%
-20%-10%
0%10%
20%
30%40%
50%
FY10 FY11 FY12 FY13 FY14 FY15
Revenue growth vs margins
Revenue growth EBITDA mgn (RHS)PAT mgn (RHS)
Net block22%
Invstmnts in
subs/asso48%
Cash/ invstmnts
5%
Working cap25%
Application of funds(FY15: ̀ 8.6bn)
Revenue CAGR: 6%
Median RoE: 16%
Techno E&E Co.
July 07, 2016 Ambit Capital Pvt. Ltd. Page 8
Exhibit 12: TEEC’s profitability declined significantly as capital employed turnover declined on the back of non-contracting business investments Standalone FY10 FY11 FY12 FY13 FY14 FY15
Capital employed turnover TEEC 1.7 1.1 1.0 0.7 0.8 0.8
KECI 2.8 2.3 2.6 2.9 2.8 2.5
KPTL 1.7 1.6 1.4 1.4 1.6 1.5
PAT margin TEEC 17% 15% 13% 11% 12% 12%
KECI 4% 4% 4% 0% 2% 2%
KPTL 6% 7% 5% 4% 4% 4%
Leverage TEEC 1.4 1.5 1.4 1.4 1.3 1.3
KECI 2.1 2.1 1.9 2.0 2.3 2.5
KPTL 1.7 1.4 1.3 1.3 1.4 1.4
RoE TEEC 38% 24% 19% 11% 12% 13%
KECI 26% 19% 20% 0% 10% 10%
KPTL 19% 15% 10% 8% 8% 8%
Source: Company, Ambit Capital research
Techno E&E Co.
July 07, 2016 Ambit Capital Pvt. Ltd. Page 9
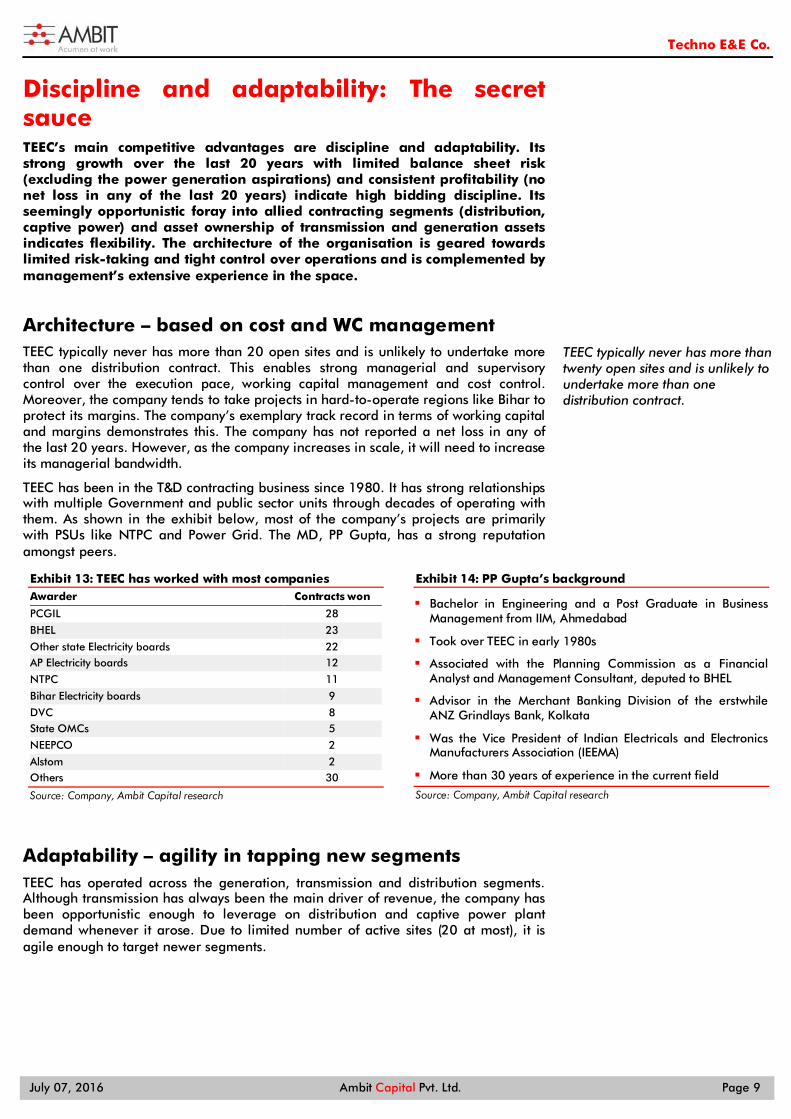
Discipline and adaptability: The secret sauce TEEC’s main competitive advantages are discipline and adaptability. Its strong growth over the last 20 years with limited balance sheet risk (excluding the power generation aspirations) and consistent profitability (no net loss in any of the last 20 years) indicate high bidding discipline. Its seemingly opportunistic foray into allied contracting segments (distribution, captive power) and asset ownership of transmission and generation assets indicates flexibility. The architecture of the organisation is geared towards limited risk-taking and tight control over operations and is complemented by management’s extensive experience in the space.
Architecture – based on cost and WC management TEEC typically never has more than 20 open sites and is unlikely to undertake more than one distribution contract. This enables strong managerial and supervisory control over the execution pace, working capital management and cost control. Moreover, the company tends to take projects in hard-to-operate regions like Bihar to protect its margins. The company’s exemplary track record in terms of working capital and margins demonstrates this. The company has not reported a net loss in any of the last 20 years. However, as the company increases in scale, it will need to increase its managerial bandwidth.
TEEC has been in the T&D contracting business since 1980. It has strong relationships with multiple Government and public sector units through decades of operating with them. As shown in the exhibit below, most of the company’s projects are primarily with PSUs like NTPC and Power Grid. The MD, PP Gupta, has a strong reputation amongst peers.
Exhibit 13: TEEC has worked with most companies Awarder Contracts won
PCGIL 28
BHEL 23
Other state Electricity boards 22 AP Electricity boards 12
NTPC 11
Bihar Electricity boards 9
DVC 8 State OMCs 5
NEEPCO 2
Alstom 2 Others 30
Source: Company, Ambit Capital research
Exhibit 14: PP Gupta’s background
Bachelor in Engineering and a Post Graduate in Business Management from IIM, Ahmedabad
Took over TEEC in early 1980s
Associated with the Planning Commission as a Financial Analyst and Management Consultant, deputed to BHEL
Advisor in the Merchant Banking Division of the erstwhile ANZ Grindlays Bank, Kolkata
Was the Vice President of Indian Electricals and Electronics Manufacturers Association (IEEMA)
More than 30 years of experience in the current field
Source: Company, Ambit Capital research
Adaptability – agility in tapping new segments TEEC has operated across the generation, transmission and distribution segments. Although transmission has always been the main driver of revenue, the company has been opportunistic enough to leverage on distribution and captive power plant demand whenever it arose. Due to limited number of active sites (20 at most), it is agile enough to target newer segments.
TEEC typically never has more than twenty open sites and is unlikely to undertake more than one distribution contract.
Techno E&E Co.
July 07, 2016 Ambit Capital Pvt. Ltd. Page 10
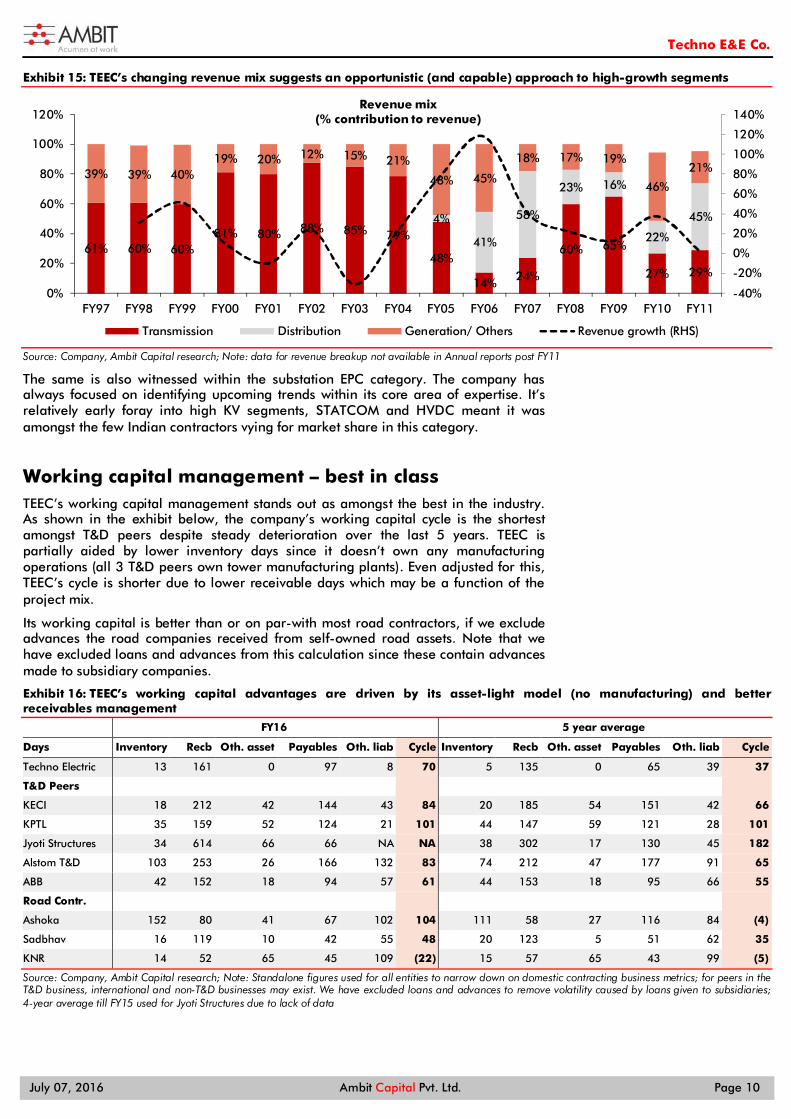
Exhibit 15: TEEC’s changing revenue mix suggests an opportunistic (and capable) approach to high-growth segments
Source: Company, Ambit Capital research; Note: data for revenue breakup not available in Annual reports post FY11
The same is also witnessed within the substation EPC category. The company has always focused on identifying upcoming trends within its core area of expertise. It’s relatively early foray into high KV segments, STATCOM and HVDC meant it was amongst the few Indian contractors vying for market share in this category.
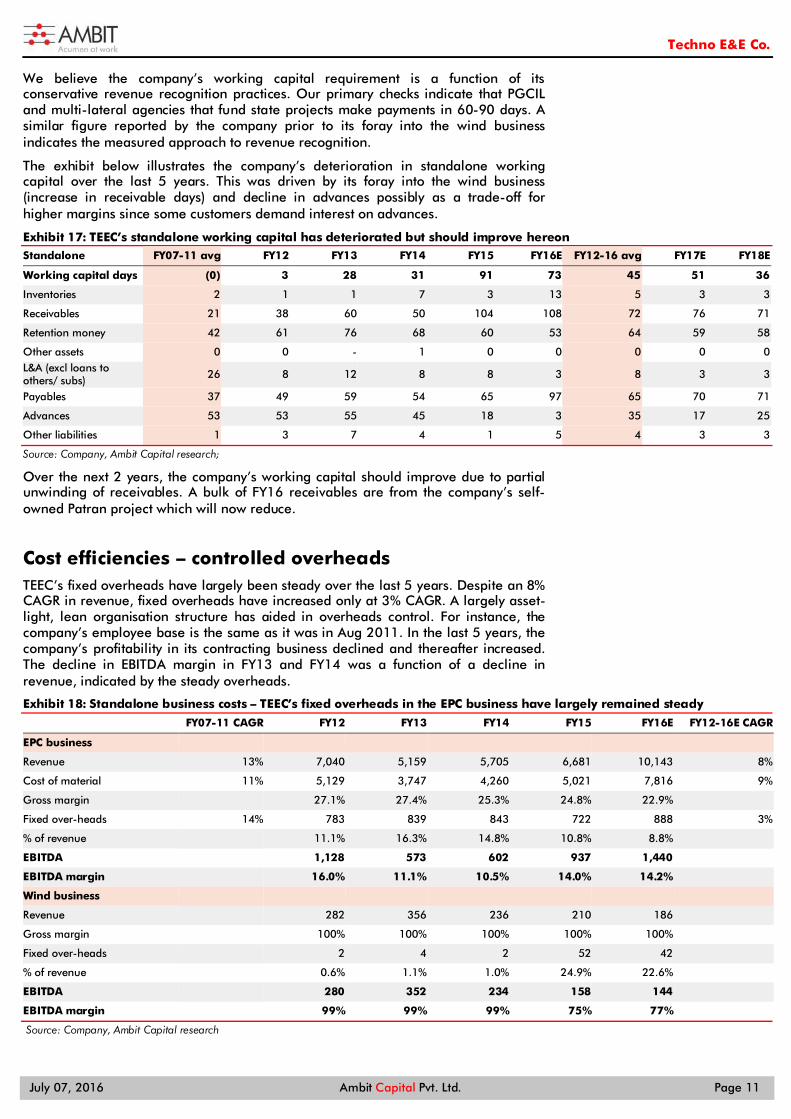
Working capital management – best in class TEEC’s working capital management stands out as amongst the best in the industry. As shown in the exhibit below, the company’s working capital cycle is the shortest amongst T&D peers despite steady deterioration over the last 5 years. TEEC is partially aided by lower inventory days since it doesn’t own any manufacturing operations (all 3 T&D peers own tower manufacturing plants). Even adjusted for this, TEEC’s cycle is shorter due to lower receivable days which may be a function of the project mix.
Its working capital is better than or on par-with most road contractors, if we exclude advances the road companies received from self-owned road assets. Note that we have excluded loans and advances from this calculation since these contain advances made to subsidiary companies.
Exhibit 16: TEEC’s working capital advantages are driven by its asset-light model (no manufacturing) and better receivables management
FY16 5 year average
Days Inventory Recb Oth. asset Payables Oth. liab Cycle Inventory Recb Oth. asset Payables Oth. liab Cycle
Techno Electric 13 161 0 97 8 70 5 135 0 65 39 37
T&D Peers KECI 18 212 42 144 43 84 20 185 54 151 42 66
KPTL 35 159 52 124 21 101 44 147 59 121 28 101
Jyoti Structures 34 614 66 66 NA NA 38 302 17 130 45 182
Alstom T&D 103 253 26 166 132 83 74 212 47 177 91 65
ABB 42 152 18 94 57 61 44 153 18 95 66 55
Road Contr. Ashoka 152 80 41 67 102 104 111 58 27 116 84 (4)
Sadbhav 16 119 10 42 55 48 20 123 5 51 62 35
KNR 14 52 65 45 109 (22) 15 57 65 43 99 (5)
Source: Company, Ambit Capital research; Note: Standalone figures used for all entities to narrow down on domestic contracting business metrics; for peers in the T&D business, international and non-T&D businesses may exist. We have excluded loans and advances to remove volatility caused by loans given to subsidiaries; 4-year average till FY15 used for Jyoti Structures due to lack of data
61% 60% 60%81% 80% 88% 85% 79%
48%
14% 24%
60% 65%
27% 29%
4%
41%
58%
23% 16%
22%
45%
39% 39% 40%19% 20% 12% 15% 21%
48% 45%
18% 17% 19%
46%
21%
-40%
-20%
0%
20%
40%
60%
80%
100%
120%
140%
0%
20%
40%
60%
80%
100%
120%
FY97 FY98 FY99 FY00 FY01 FY02 FY03 FY04 FY05 FY06 FY07 FY08 FY09 FY10 FY11
Revenue mix(% contribution to revenue)
Transmission Distribution Generation/ Others Revenue growth (RHS)
Techno E&E Co.
July 07, 2016 Ambit Capital Pvt. Ltd. Page 11
We believe the company’s working capital requirement is a function of its conservative revenue recognition practices. Our primary checks indicate that PGCIL and multi-lateral agencies that fund state projects make payments in 60-90 days. A similar figure reported by the company prior to its foray into the wind business indicates the measured approach to revenue recognition.
The exhibit below illustrates the company’s deterioration in standalone working capital over the last 5 years. This was driven by its foray into the wind business (increase in receivable days) and decline in advances possibly as a trade-off for higher margins since some customers demand interest on advances.
Exhibit 17: TEEC’s standalone working capital has deteriorated but should improve hereon Standalone FY07-11 avg FY12 FY13 FY14 FY15 FY16E FY12-16 avg FY17E FY18E
Working capital days (0) 3 28 31 91 73 45 51 36
Inventories 2 1 1 7 3 13 5 3 3
Receivables 21 38 60 50 104 108 72 76 71
Retention money 42 61 76 68 60 53 64 59 58
Other assets 0 0 - 1 0 0 0 0 0 L&A (excl loans to others/ subs) 26 8 12 8 8 3 8 3 3
Payables 37 49 59 54 65 97 65 70 71
Advances 53 53 55 45 18 3 35 17 25
Other liabilities 1 3 7 4 1 5 4 3 3
Source: Company, Ambit Capital research;
Over the next 2 years, the company’s working capital should improve due to partial unwinding of receivables. A bulk of FY16 receivables are from the company’s self-owned Patran project which will now reduce.
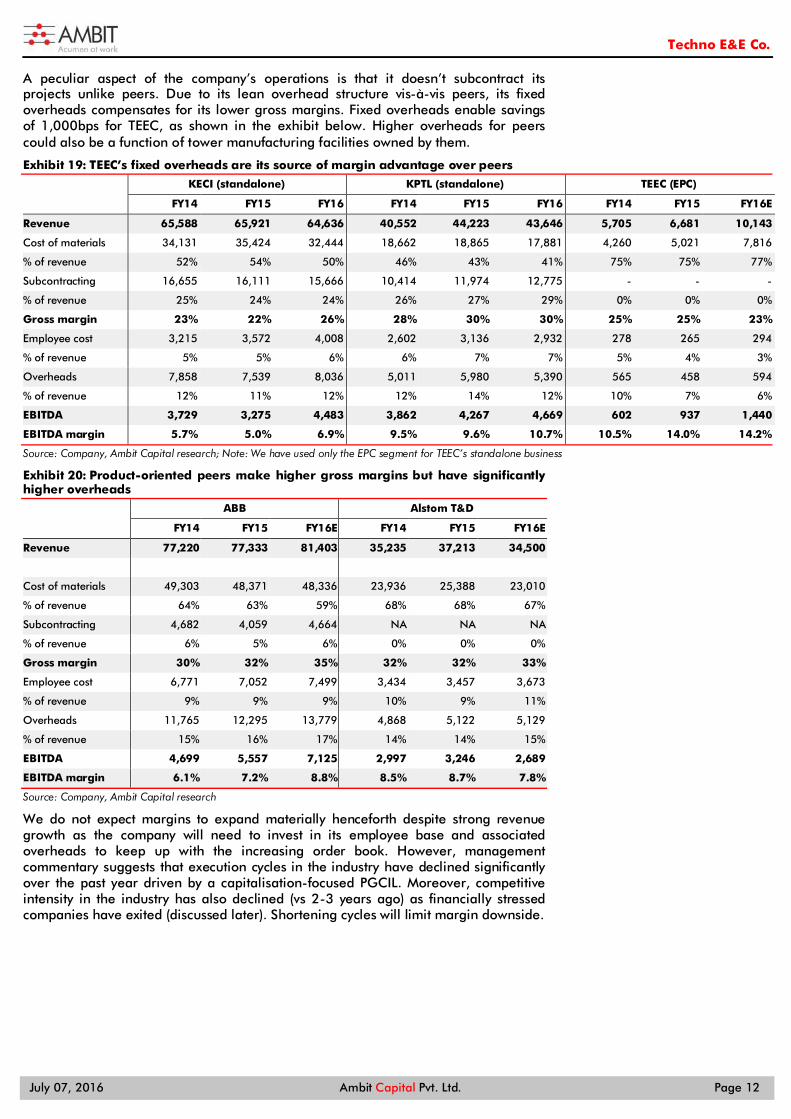
Cost efficiencies – controlled overheads TEEC’s fixed overheads have largely been steady over the last 5 years. Despite an 8% CAGR in revenue, fixed overheads have increased only at 3% CAGR. A largely asset-light, lean organisation structure has aided in overheads control. For instance, the company’s employee base is the same as it was in Aug 2011. In the last 5 years, the company’s profitability in its contracting business declined and thereafter increased. The decline in EBITDA margin in FY13 and FY14 was a function of a decline in revenue, indicated by the steady overheads.
Exhibit 18: Standalone business costs – TEEC’s fixed overheads in the EPC business have largely remained steady
FY07-11 CAGR FY12 FY13 FY14 FY15 FY16E FY12-16E CAGR
EPC business Revenue 13% 7,040 5,159 5,705 6,681 10,143 8%
Cost of material 11% 5,129 3,747 4,260 5,021 7,816 9%
Gross margin 27.1% 27.4% 25.3% 24.8% 22.9% Fixed over-heads 14% 783 839 843 722 888 3%
% of revenue 11.1% 16.3% 14.8% 10.8% 8.8% EBITDA 1,128 573 602 937 1,440 EBITDA margin 16.0% 11.1% 10.5% 14.0% 14.2% Wind business Revenue 282 356 236 210 186 Gross margin 100% 100% 100% 100% 100% Fixed over-heads 2 4 2 52 42 % of revenue 0.6% 1.1% 1.0% 24.9% 22.6% EBITDA 280 352 234 158 144 EBITDA margin 99% 99% 99% 75% 77% Source: Company, Ambit Capital research
Techno E&E Co.
July 07, 2016 Ambit Capital Pvt. Ltd. Page 12
A peculiar aspect of the company’s operations is that it doesn’t subcontract its projects unlike peers. Due to its lean overhead structure vis-à-vis peers, its fixed overheads compensates for its lower gross margins. Fixed overheads enable savings of 1,000bps for TEEC, as shown in the exhibit below. Higher overheads for peers could also be a function of tower manufacturing facilities owned by them.
Exhibit 19: TEEC’s fixed overheads are its source of margin advantage over peers
KECI (standalone) KPTL (standalone) TEEC (EPC)
FY14 FY15 FY16 FY14 FY15 FY16 FY14 FY15 FY16E
Revenue 65,588 65,921 64,636 40,552 44,223 43,646 5,705 6,681 10,143
Cost of materials 34,131 35,424 32,444 18,662 18,865 17,881 4,260 5,021 7,816
% of revenue 52% 54% 50% 46% 43% 41% 75% 75% 77%
Subcontracting 16,655 16,111 15,666 10,414 11,974 12,775 - - -
% of revenue 25% 24% 24% 26% 27% 29% 0% 0% 0%
Gross margin 23% 22% 26% 28% 30% 30% 25% 25% 23%
Employee cost 3,215 3,572 4,008 2,602 3,136 2,932 278 265 294
% of revenue 5% 5% 6% 6% 7% 7% 5% 4% 3%
Overheads 7,858 7,539 8,036 5,011 5,980 5,390 565 458 594
% of revenue 12% 11% 12% 12% 14% 12% 10% 7% 6%
EBITDA 3,729 3,275 4,483 3,862 4,267 4,669 602 937 1,440
EBITDA margin 5.7% 5.0% 6.9% 9.5% 9.6% 10.7% 10.5% 14.0% 14.2%
Source: Company, Ambit Capital research; Note: We have used only the EPC segment for TEEC’s standalone business
Exhibit 20: Product-oriented peers make higher gross margins but have significantly higher overheads
ABB Alstom T&D
FY14 FY15 FY16E FY14 FY15 FY16E
Revenue 77,220 77,333 81,403 35,235 37,213 34,500
Cost of materials 49,303 48,371 48,336 23,936 25,388 23,010
% of revenue 64% 63% 59% 68% 68% 67%
Subcontracting 4,682 4,059 4,664 NA NA NA
% of revenue 6% 5% 6% 0% 0% 0%
Gross margin 30% 32% 35% 32% 32% 33%
Employee cost 6,771 7,052 7,499 3,434 3,457 3,673
% of revenue 9% 9% 9% 10% 9% 11%
Overheads 11,765 12,295 13,779 4,868 5,122 5,129
% of revenue 15% 16% 17% 14% 14% 15%
EBITDA 4,699 5,557 7,125 2,997 3,246 2,689
EBITDA margin 6.1% 7.2% 8.8% 8.5% 8.7% 7.8%
Source: Company, Ambit Capital research
We do not expect margins to expand materially henceforth despite strong revenue growth as the company will need to invest in its employee base and associated overheads to keep up with the increasing order book. However, management commentary suggests that execution cycles in the industry have declined significantly over the past year driven by a capitalisation-focused PGCIL. Moreover, competitive intensity in the industry has also declined (vs 2-3 years ago) as financially stressed companies have exited (discussed later). Shortening cycles will limit margin downside.
Techno E&E Co.
July 07, 2016 Ambit Capital Pvt. Ltd. Page 13
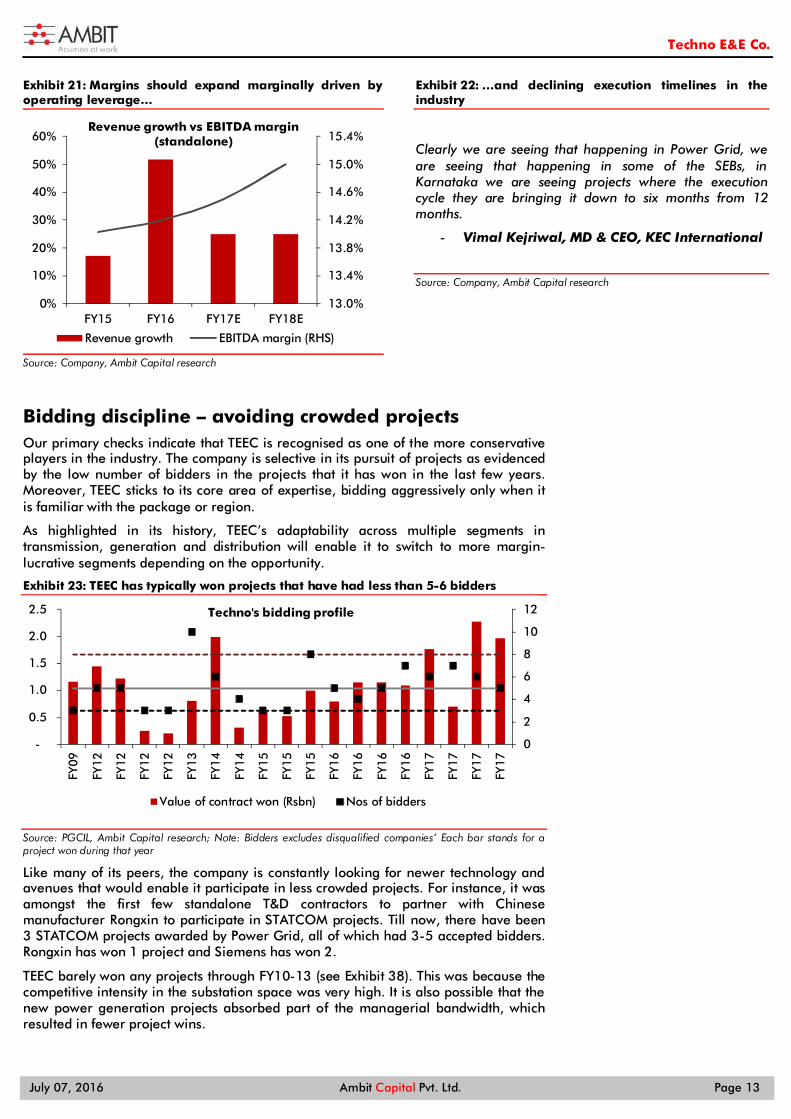
Exhibit 21: Margins should expand marginally driven by operating leverage…
Source: Company, Ambit Capital research
Exhibit 22: …and declining execution timelines in the industry
Clearly we are seeing that happening in Power Grid, we are seeing that happening in some of the SEBs, in Karnataka we are seeing projects where the execution cycle they are bringing it down to six months from 12 months.
- Vimal Kejriwal, MD & CEO, KEC International
Source: Company, Ambit Capital research
Bidding discipline – avoiding crowded projects Our primary checks indicate that TEEC is recognised as one of the more conservative players in the industry. The company is selective in its pursuit of projects as evidenced by the low number of bidders in the projects that it has won in the last few years. Moreover, TEEC sticks to its core area of expertise, bidding aggressively only when it is familiar with the package or region.
As highlighted in its history, TEEC’s adaptability across multiple segments in transmission, generation and distribution will enable it to switch to more margin-lucrative segments depending on the opportunity.
Exhibit 23: TEEC has typically won projects that have had less than 5-6 bidders
Source: PGCIL, Ambit Capital research; Note: Bidders excludes disqualified companies’ Each bar stands for a project won during that year
Like many of its peers, the company is constantly looking for newer technology and avenues that would enable it participate in less crowded projects. For instance, it was amongst the first few standalone T&D contractors to partner with Chinese manufacturer Rongxin to participate in STATCOM projects. Till now, there have been 3 STATCOM projects awarded by Power Grid, all of which had 3-5 accepted bidders. Rongxin has won 1 project and Siemens has won 2.
TEEC barely won any projects through FY10-13 (see Exhibit 38). This was because the competitive intensity in the substation space was very high. It is also possible that the new power generation projects absorbed part of the managerial bandwidth, which resulted in fewer project wins.
13.0%
13.4%
13.8%
14.2%
14.6%
15.0%
15.4%
0%
10%
20%
30%
40%
50%
60%
FY15 FY16 FY17E FY18E
Revenue growth vs EBITDA margin(standalone)
Revenue growth EBITDA margin (RHS)
0
2
4
6
8
10
12
-
0.5
1.0
1.5
2.0
2.5
FY09
FY12
FY12
FY12
FY12
FY13
FY14
FY14
FY15
FY15
FY15
FY16
FY16
FY16
FY16
FY17
FY17
FY17
FY17
Techno's bidding profile
Value of contract won (Rsbn) Nos of bidders
Techno E&E Co.
July 07, 2016 Ambit Capital Pvt. Ltd. Page 14
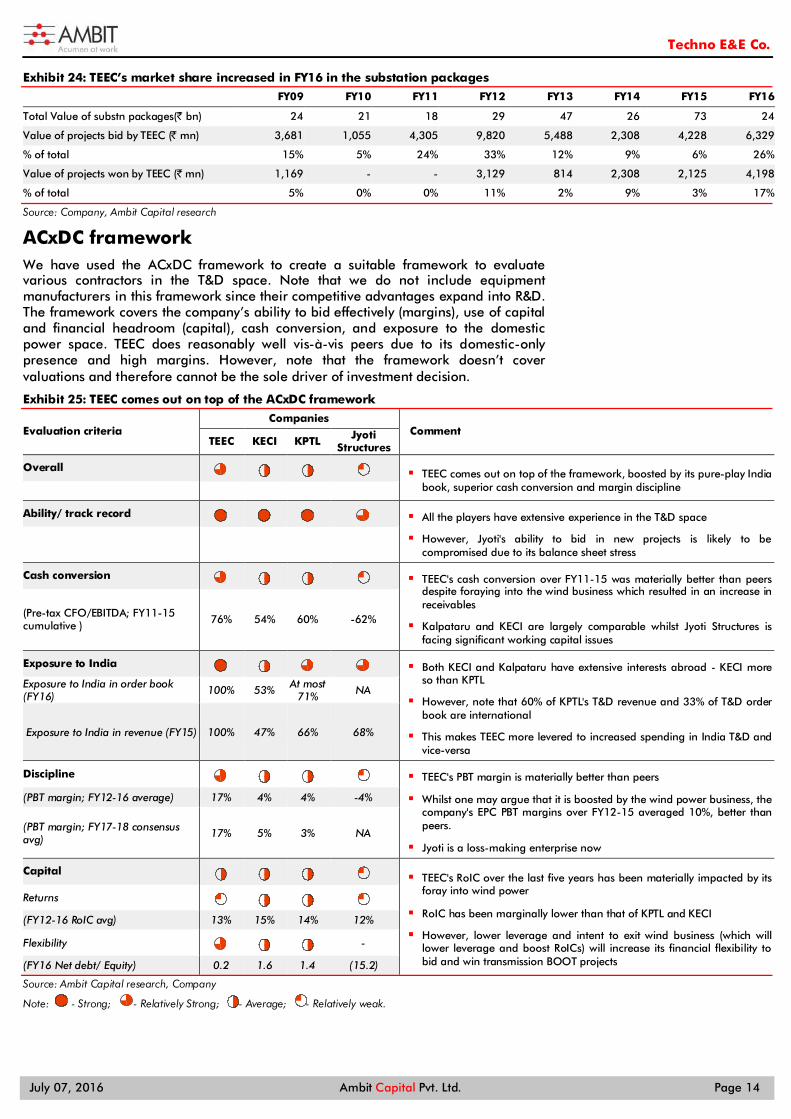
Exhibit 24: TEEC’s market share increased in FY16 in the substation packages
FY09 FY10 FY11 FY12 FY13 FY14 FY15 FY16
Total Value of substn packages(` bn) 24 21 18 29 47 26 73 24
Value of projects bid by TEEC (̀ mn) 3,681 1,055 4,305 9,820 5,488 2,308 4,228 6,329
% of total 15% 5% 24% 33% 12% 9% 6% 26%
Value of projects won by TEEC (` mn) 1,169 - - 3,129 814 2,308 2,125 4,198
% of total 5% 0% 0% 11% 2% 9% 3% 17%
Source: Company, Ambit Capital research
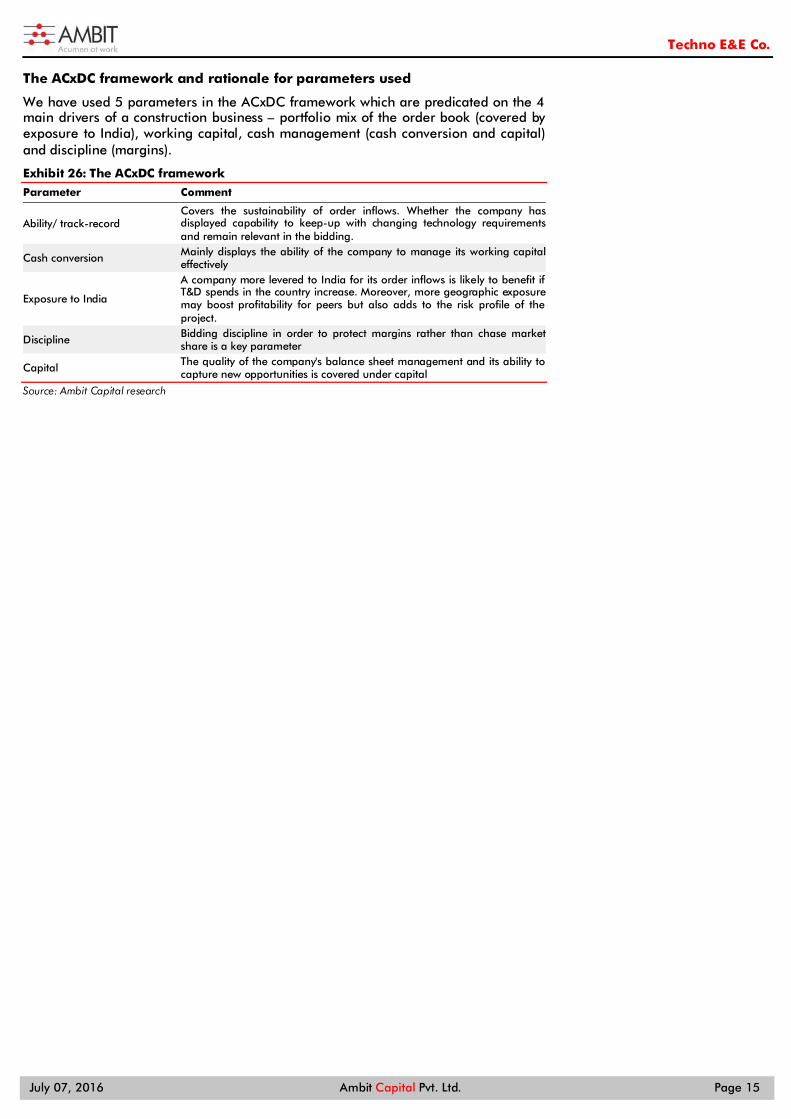
ACxDC framework We have used the ACxDC framework to create a suitable framework to evaluate various contractors in the T&D space. Note that we do not include equipment manufacturers in this framework since their competitive advantages expand into R&D. The framework covers the company’s ability to bid effectively (margins), use of capital and financial headroom (capital), cash conversion, and exposure to the domestic power space. TEEC does reasonably well vis-à-vis peers due to its domestic-only presence and high margins. However, note that the framework doesn’t cover valuations and therefore cannot be the sole driver of investment decision.
Exhibit 25: TEEC comes out on top of the ACxDC framework
Evaluation criteria Companies
Comment TEEC KECI KPTL Jyoti
Structures
Overall TEEC comes out on top of the framework, boosted by its pure-play India
book, superior cash conversion and margin discipline
Ability/ track record
All the players have extensive experience in the T&D space
However, Jyoti's ability to bid in new projects is likely to be compromised due to its balance sheet stress
Cash conversion
TEEC's cash conversion over FY11-15 was materially better than peers despite foraying into the wind business which resulted in an increase in receivables
Kalpataru and KECI are largely comparable whilst Jyoti Structures is facing significant working capital issues
(Pre-tax CFO/EBITDA; FY11-15 cumulative ) 76% 54% 60% -62%
Exposure to India
Both KECI and Kalpataru have extensive interests abroad - KECI more so than KPTL
However, note that 60% of KPTL's T&D revenue and 33% of T&D order book are international
This makes TEEC more levered to increased spending in India T&D and vice-versa
Exposure to India in order book (FY16) 100% 53% At most
71% NA
Exposure to India in revenue (FY15) 100% 47% 66% 68%
Discipline
TEEC's PBT margin is materially better than peers
Whilst one may argue that it is boosted by the wind power business, the company's EPC PBT margins over FY12-15 averaged 10%, better than peers.
Jyoti is a loss-making enterprise now
(PBT margin; FY12-16 average) 17% 4% 4% -4%
(PBT margin; FY17-18 consensus avg) 17% 5% 3% NA
Capital TEEC's RoIC over the last five years has been materially impacted by its
foray into wind power
RoIC has been marginally lower than that of KPTL and KECI
However, lower leverage and intent to exit wind business (which will lower leverage and boost RoICs) will increase its financial flexibility to bid and win transmission BOOT projects
Returns
(FY12-16 RoIC avg) 13% 15% 14% 12%
Flexibility
-
(FY16 Net debt/ Equity) 0.2 1.6 1.4 (15.2)
Source: Ambit Capital research, Company
Note: - Strong; - Relatively Strong; - Average; - Relatively weak.
Techno E&E Co.
July 07, 2016 Ambit Capital Pvt. Ltd. Page 15
The ACxDC framework and rationale for parameters used
We have used 5 parameters in the ACxDC framework which are predicated on the 4 main drivers of a construction business – portfolio mix of the order book (covered by exposure to India), working capital, cash management (cash conversion and capital) and discipline (margins).
Exhibit 26: The ACxDC framework
Parameter Comment
Ability/ track-record Covers the sustainability of order inflows. Whether the company has displayed capability to keep-up with changing technology requirements and remain relevant in the bidding.
Cash conversion Mainly displays the ability of the company to manage its working capital effectively
Exposure to India
A company more levered to India for its order inflows is likely to benefit if T&D spends in the country increase. Moreover, more geographic exposure may boost profitability for peers but also adds to the risk profile of the project.
Discipline Bidding discipline in order to protect margins rather than chase market share is a key parameter
Capital The quality of the company's balance sheet management and its ability to capture new opportunities is covered under capital
Source: Ambit Capital research
Techno E&E Co.
July 07, 2016 Ambit Capital Pvt. Ltd. Page 16
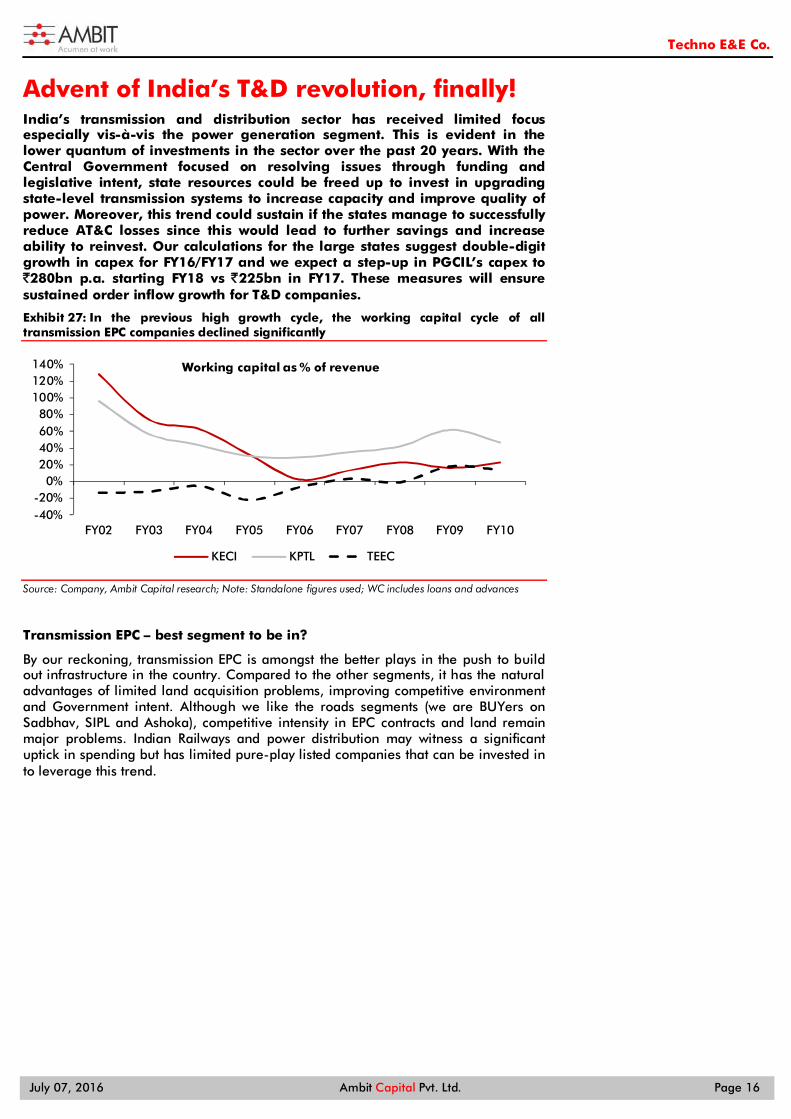
Advent of India’s T&D revolution, finally! India’s transmission and distribution sector has received limited focus especially vis-à-vis the power generation segment. This is evident in the lower quantum of investments in the sector over the past 20 years. With the Central Government focused on resolving issues through funding and legislative intent, state resources could be freed up to invest in upgrading state-level transmission systems to increase capacity and improve quality of power. Moreover, this trend could sustain if the states manage to successfully reduce AT&C losses since this would lead to further savings and increase ability to reinvest. Our calculations for the large states suggest double-digit growth in capex for FY16/FY17 and we expect a step-up in PGCIL’s capex to `280bn p.a. starting FY18 vs `225bn in FY17. These measures will ensure sustained order inflow growth for T&D companies.
Exhibit 27: In the previous high growth cycle, the working capital cycle of all transmission EPC companies declined significantly
Source: Company, Ambit Capital research; Note: Standalone figures used; WC includes loans and advances
Transmission EPC – best segment to be in?
By our reckoning, transmission EPC is amongst the better plays in the push to build out infrastructure in the country. Compared to the other segments, it has the natural advantages of limited land acquisition problems, improving competitive environment and Government intent. Although we like the roads segments (we are BUYers on Sadbhav, SIPL and Ashoka), competitive intensity in EPC contracts and land remain major problems. Indian Railways and power distribution may witness a significant uptick in spending but has limited pure-play listed companies that can be invested in to leverage this trend.
-40%-20%
0%20%40%60%80%
100%120%140%
FY02 FY03 FY04 FY05 FY06 FY07 FY08 FY09 FY10
Working capital as % of revenue
KECI KPTL TEEC
Techno E&E Co.
July 07, 2016 Ambit Capital Pvt. Ltd. Page 17
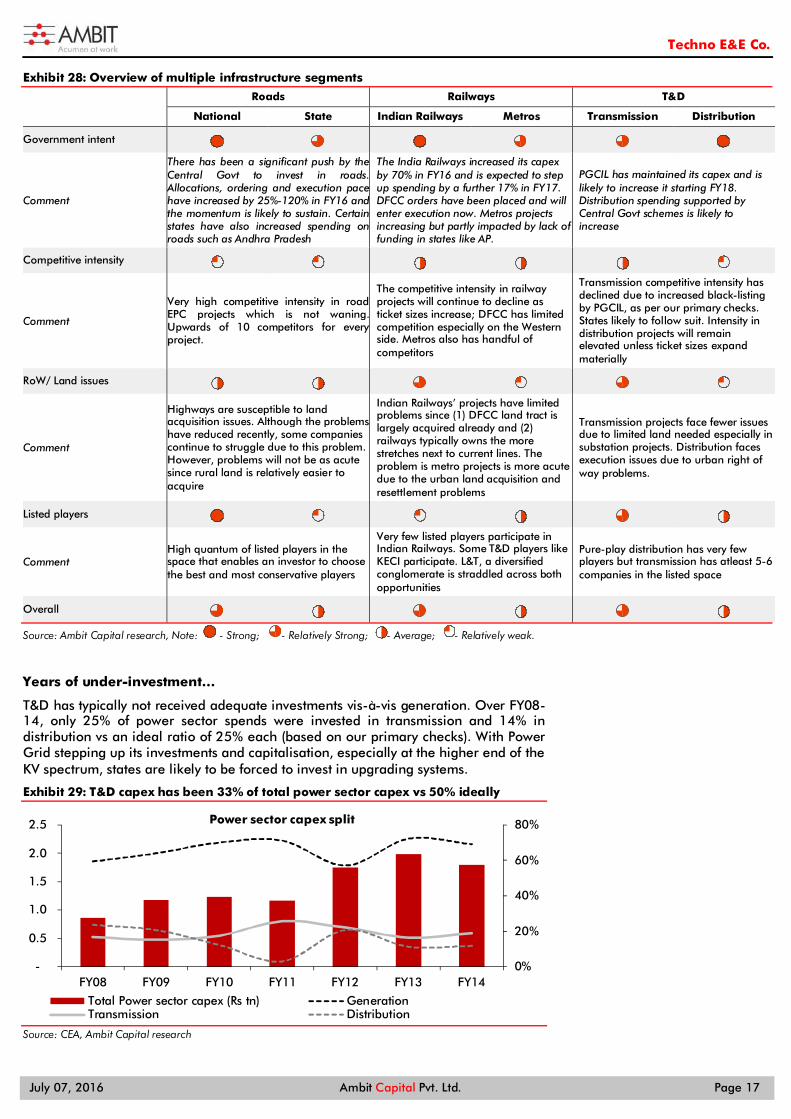
Exhibit 28: Overview of multiple infrastructure segments
Roads Railways T&D
National State Indian Railways Metros Transmission Distribution
Government intent
Comment
There has been a significant push by the Central Govt to invest in roads. Allocations, ordering and execution pace have increased by 25%-120% in FY16 and the momentum is likely to sustain. Certain states have also increased spending on roads such as Andhra Pradesh
The India Railways increased its capex by 70% in FY16 and is expected to step up spending by a further 17% in FY17. DFCC orders have been placed and will enter execution now. Metros projects increasing but partly impacted by lack of funding in states like AP.
PGCIL has maintained its capex and is likely to increase it starting FY18. Distribution spending supported by Central Govt schemes is likely to increase
Competitive intensity
Comment
Very high competitive intensity in road EPC projects which is not waning. Upwards of 10 competitors for every project.
The competitive intensity in railway projects will continue to decline as ticket sizes increase; DFCC has limited competition especially on the Western side. Metros also has handful of competitors
Transmission competitive intensity has declined due to increased black-listing by PGCIL, as per our primary checks. States likely to follow suit. Intensity in distribution projects will remain elevated unless ticket sizes expand materially
RoW/ Land issues
Comment
Highways are susceptible to land acquisition issues. Although the problems have reduced recently, some companies continue to struggle due to this problem. However, problems will not be as acute since rural land is relatively easier to acquire
Indian Railways’ projects have limited problems since (1) DFCC land tract is largely acquired already and (2) railways typically owns the more stretches next to current lines. The problem is metro projects is more acute due to the urban land acquisition and resettlement problems
Transmission projects face fewer issues due to limited land needed especially in substation projects. Distribution faces execution issues due to urban right of way problems.
Listed players
Comment High quantum of listed players in the space that enables an investor to choose the best and most conservative players
Very few listed players participate in Indian Railways. Some T&D players like KECI participate. L&T, a diversified conglomerate is straddled across both opportunities
Pure-play distribution has very few players but transmission has atleast 5-6 companies in the listed space
Overall
Source: Ambit Capital research, Note: - Strong; - Relatively Strong; - Average; - Relatively weak.
Years of under-investment…
T&D has typically not received adequate investments vis-à-vis generation. Over FY08-14, only 25% of power sector spends were invested in transmission and 14% in distribution vs an ideal ratio of 25% each (based on our primary checks). With Power Grid stepping up its investments and capitalisation, especially at the higher end of the KV spectrum, states are likely to be forced to invest in upgrading systems.
Exhibit 29: T&D capex has been 33% of total power sector capex vs 50% ideally
Source: CEA, Ambit Capital research
0%
20%
40%
60%
80%
-
0.5
1.0
1.5
2.0
2.5
FY08 FY09 FY10 FY11 FY12 FY13 FY14
Power sector capex split
Total Power sector capex (Rs tn) GenerationTransmission Distribution
Techno E&E Co.
July 07, 2016 Ambit Capital Pvt. Ltd. Page 18
… with an evolving power system
The need for accelerated investments in transmission is also necessitated by the changing production centers, consumption centers and type of power in the country. Changing production and consumption centers will drive further need for capacity enhancements and new lines. Increase role of renewables and focus on high-technology investments by PGCIL will lead to higher focus on ‘quality of power’ investments.
Exhibit 30: Mix of installed capacity is changing in terms of regions, which will necessitate further investment Mix of installed MW FY12 FY17 FY22 FY27
North 26% 24% 22% 24%
West 32% 35% 32% 30%
South 27% 26% 26% 25%
East 14% 13% 17% 15%
North East 1% 2% 3% 3%
Source: Company, Ambit Capital research
Exhibit 31: Change in mix towards renewables is likely to accelerate Mix of installed MW FY97 FY02 FY07 FY12 FY15
Thermal 71% 71% 65% 66% 71%
Nuclear 3% 3% 3% 2% 2%
Hydro 25% 25% 26% 20% 15%
Renewables 1% 2% 6% 12% 12%
Total 100% 100% 100% 100% 100%
Source: Company, Ambit Capital research
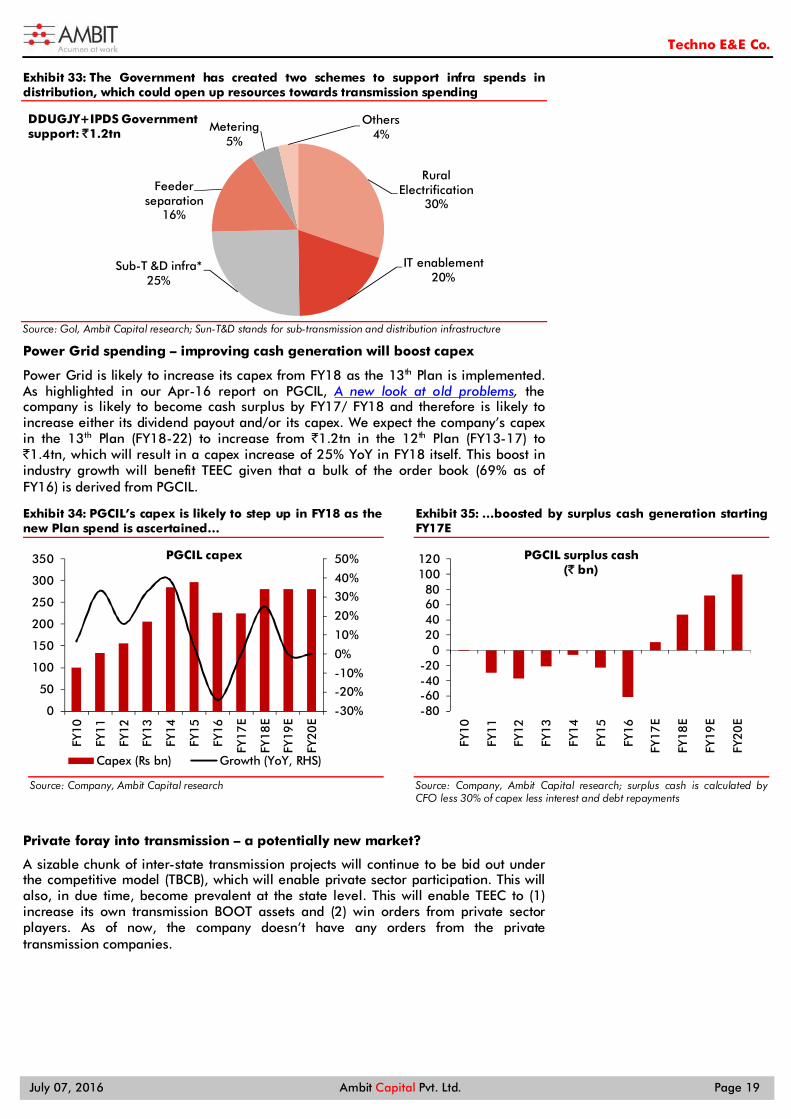
Central Government action plan – resolving issues across the value chain
The central Government seems to have a multi-level approach to resolve the power sector problems in the country. These include pushing Coal India to increase production, improving coal linkages and pushing renewables. A bulk of the Government’s T&D program is aimed for resolving distribution side problems. These include UDAY (to reduce interest costs for state-owned distribution companies) and IPDS and DDUDJY (aimed at providing infrastructure build-out support).
Exhibit 32: The Center is working towards resolving the power sector’s issues
Source: Media, Power Min, Ambit Capital research
Moreover, regulatory changes to encourage private sector participation in inter-state transmission have been or will be implemented. These include separation of CTU from Power Grid, ensuring a majority of projects are open for competitive bidding and reduction of concept to commissioning of transmission projects. The Electricity Act amendments aim to separate a distribution licensee from a supply licensee, which should result in more competitive power tariff pricing.
Techno E&E Co.
July 07, 2016 Ambit Capital Pvt. Ltd. Page 19
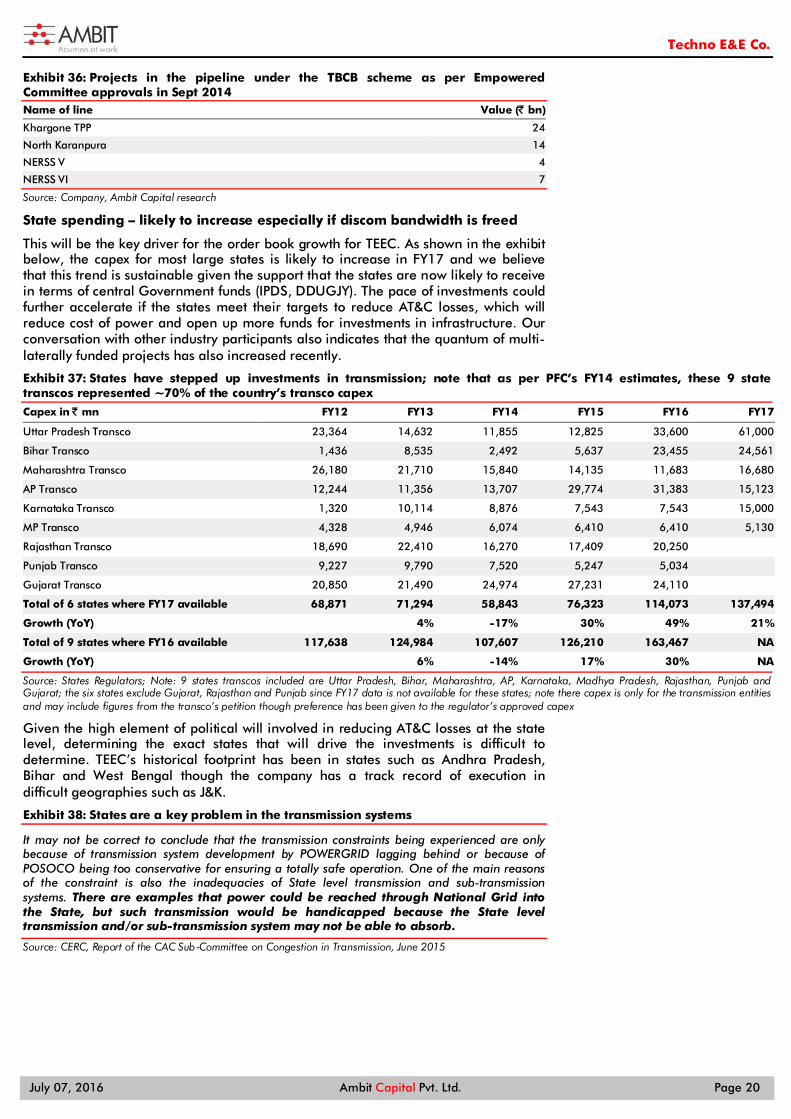
Exhibit 33: The Government has created two schemes to support infra spends in distribution, which could open up resources towards transmission spending
Source: GoI, Ambit Capital research; Sun-T&D stands for sub-transmission and distribution infrastructure
Power Grid spending – improving cash generation will boost capex
Power Grid is likely to increase its capex from FY18 as the 13th Plan is implemented. As highlighted in our Apr-16 report on PGCIL, A new look at old problems, the company is likely to become cash surplus by FY17/ FY18 and therefore is likely to increase either its dividend payout and/or its capex. We expect the company’s capex in the 13th Plan (FY18-22) to increase from `1.2tn in the 12th Plan (FY13-17) to `1.4tn, which will result in a capex increase of 25% YoY in FY18 itself. This boost in industry growth will benefit TEEC given that a bulk of the order book (69% as of FY16) is derived from PGCIL.
Exhibit 34: PGCIL’s capex is likely to step up in FY18 as the new Plan spend is ascertained…
Source: Company, Ambit Capital research
Exhibit 35: …boosted by surplus cash generation starting FY17E
Source: Company, Ambit Capital research; surplus cash is calculated by CFO less 30% of capex less interest and debt repayments
Private foray into transmission – a potentially new market?
A sizable chunk of inter-state transmission projects will continue to be bid out under the competitive model (TBCB), which will enable private sector participation. This will also, in due time, become prevalent at the state level. This will enable TEEC to (1) increase its own transmission BOOT assets and (2) win orders from private sector players. As of now, the company doesn’t have any orders from the private transmission companies.
Rural Electrification
30%
IT enablement20%
Sub-T &D infra*25%
Feeder separation
16%
Metering5%
Others4%
DDUGJY+IPDS Government support: ̀ 1.2tn
-30%
-20%
-10%
0%
10%
20%
30%
40%
50%
0
50
100
150
200
250
300
350
FY10
FY11
FY12
FY13
FY14
FY15
FY16
FY17
E
FY18
E
FY19
E
FY20
E
PGCIL capex
Capex (Rs bn) Growth (YoY, RHS)
-80-60-40-20
020406080
100120
FY10
FY11
FY12
FY13
FY14
FY15
FY16
FY17
E
FY18
E
FY19
E
FY20
E
PGCIL surplus cash(` bn)
Techno E&E Co.
July 07, 2016 Ambit Capital Pvt. Ltd. Page 20
Exhibit 36: Projects in the pipeline under the TBCB scheme as per Empowered Committee approvals in Sept 2014 Name of line Value (̀ bn)
Khargone TPP 24
North Karanpura 14
NERSS V 4
NERSS VI 7
Source: Company, Ambit Capital research
State spending – likely to increase especially if discom bandwidth is freed
This will be the key driver for the order book growth for TEEC. As shown in the exhibit below, the capex for most large states is likely to increase in FY17 and we believe that this trend is sustainable given the support that the states are now likely to receive in terms of central Government funds (IPDS, DDUGJY). The pace of investments could further accelerate if the states meet their targets to reduce AT&C losses, which will reduce cost of power and open up more funds for investments in infrastructure. Our conversation with other industry participants also indicates that the quantum of multi-laterally funded projects has also increased recently.
Exhibit 37: States have stepped up investments in transmission; note that as per PFC’s FY14 estimates, these 9 state transcos represented ~70% of the country’s transco capex
Capex in ̀ mn FY12 FY13 FY14 FY15 FY16 FY17
Uttar Pradesh Transco 23,364 14,632 11,855 12,825 33,600 61,000
Bihar Transco 1,436 8,535 2,492 5,637 23,455 24,561
Maharashtra Transco 26,180 21,710 15,840 14,135 11,683 16,680
AP Transco 12,244 11,356 13,707 29,774 31,383 15,123
Karnataka Transco 1,320 10,114 8,876 7,543 7,543 15,000
MP Transco 4,328 4,946 6,074 6,410 6,410 5,130
Rajasthan Transco 18,690 22,410 16,270 17,409 20,250 Punjab Transco 9,227 9,790 7,520 5,247 5,034 Gujarat Transco 20,850 21,490 24,974 27,231 24,110 Total of 6 states where FY17 available 68,871 71,294 58,843 76,323 114,073 137,494
Growth (YoY) 4% -17% 30% 49% 21%
Total of 9 states where FY16 available 117,638 124,984 107,607 126,210 163,467 NA
Growth (YoY) 6% -14% 17% 30% NA
Source: States Regulators; Note: 9 states transcos included are Uttar Pradesh, Bihar, Maharashtra, AP, Karnataka, Madhya Pradesh, Rajasthan, Punjab and Gujarat; the six states exclude Gujarat, Rajasthan and Punjab since FY17 data is not available for these states; note there capex is only for the transmission entities and may include figures from the transco’s petition though preference has been given to the regulator’s approved capex
Given the high element of political will involved in reducing AT&C losses at the state level, determining the exact states that will drive the investments is difficult to determine. TEEC’s historical footprint has been in states such as Andhra Pradesh, Bihar and West Bengal though the company has a track record of execution in difficult geographies such as J&K.
Exhibit 38: States are a key problem in the transmission systems
It may not be correct to conclude that the transmission constraints being experienced are only because of transmission system development by POWERGRID lagging behind or because of POSOCO being too conservative for ensuring a totally safe operation. One of the main reasons of the constraint is also the inadequacies of State level transmission and sub-transmission systems. There are examples that power could be reached through National Grid into the State, but such transmission would be handicapped because the State level transmission and/or sub-transmission system may not be able to absorb.
Source: CERC, Report of the CAC Sub‐Committee on Congestion in Transmission, June 2015
Techno E&E Co.
July 07, 2016 Ambit Capital Pvt. Ltd. Page 21
Substation sub-segment – reducing competition TEEC operates specifically in the substation segment of transmission EPC. Substations have a lower proportion of bought-out elements than transmission line making it more civil oriented than transmission line projects. The key players in this segment are Alstom T&D, TEEC, BHEL, Siemens and the Asian vendors (New North East, Hyosung and Rongxin). Barring TEEC and BHEL, the others are largely equipment manufacturers that either use their in-house EPC capabilities (European players) or outsource to Indian vendors (Asian players).
Exhibit 39: Major players in the substation segment Company Comments
ABB The Power systems segment offers turnkey systems and services for transmission and distribution for power grid and power plants. The Power products segment includes manufacturing, engineering and supply of key T&D components such as transformers, high and medium voltage switchgears, circuit breakers and capacitors
Siemens The Energy segment offers high-efficiency products for power generation, transmission & distribution segment including High Voltage Direct Current (HVDC) transmission systems, substations, switchgear and transformers
Alstom T&D Alstom T&D has a product portfolio of power T&D equipment for low, high and ultra-high voltage electricity transmission; it also provides EPC services for substations
BHEL NA
Bharat Bijlee Manufactures power transformers and it EPC of indoor and outdoor EHV & HV Switchyards up to and including 220 kV
L&T Amongst the largest players in the Power T&D space in India and GCC
Kalpataru Mainly a transmission tower manufacturer and a contractor, it now has developed capabilities in the substation space as well
Tata Projects Tata Projects is one of the leading EPC players for installation of substation and transmission systems
Jyoti Structures It provides a range of solutions such as survey, design and engineering, tower testing, construction and project management of substations and transmission lines; in addition, the company has a tower manufacturing facility
KEC International The company undertakes EPC projects of electrical sub-stations, distribution network, cabling project works, etc
EMCO The company is involved in manufacturing of transformers and transmission line towers; the company is also involved in commissioning of sub-stations, industrial switchyards and power distribution systems
Hyosung Corporation, South Korea
Hyosung is a conglomerate that operates in various fields including fabrics, industrial material, chemical, heavy industrial products, construction, product trading, etc. The company caters to the power sector by manufacturing transformers, switchgears, intelligent electronic devices, etc.
New Northeast Electric (Shenyang), China
It designs, develops, manufactures, and markets electrical transmission and transformation equipment. It also provides installation, maintenance, and after-sale service of power transmission and transformation equipment.
Pinggao Group, China
It is a wholly-owned subsidiary of the State Grid Corporation of China, the world’s largest transmission utility. The company has the largest researching, developing and manufacturing base for high voltage, extra-high voltage and ultra-high voltage switchgears in China. It offers various products for application in power transmission and transformation system, which include GIS solutions, circuit breaker, disconnector and earthing switches, compass solutions, and vacuum circuit breakers.
Xian Xd Switchgear Electric, China It engages in research, development, and production of high voltage switchgears in China.
Source: Company, Ambit Capital research
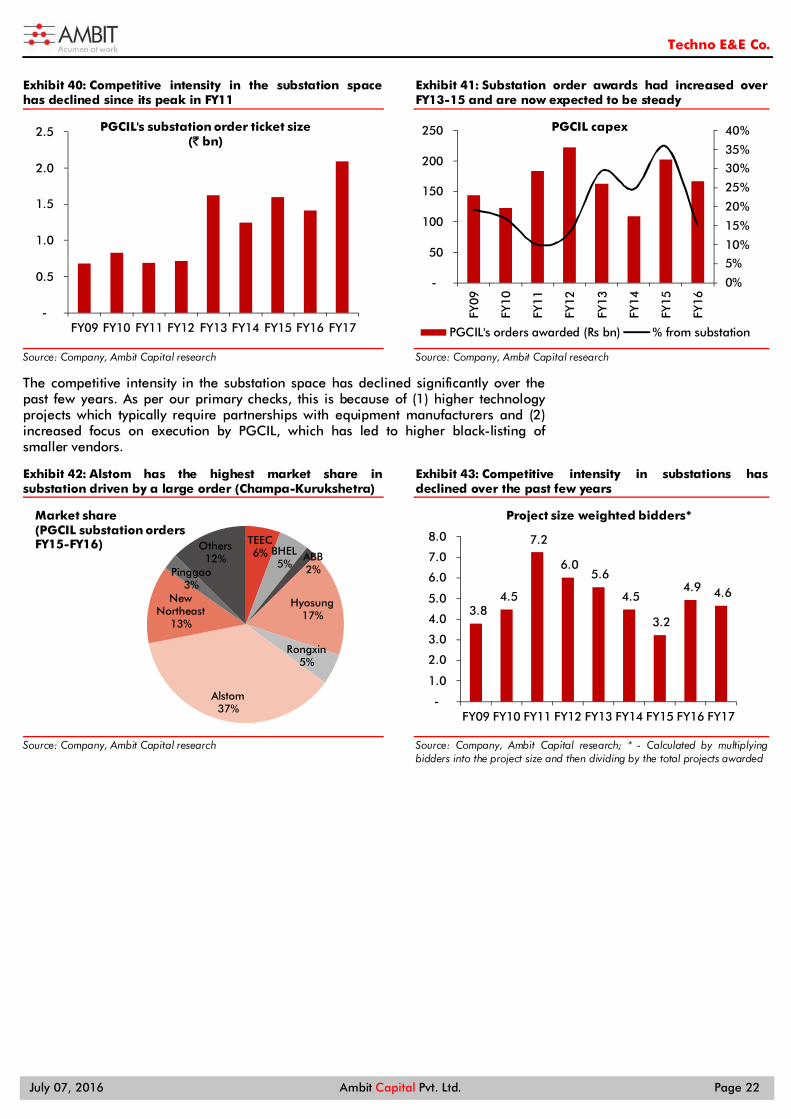
Over the past few years, the proportion of substation ordering by PGCIL has increased. This is because transmission lines are ordered earlier in a cycle (due to longer completion timelines). There was a catch-up required for substations which has largely been normalised now. Moreover, the ticket sizes of substation orders have been increasing as PGCIL continues to move up the value chain in terms of technology.
Techno E&E Co.
July 07, 2016 Ambit Capital Pvt. Ltd. Page 22
Exhibit 40: Competitive intensity in the substation space has declined since its peak in FY11
Source: Company, Ambit Capital research
Exhibit 41: Substation order awards had increased over FY13-15 and are now expected to be steady
Source: Company, Ambit Capital research
The competitive intensity in the substation space has declined significantly over the past few years. As per our primary checks, this is because of (1) higher technology projects which typically require partnerships with equipment manufacturers and (2) increased focus on execution by PGCIL, which has led to higher black-listing of smaller vendors.
Exhibit 42: Alstom has the highest market share in substation driven by a large order (Champa-Kurukshetra)
Source: Company, Ambit Capital research
Exhibit 43: Competitive intensity in substations has declined over the past few years
Source: Company, Ambit Capital research; * - Calculated by multiplying bidders into the project size and then dividing by the total projects awarded
-
0.5
1.0
1.5
2.0
2.5
FY09 FY10 FY11 FY12 FY13 FY14 FY15 FY16 FY17
PGCIL's substation order ticket size(` bn)
0%
5%
10%
15%
20%
25%
30%
35%
40%
-
50
100
150
200
250
FY09
FY10
FY11
FY12
FY13
FY14
FY15
FY16
PGCIL capex
PGCIL's orders awarded (Rs bn) % from substation
TEEC6% BHEL
5%ABB2%
Hyosung17%
Rongxin5%
Alstom37%
New Northeast
13%
Pinggao3%
Others12%
Market share(PGCIL substation ordersFY15-FY16)
3.8 4.5
7.2
6.0 5.6
4.5
3.2
4.9 4.6
-
1.0
2.0
3.0
4.0
5.0
6.0
7.0
8.0
FY09 FY10 FY11 FY12 FY13 FY14 FY15 FY16 FY17
Project size weighted bidders*
Techno E&E Co.
July 07, 2016 Ambit Capital Pvt. Ltd. Page 23
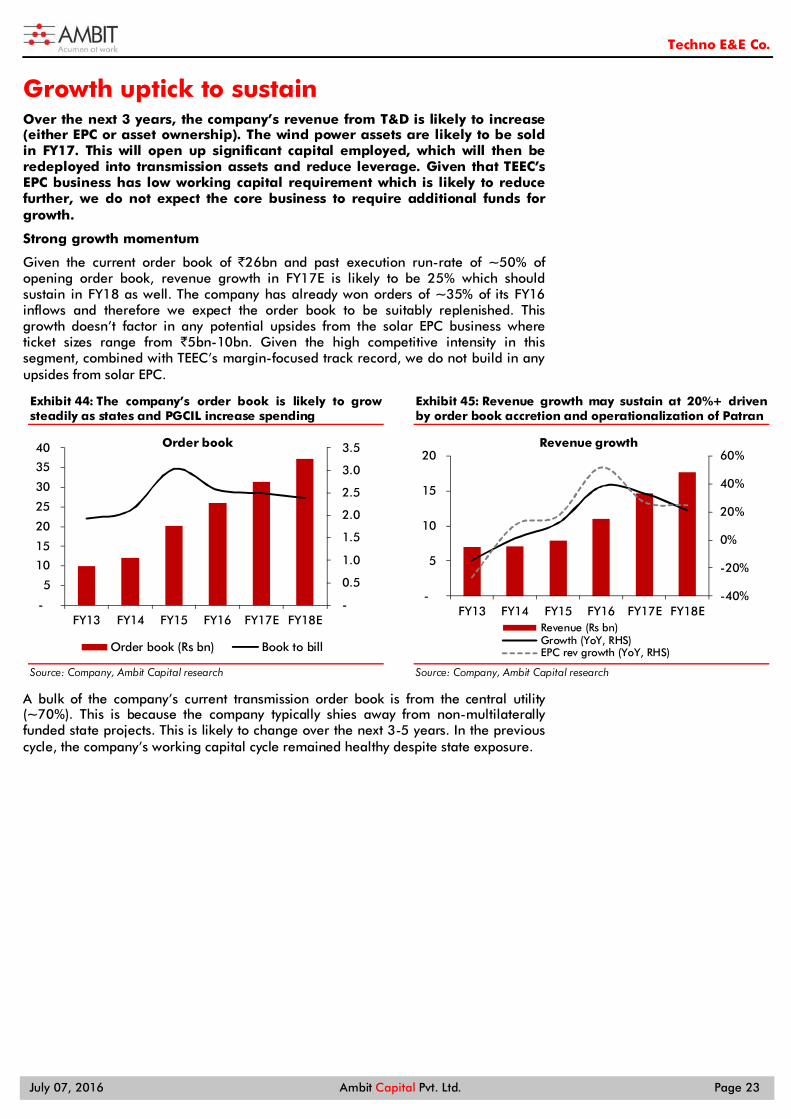
Growth uptick to sustain Over the next 3 years, the company’s revenue from T&D is likely to increase (either EPC or asset ownership). The wind power assets are likely to be sold in FY17. This will open up significant capital employed, which will then be redeployed into transmission assets and reduce leverage. Given that TEEC’s EPC business has low working capital requirement which is likely to reduce further, we do not expect the core business to require additional funds for growth.
Strong growth momentum
Given the current order book of `26bn and past execution run-rate of ~50% of opening order book, revenue growth in FY17E is likely to be 25% which should sustain in FY18 as well. The company has already won orders of ~35% of its FY16 inflows and therefore we expect the order book to be suitably replenished. This growth doesn’t factor in any potential upsides from the solar EPC business where ticket sizes range from `5bn-10bn. Given the high competitive intensity in this segment, combined with TEEC’s margin-focused track record, we do not build in any upsides from solar EPC.
Exhibit 44: The company’s order book is likely to grow steadily as states and PGCIL increase spending
Source: Company, Ambit Capital research
Exhibit 45: Revenue growth may sustain at 20%+ driven by order book accretion and operationalization of Patran
Source: Company, Ambit Capital research
A bulk of the company’s current transmission order book is from the central utility (~70%). This is because the company typically shies away from non-multilaterally funded state projects. This is likely to change over the next 3-5 years. In the previous cycle, the company’s working capital cycle remained healthy despite state exposure.
-
0.5
1.0
1.5
2.0
2.5
3.0
3.5
-
5
10
15
20
25
30
35
40
FY13 FY14 FY15 FY16 FY17E FY18E
Order book
Order book (Rs bn) Book to bill
-40%
-20%
0%
20%
40%
60%
-
5
10
15
20
FY13 FY14 FY15 FY16 FY17E FY18E
Revenue growth
Revenue (Rs bn)Growth (YoY, RHS)EPC rev growth (YoY, RHS)
Techno E&E Co.
July 07, 2016 Ambit Capital Pvt. Ltd. Page 24
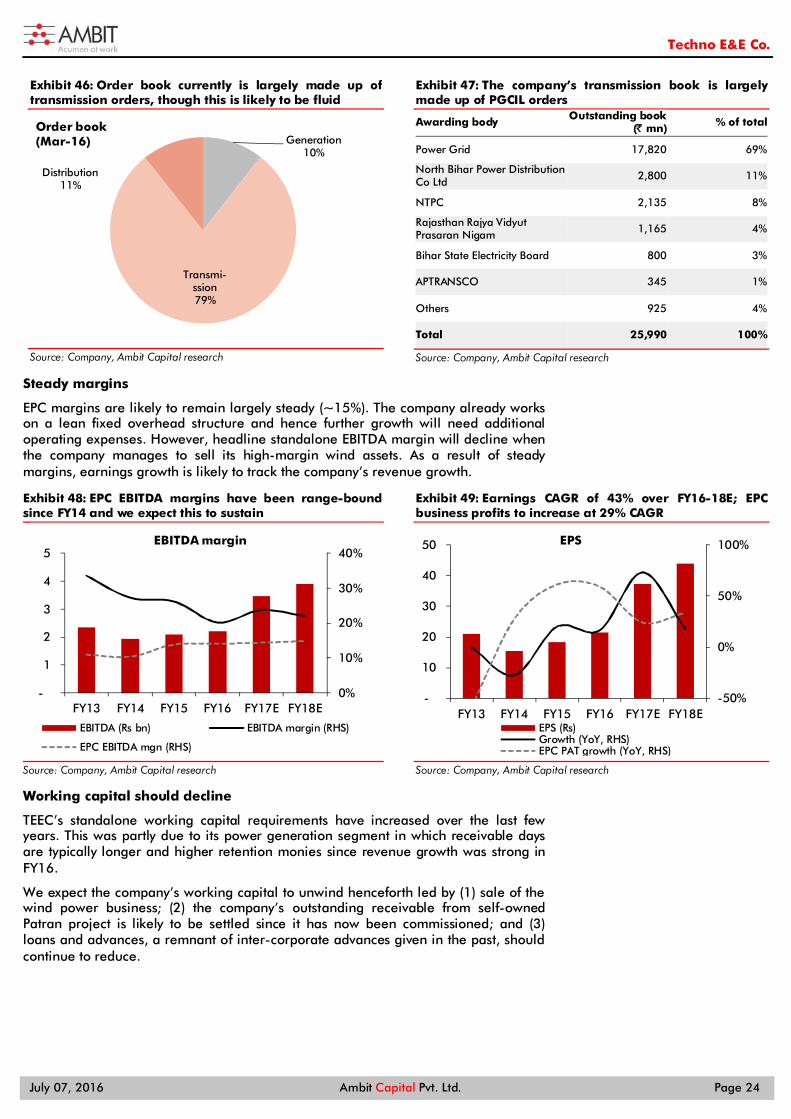
Exhibit 46: Order book currently is largely made up of transmission orders, though this is likely to be fluid
Source: Company, Ambit Capital research
Exhibit 47: The company’s transmission book is largely made up of PGCIL orders
Awarding body Outstanding book (̀ mn) % of total
Power Grid 17,820 69%
North Bihar Power Distribution Co Ltd 2,800 11%
NTPC 2,135 8%
Rajasthan Rajya Vidyut Prasaran Nigam 1,165 4%
Bihar State Electricity Board 800 3%
APTRANSCO 345 1%
Others 925 4%
Total 25,990 100%
Source: Company, Ambit Capital research
Steady margins
EPC margins are likely to remain largely steady (~15%). The company already works on a lean fixed overhead structure and hence further growth will need additional operating expenses. However, headline standalone EBITDA margin will decline when the company manages to sell its high-margin wind assets. As a result of steady margins, earnings growth is likely to track the company’s revenue growth.
Exhibit 48: EPC EBITDA margins have been range-bound since FY14 and we expect this to sustain
Source: Company, Ambit Capital research
Exhibit 49: Earnings CAGR of 43% over FY16-18E; EPC business profits to increase at 29% CAGR
Source: Company, Ambit Capital research
Working capital should decline
TEEC’s standalone working capital requirements have increased over the last few years. This was partly due to its power generation segment in which receivable days are typically longer and higher retention monies since revenue growth was strong in FY16.
We expect the company’s working capital to unwind henceforth led by (1) sale of the wind power business; (2) the company’s outstanding receivable from self-owned Patran project is likely to be settled since it has now been commissioned; and (3) loans and advances, a remnant of inter-corporate advances given in the past, should continue to reduce.
Generation10%
Transmi-ssion79%
Distribution11%
Order book(Mar-16)
0%
10%
20%
30%
40%
-
1
2
3
4
5
FY13 FY14 FY15 FY16 FY17E FY18E
EBITDA margin
EBITDA (Rs bn) EBITDA margin (RHS)
EPC EBITDA mgn (RHS)
-50%
0%
50%
100%
-
10
20
30
40
50
FY13 FY14 FY15 FY16 FY17E FY18E
EPS
EPS (Rs)Growth (YoY, RHS)EPC PAT growth (YoY, RHS)
Techno E&E Co.
July 07, 2016 Ambit Capital Pvt. Ltd. Page 25
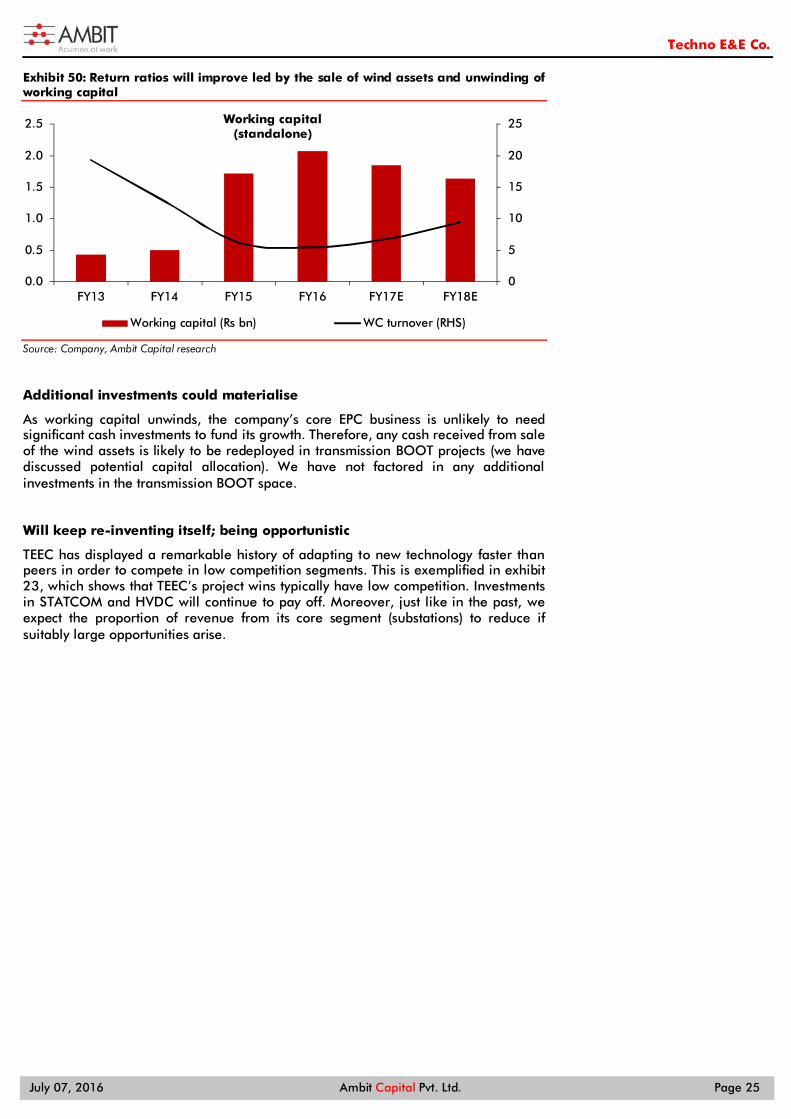
Exhibit 50: Return ratios will improve led by the sale of wind assets and unwinding of working capital
Source: Company, Ambit Capital research
Additional investments could materialise
As working capital unwinds, the company’s core EPC business is unlikely to need significant cash investments to fund its growth. Therefore, any cash received from sale of the wind assets is likely to be redeployed in transmission BOOT projects (we have discussed potential capital allocation). We have not factored in any additional investments in the transmission BOOT space.
Will keep re-inventing itself; being opportunistic
TEEC has displayed a remarkable history of adapting to new technology faster than peers in order to compete in low competition segments. This is exemplified in exhibit 23, which shows that TEEC’s project wins typically have low competition. Investments in STATCOM and HVDC will continue to pay off. Moreover, just like in the past, we expect the proportion of revenue from its core segment (substations) to reduce if suitably large opportunities arise.
0
5
10
15
20
25
0.0
0.5
1.0
1.5
2.0
2.5
FY13 FY14 FY15 FY16 FY17E FY18E
Working capital(standalone)
Working capital (Rs bn) WC turnover (RHS)
Techno E&E Co.
July 07, 2016 Ambit Capital Pvt. Ltd. Page 26
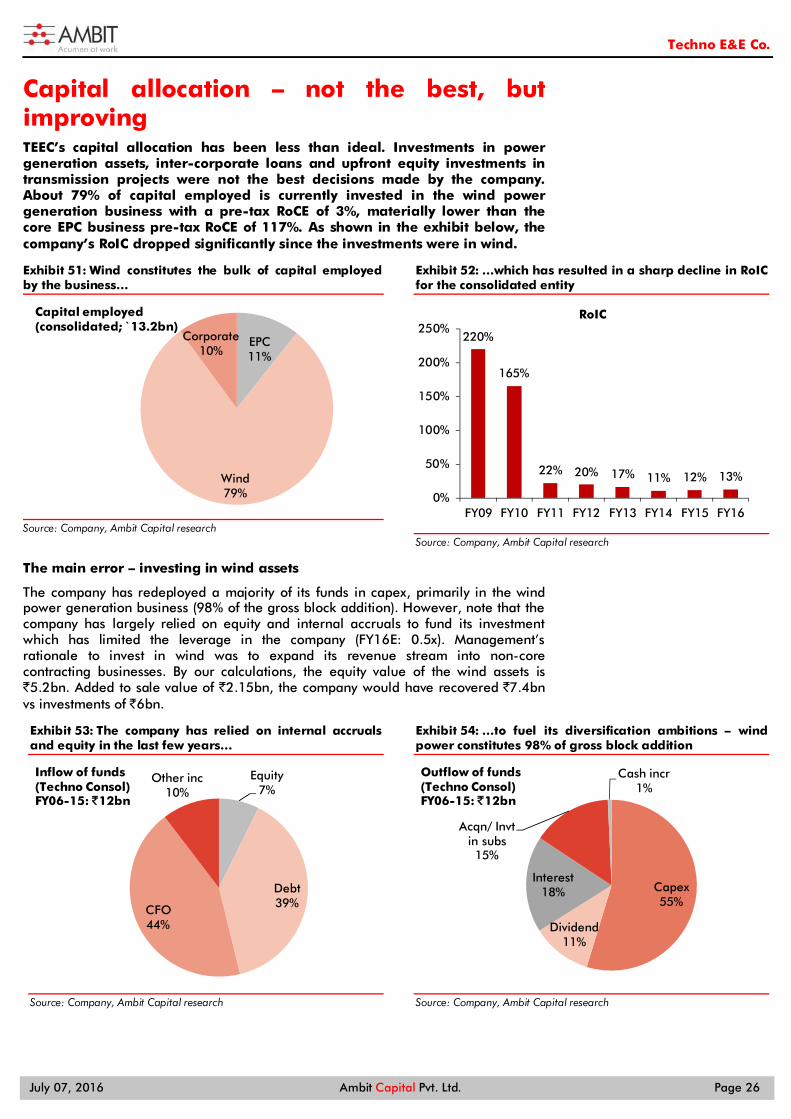
Capital allocation – not the best, but improving TEEC’s capital allocation has been less than ideal. Investments in power generation assets, inter-corporate loans and upfront equity investments in transmission projects were not the best decisions made by the company. About 79% of capital employed is currently invested in the wind power generation business with a pre-tax RoCE of 3%, materially lower than the core EPC business pre-tax RoCE of 117%. As shown in the exhibit below, the company’s RoIC dropped significantly since the investments were in wind.
Exhibit 51: Wind constitutes the bulk of capital employed by the business…
Source: Company, Ambit Capital research
Exhibit 52: …which has resulted in a sharp decline in RoIC for the consolidated entity
Source: Company, Ambit Capital research
The main error – investing in wind assets
The company has redeployed a majority of its funds in capex, primarily in the wind power generation business (98% of the gross block addition). However, note that the company has largely relied on equity and internal accruals to fund its investment which has limited the leverage in the company (FY16E: 0.5x). Management’s rationale to invest in wind was to expand its revenue stream into non-core contracting businesses. By our calculations, the equity value of the wind assets is `5.2bn. Added to sale value of `2.15bn, the company would have recovered `7.4bn vs investments of `6bn.
Exhibit 53: The company has relied on internal accruals and equity in the last few years…
Source: Company, Ambit Capital research
Exhibit 54: …to fuel its diversification ambitions – wind power constitutes 98% of gross block addition
Source: Company, Ambit Capital research
EPC11%
Wind79%
Corporate10%
Capital employed(consolidated; ̀ 13.2bn)
220%
165%
22% 20% 17% 11% 12% 13%
0%
50%
100%
150%
200%
250%
FY09 FY10 FY11 FY12 FY13 FY14 FY15 FY16
RoIC
Equity7%
Debt39%CFO
44%
Other inc10%
Inflow of funds(Techno Consol)FY06-15: ̀ 12bn
Capex55%
Dividend11%
Interest18%
Acqn/ Invt in subs15%
Cash incr1%
Outflow of funds(Techno Consol)FY06-15: ̀ 12bn
Techno E&E Co.
July 07, 2016 Ambit Capital Pvt. Ltd. Page 27
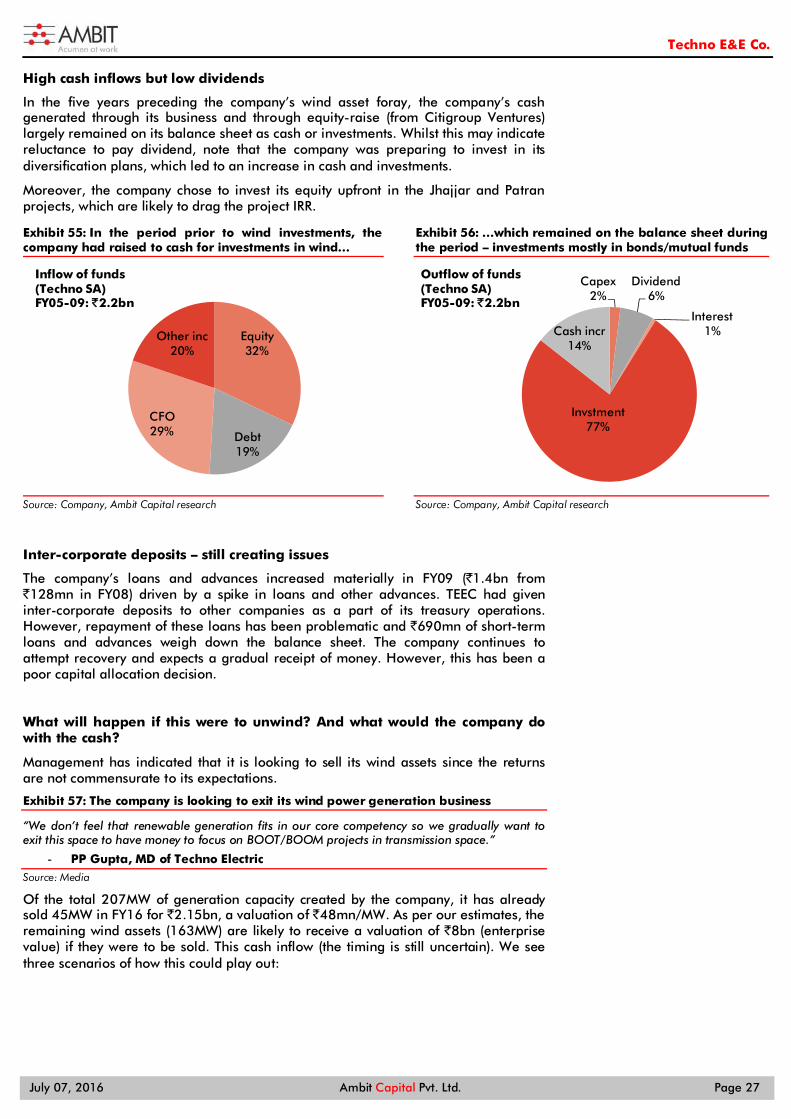
High cash inflows but low dividends
In the five years preceding the company’s wind asset foray, the company’s cash generated through its business and through equity-raise (from Citigroup Ventures) largely remained on its balance sheet as cash or investments. Whilst this may indicate reluctance to pay dividend, note that the company was preparing to invest in its diversification plans, which led to an increase in cash and investments.
Moreover, the company chose to invest its equity upfront in the Jhajjar and Patran projects, which are likely to drag the project IRR.
Exhibit 55: In the period prior to wind investments, the company had raised to cash for investments in wind…
Source: Company, Ambit Capital research
Exhibit 56: …which remained on the balance sheet during the period – investments mostly in bonds/mutual funds
Source: Company, Ambit Capital research
Inter-corporate deposits – still creating issues
The company’s loans and advances increased materially in FY09 (`1.4bn from `128mn in FY08) driven by a spike in loans and other advances. TEEC had given inter-corporate deposits to other companies as a part of its treasury operations. However, repayment of these loans has been problematic and `690mn of short-term loans and advances weigh down the balance sheet. The company continues to attempt recovery and expects a gradual receipt of money. However, this has been a poor capital allocation decision.
What will happen if this were to unwind? And what would the company do with the cash?
Management has indicated that it is looking to sell its wind assets since the returns are not commensurate to its expectations.
Exhibit 57: The company is looking to exit its wind power generation business
“We don’t feel that renewable generation fits in our core competency so we gradually want to exit this space to have money to focus on BOOT/BOOM projects in transmission space.”
- PP Gupta, MD of Techno Electric Source: Media
Of the total 207MW of generation capacity created by the company, it has already sold 45MW in FY16 for `2.15bn, a valuation of `48mn/MW. As per our estimates, the remaining wind assets (163MW) are likely to receive a valuation of `8bn (enterprise value) if they were to be sold. This cash inflow (the timing is still uncertain). We see three scenarios of how this could play out:
Equity32%
Debt19%
CFO29%
Other inc20%
Inflow of funds(Techno SA)FY05-09: ̀ 2.2bn
Capex2%
Dividend6%
Interest1%
Invstment77%
Cash incr14%
Outflow of funds(Techno SA)FY05-09: ̀ 2.2bn
Techno E&E Co.
July 07, 2016 Ambit Capital Pvt. Ltd. Page 28
Transmission BOT assets: The company has indicated that it will redeploy this cash to build its portfolio of transmission assets like its investments in Jhajjar and Patran. TEEC has bid for the rights to build and own transmission assets with ticket sizes varying from `5bn-13bn which would require equity investments of `1bn-4bn through the construction period.
Transmission assets are relatively safe investments as long as the company has bid conservatively (which has been TEEC’s forte). Unlike road BOT projects where the company is exposed to traffic risk (both initial and growth), transmission projects have a pre-fixed revenue stream and therefore IR` are fixed from the day of commissioning (though still exposed to construction and interest rate risk).
Returning cash to shareholders: The company may choose to return the excess cash to shareholders. This is unlikely given management’s stated ambition to redeploy in transmission assets.
Other alternative assets in the power space: The riskiest of the three scenarios is if the company chooses to reinvest the surplus cash into other power generation assets. Other opportunities could also emerge in distribution asset ownership if the Government’s proposal to separate content and carriage were to be successful.
Techno E&E Co.
July 07, 2016 Ambit Capital Pvt. Ltd. Page 29
Valuations – not as expensive as it seems Although the core EPC business is currently valued at a punchy 16x FY18E EPS, we expect the valuations to sustain. There are three key drivers of valuations: (1) the company’s exemplary track record of execution and management quality; (2) high growth that will make valuations seem high; and (3) unwinding of its capital allocation mistake post sale of wind asset will lead to material cash holding, in turn reducing the valuation ascribed to the core business. The core business is valued at a premium to Indian contractors like KECI but at a deserved discount to ABB and Alstom T&D due to its inability to innovate new products. The company is at a 80% premium to its 5- year average though it might not be the best benchmark for comparison given the constantly changing valuations of the embedded assets and impending high operating leverage.
Capital allocation to drive valuations henceforth
Steep valuations led by high growth outlook and relatively strong managerial track record are likely to sustain. However, the key reasons for a potential increase/decline in valuations will be the company’s capital allocation decisions over the next 2-3 years. A repeat of sub-par investments (like in power generation), providing inter-corporate loans with low dividend payout ratios could potentially lead to a decline in implied multiples. Although transmission BOOT projects will drag RoIC down, it will provide stable revenue and stable compounding of invested equity. Therefore, the company’s re-investment plans for any proceeds from wind asset sales will drive valuations over the next two years.
Deserved valuation for low-risk managerial track record
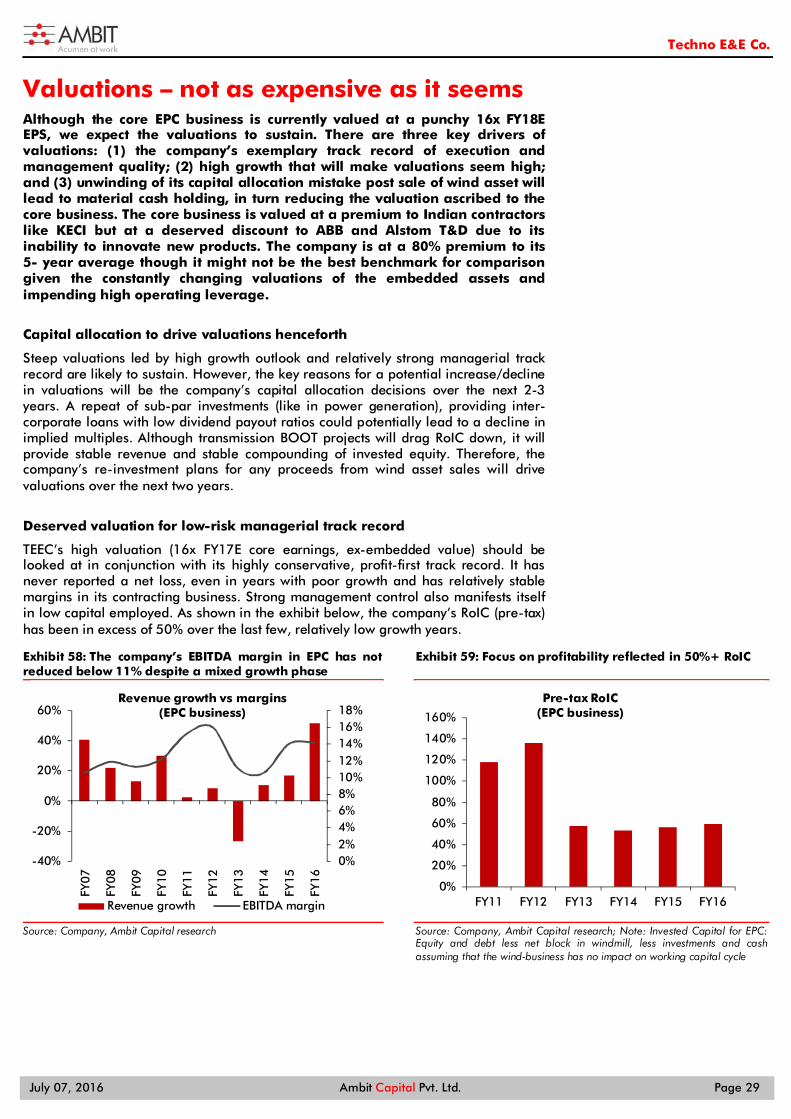
TEEC’s high valuation (16x FY17E core earnings, ex-embedded value) should be looked at in conjunction with its highly conservative, profit-first track record. It has never reported a net loss, even in years with poor growth and has relatively stable margins in its contracting business. Strong management control also manifests itself in low capital employed. As shown in the exhibit below, the company’s RoIC (pre-tax) has been in excess of 50% over the last few, relatively low growth years.
Exhibit 58: The company’s EBITDA margin in EPC has not reduced below 11% despite a mixed growth phase
Source: Company, Ambit Capital research
Exhibit 59: Focus on profitability reflected in 50%+ RoIC
Source: Company, Ambit Capital research; Note: Invested Capital for EPC: Equity and debt less net block in windmill, less investments and cash assuming that the wind-business has no impact on working capital cycle
0%2%4%6%8%10%12%14%16%18%
-40%
-20%
0%
20%
40%
60%
FY07
FY08
FY09
FY10
FY11
FY12
FY13
FY14
FY15
FY16
Revenue growth vs margins(EPC business)
Revenue growth EBITDA margin
0%
20%
40%
60%
80%
100%
120%
140%
160%
FY11 FY12 FY13 FY14 FY15 FY16
Pre-tax RoIC (EPC business)
Techno E&E Co.
July 07, 2016 Ambit Capital Pvt. Ltd. Page 30
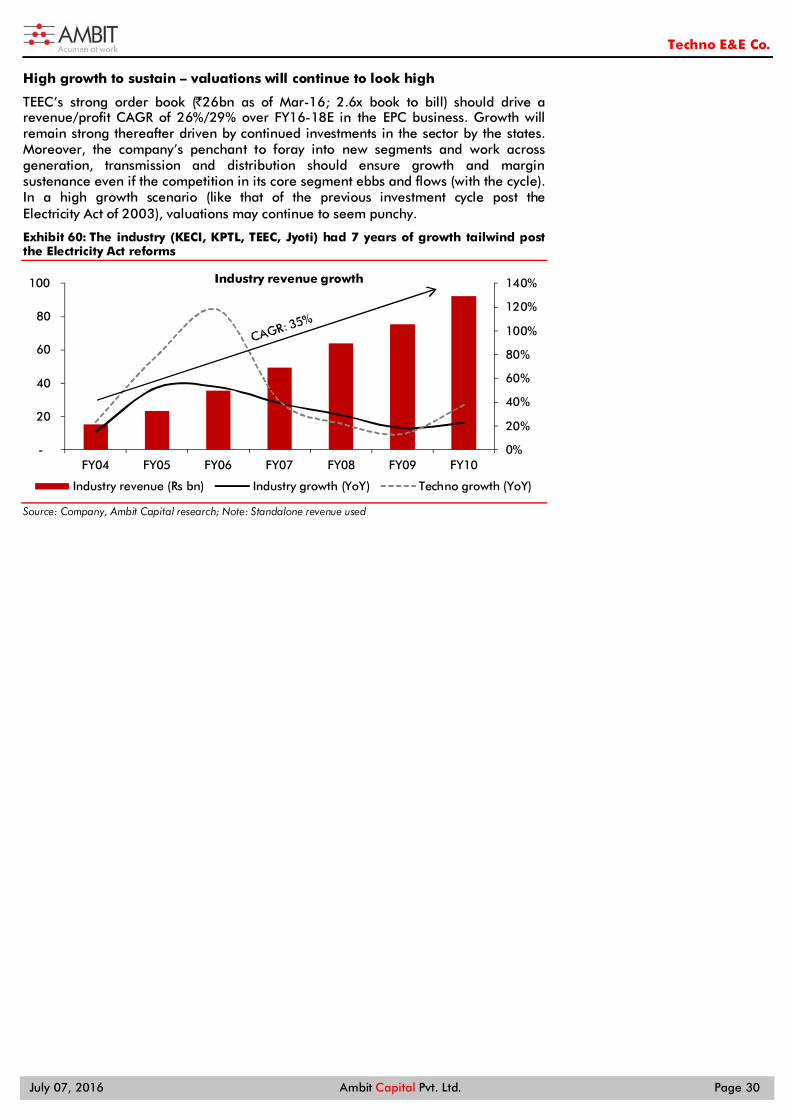
High growth to sustain – valuations will continue to look high
TEEC’s strong order book (̀ 26bn as of Mar-16; 2.6x book to bill) should drive a revenue/profit CAGR of 26%/29% over FY16-18E in the EPC business. Growth will remain strong thereafter driven by continued investments in the sector by the states. Moreover, the company’s penchant to foray into new segments and work across generation, transmission and distribution should ensure growth and margin sustenance even if the competition in its core segment ebbs and flows (with the cycle). In a high growth scenario (like that of the previous investment cycle post the Electricity Act of 2003), valuations may continue to seem punchy.
Exhibit 60: The industry (KECI, KPTL, TEEC, Jyoti) had 7 years of growth tailwind post the Electricity Act reforms
Source: Company, Ambit Capital research; Note: Standalone revenue used
0%
20%
40%
60%
80%
100%
120%
140%
-
20
40
60
80
100
FY04 FY05 FY06 FY07 FY08 FY09 FY10
Industry revenue growth
Industry revenue (Rs bn) Industry growth (YoY) Techno growth (YoY)
Techno E&E Co.
July 07, 2016 Ambit Capital Pvt. Ltd. Page 31
Key assumptions Exhibit 61: Key assumptions – all parameters are directionally positive
` mn
Standalone Consolidated
FY16 FY17 FY18 FY16 FY17 FY18
Order Book Order inflow (` bn) 15.9 18.3 21.9 15.9 18.3 21.9
Growth (YoY) 7% 15% 20% 7% 15% 20%
Closing order book 26 31 37 26 31 37
Book to bill 2.6 2.4 2.3 2.6 2.4 2.3
Income statement Revenues 10,328 13,216 16,396 10,972 14,620 17,712
Growth (YoY) 50% 28% 24% 38% 33% 21%
EPC 10,143 12,881 16,102 10,143 12,881 16,102
Transmission BOOT - - - - 164 225
Wind 186 335 295 829 1,574 1,385
Wind PLF 14% 25% 22% 13% 25% 22%
EBITDA 1,593 2,119 2,636 2,213 3,467 3,893
EBITDA margin 15% 16% 16% 20% 24% 22%
EPC 14% 15% 15% 14% 15% 15%
Transmission BOOT NA NA NA NA NA NA
Wind 77% 75% 75% 92% 92% 91%
Depreciation 136 138 143 495 578 596
EBIT 1,457 1,981 2,493 1,718 2,888 3,297
PBT 1,528 1,875 2,457 1,650 2,488 3,009
EPC 1,217 1,680 2,240 1,217 1,680 2,240
Transmission BOOT - - - - (10) 21
Wind 21 130 100 48 714 559
PBT margin 15% 14% 15% 15% 17% 17%
EPC 12% 13% 14% 12% 13% 14%
Transmission BOOT NA NA NA NA -6% 9%
Wind 12% 39% 34% 6% 45% 40%
PAT 1,247 1,443 1,892 1,226 2,123 2,509
EPS (`) 22 25 33 21 37 44
Core EPS (̀ ) 18 23 30 18 23 30
Growth (YoY) 59% 24% 34% 59% 24% 34%
Balance sheet Working capital 2,073 1,853 1,636 3,653 3,306 2,936
Working Capital turns 5.4 6.7 9.4 3.4 4.2 5.7
Capital Employed 9,409 10,120 11,349 14,936 17,371 18,632
Capem turns 1.1 1.4 1.5 0.7 0.9 1.0
Net debt/ Equity 0.1 (0.0) (0.2) 0.3 0.2 (0.1)
RoE 17% 17% 20% 13% 19% 20%
RoCE 13% 16% 18% 9% 15% 15%
Source: Company, Ambit Capital research
Order book
We expect momentum in order inflow to sustain backed by higher ordering by PGCIL and the states and lower competitive intensity. Large orders can materialize from segments such as STATCOM. The company also plans to foray into the solar EPC segment which could meaningfully add to the order book. However, we have not included this into our assumptions yet.
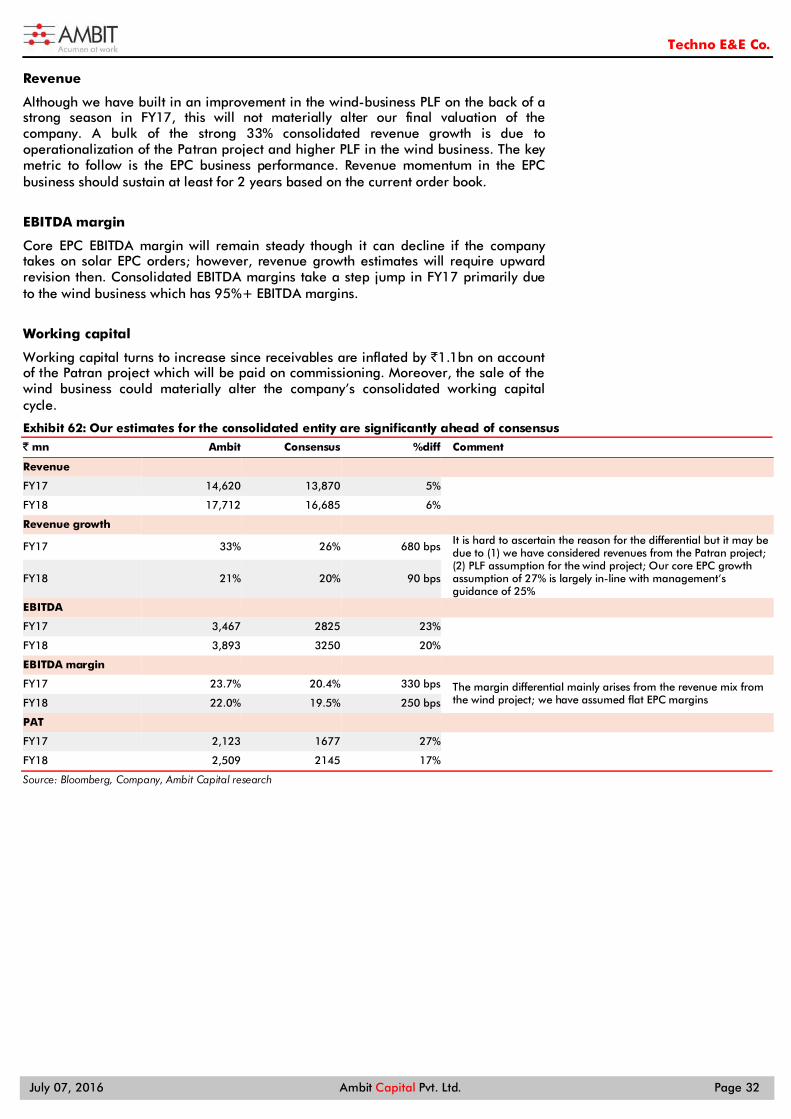
Techno E&E Co.
July 07, 2016 Ambit Capital Pvt. Ltd. Page 32
Revenue
Although we have built in an improvement in the wind-business PLF on the back of a strong season in FY17, this will not materially alter our final valuation of the company. A bulk of the strong 33% consolidated revenue growth is due to operationalization of the Patran project and higher PLF in the wind business. The key metric to follow is the EPC business performance. Revenue momentum in the EPC business should sustain at least for 2 years based on the current order book.
EBITDA margin
Core EPC EBITDA margin will remain steady though it can decline if the company takes on solar EPC orders; however, revenue growth estimates will require upward revision then. Consolidated EBITDA margins take a step jump in FY17 primarily due to the wind business which has 95%+ EBITDA margins.
Working capital
Working capital turns to increase since receivables are inflated by `1.1bn on account of the Patran project which will be paid on commissioning. Moreover, the sale of the wind business could materially alter the company’s consolidated working capital cycle.
Exhibit 62: Our estimates for the consolidated entity are significantly ahead of consensus
` mn Ambit Consensus %diff Comment
Revenue FY17 14,620 13,870 5% FY18 17,712 16,685 6% Revenue growth FY17 33% 26% 680 bps It is hard to ascertain the reason for the differential but it may be
due to (1) we have considered revenues from the Patran project; (2) PLF assumption for the wind project; Our core EPC growth assumption of 27% is largely in-line with management’s guidance of 25%
FY18 21% 20% 90 bps
EBITDA FY17 3,467 2825 23% FY18 3,893 3250 20% EBITDA margin FY17 23.7% 20.4% 330 bps The margin differential mainly arises from the revenue mix from
the wind project; we have assumed flat EPC margins FY18 22.0% 19.5% 250 bps
PAT FY17 2,123 1677 27% FY18 2,509 2145 17% Source: Bloomberg, Company, Ambit Capital research
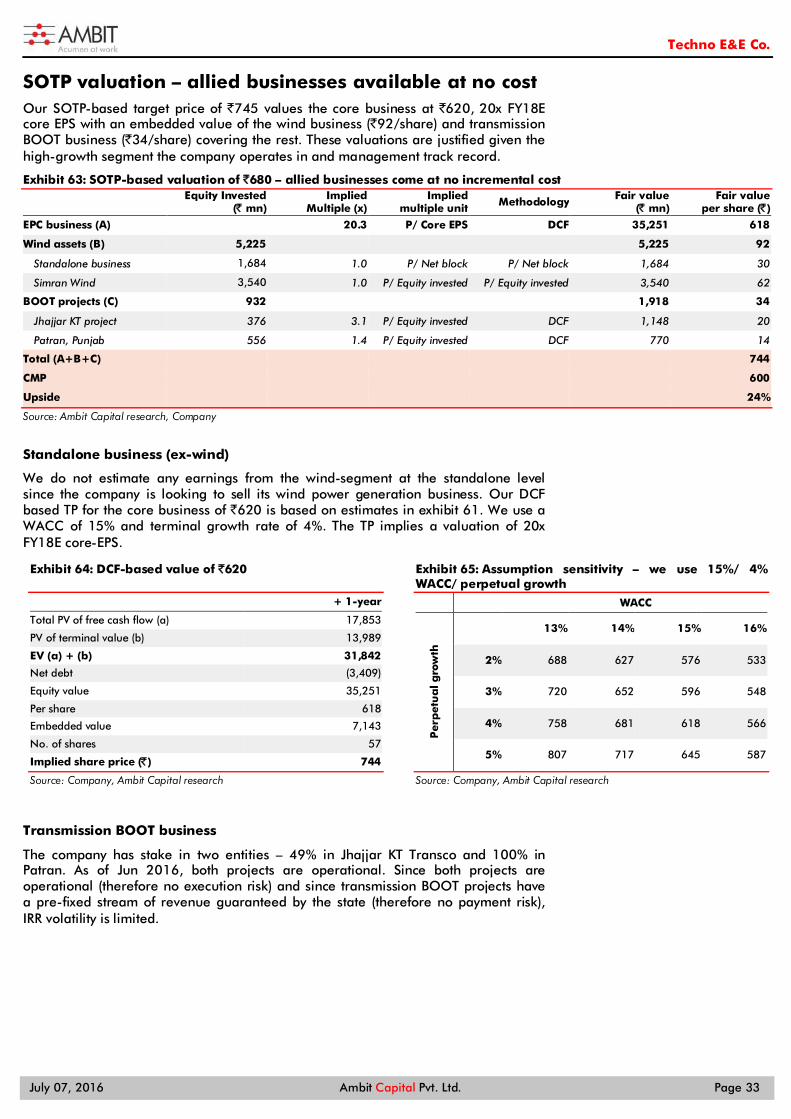
Techno E&E Co.
July 07, 2016 Ambit Capital Pvt. Ltd. Page 33
SOTP valuation – allied businesses available at no cost Our SOTP-based target price of `745 values the core business at `620, 20x FY18E core EPS with an embedded value of the wind business (`92/share) and transmission BOOT business (`34/share) covering the rest. These valuations are justified given the high-growth segment the company operates in and management track record.
Exhibit 63: SOTP-based valuation of ̀ 680 – allied businesses come at no incremental cost
Equity Invested (̀ mn)
Implied Multiple (x)
Implied multiple unit Methodology Fair value
(̀ mn) Fair value
per share (̀ )
EPC business (A) 20.3 P/ Core EPS DCF 35,251 618
Wind assets (B) 5,225 5,225 92
Standalone business 1,684 1.0 P/ Net block P/ Net block 1,684 30
Simran Wind 3,540 1.0 P/ Equity invested P/ Equity invested 3,540 62
BOOT projects (C) 932 1,918 34
Jhajjar KT project 376 3.1 P/ Equity invested DCF 1,148 20
Patran, Punjab 556 1.4 P/ Equity invested DCF 770 14
Total (A+B+C) 744
CMP 600
Upside 24%
Source: Ambit Capital research, Company
Standalone business (ex-wind)
We do not estimate any earnings from the wind-segment at the standalone level since the company is looking to sell its wind power generation business. Our DCF based TP for the core business of `620 is based on estimates in exhibit 61. We use a WACC of 15% and terminal growth rate of 4%. The TP implies a valuation of 20x FY18E core-EPS.
Exhibit 64: DCF-based value of `620 + 1-year
Total PV of free cash flow (a) 17,853
PV of terminal value (b) 13,989
EV (a) + (b) 31,842
Net debt (3,409)
Equity value 35,251
Per share 618
Embedded value 7,143
No. of shares 57
Implied share price (̀ ) 744
Source: Company, Ambit Capital research
Exhibit 65: Assumption sensitivity – we use 15%/ 4% WACC/ perpetual growth
WACC
Per
pet
ua
l gro
wth
13% 14% 15% 16%
2% 688 627 576 533
3% 720 652 596 548
4% 758 681 618 566
5% 807 717 645 587
Source: Company, Ambit Capital research
Transmission BOOT business
The company has stake in two entities – 49% in Jhajjar KT Transco and 100% in Patran. As of Jun 2016, both projects are operational. Since both projects are operational (therefore no execution risk) and since transmission BOOT projects have a pre-fixed stream of revenue guaranteed by the state (therefore no payment risk), IRR volatility is limited.
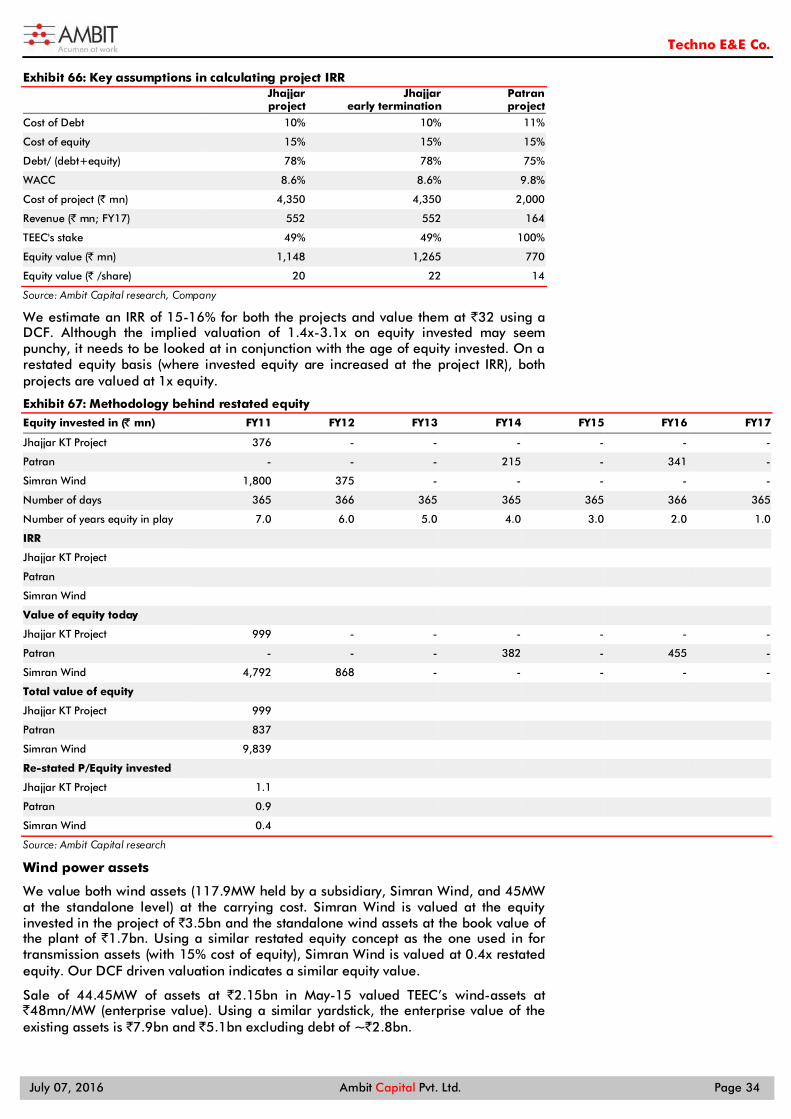
Techno E&E Co.
July 07, 2016 Ambit Capital Pvt. Ltd. Page 34
Exhibit 66: Key assumptions in calculating project IRR
Jhajjar project
Jhajjar early termination
Patran project
Cost of Debt 10% 10% 11%
Cost of equity 15% 15% 15%
Debt/ (debt+equity) 78% 78% 75%
WACC 8.6% 8.6% 9.8%
Cost of project (` mn) 4,350 4,350 2,000
Revenue (` mn; FY17) 552 552 164
TEEC's stake 49% 49% 100%
Equity value (` mn) 1,148 1,265 770
Equity value (` /share) 20 22 14
Source: Ambit Capital research, Company
We estimate an IRR of 15-16% for both the projects and value them at `32 using a DCF. Although the implied valuation of 1.4x-3.1x on equity invested may seem punchy, it needs to be looked at in conjunction with the age of equity invested. On a restated equity basis (where invested equity are increased at the project IRR), both projects are valued at 1x equity.
Exhibit 67: Methodology behind restated equity
Equity invested in (̀ mn) FY11 FY12 FY13 FY14 FY15 FY16 FY17
Jhajjar KT Project 376 - - - - - -
Patran - - - 215 - 341 -
Simran Wind 1,800 375 - - - - -
Number of days 365 366 365 365 365 366 365
Number of years equity in play 7.0 6.0 5.0 4.0 3.0 2.0 1.0
IRR Jhajjar KT Project Patran Simran Wind Value of equity today Jhajjar KT Project 999 - - - - - -
Patran - - - 382 - 455 -
Simran Wind 4,792 868 - - - - -
Total value of equity Jhajjar KT Project 999 Patran 837 Simran Wind 9,839 Re-stated P/Equity invested Jhajjar KT Project 1.1 Patran 0.9 Simran Wind 0.4 Source: Ambit Capital research
Wind power assets
We value both wind assets (117.9MW held by a subsidiary, Simran Wind, and 45MW at the standalone level) at the carrying cost. Simran Wind is valued at the equity invested in the project of `3.5bn and the standalone wind assets at the book value of the plant of `1.7bn. Using a similar restated equity concept as the one used in for transmission assets (with 15% cost of equity), Simran Wind is valued at 0.4x restated equity. Our DCF driven valuation indicates a similar equity value.
Sale of 44.45MW of assets at `2.15bn in May-15 valued TEEC’s wind-assets at `48mn/MW (enterprise value). Using a similar yardstick, the enterprise value of the existing assets is `7.9bn and `5.1bn excluding debt of ~`2.8bn.
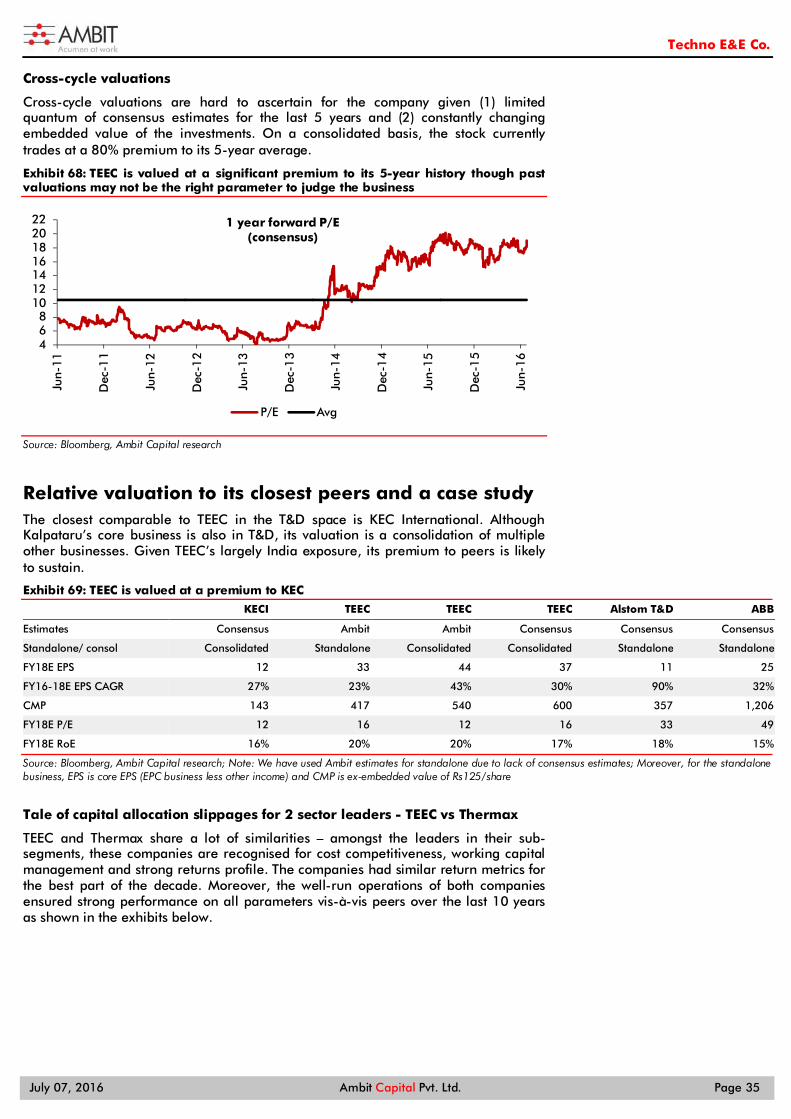
Techno E&E Co.
July 07, 2016 Ambit Capital Pvt. Ltd. Page 35
Cross-cycle valuations
Cross-cycle valuations are hard to ascertain for the company given (1) limited quantum of consensus estimates for the last 5 years and (2) constantly changing embedded value of the investments. On a consolidated basis, the stock currently trades at a 80% premium to its 5-year average.
Exhibit 68: TEEC is valued at a significant premium to its 5-year history though past valuations may not be the right parameter to judge the business
Source: Bloomberg, Ambit Capital research
Relative valuation to its closest peers and a case study The closest comparable to TEEC in the T&D space is KEC International. Although Kalpataru’s core business is also in T&D, its valuation is a consolidation of multiple other businesses. Given TEEC’s largely India exposure, its premium to peers is likely to sustain.
Exhibit 69: TEEC is valued at a premium to KEC
KECI TEEC TEEC TEEC Alstom T&D ABB
Estimates Consensus Ambit Ambit Consensus Consensus Consensus
Standalone/ consol Consolidated Standalone Consolidated Consolidated Standalone Standalone
FY18E EPS 12 33 44 37 11 25
FY16-18E EPS CAGR 27% 23% 43% 30% 90% 32%
CMP 143 417 540 600 357 1,206
FY18E P/E 12 16 12 16 33 49
FY18E RoE 16% 20% 20% 17% 18% 15%
Source: Bloomberg, Ambit Capital research; Note: We have used Ambit estimates for standalone due to lack of consensus estimates; Moreover, for the standalone business, EPS is core EPS (EPC business less other income) and CMP is ex-embedded value of Rs125/share
Tale of capital allocation slippages for 2 sector leaders - TEEC vs Thermax
TEEC and Thermax share a lot of similarities – amongst the leaders in their sub-segments, these companies are recognised for cost competitiveness, working capital management and strong returns profile. The companies had similar return metrics for the best part of the decade. Moreover, the well-run operations of both companies ensured strong performance on all parameters vis-à-vis peers over the last 10 years as shown in the exhibits below.
468
10121416182022
Jun-
11
Dec
-11
Jun-
12
Dec
-12
Jun-
13
Dec
-13
Jun-
14
Dec
-14
Jun-
15
Dec
-15
Jun-
16
1 year forward P/E(consensus)
P/E Avg
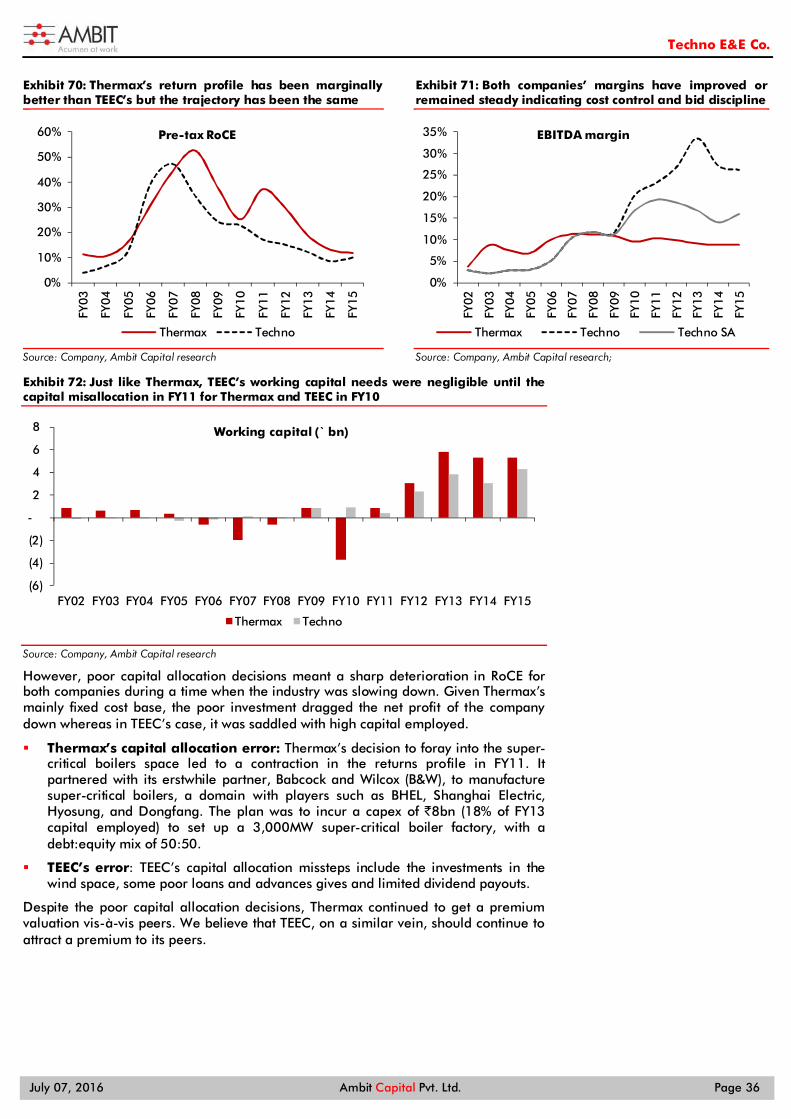
Techno E&E Co.
July 07, 2016 Ambit Capital Pvt. Ltd. Page 36
Exhibit 70: Thermax’s return profile has been marginally better than TEEC’s but the trajectory has been the same
Source: Company, Ambit Capital research
Exhibit 71: Both companies’ margins have improved or remained steady indicating cost control and bid discipline
Source: Company, Ambit Capital research;
Exhibit 72: Just like Thermax, TEEC’s working capital needs were negligible until the capital misallocation in FY11 for Thermax and TEEC in FY10
Source: Company, Ambit Capital research
However, poor capital allocation decisions meant a sharp deterioration in RoCE for both companies during a time when the industry was slowing down. Given Thermax’s mainly fixed cost base, the poor investment dragged the net profit of the company down whereas in TEEC’s case, it was saddled with high capital employed.
Thermax’s capital allocation error: Thermax’s decision to foray into the super-critical boilers space led to a contraction in the returns profile in FY11. It partnered with its erstwhile partner, Babcock and Wilcox (B&W), to manufacture super-critical boilers, a domain with players such as BHEL, Shanghai Electric, Hyosung, and Dongfang. The plan was to incur a capex of `8bn (18% of FY13 capital employed) to set up a 3,000MW super-critical boiler factory, with a debt:equity mix of 50:50.
TEEC’s error: TEEC’s capital allocation missteps include the investments in the wind space, some poor loans and advances gives and limited dividend payouts.
Despite the poor capital allocation decisions, Thermax continued to get a premium valuation vis-à-vis peers. We believe that TEEC, on a similar vein, should continue to attract a premium to its peers.
0%
10%
20%
30%
40%
50%
60%
FY03
FY04
FY05
FY06
FY07
FY08
FY09
FY10
FY11
FY12
FY13
FY14
FY15
Pre-tax RoCE
Thermax Techno
0%
5%
10%
15%
20%
25%
30%
35%
FY02
FY03
FY04
FY05
FY06
FY07
FY08
FY09
FY10
FY11
FY12
FY13
FY14
FY15
EBITDA margin
Thermax Techno Techno SA
(6)
(4)
(2)
-
2
4
6
8
FY02 FY03 FY04 FY05 FY06 FY07 FY08 FY09 FY10 FY11 FY12 FY13 FY14 FY15
Working capital (` bn)
Thermax Techno
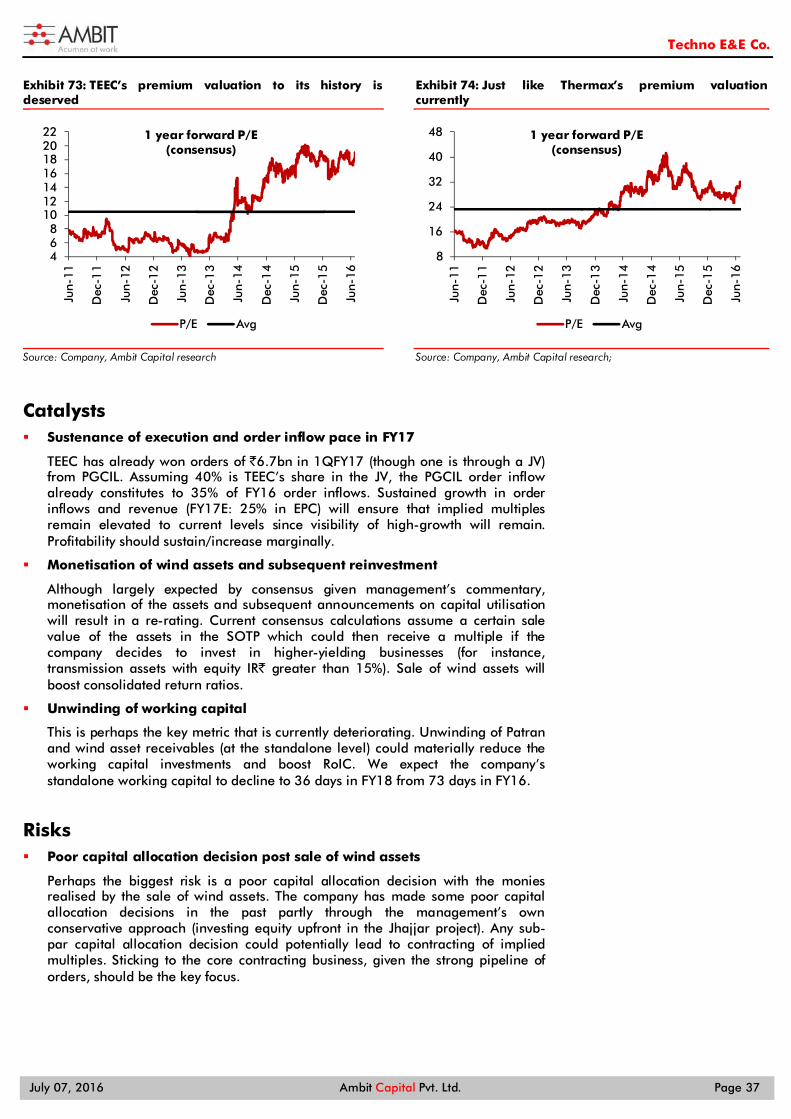
Techno E&E Co.
July 07, 2016 Ambit Capital Pvt. Ltd. Page 37
Exhibit 73: TEEC’s premium valuation to its history is deserved
Source: Company, Ambit Capital research
Exhibit 74: Just like Thermax’s premium valuation currently
Source: Company, Ambit Capital research;
Catalysts Sustenance of execution and order inflow pace in FY17
TEEC has already won orders of `6.7bn in 1QFY17 (though one is through a JV) from PGCIL. Assuming 40% is TEEC’s share in the JV, the PGCIL order inflow already constitutes to 35% of FY16 order inflows. Sustained growth in order inflows and revenue (FY17E: 25% in EPC) will ensure that implied multiples remain elevated to current levels since visibility of high-growth will remain. Profitability should sustain/increase marginally.
Monetisation of wind assets and subsequent reinvestment
Although largely expected by consensus given management’s commentary, monetisation of the assets and subsequent announcements on capital utilisation will result in a re-rating. Current consensus calculations assume a certain sale value of the assets in the SOTP which could then receive a multiple if the company decides to invest in higher-yielding businesses (for instance, transmission assets with equity IR` greater than 15%). Sale of wind assets will boost consolidated return ratios.
Unwinding of working capital
This is perhaps the key metric that is currently deteriorating. Unwinding of Patran and wind asset receivables (at the standalone level) could materially reduce the working capital investments and boost RoIC. We expect the company’s standalone working capital to decline to 36 days in FY18 from 73 days in FY16.
Risks Poor capital allocation decision post sale of wind assets
Perhaps the biggest risk is a poor capital allocation decision with the monies realised by the sale of wind assets. The company has made some poor capital allocation decisions in the past partly through the management’s own conservative approach (investing equity upfront in the Jhajjar project). Any sub-par capital allocation decision could potentially lead to contracting of implied multiples. Sticking to the core contracting business, given the strong pipeline of orders, should be the key focus.
468
10121416182022
Jun-
11
Dec
-11
Jun-
12
Dec
-12
Jun-
13
Dec
-13
Jun-
14
Dec
-14
Jun-
15
Dec
-15
Jun-
16
1 year forward P/E(consensus)
P/E Avg
8
16
24
32
40
48
Jun-
11
Dec
-11
Jun-
12
Dec
-12
Jun-
13
Dec
-13
Jun-
14
Dec
-14
Jun-
15
Dec
-15
Jun-
16
1 year forward P/E(consensus)
P/E Avg
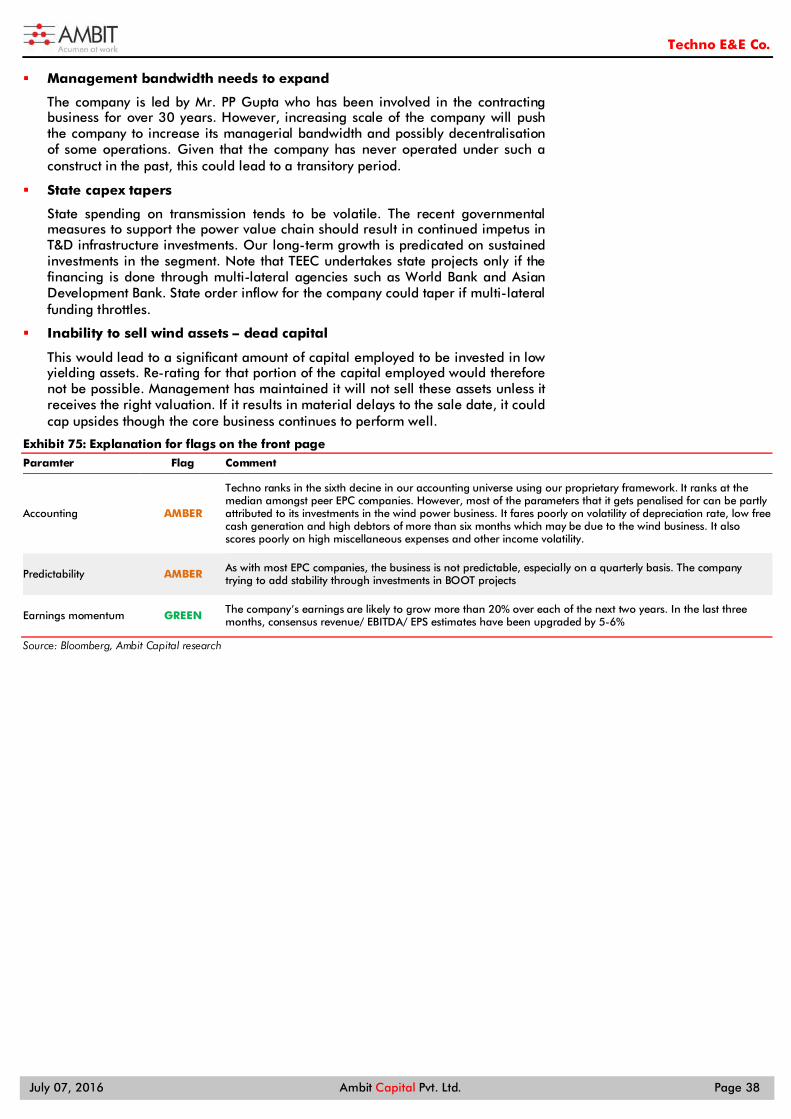
Techno E&E Co.
July 07, 2016 Ambit Capital Pvt. Ltd. Page 38
Management bandwidth needs to expand
The company is led by Mr. PP Gupta who has been involved in the contracting business for over 30 years. However, increasing scale of the company will push the company to increase its managerial bandwidth and possibly decentralisation of some operations. Given that the company has never operated under such a construct in the past, this could lead to a transitory period.
State capex tapers
State spending on transmission tends to be volatile. The recent governmental measures to support the power value chain should result in continued impetus in T&D infrastructure investments. Our long-term growth is predicated on sustained investments in the segment. Note that TEEC undertakes state projects only if the financing is done through multi-lateral agencies such as World Bank and Asian Development Bank. State order inflow for the company could taper if multi-lateral funding throttles.
Inability to sell wind assets – dead capital
This would lead to a significant amount of capital employed to be invested in low yielding assets. Re-rating for that portion of the capital employed would therefore not be possible. Management has maintained it will not sell these assets unless it receives the right valuation. If it results in material delays to the sale date, it could cap upsides though the core business continues to perform well.
Exhibit 75: Explanation for flags on the front page
Paramter Flag Comment
Accounting AMBER
Techno ranks in the sixth decine in our accounting universe using our proprietary framework. It ranks at the median amongst peer EPC companies. However, most of the parameters that it gets penalised for can be partly attributed to its investments in the wind power business. It fares poorly on volatility of depreciation rate, low free cash generation and high debtors of more than six months which may be due to the wind business. It also scores poorly on high miscellaneous expenses and other income volatility.
Predictability AMBER As with most EPC companies, the business is not predictable, especially on a quarterly basis. The company trying to add stability through investments in BOOT projects
Earnings momentum GREEN The company’s earnings are likely to grow more than 20% over each of the next two years. In the last three months, consensus revenue/ EBITDA/ EPS estimates have been upgraded by 5-6%
Source: Bloomberg, Ambit Capital research
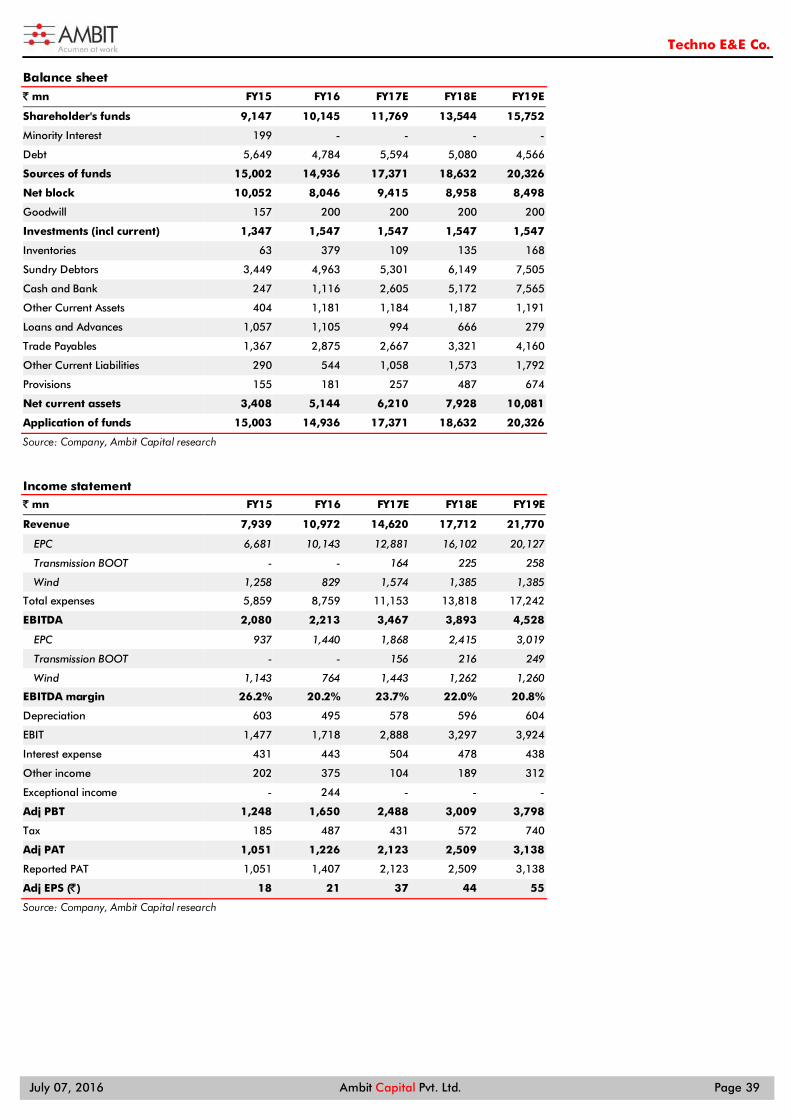
Techno E&E Co.
July 07, 2016 Ambit Capital Pvt. Ltd. Page 39
Balance sheet
` mn FY15 FY16 FY17E FY18E FY19E
Shareholder's funds 9,147 10,145 11,769 13,544 15,752
Minority Interest 199 - - - -
Debt 5,649 4,784 5,594 5,080 4,566
Sources of funds 15,002 14,936 17,371 18,632 20,326
Net block 10,052 8,046 9,415 8,958 8,498
Goodwill 157 200 200 200 200
Investments (incl current) 1,347 1,547 1,547 1,547 1,547
Inventories 63 379 109 135 168
Sundry Debtors 3,449 4,963 5,301 6,149 7,505
Cash and Bank 247 1,116 2,605 5,172 7,565
Other Current Assets 404 1,181 1,184 1,187 1,191
Loans and Advances 1,057 1,105 994 666 279
Trade Payables 1,367 2,875 2,667 3,321 4,160
Other Current Liabilities 290 544 1,058 1,573 1,792
Provisions 155 181 257 487 674
Net current assets 3,408 5,144 6,210 7,928 10,081
Application of funds 15,003 14,936 17,371 18,632 20,326
Source: Company, Ambit Capital research
Income statement ` mn FY15 FY16 FY17E FY18E FY19E
Revenue 7,939 10,972 14,620 17,712 21,770
EPC 6,681 10,143 12,881 16,102 20,127
Transmission BOOT - - 164 225 258
Wind 1,258 829 1,574 1,385 1,385
Total expenses 5,859 8,759 11,153 13,818 17,242
EBITDA 2,080 2,213 3,467 3,893 4,528
EPC 937 1,440 1,868 2,415 3,019
Transmission BOOT - - 156 216 249
Wind 1,143 764 1,443 1,262 1,260
EBITDA margin 26.2% 20.2% 23.7% 22.0% 20.8%
Depreciation 603 495 578 596 604
EBIT 1,477 1,718 2,888 3,297 3,924
Interest expense 431 443 504 478 438
Other income 202 375 104 189 312
Exceptional income - 244 - - -
Adj PBT 1,248 1,650 2,488 3,009 3,798
Tax 185 487 431 572 740
Adj PAT 1,051 1,226 2,123 2,509 3,138
Reported PAT 1,051 1,407 2,123 2,509 3,138
Adj EPS (̀ ) 18 21 37 44 55
Source: Company, Ambit Capital research
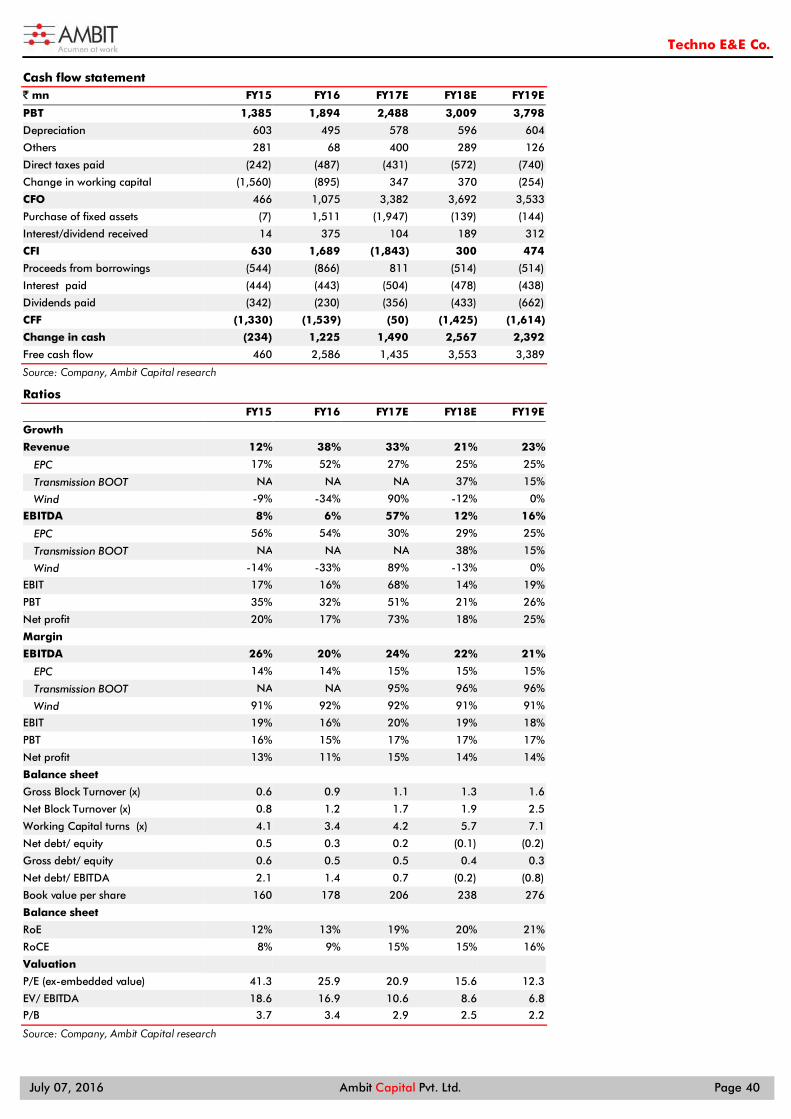
Techno E&E Co.
July 07, 2016 Ambit Capital Pvt. Ltd. Page 40
Cash flow statement ` mn FY15 FY16 FY17E FY18E FY19E
PBT 1,385 1,894 2,488 3,009 3,798
Depreciation 603 495 578 596 604
Others 281 68 400 289 126
Direct taxes paid (242) (487) (431) (572) (740)
Change in working capital (1,560) (895) 347 370 (254)
CFO 466 1,075 3,382 3,692 3,533
Purchase of fixed assets (7) 1,511 (1,947) (139) (144)
Interest/dividend received 14 375 104 189 312
CFI 630 1,689 (1,843) 300 474
Proceeds from borrowings (544) (866) 811 (514) (514)
Interest paid (444) (443) (504) (478) (438)
Dividends paid (342) (230) (356) (433) (662)
CFF (1,330) (1,539) (50) (1,425) (1,614)
Change in cash (234) 1,225 1,490 2,567 2,392
Free cash flow 460 2,586 1,435 3,553 3,389
Source: Company, Ambit Capital research
Ratios FY15 FY16 FY17E FY18E FY19E
Growth
Revenue 12% 38% 33% 21% 23%
EPC 17% 52% 27% 25% 25%
Transmission BOOT NA NA NA 37% 15%
Wind -9% -34% 90% -12% 0%
EBITDA 8% 6% 57% 12% 16%
EPC 56% 54% 30% 29% 25%
Transmission BOOT NA NA NA 38% 15%
Wind -14% -33% 89% -13% 0%
EBIT 17% 16% 68% 14% 19%
PBT 35% 32% 51% 21% 26%
Net profit 20% 17% 73% 18% 25%
Margin EBITDA 26% 20% 24% 22% 21%
EPC 14% 14% 15% 15% 15%
Transmission BOOT NA NA 95% 96% 96%
Wind 91% 92% 92% 91% 91%
EBIT 19% 16% 20% 19% 18%
PBT 16% 15% 17% 17% 17%
Net profit 13% 11% 15% 14% 14%
Balance sheet Gross Block Turnover (x) 0.6 0.9 1.1 1.3 1.6
Net Block Turnover (x) 0.8 1.2 1.7 1.9 2.5
Working Capital turns (x) 4.1 3.4 4.2 5.7 7.1
Net debt/ equity 0.5 0.3 0.2 (0.1) (0.2)
Gross debt/ equity 0.6 0.5 0.5 0.4 0.3
Net debt/ EBITDA 2.1 1.4 0.7 (0.2) (0.8)
Book value per share 160 178 206 238 276
Balance sheet RoE 12% 13% 19% 20% 21%
RoCE 8% 9% 15% 15% 16%
Valuation P/E (ex-embedded value) 41.3 25.9 20.9 15.6 12.3
EV/ EBITDA 18.6 16.9 10.6 8.6 6.8
P/B 3.7 3.4 2.9 2.5 2.2
Source: Company, Ambit Capital research
Techno E&E Co.
July 07, 2016 Ambit Capital Pvt. Ltd. Page 41
Institutional Equities Team Saurabh Mukherjea, CFA CEO, Institutional Equities (022) 30433174 [email protected]
Research Analysts
Name Industry Sectors Desk-Phone E-mail
Nitin Bhasin - Head of Research E&C / Infra / Cement / Industrials (022) 30433241 [email protected]
Aadesh Mehta, CFA Banking / Financial Services (022) 30433239 [email protected]
Aakash Adukia Oil & Gas / Chemicals / Agri Inputs (022) 30433273 [email protected]
Abhishek Ranganathan, CFA Retail (022) 30433085 [email protected]
Achint Bhagat, CFA Cement / Home Building (022) 30433178 [email protected]
Anuj Bansal Mid-caps (022) 30433122 [email protected] Ashvin Shetty, CFA Automobile (022) 30433285 [email protected]
Bhargav Buddhadev Power Utilities / Capital Goods (022) 30433252 [email protected]
Deepesh Agarwal, CFA Power Utilities / Capital Goods (022) 30433275 [email protected] Dhiraj Mistry, CFA Consumer (022) 30433264 [email protected]
Gaurav Khandelwal, CFA Automobile (022) 30433132 [email protected] Girisha Saraf Mid-caps / Small-caps (022) 30433211 [email protected]
Karan Khanna, CFA Strategy (022) 30433251 [email protected]
Kushank Poddar Technology (022) 30433203 [email protected] Pankaj Agarwal, CFA Banking / Financial Services (022) 30433206 [email protected]
Paresh Dave, CFA Healthcare (022) 30433212 [email protected]
Parita Ashar, CFA Metals & Mining / Aviation (022) 30433223 [email protected]
Prashant Mittal, CFA Strategy / Derivatives (022) 30433218 [email protected]
Rahil Shah Banking / Financial Services (022) 30433217 [email protected]
Rakshit Ranjan, CFA Consumer (022) 30433201 [email protected]
Ravi Singh Banking / Financial Services (022) 30433181 [email protected]
Ritesh Gupta, CFA Oil & Gas / Chemicals / Agri Inputs (022) 30433242 [email protected]
Ritesh Vaidya, CFA Consumer (022) 30433246 [email protected] Ritika Mankar Mukherjee, CFA Economy / Strategy (022) 30433175 [email protected]
Ritu Modi Automobile (022) 30433292 [email protected]
Sagar Rastogi Technology (022) 30433291 [email protected]
Sumit Shekhar Economy / Strategy (022) 30433229 [email protected]
Utsav Mehta, CFA E&C / Industrials (022) 30433209 [email protected]
Vivekanand Subbaraman, CFA Media (022) 30433261 [email protected]
Sales
Name Regions Desk-Phone E-mail
Sarojini Ramachandran - Head of Sales UK +44 (0) 20 7614 8374 [email protected]
Dharmen Shah India / Asia (022) 30433289 [email protected]
Dipti Mehta India / USA (022) 30433053 [email protected]
Hitakshi Mehra India (022) 30433204 [email protected]
Krishnan V India / Asia (022) 30433295 [email protected]
Nityam Shah, CFA USA / Europe (022) 30433259 [email protected]
Parees Purohit, CFA UK / USA (022) 30433169 [email protected]
Praveena Pattabiraman India / Asia (022) 30433268 [email protected]
Shaleen Silori India (022) 30433256 [email protected]
Singapore
Pramod Gubbi, CFA – Director Singapore +65 8606 6476 [email protected]
Shashank Abhisheik Singapore +65 6536 1935 [email protected]
USA / Canada
Ravilochan Pola - CEO Americas +1(646) 361 3107 [email protected]
Production
Sajid Merchant Production (022) 30433247 [email protected]
Sharoz G Hussain Production (022) 30433183 [email protected]
Jestin George Editor (022) 30433272 [email protected]
Nikhil Pillai Database (022) 30433265 [email protected]
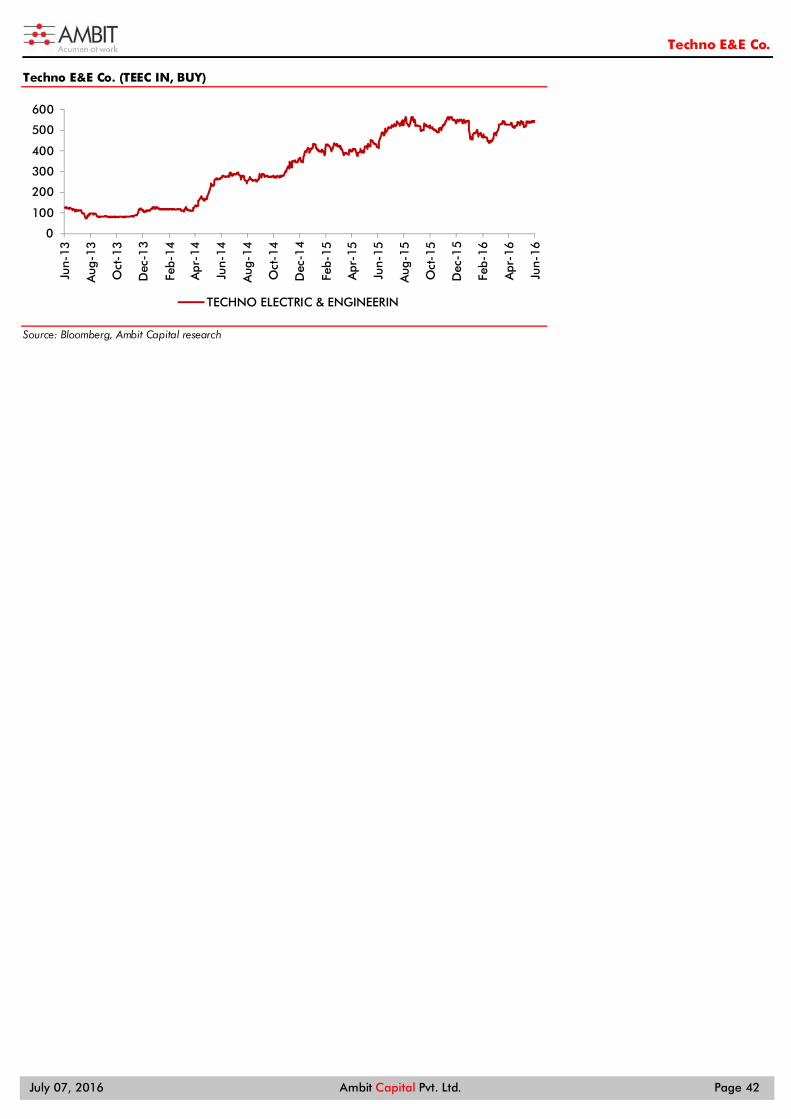
Techno E&E Co.
July 07, 2016 Ambit Capital Pvt. Ltd. Page 42
Techno E&E Co. (TEEC IN, BUY)
Source: Bloomberg, Ambit Capital research
0
100
200
300
400
500
600
Jun-
13
Aug
-13
Oct
-13
Dec
-13
Feb-
14
Apr
-14
Jun-
14
Aug
-14
Oct
-14
Dec
-14
Feb-
15
Apr
-15
Jun-
15
Aug
-15
Oct
-15
Dec
-15
Feb-
16
Apr
-16
Jun-
16
TECHNO ELECTRIC & ENGINEERIN
Techno E&E Co.
July 07, 2016 Ambit Capital Pvt. Ltd. Page 43
Explanation of Investment Rating
Investment Rating Expected return (over 12-month)
BUY >10%
SELL <10%
NO STANCE We have forward looking estimates for the stock but we refrain from assigning valuation and recommendation
UNDER REVIEW We will revisit our recommendation, valuation and estimates on the stock following recent events
NOT RATED We do not have any forward looking estimates, valuation or recommendation for the stock POSITIVE We have a positive view on the sector and most of stocks under our coverage in the sector are BUYs
NEGATIVE We have a negative view on the sector and most of stocks under our coverage in the sector are SELLs Disclaimer This report or any portion hereof may not be reprinted, sold or redistributed without the written consent of Ambit Capital . AMBIT Capital Research is disseminated and available primarily electronically, and, in some cases,
in printed form. Additional information on recommended securities is available on request. Disclaimer 1. AMBIT Capital Private Limited (“AMBIT Capital”) and its affiliates are a full service, integrated investment banking, investment advisory and brokerage group. AMBIT Capital is a Stock Broker, Portfolio Manager and
Depository Participant regis tered with Securities and Exchange Board of India Limited (SEBI) and is regulated by SEBI 2. AMBIT Capital makes bes t endeavours to ensure that the research analyst(s ) use current, reliable, comprehensive information and obtain such information from sources which the analyst(s) believes to be reliable.
However, such information has not been independently veri fied by AMBIT Capital and/or the analys t(s ) and no representation or warranty, express or implied, is made as to the accuracy or completeness of any information obtained from third parties . The information, opinions, views expressed in this Research Report are those of the research analys t as at the date of this Research Report which are subject to change and do not represent to be an authority on the subject. AMBIT Capital may or may not subscribe to any and/ or all the views expressed herein.
3. This Research Report should be read and relied upon at the sole discretion and risk of the recipient. If you are dissatisfied with the contents of this complimentary Research Report or wi th the terms of this Disclaimer, your sole and exclusive remedy is to stop using this Research Report and AMBIT Capital or its affiliates shall not be responsible and/ or liable for any direct/consequential loss howsoever directly or indirectly, from any use of this Research Report.
4. If this Research Report is received by any client of AMBIT Capital or i ts affiliate, the relationship of AMBIT Capital/i ts affiliate with such client will continue to be governed by the terms and conditions in place between AMBIT Capital/ such affiliate and the client.
5. This Research Report is issued for information only and the 'Buy', 'Sell' , or ‘Other Recommendation’ made in this Research Report such should not be cons trued as an inves tment advice to any recipient to acquire, subscribe, purchase, sell , dispose of, retain any securities and should not be intended or treated as a substi tute for necessary review or validation or any professional advice. Recipients should consider this Research Report as only a single factor in making any investment decisions . This Research Report is not an offer to sell or the solici tation of an offer to purchase or subscribe for any investment or as an official endorsement of any investment.
6. This Research Report is being supplied to you solely for your information and may not be reproduced, redis tributed or passed on, directly or indirectly, to any other person or published, copied in whole or in part, for any purpose. Neither this Research Report nor any copy of i t may be taken or transmitted or distributed, directly or indirectly within India or into any other country including United States (to US Persons), Canada or Japan or to any resident thereof. The distribution of this Research Report in other jurisdictions may be strictly res tricted and/ or prohibited by law or contract, and persons into whose possession this Research Report comes should inform themselves about such restriction and/ or prohibition, and observe any such restrictions and/ or prohibition.
7. Ambit Capital Private Limited is regis tered as a Research Enti ty under the SEBI (Research Analysts ) Regulations, 2014. SEBI Reg.No.- INH000000313. Conflict of Interests 8. In the normal course of AMBIT Capital ’s business circumstances may arise that could result in the interests of AMBIT Capital conflicting with the interests of clients or one client’s interes ts conflicting with the interest of
another client. AMBIT Capital makes bes t efforts to ensure that conflicts are identi fied and managed and that clients ’ interes ts are protected. AMBIT Capital has policies and procedures in place to control the flow and use of non-public, price sensitive information and employees’ personal account trading. Where appropriate and reasonably achievable, AMBIT Capital segregates the activities of staff working in areas where conflicts of interest may arise. However, clients/potential clients of AMBIT Capital should be aware of these possible conflicts of interests and should make informed decisions in relation to AMBIT Capital’s services .
9. AMBIT Capital and/or its affiliates may from time to time have or solicit inves tment banking, investment advisory and other business relationships with companies covered in this Research Report and may receive compensation for the same.
Additional Disclaimer for U.S. Persons 10. The research report is solely a product of AMBIT Capital 11. AMBIT Capital is the employer of the research analyst(s) who has prepared the research report 12. Any subsequent transactions in securities discussed in the research reports should be effected through Enclave Capital LLC. (“Enclave”). 13. Enclave does not accept or receive any compensation of any kind for the dissemination of the AMBIT Capital research reports . 14. The research analyst(s) preparing the email / Research Report/ attachment is resident outside the United States and is/are not associated persons of any U.S. regulated broker-dealer and that therefore the analyst(s )
is/are not subject to supervision by a U.S. broker-dealer, and is/are not required to satisfy the regulatory licensing requirements of FINRA or required to otherwise comply with U.S. rules or regulations regarding, among other things, communications with a subject company, public appearances and trading securi ties held by a research analyst account.
15. This report is prepared, approved, published and distributed by the Ambit Capital located outside of the United States (a non-US Group Company”). This report is dis tributed in the U.S.by Enclave Capital LLC, a U.S. regis tered broker dealer, on behalf of Ambit Capital only to major U.S. ins titutional investors (as defined in Rule 15a-6 under the U.S. Securi ties Exchange Act of 1934 (the “Exchange Act”)) pursuant to the exemption in Rule 15a-6 and any transaction effected by a U.S. customer in the securities described in this report must be effected through Enclave Capital LLC (19 West 44th Street, suite 1700, New York, NY 10036). In order to receive any additional information about or to effect a transaction in any securi ty or financial ins trument mentioned herein, please contact a registered representative of Enclave Capital LLC., by phone at 646 361 3107.
16. As of the publication of this report Enclave Capital LLC, does not make a market in the subject securi ties. 17. This document does not cons titute an offer of, or an invi tation by or on behalf of Ambit Capital or its affiliates or any other company to any person, to buy or sell any securi ty. The information contained herein has
been obtained from published information and other sources, which Ambit Capital or i ts Affiliates consider to be reliable. None of Ambit Capital accepts any liability or responsibili ty whatsoever for the accuracy or completeness of any such information. All estimates, expressions of opinion and other subjective judgments contained herein are made as of the date of this document. Emerging securi ties markets may be subject to risks significantly higher than more established markets. In particular, the political and economic environment, company practices and market prices and volumes may be subject to significant variations. The ability to assess such risks may also be limited due to significantly lower information quantity and quality. By accepting this document, you agree to be bound by all the foregoing provisions.
Additional Disclaimer for Canadian Persons 18. AMBIT Capital is not registered in the Province of Ontario and /or Province of Québec to trade in securities and/or to provide advice with respect to securi ties. 19. AMBIT Capital's head office or principal place of business is located in India. 20. All or substantially all of AMBIT Capital's assets may be situated outside of Canada. 21. It may be difficult for enforcing legal rights against AMBIT Capital because of the above. 22. Name and address of AMBIT Capital's agent for service of process in the Province of Ontario is: Torys LLP, 79 Wellington St. W., 30th Floor, Box 270, TD South Tower, Toronto, Ontario M5K 1N2 Canada. 23. Name and address of AMBIT Capital's agent for service of process in the Province of Montréal is Torys Law Firm LLP, 1 Place Ville Marie, Suite 1919 Montréal, Québec H3B 2C3 Canada. Additional Disclaimer for Singapore Persons 24. This Report is prepared and distributed by Ambit Capital Private Limited and dis tributed as per the approved arrangement under Paragraph 9 of Third Schedule of Securities and Futures Act (CAP 289) and Paragraph
11 of the Firs t Schedule to the Financial Advisors Act (CAP 110) provided to Ambit Singapore Pte. Limited by Monetary Authority of Singapore. 25. This Report is only available to persons in Singapore who are insti tutional investors (as defined in section 4A of the Securi ties and Futures Act (Cap. 289) of Singapore (the “SFA”).” Accordingly, if a Singapore Person is
not or ceases to be such an ins titutional investor, such Singapore Person must immediately discontinue any use of this Report and inform Ambit Singapore Pte. Limited. Disclosures 26. The analyst (s ) has/have not served as an officer, director or employee of the subject company. 27. There is no material disciplinary action that has been taken by any regulatory authority impacting equity research analysis activities . 28. All market data included in this report are dated as at the previous s tock market closing day from the date of this report. 29. Ambit and/or its associates have financial interest/equity shareholding in Ashoka Bui ldcon, Siemens, Thermax Analyst Certif ication Each of the analysts identified in this report certi fies , with respect to the companies or securi ties that the individual analyses, that (1) the views expressed in this report reflect his or her personal views about all of the subject companies and securities and (2) no part of his or her compensation was, is or will be directly or indirectly dependent on the specific recommendations or views expressed in this report. © Copyright 2015 AMBIT Capital Private Limited. All rights reserved.
Ambit Capital Pvt. Ltd. Ambit House, 3rd Floor. 449, Senapati Bapat Marg, Lower Parel, Mumbai 400 013, India. Phone: +91-22-3043 3000 | Fax: +91-22-3043 3100 CIN: U74140MH1997PTC107598 www.ambitcapital.com