Embed Size (px)
Citation preview
Aditya Birla MoneyAditya Birla Money
Shoppers Stop Ltd …India shops here
21st October 2011
Initiating Coverage | Retail | Shoppers Stop Ltd
Analyst Details
Sunny Agrawal
022-42333458

2
Aditya Birla MoneyAditya Birla Money
Investment ArgumentsRisk Return Matrix
Shareholding (%)
Chart: SSL vs. Sensex
Shoppers Stop Ltd (SSL) is one of the pioneers in organised retail in India and has chain of multi brand departmental stores spread predominantly in Tier 1 and Tier 2 cities. The company has presence in value retailing through it chain of stores under the name of Hypercity. As of FY11, the company has posted consolidated sales of ` 23232.6 mn and PAT of ` 431.9 mn.
Retail industry - favourable demographics and rising consumption; unorganised to organised still remains a big underlying theme: Rising disposable income, younger age profile and increasing urbanisation, the share of organised retailing is likely to grow from 4-5% in 2007 to 14-18% in 2015. In value terms, the organised retail industry is likely to grow from current $26 bnin 2010 to $65-80 bn by 2015 (Source: SSL AR, McKinsey).Overall, by 2015, retail industry market size will be $450bn.
Early mover advantage: With two decades of operational history, SS is well spread across the country. The early entry benefits the company in form of best locations of stores (in terms of areas with large propensity to consume) and cheaper lease rentals in growing Indian cities. In addition, the company also benefits from strong brand visibility and reputation, which usually take longer time, so as to build the consumer confidence.
Multiple levers to enhance profitability: The company can further increase its profitability with presence of levers like: (a) savings in procurement and better terms leading to reduction in working capital cycle, (b) better absorption of fixed operating overheads as more and more stores reaches maturity, and (c ) introduction of GST will lead to saving of service tax on lease rentals and other expenses (total expected savings of 0.9-1.0% of sales).
SS to generate healthy FCF from FY13E onwards and PAT to grow at CAGR of 20.6% during FY11-FY13E period: We expect SSL to open 12 and 10 SS stores in FY12E and FY13E respectively. Overall, we expect net sales, EBITDA and PAT to grow at CAGR of 22.1%, 22.4% and 20.6% during FY11-FY13E period respectively. We expect, SS to generate FCF of ` 3960.0 mn during FY13-FY15E period and expect the company to be debt free in FY15E on a standalone basis.
Hypercity likely to breakeven at operating level in FY13E: Hypercity is relatively new baby of SS with only 3 stores out of total 9 stores (as of FY11) older than 2 years. Customers have appreciated the format and with operations getting stabilised at new stores we expect it to breakeven at EBITDA level in FY13.
Valuations: We have valued the company based on SOTP valuation. Based on DCF valuation methodology, our 1-yr fwd fair value for standalone SS comes to ` 296/share. The other businesses of SSL – Hypercity, Crossword, Timezone, etc. has been valued at `48.2/share. Our fair value for SSL comes to ` 344/share. We initiate coverage with a NEUTRAL rating on the stock.
Rating CMP Target Upside %NEUTRAL 353.9 344 (2.9)
Company DataBSE Code 532638
NSE Code SHOPERSTOP
Equity Capital (` mn) 410.8
Face Value (`) 5
Market Cap (` mn) 29079
Avg Daily Volume (Qtly) 39526
52 week H/L (`) 504/261
Holders Sep 11 Jun 11 Mar 11
Promoters 67.9 68.2 68.2
FIIs 12.9 13.2 13.2
MFs/Banks & FI’s 6.5 6.6 6.3
Public & Others 12.6 12.1 12.3
Source: NSE, BSE, Capitaline, ABML ResearchSource: ABML Research, company data
In ` mn Sales YoY(%) EBITDA YoY(%) PAT YoY(%) EPS(`) EBITDA (%) RoE(%) RoCE(%) P/E(x) EV/EBITDA
(x) P/B(x)
FY10 15,024 12.2 1,135 161.4 488 (224.8) 7.2 7.6 18.0 18.2 50.6 23.5 8.0
FY11 18,417 22.6 1,521 34.0 751 54.0 9.1 8.3 16.6 20.4 38.7 20.1 4.9
FY12E 21,205 15.1 1,654 8.7 725 (3.5) 8.8 7.8 11.5 15.6 40.1 18.9 4.4
FY13E 27,448 29.4 2,278 37.7 1,094 50.8 13.3 8.3 15.3 19.6 26.6 13.5 3.8
Initiating Coverage | Retail | Shoppers Stop Ltd (SSL)
Financial Snapshot (` mn)
HighRisk
Ret
urn
Hig
hM
ediu
mLo
w
MediumLow
70
90
110
130
150
Oct
-10
Nov
-10
Jan-
11
Feb-
11
Apr
-11
May
-11
Jul-1
1
Aug-
11
Oct
-11R
elat
ive
Per
form
ance
Shoppers Stop Ltd Return Sensex Return

3
Aditya Birla MoneyAditya Birla MoneyCompany Background – Shoppers Stop Ltd (SSL)
Source: Company, ABML Research
* JV and Speciality store data: As of 30th June 2011
SHOPPERS STOP LTD (SSL)Belongs to K.Raheja group
FY11 consolidated net sales: ` 23232.6 mnFY11 consolidated PAT: ` 431.9 mn
SS Department Store• Store name: Shoppers Stop
• No of stores as of FY11: 38
• Presence in 18 cities
• Chargeable area as of FY11 : 2.14 mn sq ft
• FY11 Net Sales: ` 17120 mn
• FY11 PAT: ` 751 mn
• Loyalty program: First Citizen (2.1 mn members)
Speciality Stores*• HomeStop - No of stores: 5
• MAC, Clinique Estee Lauder - No of stores: 35
• Mothercare - No of stores: 7
Parent company
Hypercity Ltd (51% stake)
• Store name: Hypercity
• No of stores as of FY11: 09
• Presence in 7 cities
• Chargeable area as of FY11 : 0.98 mn sq ft
• FY11 Net Sales: ` 5661 mn
• FY11 PAT: Loss of ` 880 mn
• Loyalty program: Discovery Club (0.16 mn members)
Crossword (100% stake)• Store name: Crosswords
• No of stores as of FY11: 69
• Product Offering: Books, CDs, magazine, stationery, toys and music
Nuance Group (SSL holds 50% stake)
• No of stores as of FY11: 1
• Chargeable area as of FY11 : 0.02 mn sq ft
• Product Offering: Airport Retailing
Time zone (SSL holds 45% stake)• Store name: Timezone
• No of stores as of FY11: 14
• Chargeable area as of FY11 : 0.097 mn sq ft
• Product Offering: Gaming zone
JV’s*SubsidiariesOperates

4
Aditya Birla MoneyAditya Birla MoneyBusiness Model – Store Format
Source: Company, ABML Research
Particulars Shoppers Stop Hypercity
Product Category Apparels - 58.8%Non Apparels - 41.2%
Foods and Groceries - 61%General Merchandise - 31%Apparels & Jewellery – 08%
Trading Model
Consignment 45%
Bought Out 45% Mostly bought out
Concession 10%
Format Departmental store Hypermarket
Avg store size 50000 - 55000 sq ft 75000 - 100000 sq ft
Competitors Store Central, Pantaloons, Westside, Globus More, Big Bazaar, Star Bazaar
Long term EBITDA margin 8-9% 6-7%
Long term PAT margin 4-6% ~2.0%
EBITDA breakeven period for new store ~24 months ~36 months
• SS is the departmental store with average store size in the range of 50000-55000 sq ft, with majority of the sales coming from apparels as the product category. The company opened its first SS store in 1991. The company has gradually moved from “Premium” category in 2005 to “Bridge to Luxury”category in 2009.
• Hypercity is the relatively new venture with only 3 stores (out of total 9 stores) older than 3 yrs (as of FY11). Hypercity is the hypermarket with average store size in the range of 75000-100000 sq ft with majority of the sales coming from Food and Groceries. Going forward, as the stores get matured, the contribution from Food and Groceries is likely to decline. SS holds 51% stake in Hypercity.

5
Aditya Birla MoneyAditya Birla MoneyBusiness Model – Scalability and Key Assumptions
ParticularsShoppers Stop Hypercity
FY11 FY15E FY20E FY11 FY15E FY20E
Number of stores 38 70 90 9 20 42
Avg store size (sq ft) 56391 55755 55587 109361 87462 75696
Total cumulative sq ft (mn) 2.1 3.9 5.0 1.0 1.7 3.2
Revenue (` mn) 18417 42737 72281 5661 14697 40429
Avg revenue/sq ft (`/sq ft) 8518 11370 14724 6377 8402 12717
Gross margin (%) 33.8 35.3 35.8 20.5 22.0 23.5
Rent as a % of sales 8.3 8.7 8.6 6.2 5.0 5.0
Employee cost as a % of sales 5.4 5.9 5.8 7.9 6.8 5.9
EBITDA margin (%) 8.3 8.6 9.3 -5.9 2.2 5.9
Source: Company, ABML Research
• We expect, total store count from SS to reach to 70 stores in FY15E and 90 stores in FY20E. We expect total cumulative sq ft to be at 3.9 mn sq ft and 5.0 mn sq ft in FY15E and FY20E.
• For Hypercity, we expect, total store count to reach to 20 stores in FY15E and 42 stores in FY20E. We expect total cumulative sq ft to be at 1.7 mn sq ft and 3.2 mn sq ft in FY15E and FY20E.

6
Aditya Birla MoneyAditya Birla Money
ParticularsShoppers Stop PRIL - Lifestyle Business* Trent**
FY10 FY11 FY10 FY11 FY10 FY11Sales (` mn) 15023.6 18416.5 59343.7 40974.3 5874.8 7167.1
Gross margin (%) 34.5 33.8 31.5 35.3 51.0 48.4
EBITDA margin (%) 7.6 8.3 10.0 10.6 5.8 4.6
Total sq ft (mn sq ft) 1.8 2.1 3.4 4.3 NA NA
No of stores 30 3825 – Central 32 – Central
43 5448 – Pantaloons 59 – Pantaloons
SSS (%) 4 17 14 15.6 ~1.5-2 ~11-12
Avg store size 50000-55000 sq ft 25000 sq ft for Pantaloons 20,000 sq ft for Westside
100000 sq ft for Central
* From 1st Jan 2010, the Value retail business of Pantaloons was transferred to its subsidiary FVRL. Hence, FY11 and FY10 numbers are not comparable
** Standalone numbers, thereby reflecting Westside operations. Westside is the departmental store, which focus more on private labels. Exact number for SSS no available, taken from chart from FY11 annual report
Source: Company, PRIL and Trent Annual Report, ABML Research
Peer Comparison – Operating metrics

7
Aditya Birla MoneyAditya Birla Money
Store size (sq ft) 55000
Capex/ sq ft 1500
Total capex (` mn) 82.5
Assumed Equity % 50%
Assumed Debt % 50%
Equity (` mn) 41.3
LT Debt (` mn) 41.3
Particulars
Year 1 Year 2
Year 4 Year 5 Year 10 Year 15 Year 201Q 2Q 3Q 4Q FY 1Q 2Q 3Q 4Q FY Year 3
Net Sales (` mn) 55.0 61.6 69.0 77.3 262.9 86.5 96.9 108.6 121.6 413.6 537.7 618.4 692.6 1166.5 1605.6 2148.6
Sales/sq ft (`/sq ft) 1000.0 1120.0 1254.4 1404.9 4779.3 1573.5 1762.3 1973.8 2210.7 7520.4 9776.5 11242.9 12592.1 21209.8 29191.9 39065.3
Gross Profit (` mn) 91.2 143.6 186.5 214.3 240.1 405.2 555.6 745.6
Gross profit/sq ft (`/sq ft) 1658 2610 3391 3896 4365 7367 10102 13556
GPM (%) 34.7% 34.7% 34.7% 34.7% 34.7% 34.7% 34.6% 34.7%
EBITDA (` mn) -43.0 -3.4 27.0 41.0 52.7 122.4 147.2 167.7
EBITDA/sq ft (`/sq ft) -783 -62 491 746 959 2226 2676 3050
EBITDA % -16.4 -0.8 5.0 6.6 7.6 10.5 9.2 7.8
Other Income (` mn) 0.0 0.0 0.2 0.4 0.4 11.4 36.1 63.5
Depreciation (` mn) 6.6 6.6 6.6 6.6 6.6 11.2 4.6 11.5
EBIT (` mn) -49.6 -10.0 20.6 34.8 46.5 122.6 178.6 219.7
Interest (` mn) 11.9 14.8 15.0 12.6 8.3 0.7 0.0 0.0
PBT (` mn) -61.6 -24.8 5.6 22.2 38.2 121.9 178.6 219.7
PAT (` mn) -61.6 -24.8 5.6 22.2 38.2 81.4 119.3 146.8
IRR 23.8%
Source: ABML Research
• As seen above, based on the information we gathered with various experts of retail industry, we have made an profitability sheet for single SS store. As per our calculation, the store should generate IRR of ~24%.
• Please note that, all the calculations are based on certain assumptions, hence this model cant be taken as a standard benchmark for all SS stores. The business dynamics may vary depending on store location, size and ongoing macro environment.
Business Model – SS Single Store Profitability Sheet

8
Aditya Birla MoneyAditya Birla Money
Store size (sq ft) 75000
Capex/ sq ft 1400
Total capex (` mn) 105
Assumed Equity % 50%
Assumed Debt % 50%
Equity (` mn) 52.5
LT Debt (` mn) 52.5
Particulars
Year 1 Year 2 Year 3
Year 4 Year 5 Year 10 Year 15 Year 201Q 2Q 3Q 4Q FY 1Q 2Q 3Q 4Q FY 1Q 2Q 3Q 4Q FY
Net Sales (` mn) 66 72 78 85 300 93 101 110 120 424 130 141 153 166 591 680 775 1305 1796 2403
Sales/sq ft (`/sq ft) 875 954 1040 1133 4001 1235 1346 1467 1600 5648 1735 1883 2043 2217 7878 9060 10328 17397 23944 32043
Gross Profit (` mn) 61 86 119 137 156 267 379 508
Gross profit/sq ft (`/sq ft) 808 1141 1591 1830 2086 3554 5057 6767
GPM (%) 20.2% 20.2% 20.2% 20.2% 20.2% 20.4% 21.1% 21.1%
EBITDA (` mn) -21 -2 22 31 41 88 121 150
EBITDA/sq ft (`/sq ft) -281 -28 292 409 544 1176 1609 1996
EBITDA % -7.0 -0.5 3.7 4.5 5.3 6.8 6.7 6.2
Other Income (` mn) 0.0 0.0 0.0 0.7 0.9 8.3 29.8 54.6
Depreciation (` mn) 8.4 8.4 8.4 8.4 8.4 14.3 5.9 14.6
EBIT (` mn) -29.5 -10.5 13.5 23.0 33.3 82.2 144.6 189.7
Interest (` mn) 15.3 16.7 16.2 14.6 10.9 0.0 0.0 0.0
PBT (` mn) -45 -27 -3 8 22 82 145 190
PAT (` mn) -45 -27 -3 8 22 55 97 127
IRR 18.0%
• Similarly, we have made an profitability sheet for single Hypercity store. As per our calculation, the store should generate IRR of ~18%.
Please note that, all the calculations are based on certain assumptions, hence this model cant be taken as a standard benchmark for all Hypercity stores. The business dynamics may vary depending on store location, size and ongoing macro environment.
Source: ABML Research
Business Model – Hypercity Single Store Profitability Sheet

9
Aditya Birla MoneyAditya Birla Money
SWOT AnalysisSWOT
Analysis
SWOT Analysis
Strength• Loyalty Program: Has 2 mn members (largest in country)
under “First Citizen” program which accounts for 73% of the SS sales.
• Has first mover advantage in terms of location of stores, well-established backend network and well-established brand name.
• Two decades of experience in understanding Indian consumer market with experienced management team.
• Strong bargaining power: Being well established brand name, network and scale, the company has strong bargaining power for property rentals and can clinch better commercial terms with merchandise suppliers etc.
Weakness/ Risk & Concerns• Execution: Next level of growth will mainly come from Tier-2
and Tier- 3 cities, which usually takes more time to break-even and has different operating dynamics.
• Employee: Lack of good trained manpower leads to high wage inflation and chances of poaching from competitors
• Govt policies: Recent excise duty on branded readymade garments and delay in key policies like GST
• Delay in store opening: The store opening depends on timely deliver of property by the real estate player, which is not in control of SSL.
• High rental: Increase in competition may lead to high rental going forward.
Opportunity• Humungous opportunity to tap modern retail market which
has current penetration of just 6-7% ($28 bn) and is expected to reach 14-18% ($ 65-85bn) by 2020. (Source: SSL Annual Report, Mckinsey)
• As per Mckinsey, by 2025 India will have 41% of its population in mid income segment as compared to 5% in 2005. This will lead to more aspirational buying and will be beneficial for players like SSL.
• Hypermarket: There is immense scope for hypermarket in India and going forward Hypercity can be one of the main growth engine for the company.
• The company is well positioned to capture more wallet share by diversifying into multiple formats and presence in furnishing, books, cosmetic products, kids merchandise, etc.
Threat• Increasing competitive intensity due rapid expansion from
Central (Future group), Reliance Trends (Reliance Industries), Westside (Tata group) etc.
• Presence and expansion of single brand stores by the brand owners either on their own or through franchisee
• Competition may intensify post opening of FDI in retail.
• Economic slowdown: A prolong slowdown in economy affects the discretionary consumption first.
• Delay and availability of new properties could bring down the overall IRR as new locations and volume growth is critical for a retailer

10
Aditya Birla MoneyAditya Birla MoneyKey business metrics and its implications – Shoppers Stop
Year end number of stores - SS Sales per sq ft - SS
• Topline expansion primarily depends on (a) volume growth, which in turn will be due to new store addition and growth in existing stores and (b) pricing growth, which in turn will be due to pass thru effect of inflation and pricing power in some exclusive brand.
• We expect net sales to increase by 15.1% and 29.4% to ` 21204.8 mn and ` 27447.8 mn in FY12E and FY13E respectively.
SSS - Qtrly Net Sales
Source: Bloomberg , ABML Research Source: Bloomberg , ABML Research
Source: Bloomberg , ABML Research Source: Bloomberg , ABML Research
20 24 26 3038
4844
8
10
8
224 26
30
38
48
56
0
10
20
30
40
50
60
FY08 FY09 FY10 FY11 FY12E FY13E
unit
Existing Stores New stores
Rapid store expansion in next 2 yrs will fuel volume growth
7429 7592 7955 8518 86719341
2.2
4.8
7.1
1.8
7.7
(1.7)
0
2000
4000
6000
8000
10000
FY08 FY09 FY10 FY11 FY12E FY13E
Rs/
sq ft
-3
0
3
6
9
Sales per sq ft YoY%
Volume grow th coupled w ith inf lation w ill lead to gradual increase in per sq ft revenue
2.3 2.1
16.0
21.0
13.0
22.0
7.0 7.0
(3.0) (4.0)(6.3)
14.0
7.0
(10)
(5)
0
5
10
15
20
25
1QFY
09
2QFY
09
3QFY
09
4QFY
09
1QFY
10
2QFY
10
3QFY
10
4QFY
10
1QFY
11
2QFY
11
3QFY
11
4QFY
11
1QFY
12
%
Post subprime crisis, healthy SSS growth reflects return of purchasing power and hence organic growth
1154413385
1502418417
21205
27448
0
5000
10000
15000
20000
25000
30000
FY08 FY09 FY10 FY11 FY12E FY13E
Rs
mn
0
10
20
30
40
Net sales (LHS) YoY%
… leading to superior topline growth over FY11-FY13E period
Topline Drivers - a) Volume growth and b) Value growth

11
Aditya Birla MoneyAditya Birla MoneyKey business metrics and its implications – Shoppers Stop
Trading Model - Breakup GMROF
Gross margin is the function of trading model, wherein bought out sales (this includes private labels too) has the highest margin (as the inventory is on the books of company) and consignment sales has lower margin as inventory risk is not on company’s books. The company has been able to maintain to gross margin in the range of 34-35% by gradually increasing the share of consignment sales. We expect gross margin to be 35.0% and 35.1% in FY12E and FY13E respectively. Looking at the gross margins for international peers, we believe that gross margin cant increase dramatically from hereon and in our assumption, we have taken gradual increase in gross margin and with target of 35.8% in FY20E. GMROF is also the important operating metric for the company and it has declined in 1QFY12 due to recent opening of new stores. We believe it will improve once the new stores mature.
Gross margin - Shoppers Stop FY11 gross margin - International Peers
Source: Bloomberg , ABML Research Source: Bloomberg , ABML Research
Source: Bloomberg , ABML Research Source: Bloomberg , ABML Research
Gross margin Drivers - a) Trading Model b) GMROF
60 58 56 49 45
26 27 30 39 45
0%
20%
40%
60%
80%
100%
FY07 FY08 FY09 FY10 FY11
Boughtout Consession Consignment/SOR
Strategy of gradually increasing contribution of Consignment saleshas paid of w ell in the form of stable gross margin profile.
25202735
2471 25762771
626 606
0
1000
2000
3000
FY07 FY08 FY09 FY10 FY11 1QFY11 1QFY12
Rs
-11
-6
-1
4
9
14
GMROF (LHS) YoY%
Rapid store expansionduring FY11-FY12Eperiod has lead totemporary dip inGMROF
34.7
34.3
34.5
33.8
35.0 35.1
33.0
33.5
34.0
34.5
35.0
35.5
FY08 FY09 FY10 FY11 FY12E FY13E
%
Stable gross margin profile
0 5 10 15 20 25 30 35 40 45
Macy
Big Lots
JC Penny
Target
Sears Holding
Walmart
(%)
SS gross margin hascame to the level of thatof w ell establishedinternational retail players,hence further dramaticrise from levels of 35% isnot possible

12
Aditya Birla MoneyAditya Birla MoneyKey business metrics and its implications – Shoppers Stop
Operating expenses as a % of sales EBITDA Trend
• Operating margin is the function of operating expenses. Key operating expenses are employee expense, lease rent and other operating and admin expense.
• Due to aggressive store addition in FY12E, we expect employee expense as a % of sales to increase to 6.0% and 5.9% in FY12E and FY13E respectively from 5.4% in FY11E.
• Similarly, we expect lease rent as a % of sales to increase from 8.3% in FY11 to 8.9% and 8.8% in FY12E and FY13E respectively.
• Overall, we expect EBITDA margin to decline to 7.8% in FY12E (down 50 bps YoY) and then increase by 50 bps YoY to 8.3% in FY13E.
• On international front, Macy has the highest margin at 12-13%; others average being in the range of 8-10%. For SS we have gradually increased the EBITDA margin to 9.3% by FY20E. The logic behind increase in margin is (a) more and more stores entering matured category and (b) assumption of launch of high margin exclusive brand coupled with garnering of higher wallet share of consumer by introducing additional products category and (c) benefits of GST
EBITDA margin - International Peers
Source: Bloomberg , ABML Research Source: Bloomberg , ABML Research
Source: Bloomberg , ABML Research
Operating margin Drivers - a) Fixed expenses (Rent, Employee, Other operating and admin etc
4
6
8
10
12
14
FY08 FY09 FY10 FY11 FY12E FY13E
%
Employee cost as a % of sales
Lease rent as a % of sales
Other operating and admin expenses as a % of sales
0
500
1000
1500
2000
2500
FY08 FY09 FY10 FY11 FY12E FY13E
Rs
mn
0
2
4
6
8
10
EBITDA (LHS) EBITDA margin
Operating margin is likely to decline marginally in FY12E and then expand in FY13E
0
2
4
6
8
10
12
14
Macy Big Lots JC Penny Target Sears Holding Walmart
(%)
FY11 FY12E FY13E
Avg EBITDA margin of w ell established internationalplayers is in the range of 8-10%

13
Aditya Birla MoneyAditya Birla MoneyInvestment Rationale
1. Retail industry - favourable demographics and rising consumption; unorganised to organised still remains a big underlying theme
2. Early mover advantage
3. Multiple levers to enhance profitability
– Savings in procurement and better terms leading to reduction in working capital cycle
– Better absorption of fixed operating overheads as more and more stores reaches maturity
– Introduction of Goods and Service Tax (GST)
4. SS to turn FCF positive in FY13E and PAT to grow at CAGR of 20.6% during FY11- FY13E period
5. Hypercity likely to breakeven at operating level in FY13E
6. Valuations

14
Aditya Birla MoneyAditya Birla Money
1. Retail industry - favourable demographics and rising consumption; unorganised to organised still remains a big underlying theme
A. Rising disposable income:
• India’s consumer market till now was broadly defined as a PYRAMID; a very small affluent class with an appetite for luxury and high-end goods and services at the top, a middle-class at the center and a huge economically disadvantaged class at the bottom.
• This pyramid structure of the Indian market is slowly collapsing and being replaced by a DIAMOND – a relatively large affluent class at the top, a huge middle class at the center and a small economically disadvantaged class at the lower end. The diamond represents increasing volume and value across all classes of Indian consumer market.
• As per McKinsey (refer diagram on LHS), between 2005 and 2015, sustained income growth will lift consumption among massive numbers of households, as it did in China between 2001 and 2004.
• The largest part of growth will be from Seekers (with annual household income of $ 4000-11000) with numbers of households in this segments growing from 11 mn in 2005 to 55 mn in 2015. This group will move towards organised retailing and will form a new set of customers for organised retail industry. In addition, the growth of Globals (with annual household income > $22000) will grow from 1 mn households to 3 mn households and thereby fuel demand for luxurious lifestyle products.
• As seen from the diagram, by 2015, the numbers of households in Aspirers (with annual household income of $ 2000-4000) segment will increase to 106 mn from 91 mn in 2005. This category will fuel the growth from 2015 to 2025. Aspirers and Deprived segments spent 60% of their income on food. Other basics such as housing, health, education, utilities and transport takes away another 18%. This leaves very little to spend on other categories. Hence, this category will start participating in organised retailing from 2015 onwards.
• Hence, number of households, which can be target consumer segments for organised retailing, will increase from mere 14 mn in 2005 to 64 mn in 2015. We believe change in income pattern of this new households to drive the wave of consumption in next 3-4 years.
Source: The Great Indian Bazaar by McKinsey
Potential target consumer segments
Deprived<US$ 2,000 101
91
11
2
1
74
106
55
6
3
Market for next wave of growth
14 million growing to 64 million
100% = 244100% = 206
2005E, million 2015E, million
Total householdsHousehold income bracket
AspirersUS$ 2,000-4,000
SeekersUS$ 4,000-11,000
StriversUS$ 11,000-22,000
Globals>US$ 22,000
Target Households for Organised Retail
Investment Rationale

15
Aditya Birla MoneyAditya Birla Money
B. Young Population
• According to the Mckinsey, although, rapid population growth act as a double-edge sword and will put further pressure on India’s strained infrastructure, it will give India a youthful demographic profile. India’s dependency ratio (the ratio of children and elderly to income earners) is expected to drop from 60 (in 2005) to 48 by 2025. The younger population profile of the country will fuel the demand for lifestyle products due to rising aspirations.
C. Rising Urbanisation
• Around 29% of India’s population stays in urban centers, and this is expected to increase, as more and more people migrate to larger cities in search of better career opportunities. People in urban centers tends to go out for shopping to organised retail stores, as malls act as place for entertainment too.
Dependency Ratio
ORGANISED RETAILING INDUSTRY SHARE TO GROW FROM 4-5% IN 2007 TO 14-18% IN 2015
• As per McKinsey analysis, by 2015, India is likely to be $450 bn retail market.
• Over 300 mn shoppers are likely to patronise organised retail, a 5-fold growth upto 2015, accounting for 14-18% of the total retail industry.
• Today, organised retailing in India has come far ahead with entry of large corporates like Tatas, Birla, Bharti, Reliance. Foreign players Walmart, Carrefour and Metro have also marked their presence through cash-and-carry formats. Speciality stores are being setup like Croma, Ezone etc (electronics retailing), Catwalk, Inc 5 (Footwear), Tommy, Mango (Apparel), HomeTown,WellHome (Home Décor), Tanishq,Gitanjali (Jewellery) etc.
• Overall, we can say that organised retailing is the sweet spot and those who have penetrated the market during last decade can encash on the rapid growth in consumer spending in India.
Source: McKinsey, ABML Research
72
68
60
52
48
0 10 20 30 40 50 60 70 80
1985
1995
2005E
2015E
2025E
(%)
Declining Dependency ratio
Source: McKinsey, ABML Research
Scope of organised retailing in India
By 2015, Organised retail will have a 14-18% share of total retail
Size of organised retail in India US$ billion
Share of organised retail per cent 4-5 14-18
2007 2015
7
65-80
CAGR30-35%
Investment Rationale

16
Aditya Birla MoneyAditya Birla Money
SS Store location across India
Source: Company, ABML Research
2. Early Mover Advantage
• With two decades of operational history, SS is well spread across the country. As seen from the map (on RHS), SS has presence in all the Tier-1 cities and has also established its presence in Tier 2 cities.
• The presence of stores in all parts of the country increases the brand visibility.
• The company also benefits from good location in terms of presence in areas with healthy purchasing power and presence of upwardly mobile aspirational population. Also, the company gets early mover advantage in terms of better rental deal, as initially the competition is less. SS has additional benefit in the form of its promoters background, as its promoters are well established players in real estate segment.
• The presence of stores in multiple locations and different parts of countries ensures that, there is minimum wastage and mark down on both - apparels as well as non-apparels. This is because, a product not selling successfully in one part of country can be moved to other parts, where demand for such products is high and the company can avoid piling up of inventory.
First Citizen contribution to Total Sales
61 6572 75 73 72
010
203040
5060
7080
FY07 FY08 FY09 FY10 FY11 1QFY12
(%)
Source: Company, ABML Research
• The early mover advantage also helps company to run loyalty program – “First Citizen”- successfully by offering them discount coupons (for other merchants) to attract the customers. Later on, the benefits of loyalty program itself entices customer for repeat purchase at SS. In FY11, the total sales contribution from First Citizen customer was 73%. Following chart shows, First Citizen contribution to Total Sales.
Investment Rationale

17
Aditya Birla MoneyAditya Birla Money
Inventory and Creditor Days
Source: Company, ABML Research
3. Multiple levers to enhance profitability
A. Savings in procurement and better terms leading to reduction in working capital cycle
• Over last 3-4 yrs, SS has been able to align the trading model in the favour of consignment sales, with consignment sales contributing 45% of FY11 sales as compared to 27% in FY08. This has led to decline in inventory days from 90 days in FY08 to 50 days in FY11. However, there is a peak limit to proportion of consignment sales, as consignment sales commands less margins and hence SS need to properly balance the margin on one end and consignment sales on other hand, so that the company can create profitable sustainable business model. Hence, we believe, the company will continue to focus on the current trading model and further reduction in inventory days due to incremental consignment sales is not feasible.
• However, we believe there is further scope of reducing the inventory days due to the fact that, SS has invested heavily in Information Technology and is the first retailer to implement ERP, with features like auto purchase order upon drop in predetermined minimum levels, auto replenishment, arthur planning (for forecasting), warehouse management system, perpetual inventory control system, etc. In addition, over 400 vendors are connected online. We believe all this factors brings in efficiency and operating leverage with increase in scale of business. We believe SS inventory days will reduce to 40 days in FY13E and then gradually reduce to 35 days in FY20E.
• For creditor days, as the sourcing requirement of the company increases, the company can negotiate with supply vendors for better terms of supply. We believe SS creditors days will gradually increase from 65 days in FY12E/FY13E to 70 days in FY20E.
Trading Model SS
Source: Company, ABML Research
90
71
73
4045
50
60
65 6562
71
66
30
40
50
60
70
80
90
100
FY08 FY09 FY10 FY11 FY12E FY13E
days
Inventory Days Creditor Days
60 58 56 49 45
26 27 3039 45
0%
20%
40%
60%
80%
100%
FY07 FY08 FY09 FY10 FY11
Boughtout Consession Consignment/SOR
Investment Rationale

18
Aditya Birla MoneyAditya Birla Money
Source: Bloomberg, ABML Research
B. Better absorption of fixed operating overheads as more and more stores reaches maturity
• As stated on slide no 12, we expect EBITDA margin to decline by 50 bps YoY in FY12E to 7.8%, led by increased cost pressure on apparel segment due to significant increase in cotton prices and implementation of excise duty on readymade branded garment by central govt. There was disruption in apparel supply chain, as the garment producers were stuck with strikes and demonstration, so as to convince government to roll back the excise duty.
• Although, recently cotton prices have corrected from the peak of $200/lb to $100/lb, it takes minimum 6 months for the benefits to be reflected in the tail end of the supply chain. Hence, we expect apparel prices to decline in 4QFY12 or 1QFY13. We expect EBITDA margin to improve by 50 bps YoY in FY13E to 8.3%.
• We expect EBITDA to increase by 8.7% YoY to ` 1654.0 mn in FY12E and by 37.7% YoY to ` 2278.2 mn in FY13E.
EBITDA Trend
• Due to aggressive store addition in FY12E, we expect employee expense as a % of sales to increase to 6.0% and 5.9% in FY12E and FY13E respectively from 5.4% in FY11E. Similarly, we expect lease rent as a % of sales to increase from 8.3% in FY11 to 8.9% and 8.8% in FY12E and FY13E respectively. Overall, we expect EBITDA margin to decline to 7.8% in FY12E (down 50 bps YoY) and then increase by 50 bps YoY to 8.3% in FY13E.
C. Introduction of Goods and Service Tax (GST)
• Service tax on rent has been reinstated as per the Union Budget 2010-11. The current rate of service tax is 10% (without education cess). With rent as a % of sales comes to around 8%, there is impact of ~0.8% on EBITDA margin.
• Service tax on other expenses at 0.3% of sales.
• GST will provide set-off of Service Tax against VAT.
• Hence, there is scope of margin improve to the extent of ~1.0% at EBITDA level.
• The implementation of GST from FY13 seems distant but would eventually come
0
500
1000
1500
2000
2500
FY08 FY09 FY10 FY11 FY12E FY13E
Rs
mn
0
2
4
6
8
10
EBITDA (LHS) EBITDA margin
Operating margin is likely to decline marginally in FY12E and then expand in FY13E
Investment Rationale

19
Aditya Birla MoneyAditya Birla Money
FCF Trend Total Debt
4. SS to generate healthy FCF from FY13E onwards and PAT to grow at CAGR of 20.6% during FY11-FY13E period
A. SS to generate healthy FCF from FY13E onwards and likely to be debt free in FY15E
• In FY12E, we expect SS to spend ` 1205.8 mn as a capex for new store opening, including renovation of the old stores. We expect the company to spend on an average ` 1500/sq ft as a capex for new store. We have assumed that store needs to be renovated every eight years and we have assumed the renovation cost per sq ft to be at 40% of the prevailing cost of setting up a new store. For FY13E, we have applied general inflation for the capex amount and we expect the company to spend ` 1189.0 mn as an capex. We believe the company can easily funds its capex program, as we expect company to generate operating cash flow of ` 503.2 mn and ` 1749.1 mn in FY12E and FY13E respectively. We expect the company to generate free cash flow of 3960.2 mn during FY13E-FY15E period and hence the company will start focusing on debt repayment. We expect the company to become debt free in FY15E.
Source: Company, ABML Research
PAT
B. PAT to grow at CAGR of 20.6% during FY11-FY13E period and post healthy returns ratios.
• We expect SS to post PAT CAGR of 20.6% to ` 1094.0 mn in FY13E.
• We expect the company to post RoACE of 19.6% and RoAE of 15.3% in FY13E.
177358 260
(703)
560
1,202
2,198
(1,000)
(500)
0
500
1,000
1,500
2,000
2,500
FY09 FY10 FY11 FY12E FY13E FY14E FY15E
Rs
mn
Company to turn FCF positive in FY13E and w ill improve from thereon….
Source: Company, ABML Research
Source: Company, ABML Research
2,078 1,993
1,487
2,537
2,037
837
00
500
1,000
1,500
2,000
2,500
3,000
FY09 FY10 FY11 FY12E FY13E FY14E FY15E
Rs
mn
…leading to faster repayment of debt and likely to be debt free in FY15E.
69.7
(637.2)
502.3751.8 725.2
1,094.0
(800)
(400)
0
400
800
1,200
FY08 FY09 FY10 FY11 FY12E FY13E
Rs
mn
Investment Rationale

20
Aditya Birla MoneyAditya Birla Money
5. Hypercity likely to breakeven at operating level in FY13E
Year end number of stores - Hypercity
• As of FY11, the company operates 9 stores spread across 0.98 mn sq ft and have presence in cities like Amritsar, Bhopal, Jaipur, Ludhiana, Navi Mumbai, Hyderabad, Bengalaru and Mumbai. We expect the company to open 2 and 3 stores in FY12E and FY13E respectively. We expect the company to have total 20 stores (total sq ft = 1.7 mn sq ft) at the end of FY15E and 42 stores (total sq ft = 3.2 mn sq ft) at the end of FY20E.
Source: Company, ABML Research
Department Mix% Key Driver
Food & Groceries 61% Footfall driver
General Merchandise 31% Value & Margin Driver
Apparels and Jewellery 8% Fashion, Value & Margin driver
1 1 37 9 11
2
42
23
13
79
1114
0
4
8
12
16
FY08 FY09 FY10 FY11 FY12E FY13E
unit
Existing Stores New stores
A. Hypercity likely to hit 20 stores by FY15E and 42 stores by FY20E
• Hypercity has pioneered “big box mixed retail” format in India and has redefine the shopping experience of the consumer in India, The average store size is 75000-100000 sq ft in Tier 1 cities and 50000-75000 sq ft in Tier 2 cities. Its offering include food and grocery, general merchandise and apparel. Food and grocery accounts for nearly 55% of the sales and rest in non-food category. The company owns brands like Everyday, Terzo and Fresh Basket in food category, brands like Avorio, Ebano, MaxIT in general merchandise category and brands like JooJoobs, CityLife and River Inc. in fashion category. Private label accounts for 22% of the total sales and branded accounts for 78% of the sales.
Gross margin - Hypercity
Source: Company, ABML Research
B. Gross margin to improve by 200 – 300 bps till FY20E due to change in sales mix
• As of FY11, Food: Non food business accounts for 61:39 of the total sales. Going forward, the ratio is likely to change to 40:60. Food business being 12-15% gross margin business and Non-food business being 30-40% gross margin business, we expect gross margin of Hypercity to improve from 20.5% in FY11 to 22.0% in FY13E. We expect gross margin to further expand by 150 bps to 23.5% till FY20E.
20.5 20.5
22.0 22.0
19.5
20.0
20.5
21.0
21.5
22.0
22.5
FY10 FY11 FY12E FY13E
(%)
Investment Rationale

21
Aditya Birla MoneyAditya Birla Money
C. Hypercity likely to be EBITDA positive by FY13E and PAT positive by FY16E
• We expect Hypercity to hit just breakeven levels at EBITDA level in FY13E mainly due to entering of more stores into matured category (As of FY11, out of 9 stores only 3 stores are older than 2 years) thereby leading to incremental sales on same fixed operating expenses. We expect the company to report EBITDA margin of -2.8%, 0.0% and 1.4% in FY12E, FY13E and FY14E respectively. Following table show key assumptions and financial snapshot.
• As seen in the table above, we expect Hypercity to breakeven at PAT level in FY16E. However, improvement in margins at EBITDA level at faster pace as compared to our assumption may throw positive surprise. In that case, it will be beneficial for shareholders for SS (SS holds 51% stake in Hypercity), as it will lead to re-rating of the stock. Any other step (like equity infusion through bringing in strategic investor) which may lead to reduction in cost burden can also sprung positive surprise for the shareholders of SS.
Particulars Unit FY11 FY12E FY13E FY14E FY15E FY16E FY17E
Yr end no of stores unit 9 11 14 17 20 24 28
Yr end area mn sq ft 1.0 1.1 1.4 1.6 2.0 2.3 2.3
Sales/sq ft `/sq ft 6377 6850 7292 7848 8402 9086 9925
Capex/sq ft `/sq ft 1300 1365 1433 1505 1580 1659
Renovation capex/sq ft `/sq ft 520 546 573 602 632 664
Net Sales ` mn 5661 7770 9912 12198 14697 18256 22522
EBITDA ` mn -332 -218 0 165 327 686 938
EBITDA margin % -5.9 -2.8 0.0 1.4 2.2 3.8 4.2
Other income ` mn 47 62 79 98 118 146 180
Depreciation ` mn 127 128 147 166 188 215 252
EBIT ` mn -412 -283 -67 97 257 617 866
Interest Expense ` mn 274 320 412 493 544 575 617
PBT ` mn -686 -603 -480 -396 -287 42 249
PAT ` mn -880 -796 -673 -590 -481 35 207
Financial Snapshot
Investment Rationale

22
Aditya Birla MoneyAditya Birla Money
• With nearly two decades of operational history and strong management team, we believe SS is well placed to take advantage of rapid growth in organised retail industry. The growth in organised retail industry is supported by the increase in discretionary spend in India led by higher disposable income, massive shift of people from bottom of the pyramid to mid-income category and rising aspiration of majority young population of India.
• At CMP, SS is trading at P/E multiple of 40.1x and 26.6x based on FY12E and FY13E earnings respectively.
• We believe DCF valuation is the right methodology to value the company, as the company is in rapid expansion phase till FY15E and benefits of this will accrue till FY20E.
• Hence, we have drawn the financials for SS till FY20E and used DCF valuation methodology to arrive at the fair value for SS.
• Following are the key assumptions and calculation for DCF:-
Equity Risk Premium 5.0%
Risk-free rate 8.8%
Beta 0.83
Cost of Equity 13.0%
Pre-tax cost of debt 10.5%
Tax rate 33.2%
Post-tax Cost of Debt 7.0%
Portion of Equity 61.8%
Portion of Debt 38.2%
WACC 10.7%
Discounted Value of FCF till FY20E 10,903
Discounted Terminal Value 10,810
Firm Value - PV 21,713
Add: FY11 Cash Available 26
Less: FY11 Total Debt 1,487
Equity Value 20,252
No. of Shares Outstanding (mn shares) 82.2
FY11 DCF Value per Share (`) 246
1 yr fwd DCF Fair Value Per Share (`) 296
DCF Fair Value (All figures in ` mn, except where stated)WACC
Standalone SS Outlook and Valuation
Source: Company, ABML Research
Source: Company, ABML Research
SS 1 yr fwd DCF fair value per share: As per our calculation, the standalone per share value for SS comes to ` 296/share.
Investment Rationale – Valuations

23
Aditya Birla MoneyAditya Birla Money
• With Hypercity, SSL has revolutionise the shopping experience of Indian consumers with “big-box retail format”. We believe, going forward, Hypercity will be one of the key growth drivers for SSL. Also if FDI is opened, then SSL can benefits only through Hypercity, as generally departmental stores generally don’t goes international. So, the company can generate maximum value from FDI only through Hypercity.
• Since, Hypercity has not yet breakeven on EBITDA level, we have valued the company on EV/Sales metric.
• We have assigned FY13E EV/Sales multiple of 1.0x. The calculation for per share value of Hypercity is as follow:
(All figures in ` mn, except where stated)Assumed EV/Sales multiple 1.0
FY13E EV 9911.7
Less: FY13E Gross Debt 3936.1
Add: FY13E Cash 181.4
Derived Mcap 6157.1
Shoppers Stop stake 51%
Derived Value for SS 3140.1
No of shares outstanding (mn shares) 82.2
Per share value (`) 38.2
Risk Factors
a) Delay in store openings: The store opening target depends on the timely deliver of the property where is the store is slated to open. Any delay from property developer to handover the property to SS, as per decided schedule, may postpone the sales and earnings of the company
b) Slowdown in economy: With eurozone crisis spiralling to other developed countries, if the situation goes out of control, it may impact developing countries like India in medium to long term. Then, the slowdown in economic growth coupled with consistently high inflation may lead to slowdown in discretionary spend by the consumers. In this case, the earnings of SS will be impacted directly.
c) Upside Risk to earning: With government of India allowing the textile trade with Bangladesh, cheaper apparels may come into Indian market and SS can take advantage of cheaper branded apparel for its volume growth, In this case, there can be positive surprise on earning front and in that case our target price has to be revised upward.
Hypercity Valuation
• Thus, as per our calculation, the standalone per share value for Hypercity comes to ` 38.2/share.
• The per share value of equity investment in other businesses like Crossword, Timezone and Nuance group comes to ` 10.2/share.
• Adding per share fair value of standalone SS, Hypercity and other businesses, the fair value for SSL comes to ` 344 per share.
• We initiate coverage on the company with “NEUTRAL” rating and with target price of ` 344/share.
Source: Company, ABML Research
Investment Rationale – Valuations
24
Aditya Birla MoneyAditya Birla Money
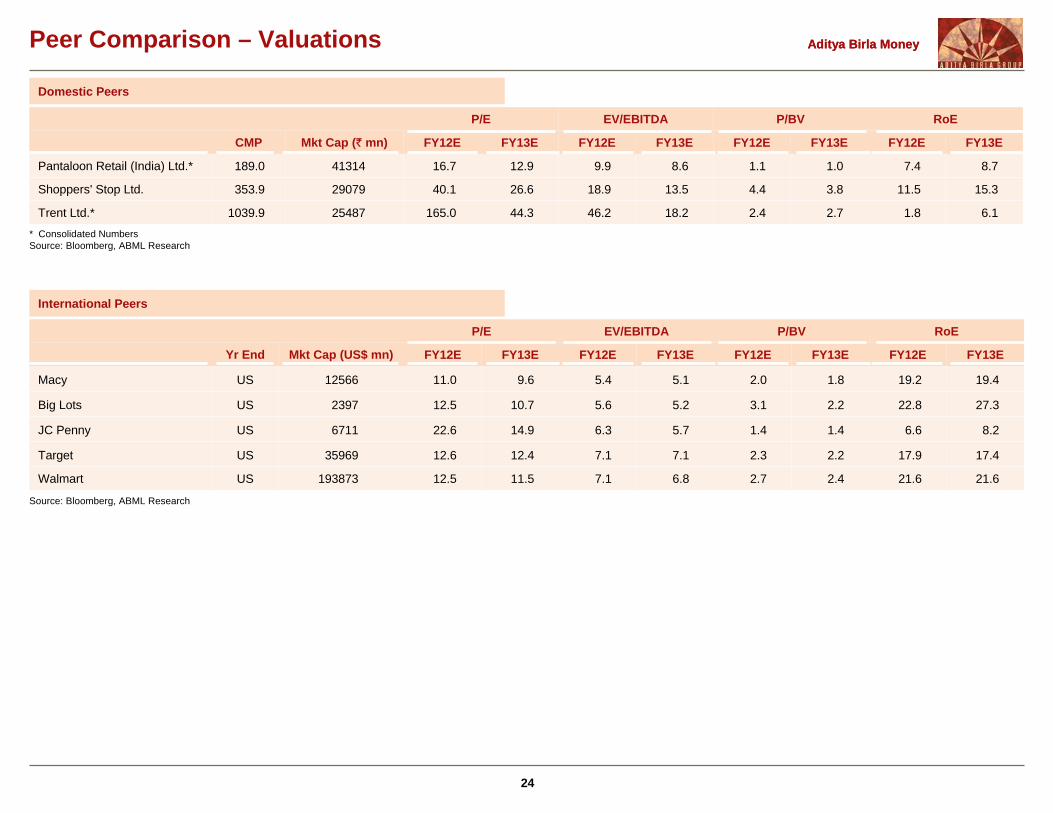
Domestic Peers
International Peers
P/E EV/EBITDA P/BV RoE
CMP Mkt Cap (` mn) FY12E FY13E FY12E FY13E FY12E FY13E FY12E FY13E
Pantaloon Retail (India) Ltd.* 189.0 41314 16.7 12.9 9.9 8.6 1.1 1.0 7.4 8.7
Shoppers' Stop Ltd. 353.9 29079 40.1 26.6 18.9 13.5 4.4 3.8 11.5 15.3
Trent Ltd.* 1039.9 25487 165.0 44.3 46.2 18.2 2.4 2.7 1.8 6.1
P/E EV/EBITDA P/BV RoE
Yr End Mkt Cap (US$ mn) FY12E FY13E FY12E FY13E FY12E FY13E FY12E FY13E
Macy US 12566 11.0 9.6 5.4 5.1 2.0 1.8 19.2 19.4
Big Lots US 2397 12.5 10.7 5.6 5.2 3.1 2.2 22.8 27.3
JC Penny US 6711 22.6 14.9 6.3 5.7 1.4 1.4 6.6 8.2
Target US 35969 12.6 12.4 7.1 7.1 2.3 2.2 17.9 17.4
Walmart US 193873 12.5 11.5 7.1 6.8 2.7 2.4 21.6 21.6
* Consolidated NumbersSource: Bloomberg, ABML Research
Source: Bloomberg, ABML Research
Peer Comparison – Valuations

25
Aditya Birla MoneyAditya Birla Money
Profit & Loss
In ` million FY09 FY10 FY11 FY12E FY13E
Net sales 13,385 15,024 18,417 21,205 27,448
YoY (%) 15.9 12.2 22.6 15.1 29.4
COGS 8800.0 9842.6 12186.7 13783.1 17813.6
Gross Profit 4,584.6 5,181.0 6,229.9 7,421.7 9,634.2
GPM (%) 34.3 34.5 33.8 35.0 35.1
Other expenses
Total expenses 4,150 4,046 4,709 5,768 7,356
Employee Cost 872 876 990 1,272 1,619
Lease rent 1,300 1,377 1,523 1,887 2,415
Other operating and admin 1,978 1,793 2,196 2,608 3,321
EBIDTA 434 1,135 1,521 1,654 2,278
YoY (%) (26.0) 161.4 34.0 8.7 37.7
EBIDTA (%) 3.2 7.6 8.3 7.8 8.3
Depreciation 631 310 310 367 448
Other income 0 38 72 10 18
EBIT (197) 862 1,283 1,297 1,848
Interest 198 224 145 211 229
Extraordinary income/(expenses) (249) 19 1 0 0
PBT (644) 657 1,138 1,086 1,619
(-) Tax (6) 154 387 361 525
Tax/ PBT (%) 1.0 23.5 34.0 33.2 32.4
PAT (637) 502 752 725 1,094
Share of Associates 0 0 0 0 0
MI 0 0 0 0 0
PAT (after MI) (637) 502 752 725 1,094
YoY (%) (1,014.6) (178.8) 49.7 (3.5) 50.8
Preference Dividend 0 0 0 0 0
Adjusted net profit (after MI) (391) 488 751 725 1,094
YoY (%) (661.2) (224.8) 54.0 (3.5) 50.8
Balance Sheet
In ` million FY09 FY10 FY11 FY12E FY13E
Equity capital 349 349 411 411 411
Reserves 1,982 2,740 5,570 6,223 7,221
Net worth 2,331 3,089 5,981 6,634 7,632
Preference capital 0 0 0 0 0
Total Debt 2,078 1,993 1,487 2,537 2,037
Deferred tax 0 (46) (33) (33) (33)
Minority Interest 0 0 0 0 0
Total liabilities 4,408 5,037 7,436 9,139 9,637
Asset Block 2,587 2,987 3,568 4,407 5,148
Investments 974 1,197 2,372 2,372 2,372
Goodwill 0 0 0 0 0
Current assets 3,509 3,550 4,496 5,640 6,348
Inventories 1,450 1,499 1,511 1,521 1,731
Debtors 113 109 160 145 178
Cash 157 30 26 311 294
Loans and advances 1,789 1,911 2,785 3,650 4,133
Other Current Assets 0 0 13 13 13
Current liabilities 2,662 2,696 3,000 3,280 4,231
Creditors 2,517 2,529 2,771 3,042 3,982
Provisions 15 79 96 105 116
Other current liabilities 130 88 133 133 133
Net current assets 847 853 1,496 2,360 2,117
Total assets 4,408 5,037 7,436 9,139 9,637
Standalone Financials – SSL
26
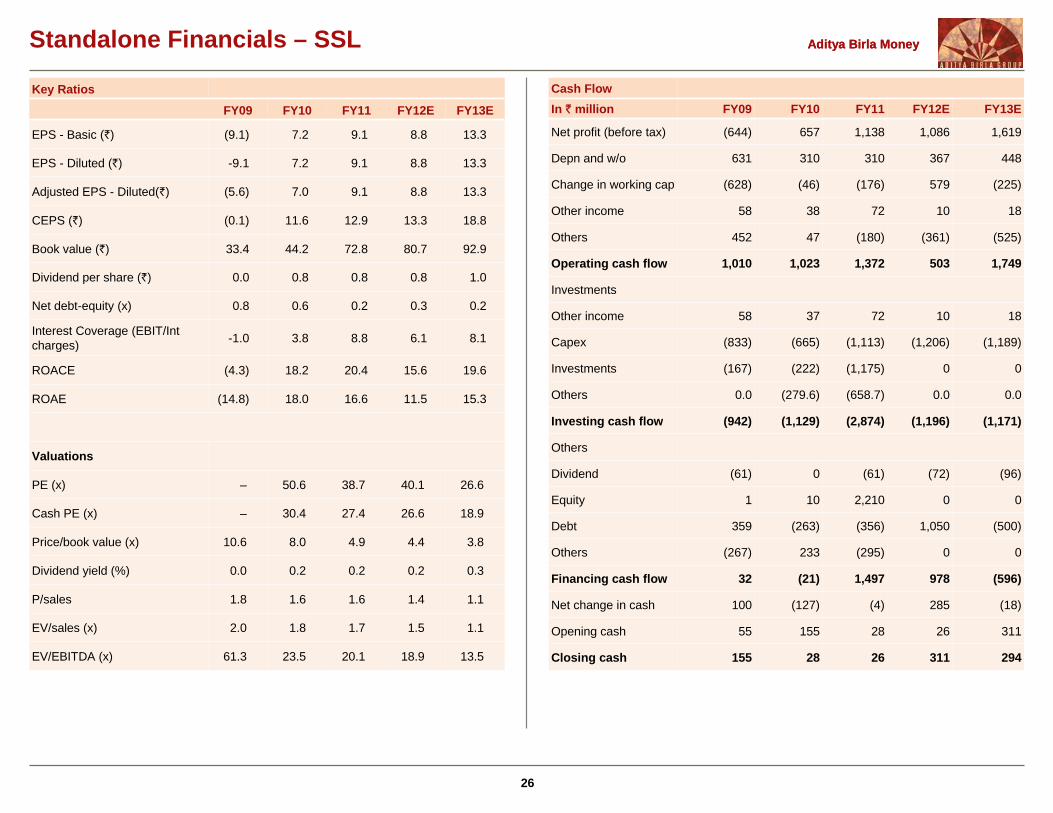
Aditya Birla MoneyAditya Birla Money
Key RatiosFY09 FY10 FY11 FY12E FY13E
EPS - Basic (`) (9.1) 7.2 9.1 8.8 13.3
EPS - Diluted (`) -9.1 7.2 9.1 8.8 13.3
Adjusted EPS - Diluted(`) (5.6) 7.0 9.1 8.8 13.3
CEPS (`) (0.1) 11.6 12.9 13.3 18.8
Book value (`) 33.4 44.2 72.8 80.7 92.9
Dividend per share (`) 0.0 0.8 0.8 0.8 1.0
Net debt-equity (x) 0.8 0.6 0.2 0.3 0.2
Interest Coverage (EBIT/Int charges) -1.0 3.8 8.8 6.1 8.1
ROACE (4.3) 18.2 20.4 15.6 19.6
ROAE (14.8) 18.0 16.6 11.5 15.3
Valuations
PE (x) – 50.6 38.7 40.1 26.6
Cash PE (x) – 30.4 27.4 26.6 18.9
Price/book value (x) 10.6 8.0 4.9 4.4 3.8
Dividend yield (%) 0.0 0.2 0.2 0.2 0.3
P/sales 1.8 1.6 1.6 1.4 1.1
EV/sales (x) 2.0 1.8 1.7 1.5 1.1
EV/EBITDA (x) 61.3 23.5 20.1 18.9 13.5
Cash FlowIn ` million FY09 FY10 FY11 FY12E FY13E
Net profit (before tax) (644) 657 1,138 1,086 1,619
Depn and w/o 631 310 310 367 448
Change in working cap (628) (46) (176) 579 (225)
Other income 58 38 72 10 18
Others 452 47 (180) (361) (525)
Operating cash flow 1,010 1,023 1,372 503 1,749
Investments
Other income 58 37 72 10 18
Capex (833) (665) (1,113) (1,206) (1,189)
Investments (167) (222) (1,175) 0 0
Others 0.0 (279.6) (658.7) 0.0 0.0
Investing cash flow (942) (1,129) (2,874) (1,196) (1,171)
Others
Dividend (61) 0 (61) (72) (96)
Equity 1 10 2,210 0 0
Debt 359 (263) (356) 1,050 (500)
Others (267) 233 (295) 0 0
Financing cash flow 32 (21) 1,497 978 (596)
Net change in cash 100 (127) (4) 285 (18)
Opening cash 55 155 28 26 311
Closing cash 155 28 26 311 294
Standalone Financials – SSL

27
Aditya Birla MoneyAditya Birla Money
Research TeamVivek Mahajan
Head of Research
022-42333522
Fundamental TeamAvinash Nahata Head of Fundamental Desk 022-42333459 [email protected] Jain Metals & Mining 022-42333540 [email protected] Agrawal FMCG/Cement 022-42333458 [email protected] Jatia Banking & Finance 022-42333460 [email protected] Mehta Construction/Real Estate 022-42333544 [email protected] Kumar Information Technology/Auto 022-42333531 [email protected] Parkar Database/Production 022-42333597 [email protected]
Quantitative TeamRizwan Khan Technical and Derivative Strategist 022-42333454 [email protected] Nangrani Sr. Technical Analyst 022-42333454 [email protected]
Raghuram Pallekonda Technical Analyst 022-42333537 [email protected]
Rahul Tendolkar Derivatives Analyst 022-42333532 [email protected]
Amit Somani Derivative Analyst 022-42333532 [email protected]
Advisory SupportIndranil Dutta Advisory Desk – HNI 022-42333494 [email protected] Gardas Advisory Desk 022-42333535 [email protected] Pandey Advisory Desk 022-30442104 [email protected]
ABML research is also accessible in Bloomberg at ABMR

28
Aditya Birla MoneyAditya Birla Money
Disclaimer:
This document is not for public distribution and is meant solely for the personal information of the authorised recipient. No part of the information must be altered, transmitted, copied, distributed or reproduced in any form to any other person. Persons into whose possession this document may come are required to observe these restrictions. This document is for general information purposes only and does not constitute an investment advice or an offer to sell or solicitation of an offer to buy / sell any security and is not intended for distribution in countries where distribution of such material is subject to any licensing, registration or other legal requirements.
The information , opinion, views contained in this document are as per prevailing conditions and are of the date of appearing on this material only and are subject to change. No reliance may be placed for any purpose whatsoever on the information contained in this document or on its completeness. Neither Aditya Birla Money Limited (ABML) nor any person connected with it accepts any liability or loss arising from the use of this document. The views and opinions expressed herein by the author in the document are his own and do not reflect the views of Aditya Birla Money Limited or any of its associate or group companies. The information set out herein may be subject to updating, completion, revision, verification and amendment and such information may change materially. Past performance is no guarantee and does not indicate or guide to future performance.
Nothing in this document is intended to constitute legal, tax or investment advice, or an opinion regarding the appropriateness of any investment, or a solicitation of any type. The contents in this document are intended for general information purposes only. This document or information mentioned therefore should not form the basis of and should not be relied upon in connection with making any investment. The investment may not be suited to all the categories of investors. The recipients should therefore obtain your own professional, legal, tax and financial advice and assessment of their risk profile and financial condition before considering any decision.
Aditya Birla Money Limited, its associate and group companies, its directors, associates, employees from time to time may have various interests/ positions in any of the securities of the Company(ies) mentioned therein or be engaged in any other transactions involving such securities or otherwise in other securities of the companies / organisation mentioned in the document or may have other potential conflict of interest with respect of any recommendation and / related information and opinions.
Analyst holding in the stock: NIL
Our Rating Methodology
Stock Ratings Buy Accumulate Neutral Reduce Sell
Absolute Returns (R) R > 15% 5% < R ≤ 15% -5% < R ≤ 5% -10% < R ≤ 5% R ≤ -10%