Embed Size (px)
Citation preview

Initial testing and a laboratory manual for the Micromeritics Gemini VI physisorption system
Laboratory Operations Programme
Internal Report IR/08/086
Isotherm Linear Plot
Relative Pressure (p/p°)0.000.00 0.05 0.10 0.15 0.20 0.25 0.30 0.35 0.40 0.45 0.50 0.55 0.60 0.65 0.70 0.75 0.80 0.85 0.90 0.95
Qua
ntity
Ads
orbe
d (m
mol
/g)
0.00.0
0.2
0.4
0.6
0.8 MPLN405 - Adsorption


BRITISH GEOLOGICAL SURVEY
LABORATORY OPERATIONS PROGRAMME
INTERNAL REPORT IR/08/086
Initial testing and a laboratory manual for the Micromeritics Gemini VI physisorption system
S J Kemp, G Turner and D Wagner
The National Grid and other Ordnance Survey data are used with the permission of the Controller of Her Majesty’s Stationery Office. Licence No: 100017897/ 2009.
Keywords Surface area, nitrogen/BET, micropore, clays, black carbon.
Front cover Micromeritics Gemini VI physisorption system
Bibliographical reference
KEMP, S.J., TURNER, G. AND WAGNER, D. 2009. Initial testing and a laboratory manual for the Micromeritics Gemini VI physisorption system . British Geological Survey Internal Report, IR/08/086. 41pp. Copyright in materials derived from the British Geological Survey’s work is owned by the Natural Environment Research Council (NERC) and/or the authority that commissioned the work. You may not copy or adapt this publication without first obtaining permission. Contact the BGS Intellectual Property Rights Section, British Geological Survey, Keyworth, e-mail [email protected]. You may quote extracts of a reasonable length without prior permission, provided a full acknowledgement is given of the source of the extract. Maps and diagrams in this book use topography based on Ordnance Survey mapping.
© NERC 2009. All rights reserved
Keyworth, Nottingham British Geological Survey 2009

The full range of our publications is available from BGS shops at Nottingham, Edinburgh, London and Cardiff (Welsh publications only) see contact details below or shop online at www.geologyshop.com
The London Information Office also maintains a reference collection of BGS publications, including maps, for consultation.
We publish an annual catalogue of our maps and other publications; this catalogue is available online or from any of the BGS shops.
The British Geological Survey carries out the geological survey of Great Britain and Northern Ireland (the latter as an agency service for the government of Northern Ireland), and of the surrounding continental shelf, as well as basic research projects. It also undertakes programmes of technical aid in geology in developing countries.
The British Geological Survey is a component body of the Natural Environment Research Council.
British Geological Survey offices BGS Central Enquiries Desk Tel 0115 936 3143 Fax 0115 936 3276 email [email protected] Kingsley Dunham Centre, Keyworth, Nottingham NG12 5GG Tel 0115 936 3241 Fax 0115 936 3488 email [email protected]
Murchison House, West Mains Road, Edinburgh EH9 3LA
Tel 0131 667 1000 Fax 0131 668 2683 email [email protected]
Natural History Museum, Cromwell Road, London SW7 5BD Tel 020 7589 4090 Fax 020 7584 8270 Tel 020 7942 5344/45 email [email protected]
Columbus House, Greenmeadow Springs, Tongwynlais, Cardiff CF15 7NE Tel 029 2052 1962 Fax 029 2052 1963
Forde House, Park Five Business Centre, Harrier Way, Sowton EX2 7HU Tel 01392 445271 Fax 01392 445371
Maclean Building, Crowmarsh Gifford, Wallingford OX10 8BB Tel 01491 838800 Fax 01491 692345
Geological Survey of Northern Ireland, Colby House, Stranmillis Court, Belfast BT9 5BF Tel 028 9038 8462 Fax 028 9038 8461
www.bgs.ac.uk/gsni/
Parent Body
Natural Environment Research Council, Polaris House, North Star Avenue, Swindon SN2 1EU Tel 01793 411500 Fax 01793 411501 www.nerc.ac.uk
Website www.bgs.ac.uk Shop online at www.geologyshop.com
BRITISH GEOLOGICAL SURVEY

IR/08/086; Version 2 Last modified: 2009/04/17 16:33
Foreword This report is the published product of a study by the British Geological Survey (BGS) and was produced under the Laboratory Operations Programme’s Maintenance and Development of Capability (MaDCap) project.
This report aims to provide a procedural manual for the newly acquired physisorption system and details of initial testing on a range of Earth Science materials including soils, mudstones and starting materials from hydrothermal experiments.
i

IR/08/086; Version 2 Last modified: 2009/04/17 16:33
Contents
Foreword i
Contents ii
Summary iv
1 Introduction 1
2 Background 2 2.1 Gemini VI 2385C System 2 2.2 VacPrep Degasser 4
3 Methods and materials 5
4 Results 7 4.1 Soil samples 7 4.2 Hydrothermal laboratory experimental materials 8 4.3 Mudstone core samples 10
5 Conclusions 12
6 Recommendations 12
References 13
Appendix 1 BGS methodology 14
Appendix 2 BET sample sheet with example data 21
Appendix 3 Example multi-point BET report (3 pages) 22
Appendix 4 Example full isotherm and pore volume distribution report (9 pages) 25
FIGURES
Figure 1. Micromeritics Gemini VI series physisorption system (Micromeritics, 2008) 3
Figure 2. Schematic for the Gemini VI (Micromeritics, 2008) 3
Figure 3. Micromeritics VacPrep system (Micromeritics, 2008) 5
Figure 4. Cross-plot of multi-point and single-point BET data for the hydrothermal laboratory experimental samples 9
ii

IR/08/086; Version 2 Last modified: 2009/04/17 16:33
TABLES
Table 1. Sample details 5
Table 2. Summary of results for soil samples 7
Table 3. Summary of results for the hydrothermal laboratory experimental samples 8
Table 4. Comparison of multi-point and single-point BET data hydrothermal laboratory experimental samples 9
Table 5. Summary of results for the mudstone samples associated with containment projects (all are 1-2 mm fractions except where indicated) 10
iii

IR/08/086; Version 2 Last modified: 2009/04/17 16:33
iv
Summary This report describes initial testing of the newly acquired Micromeritics Gemini VI physisorption system as part of the Laboratory Operations Programme’s Maintenance and Development of Capability (MaDCap) project.
The report firstly introduces the technique of surface area analysis and BGS’s capabilities and then proceeds to present a user manual and suggested working methodologies for the new system.
The report also presents data produced from a range of sample types including soils, mudstones and experimental starting materials to demonstrate the capabilities of the system to various BGS project leaders. Reliable data were generated in all cases, although very low surface areas close to the system’s lowest detection limit (c.0.05 m2/g) appear to be slightly less reliable.
Multi-point BET analyses provide more accurate but slightly larger surface areas than those derived from single-point measurements for the same sample.
On the basis of the samples tested here, sample heterogeneity would not appear to be a significant problem for ‘routine’ samples. However, analysis of ground material from the same samples revealed a wider spread of results. Sample heterogeneity may also be a greater problem when analysing very low surface area materials.
For surface areas in the range 0.1-60 m2/g, errors appear to be better than ±2% (of the value) which concurs with data for the supplied carbon black Surface Area Reference Material. For lower surface areas (<0.1 m2/g) these errors can increase to ±6%.
Analysis of soils suggests that the technique may be useful in characterising black carbon contents. Interestingly, the surface area for the ground materials appears lower than that produced for the corresponding <2 mm size fraction. This is the reverse of the expected result and requires further investigation.
For mudstone samples, surface areas appear to correspond to the total concentration of clay minerals present with some influence from the presence of smectite. Surprisingly, the lowest surface area in this suite of mudstone samples was produced by the Bentonite (?Sweden) sample. This may relate to the degassing regime employed.
Users are advised to follow the protocols outlined in this report and the analysis programs setup. It is also advised that filler rods are used to reduce free-space and error for low surface area materials (<50 m2/g).
Further work, beyond the scope of this initial study, is required to identify the effects of different degassing routines and the differing surface areas obtained when analysing ground and crushed samples. Additional work is also necessary to more fully explore the pore size distribution functions of the physisorption system.

IR/08/086; Version 2 Last modified: 2009/04/17 16:33
1 Introduction Surface area and porosity are two critical physical properties that determine the nature and reactivity of materials. In the Earth Sciences, surface area and porosity are important parameters when considering the characteristics of rocks and soils particularly with regard to their engineering properties, industrial mineral use, water/hydrocarbon potential, gas storage and possible effects on soil quality and human health.
Two different procedures are employed to determine surface area in Earth Science materials which utilize the adsorption of either gases or polar liquids.
The most common method is to derive the amount of adsorbed nitrogen (or other inert gas) on a solid surface at monolayer coverage from either a single-point analysis or a multipoint plot of adsorption isotherm data using the nitrogen/BET method, named after its inventors Brunauer, Emmett and Teller (Brunauer et al., 1938). From a knowledge of the projected cross-sectional area per molecule in the monolayer and the quantity of gas adsorbed, the surface area of the material may be calculated. The method is described by the equation:
( )[ ] ( )
( )( )
ø/
11
ø/1ø/
PPVmCC
VmCPPVPP ⎥
⎦
⎤⎢⎣
⎡ −
+=−
where V is the volume (at standard temperature and pressure, STP) of gas adsorbed at pressure P, Pø is the saturation pressure, which is the vapour pressure of liquefied gas at the adsorbing temperature, Vm is the volume of gas (STP) required to form an adsorbed monomolecular layer, and C is a constant related to the energy of adsorption.
The surface area S of the sample giving the monolayer adsorbed gas volume Vm (STP) is then calculated from:
MVmANS =
where A is Avogadro’s number, which expresses the number of gas molecules in a mole of gas at standard conditions, M is the molar volume of the gas, and N is the area of each adsorbed gas molecule.
By extending the process of gas adsorption so that gas is allowed to condense in material pore spaces, the fine pore structure of a material may be evaluated. As pressure is increased, the gas condenses in pores of increasing dimensions until saturation is reached when all pores are filled with liquid. Incremental reduction in the pressure of the adsorbed gas then evaporates the condensed gas. By comparison of the adsorption and desorption isotherms and the hysteresis between them using a range of different models (e.g. BJH method; Barrett, Joyner and Halenda, 1951) reveals information about the material’s pore size distribution, pore volume, pore area and pore shape.
However, since inert gases do not penetrate between layers of expanding clay minerals in general, only the external surface area is determined using the BET method. To measure the total (internal and external) surface area of clay-bearing samples, a different technique is employed requiring the adsorption of polar molecules such as, for example, 2-ethoxyethanol (ethylene glycol monoethyl ether, EGME, Carter et al., 1965).
1

IR/08/086; Version 2 Last modified: 2009/04/17 16:33
The BGS laboratories are equipped to carry out both the gas and polar molecule adsorption methodologies but the capability to perform gas adsorption analyses has been restricted by a relatively old system. This report presents the results of a small study carried out during 2008 under the Maintenance and Development of Capability (MaDCap) project which aimed to:
• familiarise BGS staff with a newly-purchased physisorption system
• produce a user manual
• advertise the abilities of the new system to BGS project leaders
• establish some degree of error for the technique
• study the possible effects of sample heterogeneity
2 Background The BGS have provided nitrogen/BET surface area analyses since the mid-1980s when a Micromeritics Flowsorb II 2300 system was purchased by the Mineralogy & Petrology Group and installed at the Grays Inn Road office, London. The system was subsequently moved to the Keyworth site and ultimately located in P Block.
During this time the system has been sporadically but often intensively used to provide single-point BET surface area data to a variety of projects such as:
• Industrial mineral characterisation and beneficiation projects
• Characterisation of lithologies for radioactive waste research
• Characterisation of materials before and after hydrothermal laboratory experiments relating to radioactive waste and CO2 capture and storage
• Characterisation of soils
• Direct consultancy service to industry and consultancies
Despite remaining functional, the Flowsorb II 2300 increasingly suffered from its inability to offer anything other than single-point analyses. In addition, its lack of computer control and manual operation resulted in relatively slow analyses and high unit costs. Also, despite regular servicing, it appeared that most recently, the results obtained for low surface area materials had became inconsistent and therefore suspect.
A capital bid was therefore successfully submitted for a replacement system in the 2007/08 Capital Bid Round, and a Micromeritics Gemini VI 2385C instrument was installed in March 2008. This system offered:
• Both single- and the more reliable, multi-point BET analyses
• Total pore volume determinations
• Pore volume distribution determinations
• Full computer control to enable data collection, presentation and interpretation of generated data
• A dedicated vacuum preparation system
2.1 GEMINI VI 2385C SYSTEM The Gemini series of surface area analyzers use the Static Volumetric Technique and a twin-tube design to generate high-speed surface area and porosity data (Figure 1).
2

IR/08/086; Version 2 Last modified: 2009/04/17 16:33
Figure 1. Micromeritics Gemini VI series physisorption system (Micromeritics, 2008)
The Gemini uses an adaptive rate, static volumetric technique of operation which adapts the required rate at which gas is supplied for equilibration. As shown in Figure 2, the instrument has two gas reservoirs (A) which are filled with equal volumes of the desired adsorptive, usually nitrogen. Gas is dosed into the sample from the reservoirs, and balance tubes and a transducer (B) on the sample side monitors the target pressure.
Figure 2. Schematic for the Gemini VI (Micromeritics, 2008)
3

IR/08/086; Version 2 Last modified: 2009/04/17 16:33
As the sample adsorbs gas, the pressure would tend to decrease in the sample tube were it not that transducer (B) causes a fast response servo valve (C) to hold the pressure constant. Transducer (D) located between the sample and balance tubes detects any pressure difference between the two tubes and causes another servo valve (E) to balance the pressures in both tubes. A third pressure transducer (F) monitors the pressure between the two reservoirs to determine the amount of gas that is adsorbed on the sample. This method of dosing and accounting for the volume of gas uptake enables the Gemini to produce highly accurate, highly reproducible results in the minimum time.
The sample and balance tubes are identical in every way. Conditions within one tube exactly reproduce the conditions within the other, the only difference being associated with the presence of the sample in the sample tube. Free-space errors introduced by thermal gradient variations are cancelled because the balance tube essentially has the same free space variation as the sample tube and no pressure differential is produced. Since free-space error is the limiting factor in measuring low surfaces with nitrogen, common mode rejection of free-space variation in the Gemini allows accurate measurements to be performed with nitrogen on low surface area materials. Other static volumetric techniques would usually require the use of krypton.
The sample uptake rate therefore controls the rate at which the gas is delivered through a servo valve, therefore the adsorptive is delivered as fast as the sample can adsorb it. In this manner of dosing, there is no under-dosing in which the sample waits for more adsorptive, nor over-dosing in which case the target pressure is exceeded. The result is a surface area analyzer that is as fast as the physics of adsorption allows and yet retains accuracy and reproducibility.
The Windows-based software allows the Gemini to be controlled from a PC, thus providing more versatility in data archiving, networking, and printer options. In addition, the software extends the choices of data reduction methods in each Gemini model to include:
• Single- and Multipoint BET surface area
• Langmuir surface area
• Pore volume and pore area distributions in the mesopore and macropore ranges by the BJH (Barrett, Joyner, and Halenda) method using a variety of thickness equations including a user-defined, standard isotherm
• Pore volume (distribution and total pore volume) in a user-defined pore size range
• Micropore distribution by the MP-method and total micropore volume by the t-Plot and as Plot methods
• Halsey, Harkins-Jura, Carbon Black STSA, Broekhoff-de Boer and user-entered thickness curves
The larger cabinet design of the Gemini VI 2385C model allows extended analysis time, greater stability and improved repeatability due to its longer sample tubes and a larger dewar. It also allows continuous monitoring of the saturation vapour pressure ( øP ) of the adsorptive using a dedicated øP tube and transducer. This feature allows the instrument software to accommodate, at each data point, any minute change in the saturation vapour pressure that may occur during the course of the analysis, resulting in a more meticulously determined relative pressure.
2.2 VACPREP DEGASSER The VacPrep Degasser prepares samples for surface area and pore structure analysis using both the flowing gas method and a vacuum mode which prepares samples by heating and evacuation. The VacPrep removes contaminants such as water vapour and adsorbed gases from samples to avoid interference with surface area measurements. It features six degassing stations and a choice of vacuum or gas flow preparation on each of the six stations and minimises the chance of
4

IR/08/086; Version 2 Last modified: 2009/04/17 16:33
sample contamination during transfer from the degas-to-analysis. The VacPrep allows the operator to select the temperature and preparation technique best suited to the sample type and application.
Figure 3. Micromeritics VacPrep system (Micromeritics, 2008)
3 Methods and materials Samples for analysis were submitted by BGS colleagues; Drs. Barry Rawlins (Soils Team), Chris Rochelle (Energy Theme) and Jon Harrington (Radwaste Team). Sample details are shown in Table 1.
Table 1. Sample details
MPL no Incoming sample name Sample type Submitted by MPLN405 610155 <2 mm MPLN406 611353 <2 mm MPLN407 611495 <2 mm MPLN408 610155 ground MPLN409 611353 ground
Black carbon-bearing soil samples. Crushed and ground subsamples.
Barry Rawlins
MPLN410 611495 ground MPLB464 Quartz 125-250 µm MPLB465 Albite 125-250 µm MPLG922 Chemgrade quartz (Fluka) 150 -400 µm MPLL081 Casablanca cap rock 250-500 µm
Starting materials for hydrothermal laboratory experiments
Chris Rochelle
MPLL082 Casablanca reservoir rock 250-500 µm MPLN411 Bentonite (?Sweden) MPLN412 Lias Clay Liner MPLN413 Nordland Shale 15/9-A-11 (NS-S2) 907.4-907.49 Tin 5 MPLN414 Ball Clay MPLN415 German Blue Clay MPLN416 Callovo-Oxfordian Paris Basin EST 27350 (ANDRA) MPLN417 Opalinus Clay off-cut OPA-2 Bewken Borehole MPLN418 London Clay (Landfill Liner) off-cuts Tin X19 13/5/97
Mudstone core samples associated with containment projects
Jon Harrington
MPLN419 Boom Clay offcuts T4S2 MPLN420 Opalinus Clay Mont Terri MPLN421 Gault Clay
The samples from Drs. Barry Rawlins and Chris Rochelle (ground or granular materials) were analysed as received but the core samples received from Dr. Jon Harrington were first dried at 55˚C overnight and then stage crushed to produce a 1-2 mm fraction for analysis.
5
IR/08/086; Version 2 Last modified: 2009/04/17 16:33
As well as learning how to use the instrument for Earth Science samples, the range of sample types submitted allowed the project to explore several lines of investigation:
• To establish analytical reproducibility, the same subsample from one of the mudstone samples was analysed three times.
• The soil samples were analysed both as <2 mm size fractions and ground powders to establish whether sample particle-size had any noticeable effect on surface area. Similarly the bentonite sample was analysed as a 1-2 mm fraction and a <125 µm powder.
• To establish whether sample heterogeneity produced any substantial errors, separate sub-samples were run for one of the soils (both <2 mm and ground materials) and one of the quartz samples.
All samples were prepared using a Micromeritics Gemini VacPrep Degasser and analyses were carried out on the Micromeritics Gemini VI 2385C system. All the samples were run on a 5 pressure point program to determine BET surface area. One sample, was also run on an extended 30-pressure point program to additionally determine pore volume distribution.
6

IR/08/086; Version 2 Last modified: 2009/04/17 16:33
4 Results A methodology for analysis of Earth Science materials was devised and implemented for all the samples in this study and is shown in Appendix 1. A sample preparation sheet with example data is shown in Appendix 2.
Correlation co-efficients for BET analyses provide an indication of the quality and reliability of the data produced. The majority of the samples analysed here produced co-efficients of better than 0.999 suggesting high quality analyses. However, the two quartz samples (MPLB464 and MPLG922) characterised by very low surface areas (c.0.07 m2/g) produced lower coefficients of 0.99 suggesting poorer quality analyses.
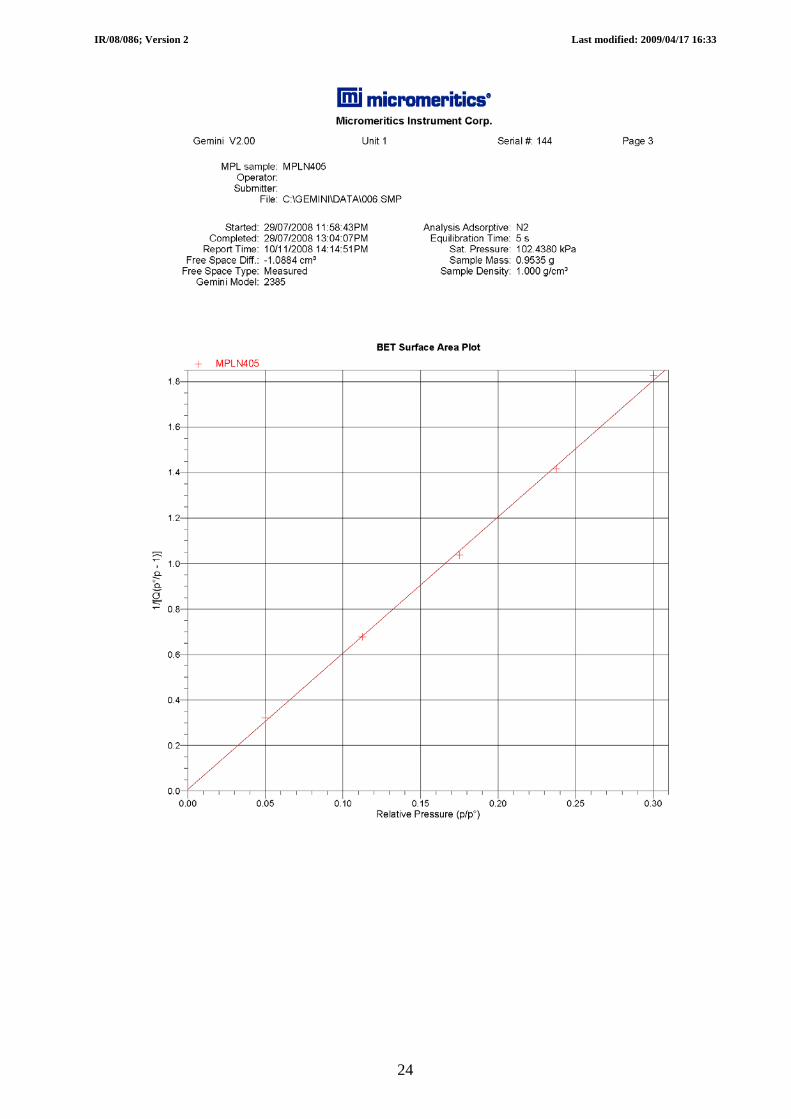
Reporting of results from the Gemini software can be tailored to the needs of the particular analysis. Example output for a typical multi-point BET analysis is shown in Appendix 3 and that from a full adsorption isotherm and pore volume distribution in Appendix 4.
4.1 SOIL SAMPLES The results of surface area analyses on the soils samples submitted by Dr Barry Rawlins are summarised in Table 2.
Table 2. Summary of results for soil samples
BET surface area (m2/g)
Run 1 Run 2 Run 3 Mean Std Dev Incoming
sample name
value +/-
error value +/-
error value +/-
error value +/-
error +/-
value error 610155 <2 mm 16.2691 0.28 16.5814 0.27 16.1768 0.25 16.3424 0.2667 0.2120 0.0153611353 <2 mm 5.8671 0.08 5.8671 0.0800 611495 <2 mm 6.7906 0.08 6.7906 0.0800 610155 ground 10.0930 0.06 13.8094 0.16 13.5109 0.15 12.4711 0.1233 2.0649 0.0551611353 ground 5.5448 0.01 5.5448 0.0050 611495 ground 6.0386 0.03 6.0386 0.0300
Mean surface areas for the soil samples range from c.5.86-16.34 m2/g (<2 mm fraction) and c.5.54-12.47 m2/g (ground material). Soil 610155 shows the greatest surface area for both sample types and soil 611495 shows the lowest surface areas. Interestingly, in each case the surface area for the ground material is lower than that produced for the corresponding <2 mm size fraction. This is the reverse of the expected result whereby a greater surface area would be expected to be exposed by grinding material to a powder.
Sample heterogeneity would not appear to be a significant problem for the <2 mm material as the standard deviation value represents only a 1.3% differential, but as a result of the low surface area measured in Run 1 for the ground material, there appears to be a greater problem with these samples (16.6% differential). This is again the reverse of the expected result whereby it would be expected that a more homogeneous sample would be created by grinding to a powder.
The high surface area sample (610155) corresponds to the sample containing the highest levels of black carbon (6.44%, B. Rawlins pers. comm.) but the impact of black carbon is more difficult to discern in the remaining samples (611353, 2.09% and 611495, 0.5%). At these lower levels, the presence of small quantities of black carbon appear to be obscured by the presence of other
7

IR/08/086; Version 2 Last modified: 2009/04/17 16:33
phases such as clay minerals. Further samples will be run to explore the link between surface area and black carbon content in soils.
4.2 HYDROTHERMAL LABORATORY EXPERIMENTAL MATERIALS The results of surface area analyses on the hydrothermal laboratory experimental samples submitted by Dr Chris Rochelle are summarised in Table 3.
Table 3. Summary of results for the hydrothermal laboratory experimental samples
BET SA (m2/g)
Run 1 Run 2 Run 3 Mean Std Dev Incoming sample
name
value +/-
error value +/-
error value +/-
error value +/-
error +/-
value error 0.0710 0.0022 Quartz 125-250 µm 0.0710 0.0022 0.6386 0.0112 Albite 125-250 µm 0.6386 0.0112
Chemgrade quartz (Fluka) 150-400 µm 0.0427 0.0042 0.0928 0.0028 0.0704 0.0050 0.0686 0.0040 0.0251 0.0011
Chemgrade quartz (Fluka) 150-400 µm (Using filler tubes)
0.0603 0.0041 0.0493 0.0033 0.0527 0.0031 0.0541 0.0035 0.0056 0.0005
Casablanca cap rock 250-500 µm 2.1448 0.0234 2.1448 0.0234
Casablanca reservoir rock 250-500 µm 0.8437 0.0080 0.8437 0.0080
In comparison to the soil samples, the hydrothermal laboratory experimental samples produced low or very low surface areas ranging from 0.07-2.14 m2/g.
The two quartz samples produced particularly low surface areas (c.0.07 m2/g) and correlation co-efficients of only 0.99 suggesting relatively poor-quality data compared to the remaining dataset. Such surface areas would appear to be close to the lower limit of accurate surface area detection using the Gemini VI.
The albite and Casablanca reservoir rock show also show low surface areas (c.0.64 and 0.84 m2/g respectively) but these are an order of magnitude higher than the quartz samples. Previous X-ray diffraction (XRD) analyses of the Casablanca reservoir rock (Rochelle et al., 2007) suggest that it is predominantly composed of calcite (95.9%) with traces of dolomite (3%) and quartz (1.1%). Such a mineralogy would be expected to produce a low surface area.
The Casablanca cap rock produced the highest surface area for the hydrothermal laboratory experimental samples, although at 2.14 m2/g, this would still be described as a low value. The higher value compared to the reservoir rock is almost certainly due to the presence of phyllosilicates and clay minerals in the cap rock. Previous XRD analyses (Rochelle et al., 2007) confirm that although the cap rock is also carbonate-dominated (calcite 55.9%, dolomite 5.8%, ankerite 1.6%) with minor quartz (14.3%), pyrite (3.8%) and albite (0.8%), it also contains undifferentiated mica including illite/smectite (15.4%) and chlorite (2.4%) species.
Three repeat runs for separate sub samples of the very low surface area Chemgrade quartz sample produced a mean surface area of 0.069 m2/g and standard deviation of 0.025. This relatively large standard deviation value represents a large 36.6% differential and may result from the free space errors or indicate that sample heterogeneity presents a significant problem in low surface area materials.
8

IR/08/086; Version 2 Last modified: 2009/04/17 16:33
In order to improve the quality of analysis of low surface area materials, Micromeritics suggest (but did not originally supply BGS) the use of filler tubes. Solid glass filler tubes, with a fine capillary down their lengths, are fitted to both the reference and sample tubes to exclude as much free space as possible and therefore ensure optimum precision and accuracy. Having obtained the filler tubes at a later date, only limited testing was carried out using the filler tubes. Three separate subsamples from the Chemgrade quartz sample were re-analysed and results show similar correlation coefficients of c.0.99, a mean surface area of 0.054 m2/g but a smaller standard deviation of 0.005 suggesting more precise data.
Comparison of the multi-point surface area data produced by the Gemini with previously obtained values from single-point analyses performed on the Flowsorb II indicate a strongly positive correlation (Table 4 and Figure 4). The albite sample lies farthest from the overall trend. It is noticeable that for all the samples, with the exception of the Quartz 125-250 µm sample, the multi-point data produces a larger surface area than the previous single-point data. This concurs with standard data such as that supplied with Surface Area Reference Materials, e.g. carbon black standard multi-point surface area 30.6 ± 0.75 m2/g, single-point surface area 29.9 ± 0.75 m2/g).
Table 4. Comparison of multi-point and single-point BET data hydrothermal laboratory experimental samples
BET SA (m2/g) Gemini VI multi-point Flowsorb II single-point (this investigation) (previous investigations)
Quartz 125-250 µm 0.0710 0.0824 Albite 125-250 µm 0.6386 0.1674 Chemgrade quartz (Fluka) 150-400 µm 0.0686 0.06 Casablanca cap rock 250-500 µm 2.1448 1.93 Casablanca reservoir rock 250-500 µm 0.8437 0.57
y = 0.8268xR2 = 0.9317
0
0.5
1
1.5
2
2.5
0 0.5 1 1.5 2 2.
Gemini VI multi-point BET (m2/g)
Flow
sorb
II s
ingl
e-po
int B
ET (m
2/g)
5
Figure 4. Cross-plot of multi-point and single-point BET data for the hydrothermal laboratory experimental samples
9

IR/08/086; Version 2 Last modified: 2009/04/17 16:33
4.3 MUDSTONE CORE SAMPLES The results of surface area analyses on the mudstone core samples submitted by Dr Jon Harrington are summarised in Table 5.
Table 5. Summary of results for the mudstone samples associated with containment projects (all are 1-2 mm fractions except where indicated)
BET SA (m2/g)
Run 1 Run 2 Run 3 Mean Std Dev Incoming sample
name
value +/-
error value +/-
error value +/-
error value +/-
error +/-
value error Bentonite 20.4925 0.3027 20.4925 0.3027 Bentonite <125 µm 17.6855 0.0813 17.6855 0.0813 Lias Clay Liner 24.0139 0.2240 24.0139 0.2240 Nordland Shale 26.7313 0.1566 26.7313 0.1566 Ball Clay 34.2023 0.0895 34.2023 0.0895 German Blue Clay 53.8411 0.4279 53.8411 0.4279 Callovo-Oxfordian 28.1373 0.4982 28.054 0.4882 27.8875 0.4823 28.0264 0.4896 0.1272 0.0080Opalinus Clay 21.7706 0.1184 21.7706 0.1184 London Clay 58.5419 0.7338 58.5419 0.7338 Boom Clay 26.9840 0.1212 26.9840 0.1212 Opalinus Clay 30.9592 0.2548 30.9592 0.2548 Gault Clay 54.0795 1.0344 54.0795 1.0344
The surface areas obtained for the mudstone core samples (1-2 mm fractions) were the highest for the samples analysed in this project and ranged from c.20.49 (Bentonite) to 58.54 m2/g (London Clay). However, as mineralogical data were not available for the same samples, discussion of the surface area data is limited to general statements.
In general terms, the surface areas appear to correspond to the total concentration of clay minerals present with some influence from the presence of smectite. The higher surface areas therefore appear to correspond to the more clay-rich samples where smectite forms a significant proportion of the clay mineral assemblage and the lower surface areas are produced by samples with lower clay contents where smectite is largely absent.
The London Clay and Gault Clay samples present the highest BET surface areas for the sample batch at c.58.54 and 54.08 m2/g respectively. Typically the London Clay shows high clay (20-81%, mean 57%; Kemp & Wagner, 2006) and smectite contents (5-30%, mean 17%; Kemp & Wagner, 2006) with moderate 2-ethoxyethanol total surface areas (74 – 260 m2/g, mean 176 m2/g; Kemp & Wagner, 2008). Similarly, the Gault Clay is characterised by high clay contents (up to 65%, Forster et al., 1994) and highly-smectitic clay mineral assemblages (Jeans, 2006).
The German Blue Clay (c.53.84 m2/g) and the Ball Clay (c.34.20 m2/g) samples also present relatively high BET surface areas. These clays are most likely to be predominantly composed of disordered kaolinite with minor smectite (e.g. Konta, 1963). Typical ball clays contain >70% <2 µm material.
The majority of the mudstone samples (Boom Clay, Opalinus Clay, Callovo-Oxfordian Clay, Nordland Shale, Lias Clay) produce moderate BET surface areas in the range 20-30 m2/g. Literature sources suggest that these lithologies are typically composed of c.50% clay minerals and usually illite- or illite/smectite-dominated clay mineral assemblages (e.g. Wenk et al., 2008;
10

IR/08/086; Version 2 Last modified: 2009/04/17 16:33
Kemp et al., 2001; 2002; 2005). The Boom Clay differs in possessing a smectite-dominated clay mineral assemblage (Decleer et al., 1983).
Surprisingly, the lowest surface area in this suite of samples was produced by the Bentonite (?Sweden) sample at c.20.49 m2/g. However, the BET surface area for standard bentonite (CMS source clay SWy-2) can produce relatively low 22.7m2/g (Umran Dogan et al., 2006). As commercial bentonites are usually composed of high proportions of smectite-group minerals (rarely less than 60% and usually more than 70%), such low BET surface areas are puzzling. A possible cause of the low surface area may be the inadequate degassing of the sample prior to analysis. Further work is necessary to explore the effects of degassing procedures on ‘difficult’ samples such as bentonites.
Analytical reproducibility was examined by analysing the same Callovo-Oxfordian Clay sub-sample, three times. The three values (28.1373, 28.054 and 27.8875 m2/g) indicate a mean surface area of 28.0264 m2/g with a standard deviation of 0.4896. These values produce a coefficient of variance (standard deviation/mean) of 1.75%, suggesting good analytical reproducibility.
11

IR/08/086; Version 2 Last modified: 2009/04/17 16:33
5 Conclusions • The Micromeritics Gemini VI physisorption system has been successfully installed and a
BGS user manual has been written and working methodologies implemented.
• A range of sample types have been analysed for various BGS project leaders, with reliable data being generated in all cases. Very low surface areas (<0.1 m2/g) appear to be slightly less reliable, although these results may be improved by employing filler rods.
• Results indicate the lowest detectable surface area is of the order of c.0.05 m2/g.
• Multi-point BET provide more accurate surface areas than those derived from single-point measurements. Multi-point surface areas appear to be slightly larger than those derived from single-point values for the same sample.
• On the basis of the samples tested here, sample heterogeneity would not appear to be a significant problem for ‘routine’ samples. However, analysis of ground material from the same samples revealed a wider spread of results. Sample heterogeneity may also be a greater problem when analysing very low surface area materials, although this may be accounted for by free space errors.
• For surface areas in the range 0.1-60 m2/g, errors appear to be better than ±2% (of the value) which concurs with data for the supplied carbon black Surface Area Reference Material. For lower surface areas (<0.1 m2/g) these errors can increase to ±6%. Surface areas are reproducible within the same degree of error.
• Analysis of soils suggests that the technique may be useful in characterising black carbon contents. Interestingly, the surface area for the ground materials appears lower than that produced for the corresponding <2 mm size fraction. This is the reverse of the expected result and requires further investigation.
• For mudstone samples, surface areas appear to correspond to the total concentration of clay minerals present with some influence from the presence of smectite. Surprisingly, the lowest surface area in this suite of mudstone samples was produced by the Bentonite (?Sweden) sample. This may relate to the degassing regime employed.
6 Recommendations • Users are advised to follow the protocols outlined in this report and the analysis programs
setup. This report should be quoted when reporting data produced by the physisorption system.
• For low surface area materials (<50 m2/g), it is recommended that filler rods are used to reduce free-space and error.
• Further work, beyond the scope of this initial study, is required to identify the effects of different degassing routines and the differing surface areas obtained when analysing ground and crushed samples. Additional work is also necessary to more fully explore the pore size distribution functions of the physisorption system.
12

IR/08/086; Version 2 Last modified: 2009/04/17 16:33
13
References British Geological Survey holds most of the references listed below, and copies may be obtained via the library service subject to copyright legislation (contact [email protected] for details). The library catalogue is available at: http://geolib.bgs.ac.uk.
BARRETT, E.P., JOYNER, L.G. AND HALENDA, P.P. 1951. The determination of pore volume and area distributions in porous substances. I. Computations from nitrogen isotherms, Journal of the American Chemical Society, 73, 373–380.
BRUNAUER, S, EMMET, P H AND TELLER, E. 1938. Adsorption of Gases in Multimolecular Layers. Journal of the American Chemical Society, 60, 309-319.
CARTER, D.L., HEILMEN, M.D. AND GONZALEZ, F.L. 1965. Ethylene glycol monoethyl ether for determining surface area of silicate minerals. Soil Science, 100, 356-360.
DECLEER, J., VIAENE, W. and VANDENBERGHE, N. 1983. relationships between chemical, physical and mineralogical characteristics of the Rupelian Boom Clay, Belgium. Clay Minerals, 18, 1-10.
FORSTER, A., HOBBS, P.R.N., CRIPPS, A.C., ENTWISLE, D.C., FENWICK, S.M.M., RAINES, M.R., HALLAM, J.R., JONES, L.D., SELF, S.J. & MEAKIN, J.L. 1994. Engineering geology of British rocks and soils: Gault Clay. British Geological Survey Technical Report, WN/94/31. 60pp.
JEANS, C.V. 2006. Clay mineralogy of the Cretaceous strata of the British Isles. Clay Minerals, 41, 47-150.
KEMP, S.J. AND WAGNER, D. 2008. The mineralogy, geochemistry and surface area of mudrocks from the London Clay Formation of southern England. British Geological Survey Internal Report, IR/06/060. 81pp.
KEMP, S.J., TURNER, G. AND WAGNER, D. 2001. Mineralogical characterisation of the Nordland Shale, UK Quadrant 16, northern North Sea. British Geological Survey Commissioned Report, CR/01/136. 52pp.
KEMP, S J, PEARCE, J M and STEADMAN, E J. 2002. Mineralogical, geochemical and petrographical characterisation of Nordland Shale cores from well 15/9-A-11, Sleipner field, northern North Sea. British Geological Survey Commissioned Report, CR/02/313. 40pp.
KEMP, S.J., MERRIMAN, R.J. and BOUCH, J.E. 2005. Clay mineral reaction progress - The maturity and burial history of Lias Group of England and Wales. Clay Minerals, 40, 43-61.
KONTA, J. 1963. Quantitative mineralogical analysis of 'Blue clay' from Vonsov, Bohemia" a comparative study by nine laboratories. Clay Minerals Bulletin, 30(5), 255-264.
MICROMERITICS. 2008. Gemini VI Windows – Operator’s manual v2.00.
ROCHELLE, C.A, TURNER, G., PEARCE, J.M., TAYLOR, H., KEMP, S.J., SHAW, R AND WILLIAMS, C. 2007. Geochemical interactions between CO2 and host rocks at the Casablanca field: Results of fluid-rock interaction experiments. British Geological Survey Internal Report, CR/07/015. 53pp.
DOGAN, A.U., DOGAN, M., ONAL, M., SARIKAYA, Y., ABURUB, A. AND WURSTER, D.E. 2006. Baseline studies of The Clay Minerals Society source clays: SSA by the Brunauer Emmett Teller (BET) Method. Clays and Clay Minerals, 54, 62-66.
WENK, H.R., VOLTOLINI, M., MAZUREK, M., VAN LOON, L.R. AND VINSOT, A. 2008. Preferred orientations and anisotropy in shales: Callovo-Oxfordian Shale (France) and Opalinus Clay (Switzerland). Clay Minerals, 56, 285-306.

IR/08/086; Version 2 Last modified: 2009/04/17 16:33
Appendix 1 BGS methodology
OPERATING INSTRUCTIONS FOR THE
MICROMERITICS GEMINI VI
SURFACE AREA AND PORE SIZE ANALYZER
(ROOM P029)
14

IR/08/086; Version 2 Last modified: 2009/04/17 16:33
1 SAMPLE PREPARATION (DAY BEFORE ANALYSIS)
1.1 Turn on VacPrep 061 on the rear panel.
1.2 Set temperature to desired value to most effectively remove moisture and adsorbed gases
without changing the nature of the material (e.g. 300ºC for the carbon black standard; 60ºC
for geological samples). The carbon black standard must be run before each batch of
samples. Note that the heating element takes a long time to cool down!
1.3 Label the sample tubes and enter the sample number and description onto the BET sample
sheet (shown in Appendix 3).
1.4 Using a 4 decimal place balance, weigh the sample into a balance boat, c.0.5 g for samples
expected to have a high (>50 m2/g) surface area and c.1.0 g for samples expected to have a
low (<50 m2/g) surface area. Set the sample aside.
1.5 Select a labelled sample tube. Fit the tube into the foam base and insert a rubber ‘ear’ into
the tube. Using a 4 decimal place balance, weigh the tube, foam base and rubber ‘ear’ and
note weight on the BET sample sheet (shown in Appendix 3).
1.6 Remove the tube, foam base and rubber ‘ear’ assembly from the balance. Remove the
rubber ‘ear’ from the tube and attach the 'tube filler' funnel. Carefully pour the sample
from balance boat into the tube.
1.7 Repeat steps 1.3 to 1.6 for up to 6 samples.
1.8 Attach each sample tube to the Vac Prep unit using the stainless steel connectors. First
slacken the connector nut, then insert the sample tube securely and re-tighten the nut
(finger-tight).
1.9 Turn on rotary pump at the wall socket.
1.10 Ensure all the needle valves at the ‘T’ pieces above the connectors are closed.
1.11 Turn the ‘gas/off/vac’ switch to the ‘vac’ position.
1.12 Slowly open each needle valve, ensuring that the sample is not drawn up the sample tube.
15

IR/08/086; Version 2 Last modified: 2009/04/17 16:33
1.13 Place the sample tubes in their heating stations (at 60ºC or desired temperature) and leave
overnight.
1.14 Repeat steps 1.3 – 1.6 using between 0.5-0.6 g of carbon black standard. Place to one side
for the next day.
16

IR/08/086; Version 2 Last modified: 2009/04/17 16:33
2 PREPARATION FOR ANALYSIS (ANALYSIS DAY)
2.1 Wearing gloves, eye protection and a lab coat, obtain a dewar of liquid N2 from the K-
block supply using established procedures.
2.2 Switch on the Gemini VI Surface and Pore Size Analyzer at the rear of machine. The
green light on the front of the cabinet should glow green.
2.3 Open the He and N2 gas supplies by releasing the valve on the top of each cylinder. The
regulators should be set to read between 1.1 – 1.2 bar (check!).
2.4 Wearing gloves, eye protection and a lab coat, fill the instrument dewar with liquid N2 to a
level 5 cm from the top and place the dewar on the instrument elevator.
2.5 Transfer all the sample tubes from the VacPrep heating stations to their cooling positions.
2.6 Increase the VacPrep temperature to 300ºC, place the carbon black sample tube in a
heating position and leave for 1 hour.
2.7 Ensure that an empty sample tube is placed in the instrument balance tube.
2.8 Wearing heat-resistant gloves, carefully remove the carbon black sample tube (HOT!)
from its heating station, attach a rubber ‘ear’ to the tube and place the sealed tube in the
cooling station for a few minutes.
2.9 Using a 4 decimal place balance, weigh the carbon standard, tube, ‘ear’ and foam base.
Record the weight on the BET sample sheet.
2.10 Start up the instrument PC. Double-click on the desktop ‘Gemini’ icon.
2.11 Allow the software initialisation to complete [the Initialisation Window will close
automatically].
2.12 Using the Gemini software, under the ‘Unit1’ dropdown menu, select ‘Show Instrument
Schematic’. A window showing an interactive schematic for the instrumental settings will
appear.
17

IR/08/086; Version 2 Last modified: 2009/04/17 16:33
3 ANALYSIS OF CARBON BLACK STANDARD
3.1 Using the Gemini software, under the ‘File’ dropdown menu, select ‘Open’ and then
‘Sample Information’. Alternatively press ‘F2’ on the keyboard.
3.2 The ‘Open Sample Information File’ window will appear. Select the directory:
C:\GEMINI\DATA\BGSDAT~1 and then Click the ‘OK’ button.
3.3 A further ‘Open Sample Information File’ window will appear indicating ‘File
C:\GEMINI\DATA\BGSDAT~1\***.SMP does not exist. Do you wish to create it ?’
Click the ‘Yes’ button.
3.4 A multi-tabbed window will appear. On the ‘Sample Information’ tab, click the ‘Replace
All’ button.
3.5 The ‘Open Sample Information File’ window will appear. Navigate to the
C:\GEMINI\DATA\METHODS directory and select the 004.SMP ‘BET Surface Area
Method’. Click the ‘OK’ button.
3.6 On the ‘Sample Information’ tab, in the MPL sample: box, overtype ‘BET surface area
method’ with ‘CARBON BLACK + date’ and overtype the sample mass (shown as
500.0000 g) with the value produced on the Excel BET sample sheet.
3.7 Using the buttons at the base of the tab, click ‘Save’ and then click ‘Close’.
3.8 Under the ‘Unit1’ dropdown menu, select ‘Start Analysis’. A ‘Start Analysis’ window
will appear. Navigate to the C:\GEMINI\DATA\BGSDAT~1 directory and select the
entry for ‘CARBON BLACK + date’. Click the ‘OK’ button.
3.9 Check the information in the new window is correct and click the ‘Start’ button at the
bottom of the window. A new window will appear which asks you to remove the sample
tube from its port.
3.10 On the instrument, ensure that the top of dewar is covered (e.g. with a blank CD) to
prevent objects from falling into the liquid N2.
3.11 Disconnect the sample tube from the instrument by releasing the tube nut. Note the
position of the ferrule and O-ring. Click the ‘OK’ button.
3.12 A new window will then appear requesting that you re-attach the sample tube.
18

IR/08/086; Version 2 Last modified: 2009/04/17 16:33
3.13 Place the tube nut, ferrule and O-ring (in this order) onto the sample tube.
3.14 Insert the sample tube into the instrument housing and tighten the nut to finger tight plus a
quarter-turn.
3.15 Check that the bases of the sample and reference tubes are level.
3.16 Place the dewar cover over the sample, reference and saturation tubes and push to the top.
Close the protection doors.
3.17 Click the ‘OK’ button.
3.18 Following completion of the analysis, to view the results, under the ‘Reports’ dropdown
menu, select ‘Start Reports’ and then select the appropriate file from the
C:\GEMINI\DATA\BGSDAT~1 directory.
3.19 Check that the carbon black standard produces a BET surface area within specifications
(30.6 ± 0.75 m2/g). If the value obtained is outside these specifications, repeat the
procedure with fresh carbon black sample.
19

IR/08/086; Version 2 Last modified: 2009/04/17 16:33
4 ANALYSIS OF SAMPLES
4.1 On the instrument, ensure that the top of dewar is covered (e.g. with a blank CD) to
prevent objects from falling into the liquid N2.
4.2 Disconnect the sample tube containing the carbon black standard from the instrument by
releasing the tube nut. Discard the carbon black standard material.
4.3 On the VacPrep unit, turn the ‘gas/off/vac’ switch to the ‘gas’ position for 30 seconds
4.4 Turn the gas/off/vac switch to the ‘off’ position.
4.5 Disconnect the sample tube from the instrument by releasing the tube nut. Attach ‘ear’
immediately. Using a 4 decimal place balance, weigh the sample, tube, ‘ear’ and foam
base assembly. Record the weight on the BET sample sheet. Note: The weight of sample
produced on the BET sample sheet is required when completing the ‘Sample Information’
tab later.
4.6 Follow the same procedure as that for the carbon black standard [steps 3.1 -3.18]
substituting the appropriate MPL number when completing the ‘Sample Information’ tab
[step 3.6].
5 TUBE CLEANING AFTER ANALYSIS
5.1 Rinse each of the sample tubes with weak detergent.
5.2 Place the tubes in an ultrasonic bath filled with RO water and sonicate for c.5 minutes.
5.3 Rinse the tubes with acetone and leave in an oven set at 50ºC until dry.
20

IR/08/086; Version 2 Last modified: 2009/04/17 16:33
Appendix 2 BET sample sheet with example data S
AM
PLE
PR
EPA
RA
TIO
N F
OR
GE
MIN
I VI S
UAR
FA
CE
AR
EA
AN
D P
OR
E SI
ZE A
NA
LYS
ER
Day
bef
ore
anal
ysis
TUB
E N
o.M
PL
No.
Alte
rnat
ive
Sam
ple
No.
/Des
crip
tion
(if
app
licab
le)
Wei
ght (
g)
TUB
E+E
AR
+BA
SE
Wei
ght (
g)
TUB
E+S
AM
PLE
+EA
R+B
AS
E (a
fter
rem
oval
from
vac
pre
p on
day
of
ana
lysi
s )
Sam
ple
Wei
ght (
g)
1N
418
Lond
on C
lay
20.1
689
21.2
635
1.09
462
N41
9B
oom
Cla
y20
.137
621
.214
51.
0769
3N
420
Opa
linus
Cla
y20
.114
321
.200
41.
0861
4N
421
Gau
lt C
lay
20.1
196
21.2
682
1.14
865
N41
1B
ento
nite
<12
5um
20.1
805
20.6
818
0.50
136
07
0
* C
arb
on B
lack
ref
eren
ce s
amp
le s
hou
ld a
lway
s b
e ru
n p
rio
r to
an
y un
kno
wn
sam
ples
an
d th
e re
sult
ve
rifie
d to
ens
ure
that
the
inst
rum
ent
is o
per
atin
g co
rrec
tly.
Fina
lly, p
lace
fille
d sa
mpl
e tu
bes
in V
ac-P
rep
unit
and
evac
uate
ove
rnig
ht a
t 60o C
- se
e se
ctio
n 1.
4 in
ope
ratin
g in
stru
ctio
ns.
Rep
eat t
he a
bove
ste
ps fo
r all
sam
ples
and
fina
lly w
eigh
out
bet
wee
n 0.
5g a
nd 0
.6g
Car
bon
Bla
ck* r
efer
ence
mat
eria
l int
o tu
be a
nd le
ave
in 5
0o C o
ven
over
nigh
t.
Wei
gh s
ampl
e ap
prox
imat
ely
into
a b
alan
ce b
oat,
i.e. 0
.5g
(for
sam
ples
with
hig
h su
rface
are
as) a
nd 1
.0g
(for s
ampl
es w
ith lo
w s
urfa
ce a
reas
). S
et s
ampl
e as
ide.
Rem
ove
com
pone
nts
from
sca
les
and
fill t
ube
with
sam
ple
by fi
rst r
emov
ing
rubb
er e
ar a
nd a
ttach
ing
the
'tube
fille
r' to
tube
, the
n ca
refu
lly p
ourin
g sa
mpl
e fro
m
bala
nce
boat
into
it.
Sel
ect a
labe
lled
sam
ple
tube
. Fit
tube
into
foam
bas
e an
d in
sert
rubb
er e
ar in
to tu
be.
Wei
gh a
ll 3
com
pone
nts
toge
ther
and
not
e w
eigh
t in
tabl
e be
low
.
Day
of a
naly
sis
Prio
r to
anal
ysis
, rem
ove
a sa
mpl
e tu
be c
onta
inin
g a
sam
ple
to b
e an
alys
ed fr
om th
e V
ac-P
rep
(afte
r al
low
ing
to c
ool)
and
inse
rt ru
bber
ear
, thu
s en
surin
g th
at th
e sa
mpl
e re
mai
ns d
ry. D
eter
min
e th
e sa
mpl
e w
eigh
t by
fittin
g th
e tu
be +
sam
ple
+ ea
r in
to th
e ba
se, w
eigh
ing
all c
ompo
nent
s an
d en
terin
g an
d th
e w
eigh
t int
o th
e ta
ble.
The
sam
ple
wei
ght c
alcu
late
d in
the
final
col
umn
shou
ld b
e ap
prox
imat
ely
0.5g
or 1
.0g.
21

IR/08/086; Version 2 Last modified: 2009/04/17 16:33
Appendix 3 Example multi-point BET report (3 pages)
22

IR/08/086; Version 2 Last modified: 2009/04/17 16:33
23
IR/08/086; Version 2 Last modified: 2009/04/17 16:33
24

IR/08/086; Version 2 Last modified: 2009/04/17 16:33
Appendix 4 Example full isotherm and pore volume distribution report (9 pages)
25

IR/08/086; Version 2 Last modified: 2009/04/17 16:33
26

IR/08/086; Version 2 Last modified: 2009/04/17 16:33
27

IR/08/086; Version 2 Last modified: 2009/04/17 16:33
28

IR/08/086; Version 2 Last modified: 2009/04/17 16:33
29

IR/08/086; Version 2 Last modified: 2009/04/17 16:33
30

IR/08/086; Version 2 Last modified: 2009/04/17 16:33
31

IR/08/086; Version 2 Last modified: 2009/04/17 16:33
32

IR/08/086; Version 2 Last modified: 2009/04/17 16:33
33