Embed Size (px)
Citation preview

Initial Public Offering Allocations
by Sturla Lyngnes Fjesme
A dissertation submitted to BI Norwegian Business School for the degree of PhD
PhD specialization: Financial Economics
Series of Dissertations 9/2011
BI Norwegian Business School

Sturla Lyngnes Fjesme Initial Public Offering Allocations © Sturla Lyngnes Fjesme 2011 Series of Dissertations 9/2011 ISBN: 978-82-8247-029-2 ISSN: 1502-2099 BI Norwegian Business School N-0442 Oslo Phone: +47 4641 0000 www.bi.no Printing: Nordberg Trykk The dissertation may be downloaded or ordered from our website www.bi.no/en/Research/Research-Publications/
Abstract Stock exchanges have rules on the minimum equity level and the minimum number of shareholders that are required to list publicly. Most private companies that want to list publicly must issue equity to be able to meet these minimum requirements. Most companies that list on the Oslo stock exchange (OSE) are restricted to selling shares in an IPO to a large group of dispersed investors or in a negotiated private placement to a small group of specialized investors. Initial equity offerings have high expected returns and this makes them very popular investments. Ritter (2003) and Jenkinson and Jones (2004) argue that there are three views on how shares are allocated in the IPO setting. First, is the academic view based on Benveniste and Spindt (1989). In this view investment banks allocate IPO shares to informed investors in return for true valuation and demand information. Informed investors are allocated shares because they help to price the issue. Second, is the pitchbook view where investment banks allocate shares to institutional investors that are likely to hold shares in the long run. It is argued, by investment banks, that buy-and-hold investors will create price stability that is good for the issuing companies. Finally, is the rent seeking view, or profit sharing view, where investment banks allocate shares to investors in return for kickbacks. There are four types of IPO rent seeking that have been investigated by U.S. regulators (the SEC and the NASD), see Liu and Ritter (2010). IPO allocations can be tied to future corporate business for the banks (IPO spinning), after-listing purchases of the IPO shares (IPO laddering) and stock-trading commissions. Investment banks and companies can also agree on high underpricing in return for after-listing company share coverage from a star analysts provided by the bank (analyst conflict of interest). Underpriced shares are then allocated to bank clients that generate high stock-trading commission for the investment bank. In the paper 'Laddering in Initial Public Offering Allocations' it is investigated if IPO allocations are tied to after-listing purchases of the IPO shares (IPO laddering). In the paper 'Using Stock-trading Commissions to Secure IPO Allocations' it is investigated if IPO allocations are tied to investor stock-trading commission. Private companies that want to list publicly can, as an alternative to the IPO allocation, issue shares in a negotiated private placement to a small group of specialized investors. Most theoretical papers on equity offerings, however, show that IPOs will almost always be preferred to the negotiated private placement by the seller, see Bulow and Klemperer (1996), Bulow and Klemperer (2009) and French and McCormick (1984). Why some companies use private placements has therefore been the focus of many empirical studies in finance, see Wruck (1989), Hertzel and Smith (1993), Barclay et al. (2007), Anshuman et al. (2010) and Cronqvist and Nilsson (2005). The research question addressed in the paper 'Initial Public Offering or Initial Private Placement?' is whether private placements are used, instead of IPOs, to transfer private benefits of control from sellers to buyers. A common contribution of all papers is that we introduce new and unique data on private company share ownership. This data allow us to investigate share allocations questions it has previously been difficult to investigate.


Acknowledgements I am deeply indebted to Professor Øyvind Norli, my supervisor, for all the continued support, guidance and encouragement throughout my time as a PhD student. I would also like to thank Professor Roni Michaely for help and guidance, and for making my stay at Cornell University such a great experience. I am very grateful to François Derrien and Øyvind Bøhren, who gave me many helpful and detailed suggestions on my pre-doctoral defense and who helped me with the job market process. I am grateful to Bruno Gerard for supervising my master degree thesis and for helping me with the job market process and my PhD thesis. I would also like to thank Karin Thorburn, Diane Denis, William Megginson, Paul Ehling, Christopher Vincent, David De Angelis, Alyssa Anderson, Maury Saslaff, Yelena Larkin, Gideon Saar, Jay Ritter, Dag Michalsen and Richard Priestley for support and for commenting on the thesis. I would like to thank my fellow PhD students, Limei Che, Christian Heyerdahl-Larsen, Morten Josefsen, Siv Staubo, Siri Valseth, Nam Huong Dau, Ignacio Garcia de Olalla Lopez, Junhua Zhong, and my friends, Per Helmer Thorkildsen, Henrik Hasner, Kjell Olav Dalen, Jan Kenneth Evanger, Dag Djurovic, Martin Jensen, Per-Eilert Vierli and Øystein Larsen, for support and many interesting economic discussions. Finally, I would like to thank my family, Sølvi Lyngnes, Torbjørn Fjesme, Arvid Lyngnes Fjesme, Sunniva Victoria Fjesme and Hanna Kristiansen, for all the help and support during my time as a PhD student.

Contents
1 Introduction 31.1 Laddering in Initial Public Offering Allocations . . . . . . . . . . . . . . . 41.2 Using Stock-trading Commissions to Secure IPO Allocations . . . . . . . . 41.3 Initial Public Offering or Initial Private Placement? . . . . . . . . . . . . . 4
2 Laddering in Initial Public Offering Allocations 7
2.1 Introduction . . . . . . . . . . . . . . . . . . . . . . . . . . . . . . . . . . . 92.2 Related literature . . . . . . . . . . . . . . . . . . . . . . . . . . . . . . . . 112.3 Predictions and testable implications . . . . . . . . . . . . . . . . . . . . . 12
2.3.1 The IPO laddering hypothesis . . . . . . . . . . . . . . . . . . . . . 132.3.2 Other testable implications of IPO laddering . . . . . . . . . . . . . 14
2.4 The listing process and the incentives to engage in IPO laddering . . . . . 152.4.1 Why investment banks use IPO laddering . . . . . . . . . . . . . . . 152.4.2 Why laddering investors agree to buy more shares . . . . . . . . . . 162.4.3 Why IPO laddering is a problem . . . . . . . . . . . . . . . . . . . . 16
2.5 Data description . . . . . . . . . . . . . . . . . . . . . . . . . . . . . . . . 172.5.1 The IPO sample . . . . . . . . . . . . . . . . . . . . . . . . . . . . 182.5.2 The remaining IPOs . . . . . . . . . . . . . . . . . . . . . . . . . . 182.5.3 Aggregate laddering . . . . . . . . . . . . . . . . . . . . . . . . . . . 182.5.4 Variable explanations . . . . . . . . . . . . . . . . . . . . . . . . . . 19
2.6 Empirical results . . . . . . . . . . . . . . . . . . . . . . . . . . . . . . . . 212.6.1 Optimal holdings . . . . . . . . . . . . . . . . . . . . . . . . . . . . 242.6.2 The effect of IPO laddering . . . . . . . . . . . . . . . . . . . . . . 242.6.3 Robustness and aggregate IPO laddering . . . . . . . . . . . . . . . 24
2.7 Conclusion . . . . . . . . . . . . . . . . . . . . . . . . . . . . . . . . . . . . 24
3 Using Stock-trading Commissions to Secure IPO Allocations 43
3.1 Introduction . . . . . . . . . . . . . . . . . . . . . . . . . . . . . . . . . . . 453.2 Related literature . . . . . . . . . . . . . . . . . . . . . . . . . . . . . . . . 463.3 Theoretical predictions and testable implications . . . . . . . . . . . . . . . 47
3.3.1 The rent seeking view of IPO allocations . . . . . . . . . . . . . . . 483.3.2 The pitchbook view of IPO allocations . . . . . . . . . . . . . . . . . 493.3.3 The academic view of IPO allocations . . . . . . . . . . . . . . . . . 50
3.4 Data . . . . . . . . . . . . . . . . . . . . . . . . . . . . . . . . . . . . . . . 503.4.1 IPO allocations . . . . . . . . . . . . . . . . . . . . . . . . . . . . . 513.4.2 After-listing ownership . . . . . . . . . . . . . . . . . . . . . . . . . 513.4.3 Variable description . . . . . . . . . . . . . . . . . . . . . . . . . . 52
3.5 Empirical results . . . . . . . . . . . . . . . . . . . . . . . . . . . . . . . . 533.5.1 The rent seeking view of IPO allocations . . . . . . . . . . . . . . . 543.5.2 The pitchbook view of IPO allocations . . . . . . . . . . . . . . . . . 553.5.3 The academic view of IPO allocations . . . . . . . . . . . . . . . . . 553.5.4 Robustness . . . . . . . . . . . . . . . . . . . . . . . . . . . . . . . 56
3.6 Conclusion . . . . . . . . . . . . . . . . . . . . . . . . . . . . . . . . . . . . 56
1

4 Initial Public Offering or Initial Private Placement? 734.1 Introduction . . . . . . . . . . . . . . . . . . . . . . . . . . . . . . . . . . . 744.2 Literature review . . . . . . . . . . . . . . . . . . . . . . . . . . . . . . . . 754.3 The road to the listing . . . . . . . . . . . . . . . . . . . . . . . . . . . . . 77
4.3.1 The formal listing process . . . . . . . . . . . . . . . . . . . . . . . 774.3.2 A public or a private offering? . . . . . . . . . . . . . . . . . . . . . 78
4.4 Theoretical predictions and testable implications . . . . . . . . . . . . . . . 794.4.1 The private benefits of control hypothesis . . . . . . . . . . . . . . . 804.4.2 Alternative explanations . . . . . . . . . . . . . . . . . . . . . . . . 814.4.3 Other control measures . . . . . . . . . . . . . . . . . . . . . . . . . 824.4.4 Private benefits of control also after the listing . . . . . . . . . . . . 83
4.5 Data and descriptive statistics . . . . . . . . . . . . . . . . . . . . . . . . . 834.5.1 Descriptive statistics . . . . . . . . . . . . . . . . . . . . . . . . . . 844.5.2 Variable description . . . . . . . . . . . . . . . . . . . . . . . . . . 84
4.6 Empirical Results . . . . . . . . . . . . . . . . . . . . . . . . . . . . . . . . 854.6.1 The private benefits of control hypothesis . . . . . . . . . . . . . . 854.6.2 Alternative explanations . . . . . . . . . . . . . . . . . . . . . . . . 864.6.3 Private benefits of control also after the listing . . . . . . . . . . . . 86
4.7 Conclusion . . . . . . . . . . . . . . . . . . . . . . . . . . . . . . . . . . . . 87
5 Summary 100
2

1 Introduction
This dissertation consists of three papers; ’Laddering in Initial Public Offering Alloca-tions’, ’Using Stock-trading Commissions to Secure IPO Allocations’and ’Initial PublicOffering or Initial Private Placement?’ The rest of this section is organized as follows. Ifirst discuss the common feature of the papers, namely the allocations of Initial PublicOffering (IPO) shares. I then briefly discuss the main results in each of the papers.Stock exchanges have rules on the minimum equity level and the minimum number
of shareholders that are required to list publicly. Most private companies that want tolist publicly must issue equity to be able to meet these minimum requirements. Mostcompanies, that list on the Oslo stock exchange (OSE), are restricted to selling sharesin an IPO to a large group of dispersed investors or in a negotiated private placementto a small group of specialized investors. Initial equity offerings have high expectedreturns and this makes them very popular investments. Ritter (2003) and Jenkinson andJones (2004) argue that there are three views on how shares are allocated in the IPOsetting. First, is the academic view based on Benveniste and Spindt (1989). In this viewinvestment banks allocate IPO shares to informed investors in return for true valuationand demand information. Informed investors are allocated shares because they help toprice the issue. Second, is the pitchbook view where investment banks allocate sharesto institutional investors that are likely to hold shares in the long run. It is argued, byinvestment banks, that buy-and-hold investors will create price stability that is good forthe issuing companies. Finally, is the rent seeking view, or profit sharing view, whereinvestment banks allocate shares to investors in return for kickbacks. There are fourtypes of IPO rent seeking that have been investigated by U.S. regulators (the SEC andthe NASD), see Liu and Ritter (2010). IPO allocations can be tied to future corporatebusiness for the banks (IPO spinning), after-listing purchases of the IPO shares (IPOladdering) and stock-trading commissions. Investment banks and companies can alsoagree on high underpricing in return for after-listing company share coverage from a staranalysts provided by the bank (analyst conflict of interest). Underpriced shares are thenallocated to bank clients that generate high stock-trading commission for the investmentbank. In the paper ’Laddering in Initial Public Offering Allocations’it is investigated ifIPO allocations are tied to after-listing purchases of the IPO shares (IPO laddering). Inthe paper ’Using Stock-trading Commissions to Secure IPO Allocations’it is investigatedif IPO allocations are tied to investor stock-trading commission.Private companies can, as an alternative to the IPO, issue shares in a negotiated
private placement to a small group of specialized investors. Most theoretical papers onequity offerings, however, show that IPOs will almost always be preferred to the negotiatedprivate placement by the seller, see Bulow and Klemperer (1996), Bulow and Klemperer(2009) and French and McCormick (1984). Why some companies use private placementshas therefore been the focus of many empirical studies in finance, see Wruck (1989),Hertzel and Smith (1993), Barclay et al. (2007), Anshuman et al. (2010) and Cronqvistand Nilsson (2005). The research question addressed in the paper ’Initial Public Offeringor Initial Private Placement?’ is whether private placements are used, instead of IPOs, totransfer private benefits of control from sellers to buyers. A common contribution of allpapers is that we introduce new and unique data on private company share ownership.This data allow us to investigate share allocations questions it has previously been diffi cultto investigate.
3

1.1 Laddering in Initial Public Offering Allocations
IPO laddering is the process where share allocations are tied to the after-listing purchasesof the company shares. IPO laddering has been known by regulators for a long time(the SEC sent out warnings to investment banks that laddering is illegal the first timein 1961), but there has been limited empirical research on IPO laddering. A potentialreason for this is that it is very diffi cult to investigate laddering because investment banksrarely distribute information about allocation practices. In this paper we use unique datafrom the Oslo Stock Exchange (OSE) that allow us to observe the after-listing tradingof investors that are allocated IPO shares. The data consists of 16,593 combinations ofinvestor IPO allocations, stock-trading commission and after-listing trading on the OSEin the period from 1993 to 2007. This data allow us to investigate laddering at theinvestor level. The main contribution of this paper is that we show a strong and robustrelationship between IPO allocations and the number of shares that are purchased afternew listings at the investor level. This relationship is stronger for investors that sell allshares again right after the listing, in underpriced IPOs and in IPOs with a positive driftin the share price after the listing. These are the investors and the IPOs that the existingresearch identifies as the most likely laddering investors. These findings are consistentwith the suspicion that IPO shares are allocated to investors that buy shares dictated bythe investment bank after the listing (laddering). This finding extends to Hao (2007) andGriffi n et al. (2007).
1.2 Using Stock-trading Commissions to Secure IPO Alloca-tions
Another concern for regulators is that IPO allocations are tied to excessively large stock-trading commissions and that such a practice is illegal kickbacks from investors to invest-ment banks. Using the same data as in ’Laddering in Initial Public Offering Allocations’,we are able to link stock-trading commission and IPO allocation at the investor level. Themain finding of the paper is a strong and robust positive relationship between the levelof stock-trading commission generated by an investor prior to the IPO and the numberof shares the same investor receives through the IPO allocation. This finding indicatesthat investors are able to buy IPO allocations by trading excessively to generate com-mission. The finding extends to Reuter (2006), Nimalendran, Ritter and Zhang (2006),Ritter (2003) and Jenkinson and Jones (2004) who all argue that investment banks arelikely to allocate IPO shares in return for stock-trading commission.
1.3 Initial Public Offering or Initial Private Placement?
Companies can, as an alternative to the IPO, sell shares in a negotiated private placement.Most theoretical research on equity offerings show that auctions, that are similar to IPOs,will in most cases be preferred by the seller of a company. In practice, however, there aremany companies that use negotiated private placements to raise equity. Several studieshave proposed explanations to this private placement choice. Some papers argue thatprivate placements are used to attract certain investors, to keep management in control,to reduce undervaluation or to reduce problems associated with information asymmetry(Wruck, 1989; Hertzel and Smith, 1993; Barclay et al.,2007; Anshuman et al., 2010;
4

Cronqvist and Nilsson, 2005). Other papers suggests that private placements are usedwhen buyers value private benefits of control over the stand alone cash flow value of thecompany (Zingales, 1994; Zingales, 1995; Zwiebel, 1995 and Damodaran, 2005). Themain contribution of our paper is that we show a strong and robust relationship betweenprivate benefits of control, before the initial offering, and the use of private placements.This indicates that private placements are used to transfer private benefits of control fromsellers to buyers. This finding supports Zingales (1995) in that private placements areused to transfer company control rights.
5

.
6

2 Laddering in Initial Public Offering Allocations
Sturla Lyngnes Fjesme1
BI Norwegian Business School
.
.
.
.
.
.
.
.
JEL classification: G3; G24Keywords: IPO allocations; Laddering; Tie-in agreements; Rent seeking; Equity offer-
ings
1I am very grateful to Øyvind Norli (supervisor), François Derrien, Roni Michaely, Øyvind Bøhren,Bruno Gerard, Karin Thorburn (discussant), Diane Denis (discussant), William Megginson (discussant),Paul Ehling, Christopher Vincent, David De Angelis, Alyssa Anderson, Maury Saslaff, Yelena Larkin,Gideon Saar, and seminar participants at Cornell University, BI Norwegian Business School, the NordicFinance Network (NFN) workshop in Lund 2010, the Financial Management Association (FMA) Doc-toral Student Consortium in Hamburg 2010, Stockholm University, the University of Gothenburg, theUniversity of Warwick and the University of Melbourne for valuable suggestions. I thank the Oslo StockExchange VPS for providing the data, the Financial Supervisory Authority of Norway (Finanstilsynet)and the companies and investment banks that helped locate the listing prospectuses. Part of the articlewas written while I was a visiting PhD student at the S.C. Johnson Graduate School of Managementat Cornell University. I also thank the American-Scandinavian-Association and the Norwegian CentralBank for financial support. All errors are my own.Correspondence: BI Norwegian Business School, Nydalsveien 37, 0484 Oslo, Norway, Email address:
[email protected], Telephone (USA): +1-607-793-6911, Telephone (Norway): +47-957-722-43.
7

Abstract
Tying Initial Public Offering (IPO) allocations of common stock to after-listing purchases in the IPO shares, a process referred to as IPO laddering,has resulted in large-scale investigations of the major investment banks by theSEC and the National Association of Securities Dealers (NASD). This processis claimed to drive after-listing share prices above their fundamental values,and is illegal under the laws against market manipulation and fraud. As aresult, investment banks are reluctant to distribute information about theirallocation practices, so investigating the alleged laddering and its implicationshas proven to be diffi cult. With a new and unique data set of 16,593 IPOallocations on the Oslo Stock Exchange (OSE), we confirm the SEC’s suspicionthat IPO allocations are dependent on after-listing trading. Allocations toafter-listing purchasing investors has been combined with allocations to highstock-trading commissions generating investors that can take advantage of theIPO laddering, thereby allowing investment banks to recapture some of themoney left on the table in IPOs. Allocated IPO investors buy more shares afternew listings because they are rewarded for doing so with more IPO allocations.
8

2.1 Introduction
On December 6, 2000 the Wall Street Journal (WSJ) reported that the SEC and theNASD were investigating some of the major investment banks for tying IPO allocationsto after-listing purchases. An investment banker interviewed for the article admits thatIPO allocations to investors with after-listing interest could occur, but explains thatafter-listing interest is a signal that the investor is of the buy-and-hold type. Since banksstrive to allocate shares to buy-and-hold investors to create price stability, after-listingpurchases are related to IPO allocations. An investor confirms that expressing an interestin after-listing purchases is one way of obtaining more IPO allocations.Three U.S. investment banks have been sued by the SEC over allegations of IPO
laddering after the WSJ article, though all three later settled (without admitting guilt).2
The allegations made by the SEC are that the banks promised investors that they wouldreceive an increased allocation in current hot IPOs if they bought additional shares afterthe listing of the same IPOs.3 The banks, allegedly asked IPO applicants if they wouldbe interested in buying more shares after the listings and at what price and quantity.Since IPO laddering is illegal, there are no formal records of tying IPO allocations toafter-listing trading, as agreements are likely to be made over the phone or in personrather than in a written agreement.4 It is, however, possible to see if there is a positiveand consistent relationship between IPO allocations and after-listing trading by investors.Such a relationship would strongly indicate that IPO allocations are tied to after-listingbuy trades, although this data is very hard to obtain in the U.S. (even for the SEC andNASD). Using data from the Oslo Stock Exchange (OSE), we are able to observe theafter-listing trading of investors that were allocated shares in IPOs. The data consistsof 16,593 IPO allocations with stock-trading commissions and after-listing trading on theOSE in the period from 1993 to 2007. Stock ownership by investor ID is observed for allcompanies throughout the listing process, and is used to calculate actual IPO allocations.It is, from this data that the relationship between IPO allocations, after-listing purchases,commissions and future IPO allocations is investigated.The main contribution of this paper is that we show a strong and robust relationship
between the number of shares that are purchased after new listings and IPO allocationsby laddering investors. This is consistent with the SEC’s suspicion that IPO sharesare allocated to investors that buy shares dictated by the investment bank. We defineladdering as allocated IPO investors that continue to buy shares right after the listingbefore they sell all shares within six months of the listing date. This sales requirementis included to remove rationed investors that buy shares to reach optimal holding levelsafter the listing. We also show that IPO laddering benefits both investors and investmentbanks and that the specified trading can not be attributed to other explanations such asshare rationing. In the 50% IPOs with the highest laddering there is an average aggregateIPO allocation to laddering investors of 4%. On average these investors buy 6% more ofthe aggregate IPO shares after the listing, and then sell on average 10% of the aggregate
2See the litigation releases made by the SEC at http://www.sec.gov/litigation/litreleases/lr18385.htm,http://www.sec.gov/litigation/litreleases/lr19050.htm, and http://www.sec.gov/litigation/litreleases/lr19051.htm.
3There are many news articles and web pages that cover laddering and the laddering casesin the U.S. For excellent overviews please see Deneen and Hooghuis (2001), Aggarwal etal. (2006) and the IPO securities litigation websites at http://www.iposecuritieslitigation.com/,http://www.dandodiary.com/articles/ipo-laddering-cases/ and the articles by Susan Pulliam and RandallSmith, the journalists that first published the laddering scandal in the Wall Street Journal series in 2000.http://www.pbs.org/wgbh/pages/frontline/shows/dotcon/interviews/pulliam-smith.html
4In both Norway and the U.S. IPO laddering is illegal under the law against market manipulation.
9

IPO shares shortly after the listing. As a consequence of this, we are not able to rejectthat IPO allocations are tied to after-listing purchases of IPO shares.The SEC is investigating IPO laddering because laddering falsely increases the price
and demand of specific shares (price manipulation). In addition to being abusive anddiscriminatory, IPO laddering is undesirable because it increases adverse selection prob-lems (by deterring non-laddering investors from applying for IPO shares).5 Investmentbanks use IPO laddering because this practice will boost share prices after the listings.IPO shares that will go up in price for sure can also be allocated to bank clients thatprovide high levels of stock-trading commissions, thereby ensuring a future relationshipbetween banks and investors that generate high levels of income for the banks. We showthat investment banks and laddering inventors earn money on IPO laddering, while mostcompanies with high levels of IPO laddering fall in price in the first six months after thelisting (8 out of 11).IPOs generally have high first day returns (on average 8% in Norway in the sample
period) and IPO shares are therefore very popular investments. Most IPOs are manytimes oversubscribed and few investors are allowed to buy IPO shares. Investment banksare reluctant to distribute information about their allocation practices, and the continuedinvestigation by the SEC and the NASD on investment bank allocation practices has notmade data collection any easier. Ritter (2003) and Jenkinson and Jones (2004) arguethat there are three main views on how IPOs are allocated. First, the academic viewbased on Benveniste and Spindt (1989) is that investors obtain IPO allocations in returnfor revealing their true valuations of the IPO shares. These investors help to price theissue. Second, the pitchbook view argues that IPO shares are allocated to buy-and-holdinvestors, and long-term buy-and-hold investors will create price stability. Finally, therent seeking view argues that IPOs are allocated in return for kickbacks. The types ofrent seeking that have been under SEC investigation are to condition IPO allocationson generated stock-trading commissions, future corporate business (IPO spinning) orafter-listing purchases of IPO shares (IPO laddering), see Liu and Ritter (2010). IPOscan also be intentionally underpriced in exchange for future analyst coverage (analystconflict of interest). There are many articles that have studied both the academic andpitchbook view, but a lack of data has limited the number of articles which have studiedthe rent seeking view.6 Cliff and Denis (2004) show that IPO underpricing is relatedto after-listing analyst coverage, Liu and Ritter (2010) reveal that IPOs are allocated inreturn for IPO spinning and Fjesme, Michaely and Norli (2011) document that IPOs areallocated in return for stock-trading commissions. No empirical papers have been able toestablish a relationship between IPO allocations and after-listing purchases of IPO shares(IPO laddering). Hao (2007) identifies the incentives to engage in IPO laddering and theimplications of IPO laddering theoretically. Griffi n, Harris and Topaloglu (2007) showempirically that it is likely that IPO laddering is used by studying aggregate after-listingtrading at the brokerage house level. Griffi n et al. (2007) find that after-listing buy tradesprimarily go through lead managers, whereas after-listing sell trades go through othermanagers in the weeks after new listings. This is consistent with IPO laddering becauseladdering investors will place their orders through the lead manager as evidence that thetrades have been made. Previous research has not been able to study the relationship
5Laddering is not new. The SEC sent out warnings that laddering was illegal in 1961, 1984 and 2000(Griffi n et al., 2007).
6See, amongst others, Jenkinson and Jones (2004), Ritter (2003) and Fjesme, Michaely and Norli(2011) for papers that summarizes studies on IPO allocations.
10

between IPO allocations and after-listing trading of the IPO shares at the investor leveldue to data limitations.7 The main research question addressed in this paper is whetherinvestors are able to increase allocations in IPOs by committing to buy more shares afterthe listing of the same IPOs. We also investigate whether future IPO allocations are tiedto after-listing purchases in past IPOs.The rest of the paper is organized as follows: Section 2.2 describes related literature.
Section 2.3 describes predictions and testable implications. Section 2.4 describes the IPOprocess and the factors that create the incentives to engage in IPO laddering. Section2.5 describes the data set. Section 2.6 describes the empirical results, and Section 2.7concludes.
2.2 Related literature
The two main theoretical papers that model IPO laddering are Hao (2007) and Aggarwalet al. (2006). Hao (2007) first show the factors that create the incentives to engagein IPO laddering. Then, the effects of IPO laddering on companies are identified. Hao(2007) argue that IPO laddering can benefit the underwriter from two sources. First,IPO laddering can boost the after-listing market price. This will reduce the underwritersexpected cost of price support after the listing. From this it is expected that IPO ladderingwill be stronger when there is a positive drift in the after-listing share price. Second, IPOladdering can benefit the underwriter through rent seeking. If some allocated investors paya part of their profit from IPO allocations back to the underwriter through stock-tradingcommission payments, then a part of the laddering generated profits will go back to theunderwriter. Hao (2007) argue that when the underwriter share in on the profit fromthe underpricing, then laddering is stronger when the realized percentage underpricing ishigher. Hao (2007) also show that expected underpricing increases IPO laddering. Fromthis it is expected that laddering will be stronger when there is a positive underpricing.Hao (2007) also predicts that laddering is positively related to IPO allocations to high
stock-trading commission generating investors. IPO laddering will inflate prices after thelisting, so investment banks use laddering to make share prices go up after the listing(more than they otherwise would have). Shares that go up in price for sure are thenbe allocated to clients that generate high stock-trading commissions. Hao (2007) finallypredicts that laddering will increase the IPO offer price, the first day closing price, themoney left on the table and the long-run underperformance of the newly listed companies.Aggarwal et al. (2006) predict that IPO laddering increases underpricing, turnover andlong-run underperformance of the newly listed companies. These are all effects of anincreased demand of the IPO shares right after the listing that will fall in the long-run.There are three main empirical papers that provide indirect evidence of the existence
of IPO laddering. Griffi n et al. (2007) look at investors who buy shares through leadand other underwriters in the three weeks after the listing of 1,294 Nasdaq IPOs inthe period 1997 to 2002. As opposed to this study, they examine aggregate trading atthe brokerage house level. They argue that the after-listing buy trades through the lead
7Griffi n, Harris and Topaloglu (2007) find that it is very likely that investment banks tie IPO alloca-tions to after-listing purchases. The major difference is that Griffi n et al. (2007) study the after-listingtrading through co and lead managers at the brokerage house level, and we study actual IPO allocationsand after-listing trading on the investor level. Griffi n et al. (2007) show that it is likely that laddering isbeing used by investigating through what manager after-listing buy orders are placed, and we show thatafter-listing buy orders are related to current and future IPO allocations by investors.
11

manager (main underwriter) in the weeks after the listings are likely to be part of ladderingagreements, while buy trades through other managers (co-underwriters that help to spreadthe issue) in the same period are likely to not be part of the agreements. The paper findsthat it is likely that IPO allocations are tied to after-listing purchases because thereare unproportional high levels of buy trades through lead managers after new listings.Aggarwal et al. (2006) study IPOs that have been sued on laddering allegations to testthe implications of laddering. The data includes 33 IPOs sued by the SEC, 140 classaction law suits and 735 non-laddering IPOs on Nasdaq, NYSE and AMEX in the period1998 to 2000. The main findings are that IPO laddering leads to underpricing and long-run underperformance. Ellis (2006) investigates the trading volume in IPO shares afterthe listing for 311 Nasdaq IPOs in the period 1996 to 1997. She shows that investor buytrades through the lead underwriter account for 22% of trading volume after IPOs, andthis is consistent with laddering being used.8
2.3 Predictions and testable implications
An IPO investor is rationed when the number of shares sought in the IPO is larger thanthe allocation. Rationing will lead to a smaller IPO allocation than the applied for sharesfor most investors. Rationed investors may buy more shares after the listing to get tothe desired holding level. This has similar implications as IPO laddering. Griffi n etal. (2007) argue that investment banks may strategically allocate toe-holds to investorsthat the bank knows have higher optimal holding levels (share rationing)9. The bankdoes this in hopes that the investor will buy more shares after the listing to reach theoptimal holding level. It is expected that most optimal holding investors will reach theirdetermined holding level and then hold this in the longer run. Laddering investors, onthe other hand, buy shares right after the listing to fulfill an obligation.10 Many laddering
8There are also three other types of IPO rent seeking that have led to investigations and subsequentsettlements with the SEC or the NASD (Liu and Ritter, 2010). IPO allocations can be dependent onfuture corporate business (IPO spinning), stock-trading commissions or companies can agree to underpriceIPOs in exchange for after-listing company coverage from a star analyst provided by the investment bank(analyst conflict of interest). All of these allocation practices have been investigated in empirical papers.Liu and Ritter (2010) investigate 56 U.S. IPOs in the period 1996 to 2000 and show that IPO sharesare allocated to corporate executives in return for future corporate business (IPO spinning). Cliff andDenis (2004) show that IPO underpricing is positively related to the after-listing coverage by the leadunderwriter and an all star analyst (analyst conflict of interest). Nimalendran, Ritter and Zhang (2007),Reuter (2006) and Fjesme, Michaely and Norli (2011) show that IPO allocations are related to stock-trading commissions.
9The SEC makes a big point about selling shares early in their cases. It is claimed that banks frequentlyallocated shares to investors that had no plans of holding the shares in the long run. Apparently, thebanks asked the investors if they would agree to buy more shares after the listing and not if the investorswere planning to hold the shares in the long run. If the reason for the after-listing purchases is to increaseallocations, then this is laddering.
10Allocated IPO investors that buy more shares after new listings can be explained by either IPOladdering or by IPO share rationing. Most of the IPO first day return takes place between the offer priceand the first day opening price (not between the first day opening and the first day close). This meansthat any additional purchased shares have an expected return commensurate with risk and nothing more.It is therefore expected that investors that buy more shares after the listing do so because they want tohold more of the specific stock in their portfolio. If there is laddering, there should then be a strongerrelation between after-listing purchases and allocations for short term investors. Short term investors aremore likely to be laddering investors than long term investors.
12

investors will therefore sell their shares when the agreement is completed. The argumentis not that laddering investors will always liquidate their holdings early. The argumentis that investors that buy more shares because of optimal holding are more likely to holdtheir shares in the long-run. Some laddering investors are likely to hold their shares in thelong-run as well, but some laddering investors will also liquidate their shares early becausethey have no interest in holding the shares. It is important to note that the intention ofthe after-listing buyer to buy-and-hold does not remove the possibility of IPO laddering(Griffi n et al., 2007).11
Optimal holding is also not a very good explanation for the observed after-listingbuying in Norway. Investment banks rank investors on A, B and C lists before the IPOallocations.12 We do not know how investors are placed on the lists, but we believe thatit is related to the investors’past trading characteristics. Investors on the A list are likelyto be rationed less than investors on the B list, and investors on the B list are likely to berationed less than investors on the C list. It is therefore expected that IPO applicants onthe A list are awarded a big allocation and will buy few shares after the listing. Investorson the C list will be allocated few shares and will therefore buy many shares to reachtheir optimal holding level. This will create a negative correlation between the number ofshares allocated and the number of shares purchased after the listing for these investors.
2.3.1 The IPO laddering hypothesis
Hao (2007) argue that there are two reasons why underwriters use laddering. First, Hao(2007) argue that banks use laddering to boost prices after the listing. Boosted pricesare good for investment banks because the expected price support cost is then reduced.IPOs with boosted after-listing prices will also be viewed as more successful. Second,Hao (2007) argue that when the underwriter share in on the profit from the underpricing,laddering is stronger when the realized percentage underpricing is higher. Hao (2007) alsoshow that expected underpricing increases IPO laddering. (It is likely that the expectedunderpricing is highly related to the realized underpricing). If there is IPO laddering, it isexpected that the relationship between allocations and after-listing purchases is strongerwhen the realized underpricing is higher. From Griffi n et al. (2007) and the first argumentin Hao (2007) we expect that laddering is more likely when there is a positive drift inthe share price after the listing (boosted price) and after-listing investors sell their sharessoon after the listing date. This is formalized in H0.1. From Griffi n et al. (2007) andthe second argument in Hao (2007) we expect that laddering is more likely when there isa positive underpricing and after-listing investors sell their shares soon after the listing.This is formalized in H0.2. If the relationship between IPO allocations and after-listingpurchases is explained by share rationing, there is no reason why the relation should bestronger in IPOs where investors sell their shares soon after the listing, the price increasein the first week after the listing and the IPO is underpriced. This is formalized in HA.
11Griffi n et al. (2007) test between IPO laddering and optimal holding by studying how the aggregateinstitutional holding percentage evolves from the listing date to the first quarter and the first year afterthe listing. They argue that laddering investors are mainly institutional, so the aggregate institutionalholding percentage should go down in companies with IPO laddering - since laddering investors will reducetheir holding percentage and optimal holding investors will not. In the Norwegian data we observe thatthe investors are allocated IPO shares buy more IPO shares after the listing and then sell shares soonafter the listing. It is more likely that investors that follow this three stage IPO share investment processare laddering investors than optimal holding investors.12Information about allocation practices are obtained from meetings with former investment bankers
in Norway.
13

H0 and HA are tested by regression equation (1).13 If the relationship between allocationsand after-listing shares is significantly stronger for (After-listing shares/shares issued)%i
* D1 * D2 * D3 than for (After-listing shares/shares issued)%i, then we are not able toreject H0. This will, however, reject HA.
H0.1: The relationship between allocations and after-listing purchases is stronger wheninvestors sell all shares within six months after the listing and the price after one weekexceed the first day closing price.
H0.2: The relationship between allocations and after-listing purchases is stronger wheninvestors sell all shares within six months after the listing and the first day closing priceexceeds the offer price.HA: The relationship between IPO allocations and after-listing purchases is the same
for all investors.
(1) (Allocated shares/shares issued )%i= α+ β1(After-listing shares/shares issued)%i
+ β2(After-listing shares/shares issued)%i * D1 * D2 * D3 + β[Control variables] + εi
2.3.2 Other testable implications of IPO laddering
There are two other testable implications of IPO laddering besides that relation betweenafter-listing purchases and IPO allocations. First, it can be tested if IPO laddering isbeneficial for investors. In hot IPOs it is expected that investors that buy more sharesafter the listing will earn money because they are allocated an increased portion of hotshares. It is possible that the investors either lose or earn money on the additional sharespurchased after the listing (this is uncertain and can go both ways according to an e-mailby Goldman Sachs referred to in the SEC release), but it is expected that buying moreshares should be profitable overall. Money earned on the hot IPO allocations shouldoutweigh any loss on the additional shares. This is tested by investigating if ladderinginvestors earn money overall. In cold IPOs it is expected that the investors earn moneyon future IPO allocations. Although investors are not enthusiastic about cold IPOs it isexpected that investors will follow through with the laddering to not be excluded fromfuture IPOs, see Griffi n et al. (2007). This is tested by regressing past laddering on futureIPO allocations.Second, it can be tested if IPO laddering is beneficial for investment banks. Investment
banks tie allocations to after-listing purchases partly to earn money on stock-tradingcommissions. Laddering investors buy more shares after new listings so total IPOs withladdering increase more in price than IPOs with no laddering. Investment banks canthen charge more stock-trading commissions for IPO allocations with laddering, see Hao(2007). If this is the case, there will be a relation between stock-trading commissiongenerated before IPOs, by non-laddering allocated investors, and the aggregate after-listing purchases made by laddering investors. This is tested by regressing the aggregated
13D1: A dummy that takes the value of one if the investor have sold all allocated and after-listing shareswithin six months of the listing date.D2: A dummy variable that takes the value of one if there is a positive drift in the share price in the
week following the listing (from the first day closing price to the first week closing price).D3: A dummy variable that takes the value of one if the IPO have a positive underpricing.
14

IPO after-listing purchases made by the laddering investors on the average commissiongenerated per share before the IPO (by the non-laddering allocated investors).
2.4 The listing process and the incentives to engage in IPO lad-dering
The OSE requires that companies have suffi cient levels of equity to survive for 12 monthswithout a positive cash flow after a listing. The OSE also requires that public companiesmust have a minimum number of owners before they can list (500 for the main list).14
This means that most companies need to issue equity before they are able to list publicly.Table 1 gives the annual distribution of IPOs on the OSE in the sample period. Mostcompanies are assisted by an investment bank in their equity issuance and in the listingprocess. The investment bank makes a list with proposed IPO allocations that is given tothe board of the issuing company for approval. Anecdotal evidence suggests that this listtypically is approved without adjustments. Investment banks and investors have differentreasons for why they participate in IPO laddering. Regulators investigate IPO ladderingbecause it is manipulative.15
2.4.1 Why investment banks use IPO laddering
IPO laddering can be advantageous for investment banks in both hot and cold IPOs.There are two main reasons why investment banks use IPO laddering in hot IPOs. Firstly,investment banks can earn money on combining allocations to investors that generate highstock-trading commission and to laddering investors. IPO laddering will boost pricesafter the listing. This will give the companies attention as more successful IPOs (Hao,2007; Aggarwal et al., 2006; Griffi n et al., 2007). Secondly, IPO laddering will increaseunderpricing. The IPO allocations will then be valued higher by investors that are willingto pay stock-trading commissions to obtain allocations (Hao, 2007; Aggarwal et al., 2006).In related papers, Reuter (2006), Nimalendran et al. (2006) and Fjesme, Michaely andNorli (2011) show that stock-trading commissions are related to IPO allocations.Laddering can also be beneficial for investment banks in cold IPOs. IPO laddering
will reduce the after-listing price uncertainty in cold IPOs. This is good for investmentbanks because IPOs that fall in price may cause reputation damage (and price supportif used without over allotment options is potentially expensive) (Hao, 2007; Aggarwal etal., 2006; Griffi n et al., 2007). Investment banks use IPO laddering to earn more moneyon stock-trading commissions, to increase the likelihood of successful IPOs and to reducethe risk of after-listing price falls.16 The after-listing purchases will also increase directcommission from the extra trades. According to Griffi n et al. (2007), it is uncertainwhether laddering is more beneficial for the investment banks in hot or cold IPOs.17
14The information about the listing process is obtained from the seminar “The road to the listing”November 3, 2009 by Deloitte Public Accountants and the Oslo Stock Exchange and from meetings withformer investment bankers in Norway.15Figure 1 describes the incentives to engage in IPO laddering for the different market participants.16It is probably more common that bidders will offer laddering than that banks require laddering.
Investors will offer laddering if they believe that this will increase allocations and lead to future allocations.Hao (2007) argues that it does not matter for the effect of laddering if it is bidder or investment bankinitiated.17Laddering in cold IPOs creates a relation between after-listing purchases and future allocations (not
necessarily between allocations and after-listing purchases). Laddering in hot IPOs will create a relationbetween allocations and after-listing purchases in specific IPOs.
15

2.4.2 Why laddering investors agree to buy more shares
Investors agree to buy more shares after cold IPOs to get future allocations in hot IPOs.Investors are not likely to be enthusiastic about laddering in cold IPOs, but investors whowant continued access to future hot IPO allocations are likely to follow through with theagreements (Griffi n et al., 2007). Investors accept laddering in hot IPOs in order to getmore allocations in the specific IPOs. Laddering investors may either earn or lose moneyon the extra shares purchased after the listing, but it is expected that the return of thehot allocated shares will outweigh any loss on the additional shares.18 Investment banksdo not require laddering by all investors. Griffi n et al. (2007) argue that laddering ispre arranged buying support by large institutional clients. It is easier to control that theshares are purchased when there are only a few investors involved.
2.4.3 Why IPO laddering is a problem
The reason why the SEC is investigating IPO laddering is because laddering violates bothanti-price-manipulation and anti-fraud regulations. Laddering will falsely increase priceand demand in specific shares. Investors who are not aware of the laddering will buyshares on false market demand information. Regulators (the SEC) try to ensure that theIPO allocation process is fair and open to all investors. Any abusive allocation practiceswill not be tolerated. Laddering is a problem because it is discriminatory against investorsthat are not willing to engage in price manipulation to receive IPO shares. In a fair IPOwith high demand the offer price will increase and more money will go to the issuingcompany. In an IPO with laddering the price will go up after the listing and more moneywill go to the allocated investors.Other investors can also lose money on IPO laddering. The investors that are allocated
less (or no) IPO shares because the laddering investors are allocated more hot shares aremissing out on good investment opportunities. Non-allocated investors that buy sharesafter the listing lose money if the laddering investors sell their shares so that prices fallafter the listing. IPO laddering will also increase adverse selection problems. Wheninvestors know that it is possible to buy allocations with after-listing trading, it is notlikely that investors will participate in IPOs. Investors that do not provide any form ofkickback will not want to participate in IPOs because they expect shares to be overpricedwhenever they are offered allocations.The allegation made by the SEC is that investment banks have promised investors
that they will get favorable IPO allocations if they buy additional shares after the listingof the same IPO.19 The banks have, allegedly, asked IPO share applicants if they areinterested in buying more shares after the listings and at what prices and quantities. Thebanks have also allocated shares to investors with after-listing interest -investors the banks
18See the litigation releases made by the SEC at http://www.sec.gov/litigation/litreleases/lr18385.htm,http://www.sec.gov/litigation/litreleases/lr19050.htm, and http://www.sec.gov/litigation/litreleases/lr19051.htm.19Three U.S. Investment banks that have been sued and later settled with the SEC on IPO laddering
allegations. None of the banks have admitted to the laddering charges, but all banks have agreed to paypenalties of $40 million (Morgan Stanley), $40 million (Goldman Sachs) and $25 million (J.P. Morgan).The charge by the SEC is that the banks have violated Rule 101 of Regulation M under the Securities andExchange Act of 1934. This rule is, among other things, in place to prohibit underwriters in a restrictedperiod, prior to their completion of the distribution of the IPO shares, from bidding for or attemptingto induce any person to bid for or purchase any offered security in the aftermarket. Regulation M isdesigned to prohibit activities that can artificially influence the market and the perceived demand of theIPO shares.
16

knew were likely to sell their shares soon after the listing (laddering investors). The bankshave made follow up calls to investors that indicated after-listing interest to make surethe purchases are made. Arguably, the only reason investors have provided after-listinginterest is because the investors understand that this will help them get favorable IPOallocations. Banks and investors have agreed that investors will buy after-listing sharesproportional to the allocations they receive.20
2.5 Data description
There are 403 new listings on the OSE in the period January 1993 to September 2007(210 of the 403 companies listed through IPOs)21. New listings are identified from theannual statistics published by the OSE. Allocation dates are collected from the IPOlisting prospectuses. One listing requirement on the OSE is that all shareholders mustbe registered in the Norwegian Central Depository (VPS) before the listing. The numberof shares owned by each investor must be given to the VPS before any company can listpublicly. This database is 100% accurate, as it is not possible to list otherwise. TheVPS database includes month end ownership by all shareholders in all companies thatare publicly listed or intend to list publicly. Some companies list in the VPS databaseyears before the listing. Other companies list in the VPS as part of the listing process.See Figure 3 for a detailed description of the timeline in the listing process.IPO allocations are obtained from the VPS database by taking the difference in com-
pany ownership before and after IPO allocation dates. We only investigate IPO allocationsto new shareholders. More allocations to existing shareholders, if any, are not included inthe analysis. All companies list in the VPS, sell shares in the IPO and list on the OSE.There are three dates that are important in the listing process to determine IPO alloca-tions,: -when companies list in the VPS ownership database, when companies distributeshares in the IPO and when companies list on the OSE. All three dates influence data onIPO allocations. Companies do this process in different orders, and this leads to differentlevels of the obtained IPO allocations.There are 15 savings banks (PCC list) out of the 210 IPOs on the OSE in the sample
periods. In total, 14 and seven of these savings banks are in the 185 IPOs with allocationdata and in 30 exact sample respectively. These banks are owned by the bank guaranteefund before they are publicly listed. All results remain unchanged if the banks are includedin the analysis or not. These savings banks are removed in the main analysis because itcan be argued that these banks are causing the results. The savings banks does nothave previous owners before the listing, so it can be argued that different investors tryto gain control over these companies after the listing. Investors who are not able to getcontrol will eventually sell their shares. This will create similar findings, as the ladderinghypothesis, for these savings banks.
20In addition to these allegations, the NASD claims that J.P. Morgan tied cold IPO allocations to hotIPO allocations and that J.P. Morgan allocated hot IPO shares to investors in the return for acceptingcold IPO allocations. This is also part of the J.P. Morgan settlement. Hao (2007) explains that IPOorder books often have investors that are marked with the number of shares that will be purchased afterthe listing.21In total 14 savings banks listed on the PCC list of the OSE are removed from the analysis. Most of the
PCC companies are listed by the Norwegian bank guarantee fund. When including the PCC companiesthe findings remain unchanged.
17

2.5.1 The IPO sample
When the listing in the VPS database, the IPO allocation and the listing on the OSE are inseparate calendar months, we are able to calculate exact IPO allocations (the ownershipdata is in monthly observations). Group one companies list in the VPS in good timebefore the IPO. These companies also list on the OSE in a separate calendar month fromthe IPO (for most companies, the IPO is in the calendar month right before the listingmonth). For group one companies the IPO allocations are completely accurate. Thereare 16,593 IPO allocations in group one companies (23 IPOs). After-listing purchases arethe increase in the number of shares by the allocated investors from the IPO allocationto the end of the listing month (and to the end of the month after the listing).22
2.5.2 The remaining IPOs
The data set also includes 158,789 IPO allocations in 148 IPOs that are used in robustnesstests.23 The allocations in these IPOs include either some existing owners or some after-listing trading. Group two companies list in the VPS in good time before the IPO, butthey list on the OSE in the same calendar month as the IPO allocation month. Thesecompanies have allocations that include the actual IPO allocations and some after-listingtrading. These IPO allocations includes from one to 30 days of after-listing trading.The companies in group two are used to test the relationship between past and futureafter-listing IPO holdings.
2.5.3 Aggregate laddering
There are 317 investors who sell all allocated and all after-listing shares within six monthsof the listing date in IPOs with a positive underpricing (in the 50% IPOs with the highestladdering). The aggregate allocations to these investors is 4% of the IPO shares. Theybuy in aggregate 6% of the IPO shares after the listing. Within six months they havesold all IPO shares (in aggregate 10% of the IPO shares). There are 174 investors whosell all allocated and all after-listing shares within six months of the listing date in IPOsthat appreciate in price in the week after the listing (in the 50% IPOs with the highestladdering). The aggregate allocations to these investors is 5% of the IPO shares. Theybuy in aggregate 8% of the IPO shares after the listing. Within six months they havesold all IPO shares (in aggregate 13% of the IPO shares).
22Shares sold over the counter (OTC trading) in the period between the allocation day and the endof the allocation month will not be detected in the data. Investors that buy shares in the OTC marketbetween the allocation day and the end of the allocation month will be treated as allocated investors.OTC trading is, however, expected to be a very small issue. It is unlikely that many investors that havebeen allocated IPO shares will sell these shares in the weeks before the listing. The average number ofdays between payment date in the IPO (when shares are transferred) and the listing date is just belowtwo weeks23The reason it is 148 IPOs and not 172 (195-23=172) is because in 15 IPOs it has not been possible
to calculate IPO allocations from the ownership data. These companies are listed in the VPS in thesame month as the listing month. These companies are therefore removed from the sample. In 6 IPOsit has not been possible to locate the pricing information. These IPOs are therefore not included in theanalysis. There are three privatizations in the period that are removed.
18

2.5.4 Variable explanations
IPO level characteristics are given in Table 2. Market value is the total market value(in USD) at the listing date of the IPO company. This is calculated as the number ofoutstanding shares times the first day closing price. Book/Market is the book to marketratio of the IPO company at the listing date. This is calculated as the book value ofequity, after the IPO, divided by the market value. Offer price is the IPO offer price (inUSD) reported in the listing prospectus or in the newspapers. VC dummy is a dummyvariable that takes the value of one for companies with venture capital backing. High-tech dummy is a dummy variable that takes the value of one for IT -companies. The IPOcompany variables are used to control that the results are not driven by company specificcharacteristics. Market value and the book to market ratio are included in the regressionsto make sure that company size is not driving the results. Offer price is included to makesure that it is not very high or low priced IPOs that drive the results. The VC dummyand the high-tech dummy are included to make sure that the results are not driven byventure capital backing or high technology companies. All regressions include IPO andyear fixed effects. These are dummy variables that take the value of one for each of thecompanies and sample years.Investor characteristics, for the investors on the OSE in the period 1993 to 2007,
are described in Table 3. (After-listing shares/shares issued) % is the additional sharespurchased after the listing divided by the total number of shares issued in the IPO.24 Theafter-listing shares are calculated as the share increase from the IPO allocation to theend of the listing month for the 23 sample IPOs. (We also include the share increase tothe end of the month after the listing because some companies list late in the month andIPO laddering may go on as long as three weeks after the listing, see Griffi n et al., 2007).For the remaining IPOs the share increase is measured from the end of the listing monthto the end of the month after the listing. This is likely to underestimate the after-listingpurchases in the IPOs used for robustness. D1 is a dummy variable that takes the valueof one if the investor have sold all allocated and after-listing shares within six months ofthe listing date. D2 is a dummy variable that takes the value of one if there is a positivedrift in the share price in the week following the listing (from the first day closing priceto the first week closing price). D3 is a dummy variable that takes the value of one if theIPO have a positive underpricing. (Allocated shares/shares issued) % is allocated sharesto each investor divided by the total number of shares issued in the IPO.25 This is thepercentage allocation of shares given to each investor in each IPO. Previous laddering isthe accumulated number of times an investor has laddered divided by the accumulatednumber of times the investor has participated in IPOs. This is a measure of how frequently
24The number of shares sold in the IPO is the number of actual shares sold to new shareholders fromthe VPS database. In the listing prospectuses the number of shares sold is often listed as a range. E.g. inthe Aqua Bio IPO the listing prospectus says that the number of shares sold will be between 1.2 millionand 4 million shares. It is also uncertain if Over Allotment Options (OAO) is used or not. This mayincrease the number of shares sold from the listing prospectus to actual shares sold up to 20%. E.g. inthe Nutri Pharma IPO the minimum number of shares sold is 10 million. The lead manager is given 2million extra shares in an OAO. From the prospectus it is impossible to know the exact number of sharesthat will actually be sold. This number is observable in the VPS database.25(Allocated shares/shares issued) % is trimmed at 1% at the total 171 IPO level to remove the highest
IPO allocations. These allocations are not likely to be made to investors based on trading characteristics.This is included to be consistent with Fjesme, Michaely and Norli (2011). This trimming has no influenceon the findings in this article.
19

an investor engages in laddering, relative to its total participations in IPOs.26
Commission is the accumulated commission (in USD) generated by each investor inthe two years before the IPO allocation dates.27 Commission is calculated as the monthlyportfolio turnover times share prices and a fixed percentage commission rate (0.075%).The 0.075% commission rate is the average used by 15 Norwegian brokerage houses.Commission is calculated as buy generated commission only. Generated commission belowthe minimum rate is replaced by the fixed minimum fee for one transaction ($15). Portfoliovalue is the total investor portfolio value (in million USD) for each allocated investor at31.12.xx in the year before the IPO allocation date. This is calculated as the shares heldat 31.12.xx times the appropriate share prices. Financial institution dummy is a dummyvariable that takes the value of one for investors that are either Norwegian or foreignfinancial institutions.Previous IPOs is the accumulated previous IPO participations by the investors di-
vided by the accumulated number of IPOs in the sample.28 This is used to measure howmany IPOs, out of all possible in the sample, each investor has participated in. Pre-vious buy-and-hold is the accumulated previous number of times the allocated investorhas been a buy-and-hold investor divided by all previous IPO participations. This is thenumber of times, out of all previous IPO participations, the investor has held some ofthe IPO allocated shares for more than six months after the listing. Previous flipping isthe accumulated number of times the investor has flipped previous IPOs divided by allprevious IPO participations. Flipping is when all shares are sold within one month aftera listing. This is the number of times, out of all previous IPO participations, the investorhas held all IPO allocated shares for less than one month. The previous trading variablesare used to control that the results are not driven by investor size, trading activity orholding periods.Other control variables includes the Percentage change in pricing range that is the
change from the midpoint in the pricing range to the offer price in book-building IPOs.This variable measures price information collected in the book-building period, see Ljungqvistand Wilhelm (2002). Number of sentiment investors is the number of allocated retail in-vestors that buy less than 1,000 shares in the IPO. We use this as our sentiment measureas we believe that small retail investors are more sentiment driven in their IPO applica-tions as they spend less time on fundamental analysis, see Kumar and Lee (2006). Averagecommission per share is calculated as the total commission generated by non-after-listingpurchasing investors in the 24 month period before the IPO divided by the number ofshares allocated in the IPO. This is the average dollar generated commission per share be-
26An investor that has participated in one IPO and bought more shares after the listing and then soldshares will take the value of 1 (1/1). An investor that has participated in two IPOs and bought and soldmore shares after the listing in one of these IPOs will take the value of 0.5 (1/2).27Commissions are generated from monthly data and not daily data.28Many IPOs are underwritten by more than one investment bank. If there is more than one investment
bank involved in the IPO, the bank that appears on the top left of the front page of the listing prospectusis assumed to be the lead investment bank. Carter and Manaster (1990) use the investment bank thatappears top left on the tombstone as the lead investment bank. In most IPOs there are also co-managersthat help with spreading the shares. Co-managers will allocate shares to their own clients. Investmentbanks can be co-managers in many IPOs, and this creates the situation where investors can be allocatedshares as a reward in an IPO by another lead bank. There are also some mergers between investmentbanks in the period and this will also create the situation where award shares can come from other leadbanks. Because of this, we investigate past trading behavior in all past IPOs in relation to current IPOallocations. We also study IPOs by one single bank separately. When this is done, we only investigatepast trading in the IPOs where the one bank has been the lead.
20

fore the allocation (by non-laddering investors). Combined commission % is calculated asthe commission generated by all the allocated investors in the 24 month period before eachIPO divided by the accumulated commission generated by all the allocated IPO investorsin the 24 month period before all IPOs. Average commission and Combined commissionare used to measure how important stock-trading commission is for allocations in eachspecific IPO. These variables measure if there is a relationship between commission gener-ated before an IPO (by the allocated investors) and the aggregated after-listing purchasesof the IPO shares.We do not know the exact oversubscription numbers in each IPO. Normally, oversub-
scription numbers are used to define if IPOs are hot (popular/oversubscribed) or cold(less popular/undersubscribed). We proxy for hot/cold by a dummy that takes the valueof zero if there is negative first day return (cold) and one otherwise (hot). We expect thatunderpriced IPOs are hot and non-underpriced IPOs are cold.
2.6 Empirical results
From Table 4 it can be seen that there is a positive relationship between IPO allocationsand after-listing purchases (regression 1). This relationship is significantly stronger forinvestors who sell their shares soon after the listing (regression 2). The relationship isalso significantly stronger for investors that sell all shares soon after the listing in IPOswith a positive drift in the share price in the week after the listing (regression 3). Thisis consistent with H0.1. The relationship is also significantly stronger when investors sellshares soon after the listing and the IPO have a positive realized underpricing (regression4). This is consistent with H0.2. The relationship between allocations and after-listingpurchases is also significantly stronger for investors that sell all shares soon after thelisting, in IPOs with a positive underpricing, and in IPOs with a positive drift in theshare price after the listing (regression 5). The point estimate for the allocation andafter-listing purchase relationship is typically two to five times as large for the caseswhere H0 specify that the relationship should be stronger.The relationship is also economically significant. The coeffi cient between allocation
and after-listing purchases is about 0.25. This means that for each 1% of the issues that isallocated these investors buy 4% more after the listing, controlling for all other variables.The average number of shares purchased after the listing is close to 7,000 shares for the 427laddering investors. This indicates that the allocation rule is that investors who committo buy 7,000 shares after the listing are allocated close to 2,000 more shares in the IPOs.The results are robust to how many shares and how early the shares must be sold
for investors to be regarded as laddering investors. The results remain unchanged wheninvestors who have sold 50% of their shares within three months of the listing date areregarded as laddering investors. The relationship between IPO allocations and after-listing purchases is significantly stronger for investors that sell 50% of total shares withinthree months after the listing, in IPOs with a positive underpricing, and in IPOs with apositive drift in the share price after the listing than for other investors (regression 6).The relationship is also significantly stronger for investors that sell 50% of total shareswithin six months after the listing, in IPOs with a positive underpricing, and in IPOs witha positive drift in the share price after the listing (regression 7). This is consistent withH0.29 Most of the control variables are unrelated to the level of allocations. Generated29Both allocated shares and after-listing shares are scaled by the number of shares issued in the IPOs.
21

stock-trading commission is positively related to allocations. This indicates that ladderinginvestors are active investors.To make sure that the results are not driven by the other allocations views suggested by
Ritter (2003) and Jenkinson and Jones (2004) we control for these views in all regressions.To control for the pricing information view (the academic view) we include a dummyvariable that takes the value of one for all professional investors (financial institutiondummy). If there is allocation to buy-and-hold type investors, there will be a relationbetween holding periods and IPO allocations (buy-and-hold view). This is controlled forby including the past IPO holding period of the allocated investors in all regressions (pastbuy-and-hold and past flipping). Neither of these variables are consistently related toallocations. It is also possible that allocations are made to commission generating investorsonly (rent seeking view). This view is controlled for, and ruled out by including theportfolio value and the generated commission before the IPOs by the allocated investorsin the regressions.30
In Table 5 the relation between past IPO laddering and future ownership of IPO sharesis investigated more closely. If there is IPO laddering, it is expected that investors maybe rewarded with allocations in future IPOs as well. Testing the relation between pastladdering and future allocations is hard in the 23 IPO sample because there may be sometime between each observed IPO. This is therefore tested on the full sample where IPOallocations include after-listing trading. Here we test whether investors that buy more(and then sell) shares after the listing of IPOs also hold shares after the listing of futureIPOs. In Table 5 all 171 IPOs (with 175,382 IPO allocations) are investigated. Mostof these IPOs are of group two allocations. This means that the IPO allocations maybe overestimated and the after-listing purchases may be underestimated in these IPOs.31
Therefore, we are not studying allocations. Rather, this table investigates whether pastafter-listing buying leads to future after-listing holding of IPO shares.In Table 5 we regress after-listing holdings of IPO shares on the number of times in the
past (out of all IPO participations) allocated investors have bought (and then sold) moreshares after IPOs. There is a strong relation between past IPO laddering and shares heldafter future IPOs. This indicates that banks tie IPO allocations together. This indicatesthat IPO shares are also rewards for past laddering in IPOs.32 There is a consistent
There are very different numbers of shares sold in each IPO. Capital raised depends on both the numberof shares and on the offer price in the IPO. The numbers we are interested in are therefore allocatedshares and after-listing shares in percent of issued shares. This tests the relationship regardless of thenumber of shares issued in the IPO. We also regress allocated shares on after-listing shares directlywithout adjusting for issued shares in all regressions. This does not alter the findings. There are somechanges to significance levels and adjusted R —squares, but the results remain the same (not reported).30We are not able to control for IPO spinning. IPO spinning is when IPO shares are allocated to
company executives for future corporate business. Spinning will not generate the same implications asIPO laddering, so we argue that this is not a problem.31These shares are still purchased by the investors. Aftermarket purchases for group two IPO allocations
are calculated as the share increase from the end of the listing month to the end of the month after thelisting. This means that all of these investors have an increase in the IPO shares in this period. Allof these investors are buying shares after the listing of IPOs. These investors also hold significantlymore IPO shares in subsequent IPOs. Table 5 shows that investors who hold shares after the listing ofIPOs, before they buy more shares in the following month, also hold more shares of future IPOs. This isconsistent with the laddering story. We cannot show that IPO allocated investors who buy more sharesafter a listing are allocated more hot IPO shares, but we show that investors who buy more (and thensell) shares after the listing of an IPO have more IPO shares in their future portfolios.32Past aftermarket buying is less statistically and economically related to IPO allocations in the 20
IPOs by the least active investment banks (not reported). The tie-in agreement variables are highly
22

negative relationship between past buy-and-hold and IPO allocations. Investors are notallocated shares because they repeatedly hold their shares in the long-run. Investors are,however, punished for flipping shares in the past. Flipping investors are kept out of futurehot IPOs. These findings also show that investment banks keep records of how investorstrade in IPOs. The banks use these records in their future IPO allocations. This isconsistent with the SEC releases where it is claimed that banks track investor tradingand use this in their future allocation decisions.From Table 6 it can be seen that investors are able to earn a profit from IPO laddering.
For allocated shares the monetary return is calculated as the number of allocated IPOshares times the first day and first month return. For shares purchased after the listing themonetary return is calculated as after-listing shares times the first month return. It is clearthat the profit earned from hot IPO allocations outweighs any loss from the after-listingpurchases. Table 6A show that the average return made by the 357 investors who ladderin IPOs with a positive realized underpricing have a positive return overall. This is alsotrue for the 195 investors who ladder in IPOs with a positive drift after the listing (Table6B). The 70 investors (427 laddering investors - 357 laddering investors in hot IPOs) thatladder in cold IPOs are earning a profit in their overall IPO participation. This indicatesthat these investors are rewarded in future IPOs for their cold IPO laddering (Table6C). The 23 IPO sample is also split into high and low laddering IPOs based on the 427investors who sell all shares within six months of the listing. Non-allocated investors thatbuy shares after the listing in the high laddering IPOs are losing money on average (Table6D). This is not true in the IPOs with low laddering (Table 6E). Overall, this shows thatIPO laddering is profitable for laddering investors. However, IPO laddering is very badfor non-allocated IPO investors that buy shares after the listing.From Table 7 it can be seen that there is a positive relationship between aggregate
after-listing buying in each IPO (by the investors who sell all shares within six monthsof the listing) and the average commission generated by other allocated investors beforethe IPO. This is an important condition for IPO laddering to take place. A main reasonwhy an investment bank would engage in IPO laddering is to increase revenue by sharingin on the money left on the table. Investment banks combine IPO allocations to ladder-ing investors and stock-trading commission investors, and thus create a positive relationbetween after-listing buying and commissions generated by the allocated investors beforethe IPO. Laddering investors increase prices after the listing, and commission investorspay more stock-trading commission for shares that will increase in price for sure. Theinvestment banks earns more money from stock-trading commissions in the IPOs wherethere are more shares purchased after the listing. The data is consistent with that in-vestment banks combine IPO allocations to high stock-trading commission investors andladdering investors.
related to IPO allocations in the IPOs by the most active investment bank (not reported). The resultsindicate that active IPO investment banks are able to use tie-in agreements. The reason why investors gothrough with the tie-in agreements, and buy more shares after the listing, is to avoid being blacklisted infuture IPOs. An active investment bank will have a more reliable threat than less active banks. There isno relationship between IPO allocations and aftermarket purchases by Norwegian government investors.This is also as expected. The findings are consistent with Pulliam and Smith (2000), Ritter (2003),Aggarwal et al. (2006), Hao (2007) and Griffi n et al. (2007).
23

2.6.1 Optimal holdings
We reject the hypotheses that the relation between IPO allocations and after-listing buy-ing is driven by optimal holding of shares. There is a stronger relationship between IPOallocations and after-listing purchases for investors that sell all shares soon after the list-ing, in IPOs with a positive underpricing, and in IPOs with a positive drift in the shareprice after the listing. There is also no relationship between IPO allocations and pastbuy-and-hold. Investment banks do not allocate shares to investors because they are ex-pected to be buy-and-hold based on past trading. Therefore, the after-listing purchasesare not simply a result of investors trying to reach their optimal holding levels. We rejectHA.
2.6.2 The effect of IPO laddering
We find indications that laddering is affecting company long-run returns negatively afterthe listing (not reported).33 The 11 companies with high levels of IPO laddering have anegative price evolvement in the time after the listing on average. Non-allocated IPO in-vestors who buy shares in this period are also losing money on average. This is consistentwith both Hao (2007) and Aggarwal et al. (2006). When comparing long-run returns ofIPOs with high laddering to a one for one matching listed firm, the underperformanceresults are very weak with zero or very low explanatory power. The matching firm tech-nique is also biased towards finding long-run underperformance, see Eckbo, Masulis andNorli (2008). We are not able to conclude that high levels of laddering leads to low long-run performance, but the results indicate that laddering is negatively related to long-runperformance.
2.6.3 Robustness and aggregate IPO laddering
The results are robust to including PCC savings banks and trimming IPO allocations at0.1% instead of at 1%, see Table 8. The results are also robust to removing all companyspecific control variables (Table 9). From Table 10 it can also be seen that IPO ladderinginvolves an economically significant amount of the IPO shares. Laddering investors areon average allocated 4% of IPO shares before they buy 6% more shares after the listing.These investors then sell 10% of the IPO shares within six months of the listing date (inthe 50% IPOs with the highest IPO laddering).
2.7 Conclusion
There is a stronger relationship between IPO allocations and after-listing purchases wheninvestors sell shares soon after the listing, the IPO have a positive realized underpricingand there is a positive drift in the share price after the listing. This finding is not consistent
33Long run performance is calculated as the (IPO company holding period return / matching companyholding period return) (Ritter, 1991). This long run return measure is regressed on the aggregate levelof aftermarket share buying and a set of control variables. Companies are matched on market values andbook to market ratios, see Eckbo and Norli (2005). All matching companies with a market value within30% of each IPO company are grouped together. Only companies that have been listed for more than fiveyears are included as matching companies. The company with the book to market ratio that is closestto the IPO company is used as the matching company. A delisted matching company is replaced by thecompany with the second closest book to market ratio for the remaining years etc.
24

with HA and this hypothesis is therefore rejected. We reject that the relationship betweenIPO allocations and after-listing purchases is driven by share rationing only. This findingis, however, consistent with H0. We are not able to reject that the relationship betweenIPO allocations and after-listing purchases is driven by IPO laddering. The evidencesupport IPO laddering.We find that laddering investors who buy more shares after the listing are also allo-
cated more shares in IPOs. This controls for the stock-trading commissions generatedby the investors, portfolio value, investor type, past trading characteristics and companyspecific variables. These investors also sell their shares shortly after the listing and earn ahigh profit from their IPO participation, which is consistent with IPO laddering. The in-vestors that buy the most shares after the listing are also allocated the most shares. Theseinvestors are not expected to hold the shares based on past trading characteristics. Thereis also a positive relationship between the number of times investors have used ladderingafter the listing in previous IPOs and after-listing ownership of future IPO shares. Thereis no relationship between past buy-and-hold and future IPO share ownership, -furtherindicating that this is IPO laddering. Laddering gives more shares in specific IPOs andmore shares in future IPOs. The aggregate laddering in IPOs is also positively related tothe average commission generated by the allocated investors before the IPOs, thus demon-strating that there is more laddering when there are more shares allocated to investorsthat generate high levels of stock-trading commission. Investment banks seems to be ableto earn money on IPO laddering by combining allocations to after-listing investors andhigh commission investors. The evidence is consistent with IPO laddering. We are notable to reject that IPO laddering is being used.There are many implications of this finding. The main practical implication is that
investors who are not aware of IPO laddering lose money on trading in IPO shares incomparison to more informed investors. IPO laddering is also likely to increase adverseselection problems as many investors are likely to stay away from the IPO market whenthey know they must provide kickbacks to acquire the good allocations. In the U.S. therehas been a large-scale investigation of IPO allocation practices, and this study shows thatmore countries should probably start their own investigations as well. A main theoreticalimplication of this finding is that IPO allocation practices should probably be explainedmore from a rent seeking perspective since most theoretical papers explain IPO allocationsfrom a pricing information or buy-and-hold perspective.There are some limitations to this study. With regard to the generated stock-trading
commission, we cannot see that commission is paid from the allocated investor to theinvestment bank, and can only observe that the commission has been generated. We alsocalculate commissions based on monthly data, and this is likely to underestimate com-missions. The study does not conduct and in-depth investigation of long-run performance(as we only observe a limited number of companies), and we also do not know the over-subscription numbers of the IPOs. This is proxied for by using the actual first day returnas the oversubscription hot/cold IPO dummy. Nevertheless, we do expect this dummy tobe very accurate. In terms of future research, it would be very interesting to investigatea sample which included the actual IPO laddering agreements in writing.
25

References
[1] Aggarwal, Rajesh K., Amiyatosh K. Purnanandam and Guojun Wu, 2006, Under-writer Manipulation in Initial Public Offerings. Working paper. University of Virginiaand University of Michigan.
[2] Benveniste, Lawrence and Paul Spindt, 1989, How investment banks determine theoffer price and allocation of new issues, Journal of Financial Economics 24, 343-362.
[3] Carter, Richard B. and Steven Manaster, 1990, Initial Public Offerings and the un-derwriter reputation, Journal of Finance 45, 1045-1067.
[4] Cliff, Michael T. and David J. Denis, 2004, Do Initial Public Offering Firms PurchaseAnalyst Coverage with Underpricing?, Journal of Finance 6, 2871-2901.
[5] Deneen, M., and J. Hooghuis, 2001, Tidal Wave of IPO ‘Laddering Litigation’Swamps D&O Market, The Plus Journal 9.
[6] Eckbo, Espen B. and Øyvind Norli, 2005, Liquidity risk, leverage and long-run IPOreturns, Journal of Corporate Finance 11, 1-35.
[7] Eckbo, Espen B., Ronald W. Masulis and Øyvind Norli, 2000, Seasoned Public Of-ferings: resolution of the ’new issues puzzle’, Journal of Financial Economics 56,251-291.
[8] Ellis, Katrina, Roni Michaely and Maureen O’Hara, 2000, When the Underwriter Isthe Market Maker: An Examination of Trading in the IPO Aftermarket, Journal ofFinance 3, 1039-1074.
[9] Ellis, Katrina, 2006, Who trades IPOs? A close look at the first days of trading,Journal of Financial Economics 79, 339-363.
[10] Fjesme, Sturla Lyngnes, Roni Michaely and Øyvind Norli 2011, Using stock-tradingcommissions to Secure IPO allocations, Working paper, Norwegian Business School(BI).
[11] Griffi n, John M., Jeffrey H. Harris and Selim Topaloglu, 2007, Why are IPO investorsnet buyers through lead underwriters?, Journal of Financial Economics 85, 518-55.
[12] Hao, Qing (Grace), 2007, Laddering in initial public offerings, Journal of FinancialEconomics 85, 102-122.
[13] Jenkinson, Tim, and Howard Jones, 2004, Bids and Allocations in European IPOBook-building, Journal of Finance 5, 2309-2338.
[14] Kecskes, Ambrus, Roni Michaely and Kent Womack, 2010, What drives the Valueof Analysts Recommendations: Earnings Estimates or Discount Rate Estimates?,Working paper Cornell University.
[15] Kumar, Alok and Charles M.C. Lee, 2006, Retail Investor Sentiment and ReturnComovements, Journal of Finance 5, 2451-2486.
[16] Liu Xiaoding and Jay. R. Ritter, 2010, The Economic Consequences of IPO Spinning,Review of Financial Studies 5, 2024-2059.
26

[17] Ljungqvist, Alexander P. and William J. Wilhelm, 2002, IPO allocations: discrimi-natory or discretionary?, Journal of Financial Economics 65,167-201.
[18] Loughran, Tim and Jay R. Ritter, 1995, The New Issues Puzzle, Journal of Finance1, 23-51.
[19] Loughran, Tim and Jay R. Ritter, 2004, Why has IPO underpricing changes overtime?, Financial Management 33, 5-37.
[20] Megginson, William and Kathleen Weiss, 1991, Venture capitalists certification ininitial public offerings, Journal of Finance 46, 879-904.
[21] Michaely, Roni and Wayne H. Shaw, 1995, The Choice of Going Public: Spin-offs vs.Carve-Outs, Financial Management 24, 5-21.
[22] Nimalendran, M., Jay Ritter, and Donghang Zhang, 2007, Do today’s trades affecttomorrows IPO allocations? Journal of Financial Economics 84, 87-109.
[23] Pulliam, Susan and Randall Smith, 2000, Trade-offs: Seeking IPO Shares, InvestorsOffer to Buy More in the After Market, The Wall Street Journal December12, 2000.
[24] Pulliam, Susan and Randall Smith, 2000B, Linux Deal is focus of IPO-CommissionProbe, The Wall Street Journal, December 12, 2000.
[25] Reuter, Jonathan, 2006, Are IPO allocations for sale? Evidence from Mutual Funds,Journal of Finance 5, 2289-2324.
[26] Ritter, Jay R.,1984, The ‘hot issue’market of 1980, journal of Business 32, 215-240.
[27] ____, 1987, The cost of going public, Journal of Financial Economics 19, 269-281.
[28] ____, 1991, The long run performance of Initial Public Offerings, Journal of Fi-nance 46, 3-27.
[29] ____, 2003, Differences between European and American IPO markets, EuropeanFinancial Management 4, 421-434.
[30] Rogers, W. H.,1993, Regression standard errors in clustered samples, Stata TechnicalBulletin 13, 19-23. Reprinted in Stata Technical Bulletin Reprints 3, 88—94.
[31] White, Halbert, 1980, A heteroscedasticity-consistent covariance matrix estimatorand a direct test of heteroscedasticity, Econometrica 48, 817-838.
27

Table 1The number of Initial Public Offerings on the Oslo Stock Exchange
The column labeled "IPOs" lists the number of Initial Public Offerings on the Oslo Stock Exchange in
the sample period. The column labeled "Data" indicates the IPOs with allocation data. The column labeled
"Prospectus" lists the IPOs where we have been able to locate the listing prospectus. The column labeled
"Sample" lists the 23 sample IPOs. The columns labeled "Value of shares" list the annually aggregate million
USD values of shares sold in the 153 IPOs with listing prospectus. "All", "New" and "Secondary" indicates
the value of all shares, only newly issued shares and shares sold by existing shareholders respectively. The
columns labeled "P" and "S" is the annual aggregated USD million value of shares sold in the IPOs with
prospectuses and in the 23 IPO sample respectively. Value of shares sold is reported in USD using a
USD/NOK exchange rate of 0.1792. The sample period is January 1993 through September 2007.
Number of IPOs Value of shares (Million USD)
All New Secondary
Year IPOs Data Prospectus Sample P S P S P S
1993 11 9 7 541 539 2
1994 15 9 8 3 275 147 218 142 57 5
1995 14 12 9 2 452 49 403
1996 15 11 7 2 137 80 56 81 80
1997 29 25 19 9 976 230 504 21 471 209
1998 12 9 8 1 189 87 145 87 43
1999 3 3 3 50 21 29
2000 10 10 10 2 817 101 753 89 64 12
2001 4 4 4 183 166 17
2002 2 2 2 2 70 70 64 65 51 5
2003 2 2 2 83 78 5
2004 14 14 14 1,605 1,319 287
2005 31 30 30 2 2,041 34 566 23 1,475 11
2006 18 17 16 2,730 2,237 493
2007 15 14 14 912 517 395
Total 195 171 153 23 11,061 749 7,232 427 3,873 322
28

Table 2Summary Statistics of Firms Going Public on the Oslo Stock Exchange
Panel A reports the company characteristics for the 23 sample IPOs and all 171 IPOs with ownership
data. "After-listing/ issued" is the additional shares purchased after the listing divided by the shares issued
in the IPOs. "-Sell within 6 months " is the "(After-listing shares/shares issued) %" for only investors
that sell all shares within six months of the listing date. "Market V. (M.USD)" is the number of shares
outstanding on the listing day times the first day closing price. "Book/Market" is the book value of equity
after the IPO divided by the market value on the listing day. "Offer price" is the USD IPO price in the
listing prospectuses. "VC backed d." is a dummy variable that takes the value of one if the company has
venture capital backing. "High-tech d." takes the values of one for IT -companies. "First day return" is the
percentage price change from the offer price to the first day closing price. USD values are calculated from a
USD/NOK exchange rate of 0.1792. In Panel B the 23 Sample IPOs are split into IPOs with high and low
after-listing purchases by investors that sell all shares within six months of the listing date. T —statistics
are calculated as: Difference / (square root [(variance sample 1/ numbers in sample 1) + (variance sample
2/ numbers in sample 2)].
Panel A Sample 23 IPOs All 171 IPOs Mean difference
N Mean Std.Dev Median N Mean Std.Dev Median Diff. t-stat.
After-listing/ issued 23 8.7% 7.6% 6.2% 171 5.8% 6.2% 3.8% 2.9% (1.8)
-Sell within 6 months 23 3.3% 3.7% 2.3% 171 3.6% 5.0% 1.7% -0.3% (-0.3)
Market V. (M.USD) 23 $149.3 $145.2 $117.3 171 $311.4 $871.9 $108.3 -$162.1 (-2.2)
Offer price USD 23 $8.7 $6.9 $7.2 171 $8.2 $6.4 $6.8 $0.5 (0.3)
Book/Market 23 0.3 0.29 0.23 171 0.46 0.33 0.4 -0.16 (-2.4)
VC backed d. 23 0.17 0.39 0.0 171 0.18 0.38 0.0 -0.01 (-0.1)
High-tech d. 23 0.09 0.29 0.0 171 0.12 0.32 0.0 -0.03 (-0.5)
First day return 23 0.13 0.19 0.09 171 0.08 0.19 0.03 0.05 (1.2)
Panel B 11 high laddering IPOs 12 low laddering IPOs Mean difference
N Mean Std.Dev Median N Mean Std.Dev Median Diff. t-stat.
After-listing/ issued 11 12.6% 8.5% 8.4% 12 5.2% 4.7% 4.4% 7.4% (2.6)
-Sell within 6 months 11 6.2% 3.5% 5.2% 12 0.7% 0.8% 0.4% 5.5% (5.1)
Market V. (M.USD) 11 $117.3 $67.1 $95.8 12 $178.8 $190 $144.9 -$61.5 (-1.1)
Book / Market ratio 11 0.34 0.3 0.26 12 0.26 0.29 0.22 0.08 (0.6)
Offer price (USD) 11 $9.0 $5.4 $8.1 12 $8.5 $8.3 $5.7 $0.5 (0.2)
VC backed d. 11 0.09 0.3 0.0 12 0.25 0.45 0.0 -0.16 (-0.1)
High-tech d. 11 0.0 0.0 0.0 12 0.17 0.39 0.0 -0.17 (-1.5)
First day return 11 0.16 0.16 0.18 12 0.1 0.21 0.06 0.06 (0.8)
29

Table 3Summary Statistics on IPO Allocations and on Investors Trading
Panel A reports the summary statistics for the individual trading prior to the 23 sample and all 171
IPOs on the Oslo Stock Exchange in the period 1993 to 2007. "(Allocated/issued) " is the number of
allocated shares to each investor divided by the shares issued in the IPO. "(After-listing/issued) " is the
additional shares purchased after the listing divided by the shares issued in the IPOs. "Commission" is
the accumulated commission generated in USD by the investors in the two years before the IPO allocation
date. "Portfolio value" is the portfolio value in million USD for each allocated investor at 31.12.xx in
the year before the IPO allocation date. "Previous IPOs" is the accumulated previous IPO participations
by the investors divided by the accumulated IPO number in the sample." Previous Buy-and-hold " is the
accumulated previous number of times the allocated investor has been a buy-and-hold investor as a percent
of all previous IPO participations. This is the number of times the investor has held some IPO allocated
shares for more than six months in previous IPOs. "Previous Flipping" is the accumulated number of times
the investor have flipped previous IPOs as a percent of all previous IPO participations before the IPO
allocation. Flipping is when all shares are sold within one month of the listing. USD values are calculated
from a USD/NOK exchange rate of 0.1792. Panel B reports that investors that buy (and sell) more shares
after the listing are allocated significantly more IPO shares than investors that do not. T —statistics are
calculated as: Difference / (square root [(variance sample 1/ numbers in sample 1) + (variance sample 2/
numbers in sample 2)].
Panel A
Sample 23 IPOs All 171 IPOs
N Mean Std.Dev Median N Mean Std.Dev Median
(Allocated/issued) 16,593 0.053% 0.173% 0.009% 175,382 0.036% 0.14% 0.003%
(After-listing/issued) 16,593 0.011% 0.19% 0.0% 175,382 0.006% 0.12% 0.0%
Commission USD 16,593 $3,544 $46,711 $37.9 175,382 $6,274 $93,395 $30.8
Portfolio value M.USD 16,593 $2.6 $44.5 $0.003 175,382 $3.6 $72.6 $0.004
Previous IPOs 16,593 0.05 0.05 0.04 175,382 0.03 0.05 0.017
Previous Buy-and-hold 16,593 0.21 0.37 0.0 175,382 0.21 0.37 0.0
Previous Flipping 16,593 0.15 0.31 0.0 175,382 0.1 0.25 0.0
Panel B: Comparing IPO allocations to after-listing investors and non after-listing investors
Laddering investors All investors Mean Difference
N Mean Std.Dev Median N Mean Std.Dev Median Diff. t-stat.
*D1 427 0.116% 0.264% 0.018% 16,593 0.053% 0.173% 0.009% 0.06% (4.9)
*D1*D2 195 0.097% 0.263% 0.009% 16,593 0.053% 0.173% 0.009% 0.04% (2.3)
*D1*D3 357 0.097% 0.239% 0.017% 16,593 0.053% 0.173% 0.009% 0.04% (3.5)
*D1*D2*D3 195 0.097% 0.263% 0.009% 16,593 0.053% 0.173% 0.009% 0.04% (2.3)
30

Table 4Relationship between After-listing Purchases and IPO Allocations
This table reports the coeffi cients and heteroscedastic consistent t -statistics (errors adjusted for clus-
tering across firms Rogers, 1993) in parentheses for the regressions with (allocated shares/issued shares) %
as the dependent variable. This is a standard OLS model. Only the 23 IPOs with exact allocations are
included. All variables are as described in Table 2 and Table 3. In regression 6 and 7 D1 indicates if more
than 50% of shares are sold within three and six months.
(Allocated shares/shares issued) %
Reg 1 Reg 2
Intercept 0.6366 0.7096
(2.3) (2.8)
(After-listing shares/shares issued) % 0.0738 0.054
(1.6) (1.4)
(After-listing shares/shares issued) %* D1 0.1306
(1.7)
D1 -Investors sell shares within months a listing -0.0283
(-1.3)
Log (commission) 0.0111 0.0096
(2.5) (2.2)
Log (portfolio value) 0.0014 0.0018
(0.6) (0.9)
Previous IPOs 0.2242 0.2085
(0.7) (0.7)
Previous buy-and-hold -0.0076 -0.0046
(-0.3) (-0.2)
Previous flipping -0.019 -0.0207
(-0.6) (-0.6)
Financial institution dummy 0.0657 0.0743
(0.9) (1.1)
Log (market value) -0.0573 -0.0602
(-4.2) (-4.8)
BV / MV equity 0437 0.4309
(7.3) (6.7)
Offer price -0.0024 -0.0023
(-4.0) (-3.9)
VC backed dummy 1.0986 1.1027
(15.5) (14.5)
High-tech dummy -0.9268 -0.9488
(-12.0) (-14.5)
First day return dropped dropped
Company and year dummy yes yes
Observations (IPO allocations) 1,016 1,016
-of which are laddering investors 427
Adjusted R -squared 33.6% 35.2%
Investors sell within months of listing all 6m.
31

Continued... (Allocated shares/shares issued) %
Reg 3 Reg 4 Reg 5 Reg 6 Reg 7
Intercept 6.0717 1.9466 1.268 1.3036 1.1851
(16.8) (9.4) (10.6) (10.6) (13.7)
(After-listing shares/shares issued) % 0.0486 0.0587 0.0587 0.062 0.0487
(1.2) (1.4) (1.4) (1.5) (1.4)
(After-listing shares/shares issued) %* D1*D2 0.286
(4.2)
(After-listing shares/shares issued) %* D1*D3 0.2698
(4.9)
(After-listing shares/shares issued) %* D1*D2*D3 0.286 0.3013 0.2398
(4.2) (2.9) (7.7)
D1 -Investors sell shares within months a listing -0.0384 -0.0249 -0.0249 -0.0434 -0.0093
(-1.6) (-1.2) (-1.2) (-1.7) (-0.5)
D2 - Positive drift in share price after the listing -0.2606 -0.2075 -0.2138 -0.2053
(-5.3) (-4.5) (-4.5) (-4.5)
D3 - Underpriced IPO 0.5297 0.1551 0.1713 0.1267
(20.1) (2.6) (2.7) (2.0)
Log (commission) 0.0083 0.0085 0.0085 0.0103 0.0094
(1.8) (1.8) (1.8) (2.4) (2.3)
Log (portfolio value) 0.0024 0.0023 0.0023 0.0015 0.0019
(1.2) (1.2) (1.2) (0.8) (1.0)
Previous IPOs of possible 0.1996 0.2351 0.2351 0.2691 0.2274
(0.6) (0.8) (0.8) (0.9) (0.8)
Previous buy-and-hold of possible -0.002 -0.0072 -0.0072 -0.007 -0.0061
(-0.1) (-0.3) (-0.3) (-0.3) (-0.2)
Previous flipping of possible -0.0172 -0.0167 -0.0167 -0.011 -0.0194
(-0.5) (-0.5) (-0.5) (-0.4) (-0.6)
Financial institution dummy 0.0703 0.0641 0.0641 0.0644 0.0611
(1.1) (0.9) (0.9) (0.9) (0.9)
Log (market value) -0.3003 -0.0983 -0.0636 -0.0656 -0.0599
(-16.8) (-9.6) (-11.5) (-11.4) (-15.9)
BV / MV equity dropped dropped dropped dropped dropped
Offer price -0.009 -0.0016 -0.0023 -0.0025 -0.002
(-12.4) (-1.8) (-2.9) (-3.1) (-2.5)
VC backed dummy -0.4496 0.6022 0.5567 0.5428 0.6072
(-17.2) (-16.6) (7.0) (6.5) (7.4)
High-tech dummy -1.0434 -1.0831 -0.8529 -0.8437 -0.8859
(-12.7) (-16.8) (-8.8) (-8.5) (-9.6)
First day return dropped dropped dropped dropped dropped
Company and year dummy yes yes yes yes yes
Observations (IPO allocations) 1,016 1,016 1,016 1,016 1,016
-of which are laddering investors 357 195 195 145 217
Adjusted R -squared 38.3% 37.0% 34.5% 36.2% 37.9%
Investors sell within months of listing all 6m. all 6m. all 6m. 50% 3m. 50% 6m.
32

Table 5After-listing Purchases in Past IPOs Give More Future IPO Ownership
This table reports the coeffi cients and heteroscedastic consistent t -statistics (errors adjusted for clus-
tering across firms Rogers, 1993) in parentheses for the regressions with (allocated shares/issued shares) %
as the dependent variable. This is a standard OLS model. All variables are as described in Table 2 and
Table 3. Regression 1 includes all IPOs. Regression 2 and 3 includes hot and cold IPOs respectively. There
are 171, 105 and 45 IPOs in regression 1, 2 and 3. Regression 4 to 6 drop all company specific control
variables. Past laddering includes only investors who have purchased more shares right after the listing and
then sold some of the shares within six months of the listing date in past IPOs.
(Allocated shares/shares issued) %
Reg 1 Reg 2 Reg 3 Reg 4 Reg 5 Reg 6
Intercept -0.12984 0.1096 0.7882 -0.0278 2.0078 0.0587
(-25.9) (6.9) (100.0) (-7.0) (90.8) (10.6)
Previous laddering 0.1114 0.1137 0.0877 0.1114 0.1137 0.0877
(9.3) (8.2) (3.4) (9.3) (8.2) (3.4)
Log (commission) 0.006 0.0051 0.012 0.006 0.0051 0.012
(4.1) (3.6) (8.9) (4.1) (3.6) (8.8)
Log (portfolio value) 0.0085 0.0007 0.0013 0.0009 0.0007 0.0013
(2.6) (2.3) (2.2) (2.6) (2.3) (2.2)
Previous IPOs 0.1535 0.1619 0.1865 0.1535 0.1619 0.1865
(3.8) (3.6) (3.0) (3.8) (3.6) (3.0)
Previous buy-and-hold -0.0156 -0.0153 -0.0177 -0.01558 -0.0153 -0.0177
(-7.8) (-7.0) (-3.0) (-7.8) (-7.0) (-3.0)
Previous flipping -0.0022 -0.0051 0.0061 -0.0022 -0.0051 0.0061
(-0.9) (-1.9) (0.9) (-0.9) (-1.9) (0.9)
Financial institution dummy 0.1779 0.1653 0.1807 0.1779 0.1653 0.1807
(9.5) (6.9) (5.3) (9.5) (6.9) (5.3)
Log (market value) 0.0121 -0.008 -0.0357
(21.4) (-9.8) (-109.1)
BV / MV equity -0.0108 0.0474 -0.2327
(-2.1) (10.3) (-90.3)
Offer price -0.0011 -0.001 0.0008
(-63.6) (-32.3) (64.4)
VC backed dummy 0.1196 0.0493 -0.2708
(29.7) (5.0) (-85.9)
High-tech dummy -0.1668 -0.44 0.0599
(-33.4) (-42.8) (27.3)
First day return 0.4163 0.3627 dropped
(16.3) (12.5)
Company and year dummy yes yes yes yes yes yes
Observations 175,382 145,392 22,114 175,382 145,392 25,891
Adjusted R -squared 22.0% 21.7% 20.1% 22.0% 21.7% 20.1%
IPOs all hot cold all hot cold
33
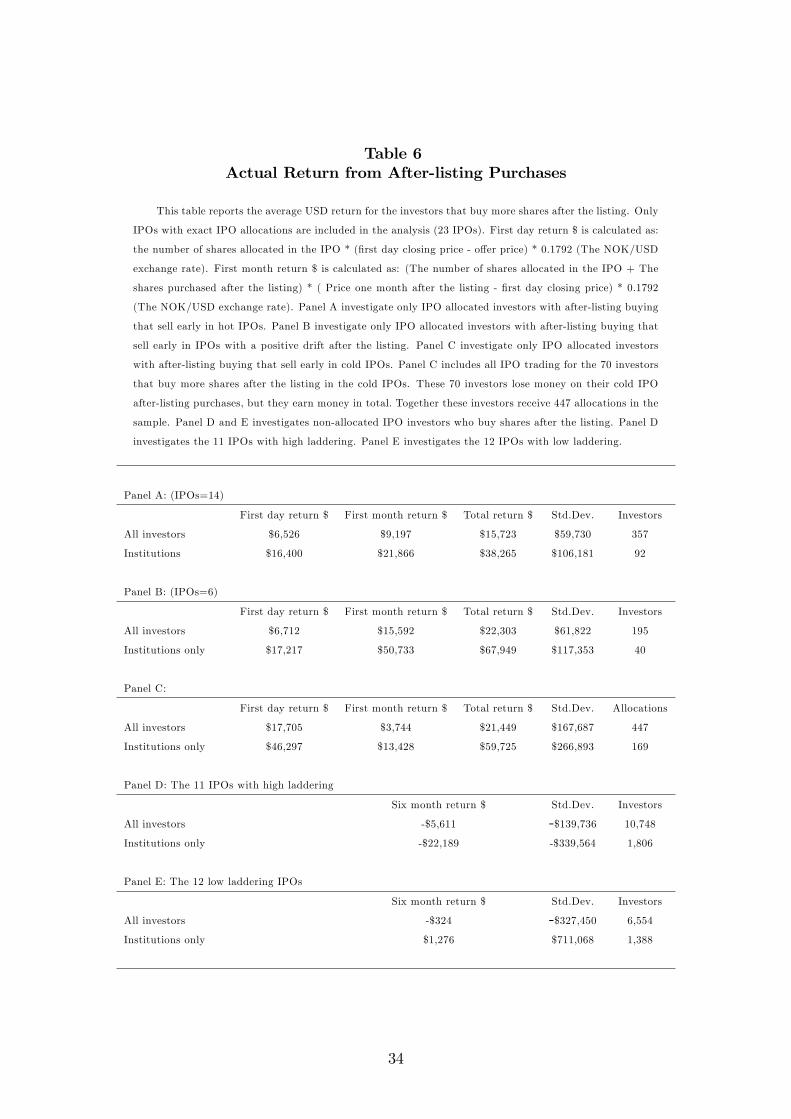
Table 6Actual Return from After-listing Purchases
This table reports the average USD return for the investors that buy more shares after the listing. Only
IPOs with exact IPO allocations are included in the analysis (23 IPOs). First day return $ is calculated as:
the number of shares allocated in the IPO * (first day closing price - offer price) * 0.1792 (The NOK/USD
exchange rate). First month return $ is calculated as: (The number of shares allocated in the IPO + The
shares purchased after the listing) * ( Price one month after the listing - first day closing price) * 0.1792
(The NOK/USD exchange rate). Panel A investigate only IPO allocated investors with after-listing buying
that sell early in hot IPOs. Panel B investigate only IPO allocated investors with after-listing buying that
sell early in IPOs with a positive drift after the listing. Panel C investigate only IPO allocated investors
with after-listing buying that sell early in cold IPOs. Panel C includes all IPO trading for the 70 investors
that buy more shares after the listing in the cold IPOs. These 70 investors lose money on their cold IPO
after-listing purchases, but they earn money in total. Together these investors receive 447 allocations in the
sample. Panel D and E investigates non-allocated IPO investors who buy shares after the listing. Panel D
investigates the 11 IPOs with high laddering. Panel E investigates the 12 IPOs with low laddering.
Panel A: (IPOs=14)
First day return $ First month return $ Total return $ Std.Dev. Investors
All investors $6,526 $9,197 $15,723 $59,730 357
Institutions $16,400 $21,866 $38,265 $106,181 92
Panel B: (IPOs=6)
First day return $ First month return $ Total return $ Std.Dev. Investors
All investors $6,712 $15,592 $22,303 $61,822 195
Institutions only $17,217 $50,733 $67,949 $117,353 40
Panel C:
First day return $ First month return $ Total return $ Std.Dev. Allocations
All investors $17,705 $3,744 $21,449 $167,687 447
Institutions only $46,297 $13,428 $59,725 $266,893 169
Panel D: The 11 IPOs with high laddering
Six month return $ Std.Dev. Investors
All investors -$5,611 -$139,736 10,748
Institutions only -$22,189 -$339,564 1,806
Panel E: The 12 low laddering IPOs
Six month return $ Std.Dev. Investors
All investors -$324 -$327,450 6,554
Institutions only $1,276 $711,068 1,388
34

Table 7After-listing Purchases and Generated stock-trading Commissions
This table reports the coeffi cients and White (1980) heteroscedasticity consistent t-statistics in paren-
theses for the regressions with the aggregate (after-listing shares/shares issued) % as the dependent variable.
All variables are as described in Table 2 and Table 3. All regressions are standard OLS models, and the
sample period is from January 1993 to September 2007. Only investors that sell some shares within six
months of the listing are included in Aggregate (After-listing shares/shares issued) %. Only investors that
do not buy shares after the listing are included in Log (average commission per share). Regression 2 and 4
drop the variables that Hao (2007) and Aggarwal et al. (2006) predict increase laddering. Regression 3 and
4 use average commission by shares instead of the sum of commission scaled by commission in all IPOs.
Log (aggregate after-listing shares/shares issued) %
Reg 1 Reg 2 Reg 3 Reg 4
Intercept 1.5289 1.5296 0.6737 0.3876
(1.5) (1.6) (0.7) (0.4)
(Combined commission) % 51.5725 44.7781
(3.9) (4.4)
Log (average commission per share) 0.2172 0.2116
(1.8) (1.7)
Log (market value) -0.0289 -0.03153 0.01 0.0306
(-0.5) (-0.5) (0.2) (0.5)
BV / MV equity -0.147 -0.1551 -0.2652 -0.2938
(-0.5) (-0.5) (-0.9) (-0.9)
VC backed dummy -0.4901 -0.6445 -0.505 -0.5339
(-1.5) (-2.3) (-1.5) (-1.7)
High-tech dummy -0.2395 -0.2797 -0.1333 -0.1139
(-0.7) (-0.9) (-0.4) (-0.3)
Absolute price revision -0.0305 -0.0044
(-0.2) (-0.2)
Sentiment investors (million) 0.0000 0.0001
(-0.3) (2.2)
Observations 171 171 171 171
Adjusted R -squared 7.8% 7.4% 4.7% 4.1%
35

Table 8Relationship between After-listing Purchases and IPO Allocations
-Robustness
This table reports the coeffi cients and heteroscedastic consistent t -statistics (errors adjusted for clus-
tering across firms Rogers, 1993) in parentheses for the regressions with (allocated shares/issued shares) %
as the dependent variable. This is a standard OLS model. Only the 23 IPOs with exact allocations are
included. All variables are as described in Table 2 and Table 3. In regression 1 all PCC (savings banks) are
included. In regression 2 IPO allocations are trimmed at 0.1%.
Intercept 1.5432 1.0574
(14.3) (2.8)
(After-listing shares/shares issued) % 0.0772 0.249
(1.9) (4.6)
(After-listing shares/shares issued) %* D1 *D2 *D3 0.2674 0.5255
(3.7) (1.7)
D1 -Investors sell shares within six months a listing -0.0201 -0.0326
(-1.1) (-0.6)
D2 - Positive drift in share price after the listing 0.1242 -0.1165
(7.6) (-1.6)
D3 - Underpriced IPO -0.1832 -0.4437
(-15.0) (-5.5)
Log (commission) 0.0093 0.029
(2.5) (2.1)
Log (portfolio value) 0.0035 0.0005
(2.0) (0.1)
Previous IPOs of possible 0.0171 0.0135
(0.1) (0.0)
Previous buy-and-hold of possible -0.004 0.0311
(-0.2) (0.6)
Previous flipping of possible -0.0346 -0.0602
(-1.1) (-1.3)
Financial institution dummy 0.1086 0.4664
(1.5) (1.7)
Log (market value) -0.0779 -0.0727
(-19.2) (-4,2)
BV / MV equity 0.0331 dropped
(6.3)
Offer price 0.0002 0.0152
(1.4) (11.4)
VC backed dummy 0.7644 -0.4935
(23.7) (-4.8)
High-tech dummy 0.3245 0.4879
(12.8) (7.2)
First day return dropped dropped
Company and year dummy yes yes
Observations (IPO allocations) 1,251 1,064
-of which are laddering investors 209 200
Adjusted R -squared 34.2% 31.6%
Investors sell within months of listing all 6m. all 6m.
36
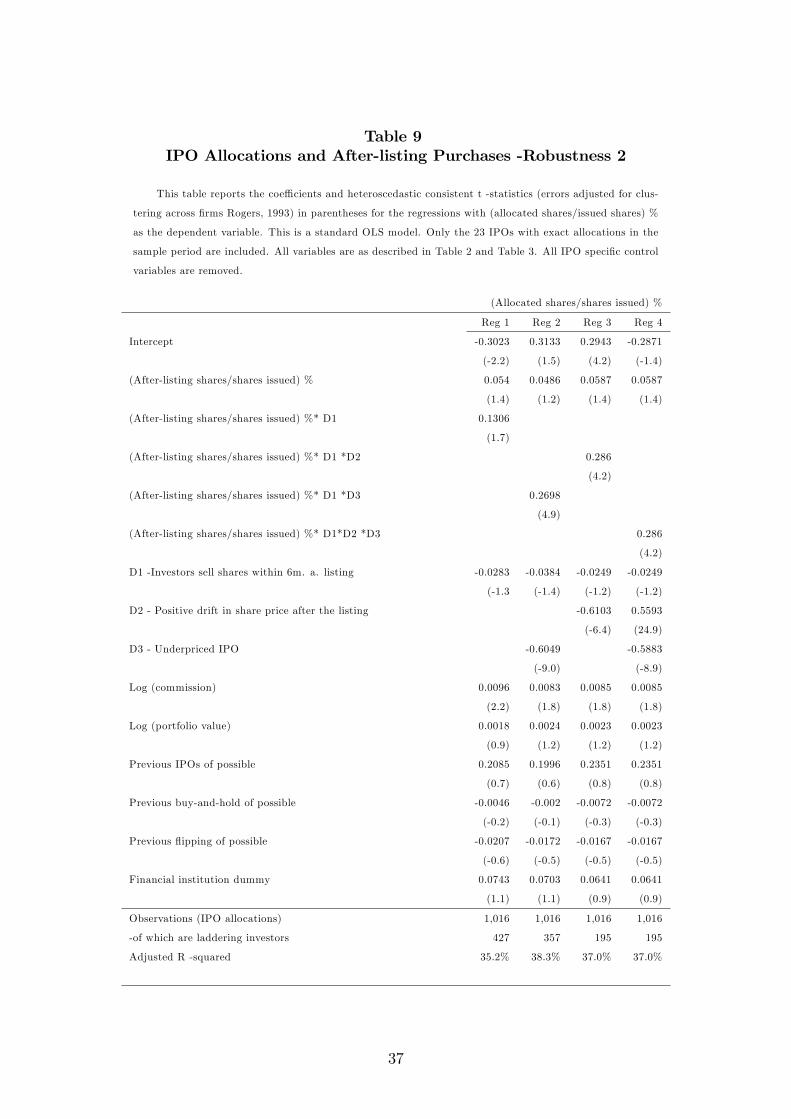
Table 9IPO Allocations and After-listing Purchases -Robustness 2
This table reports the coeffi cients and heteroscedastic consistent t -statistics (errors adjusted for clus-
tering across firms Rogers, 1993) in parentheses for the regressions with (allocated shares/issued shares) %
as the dependent variable. This is a standard OLS model. Only the 23 IPOs with exact allocations in the
sample period are included. All variables are as described in Table 2 and Table 3. All IPO specific control
variables are removed.
(Allocated shares/shares issued) %
Reg 1 Reg 2 Reg 3 Reg 4
Intercept -0.3023 0.3133 0.2943 -0.2871
(-2.2) (1.5) (4.2) (-1.4)
(After-listing shares/shares issued) % 0.054 0.0486 0.0587 0.0587
(1.4) (1.2) (1.4) (1.4)
(After-listing shares/shares issued) %* D1 0.1306
(1.7)
(After-listing shares/shares issued) %* D1 *D2 0.286
(4.2)
(After-listing shares/shares issued) %* D1 *D3 0.2698
(4.9)
(After-listing shares/shares issued) %* D1*D2 *D3 0.286
(4.2)
D1 -Investors sell shares within 6m. a. listing -0.0283 -0.0384 -0.0249 -0.0249
(-1.3 (-1.4) (-1.2) (-1.2)
D2 - Positive drift in share price after the listing -0.6103 0.5593
(-6.4) (24.9)
D3 - Underpriced IPO -0.6049 -0.5883
(-9.0) (-8.9)
Log (commission) 0.0096 0.0083 0.0085 0.0085
(2.2) (1.8) (1.8) (1.8)
Log (portfolio value) 0.0018 0.0024 0.0023 0.0023
(0.9) (1.2) (1.2) (1.2)
Previous IPOs of possible 0.2085 0.1996 0.2351 0.2351
(0.7) (0.6) (0.8) (0.8)
Previous buy-and-hold of possible -0.0046 -0.002 -0.0072 -0.0072
(-0.2) (-0.1) (-0.3) (-0.3)
Previous flipping of possible -0.0207 -0.0172 -0.0167 -0.0167
(-0.6) (-0.5) (-0.5) (-0.5)
Financial institution dummy 0.0743 0.0703 0.0641 0.0641
(1.1) (1.1) (0.9) (0.9)
Observations (IPO allocations) 1,016 1,016 1,016 1,016
-of which are laddering investors 427 357 195 195
Adjusted R -squared 35.2% 38.3% 37.0% 37.0%
37

Table 10Aggregate IPO Laddering and Allocations
This table reports the aggregate allocation and laddering at the IPO level. Panel A includes the 11
high laddering IPOs. Panel B includes also the 12 low laddering IPOs.
Panel A
Group Investors Allocation Laddering Total IPOs
D1 363 3.6% 6.2% 9.8% 11
D1, D3 317 3.5% 6.3% 9.8% 9
D1, D2 174 4.5% 8.7% 13.2% 4
Panel B
D1 427 2.5% 3.5% 6.0% 20
D1, D3 357 2.5% 4.5% 7.0% 14
D1, D2 195 5.9% 3.2% 9.1% 6
.
38

Figure 1The Factors that Create the Incentives to Engage in IPO Laddering
Laddering investors are allocated some shares in the IPO and then they buy more shares after the
listing before they sell all shares. Commission investors are investors that generate high levels of stock-
trading commission to the investment bank through trading in other shares. Investment bank is the lead
manager in the IPO. Hot and cold IPOs are high and low oversubscribed IPOs. Hot and cold IPOs are
proxied for by positive and non-positive first day return.
Hot IPOs
Laddering Agree to buy more shares after the listing to increase Pulliam and Smith (2000)
investors current hot IPO allocations and the SEC litigation
releases
Commission Pay increased stock-trading commissions to the investment Reuter (2006) and
investors bank, through trades in other shares, to increase Nimalendran, Ritter
current and future hot IPO allocations and Zhang (2006)
Investment banks 1) Increase received commissions by allocating IPO Hao (2007)
shares to laddering investors and commission investors
2) Ensure a successful IPO by allocating shares to Hao (2007)
laddering investors that increase prices after the listing
Cold IPOs
Laddering Agree to buy more shares after the listing to increase Griffi n et al. (2007)
investors future hot IPO allocations
Investment banks 1) Ensure a more successful IPO by allocating shares to Griffi n et al. (2007)
laddering investors that increase prices after the listing and Hao (2007)
2) Reduces after-listing price uncertainty by allocating Griffi n et al. (2007)
shares to laddering investors
3) Reduces the risk of damaged reputation from IPOs Griffi n et al. (2007)
that fall in price by allocating shares to laddering
investors
39

Figure 2Theoretical Predictions By Hao (2007) and Aggarwal et al. (2006)
Predictions made by Hao (2007)
Laddering will increase the following variables:
1) Laddering results in a higher offer price if investors are not expected to sell shares in the six m. after-listing
2) Laddering is positively related to money left on the table.
3) Laddering in itself does not necessarily increase underpricing.
4) Laddering contributes to long-run underperformance.
The following variables will increase laddering:
5) More expected underpricing (without laddering) leads to more laddering
6) When there are information momentum effects, there is more laddering.
7) When underwriters shares in on the profits from underpriced IPOs, there is more laddering
Predictions made by Aggarwal et al (2006)
Laddering will increase the following variables:
1) Returns should be higher for IPOs with laddering over the six months after the listing
2) The long-run return should be lower for IPOs with laddering than for IPOs with no laddering
3) The number of sentiment investors increases IPO underpricing for IPOs with laddering.
4) Turnover and volume (shares traded) are greater for IPOs with laddering than for IPOs with no laddering
The following variables will increase laddering:
5) Underpricing is higher for IPOs with laddering than for IPOs with no laddering
6) When there are more sentiment investors there is a bigger likelihood of laddering
Major Differences
1) Hao (2007) predict intentional underpricing, and Aggarwal et al. (2006) predict price run ups that are corrected
2) Hao (2007) and Aggarwal et al. (2006) predicts that laddering increases offer/closing and underpricing respectively
40

Figure 3Timeline of the IPO Allocations for the Different Groups
Listing in database is when the company list ownership records in the ownership database. This is
when the ownership records are observed in the data the first time. IPO allocation is when the companies
distribute the allocated shares in the ownership database. Listing is when the company is listed publicly.
After-listing purchases is when the laddering trades are calculated. Group 1 to 3 is the ordering of the group
of detail in the allocations. Group 1 is 100% accurate IPO allocations. Group 2 IPO allocations includes
one to 30 days of after-listing trading. Group 3 IPO allocations includes existing owners who have not sold
all of their shares in the IPO. There are 23, 143 and 5 companies in group 1, 2 and 3 respectively.
Timeline Six months before One month before Listing month One month after
the listing the listing the listing
Group 1 Listing in database IPO allocation Listing After-listing purchases
Group 2 Listing in database IPO allocation After-listing purchases
Listing
Group 3 Listing in database Listing After-listing purchases
IPO allocation
41

.
42

3 Using Stock-trading Commissions to Secure IPO Allocations
Sturla Lyngnes Fjesme34
BI Norwegian Business School
Roni MichaelyCornell University and the Interdisciplinary Center
Øyvind NorliBI Norwegian Business School
.
.
.
.
.
.
.
.
.
JEL classification: G24; G28Keywords: IPO allocations; Equity issue; Commission; Rent seeking
34We are grateful to Jay Ritter, Øyvind Bøhren, François Derrien, seminar participants at BI NorwegianBusiness School for valuable suggestions, “The Center for Corporate Governance Research (CCGR)”atBI Norwegian Business School for financial support, the Oslo Stock Exchange VPS for providing the dataand the investment banks and companies that helped us locate the listing prospectuses. All errors areour own.Contact: BI Norwegian Business School, Nydalsveien 37, 0484 Oslo, Norway. E-mail address:
[email protected] Telephone: +47-957-722-43.
43

Abstract
Using data, at the investor level, on the allocations of shares in initialpublic offerings (IPOs), we document a strong positive relationship betweenthe amount of stock-trading commission and the number of shares an investorreceives in a subsequent IPO. We find no evidence to support the idea that in-vestment banks allocate shares to investors that are perceived to be long-terminvestors. Our findings are consistent with the view that investment banksare able to capture some of the profits earned by investors when participatingin underpriced IPOs.
44

3.1 Introduction
The Securities and Exchange Commission (SEC) has since the early 2000s investigated theinitial public offering (IPO) allocation practices of several major investment banks. Oneconcern is that IPO allocations are tied to excessively large stock-trading commissionsand that such a practice would constitute illegal kickbacks from investors to investmentbanks. Reuter (2006) points out that such kickbacks would allow the underwriter to sharemore of the benefits of underpriced IPOs– and, therefore, exacerbate the agency conflictthat exists between the issuing firm and the lead underwriter of the IPO. This paperinvestigates whether or not investors that has generated large stock-trading commissionsin the past receives a preferential treatment in future IPO allocations.Using data on the stock-holdings for every single investor that owned common shares
that was listed or became listed on the Oslo Stock Exchange during the period 1993through 2007, we are able to link stock-trading commission and IPO allocation at theinvestor level. The main finding of the paper is a strong and robust positive relationshipbetween the level of stock-trading commission generated by an investor prior to the IPOand the number of shares the same investor receives through the IPO allocation. It canbe argued that large investors that generate more commissions are likely to apply formore IPO shares. However, the economic and statistical significance of the relationshipbetween commission and allocation is robust to controlling for the market value of theinvestors portfolio, as well as to other investor characteristics. We conclude that investorsgenerating large stock-trading commission receives the most IPO shares because of thecommission they generate. Other investor characteristics are of less or no importance forIPO allocations.The empirical research on the allocation practices of investment banks have been ham-
pered by the lack of data on IPO allocations.35 Since information about stock-tradingcommissions are equally hard to come by, there is little empirical research on the relation-ship between commissions and allocations. One exception, and the paper closest to ours,is Reuter (2006) who finds a positive correlation between stock-trading commission paidby mutual funds to lead investment banks and the holdings in IPOs underwritten by thesame banks. This suggests, in general, that having a business relationship with the leadunderwriter increases the chance of getting shares in underpriced IPOs. In particular,it suggests that investors can “buy”allocations by channeling their trades through thebrokerage arm of the lead underwriter. In another related paper, Nimalendran, Ritter andZhang (2006) show that there is a positive relationship between money left on the tablein IPOs and trading volume in liquid shares around IPO allocation dates. This is indirectevidence of a positive relationship between trading commission and IPO allocations.The strength of our paper, compared to the existing literature, is that we are able to
analyze exact allocations at the investor level. In the main part of the paper, we study24,308 IPO allocations.36 The existing literature has suggested at least three potentialexplanations for what determines investment banks’decision of which investors are get-ting shares in oversubscribed IPOs. First, Benveniste and Spindt (1989) suggest thatinvestment banks allocate IPO shares to informed investors in return for a truthful reve-lation of their valuation of the issuer. Second, investment banks themselves tend to argue
35See Ritter (2003) and Jenkinson and Jones (2004) for papers that study IPO allocations and sum-marizes IPO allocation studies.36These exact allocations are from 30 different IPOs. In other words, there are 24,308 unique investor-
IPO combinations in our data. In robustness tests, we also study 162,384 investor-IPO pairs where theIPO allocation data might be contaminated with some post-IPO trading.
45

that they are looking for long-term investors. Third, investment banks allocate shares toinvestors that can provide some form of kickback.The empirical literature provides mixed results in terms of understanding IPO alloca-
tions in the light of the above three potential explanations.37 An important contributionof our paper is that we examine and contrast all three potential explanations simultane-ously. As already mentioned, our data strongly support the view that investors can securethemselves IPO allocations through large stock-trading commissions. We find no evidenceof a preferential treatment of buy-and-hold investors. Neither do we find any support forthe idea that investors get allocation in return for revealing private information aboutissuing firm value.The rest of paper is organized as follows: Section 3.2 describes the related literature.
Section 3.3 describes theoretical predictions and the testable implications. Section 3.4describes the data set. Section 3.5 gives the empirical results, and section 3.6 concludes.
3.2 Related literature
Ritter (2003) and Jenkinson and Jones (2004) argue that there are three views on howIPOs are allocated. First, is the academic view based on Benveniste and Spindt (1989).In this view, investment banks allocate IPO shares to informed investors in return fortrue valuation and demand information. Second, is the pitchbook view where invest-ment banks allocate shares to institutional investors that are likely to be buy-and-hold.Finally, is the rent seeking view where investment banks allocate shares to investors inreturn for kickbacks. Existing research have found support for each of these views andagainst the academic view and the pitchbook view. The existing research have investi-gated these views one by one. The exception is Jenkinson and Jones (2004) that comparesthe academic view to the pitchbook view.There are many papers that investigates the academic view alone, as described by
Benveniste and Spindt (1989). Cornelli and Goldreich (2001) investigate the order bookof 23 and 16 international IPOs and SEOs. They find that regularly participating, largebid and domestic participants are favored in allocations. They also find that bidders thatparticipate in both hot and cold issues are given larger allocations in hot issues. Cornelliand Goldreich (2003) investigate the order book of 37 and 26 international IPOs andSEOs. They find that bids from large, frequent bidders that include a limit price affectthe issue price. It is concluded that book-building is designed to extract information frominvestors. Ljungqvist and Wilhelm (2002) look at allocations between institutional andretail investors for 1,032 international IPOs. They find that institutional investors arefavored over retail investors. They find that an increased institutional allocation is linkedto a higher deviation from the midpoint of the book-building pricing range to the finaloffer price. It is concluded that underwriters use institutional bids to set the offer pricesin IPOs. Binay, Gatchev and Pirinsky (2007) investigate 4,668 U.S. IPOs and find thatunderwriters favor institutions they have previously worked with. A relationship with theunderwriter is more important in IPOs with strong demand, IPOs of less liquid firms andIPOs by less famous underwriters. It is argued that favoring regular investors is done toprice IPOs more correctly. Regular investors have incentives to report their true value inthe book-building so that they will be favored in future IPOs. Bubna and Prabhala (2007)investigate 137 Indian IPO allocations. They find that book-building and discretion in
37Table 1 summarizes related papers.
46

allocation enhances pre-market price discovery. All these papers are consistent with theacademic view of IPO allocationsThe two main papers that investigate the pitchbook view of IPO allocations are Jenk-
inson and Jones (2004) and Aggarwal (2002). Jenkinson and Jones (2004) study 27European IPO order books to compare the pitchbook view to the academic view. Theyfind that there is limited information gathering in the book-building procedure. Thisis inconsistent with the academic view. Jenkinson and Jones (2004) do, however, findevidence in favor of the pitchbook view and concludes that IPO allocations are made tobuy-and-hold investors. Aggarwal (2002) investigate the pitchbook view by looking atflipping activity of institutional and retail investors in 193 U.S. IPOs. It is found thatinstitutional investors flip a larger part of their IPO allocations than retail investors. Thisis taken as evidence against the pitchbook view. This view argues that institutions areallocated more IPO shares because institutions are more likely to be buy-and-hold thanretail investors.There are four types of IPO rent seeking that have led to investigations (and set-
tlements) between the SEC or NASD and different investment banks, see Liu and Rit-ter (2010).38 IPO allocations can be tied to future corporate business (IPO spinning),after-listing purchases of the IPO shares (IPO laddering) and stock-trading commissions.Issuing companies can also agree to heavy underpricing in return for after-listing coveragefrom star analysts provided by the investment bank (analyst conflict of interest). Theunderpriced shares are then allocated to clients that generate high commissions so thatthe investment bank is able to recapture some of the underpricing. All of these allocationpractices have been looked at in different studies. Liu and Ritter (2010) investigate IPOspinning, Fjesme (2011) investigate IPO laddering, Cliff and Denis (2004) investigate an-alyst conflict of interest and Reuter (2006) and Nimalendran, Ritter and Zhang (2006)investigate IPO allocations for commission trading.Reuter (2006) investigate if IPO allocations are tied to stock-trading commissions by
studying 1,868 IPOs on NYSE, AMEX and Nasdaq in the period 1996 to 1999. Reuter(2006) find a positive relationship between stock-trading commissions paid by mutualfunds to IPO lead underwriters and mutual fund holdings of IPO shares after the listing.It is concluded that commission generation is a likely reason behind IPO allocations formutual funds. Reuter (2006) establish a link between IPO allocations and stock-tradingcommission for mutual funds, but it is not investigated if commission is important forIPO allocations for other investor groups. Nimalendran, Ritter and Zhang (2006) studyinvestor trades in the 50 most liquid stocks in the U.S. during the days surrounding IPOallocations. They find that trading volume is positively related to money left on the tablein IPOs. It is suggested that this increased trading is done purely to increase stock-tradingcommission as payment for IPO share allocations. Both of these papers support the rentseeking view.
3.3 Theoretical predictions and testable implications
Investors are placed on A, B and C lists by investment banks before any IPO.39 Investorsfrom the A list, that applies for shares, are more likely to receive more IPO allocations
38Figure 1 describes the four types of IPO rent seeking.39The information about IPO allocation practices is obtained from meetings with former Norwegian
investment bankers.
47

than investors on the B lists etc.40 We do not know how investors are placed on the A,B and C lists, but we expect that this is related to the pitchbook, the academic and therent seeking view of IPO allocations. The investment bank prepares a list with proposedallocations after the book building/pricing of the IPOs that is given to the board of theissuing company. The board then decides IPO allocations based on this list. Anecdotalevidence suggests that most boards approve the proposed list without adjustments. Beingon the A list of the lead investment bank is therefore very important when applying forIPO shares.In this paper we test if information gathering, allocation to long term buy-and-hold
investors or rent seeking are likely reasons behind IPO allocations. We measure if provid-ing pricing information, price stability or stock-trading commission will place investors onthe A, B and C lists of the investment banks. The three allocation views are not mutuallyexclusive within or between IPOs. It is therefore possible that different IPOs are allocatedbased on different views. It is also possible that different investors are allocated sharesbased on different views within one IPO.
3.3.1 The rent seeking view of IPO allocations
Rent seeking is an area that have received allot of attention in the media, but there islimited empirical research on the rent seeking view of IPO allocations. A likely reasonfor this is that it is very hard to obtain data to test for rent seeking. Testing for moneytransfers from one bank account to another obviously requires very detailed data. Thecover-up activities needed to hide transfers as legitimate activities can be very creative.In this paper we focus on the rent seeking suggested in Reuter (2006) and Nimalendran,Ritter and Zhang (2006). We study if IPO allocations are related to generated stock-trading commission. In the Robert Stevenson settlement, an investment bank settled topay a fine for alledgedly tying IPO allocations to stock-trading commission, it was arguedthat clients both increased trading and increased commission rates per trade to receiveIPO shares.41 In the Norwegian data it is only possible to test if there is a relationshipbetween trading and allocations. It is not possible to detect changes in payments pertrade in the data. The data also only let us test for commission generation on monthlytrading.42 This means that it is possible that commission trading takes place even if itdoes not show up in the data.The rent seeking view is tested by regressing IPO allocations on stock-trading commis-
sion generated by the allocated investors and a set of control variables. Generated stock-trading commission is accumulated, per investors ID, over monthly portfolio changes inthe past 24 months prior to any IPO. Only buy generated commission is included to avoidany issues related to portfolio rebalancing (to make room for the new shares). If investorsthat generate more commission are also allocated more IPO shares, we conclude thatthe rent seeking view is an accurate view of IPO allocations. If there is no relationshipbetween commission and IPO allocations, we are not able to reject the rent seeking viewbecause it is possible to hide this type of trading. It is also tested if there is a link between
40Figure 2 describes all the steps in the IPO allocation process.41See January 9, 2003 NASD settlement http://www.finra.org/Newsroom/NewsReleases/2003/P00295742Commissions are generated from monthly data and not daily data. Because of this it is possible that
commission trading takes place even if we are not able to find it in our data set. If commissions aregenerated from daily buy and sell orders in the same shares we are not able to detect this. It is alsopossible that some investors pay higher commission rates to get allocations. This should, however, bediscovered in auditing.
48

the number of IPO participations and commission. If rent seeking is an active strategy,there will be a strong relation between stock-trading commission and the number of IPOparticipations by each investor. It is possible that investors that get repeated allocationsdo so because they generate high commissions. IPO investors with single time IPO allo-cation may be kept out of future IPOs because they do not generate suffi cient levels ofstock-trading commission.
3.3.2 The pitchbook view of IPO allocations
The pitchbook view of IPO allocations comes from the sales pitch slides of the investmentbanks (Ritter, 2003). In these slides it is usually argued that investments banks will usetheir power to allocate shares to long term buy-and-hold investors. It is argued, by theinvestment banks, that buy-and-hold investors will create price stability that is good forthe issuing company. If buy-and-hold is an accurate view of IPO allocations, investorsthat buy-and-hold IPO shares must also receive future IPO allocations. There must alsobe a punishment in terms of no (or at least less) future IPO allocations for investorsthat sell shares early (flipping investors).43An investment bank that underwrite manyIPOs will have a more reliable reward/threat system than less active investment banks.Therefore, it should also be more buy-and-hold investors in IPOs by active investmentbanks. It should also not be possible for investors to repeat a flipping strategy in IPOsby the same bank over time.44 If buy-and-hold investors do not have the potential threatof not receiving future allocations, there is no point of being buy-and-hold. If investorsthat continue to flip their shares still get IPO allocations, this is also support against thepitchbook view.The pitchbook view of IPO allocations is tested by splitting allocated IPO investors
into three groups. Group one investors flip their shares (sell all shares within the firstmonth after the listing), group two investors hold their shares in the long term (hold someshares longer than six months after the listing) and group three investors are all remaininginvestors.To control for past buy-and-hold and flipping we add the number of times each investor
has been, out of all past IPO participations, placed in group one or two. This will controlfor past buy-and-hold and past flipping activity in all previous IPO participations. Thepast buy-and-hold and the past flipping variables are calculated both on the total sampleand on a bank by bank basis. The pitchbook view is then tested by regressing IPOallocations on the past level of buy-and-hold and flipping. If investors are allocated sharesbecause they are buy-and-hold, the buy-and-hold variable will be positively related to IPOallocations and the flipping variable will be negatively related to IPO allocations. Since theviews are not mutually exclusive, it is possible that both buy-and-hold and stock-tradingcommission are important for IPO allocations. Because of this, past buy-and-hold andpast flipping are included as control variables when testing the other views as well.
43The rent seeking view and the academic view can be tested in one specific or several unrelated IPOs.The buy-and-hold view should, however, be tested in several related IPOs. The key of the buy-and-holdview is that investors that provide this service over time are allocated shares over time. Investors thathold shares in the long run are rewarded with more shares in the future. Investors that sell shares earlyare punished by no future allocations.44Flipping investors are normally meant to be investors that sell their allocated shares during the first
day of trading (Krigman, Shaw and Womack, 1999). We really want to test how selling shares earlyaffects future allocations. It is therefore more accurate for our analysis to include all shareholders thatsell their shares within the first month as flipping investors.
49

3.3.3 The academic view of IPO allocations
The idea of Benveniste and Spindt (1989) is that investment banks meet with informedinvestors to price the IPO shares. Investment banks use investor bids to build a demandcurve of the company shares. Investors are rewarded for their pricing service with IPOallocations that are underpriced on average. The academic view is controlled for byincluding a dummy variable that takes the value of one for all professional investors(financial institutions). It is possible that other investors, like non-financial institutionsor retail investors, are participating in pricing of the shares, but it is not expected thatthis is very common. Investment banks are more likely to meet with financial institutionswhen they price IPO shares. To test the academic view more directly we proceed inthe direction of Ljungqvist and Wilhelm (2002). The absolute percentage change fromthe midpoint in the initial pricing range to the actual offer price is used as the measureof pricing information. This measure should change when more pricing information iscollected. The percentage change from the midpoint in the pricing range to the offerprice is regressed on the combined allocation percentage to financial institutions and aset of control variables. If there is pricing information, the financial institution allocationpercentage will be related to the percentage change in the pricing range. When financialinstitutions are allocated IPO shares, there should be a significant effect on the price.This analysis can, however, only be performed at the company level on the 71 IPOs thatare priced through book-building.
3.4 Data
There are 403 new listings on the OSE in the period January 1993 to September 2007. Intotal, 193 of the 403 companies listed through private placements, cross listings, spin-offsto existing shareholders or directly without any offerings. There are 89 companies with noofferings to new shareholders. The remaining 210 companies listed through IPOs. Table2 gives the annual distribution of IPOs on the OSE in the period 1993 to 2007.In 30 of the 210 IPOs we have obtained 24,308 IPO allocations. (In 155 additional
IPOs we have obtained 162,384 IPO allocations that might be contaminated with after-listing trading. The 162,384 IPO allocations are used in robustness testing). One listingrequirement on the OSE is that all shareholders must be registered in the NorwegianCentral Depository (the VPS) before the listing. The number of shares owned by eachinvestor must be given to the VPS before any company can list publicly. This database is100% accurate, as it is not possible to list otherwise. The VPS database includes all share-holders in all companies that are publicly listed or intend to list publicly. This database isused to obtain the IPO allocations by taking the difference in company ownership beforeand after allocation dates.45 Only IPO allocations to new shareholders are investigated.
45In 16 of the 210 IPOs it has not been possible to calculate IPO allocations from the ownershipdata. These companies are listed in the database (VPS) in the same month as the listing month. Thesecompanies are therefore removed from the sample. In three companies there is missing allocation data,and in four companies it has not been possible to locate the pricing information (no offer price). TheseIPOs are therefore not included in the analysis. There are three privatizations in the period that areremoved. The final sample is 185 IPOs with allocation and pricing data. 210 IPO companies - 16companies that list in both VPS, OSE and IPO in the same month - 3 privatizations - 2 missing VPSdata - 4 missing prospectus and newspaper articles on pricing = 185 companies.
50

More allocations to existing shareholders are removed. Allocation dates are collected fromthe IPO listing prospectuses.Some companies list in the VPS database in years before the listing. Other companies
list in the VPS as part of the listing process. The number of shares by each investor ID isobserved at the end of each month. All companies list in the VPS, sell shares in the IPOand list on the OSE. Allocations, by investor ID, are calculated as the difference in com-pany share holdings before and after allocation dates. In terms of IPO allocations thereare three dates that are important in the listing process. When companies list in the VPSownership database, when companies distribute shares in the IPO and when companieslist on the OSE influence IPO allocations. Companies do this process in different orders.This leads to three different levels of detail in the obtained IPO allocations. All ownershipis observed on a monthly level, so if more than one listing event is performed within thesame calendar month we are not able to distinguish between the events. Figure 3 givesa detailed description of how the IPO allocations are obtained for the different companygroups.There are 15 savings banks (PCC list) out of the 210 IPOs on the OSE in the sample
period. In total, 14 and seven of these savings banks are in the 155 IPOs with allocationdata and in the 30 exact sample respectively. These banks are owned by the bank guar-antee fund before they are publicly listed. All results remain unchanged if the banks areincluded or not.
3.4.1 IPO allocations
Group one companies list their ownership records in the VPS database in good timebefore the IPO. These companies also list on the OSE in the calendar month after theIPO. For these companies the IPO allocations are completely accurate. There are 24,308IPO allocations in these 30 IPOs. Some of these allocations are the same investors thatare allocated shares in more than one IPO. IPO allocations for group one companies areobtained as the end of IPO month company ownership minus the ownership prior to theIPO month ownership. The owners that are left are the IPO allocated investors.46
3.4.2 After-listing ownership
Group two companies list in the VPS database in good time before the IPO, but thesecompanies list on the OSE in the same calendar month as the IPO allocation month.These companies have IPO allocations that include the actual IPO allocations and someafter-listing trading (150 companies out of 185). The IPO allocations for these companiesinclude the actual IPO allocations and between one and 30 days of after-listing trading.IPO allocations for group two companies are calculated as the listing month (and IPOallocation month) end of month company ownership minus the company ownership priorto the listing month. The investor holdings that are left are the allocated investors andthe investors that have purchased shares in the period between the listing day and theend of the listing month.47
46Over the counter (OTC) trading in the IPO allocation month will be treated as IPO allocations. Itis, however, not expected that OTC trading will be a big issue because few investors are likely to tradeshares in this period. Few IPO allocated investors are likely to sell their allocation and potentially loseout on the first day return. The average time between the IPO allocation and listing is less than twoweeks in the 30 IPOs.47Group two company IPO allocations includes some after-listing trading, but it is expected that most
of these allocations are actual IPO allocations. If past trading activity is important for current allocations,
51

Group three companies list in the VPS database in the same month as the IPO allo-cation month. These IPO allocations does not include any after-listing trading, but theyinclude existing owners who have not sold their shares (5 companies). IPO allocations forthese companies are calculated as the end of listing in the VPS month ownership (andIPO allocation month ownership). Previous owners for these companies are not removed.Group two and three companies are used in robustness testing.
3.4.3 Variable description
Company characteristics and the aggregate distribution of allocations between the differ-ent investor groups are given in Table 3. Market value is the total market value in USDat the listing date of the IPO company. This is calculated as the number of outstandingshares times the first day closing price. Book/Market is the book to market ratio of theIPO company at the listing date. This is calculated as the book value of equity, after theIPO, divided by the market value. Offer price is the actual offer prices in USD reportedin the listing prospectuses or in the newspapers after the listing. VC dummy is a dummyvariable that takes the value of one for companies with venture capital baking. High-techdummy is a dummy variable that takes the value of one for IT -companies. Year dummyare dummy variables for each of the 15 years in the sample period. Company dummyare dummy variables for each of the 185 companies in the sample. Lead manager IPOsis the number of times the lead manager has been lead in the sample period. There are32 different mangers in the 185 IPOs. There is one big manager that underwrites 23 outof the 185 IPOs. The ten biggest managers underwrite 144 of the 185 IPOs. There are14 different managers that underwrite the 30 sample IPOs. Lead manager market shareis the market share of the lead manager. This is calculated by the percentage marketcapitalization of the companies taken public out of total in the sample.Investor characteristics, for the individual investors on the OSE in the period 1993 to
2007, are described in Table 4. The dependent variable (Allocated shares/shares issued) isallocated shares to each investor divided by the total number of shares issued in the IPO.This is the same dependent variable as in Reuter (2006). The all IPO sample of 190,504IPO allocations (in 185 IPOs) is trimmed at 1% to 186,694 allocations. This has no effecton results. This is done to remove the most extreme IPO allocations. Commission isthe accumulated stock-trading commission generated by the investors in the two yearsbefore the IPO allocation dates.48 Commission is calculated as the monthly portfolioturnover times the share prices and a fixed percentage commission rate.49 Commission
this will be reflected in the data even if the data includes some after-listing trading. This is especiallytrue for the past buy-and-hold trading variables. Buy-and-hold investors will not sell their allocatedshares, so if past buy-and-hold behavior is important for future IPO allocations this will be observed inthe group two IPO allocations also. Group two IPO allocations can, however, not be used to reject thatflipping investors are not punished for selling shares early. This is because some of the flipping investorsare lost in the way the group two IPO allocations are obtained.48Commissions are generated from monthly data and not daily data. Because of this it is possible that
commission trading takes place even if we are not able to find it in our data set. If commissions aregenerated from daily buy and sell orders in the same shares, then we are not able to detect this. It isalso possible that some investors pay higher commission rates to get allocations. This should, however,be discovered in auditing.49We construct two separate data sets. In the first data set we obtain the allocated shares in the IPOs.
The second data set is constructed by using the allocated shares in the first data set. For all allocatedinvestors we collect the portfolio of publicly traded shares on OSE. We collect the change in the monthlyportfolio ownership for each investor and this is multiplied with the correct market stock prices and thestandard commission rates. The average commission rate offered by the 11 biggest internet share trading
52

is calculated as buy generated commissions only.50 Only commission by investors thatdo at least one trade in each of the four six months periods before the IPO is included.This has no effect on results as most investors trade in all four periods. This is doneto remove investors that buy a large block of a company in one period without tradingin the other periods. Generated commission below the minimum rate is replaced by thefixed minimum fee for one transaction ($15). The non-negative underpricing dummy is adummy variable that takes the value of one for all IPOs with zero or positive underpricing.The variable commission*D is commission times the non-negative underpricing dummy.This variable is used to test if generated commission is more important for allocations inIPOs with a non-negative underpricing. Portfolio value is the portfolio value, in millionUSD, for each allocated investor at 31.12.xx in the year before the IPO allocation date.Previous IPOs is the accumulated number of past IPO participations by investors
divided by the accumulated IPO number in the sample. This is used to measure howmany IPOs, out of all possible, each investor has participated in. Previous buy-and-holdis the accumulated previous number of times the allocated investor has been a buy-and-hold investor divided by all previous IPO participations. This is the number of times,out of all previous IPO participations, an investor has held some IPO allocated shares formore than six months. Previous flipping is the accumulated number of times an investorhas flipped previous IPOs divided by all previous IPO participations. Flipping is whenall shares are sold within one month after a listing. This is the number of times, outof all previous IPO participations, the investor has held all IPO allocated shares for lessthan one month. Held cold IPO dummy is a dummy variable that takes the value of oneif the IPO has a positive underpricing and the investor is allocated shares in a previousIPO with a negative underpricing. This variable is used to test if investors receive sharesin hot IPOs because they accepted allocations in past cold IPOs. The Previous IPOs,Previous buy-and-hold, Previous flipping and Held cold IPO dummy are calculated on all185 IPOs when allocations of the 30 exact IPOs are studied separately. The variables arealso recalculated on a bank by bank basis when the most active bank is studied separately.Financial institution dummy is a dummy variable that takes the value of one for investorsthat are either Norwegian or foreign financial institutions.
3.5 Empirical results
The main empirical result is that there is a strong and robust relationship between stock-trading commission generated in the period before IPO allocations and the number ofshares allocated in IPOs. This is true for all investor types (retail and institutions). Thereis no consistent relationship between previous IPO share holding periods and currentIPO allocations. There is also not more change in the pricing range of book-built IPOswhen more shares are allocated to financial institutions (or institutions in general). It isconcluded that IPO shares are allocated to the investors that generate the most stock-trading commission before the IPO allocations.
companies in Norway is 0.075%. Some investors are likely to buy shares directly from their broker at ahigher commission rate. We use the commission rate of 0.075% for all investors. The final number is themonthly commissions paid by each investor. The commission generated in each specific IPO is removed.50Sell generated commission variables are also related to IPO allocations. Only buy generated com-
mission in the 24 month period before the IPOs is used as commission This is to avoid any issues relatedto sell generated commissions from rebalancing portfolios before IPOs. The results are the same whendifferent measures of commission are used.
53

3.5.1 The rent seeking view of IPO allocations
From Table 5 it can be seen that there is a positive relationship between generated stock-trading commission and IPO allocations in the 30 IPO sample (group one companies).IPO allocated shares, scaled by total shares issued in the IPOs, is regressed on the accu-mulated stock-trading commission in the 24 month period before the IPO allocation and aset of control variables. The level of generated commission is highly related to the numberof allocated shares. This result control for investor size (measured by investor portfoliovalue), investor past trading behavior (past buy-and-hold, past flipping, past IPO partic-ipations and past accepted cold IPO allocations), investor type (financial institution ornot), company fixed effects, year fixed effects and company specific variables.The results are statistically significant even if the sample size in all regressions is
very large. All significance levels are correspondingly large to the sample sizes.51 Theresults are also economically significant. The point estimate for stock-trading commissionis about 0.1 for retail investors (and 0.05 for institutional investors). If stock-tradingcommission is increased by 10% for retail investors, the allocation percentage is increasedwith one percent, see Wooldridge (2003).Stock-trading commission is also calculated for only IPOs with a non-negative under-
pricing. E.g. Stock-trading commission is multiplied with an interaction dummy variablethat takes the value of one for IPOs with a non-negative underpricing. This new variable,Commission*D, is used to test if IPO shares are mainly allocated to investors with a highlevel of commission when IPOs are underpriced. The Commission*D is not always signifi-cant. This means that high commission investors are allocated more shares in general andnot only in underpriced IPOs.52 Investors that generate high commission rates are likelyto be preferred when they apply for IPO shares regardless of the expected underpricing.It is likely that high stock-trading commission will place investors on the A, B and Clists of the banks. When investors from these lists apply for shares, they are likely to beallocated shares. It seems unlikely that investment banks will discourage investors fromaccepting IPO allocations even if the issues may fall in price after the listing (even if theinvestors are from the A, B or C list). IPO allocations are also studied on the sub groupsonly retail investors and only institutional investors. The results remain unchanged.In Table 6 IPO allocations in group two and three are also included in the analysis.
From Table 6 it can be seen that there is a positive relationship between generated stock-trading commission and IPO allocations for all IPOs. The results remain unchangedwhen the IPOs that might be contaminated by after-listing trading are included in theanalysis. The number of IPO participations by each investor is also regressed on thestock-trading commission. The results are highly significant and explanatory. There isa strong relationship between generated stock-trading commission and the number ofinvestor IPO participations. This means that investors that generate more commissionare also participating in more IPOs than investors that generate less commission (notreported).
51Even if the sample sizes are reduced by a large factor and the corresponding t —statistics are reducedby the square root of this factor, the findings are still significant; see Kecskes, Michaely and Womack,2010.52Investors are, however, not likely to always know if IPOs will be under or overpriced. Investors are
likely to apply for the shares they want. It is not certain that it is always the expected underpricing thatdrives the IPO application. If this was the case, there would be no IPO applicants in overpriced issues.Investors are likely to apply for shares in some issues that will fall in price after the listing. It is alsolikely that investment banks will allocate to investors that generate high commission rates when theyapply for IPO shares.
54

3.5.2 The pitchbook view of IPO allocations
The pitchbook view of IPO allocations is controlled for by including the past number oftimes investors have been buy-and-hold or flipping, out of past IPO participations, in allregressions. The pitchbook view argue that IPO shares are allocated to investors that areexpected to be long term buy-and-hold investors. Buy-and-hold investors will create longterm price stabilization of the IPO shares. Long term buy-and-hold investors can developa relationship with investment banks and then be rewarded with future IPO allocations inreturn for previous buy-and-hold services. The long term investors will hold their sharesto avoid being blacklisted in future IPOs. From Table 5 (the exact IPO allocations) itcan be seen that the number of times an investor has been buy-and-hold in the past isnegatively related or unrelated to current IPO allocations. For retail investors there isactually a positive relationship between past flipping activity and current IPO allocations.In Table 6 (all IPO allocations) the exact same results appear. This indicates that thereis no or limited IPO allocations to buy-and-hold investors.The 30 exact IPOs are underwritten by several different investment banks. The same is
true when all 185 IPOs are studied together. It is possible that this is causing the results.In many listing prospectuses there are two to three participating investment banks. Itis then assumed that the bank that is mentioned first on the left side on the cover pageof the listing prospectus is the lead investment bank. The single most active bank is thelead underwriter in 23 (out of 185) IPOs in the sample period. To study the pitchbookview it is necessary to also study this sample separately.53
From Table 7 it can be seen that there is not allocations to buy-and-hold investorsfor the most active bank either. There is no significant relationship between previousholding periods and future IPO allocations when only the single most active bank isstudied separately. This is the exact same result as in Table 5 and Table 6. In Table7 (regression 2 and 4) investors are also classified as only buy-and-hold investors if theyhave never been flipping investors in the past. (E.g. An investors that has a positivevalue for flipping in the past will take a zero value for the buy-and-hold by definition).The results remain unchanged. We are not able to detect a positive relationship betweenlong holding periods and IPO allocations. It is concluded that the pitchbook view is nota likely reason behind IPO allocations.
3.5.3 The academic view of IPO allocations
The academic view of IPO allocations is controlled for by including a dummy variablethat takes the value of one for the expected pricing investors (financial institutions) inall regressions. In Table 8 the academic view is tested more directly. In Table 8 thepercentage price revision in book-built IPOs is regressed on the allocation percentageto financial institutions and a set of control variables. This is similar to Ljungqvist and
53Most of the IPOs of the very active banks are of the group two IPO allocations. This means thatthese IPO allocations includes from one to 30 days of aftermarket trading. We argue that this is of smallerimportance when we study the pitchbook view, as this view argues that the investors hold their sharesin the long run. The IPO allocations from group two will include the long term buy-and-hold investorsif they are really buy-and-hold investors. In the sample it is observed if investors that hold shares in thelong run are allocated more shares in future IPOs. The only problem is that some investors may buyshares after the listing and then hold these shares in the long run. These investors will be treated asbuy-and-hold investors in the data, but they will not be awarded with future shares. It is expected thatthere will be less of this type of investors than actual buy-and-hold if buy-and-hold is an accurate view.Group two IPOs allocations should therefore detect any IPO allocations in return for past buy-and-hold.
55

Wilhelm (2002) that regress the percentage price revision on the percentage IPO allocationbetween institutional and retail investors. Ljungqvist and Wilhelm (2002) show that IPOallocations to institutional investors have a significant impact on price revisions. FromTable 8 it can be seen that IPO allocations to financial institutions have no impact onthe percentage price revision in our sample. IPO allocations to financial institutions isactually negatively related to changes in the offer price in the book-building period. Thisindicates that there is no price information collected from financial institutions. The sameresult is found when total allocations to institutional investors is investigated separately.The sample size is, however, very low with only 71 book-built IPOs in the sample.
3.5.4 Robustness
As robustness we also test if there is a relationship between share ownership right afternew listings and generated stock-trading commission for companies with no IPO. Thereare 89 companies with a suffi cient share spread and equity value to list directly at theOSE without conducting an IPO first. These 89 straight listings are used as a comparablesample. From Table 9 it can be seen that there is a relationship between stock-tradingcommission and share holdings after the listing in non-IPO companies also, but that thisrelationship is weaker than for IPOs. Investor stock-trading commission is multipliedwith a dummy variable that takes the value of one for the IPO companies. After-listingownership for both IPO companies and non-IPO companies is regressed on stock-tradingcommission. The coeffi cient for the relation between stock-trading commission and IPOallocations is many times greater in IPOs than in non-IPOs. It is concluded that therelationship between after-listing share ownership and stock-trading commission is drivenby IPO allocations. In Table 9 the IPO allocations are also trimmed at 1%.In Table 10 the allocated investors are matched one for one with a non allocated
investor in a Tobit regression. These IPO allocations are also trimmed at the 1% level. Intotal 9,498 (out of 24,308 investors) are first observed in the data with their IPO allocation.These investors have no previous stock-trading commission, past trading or portfolio size.The remaining investors are matched one for one with a non-allocated investor with noIPO participations in the last 12 months on investor type, investor country and number ofshares in the portfolio. Among these investors the investor with the closest portfolio sizeis selected as the matching investor. The allocation percentage is then regressed on stock-trading commission and the control variables in a Tobit regression. The matching investorstake the value of zero for (Allocated shares/shares issued) because they are not allocatedIPO shares. We do not know if the matching investors applied for shares or not, butthe regressions in Table 10 show that the matching investors generated less stock-tradingcommission than the allocated investors before the allocations. This further indicatesthat the stock-trading commission was generated to receive IPO allocations. The level ofstock-trading commission is highly related to IPO allocations. This show that investorsthat are allocated IPO shares generate more stock-trading commission than investors thatare not allocated IPO shares (matching on investor type, investor country and portfoliovalue).
3.6 Conclusion
The main finding of the paper is that there is a strong and robust relationship betweenstock-trading commission generated by investors before IPO allocations and the number
56

of shares allocated in IPOs. The investors that generate the most stock-trading com-mission are also allocated the most IPO shares. This result is consistent for all investortypes, in all IPOs and in all sample years. This result control for the portfolio value of theallocated investors, past trading behavior (the pitchbook view) and investor types (infor-mation gathering view). The result is also robust to companies that do not conduct IPOsand investors who are not allocated IPO shares. The meaning of this result is that thereis a strong indication that investors are able to buy IPO allocations with stock-tradingcommission. The investors that are the most profitable clients, for the investment banks,are rewarded with the most IPO allocations. It can be argued that investors that trademore are also likely to apply for more IPO shares. The IPOs are, however, on averagehighly oversubscribed, so some investors are given more IPO allocations than other in-vestors. We show that the investors that generate the most stock-trading commission areallocated the IPO shares.There is no evidence that support the information gathering view. There is not a
bigger change in the percentage price revision from the midpoint in the pricing range tothe offer price when financial institutions, or institutions in general, are allocated moreshares. The sample size for the information gathering view is, however, too small tomake any meaningful inferences. There is also no support for the pitchbook view. Thereis no detectable relationship between past IPO share holding periods and current IPOallocations. Investors that hold shares in the long run are not allocated more future IPOshares. This is also true when IPOs are studied on a bank by bank basis. Some investorsare also able to obtain IPO allocations even if they repeatedly flip their shares.The conclusion is that more IPO shares are allocated to investors that generate more
stock-trading commission. IPO shares are allocated based on the rent seeking view of IPOallocations. This finding is consistent with Reuter (2006) and Nimalendran, Ritter andZhang (2007) in that IPO shares are allocated in return for stock-trading commission. Amain contribution to the previous literature is that we are able to combine all existingviews on IPO allocations in the same data set. We rank the views as the most to the leastimportant view. This has not been possible to do before. There is strong evidence sup-porting the rent seeking view. There is no evidence supporting the academic view or thepitchbook view when controlling for the rent seeking view. There are also some practicalimplications of the study. Investors should be able to increase IPO allocations by increas-ing their stock-trading commission before IPOs. Investors can also be able to increase IPOallocations by directing trades to investment banks that underwrite many IPOs. Thereshould also be more regulatory investigations into IPO allocation practices. It seems likethe exchange of IPO allocations with stock-trading commission is a widespread practice.There are some limitations to the study. It is not observed that stock-trading com-
mission is paid from the allocated investor to the investment bank. It is only observedthat the commission is generated. Commission is also calculated based on monthly data.This is likely to underestimates commission. For future research it would be interestingto study stock-trading commission that is paid directly to the investment bank for all theallocated investors on a daily basis.
57

References
[1] Aggarwal, Reena, 2002, Allocation of initial public offerings and flipping activity,Journal of Financial Economics 68, 111-135
[2] Benveniste, Lawrence M. and Paul A. Spindt, 1989, How investment bankers determinethe offer price and allocation of new issues, Journal of Financial Economics 24, 343-361.
[3] Binay, Murat M., Vladimir A. Gatchev and Christo A. Pirinsky, 2006, The role ofUnderwriter-Investor Relationships in the IPO Process, The Journal of Financial andQuantitative analysis 42, 785-809.
[4] Bubna, Amit and Nagpurnanand R. Prabhala, 2007, When BookbuildingMeets IPOs, AFA 2008 New Orleans Meetings Paper Available at SSRN:http://ssrn.com/abstract=972757
[5] Cliff, Michael T. and David J. Denis, 2004, Do Initial Public Offering Firms PurchaseAnalyst Coverage with Underpricing?, Journal of Finance 6, 2871-2901.
[6] Cornelli, Francesca and David Goldreich, 2001, Bookbuilding and strategic allocation,Journal of Finance 56, 2337-2369.
[7] Cornelli, Francesca and David Goldreich, 2003, Bookbuilding: How informative is theorder book?, Journal of Finance 58, 1415-1443.
[8] Derrien, François and Kent L. Womack, 2003, Auctions vs. Bookbuilding and theControl of Underpricing in Hot IPO Markets, The Review of Financial Studies 1, 31-61.
[9] Eckbo, Espen B. and Øyvind Norli, 2005, Liquidity risk, leverage and long-run IPOreturns, Journal of Corporate Finance 11, 1-35.
[10] Fjesme, Sturla Lyngnes, 2011, Laddering in Initial Public Offering Allocations, Work-ing paper, Norwegian Business School (BI).
[11] Hao, Qing (Grace), 2007, Laddering in Initial Public Offerings, Journal of FinancialEconomics, 85, 102-122
[12] Jenkinson, Tim and Howard Jones, 2004, Bids and Allocations in European IPOBookbuilding, Journal of Finance 59, 2309-2338.
[13] Kecskes, Ambrus, Roni Michaely and Kent Womack, 2010, What drives the Value ofAnalysts Recommendations: Earnings Estimates or Discount Rate Estimates?, Work-ing paper Cornell University.
[14] Krigman, Laurie, Wayne H. Shaw and Kent L. Womack, 1999, The persistence ofIPO mispricing and the predictive power of flipping, Journal of Finance 54, 1015-1044.
[15] Liu, Xiaoding and Jay R. Ritter, 2009, The economic consequences of IPO spinning,Forthcoming in Review of Financial Studies.
[16] Ljungqvist, Alexander P. and William J. Wilhelm, 2002, IPO allocations: discrimi-natory or discretionary?, Journal of Financial Economics 65,167-201.
58

[17] Loughran, Tim and, Jay Ritter, 2004, Why has IPO underpricing changed over time?,Financial Management 33, 5-37.
[18] Nimalendran, M., Jay R. Ritter, and Donghang Zhang, 2007, Do today’s trades affecttomorrows IPO allocations?, Journal of Financial Economics 84, 87-109.
[19] Pulliam, Susan and Randall Smith, Linux Deal is focus of IPO-Commission Probe,The Wall Street Journal, December 12, 2000.
[20] Reuter, Jonathan, 2006, Are IPO allocations for sale? Evidence from Mutual Funds,Journal of Finance 61, 2289-2324.
[21] Ritter, Jay, 1991, The long run performance of Initial Public Offerings, Journal ofFinance 46, 3-27.
[22] – – , Jay R. and Ivo Welch, 2002, A review of IPO activity, pricing and allocations,Journal of Finance 57, 1795-1828.
[23] – – , Jay R., 2003, Differences between European and American IPO markets, Eu-ropean Financial Management 9, 421-434.
[24] Rogers, W. H.,1993, Regression standard errors in clustered samples, Stata TechnicalBulletin 13, 19-23. Reprinted in Stata Technical Bulletin Reprints 3, 88—94.
[25] White, Halbert, 1980, A heteroskedastic-consistent covariance matrix estimator anda direct test of heteroscedasticity, Econometrica 48, 817-838
[26] Wooldridge, Jeffrey M., 2003, Introductory Econometrics A Modern Approach(Tsinghua, Tsinghua University Press, South-Western College Publishing ThompsonLearning).
59

Table 1Related Empirical Papers
Rent seeking view
Reuter (2006) Positive relationship between commission and
holdings of IPO shares after new listings
Nimalendran, Ritter and Zhang (2006) Positive relationship between money on table
and trading volume in liquid shares
Liu and Ritter (2010) Find evidence of IPO spinning
Cliff and Denis (2004) Find evidence of analyst conflict of interest
Academic view
Cornelli and Goldreich (2001) Regularly participating, large bid and domestic
participants are favored in allocations
Cornelli and Goldreich (2003) Bids from large, frequent bidders that
include a limit price affect the issue price
Ljungqvist and Wilhelm (2002) Increased institutional allocations results in
higher offer price deviations from the midpoints
of the book-building pricing ranges
Binay, Gatchev and Pirinsky (2007) Underwriters favor institutions they
have previously worked with
Bubna and Prabhala (2007) Book-building and discretion in allocation
enhances pre-market price discovery
Jenkinson and Jones (2004) Find evidence against the
academic view
Pitchbook view
Aggarwal (2002) Institutions flip more than retail investors
(Evidence against the pitchbook view)
Jenkinson and Jones (2004) Find evidence in favor
of the pitchbook view
60

Table 2The Number of Initial Public Offerings on the Oslo Stock Exchange
The column labeled "IPOs" lists the number of Initial Public Offerings on the Oslo Stock Exchange in
the sample period. The column labeled "Data" indicates the IPOs with allocation data. The column labeled
"Prospectus" lists the IPOs where we have been able to locate the listing prospectus. The column labeled
"Sample" lists the 30 sample IPOs. The columns labeled "Value of shares" list the annually aggregate million
USD values of shares sold in the IPOs with listing prospectus. "All", "New" and "Secondary" indicates
the value of all shares, only newly issued shares and shares sold by existing shareholders respectively. The
columns labeled "P" and "S" are the annual aggregated USD million value of shares sold in the IPOs
with prospectuses and in the 30 IPO sample respectively. Value of shares sold is reported in USD using a
USD/NOK exchange rate of 0.1792. The sample period is January 1993 through September 2007.
Number of IPOs Value of shares USD
All New Secondary
Year IPOs Data Prospectus Sample P S P S P S
1993 11 9 7 541 539 2
1994 18 12 11 5 626 392 218 142 409 250
1995 18 14 11 3 516 47 113 47 403
1996 14 12 8 3 146 89 65 9 81 80
1997 30 26 20 9 988 229 516 20 472 208
1998 15 11 11 2 233 95 190 94 43 1
1999 4 4 4 60 31 29
2000 12 12 11 2 839 112 765 90 74 22
2001 4 4 4 183 166 17
2002 2 2 2 2 70 70 64 64 6 6
2003 2 2 2 83 78 5
2004 14 14 14 1,605 1,319 287
2005 32 31 31 3 2,069 61 594 51 1,475 11
2006 18 17 17 2,730 2,237 493
2007 16 15 15 1 931 20 537 20 395
Total 210 185 168 30 11,621 1,130 7,431 550 4,190 580
61

Table 3Summary Statistics of Firms Going Public on the Oslo Stock Exchange
Panel A reports the average percentage distributions of the IPO allocations. The exact sample includes
the 30 IPOs with no after-listing trading. The total sample includes all 185 IPOs with IPO allocations.
Panel B reports the IPO company characteristics for the 185 and the 30 companies. "Market value (Mill
USD)" is the number of shares outstanding on the listing day times the first day closing price. "Offer price"
is the USD IPO price in the listing prospectuses. "Book/Market" is the book value of equity after the IPO
divided by the market value on the listing day. "VC backed dummy" is a dummy variable that takes the
value of one if the company has venture capital backing. "High-tech dummy" is a dummy variable that
takes the value of one for IT companies. "% change in pricing range" is change from the midpoint in the
pricing range to the offer price in book-building IPOs. "Lead manager IPOs" is the average number of
times the lead manager has been lead in the total 185 sample period. "Lead manager market share" is
the market share of the lead manager. This is calculated by the percentage market capitalization of the
companies taken public out of total in the sample. USD values are calculated from a USD/NOK exchange
rate of 0.1792. IPO allocations are trimmed at 1%.
Exact allocations Full Sample
Variable N Mean Std.Dev Median N Mean Std.Dev Median
A. Average Percent Allocation
Retail % 30 39.9% 19.5% 38.3% 185 41.9% 23.6% 40.4%
Norwegian non financial % 30 30.3% 16.6% 30.2% 185 24.5% 14.8% 23.2%
Norwegian financial % 30 16.4% 16.6% 10.9% 185 13.9% 12.2% 12.3%
Foreign % 30 7.9% 8.7% 3.7% 185 15.3% 17.5% 6.7%
Other % 30 5.5% 5.5% 3.2% 185 4.4% 5.2% 1.2%
B. IPO Characteristics
Market value (Mill USD) 30 $128 $135 $98.2 185 $291.2 $841.2 $101.4
Offer price USD 30 $11.4 $7.8 $8.2 185 $9.1 $6.9 $7.2
Book/Market 30 0.77 1.4 0.29 185 0.63 0.82 0.42
VC backed dummy 30 0.13 0.35 0 185 0.16 0.37 0
High-tech dummy 30 0.07 0.25 0 185 0.11 0.32 0
% change pricing range 30 0 0 0 71 8.3% 8.2% 7.3%
Lead manager IPOs 30 9.8 7.5 7 185 6.3 7.6 3
Lead manager market share 30 4.6% 11.9% 1.3% 185 3.1% 8.2% 0.5%
62
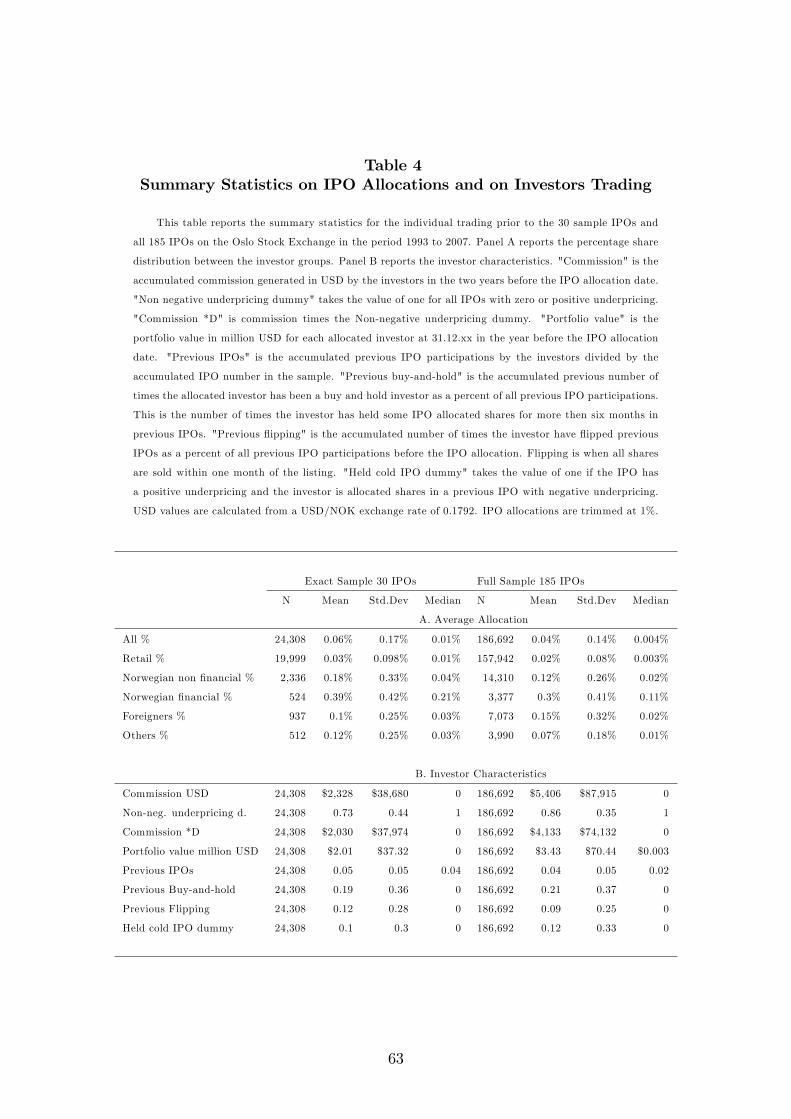
Table 4Summary Statistics on IPO Allocations and on Investors Trading
This table reports the summary statistics for the individual trading prior to the 30 sample IPOs and
all 185 IPOs on the Oslo Stock Exchange in the period 1993 to 2007. Panel A reports the percentage share
distribution between the investor groups. Panel B reports the investor characteristics. "Commission" is the
accumulated commission generated in USD by the investors in the two years before the IPO allocation date.
"Non negative underpricing dummy" takes the value of one for all IPOs with zero or positive underpricing.
"Commission *D" is commission times the Non-negative underpricing dummy. "Portfolio value" is the
portfolio value in million USD for each allocated investor at 31.12.xx in the year before the IPO allocation
date. "Previous IPOs" is the accumulated previous IPO participations by the investors divided by the
accumulated IPO number in the sample. "Previous buy-and-hold" is the accumulated previous number of
times the allocated investor has been a buy and hold investor as a percent of all previous IPO participations.
This is the number of times the investor has held some IPO allocated shares for more then six months in
previous IPOs. "Previous flipping" is the accumulated number of times the investor have flipped previous
IPOs as a percent of all previous IPO participations before the IPO allocation. Flipping is when all shares
are sold within one month of the listing. "Held cold IPO dummy" takes the value of one if the IPO has
a positive underpricing and the investor is allocated shares in a previous IPO with negative underpricing.
USD values are calculated from a USD/NOK exchange rate of 0.1792. IPO allocations are trimmed at 1%.
Exact Sample 30 IPOs Full Sample 185 IPOs
N Mean Std.Dev Median N Mean Std.Dev Median
A. Average Allocation
All % 24,308 0.06% 0.17% 0.01% 186,692 0.04% 0.14% 0.004%
Retail % 19,999 0.03% 0.098% 0.01% 157,942 0.02% 0.08% 0.003%
Norwegian non financial % 2,336 0.18% 0.33% 0.04% 14,310 0.12% 0.26% 0.02%
Norwegian financial % 524 0.39% 0.42% 0.21% 3,377 0.3% 0.41% 0.11%
Foreigners % 937 0.1% 0.25% 0.03% 7,073 0.15% 0.32% 0.02%
Others % 512 0.12% 0.25% 0.03% 3,990 0.07% 0.18% 0.01%
B. Investor Characteristics
Commission USD 24,308 $2,328 $38,680 0 186,692 $5,406 $87,915 0
Non-neg. underpricing d. 24,308 0.73 0.44 1 186,692 0.86 0.35 1
Commission *D 24,308 $2,030 $37,974 0 186,692 $4,133 $74,132 0
Portfolio value million USD 24,308 $2.01 $37.32 0 186,692 $3.43 $70.44 $0.003
Previous IPOs 24,308 0.05 0.05 0.04 186,692 0.04 0.05 0.02
Previous Buy-and-hold 24,308 0.19 0.36 0 186,692 0.21 0.37 0
Previous Flipping 24,308 0.12 0.28 0 186,692 0.09 0.25 0
Held cold IPO dummy 24,308 0.1 0.3 0 186,692 0.12 0.33 0
63

Table 5IPO Allocations and Generated Commission for the 30 Sample IPOs
This table reports the coeffi cients and heteroscedastic consistent t -statistics (errors adjusted for clus-
tering across firms Rogers, 1993) in parentheses for the regressions with the number of allocated shares
divided by the total number of shares issued in the IPO as the dependent variable. This is a standard OLS
model. Only the 30 IPOs with exact allocations in the sample period September 1993 to January 2007
are included. All variables are as described in Table 3 and Table 4. Regression 1 includes all investors.
Regression 2 includes only retail investors. Regression 3 includes only institutional investors. In Regression
4 and 5 the investors with zero in commission in the 24 month period before the new listings are dropped.
In Regression 6 the savings banks (7) are removed. IPO allocations are trimmed at 1%.
Log (Allocated shares/shares issued) %
Reg 1 Reg 2 Reg 3 Reg 4 Reg 5 Reg 6
Intercept 4.356 -16.1345 2.5336 -0.9762 -3.2502 5.0669
(19.3) (-48.0) (8.6) (-2.5) (-8.3) (48.5)
Log (commission) 0.0949 0.0961 0.0539 0.081 0.0487 0.0962
(5.7) (5.8) (3.2) (7.9) (3.4) (7.4)
Log (commission) *D -0.0714 -0.077 -0.0277 -0.0561 -0.0237 -0.0522
(-3.6) (-3.5) (-1.5) (-4.0) (-1.4) (-2.8)
Non-negative underpricing D. 0.6562 2.7586 -1.1431 0.3261 -0.1382 -3.3122
(18.5) (3.5) (-21.7) (5.9) (-1.6) (-75.9)
Log (portfolio value) 0.0513 0.0327 0.0668 0.035 0.0768 0.0404
(4.3) (3.5) (5.8) (4.1) (5.9) (3.5)
Previous IPOs 0.8032 -0.321 0.8488 -0.6907 0.4453 -0.1461
(1.0) (-0.7) (0.9) (-1.8) (0.4) (-0.2)
Previous buy-and-hold -0.1286 -0.0798 -0.03 -0.0711 -0.0119 -0.1544
(-2.7) (-2.3) (-0.4) (-1.6) (-0.1) (-3.1)
Previous flipping 0.1446 0.2016 -0.2193 0.2568 -0.0388 0.1295
(2.4) (3.5) (-1.7) (4.3) (-0.4) (2.1)
Held cold IPO dummy 0.0788 0.0087 -0.0106 -0.0005 0.0418 0.0506
(1.2) (0.2) (-0.1) (-0.0) (0.5) (0.6)
Financial institution dummy 1.8786 dropped 0.5319 dropped 0.502 1.1784
(10.2) (3.9) (3.6) (6.3)
Log (market value) -0.4328 0.4991 -0.3657 -0.2573 -0.0861 -0.5397
(-29.8) (30.2) (-20.5) (-12.0) (-4.8) (-59.1)
BV / MV equity 0.316 0.5386 0.3979 0.3877 0.4329 dropped
(28.1) (62.6) (51.7) (83.1) (32.3)
Offer price 0.0069 -0.0103 0.0001 -0.0034 0.0063 0.0084
(14.0) (-35.3) (0.3) (-33.8) (13.5) (24.1)
VC backed dummy 1.6586 0.69 0.7532 -0.4467 0.3223 5.5484
(16.9) (9.6) (12.7) (-8.5) (2.7) (39.3)
High-tech dummy dropped 4.433 -1.7555 0.1653 dropped -7.8126
(201.3) (-17.5) (2.5) (-77.9)
Year and Company dummy yes yes yes yes yes yes
Observations 24,308 19,999 4,309 10,207 2,876 16,593
Adjusted R -squared 42.4% 49.1% 34.6% 42.5% 31.5% 42%
Investor group All Retail Institution Retail Institution All
64

Table 6IPO Allocations and Generated Commission for All 185 IPOs
This table reports the coeffi cients and heteroscedastic consistent t -statistics (errors adjusted for clus-
tering across firms Rogers, 1993) in parentheses for the regressions with the number of allocated shares
divided by the total number of shares issued in the IPO as the dependent variable. This is a standard OLS
model. All 185 IPOs in the sample period September 1993 to January 2007 are included. All variables are
as described in Table 3 and Table 4. Regression 1 includes all investors. Regression 2 includes only retail
investors. Regression 3 includes only institutional investors. In Regression 4 and 5 the investors with zero
in commission in the 24 month period before the new listings are dropped. In Regression 6 the savings
banks (14) are removed. IPO allocations are trimmed at 1%.
Log (Allocated shares/shares issued) %
Reg 1 Reg 2 Reg 3 Reg 4 Reg 5 Reg 6
Intercept -4.185 -14.8485 -4.9007 -12.9069 -0.0259 -8.818
(-29.8) (-85.7) (-29.1) (-141.4) (-0.1) (-40.7)
Log (commission) 0.0679 0.0384 0.0608 0.0392 0.0612 0.0674
(6.1) (4.3) (5.3) (6.3) (5.7) (5.9)
Log (commission) *D 0.014 0.0079 0.02359 0.0031 0.0164 0.0187
(0.6) (0.5) (1.1) (0.3) (1.0) (0.8)
Non-negative underpricing D. -4.1829 -1.2985 -0.9574 -1.2387 -0.4123 -1.14076
(-70.8) (-24.6) (-8.0) (-36.4) (-4.2) (-12.5)
Log (portfolio value) 0.042 0.0285 0.057 0.0296 0.0678 0.0403
(13.4) (9.7) (13.3) (9.7) (11.6) (13.8)
Previous IPOs -1.1269 -1.067 -0.6539 -1.1515 -0.6968 -1.3911
(-1.6) (-2.5) (-0.9) (-3.7) (-1.5) (-2.0)
Previous buy-and-hold 0.0396 0.115 -0.1148 0.0445 -0.1463 0.0424
(0.3) (1.0) (-2.0) (0.5) (-3.9) (0.3)
Previous flipping 0.2679 0.3299 -0.1543 0.3323 -0.1023 0.272
(3.0) (4.2) (-1.7) (5.4) (-1.3) (2.9)
Held cold IPO dummy 0.0805 0.04 0.0486 0.0518 0.0673 0.0877
(2.4) (1.3) (1.0) (2.0) (1.4) (2.4)
Financial institution dummy 1.1915 dropped 0.6573 dropped 0.6003 1.8942
(18.2) (8.0) (8.3) (16.2)
Log (market value) 0.0987 0.4584 -0.0064 0.4066 -0.0336 0.1266
(21.0) (48.0) (-2.6) (126.7) (-12.6) (15.3)
BV / MV equity -0.0094 0.0979 0.1429 0.0984 0.1518 2.1588
(-0.9) (8.2) (22.1) (10.5) (12.2) (31.2)
Offer price 0.0055 -0.0138 0.0085 -0.0125 -0.0025 -0.001
(51.6) (-39.3) (40.7) (-76.0) (-6.5) (-5.8)
VC backed dummy 1.6097 -1.9087 -0.2361 -2.2017 -0.6031 -0.3591
(18.5) (-322.9) (-6.0) (-258.2) (-56.1) (-23.4)
High-tech dummy -0.2622 2.2149 -1.0701 2.4697 -0.0991 0.2558
(-3.5) (69.0) (-11.4) (66.8) (-2.9) (8.1)
Year and Company dummy yes yes yes yes yes yes
Observations 186,692 157,942 28,750 94,362 21,195 175,382
Adjusted R -squared 79.5% 84.2% 53.4% 83.3% 48.6% 79.5%
Investor group All Retail Institution Retail Institution All
65

Table 7IPO Allocations to Buy-And-Hold Investors
This table reports the coeffi cients and Clustered (Rogers, 1993) heteroscedasticity consistent t-statistics
in parentheses for the regressions with the number of allocated shares divided by the total number of shares
issued in the IPO as the dependent variable. All variables are as described in Table 3 and Table 4. All
regressions are standard OLS models, and the sample period is from January 1993 to September 2007. Only
the 23 IPOs by the most active bank in the sample period is investigated. Previous trading variables are
only in past IPOs by the most active bank. Regression 1 and 2 includes all IPO allocations. Regression
3 and 4 includes only allocation in the 13 underpriced (hot) IPOs. Regression 2 and 4 includes only past
buy-and-hold for investors who have never been flipping investors before. IPO allocations are trimmed at
1%.
(Allocated shares/shares issued) %
Reg 1 Reg 2 Reg 3 Reg 4
Intercept 0.0668 0.0668 0.0317 0.0315
(58.3) (57.7) (26.9) (26.1)
Log (commission) 0.0038 0.0038 0.0007 0.0007
(8.5) (8.9) (3.5) (3.4)
Log (commission) *D -0.0031 -0.0031
(-6.1) (-6.3)
Non-negative underpricing D. -0.0036 -0.0004
(-0.2) (-0.2)
Log (portfolio value) 0.0002 0.0002 0.0002 0.0002
(3.3) (3.4) (3.1) (3.2)
Previous IPOs -0.0016 0.0013 -0.0004 0.001
(-0.6) (0.4) (-0.2) (0.3)
Previous buy-and-hold 0.0003 -0.0004 00005 -0.0002
(0.4) (-0.4) (0.7) (-0.2)
Previous flipping 0.0034 0.001
(1.3) (0.7)
Held cold IPO dummy 0.001 0.0012 0,002 0.0022
(0.5) (0.7) (1.1) (1.2)
Financial institution dummy 0.0315 0.0314 0.0285 0.0285
(4.2) (4.3) (4.0) (4.0)
Log (market value) -0.0025 -0.0025 -0.0005 -0.0005
(-15.0) (-14.6) (-8.3) (-8.4)
BV / MV equity 0.0002 0.0001 0.0002 0.0001
(0.6) (0.3) (0.3) (0.2)
Offer price -0.002 -0.0002 -0.0003 -0.0003
(-16.8) (-16.3) (-65.2) (-63.6)
VC backed dummy -0.0283 -0.0284 dropped dropped
(-40.8) (-43.9)
High-tech dummy 0.0101 0.0101 0.0068 0.007
(20.7) (20.1) (10.6) (10.6)
Year dummy and Company dummy yes yes yes yes
Observations 67,795 67,795 63,539 63,539
Adjusted R -squared 33% 33% 20.4% 20.4%
Included IPOs 22 22 13 13
66

Table 8IPO Allocations in Return for Pricing Information
This table reports the coeffi cients and White (1980) heteroscedasticity consistent t -statistics in paren-
theses for the regressions with the absolute percentage change in the price revision as the dependent variable.
This is a standard OLS model, and all book-built IPOs in the sample period from January 1993 to Septem-
ber 2007 are included. All variables are described in Table 3 and Table 4. Regression 1 includes "Financial
institution allocation %" in all book-built IPOs. Regression 2 includes "Institutional allocation %" in all
book-built IPOs.
Absolute % price revision
Reg 1 Reg 2
Intercept 17.7888 11.9459
(2.3) (1.1)
Financial institution allocation % -0.1046
(-2.0)
Institutional allocation % -0.0022
(-0.0)
Log (market value) -0.472 -0.2403
(-1.1) (-0.5)
BV / MV equity -1.3576 -1.4011
(-0.5) (-0.5)
Offer price 0.016 0.0008
(0.5) (0.0)
VC backed dummy 3.6374 4.1113
(1.5) (1.6)
High-tech dummy 1.2246 0.2923
(0.5) (0.1)
Observations 71 71
Adjusted R -squared 5.8% 0.4%
67

Table 9Commission and Share holdings of Newly Listed Companies with No IPO
This table report the coeffi cients and Rogers (1993) clustered (on company) heteroscedasticity con-
sistent t-statistics in parentheses for the regressions with the shares owned per investor at the end of the
listing month divided by outstanding shares in the listed company as the dependent variable. There are 89
companies that list with no offering to new shareholders. The regression is a standard OLS model, and the
sample period is from January 1993 to September 2007. Regression 1 includes allocations and after-listing
ownership in all 185 IPO companies and all 89 companies with no IPO. The dummy IPO takes that value
of one for all investors in the 185 IPOs and zero for all the investors in the 89 non-IPO companies. "Log
(commission) * Dummy IPO" is investor commission in all IPOs and zero commission in all 89 non-IPOs.
IPO allocations and after-listing ownership are trimmed at 1%.
Variables (Shares holdings/shares outstanding) %
Reg 1
Intercept 0.1697
(7.0)
Commission 0.00000
(7.3)
Commission * Dummy IPO 0.0048
(4.7)
Dummy IPO 0.1679
(370.1)
Portfolio value 0.0000
(3.5)
Previous IPOs 0.1208
(4.3)
Previous buy-and-hold -0.00062
(-5.5)
Previous flipping 0.005
(2.6)
Financial institution dummy 0.127
(11.4)
Year and Company dummy yes
Observations 374,584
Adjusted R -squared 22.6%
68

Table 10Matching Allocated Investors with Non-Allocated Investors
This table reports the coeffi cients and Rogers (1993) heteroscedasticity consistent t -statistics in paren-
theses for the regressions with the number of allocated shares divided by the total number of shares issued
in the IPO as the dependent variable. This is a standard Tobit regression. Allocated investors with previous
trading are matched one for one with a non-allocated investor. The non-allocated investors takes a value of
zero for "(Allocated shares/shares issued) %". IPO allocations are trimmed at 1%. Regression 1 includes
all exact IPO allocations and matched investors that did not receive IPO allocations. Regression 2 includes
only investors with a positive level of commission.
(Allocated shares/shares issued) %
Reg 1 Reg 2
Intercept -0.1971 -0.2331
(-12.9) (-20.1)
Log (commission) 0.0079 0.0106
(6.7) (7.8)
Log (commission) *D -0.0038 -0.0037
(-2.1) (-1.6)
Non-negative underpricing D. 0.0465 0.0174
(7.1) (1.2)
Log (portfolio value) -0,0001 0.0003
(-0.4) (0.9)
Previous IPOs 0.5768 0.5341
(5.5) (4.7)
Previous buy-and-hold -0.006 -0.0055
(5.5) (-1.2)
Previous flipping 0.0076 0.0124
(1.3) (1.8)
Held cold IPO dummy -0.0152 -0.0138
(-3.4) (-3.2)
Financial institution dummy 0.0914 0.0747
(8.4) (6.6)
Log (market value) 0.0077 0.0079
(10.4) (14.2)
BV / MV equity 0.0136 0.0134
(14.8) (20.1)
Offer price -0.0001 0.0004
(-3.8) (15.9)
VC backed dummy 0.0461 0.0334
(7.6) (24.1)
High-tech dummy 0.2516 0.0268
(79.8) (12.4)
Year dummy, Company dummy yes yes
Observations 38,973 27,774
Pseudo R -squared 16.9% 10.5%
69

Figure 1The different IPO Allocation Views
Ritter (2003) and Jenkinson and Jones (2004) argue that there are three views on how IPOs are
allocated. First, is the academic view based on Benveniste and Spindt (1989). In this view investment
banks allocate IPO shares to informed investors in return for true valuation and demand information.
Second, is the pitchbook view where investment banks allocate shares to institutional investors that are
likely to be buy-and-hold. Finally, is the rent seeking view where investment banks allocate shares to
investors in return for some form of kickback.
The Rent seeking view of IPO allocations
Commission Shares are allocated to investors that generate
high levels of stock-trading commissions.
IPO spinning Shares are allocated to company executives to attract
corporate business.
IPO laddering Shares are allocated to investors that will provide
after-listing share price support. Underpriced shares are
allocated to investors that generate high
stock-trading commissions.
Analyst overage Companies accept underpricing in exchange for future.
research coverage. Underpriced shares are allocated
to investors that generate high stock-trading commissions.
The pitchbook view of IPO allocations
Shares are allocated to investors that are expected to be
buy-and-hold. This will create long run price stability.
The academic view (information gathering) of IPO allocations
Shares are allocated to investors that report true share values.
Shares are exchanged with price information.
70

Figure 2Timeline of the Listings on the Oslo Stock Exchange
Listing in the VPS is when the company list ownership records in the ownership database. This is
when the ownership records are observed in the data the first time. Public Offering is when the companies
distribute the allocated shares in the ownership database. The public offering is in most cases in the month
before (30 exact IPOs) or the month of the listing (150 IPOs).
Timeline of the listing
Company list shares in the VPS database
Six months before the listing
The company selects an investment bank
The initial meeting between company, investment bank and the OSE
Compliance report is finalized by the investment bank
The legal and accounting due diligence is performed
The formal application is submitted to the OSE
Prospectus is finalized and distributed
IPO shares are priced through meetings with investors
One month before the listing Shares are transferred in the Public Offering
Listing month Listing
71

Figure 3Timeline of the IPO allocations for the different groups
Listing in database is when the company list ownership records in the ownership database. This is
when the ownership records are observed in the data the first time. IPO allocation is when the companies
distribute the allocated shares in the ownership database. Group 1 to 3 is the ordering of the group of
detail in the allocations. Group 1 is 100% accurate IPO allocations. Group 2 IPO allocations includes one
to 30 days of after-listing trading. Group 3 IPO allocations includes existing owners who have not sold all
of their shares in the IPO. There are 30, 150 and 5 companies in group 1, 2 and 3 respectively.
Timeline of the listing Six months before One month before Listing month
the listing the listing
Group 1 Listing in database IPO allocation Listing
Group 2 Listing in database IPO allocation
Listing
Group 3 Listing in database Listing
IPO allocation
72

.
4 Initial Public Offering or Initial Private Placement?
Sturla Lyngnes Fjesme54
BI Norwegian Business School
Øyvind NorliBI Norwegian Business School
.
.
.
.
.
Abstract
This paper studies the choice between an auction and a negotiation whenselling a large fraction of a company. Using detailed data on ownership struc-ture in 123 public offerings and 88 negotiated private placements, we showthat negotiated private placements are much more common when there aresignificant private benefits of control. This finding supports the idea that anegotiated transaction allow the seller to extract more of the gains from tradewhen the gains from trade include private benefits.
JEL classification: G24
Keywords: Private Placements; Public Offerings; IPOs; Equity offerings
54We are grateful to "The Center for Corporate Governance Research (CCGR)" at BI NorwegianBusiness School for financial support, to Øyvind Bøhren, François Derrien, and seminar participants atBI Norwegian Business School for valuable suggestions, and the Oslo Stock Exchange VPS for providingthe data. All errors are our own.Corresponding author: BI Norwegian Business School, Nydalsveien 37, 0484 Oslo, Norway, E-mail
address: [email protected], Telephone: +47-957-722-43
73

4.1 Introduction
Stock exchanges have stringent rules on minimum equity levels and the minimum numberof shareholders that are required to list publicly. Most private companies must issue equityto be able to meet these minimum requirements. Shares can either be sold in an IPO toa large group of dispersed investors or in a negotiated private placement to a small groupof specialized investors. Most theoretical papers on equity offerings show that publicofferings will almost always be preferred by the seller, so why some companies use privateplacements has been the focus of many empirical studies in finance. The research questionaddressed in this paper is whether private placements are used to transfer private benefitsof control from the seller to the buyer. The new and unique data in this paper includesinvestor level ownership and audited financial statements in 88 private placements and123 public offerings during their listing on the Oslo Stock Exchange (OSE) in the period1993 to 2007.The main contribution of the paper is that we show a strong and robust relationship
between private benefits of control before the initial equity offering and the use of privateplacements55. This suggests that sellers of a company use private placements to transferprivate benefits of control to buyers. Private placements are used by family firms and firmswith controlling owners before the offerings. Public offerings are used by companies withmore dispersed ownership before the offerings. Companies that use private placementsalso have more block ownership after the listings. Public offerings reduce block ownership.The main implication of this finding is that companies with low private benefits of controlshould be sold in public offerings and companies with higher private benefits of controlshould be sold in private placements. The finding also have implications for research onauctions and negotiations. When auctions are structured like IPOs and there are largeprivate benefits of control, the seller is likely to prefer a negotiation over an auction.Several papers have proposed explanations to the private placement choice made by
some companies. Some papers argue that private placements are used to attract valuecreating investors such as monitoring or certification investors (Wruck, 1989; Hertzel andSmith, 1993). These investors ensure that companies are run optimal or put their stamp ofapproval on company valuations. Other papers suggests that private placements are usedwhen buyers value private benefits of control (Zingales, 1995; Zingales, 1994; Zwiebel,1995 and Damodaran, 2005).Most existing research on private equity offerings are on SEOs by publicly listed com-
panies. The reason for this is likely to be that there are more available data on publiclylisted companies. Only investigating public companies is problematic for this researchquestion because this leaves out the major equity offerings taken place before the ac-tual listing. Many of the companies that list on the OSE through private placementshave follow-on public and employee offerings before the listing. This shows that privateplacements must often be used in connection with a follow-on offering to meet listingrequirements. This also show that the private or public choice is not dictated by theminimum size listing requirements.55The agency problem investigated is between large owners and small owners. Large owners have a
controlling benefit at small owners expense. Throughout the article, we mean the private benefit ofcontrolling the firm enjoyed by the controlling/big shareholders at the expense of smaller owners whenthe term private benefit of control is used. Other agency problems, that we do not study, can for instancebe between owners and managers in the firm.
74

Derrien and Kecskés (2007) show that many U.K. companies lists publicly withoutissuing equity and that these companies issue equity in a SEO after the listing. Thistwo-stage listing is cheaper than the normal IPO. On the OSE there are only a limitednumber of companies that are allowed to use this two-stage process. In most listings onthe OSE the offering is a requirement to list. The choice faced by most companies is not ifthere should be an offering before or after the listing. The choice is if the required offeringshould be public, private or to existing shareholders. Few companies have an existingshareholder base that can cover the offering in full. Listing rules require that there mustbe at least 500 owners to list on the main list of the OSE (100 at the Small and MediumSized SMB/Axess list). Only 21 out of 403 companies have listings with only an offerto existing shareholders. Therefore, the main choice at the OSE is between a negotiatedprivate placement and an IPO. This makes the OSE an ideal market to study the choicebetween IPOs and private placements.The remaining paper is organized as follows. Section 4.2 describes related literature.
Section 4.3 describes the road to the listing. Section 4.4 describes predictions and testableimplications. Section 4.5 and 4.6 describes the data set and the empirical results. Section4.7 concludes.
4.2 Literature review
There are many theoretical papers that study the equity sales process.56 Bulow and Klem-perer (1996, 2009) compare auctions to negotiations and sequential sales mechanisms.57
Bulow and Klemperer (1996) show that for a seller it is better to sell in an auction with(N+1) bidders than in a negotiation with N bidders. The seller should therefore focuson maximizing the number of bidders and not focus on finding a single bidder to nego-tiate with. The exception to this rule is when more information must be disclosed inthe auction. When more information, that can possible reduce the future asset value forthe final owner, is disclosed in the auction, it is possible that the negotiation is moreprofitable for the seller than the auction. Bulow and Klemperer (2009) show that buyers(usually) prefer to buy in a sequential sale (negotiation), and sellers (usually) prefer tosell in an auction. The exception to this finding is when the marginal revenue curve ofthe winner is very flat, there are many potential bidders and the bidder cost of obtainingvalue information is neither too high nor to low. French and McCormick (1984) find thatnegotiations should be used instead of auctions when there is an ongoing relationshipbetween bidder and seller, there is a low asset value difference between bidder and seller,there is a low asset value difference between different bidders and the actual negotiationcost is low compared to auctions.Zingales (1995) propose that the buyer of a company can have a higher company
value than the current owner from either an increase in the private benefits of controlor an increase in the cash flow. By selling to dispersed shareholders the proceeds fromthe sale of cash flow rights are maximized. Through bargaining with a buyer the sellermaximizes proceeds from the sale of control rights. Zingales (1994) argue that one of
56Table 1 summarizes all related papers.57IPOs are not really open auctions, and private placements are not really negotiations in the exact
same sense as used in all of the literature. There are, however, large similarities between IPOs andauctions and private placements and negotiations, and we therefore include a literature review on theauctions and negotiations literature. We also expect that our findings may have implications for researchon auctions.
75

the most common areas of private benefits of control is dilution of minority propertyrights. This shows that there should be some smaller investors in the companies that useprivate placements. It is also argued that control is more valuable during proxy contests.Damodaran (2005) argues that the value of a block of shares comes from the ability toinfluence control by changing the way the business is currently run. Damodaran (2005)argues that block shares are sold at a premium compared to dispersed shares. Valueof control can be calculated as the value of the firm assuming that it is optimally runminus the status quo value of the firm. Control of a firm does not necessarily require51% of shares if the remaining shares are sold to a dispersed group of shareholders.Zwiebel (1995) investigates smaller block shares. It is argued that there are benefits ofhaving blocks that are smaller than controlling stakes from partial benefits of control.Smaller block holders can join together and get control if desired. Private benefits ofcontrol can be the ability of owners, management or directors to dilute corporate fundsfor private benefits.58 Private benefits can also be synergies obtainable through mergers(during takeover contests opposing sides actively recruit block shareholders), favors byfirms, access to inside information, perquisites of control and utility derived directly frompower of control. Some firms, such as sports and communication firms, are likely to yieldprivate benefits from the nature of their business. Stoughton and Zechner (1998) arguethat IPOs are allocated to institutions to increase monitoring.Several empirical papers propose explanations to the private placement choice. Wruck
(1989), later referred to as the monitoring hypothesis, show that active investors buyshares privately and monitor management. It is argued that monitoring will increase valueby ensuring effi ciency and openness to value creating takeovers. The article investigates128 private placements made by companies listed on NYSE and AMEX in the period1979 to 1985. Hertzel and Smith (1993), later referred to as the certification hypotheses,argues that an informed investor buy large blocks of shares in private placements toput their stamp of approval on company valuations. The paper investigates 106 privateplacements made by smaller companies listed on NASDAQ in the period 1980 to 1987.It is concluded that certification is a likely reason behind private placements. Barclay etal. (2007) investigate if monitoring (Wruck, 1989) and certification (Hertzel and Smith,1993) explains private placements by investigating 594 U.S. publicly traded firms in theperiod 1979 to 1997. The main finding is that private placements are often allocated topassive investors that help management keep control of the companies. This is proposedas the entrenchment hypothesis, and it is concluded that entrenchment is a more likelyreason for private placements than monitoring or certification.Anshuman et al. (2010) propose the undervaluation hypothesis as appose to the mon-
itoring, certification and entrenchment hypotheses. The undervaluation hypothesis is anextension of Myers and Majluf (1984), and the hypothesis propose that company man-agement and insiders buy shares in their own company, through private placements, whenthey believe that the company is undervalued. The hypothesis is tested on a sample of164 private placements in the Indian capital market in the period 2001 to 2009. It is con-cluded that private placements (to company insiders) can eliminate underinvestment, andthe underinvestment hypothesis can explain the private placement choice after controllingfor monitoring, certification and entrenchment. Wu (2003) investigates how informationasymmetry and monitoring affects the company choice between public offerings and pri-vate placements. The data investigated is 728 public offerings and 360 private placements
58In this paper we study private benefits of control enjoyed by big owners through dilution of corporatefunds.
76

made by high technology companies that have recently been publicly listed on NYSE,Nasdaq or AMEX. The main finding is that private placement companies have a higherinformation asymmetry than public offering companies. Private placement investors alsodo not monitor more than public offerings investors. Wu (2003) concludes that monitoringis not a likely reason behind private placements. Brennan and Franks (1997) investigate67 U.K. IPOs and find that underpricing is used to ensure suffi cient oversubscription andrationing of shares. This is done by IPO company insiders to discriminate between share-holders and reduce block sizes. Brennan and Franks (1997) argue that underpricing isused to avoid block holder formations. Arugaslan, Cook and Kieschnick (2004) investigate3,441 U.S. IPOs. They find that determinants of initial returns, institutional share hold-ings and post- IPO likelihood of acquisition are not consistent with either Brennan andFranks (1997) or Stoughton and Zechner (1998). Arugaslan et al. (2004) conclude thatmonitoring considerations are not important determinants of IPO underpricing. Cron-qvist and Nilsson (2005) investigate how Swedish publicly traded companies in the period1986 to 1999 choose between rights offerings and private placements in SEOs. It is foundthat companies with much asymmetric information will choose private placements overrights offerings. Companies will choose private placements to current shareholders whenasymmetric information is extreme. Companies also do private placements to new busi-ness partners. It is concluded that private placements can be used to reduce moral hazard,adverse selection costs and offset high issue cost.Boone and Mulherin (2007) investigate why not all firms are sold in competitive auc-
tions. The investigated data includes 202 auctioned and 198 negotiated takeovers of U.S.public firms in the period 1989 to 1999. The main finding is that there is no differencein wealth effects of the target firms after negotiations and an auctions. Auctions doesnot increase revenue for the sellers. Boone and Mulherin (2008) investigate 145 auctionedand 163 negotiated takeovers by U.S. publicly traded bidders in the period 1989 to 1999.The paper test if the return to the winning bidder is related to the level of competitionin the takeover market. It is assumed that there is a negative relationship between thenumber of bidders and the level of value uncertainty and the bidder return if the winnerscurse is true. The main finding is that there is no relationship between bidder returnand competition. It is concluded that there is no winners curse in the corporate takeovermarket.
4.3 The road to the listing
The listing process includes many formal requirements. These are dictated changes theprivate company must make to be allowed to list publicly. The private company mustalso make many decisions that are not formal requirements. The most notable, for thisarticle, is if equity should be raised through an IPO or in a negotiated private placement.
4.3.1 The formal listing process
The listing process at the OSE takes between eight and 14 weeks to complete.59 Theprivate company must first select an investment bank to help with the listing process.The company and the chosen investment bank then have a meeting with the board of theOSE to initiate the listing process. After this initial meeting the investment bank hires
59The information about the listing process is obtained from the seminar “The road to the listing”November 3, 2009 by Deloitte Public Accountants and the Oslo Stock Exchange.
77

an accounting firm and a law firm to complete a financial and a legal due diligence of theprivate company. The investment bank then, assuming everything is in order, makes acompliance report that shows that the private company meet all formal requirements to liston the OSE. Four weeks after the initial meeting with the OSE, there is a meeting betweenthe accounting firm, the law firm and the OSE. At this time, the formal application ishanded in to the OSE by the investment bank. During the next four weeks, the investmentbank completes the formal listing prospectus. The OSE use this time to go through theapplication. The company is then accepted or rejected to list on the OSE. About 80 to90% of all companies are accepted. Most companies are, however, accepted to list withconditions. Most companies have to adjust before they are allowed to list publicly.There are two very common conditions to list. The first common condition is that the
equity level must be increased. Companies must show that they have suffi cient equity tokeep the company running for at least 12 months after the listing. It is not necessarywith a positive cash flow as long as the company can run on equity for at least 12 months.Many companies on the OSE are shipping companies with high cash outflows around thelisting date and high cash inflows at a later point in time. The second common conditionis that one or two members of the board must be replaced with more independent boardmembers. Many private companies have boards consisting of representatives that arerelated to the company in some way. Public companies must have more independentboards. When a company is accepted or accepted with conditions, the investment bankstarts the roadshow (the marketing and sale of new stock). This is the main reason whya private company needs to use an investment bank. Distribution of shares is potentiallyhard to accomplish without the sales force of the bank. The company has 45 days to listafter it has been accepted or accepted with conditions. If the company is not listed inthis period, the process must be repeated. Most of the companies that list on the OSEare forced to issue equity as a part of the listing process. Out of the 403 listings at theOSE in the period 1993 to 2007 only 90 companies are able to list without increasing theirequity level in some way.60
4.3.2 A public or a private offering?
Due to oversubscription and share rationing it is diffi cult for investors to buy large blocksof shares in IPOs. In the traditional IPO setting investors submit bids for a given numberof shares at a specified offer price (book-building). (In a fixed price offering the investmentbank determine the price first and then investors submit bids for shares at the given price).It is common that IPOs are oversubscribed. This means that there are normally bids formore shares than the company is planning to sell. Investment banks usually set the offerprice where demand is above supply. Sometimes demand is many times greater than thesupply of shares (this is the oversubscription fraction reported in the newspapers after theoffering). When IPOs are oversubscribed, shares are often rationed to the applicants atthe price decided. An investor that bid for a high number of shares with a high bid priceis likely to only be awarded a fraction of the applied for shares. The price is likely to belower than the bid price because there is only one offer price to all investors. Rationingmeans that investors are likely to not be allocated blocks of shares.In negotiated private placements, on the other hand, shares are normally sold in
blocks. The investors that are willing to pay the most for blocks of shares are awardedthe blocks. This means that negotiated private placements are more suitable to transfer
60Figure 1 list the timeline in the listing process.
78

blocks of shares. It is easier for an investors to obtain company blocks following privateplacements. An investor that wants to sell company control rights should therefore issueshares in a private placement. It is possible to stage the equity sales by first selling blocksand then selling the remaining shares. This is also what is observed in the data. Manycompanies that use private placements also sell shares publicly afterwards. Interestingly,this is the opposite order of what is predicted by Zingales (1995).61
4.4 Theoretical predictions and testable implications
The value of owning company shares can come from two sources. The first source is theresidual claim to cash (cash flow rights). When all debtholders and other claimants tocompany cash flow has been paid, the remaining cash is the property of shareholders.The second source is the ability to enforce control (control rights). An owner with a highownership percentage can influence more control and dilute more corporate resourcesaway from smaller owners. This is private benefits of control that comes from owninga big stake in a company. The private benefits of control only goes to the controllingowner(s). Private benefits of control is enjoyed by the single biggest owner, or a groupthat together makes a controlling stake, at the expense of smaller shareholders (Zwiebel,1995). Zwiebel (1995) explains that smaller block holders can join together and getcontrol if desired. Transfer of control is therefore not necessarily from one big shareholderto another big shareholder. Transfer of control can also be from one big shareholder toa small group of block shareholders. Value of control can come from influencing how acompany is run, but value of control can also come from the ability to misuse corporateresources. In some companies it is likely that it is easier to use control to move resourcesthan in other companies.According to Zingales (1995) the seller of a company can maximize proceeds from cash
flow rights by selling in an IPO to dispersed shareholders. The seller can maximize pro-ceeds from control rights by directly bargaining with the buyer. Zingales (1995) explainsthat companies should optimally be sold in a two-stage process. Sellers should first sell apart of the company to dispersed shareholders. Then, the control rights should be sold ina private negotiation. In our data set there are no companies that follow this two-stagestrategy, so we can not test this model directly. We can, however, test if companies withmore value from control rights (higher private benefits of control) are more likely to besold in negotiations (private placements). A company with a high value of control shouldbe sold in a private placement because it is easier to transfer control this way.62 Thetestable prediction from Zingales (1995) is that there should be a relation between privatebenefits of control and the use of private placements. We label this the private benefitsof control hypothesis based on Zingales (1995).
61Zingales (1995) predicts that companies with high private benefits of control will sell shares in apublic offering first. Remaining shares will be sold in a private placement at a later stage. We observethat the private placement takes place before the public offering every time this two stage process is used.This is opposite of what is predicted by Zingales (1995).62If there are high private benefits of controlling a firm, the firm could potentially stay private so that
the owner can continue to enjoy the private benefits of control. If owners still want to go public, it canbe argued that it will be better for the seller to sell control rights separately. There are many benefitsof being publicly listed. The most notable is access to capital. It is therefore safe to assume that alsocompanies with high private benefits of control benefit of being publicly listed.
79

4.4.1 The private benefits of control hypothesis
To test the relationship between private benefits of control and the use of private place-ments it is necessary to measure private benefits of control. It is not possible to know theexact level of private benefits of control because it is an unobservable variable. It is, how-ever, possible to observe some sources of private benefits of control. We use these sourcesas estimates of the private benefits of control for the controlling owners. It is mainlyexpected that companies with block ownership before the initial offering have higher pri-vate benefits of control. Zwiebel (1995) argue that the main reason why there are blockowners is because of private benefits of control from taking advantage of smaller owners.Accordingly, there should be more private benefits of control in a company when thereare more and bigger block owners. Private benefits of control are therefore estimated onthe basis of bock ownership before the offerings.63 The ownership fraction of the largestowner before the offering is used as one measure of private benefits of control.64 Thecombined ownership fraction of all block holders is used as another measure of privatebenefits of control.Other measures that also indicate the level of private benefits of control are the tim-
ing of the offering, company industry, dividend payout, family ownership and positions,minority power and CEO/board compositions. In 2006 there was introduced a new lawthat increased tax on dividends in Norway. It is expected that this new tax will reducethe level of dividend paid out after 2006. It is expected that private benefits of controlwill increase after 2006 because more money is left in the companies. Total dividendspaid in the year before the listing is also included based on the same argument. It is alsoexpected that firms in certain industries give higher private benefits of control. Especially,it is expected that firms in the sports and communications industry have more benefits ofcontrol, see Zwiebel (1995). Unfortunately, there are no sports companies and very fewcommunications companies listed in Norway. This variable is therefore dropped.It is also expected that family firms have higher benefits of private control than non-
family firms. It can be argued that family firms have already used their benefits of controlby placing family members in management positions. Family firms are defined, in thispaper, as firms where members of one family together hold the largest fraction of thecompany and more than one member of the family is in the senior management. It is alsoexpected that minority power is decreasing in private benefits of control. It is expectedthat the founder is the minority owner in the company. New owners can group togetherand gain control. It is therefore expected that minority (founder) power should decreasein private benefits of control. Minority power is measured by founder position in the
63It is likely that tunneling is one of the major sources of private benefits of control. In tunneling, thebiggest owner owns a large stake (e.g. 51%) in one firm and 100% of another firm. The biggest ownerthen tunnels resources from the firm with 51% ownership to the firm with 100% ownership. Tunnelingcan for instance be in the form of selling assets below actual value. Tunneling lets the big owner stealresources from the shareholders that own the remaining 49% of the shares in the first company. We arenot able to detect tunneling in the data.64All variables, unless otherwise specified, are obtained in the VPS ownership database prior to the
offering or in the listing prospectus made before the offering. This means that all independent variables areknown and observed before the private placement/public offering choice is made. The listing prospectus ismainly based on annual accounting data, so it is reasonably assumed that all information in the prospectusis available before the public offering/private placement choice is made. Even the level of capital raisedshould be known before the public offering/private placement choice is made. Capital raised is in mostcases dictated by OSE as a requirement to list. We argue that there are no simultaneous decisions in ourdata, and there is no endogeneity issues in the analysis.
80

companies (E.g. The founder is the CEO or on the board of directors). The ownershipconcentration of the owners besides the single biggest owner is also a measure of minoritypower. This is measured by the Herfindahl index of the 50 biggest owners besides thesingle biggest owner. Finally, it is expected that there are more private benefits of controlin companies where the largest owner use control in an observable manner. It is expectedthat in companies where the largest owner is the CEO or on the board of directors thereare more benefits of private control. The dummy variable private placements (0) or publicofferings (1) is regressed on the private benefits of control measures in a standard probitmodel to test if companies use private placements when there are more private benefitsof control.65
4.4.2 Alternative explanations
Private placements have, in addition to private benefits of control, also been explainedwith the monitoring (Wruck, 1989), the certification (Hertzel and Smith, 1993), the en-trenchment (Barclay et al.,2007), the undervaluation (Anshuman et al., 2010) and theasymmetric information (Cronqvist and Nilsson, 2005) hypotheses. The monitoring hy-pothesis is that investors buy shares in private placements to increase company valuationthrough increased monitoring of management. It is likely that companies with high own-ership concentration, before the initial offering, already have more monitoring of manage-ment than companies with lower ownership concentration. Block owners are more likely tomonitor management because they have more at stake in the companies. The monitoringhypothesis therefore predicts (indirectly) that companies with lower ownership concen-tration should be more likely to use private placements. This is the opposite predictionof the private benefits of control hypothesis. The monitoring hypothesis is therefore con-trolled for by testing the relationship between ownership concentration, before the initialoffering, and the use of private placements.The certification hypothesis is that informed investors buy shares in private place-
ments to put their stamp of approval on company valuations. This does not give thesame implications as the private benefits of control hypothesis. There is no reason whya company with more concentrated ownership would need more certification than a com-pany with less concentrated ownership. It is, however, likely that smaller and youngercompanies would be more likely to want certification, as there is less information publiclyavailable for these companies. The certification hypothesis is therefore controlled for byincluding the number of employees (size) and company age in all regressions.The entrenchment hypothesis is that private placements are used by company man-
agement to keep their positions (even if they perform poorly). Entrenchment is a highlyunlikely explanation for the companies in our sample. All companies are eventually listedpublicly and this indicates that these companies are doing very well. It is very unlikelythat the companies in our sample have management that consistently need ownershipmanipulation to keep their positions. It can also be seen in Table 3 that most of thecompanies in the sample have the largest owner as the CEO or on the board of directors.This indicates that these owners are active and not passive investors that help keep poormanagement in their positions. The entrenchment hypothesis will also not explain whycompanies with more concentrated ownership before the initial offering are more likely to
65It is argued that value of control does not require 51% of the shares (Damodaran, 2005). We do notknow how much ownership that is needed to enjoy private benefits of control, so the ownership percentageof the largest owner or the combined block ownership is included in all regressions.
81

use private placements. If private placements are used by companies with poor manage-ment, it is, however, likely that company results before the offering are negatively relatedto the use of private placements. The entrenchment hypothesis is therefore controlled forby including company results before the offering in all regressions.The undervaluation hypothesis is that insiders buy shares through private placements
when they perceive the company to be undervalued. In the capital history section inthe listing prospectus there are clear distinctions between employee offerings and privateplacements. Company insiders buy shares in employee offerings and not through privateplacements. The ownership level for all company insiders is also disclosed before andafter the equity offerings, so we know that the private placements are not made towardscompany insiders. The undervaluation hypothesis is therefore not relevant for our dataset and question.The asymmetric information hypothesis is that companies with high information dis-
crepancies, between company insiders and outsiders, use private placements to reducethe cost of conveying information to investors. It is likely that certain (harder to value)industries are more likely to have more information asymmetry. Especially, it is expectedthat companies in the information technology (IT) sector have more information asym-metry than other companies that list on the OSE. It is also expected that younger andsmaller companies have more information asymmetry because less information is publiclyavailable for these companies. IT, younger and smaller companies should use more pri-vate placements if this hypothesis is true. It is tested if asymmetric information drivesthe private placement choice by including a dummy variable for all companies in the ITsector, the company age and the number of employees in all regressions.
4.4.3 Other control measures
The reasons why companies issue equity is to have suffi cient levels of equity and numberof owners before the listings. The OSE requires a minimum of 500 investors to list on themain list of the OSE (and 100 to list in the small and medium sized list). Therefore, itis necessary to control that the number of investors prior to the offering and the capitalraised do not decide the method chosen. These variables are therefore included in allregressions.Carpentier and Suret (2009) show that Canadian firms that use private placements
have lower book to market rations, are in special industries, are financially distressed orconstrained, are in the development stage and in general raise less capital. Barclay et al.(2007) show that private placements are made at a discount to certain investors. Booneand Mulherin (2007) show that market value is related to the use of private placements.The problem with these variables is that they are observed only after the listing. Most ofthese variables are observed the first time about six months after the initial private place-ment or public offering choice has been made. The variables book to market ratio, firstday return and market value are observed the first time on the day of the listing. Thesevariables are not available for the companies in our sample because they are privatelyheld. All companies in the sample are also eventually listed on the stock exchange, sothere are no financially distressed or constrained firms in the sample. (This is, however,controlled for by including the last annual net result reported in the listing prospectus).
82

4.4.4 Private benefits of control also after the listing
It can be argued that companies with high private benefits of control should stay private.The reason for this is that some of the private benefits of control is likely to disappearwhen companies become public. We therefore test if there are private benefits of controlafter the new listings. If control rights are sold in private placements, there should begreater values of control also after the listings following private placements. To test forbenefits of control after the listing it is necessary to regress private benefits of controlafter the listing on the public offering or private placement choice.Private benefits of control is an unobservable variable that is estimated by a portfolio
of measures. Most of these measures are very persistent. E.g. Few companies change theCEO or board members right after the listing and company specific variables such as age,number of employees, family firm, result and dividend do not change. These variables arenot suitable as single measures of private benefits of control. A more suitable measure ofprivate benefits of control is the ownership fraction of the biggest owner(s) after the listing.If there is a more concentrated ownership also after the listing, it can be argued that thereis persistence in the control. This is tested by regressing the ownership percentage of thebiggest owner(s) one month after the listing on the private placement or public offeringchoice (before the offering) and a set of control variables.
4.5 Data and descriptive statistics
There are 403 companies the list publicly on the OSE in the period January 1993 toSeptember 2007. Table 2 gives the yearly distribution of IPOs and negotiated privateplacements in this period. All companies must list their ownership records in the Nor-wegian central depository (VPS) database as a part of the listing procedure. From thisdatabase the pre offering ownership in all listed companies is observed. Accounting vari-ables are collected from the listing prospectuses. It is assumed that private placementsin the six month period before the listing date are part of the listing procedure. Privateplacements before this are assumed to not be part of the listing procedure.66
Company ownership at the end of month six prior to the listing date is the measureof ownership concentration prior to the offering. Most public offerings are in the calendarmonth before or in the same calendar month as the listing date. Private placements arespread out over the six months prior to the listing date. From Table 2 it can be seenthat there is a proportionate number of private placements and IPOs over the sampleperiod. There is a slight increase in the number of private placements compared to IPOsin the end of the sample period. It is argued that the reason for this is an increase in theNorwegian tax rates in 2006 that increased overall private benefits of control from moreretained cash.There are 210 public offerings and 106 private placements by companies listing on
the OSE in the period 1993 to September 2007.67 For 19 public offerings and 6 private
66Companies define the equity offering to be private or public in the capital history section in the listingprospectuses. Data on all historical equity offerings are provided in these prospectuses.
67In total, 44 companies used a private placement before a public offering, and 131 companies did notoffer shares to new investors in the lead up period to the listing (21 of these companies were spinoffs toexisting shareholders). Private placements are made at different points in time in the six months periodbefore the listings. Private placements before this is not included in the sample. The public offerings are
83

placements it has not been possible to identify the ownership before the offering from theVPS ownership database. These companies are removed from the sample.68 A total of44 companies made a private placement before the public offering. These companies areregarded as only private placement companies as they made this offering first.69 The finalsample is 88 companies that used a private placement and 123 companies that used anIPO.
4.5.1 Descriptive statistics
From Table 3 it can be seen that companies that use private placements and publicofferings are very similar. Private placement companies do, however, have on averagemore large owners on the boards, higher ownership fractions of the largest owners afterthe listings, more founders on the boards or as the CEOs, are more likely to be familyfirms before the offerings and have lower age. The average capital raised in the 88 privateplacements is $57.3 million. This is just below the average size of the public offerings.For private placements the combined sale of new and existing shares averages about 22%of total outstanding shares at the listing date. For public offerings this number is 41%.There are no significant differences between companies that use private placements andpublic offerings on total assets, dividends, results, number of owners before the offering,capital raised and number of employees.
4.5.2 Variable description
The dependent variable in most regressions is a dummy variable for public offering (1) andprivate placements (0).70 Combined block ownership is the combined ownership fractionof all investors that owns more than 5% of the company before any offering is made.71
Holding of largest owner b. offer is the holding fraction of the single biggest owner beforethe offering. Holding of largest owner a. listing is the holding fraction of the single biggestowner one month after the listing. Largest owner is the CEO and Largest owner is on theboard are dummy variables that takes the value of one for companies where the largest
usually performed in the month before the listing or in the listing month itself. Some private placementshave a follow on offering to the public or to employees of the company. By using follow on offerings theminimum number of investors regulation, set by stock exchanges, has no influence on the equity offeringmethod chosen. The remaining 110 listings are results of mergers with an already listed company, crosslistings or companies traded actively at the Norwegian over the counter list (OTC list) before the OSElisting.68For 27 public offerings and 12 private placements it has not been possible to obtain all company
specific information (i.e. listing prospectuses). These companies are therefore removed from the sample.69When there is both a public and a private sale it is common that the investors in the private placement
sell a small fixed percentage of their allocated shares in the public offering. It is likely that the privateplacement is made to increase the capital for the company through the issue of new shares. It is alsolikely that the public offering is made to increase the number of shareholders. It is common that thereis one fixed resell percentage that applies to all investors in the private placement. This percentage isusually very low (less than 10%). The issuing company have then sold shares with the condition thatthe investors must sell some of their allocated shares before the listing. It is likely that this condition isincluded to meet minimum spread requirements set by the OSE. The final sample is 123 public offeringsand 88 private placements.70All ownership variables are obtained from the VPS database. All other pre listing variables are
obtained from the listing prospectuses that are made in connection with the listings.71In Norway, all shareholders that own more than 5% of the outstanding shares must be reported in
the listing prospectus. In the remainder of the article we refer to shareholders that own more than 5%of outstanding shares as block holders.
84

owner is the CEO or on the board of directors. The founder is the CEO and The founderis on the board are dummy variables that take the value of one if the founder is the CEO oron the board of directors. Herfindahl index is the squared ownership fraction of the sumof the 50 biggest owners besides the largest owner.72 The 2006 dummy takes the valueof one for all companies listed after 2005. (Dividend / Total Assets) is the total dividendpayment made in the year before the listing year scaled by total assets. The Family firmdummy takes the value of one for family firms. Family firms are identified in the listingprospectuses as firms where members of one family together hold the largest fraction of thecompany and more than one member of the family is in the senior management of the firm.Age is the difference between listing year and the year of incorporation of the companies.Number of employees is the number of annual accumulated full time employees in theissuing company. Capital raised is the total number of shares sold in the offering timesthe offer price. N. owners before offering is the number of investors that own shares inthe company before the offering. Capital raised and N. owners before offering are weaklynegatively correlated. (Net result / Total Assets) is the last annual end of year result,scaled by total assets, listed in the listing prospectus. IT dummy takes the value of onefor companies in the information technology (IT) sector. Year fixed dummy is includedas dummy variables for the different years in the sample period (1993 to 2007).
4.6 Empirical Results
The main empirical finding of the paper is that companies with more block ownership,before the offerings, are more likely to use private placements instead of public offerings.The companies that did use private placements also have more block ownership after thelistings. There is also a bigger reduction in block ownership following public offeringsthan following private placements.
4.6.1 The private benefits of control hypothesis
The dummy dependent variable private placement (0) or public offering (1) is regressedon the estimated private values of control in a probit regression.73 From Table 4 it can beseen that companies with one large owner prior to the initial offering are more likely to useprivate placements. The coeffi cient for holding fraction of the largest owner on the issuechoice is positive and significant at the 0.01 level. The positive coeffi cient supports theprivate benefits of control hypothesis that private placements are used to transfer privatebenefits of control. Companies where there is one controlling owner prior to the offering
72In general, it is expected that private benefits of control should decrease in minority power. Thereare, however, some sample characteristics that may alter this expectation. In many companies there area small group of investors that jointly owns a controlling stake in the company together (E.g. a familyor a group of friends). It is expected that all of these investors will enjoy the private benefits of controleven if one investor have a slightly larger stake than the others. Zwiebel (1995) also argues that thereare private benefits of control from block holders that are not the single biggest owner.73We do not expect there to be any problems with endogeneity in the analysis. All independent
variables are observed in the listing prospectus before the public offering. We assume that these variablesare also publicly available before the private placements even if these may be up to five moths before thelisting prospectus is available. We argue that the used independent variables are determined before theprivate placement/public offering choice, and any endogeneity due to simultaneity will therefore not bean issue. The variables in the listing prospectuses are also available in annual (and quarterly) reports. Itis reasonably assumed that investors are able to locate this information before the private offering.
85

are more likely to use private placements instead of public offerings. Companies that issueequity in periods where there is likely to be more private benefits of controlling firms (after2006) also issue more in private placements. Companies that use private placements arealso more likely to be family firms. Most control variables are unrelated to the issuechoice. The level of capital raised is highly related to the use of public offerings.From Table 5 it can be seen that the exact same results are obtained when the block
ownership fraction of the biggest owners is used instead of the ownership fraction ofthe single biggest owner. Companies with more block ownership are more likely to useprivate placements whereas companies with less block ownership are more likely to useIPOs. These results control for the level of capital raised, the number of investors thatown shares in the companies before the offerings and the alternative explanations forprivate placements. The results are also robust to the removal savings banks (13).From Table 6 it can be seen that the relationship between private benefits of control
and private placements is robust to including year fixed effects. It is not possible to rejectthe hypothesis that private placements are used to transfer private benefits of control.
4.6.2 Alternative explanations
The private placement choice has in the previous literature, in addition to the private ben-efits of control hypothesis, been explained with monitoring, certification, entrenchment,undervaluation and asymmetric information. There is a positive relationship betweenthe use of private placements and the holding fraction of the largest owner(s) before theoffering. This is the opposite finding of what is predicted by the monitoring hypothesisand this hypothesis is therefore rejected. There is not a consistent relationship betweenthe use of private placements and company age and number of employees. It is likelythat younger and smaller companies have more need for value certification from informedinvestors than other companies. The certification hypothesis is therefore also rejected.If company management use private placements to keep their control even if they per-
form poorly, it is expected that there will be a negative relationship between companyresults and the use of private placements . There is, however, not a consistent relation-ship between company results before the offerings and the use of private placements. Theentrenchment hypothesis is therefore also rejected. There is also not more private place-ments by younger and smaller companies in the IT industry. If private placements areused to reduce the problems associated with information asymmetry, it is expected thatthere will be a relationship between companies with more expected information asymme-try (e.g. smaller, younger and IT companies) and the use of private placements. Thisrelationship does not exist and the asymmetric information hypothesis is therefore alsorejected.
4.6.3 Private benefits of control also after the listing
If control rights are sold in private placements, there should be greater values of controlalso after the listing in companies that used private placements. This is tested by regress-ing private benefits of control after the listing on the IPO or private placement choice. InTable 7 the combined ownership percentage of block owners one month after the listing isregressed on the public offering or private placement choice (and the control variables forthe alternative explanations). There is more block ownership one month after the listingfollowing private placements than following public offerings. Public offerings are relatedto smaller block ownership one month after the listing. In Table 8 it can be seen that
86

the exact same results are found when only the ownership of the single largest owner isstudied separately. This show that there is more block ownership in companies that usedprivate placements also after the listings.
4.7 Conclusion
There is a strong and robust relationship between the ownership fraction of the largestowner(s), before the initial equity offering, and the use of private placements. The biggestowner(s) also have a higher ownership fraction following private placements than follow-ing public offerings. If it is assumed that the main reason that investors are willing tohold blocks of shares is to enjoy private benefits of control, it can be concluded thatprivate placements are used to transfer private benefits of control. Zwiebel (1995) ar-gue that the only reason investors hold blocks of shares is to enjoy private benefits ofcontrol. We reject that private placements are used because of monitoring, certification,entrenchment, undervaluation or asymmetric information considerations. We concludethat private placements are used to transfer private benefits of control between the sellerand the buyer.The main theoretical implication of this finding is that Zingales (1995) is correct in
that company control rights are better sold separately. Companies are sold based onthe value of control rights when they are higher than the stand alone cash flow rights.The finding also have implications for auction theory. When the auction makes it hardto obtain blocks of shares, as in the case of the IPO, the negotiation may be preferredby the seller if there are private benefits of control. The main practical implication ofthis finding is that companies should use private placements when the value of controlrights are higher than stand alone cash flow rights. If there are larger private benefits ofcontrolling a firm, the firm should be sold in a private placement.There are some limitations to the study. Private benefit of control is an unobservable
variable that can come from an unlimited number of sources. Private benefit of control isestimated based on existing ownership and company specific variables. A more directlyobservable measure of private benefits of control would have been preferable. It is alsonot possible to detect tunnelling in the data. Tunnelling is likely to be a major source ofprivate benefits of control.For future research it would be interesting to study a bigger sample that includes more
firms with obvious private benefits of control such as sports companies. It would also bevery interesting to study cross company ownership and related business deals. Businessdeals by companies with the same ownership would allow us to study tunneling.
87

References
[1] Anshuman, V. Ravi, Vijaya B. Marisetty and Marti G. Subrahmanyam, 2010, PrivatePlacements, Regulatory Restrictions and Firm Value: Theory and Evidence from theIndian Market, NYU working paper.
[2] Arugaslan, Onur, Douglas O. Cook and Robert Kieschnick, 2004, Monitoring as aMotivation for IPO Underpricing, Journal of Finance 59, 2403-2420.
[3] Barclay, Michael J., Clifford G. Holderness and Dennis P. Sheehan, 2007, PrivatePlacements and Managerial Entrenchment, Journal of Corporate Finance 13, 461-484.
[4] Boone, Audra L. and J. Harold Mulherin, 2007, How are Firms Sold?, Journal ofFinance 2, 847-875.
[5] Boone, Audra L. and J. Harold Mulherin, 2008, Do Auctions Induce aWinner’s Curse?New Evidence from the Corporate Takeover Market, Journal of Financial Economics89, 1-19.
[6] Bulow, Jeremy and Paul Klemperer, 1996, Auctions Versus Negotiations, The Amer-ican Economic Review 86, 180-194.
[7] Bulow, Jeremy and Paul Klemperer, 2009, Why Do Sellers (Usually) Prefer Auctions?,The American Economic Review, forthcoming.
[8] Brennan, Michael and Julian Franks, 1997, Underpricing, Ownership and Control inInitial Public Offerings of Equity Securities in the U.K., Journal of Financial Economics45, 391-413.
[9] Carpentier, Cecile and Jean-Marc Sure, 2009, Private Placements by Small Pub-lic Entities: Canadian Experience, Douglas J. Cumming, Ed., Companion to PrivateEquity, Wiley, Chapter 8, forthcoming.
[10] Cronqvist, Henrik and Mattias Nilsson, 2005, The Choice Between Rights Offeringsand Private Equity Placements, Journal of Financial Economics 78, 357-407.
[11] Damodaran, Aswath, 2005, The value of Control: Implications for Control Premia,Minority Discounts and Voting Share Differentials, NYU working paper.
[12] Derrien, François and Ambrus Kecskés, 2007, The Initial Public Offerings of ListedFirms, Journal of Finance 1, 447-479.
[13] French, Kenneth R. and Robert E. McCormick, 1984, Sealed Bids, Sunk Cost, andthe Process of Competition, The Journal of Business 4, 417-441.
[14] Hertzel, Michael and Richard L. Smith, 1993, Market Discounts and shareholderGains for placing Equity Privately, Journal of Finance 48, 459-485.
[15] Jenkinson, Tim and Howard Jones, 2004, Bids and Allocations in European IPOBookbuilding, Journal of Finance 59, 2309-2338.
[16] Megginson, William L., Robert C. Nash, Jeffry M. Netter and Annette B. Poulsen,2004, The Choice of Private Versus Public Capital Markets: Evidence from Privatiza-tions, Journal of Finance 59, 2835-2870.
88

[17] Myers, S.C., Majluf, N., 1984, Corporate Financing and the Investment DecisionWhen Firms Have Information that Investors do not have, Journal of Financial Eco-nomics 13, 187-221.
[18] Ritter Jay R., 2003, Differences between European and American IPO markets, Eu-ropean Financial Management 9, 421-434.
[19] Ritter Jay R., 1984, The Hot Issue Market of 1980, The Journal of Business 57,215-240.
[20] Stoughton Neal and Josef Zechner, 1998, IPO —Mechanisms, Monitoring and Own-ership Structure, Journal of Financial Economics 49, 45-77.
[21] White, Halbert, 1980, A heteroskedastic-consistent covariance matrix estimator anda direct test of heteroscedasticity, Econometrica 48, 817-838
[22] Wu, YiLin, 2004, The Choice of Equity Selling Mechanisms, Journal of FinancialEconomics 2004, 3-28.
[23] Wruck, Karen Hopper, 1989, Equity Ownership Concentration and Firm Value: Ev-idence from private equity financing, Journal of Financial Economics 23, 3-28.
[24] Zingales, Luigi,1995, Insider Ownership and the Decision to Go Public, The Reviewof Economic Studies 62, 425-448.
[25] Zingales, Luigi, 1994, The value of Voting Right: A study of the Milan Stock Ex-change Experience, The Review of Financial Studies 1, 125-148.
[26] Zwiebel, Jeffrey, 1995, Block Investment and Partial Benefits of Corporate Control,The Review of Economic Studies 62, 161-185
89

Table 1 Related Studies
Auction (theory)
Bulow and Klemperer (1996) Seller prefer to sell in an auction
Bulow and Klemperer (2009) Buyers prefer to buy in negotiation
and sellers prefer to sell in an auction.
French and McCormick (1984) Auctions are usually preferred
Equity offerings (theory)
Zingales (1995) Control rights are optimally sold private
Zingales (1994) Private benefits of control is dilution
of minority property rights
Zwiebel (1995) There are benefits of blocks smaller than control
Stoughton and Zechner (1998) Private placements increase monitoring
Attract certain types of investors (empirical)
Wruck (1989) Monitoring hypothesis
Hertzel and Smith (1993) Certification hypotheses
Barclay et al. (2007) Entrenchment hypothesis
Anshuman et al. (2010) Undervaluation hypothesis
Brennan and Franks (1997) Underpricing used to
avoid block holder formations
Arugaslan, Cook and Kieschnick (2004) Monitoring not important
Wu (2003) Monitoring not important
Cronqvist and Nilsson (2005) Private placements reduce
moral hazard and adverse selection
Boone and Mulherin (2007) Auctions does not increase revenue
for the seller
Boone and Mulherin (2008) There is no relation between bidder
return and competition
90

Table 2IPOs and Private Placements on the Oslo Stock Exchange
This table gives the annual distribution of initial offerings: Column 1 is the sample years. Column 2
is the number of public offerings per year. Column 3 is the average underpricing of the public offerings per
year. Column 4 is the total capital raised in all public offerings combined per year in USD. Column 5 is the
number of private placements per year. Column 6 is the average underpricing of the private placements per
year. Column 7 is the total capital raised in all private placements combined per year in USD. Underpricing
is calculated as: (offer price in the listing prospectus — first day closing price) / offer price in the listing
prospectus. Value of shares sold is reported in USD using a USD/NOK exchange rate of 0.1792. The sample
period is January 1993 through September 2007.
Public Offerings Private Placements
Distribution Capital raised Distribution Capital raised
Year N Underpricing % M USD N Underpricing % M USD
1993 5 -1.8% $474 4 27.4% $81
1994 10 4.2% $609 2 4.8% $20
1995 6 6.7% $467 5 8.1% $49
1996 4 24% $99 5 10.6% $49
1997 15 16.6% $972 11 34.6% $139
1998 8 1.9% $185 6 -6.1% $108
1999 4 18.7% $185 0 0 0
2000 9 -0.9% $517 6 36% $527
2001 4 -7.4% $183 2 6.5% $483
2002 2 -9.8% $70 1 2.5% $210
2003 2 -2.3% $83 0 0 0
2004 13 5.6% $1,602 1 5.5% $3.6
2005 20 3.3% $1,709 18 6.6% $1,711
2006 12 3.2% $1,417 9 9.2% $584
2007 9 3.3% $793 18 6.9% $1,077
Total 123 5.3% $9,365 88 12.7% $5,074
91

Table 3Summary Statistics on Firms Going Public
This table show the difference between companies using initial private placements and initial public
offerings. "Combined block ownership" is the combined ownership of all investors that owns more than 5%
of the company before the offering. "Holding of largest owner b. offer" is the holding fraction of the single
biggest owner before the offering "Holding % of largest owner a. listing" is the holding fraction of the single
biggest owner one month after the listing. "Reduced % of largest owner" is the difference in the ownership
fraction of the largest owner from before the offering to one month after the listing. "Largest owner is
the CEO dummy", "Largest owner is on the board dummy", "The founder is the CEO dummy" and "The
founder is on the board dummy" are dummy variables that take the value of one if the biggest owner or
founder are the CEO or on the board. Herfindahl index is the sum of the squared ownership fraction of the
50 biggest owners besides the largest owner. "Age of company" and "Number of employees" is the age and
the number of employees of the issuing company. "2006 dummy" and "Family firm dummy" takes the value
of one for issues after 2006 and family firms respectively. "IT dummy" takes the value of one for companies
in the information technology (IT) sector. "Capital raised " is the offer price times the number of shares
sold in the offering. "N. owners before offering" and "First day return %" are the number of owners in the
company before the offering and the first day return from offer price to first day closing price respectively.
"Market value" is the number of outstanding shares at the listing day times the first day closing price.
"Fraction of company sold" is the fraction of sold shares to outstanding shares in the offering. "Net result",
"Dividends" and "Total assets" are the last annual result, dividend paid and total assets reported in the
listing prospectus before the offering. The t —statistic is calculated as: (Mean private placements - mean
public offerings) / (square root [ (variance private placements / numbers of private placements) + (variance
public offerings/ numbers of public offerings)].
Private placement Public offering Difference
Variables Obs. Mean Std.Dev Obs. Mean Std.Dev Diff. t-stat.
Combined block ownership 88 0.78 0.23 123 0.76 0.26 0.02 (0.6)
-with no savings banks 88 0.78 0.23 110 0.74 0.26 0.04 (1.1)
Holding largest owner b. offer 88 0.5 0.31 123 0.5 0.34 -0.01 (-0.2)
-with no savings banks 88 0.5 0.31 110 0.47 0.32 0.02 (0.7)
Holding largest owner a. listing 85 0.3 0.16 123 0.26 0.18 0.04 (1.7)
Reduced % of largest owner 85 0.2 0.23 123 0.25 0.32 -0.05 (-1.3)
Largest owner is the CEO D 88 0.24 0.43 123 0.16 0.37 0.08 (1.4)
Largest owner is on the board D 88 0.52 0.5 123 0.31 0.46 0.21 (3.1)
Herfindahl index 88 0.05 0.05 123 0.04 0.05 0.01 (1.4)
The founder is the CEO D 88 0.27 0.45 123 0.18 0.38 0.09 (1.5)
The founder is on the board D 88 0.36 0.48 123 0.23 0.42 0.13 (2.0)
Age of company in years 88 19.5 28.4 123 36.2 47 -16.7 (-3.2)
92

Table 3 continued. Private placement Public offering Difference
Variables Obs. Mean Std.Dev Obs. Mean Std.Dev Diff. t-stat.
Number of employees 88 507 1,343 123 735 2,220 -228 (-0.9)
2006 dummy 88 0.31 0.46 123 0.17 0.38 0.14 (2.3)
Family firm dummy 88 0.27 0.45 123 0.12 0.32 0.15 (2.7)
IT dummy 88 0.15 0.36 123 0.2 0.4 -0.05 (-0.9)
Capital raised (Mill USD) 88 57.3 93.1 123 75.1 121 -17.8 (-1.2)
N. owners before offering 88 233 654 123 135 265 98 (1.3)
First day return 88 0.13 0.334 123 0.05 0.14 0.08 (2.0)
Market value E. (Mill USD) 88 351.8 525.2 123 236.6 418.7 115.2 (1.7)
Fraction of company sold 88 0.22 0.24 123 0.41 0.26 -0.19 (-5.5)
Net result (Mill USD) 88 5.6 74.5 123 4.2 30.8 1.4 (0.2)
Dividends (Mill USD) 88 0.31 0.96 123 1.4 9.3 -1.1 (-1.3)
Total assets (Mill USD) 88 912 4,926 123 408 968 504 (0.9)
93

Table 4Private Placements and Private Benefits of Control of the Single Biggest
Owner
This table reports the coeffi cients and t -statistics in parentheses for the regressions with the dummy
variable that takes the value of one for IPOs and zero for private placements as the dependent variable.
All regressions are standard Probit models. The sample period is September 1993 to January 2007. All
variables are as described in Table 3. Age, employees, capital raised and number of owners are in log in all
regressions. In all Regressions the ownership fraction of the single biggest owner before the (first) offering
is included. In Regression 1 and 2 savings banks (13) are dropped. Regression 2 includes White (1980)
robust standard errors. In regression 3 all savings banks (13) are included. No independent variables have
a correlation above 0.5.
Dummy IPO (1) or Private Placement (0)
Reg 1 Reg 2 Reg 3
Intercept -4.6415 -4.6415 -4.0439
(-2.9) (-2.8) (-2.6)
Holding fraction of largest owner before offering -1.5283 -1.5283 -1.5313
(-2.5) (-2.4) (-2.6)
Largest owner is the CEO dummy 0.2489 0.2489 0.1852
(0.9) (0.9) (0.6)
Largest owner is on the board dummy -0.257 -0.257 -0.303
(-1.0) (-1.0) (-1.2)
Herfindahl index -3.9762 -3.9762 -5.0464
(-1.6) (-1.5) (-2.1)
The founder is the CEO dummy -0.3744 -0.3744 -0.3821
(-1.3) (-1.3) (-1.3)
The founder is on the board dummy 0.2393 0.2393 0.1855
(0.9) (0.9) (0.7)
Age of company 0.1346 0.1346 0.203
(1.6) (1.4) (2.6)
Number of employees 0.077 0.077 0.0556
(1.4) (1.3) (1.0)
2006 dummy -0.5095 -0.5095 -0.5206
(-2.1) (-2.2) (-2.2)
Family firm dummy -0.4829 -0.4829 -0.5055
(-1.7) (-1.8) (-1.8)
Capital raised 0.2998 0.2998 0.2789
(3.6) (3.4) (3.4)
N. Owners before the offering -0.1183 -0.1183 -0.145
(-1.6) (-1.6) (-2.0)
Net result / Total Assets 0.3284 0.3284 0.3076
(1.2) (1.7) (1.1)
Dividend / Total Assets 3.9909 3.9909 3.0634
(0.8) (0.8) (0.6)
IT dummy 0.421 0.421 0.4179
(1.5) (1.6) (1.5)
Observations 198 198 211
Pseudo R -squared 15.8% 15.8% 16.9%
94
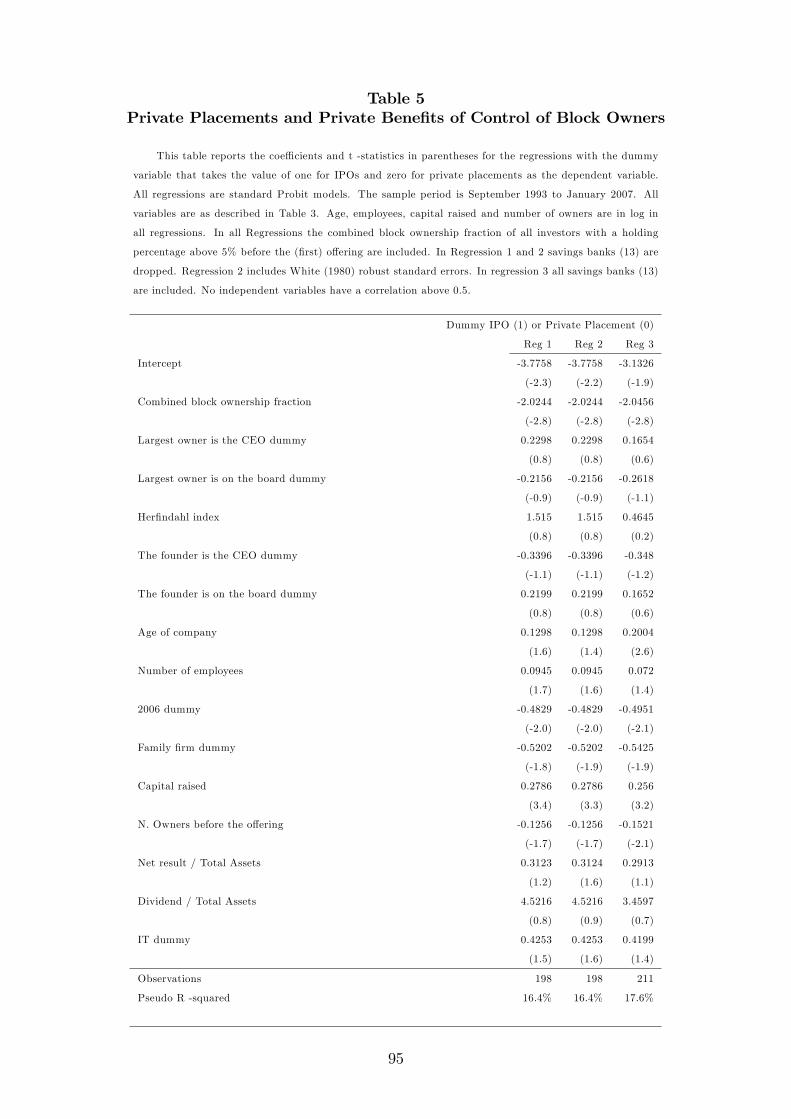
Table 5Private Placements and Private Benefits of Control of Block Owners
This table reports the coeffi cients and t -statistics in parentheses for the regressions with the dummy
variable that takes the value of one for IPOs and zero for private placements as the dependent variable.
All regressions are standard Probit models. The sample period is September 1993 to January 2007. All
variables are as described in Table 3. Age, employees, capital raised and number of owners are in log in
all regressions. In all Regressions the combined block ownership fraction of all investors with a holding
percentage above 5% before the (first) offering are included. In Regression 1 and 2 savings banks (13) are
dropped. Regression 2 includes White (1980) robust standard errors. In regression 3 all savings banks (13)
are included. No independent variables have a correlation above 0.5.
Dummy IPO (1) or Private Placement (0)
Reg 1 Reg 2 Reg 3
Intercept -3.7758 -3.7758 -3.1326
(-2.3) (-2.2) (-1.9)
Combined block ownership fraction -2.0244 -2.0244 -2.0456
(-2.8) (-2.8) (-2.8)
Largest owner is the CEO dummy 0.2298 0.2298 0.1654
(0.8) (0.8) (0.6)
Largest owner is on the board dummy -0.2156 -0.2156 -0.2618
(-0.9) (-0.9) (-1.1)
Herfindahl index 1.515 1.515 0.4645
(0.8) (0.8) (0.2)
The founder is the CEO dummy -0.3396 -0.3396 -0.348
(-1.1) (-1.1) (-1.2)
The founder is on the board dummy 0.2199 0.2199 0.1652
(0.8) (0.8) (0.6)
Age of company 0.1298 0.1298 0.2004
(1.6) (1.4) (2.6)
Number of employees 0.0945 0.0945 0.072
(1.7) (1.6) (1.4)
2006 dummy -0.4829 -0.4829 -0.4951
(-2.0) (-2.0) (-2.1)
Family firm dummy -0.5202 -0.5202 -0.5425
(-1.8) (-1.9) (-1.9)
Capital raised 0.2786 0.2786 0.256
(3.4) (3.3) (3.2)
N. Owners before the offering -0.1256 -0.1256 -0.1521
(-1.7) (-1.7) (-2.1)
Net result / Total Assets 0.3123 0.3124 0.2913
(1.2) (1.6) (1.1)
Dividend / Total Assets 4.5216 4.5216 3.4597
(0.8) (0.9) (0.7)
IT dummy 0.4253 0.4253 0.4199
(1.5) (1.6) (1.4)
Observations 198 198 211
Pseudo R -squared 16.4% 16.4% 17.6%
95

Table 6Private Placement and Private Benefits of Control - Year Fixed Effects
This table reports the coeffi cients and standard t -statistics in parentheses for the regressions with the
dummy variable that takes the value of one for IPOs and zero for private placements as the dependent
variable. All regressions are standard Probit models. The sample period is September 1993 to January
2007. All variables are as described in Table 3. Regression 1 and 3 includes year fixed effects and the
combined block ownership fraction before the offering. Regression 2 and 4 includes year fixed effects and
the holding fraction of the single largest owner before the offering. In regression 3 and 4 all savings banks
(13) are included. No independent variables have a correlation above 0.5.
Dummy IPO (1) or Private Placement (0)
Reg 1 Reg 2 Reg 3 Reg 4
Intercept -4.3351 -5.2256 -3.6263 -4.5002
(-2.2) (-2.8) (-1.9) (-2.5)
Combined block ownership fraction -1.9282 -1.8672
(-2.5) (-2.4)
Holding fraction of largest owner before offering -1.5167 -1.4764
(-2.4) (-2.3)
Largest owner is the CEO dummy 0.1811 0.204 0.1156 0.1377
(0.6) (0.6) (0.4) (0.4)
Largest owner is on the board dummy -0.3166 -0.3572 -0.3425 -0.3803
(-1.1) (-1.3) (-1.2) (-1.4)
Herfindahl index 2.9923 -2.3186 1.305 -3.8551
(1.4) (-0.9) (0.6) (-1.5)
The founder is the CEO dummy -0.3931 -0.4329 -0.387 -0.425
(-1.2) (-1.3) (-1.2) (-1.3)
The founder is on the board dummy 0.2501 0.2547 0.1538 0.1625
(0.8) (0.8) (0.5) (0.5)
Age of company 0.1224 0.1342 0.2132 0.2212
(1.4) (1.5) (2.6) (2.6)
Number of employees 0.0924 0.0727 0.0597 0.0419
(1.6) (1.2) (1.0) (0.7)
2006 dummy -0.29 -0.1931 -0.3488 -0.2583
(-0.5) (-0.4) (-0.6) (-0.5)
Family firm dummy -0.4996 -0.463 -0.5252 -0.4857
(-1.6) (-1.5) (-1.7) (-1.6)
Capital raised 0.3048 0.3271 0.2801 0.303
(3.3) (3.4) (3.2) (3.3)
N. Owners before the offering -0.1051 -0.1027 -0.1416 -0.1416
(-1.3) (-1.3) (-1.8) (-1.8)
Net result / Total Assets 0.3574 0.3762 0.3003 0.3239
(1.2) (1.3) (1.1) (1.2)
Dividend / Total Assets 4.7078 3.4868 3.5196 2.4382
(0.8) (0.6) (0.6) (0.4)
IT dummy 0.4174 0.3761 0.3965 0.3652
(1.3) (1.1) (1.2) (1.1)
Year fixed dummy yes yes yes yes
Observations 193 193 205 205
Pseudo R -squared 21.9% 21.6% 22.1% 21.9%
96

Table 7Block Owners own more of the Company Following Private Placements
This table reports the coeffi cients and heteroscedastic consistent t -statistics (errors adjusted for clus-
tering across firms Rogers, 1993) in parentheses for the regressions with the combined ownership percentage
of the biggest owners one month after the listing as the dependent variable. All regressions are standard
OLS models. The sample period is September 1993 to January 2007. All variables are as described in
Table 3. Regression 1 drops savings banks (13). Regression 2 includes savings banks (13). No independent
variables have a correlation above 0.5.
.
Combined block ownership % after the listing
Reg 1 Reg 2
Intercept 71.1734 67.771
(2.9) (3.2)
Dummy IPO (1) or Private Placement (0) -4.5329 -8.4463
(-2.0) (-3.3)
Age of company 2.3088 0.2019
(2.5) (0.2)
Number of employees 0.435 1.4037
(0.7) (1.7)
Capital raised -0.4381 -0.365
(-0.4) (-0.3)
N. Owners before the offering -1.6963 -0.5708
(-2.7) (-1.0)
Net result / Total Assets -2.1682 -1.1675
(-1.3) (-0.5)
IT dummy -1.1653 -1.003
(-0.3) (-0.3)
Year fixed dummy yes yes
Observations 195 208
Adjusted R -squared 11.1% 8.1%
97

Table 8The Biggest Owner have a Larger Ownership % Following Private
Placements
This table reports the coeffi cients and heteroscedastic consistent t -statistics (errors adjusted for clus-
tering across firms Rogers, 1993) in parentheses for the regressions with the ownership percentage of the
biggest owner one month after the listing as the dependent variable. All regressions are standard OLS
models. The sample period is September 1993 to January 2007. All variables are as described in Table 3.
Regression 1 drops the savings banks (13). Regression 2 includes the savings banks (13). No independent
variables have a correlation above 0.5.
.
Ownership % of the biggest owner after the listing
Reg 1 Reg 2
Intercept 10.7614 6.9755
(0.5) (0.3)
Dummy IPO (1) or Private Placement (0) -3.4035 -6.3423
(-1.8) (-3.1)
Age of company 2.9051 1.3201
(2.5) (1.1)
Number of employees 0.0852 0.8391
(0.2) (1.5)
Capital raised 0.9532 1.0741
(0.8) (1.0)
N. Owners before the offering -1.9657 -1.1421
(-2.6) (-1.6)
Net result / Total Assets 0.7173 1.4292
(0.3) (0.7)
IT dummy -6.1962 -5.6924
(-2.3) (-2.2)
Year fixed dummy yes yes
Observations 195 208
Adjusted R -squared 15.7% 9.7%
98

Figure 1Timeline of the Listings on the Oslo Stock Exchange
Listing in database is when the company list ownership records in the ownership database. This is
when the ownership records are observed in the data the first time. Public offering or Private placement is
when the companies distribute the allocated shares in the ownership database. The private placement can
be at any point in time in the six month period leading up to the listing. The public offering is in most
cases in the month before or the month of the listing.
Timeline of the listing Private placements Public offerings
Listing in database Listing in database
Six months before the listing
Meeting with the OSE Meeting with the OSE
Compliance report Compliance report
Due diligence Due diligence
Application submitted Application submitted
Prospectus is made Prospectus is made
Private Placement
One month before the listing
(Public Offering) Public Offering
(Employee offering) (Employee offering)
Listing month Listing Listing
99

5 Summary
This dissertation consists of the three papers; ’Laddering in Initial Public Offering Allo-cations’, ’Using Stock-trading Commissions to Secure IPO Allocations’and ’Initial PublicOffering or Initial Private Placement?’ In the paper ’Laddering in Initial Public OfferingAllocations’it is found that it is likely that IPO allocations are tied to after-listing pur-chases of the IPO shares (IPO laddering). In the paper ’Using Stock-trading Commissionsto Secure IPO Allocations’ it is found that it is likely that IPO allocations are tied tostock-trading commissions before the allocations. In the paper ’Initial Public Offering orInitial Private Placement?’ it is found that it is likely that private placements are usedto transfer private benefits of control from the seller to the buyer.The overall contribution of these findings is an extension to our understanding of how
companies and investment banks allocate shares in initial/primary equity offerings. Thereis strong evidence supporting the rent seeking view of IPO allocations. Both in terms ofallocating IPO shares based on after-listing purchases (IPO laddering) and allocating IPOshares based on stock-trading commissions. There is no evidence supporting the academicview or the pitchbook view of IPO allocations. The thesis also shows that investors withprivate benefits of controlling companies are likely to sell their control rights in privateplacements. The overall conclusion is that both investors and investment banks are likelyto optimize their own return in the equity issuance process.
100

101