Embed Size (px)
Citation preview
°.
|
Initial Observations on the Burning of an
Ethanol Droplet in Microgravity
• qR
Andrei Kazakov, Bradley Urban, Jordan Conley and Frederick L. Dryer
Department of Mechanical and Aerospace Engineering
Princeton University
Princeton, New Jersey 08544-5263
This is a prepdntor reprintof a paperintendedfor presentationat aconference.Becausechanges maybe made beforeformalpublication,thisis made availablewiththe understandingthat it willnotbe citedor reproducedwithoutthe permissionof the author.
1999 Fall Technical Meeting of the Eastern States Section of
the Combustion Institute
Raleigh, NC, October 13, 1999
https://ntrs.nasa.gov/search.jsp?R=20020027090 2018-08-31T03:31:04+00:00Z
Motivation
droplet studies in microgravity."
•simple geometric configuration - opportunity for
testing/validating theory
•facile method to study the diffusive combustion of
fuel molecular species similar to those in
transportation fuels
•link to multi-droplet (spray) applications
•fire safety criteria in space
ethanol:
•relatively simple and established chemistry
•azeotropic behavior of mixtures with water
•change in sooting tendency with pressure
•important gasoline fuel additive
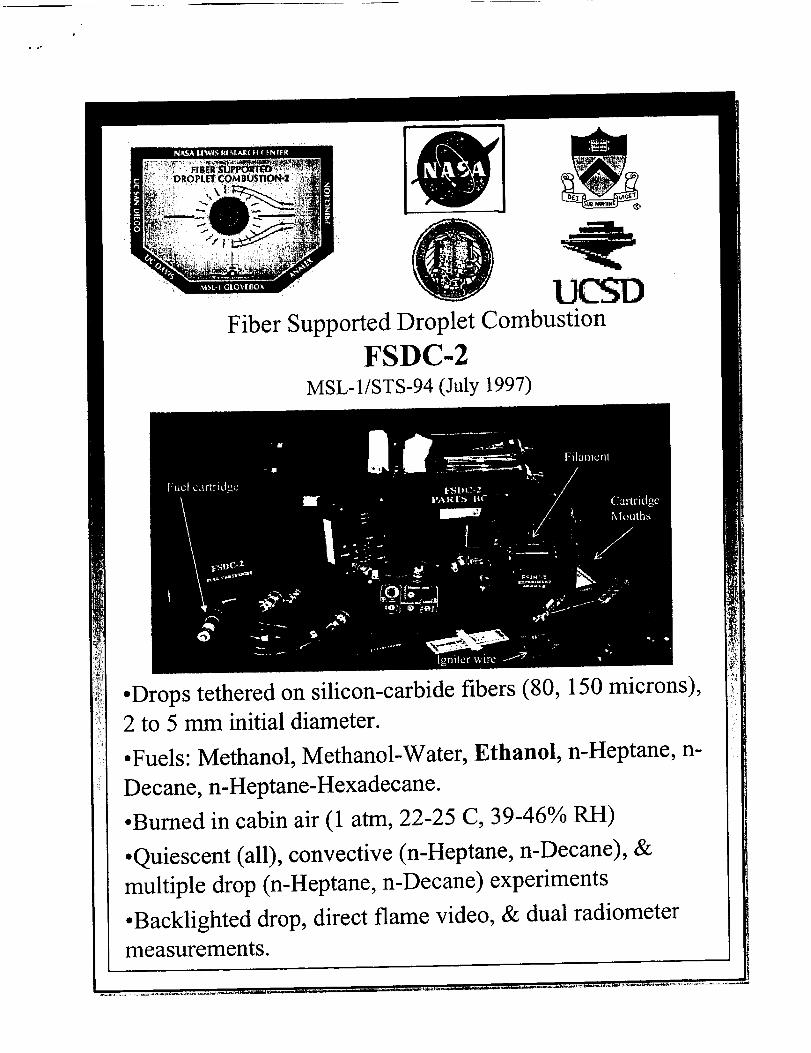
i OFiber Supported Droplet Combustion
FSDC-2MSL-1/STS-94 (July 1997)
•Drops tethered on silicon-carbide fibers (80, 150 microns),2 to 5 mm initial diameter.
•Fuels: Methanol, Methanol-Water, Ethanol, n-Heptane, n-
Decane, n-Heptane-Hexadecane.
•Burned in cabin air (1 atm, 22-25 C, 39-46% RH)
•Quiescent (all), convective (n-Heptane, n-Decane), &
multiple drop (n-Heptane, n-Decane) experiments
•Backlighted drop, direct flame video, & dual radiometermeasurements.

Droplet burning history
pure ethanol, d o - 3.41 mm
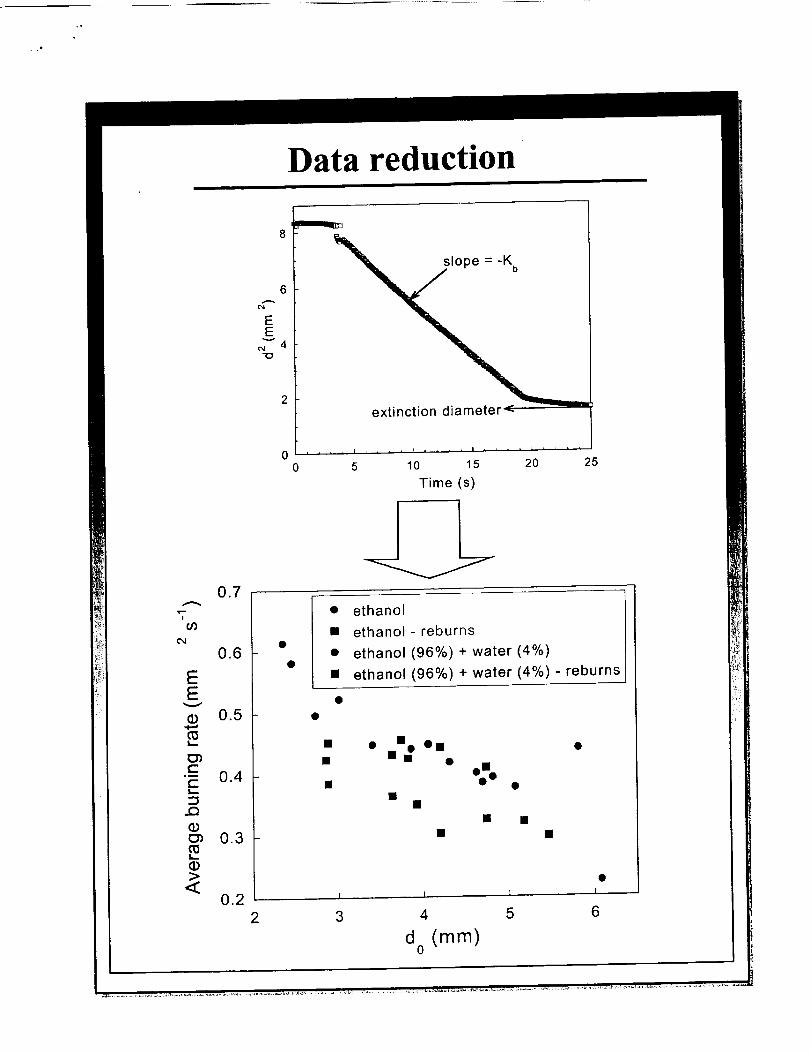
Data reduction
EE
V
¢...
><
0.7
0.6
0.5
0.4
0.3
0.2
6
EE
.'-'4
00
2
.... n .... ! .... i .... L ....
5 10 15 20
Time (s)
25
• ethanol
[] ethanol- reburns
• ethanol (96%) + water (4%)
[] ethanol (96%) + water (4%) - reburns
mmm
[]
• i! O[][]m
ohmO• •
[] [][]
[ ....
4
d (mm)0
I
5
I ,
6
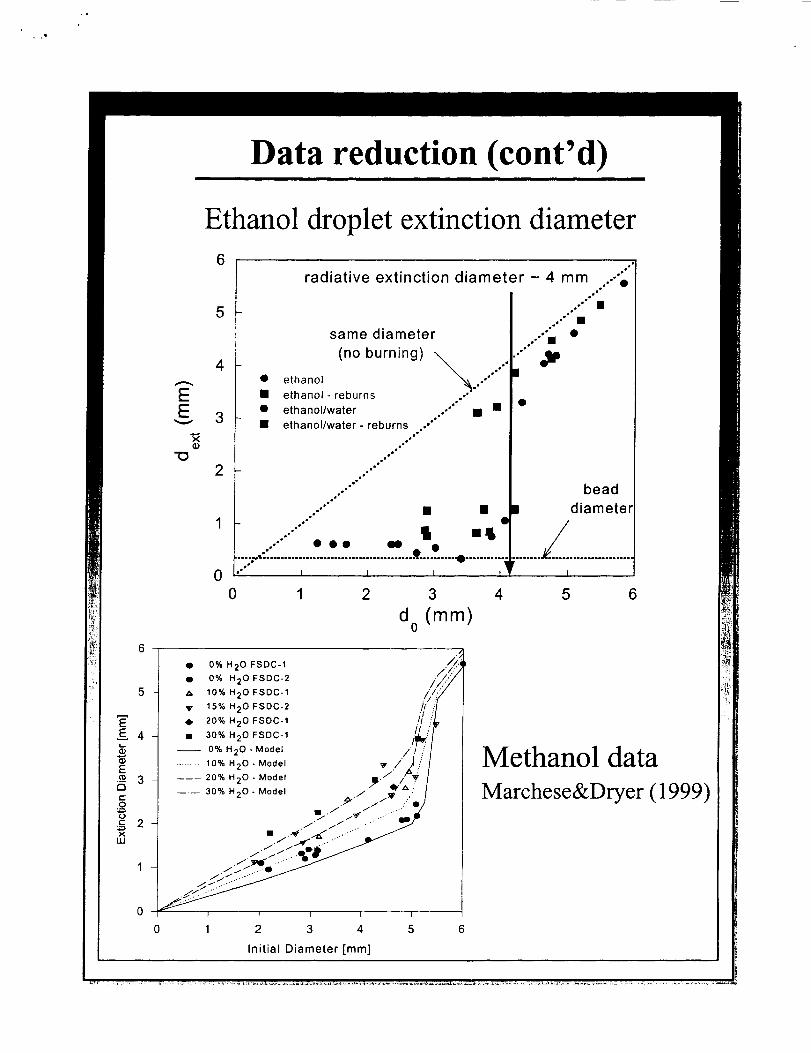
Data reductiola (cont'd)
5
4
3
2
Ethanol droplet extinction diameter
EE
V
5
4
3
2
0
ethanol
ooo'
radiative extinction diameter - 4 mm .."'ew•
I ..'"'11
ojoe •
same diameter ..,'L, •
(no burning) _-'"'"'"'"""ethanol- reburns
ethanol/water
ethanol/water- reburns ..,m
oo f
••o
=J•.o
=o°
o•o "w° •
t"
B•
• "°° •
o•l []
.o
l
beaddiameter
o=°.. _ mt.,-" Ooo OO •
.;_...,,:'......................................... _.......... _ ...........,'" I I I 1
0 1 2 3 4
d (mm)0
I
5 6
• 0% H20 FSDC-1
• 0% H20 FSDC-2
A 10% H20 FSDC-1
V 15% H20 FSDC-2
• 20% H20 FSDC-1
• 30% H20 FSDC-1
-- 0% H20-Model /,I.
......... 10% H20- Model v /'11/:
------ 20% H20 - Model ,_./' /• Q, .., /--.-- 30% H20- Model / _ :
_.. /./ /'O
-/" _5"_e" _ -''_........
•/._- _o_
i t I I I
0 1 2 3 4 5
//,i
/_/..//
.1_/ _"
Methanol data
Marchese&Dryer (1999)
Initial Diameter [mm]

Time-Dependent, Spherically Symmetric,
Bi-component Model for Droplet
Combustion(Based on FEM approach of Cho, et al., 1992) _.---t_--®
Gas Phase:
[ • Multicomponent molecular diffusion
[ _ Detailed chemical kinetics] .Spectral (no--us) thermal radiation
•UV flame emission
=._(__I_ _ 1 0 r2 V +0 _ _ _=7-4-( P,Y, , ) (Os
..... mergy_ Lon:Droplet buriace: -::,:,._:
• Surface regression O(P,_,sr,)
• Evaporation of fuel• Condensation/Dissolution
of products
• Radiative heat exchange
Net Radiative Heat Flux
Droplet Interior:
O(p,C,.,T,) 1 O { _ OT,5Ot = 7_-r (r X' :_rlJ
-D--:7_t. :D,.,--_=-j
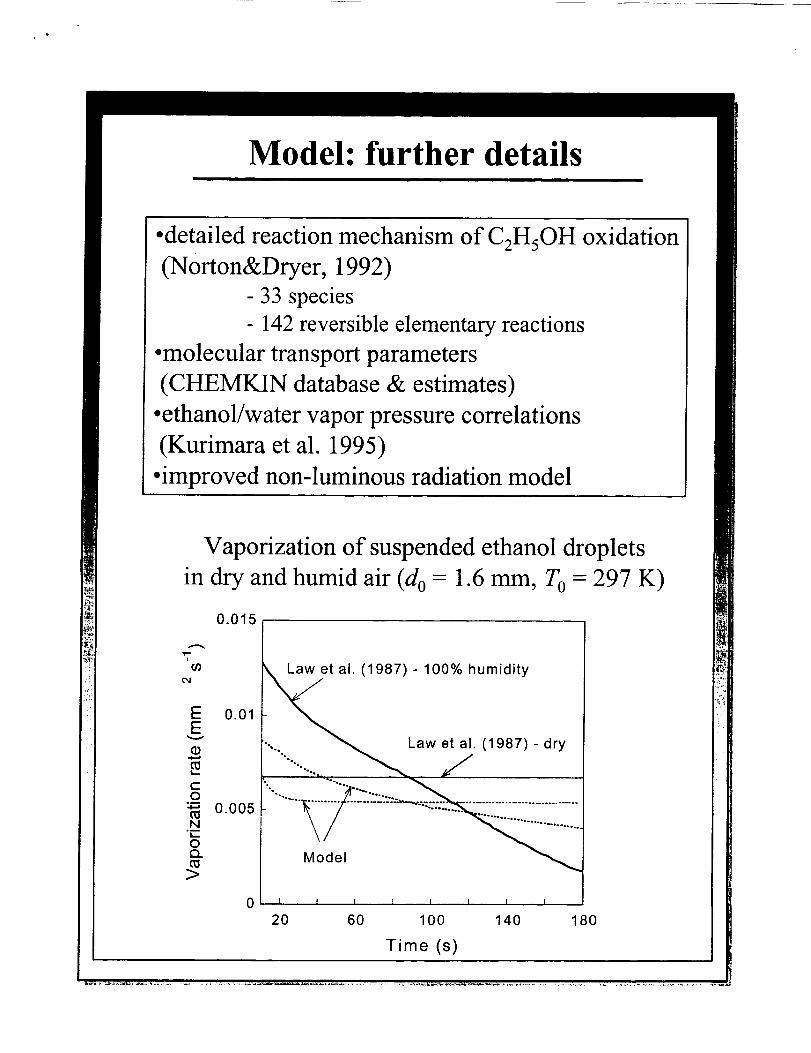
Model: further details
•detailed reaction mechanism of C2HsOH oxidation
(N0rton&Dryer, 1992)
- 33 species
- 142 reversible elementary reactions
•molecular transport parameters
(CHEMKIN database & estimates)
•ethanol/water vapor pressure correlations
(Kurimara et al. 1995)
• improved non-luminous radiation model
Vaporization of suspended ethanol droplets
in dry and humid air (d o = 1.6 ram, To = 297 K)
0.015
i
¢'q
EE
v
¢-O
N
OEl.
>
0.01
0.005
0
1987, ialii iiiiiildry---........_--_ J
I I [ [ I I I
20 60 100 140 180
Time (s)
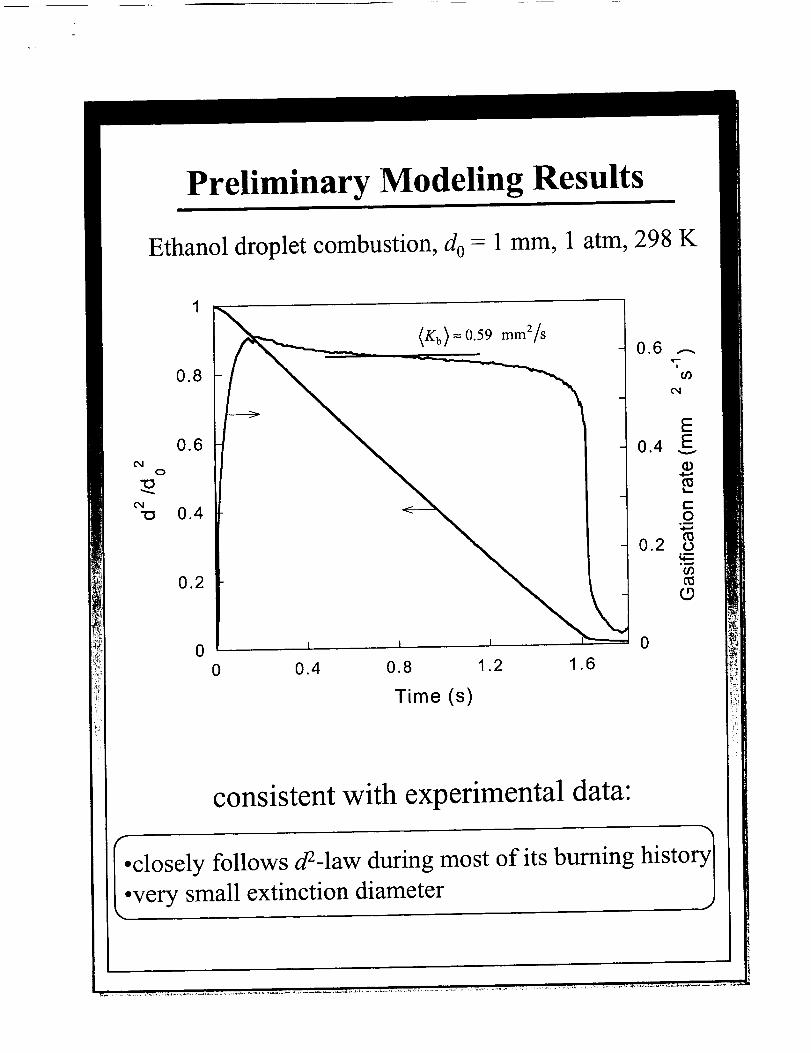
Preliminary Modeling Results
Ethanol droplet combustion, d o = 1 mm, 1 atm, 298 K
¢'4
0.8
0.6
¢'q
0.4
0.2
(Kb) = 0.59 mm2/s
I
\0 0
0 0.4 0.8 1.2 1.6
Time (s)
0.6"T,
E0.4 E
(D
t.-
t-O
.m
0.2oo
(.9
consistent with experimental data:
-)•closely follows d2-1aw during most of its burning history[
•very small extinction diameter
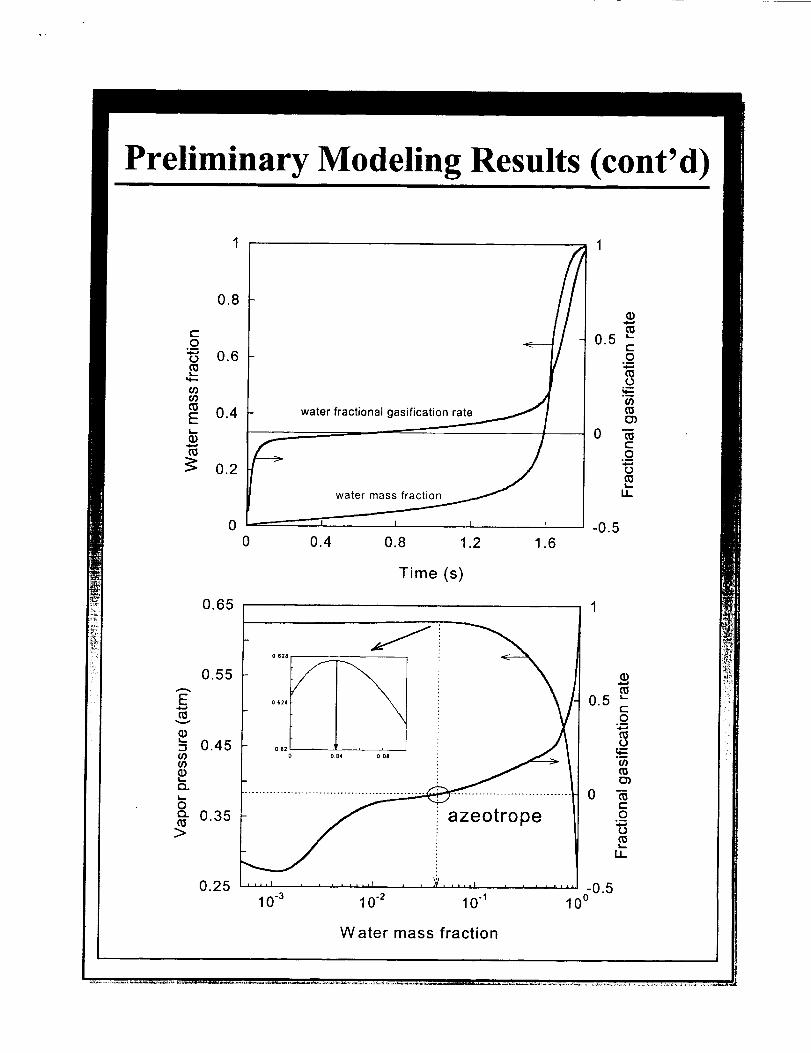
Preliminary Modeling Results (cont'd)
1 1
0.8
t-
O 0.6
ffl
E 0.4I,..
_ 0.2
0
0.65
0.55
_0.45
_- 0.35>
0.25
water fractional gasific
i i I t
0.4 0.8 1.2 1.6
0.5
0
-0.5
Time (s)
0,,.
o 0.5
0 -_0
U_
.... , ........ I , , ,V..... , ....... 0.510 3 10 .2 10 1 10 °
¢,,..o_
o.m
0")
c-O
°_
o
U_
Water mass fraction
Summary
•first experimental information on ethanol droplet burning
in microgravity
- burning rates- extinction diameters
- radiative extinction diameter (~ 4 mm)- flame diameters
•ethanol droplet combustion is less influenced by water
condensation as opposed to previously studied methanol
cases
•preliminary computational analysis is in consistence with
experimental findings
•further computational analysis is in progress; additional
experimental work (FSDC-3) is planned
Acknowledgements
•FSDC-2 team members:
Forman Williams, Ron Colantonio, Dan Dietrich, John Haggard,
Sue Motil, Vedha Nayagam, and Ben Shaw
•financial support from NASA Glenn Research Center
°.
Extras follow...
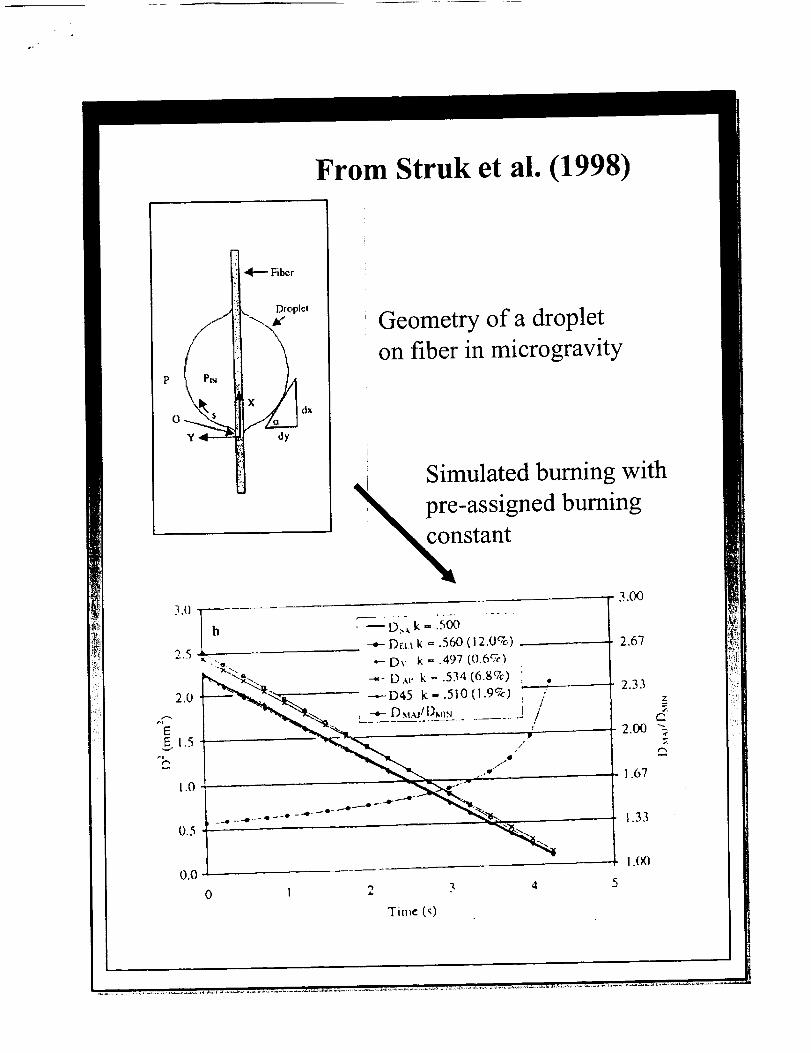
From Struk et al. (1998)
o
3.0
2.5
2.0
r.J
EE 1.5
%
1.0
_ 4-.-- Fiber
Geometry of a droplet
on fiber in microgravity
Simulated burning with
Pre-assigned burning
stant
3.00
0.5
0.0
2.67
2.33Z
2.00 -_7..
1.67
1.3.1
I.(X)
0 I 2 3 4 5
Time (s)
#,
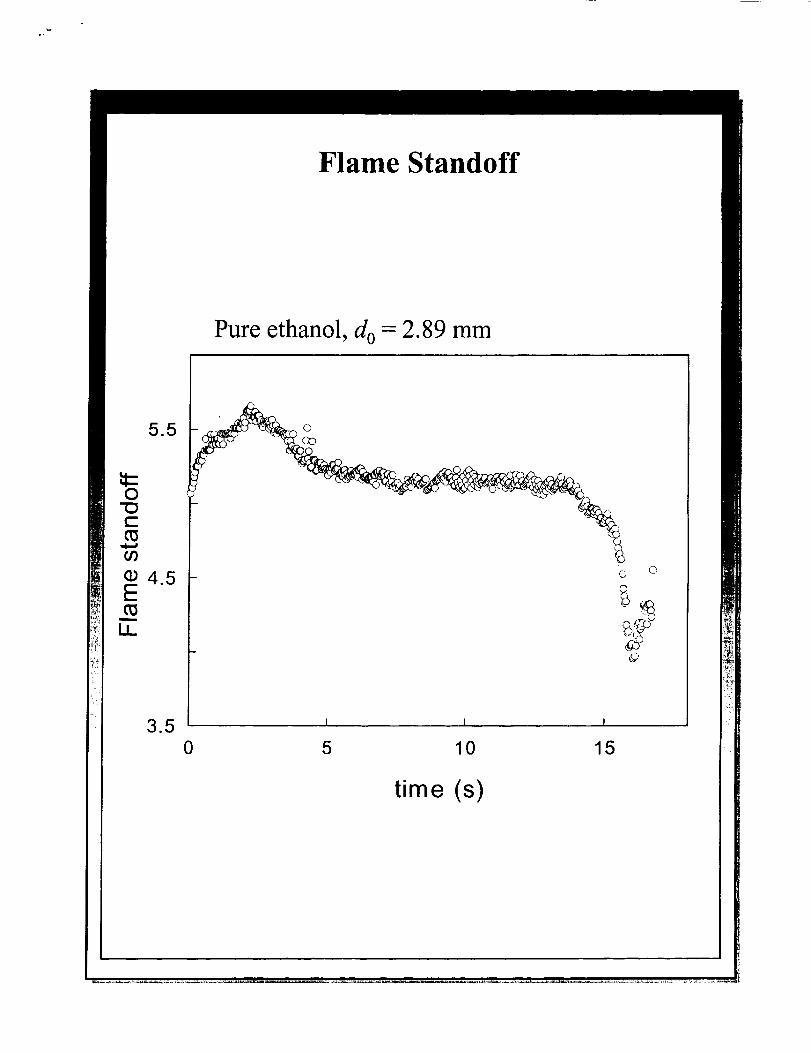
Flame Standoff
Pure ethanol, do = 2.89 mm
0
t'-
I
LL.
5.5
4.5
3.5
0
0
I I I
5 10 15
0 0
g
¢©
time (s)
Initial Observations on the Burning of an Ethanol Droplet in Microgravity
Andrei Kazakov, Bradley Urban, Jordan Conley and Frederick L. DryerDepartment of Mechanical and Aerospace Engineering,
Princeton University, Princeton, NJ 08544
INTRODUCTION
Combustion of liquid ethanol represents an important system both from fundamental and practical
points of view. Ethanol is currently being used as an additive to gasoline in order to reduce carbon
monoxide and particulate emissions as well as to improve the fuel octane rating. A detailed physical
understanding of liquid ethanol combustion is therefore necessary to achieve an optimal performance of
such fuel blends in practical conditions. Ethanol is also a relatively simple model compound suitable for
investigation of important combustion characteristics typical of more complex fuels. In particular,
ethanol has been proposed for studies of sooting behavior during droplet burning [1 ]. The sooting nature
of ethanol has pressure sensitivities similar to that of n-heptane, but shifted to a higher range of pressures
(1-3 atm). Additionally, liquid ethanol is miscible with water produced during its combustion forming
mixtures with azeotropic behavior, a phenomenon important for understanding multi-component, liquid
fuel combustion [2]. In this work, we present initial results obtained in the series of recent space-based
experiments [3] and development a detailed model describing the burning of ethanol droplet in
microgravity.
EXPERIMENTAL
The microgravity ethanol droplet combustion experiments were performed aboard the STS-94/MSL-
1 Shuttle mission within the Fiber-Supported Droplet Combustion-2 (FSDC-2) program [3]. All
experiments were carried out in the Glovebox (MGBX) facility using the FSDC-2 experimental
apparatus. Ethanol and ethanol/water mixtures were contained in modified, airtight commercial syringe
cartridges. To operate the experiment, the fuel cartridge was screwed into the base of the experiment
module. The crew turned a plunger screw, forcing fuel through two, opposed, hypodermic needles to the
deployment site on a silicon fiber located between the needles and perpendicular to them. After the fuel
coalesced into a droplet of the desired size, the needles were slowly retracted to minimize contact of the
liquid with the needle surfaces. The stretched droplet was then deployed by rapidly retracting the needles
into the bottom of the chamber. Motions of the deployed droplet were allowed to dampen before the
ignition button was depressed. This automatically lifted a replaceable igniter wire into place on one side
of the droplet (parallel to the fiber), approximately 3.5 mm from the fiber, and simultaneously provided
DC electric current to the igniter. When the crew operator detected ignition visually, the igniter button
was released, automatically retracting the igniter to the bottom of the test chamber. The manual nature of
the experiment can affect the reproducibility and fidelity of the data, in comparison to that obtained in the
full-facility Droplet Combustion Experiment (DCE) apparatus. However, FSDC experiments provide
substantial scientific insights as well as fn'st-order data on which to base more refined DCE studies.
Imaging data are provided by two video views, one a backlit view of the droplet and the other a
perpendicular view of the flame. The video camera for the droplet view was attached to the Glovebox
microscope. The second video camera, with a view essentially orthogonal to the microscope, recorded
the droplet, the fiber, and the flame. All of the data were recorded using three 8 mm VCR's. The taped
camera images were analyzed using microcomputer-based imaging analysis systems. Each droplet
combustion test occurred at pressures (0.996-1.107 bar), oxygen mole fractions (0.204-0.222), and
relative humidity (39-46%) of the Spacelab environment.
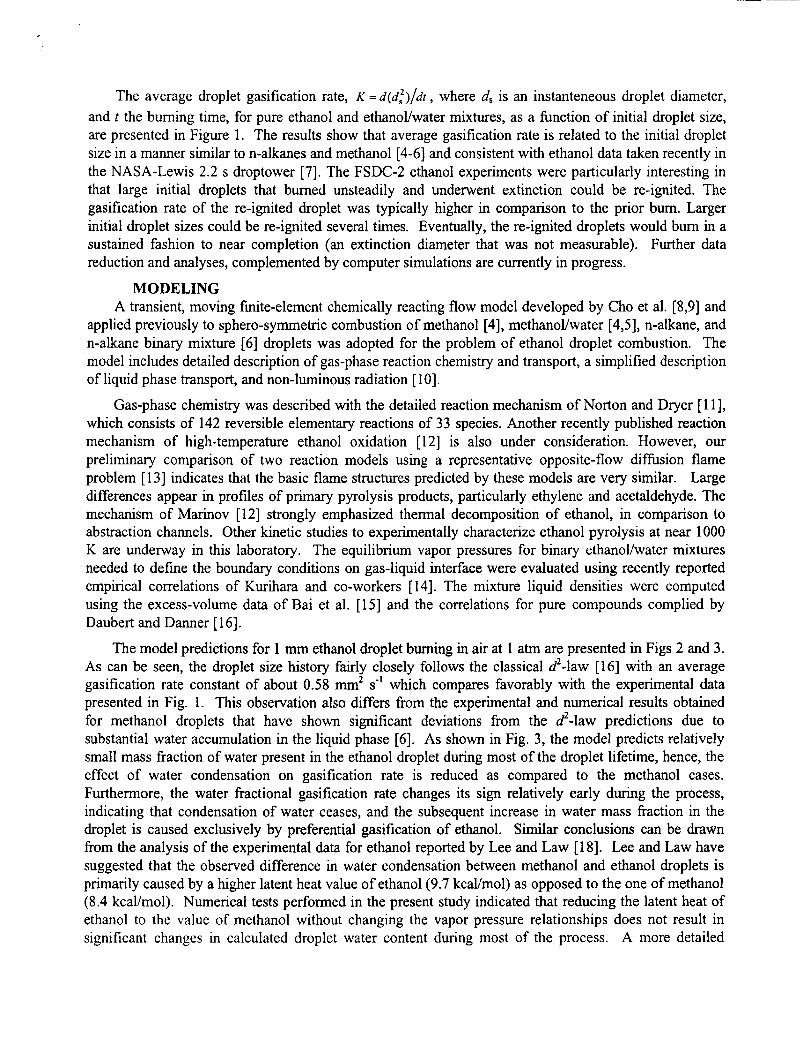
Theaveragedropletgasificationrate, K = d(d2s)/dt, where ds is an instanteneous droplet diameter,
and t the burning time, for pure ethanol and ethanol/water mixtures, as a function of initial droplet size,
are presented in Figure 1. The results show that average gasification rate is related to the initial droplet
size in a manner similar to n-alkanes and methanol [4-6] and consistent with ethanol data taken recently in
the NASA-Lewis 2.2 s droptower [7]. The FSDC-2 ethanol experiments were particularly interesting in
that large initial droplets that burned unsteadily and underwent extinction could be re-ignited. The
gasification rate of the re-ignited droplet was typically higher in comparison to the prior bum. Larger
initial droplet sizes could be re-ignited several times. Eventually, the re-ignited droplets would bum in a
sustained fashion to near completion (an extinction diameter that was not measurable). Further data
reduction and analyses, complemented by computer simulations are currently in progress.
MODELING
A transient, moving finite-element chemically reacting flow model developed by Cho et al. [8,9] and
applied previously to sphero-symmetric combustion of methanol [4], methanol/water [4,5], n-alkane, and
n-alkane binary mixture [6] droplets was adopted for the problem of ethanol droplet combustion. The
model includes detailed description of gas-phase reaction chemistry and transport, a simplified description
of liquid phase transport, and non-luminous radiation [10].
Gas-phase chemistry was described with the detailed reaction mechanism of Norton and Dryer [11],
which consists of 142 reversible elementary reactions of 33 species. Another recently published reaction
mechanism of high-temperature ethanol oxidation [12] is also under consideration. However, our
preliminary comparison of two reaction models using a representative opposite-flow diffusion flame
problem [13] indicates that the basic flame structures predicted by these models are very similar. Large
differences appear in profiles of primary pyrolysis products, particularly ethylene and acetaldehyde. The
mechanism of Marinov [12] strongly emphasized thermal decomposition of ethanol, in comparison to
abstraction channels. Other kinetic studies to experimentally characterize ethanol pyrolysis at near 1000
K are underway in this laboratory. The equilibrium vapor pressures for binary ethanol/water mixtures
needed to define the boundary conditions on gas-liquid interface were evaluated using recently reported
empirical correlations of Kurihara and co-workers [14]. The mixture liquid densities were computed
using the excess-volume data of Bai et al. [15] and the correlations for pure compounds complied by
Daubert and Danner [16].
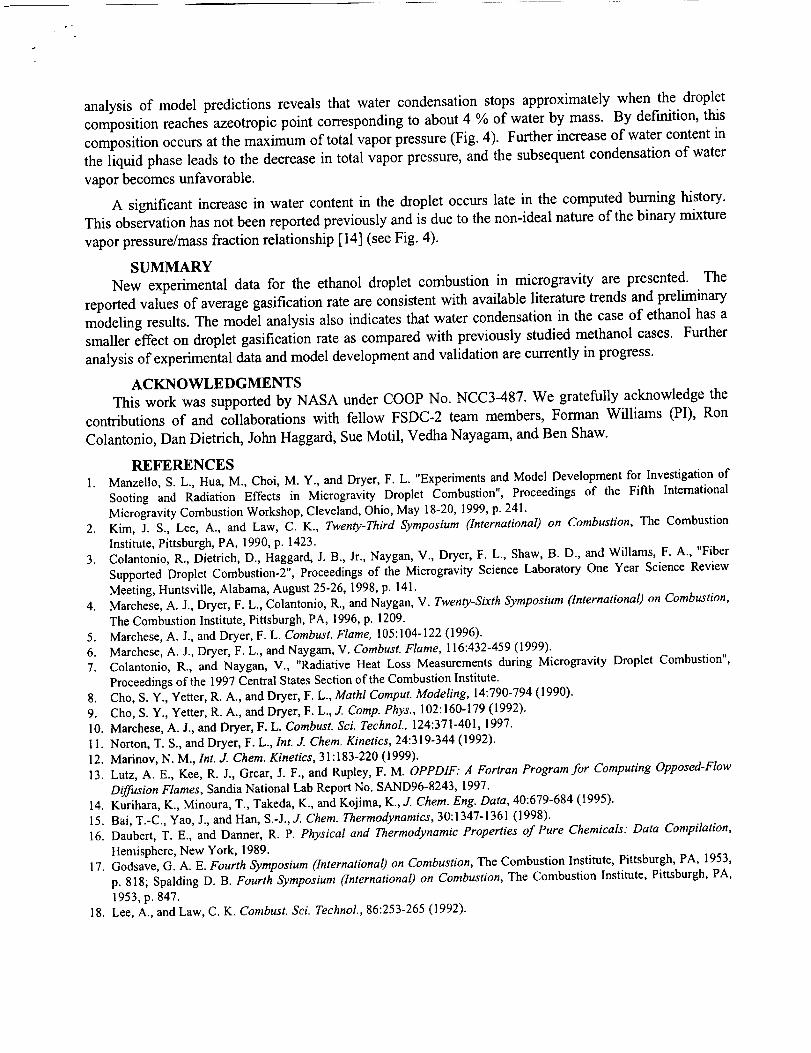
The model predictions for 1 mm ethanol droplet burning in air at 1 atm are presented in Figs 2 and 3.
As can be seen, the droplet size history fairly closely follows the classical d2-1aw [16] with an average
gasification rate constant of about 0.58 mm 2 st which compares favorably with the experimental data
presented in Fig. 1. This observation also differs from the experimental and numerical results obtained
for methanol droplets that have shown significant deviations from the d2-1aw predictions due to
substantial water accumulation in the liquid phase [6]. As shown in Fig. 3, the model predicts relatively
small mass fraction of water present in the ethanol droplet during most of the droplet lifetime, hence, the
effect of water condensation on gasification rate is reduced as compared to the methanol cases.
Furthermore, the water fractional gasification rate changes its sign relatively early during the process,
indicating that condensation of water ceases, and the subsequent increase in water mass fraction in the
droplet is caused exclusively by preferential gasification of ethanol. Similar conclusions can be drawn
from the analysis of the experimental data for ethanol reported by Lee and Law [18]. Lee and Law have
suggested that the observed difference in water condensation between methanol and ethanol droplets is
primarily caused by a higher latent heat value of ethanol (9.7 kcal/mol) as opposed to the one of methanol
(8.4 kcal/mol). Numerical tests performed in the present study indicated that reducing the latent heat of
ethanol to the value of methanol without changing the vapor pressure relationships does not result in
significant changes in calculated droplet water content during most of the process. A more detailed
analysis of model predictions reveals that water condensation stops approximately when the droplet
composition reaches azeotropic point corresponding to about 4 % of water by mass. By definition, this
composition occurs at the maximum of total vapor pressure (Fig. 4). Further increase of water content in
the liquid phase leads to the decrease in total vapor pressure, and the subsequent condensation of water
vapor becomes unfavorable.
A significant increase in water content in the droplet occurs late in the computed burning history.
This observation has not been reported previously and is due to the non-ideal nature of the binary mixture
vapor pressure/mass fraction relationship [I4] (see Fig. 4).
SUMMARY
New experimental data for the ethanol droplet combustion in microgravity are presented. The
reported values of average gasification rate are consistent with available literature trends and preliminary
modeling results. The model analysis also indicates that water condensation in the case of ethanol has a
smaller effect on droplet gasification rate as compared with previously studied methanol cases. Further
analysis of experimental data and model development and validation are currently in progress.
ACKNOWLEDGMENTS
This work was supported by NASA under COOP No. NCC3-487. We gratefully acknowledge the
contributions of and collaborations with fellow FSDC-2 team members, Forman Williams (PI), Ron
Colantonio, Dan Dietrich, John Haggard, Sue Motil, Vedha Nayagam, and Ben Shaw.
REFERENCES
1. Manzello, S. L., Hua, M., Choi, M. Y., and Dryer, F. L. "Experiments and Model Development for Investigation ofSooting and Radiation Effects in Microgravity Droplet Combustion", Proceedings of the Fifth International
Microgravity Combustion Workshop, Cleveland, Ohio, May 18-20, 1999, p. 241.2. Kim, J. S., Lee, A., and Law, C. K., Twenty-Third Symposium (International) on Combustion, The Combustion
Institute, Pittsburgh, PA, 1990, p. 1423.
3. Colantonio, R., Dietrich, D., Haggard, J. B., Jr., Naygan, V., Dryer, F. L., Shaw, B. D., and Willams, F. A., "FiberSupported Droplet Combustion-2", Proceedings of the Microgravity Science Laboratory One Year Science Review
Meeting, Huntsville, Alabama, August 25-26, 1998, p. 141.
4. Marchese, A. J., Dryer, F. L., Colantonio, R., and Naygan, V. Twenty-Sixth Symposium (International) on Combustion,The Combustion Institute, Pittsburgh, PA, 1996, p. 1209.
Marchese, A. J., and Dryer, F. L. Combust. Flame, 105:104-122 (1996).Marchcse, A. J., Dryer, F. L., and Naygam, V. Combust. Flame, 115:432-459 (1999).
Colantonio, R., and Naygan, V., "Radiative Heat Loss Measurements during Microgravity Droplet Combustion",Proceedings of the 1997 Central States Section of the Combustion Institute.
Cho, S. Y., Yetter, R. A., and Dryer, F. L., Mathl Comput. Modeling, 14:790-794 (1990).Cho, S. Y., Yetter, R. A., and Dryer, F. L., J. Comp. Phys., 102:160-179 (1992).
Marchese, A. J., and Dryer, F. L. Combust. Sci. Technol., 124:371-401, 1997.Norton, T. S., and Dryer, F. L., Int. J. Chem. Kinetics, 24:319-344 (1992).
Marinov, N. M., Int. J. Chem. Kinetics, 31"183-220 (1999).
Lutz, A. E., Kee, R. J., Grcar, J. F., and Rupley, F. M. OPPDIF: A Fortran Program for Computing Opposed-FlowDiffusion Flames, Sandia National Lab Report No. SAND96-8243, 1997.
Kurihara, K., Minoura, T., Takeda, K., and Kojima, K., J. Chem. Eng. Data, 40:679-684 (1995).Bai, T.-C., Yao, J., and Han, S.-J., J. Chem. Thermodynamics, 30:1347-1361 (1998).
Daubert, T. E., and Danner, R. P. Physical and Thermodynamic Properties of Pure Chemicals: Data Compilation,Hemisphere, New York, 1989.
Godsave, G. A. E. Fourth Symposium (International) on Combustion, The Combustion Institute, Pittsburgh, PA, 1953,p. 818; Spalding D. B. Fourth Symposium (International) on Combustion, The Combustion Institute, Pittsburgh, PA,1953, p. 847.
Lee, A., and Law, C. K. Combust. Sci. Technol., 86:253-265 0992).
5°
6.7.
.
9.10.
11.12.
13.
14.15.
16.
17.
18.

1 1
0.6
0.5E
g
0.4co
"_ 0.3
0
Figure 1.
0.2
o
o
0
• pure ethanol
m pure ethanol - reburn
0 ethanollwater
r_ ethanot/water - reburn
• D O o D •
• m • • n
o° o
Nil •• D
0L i i i
3 4 5 6
Initialdiameter(ram)
Average gasification rate constant as a
function of initial droplet diameter for ethanol
droplet burning in air [3].
0.8
g0.6
g0,4
o=
0.2
00
Figure 3.
o.o_
)Lt.
-0.5
0.4 0.8 1.2 1.6
Time (s)
Water mass fraction (solid line) and fractional
gasification rate, mH_o/(ml-l=O+ rhc:tsorl ),
where rhH_o and /nC2H_OH are mass flow
rates of water and ethanol, respectively, on thedroplet surface (dotted line).
0.8
0.6e_
_°% 0.4
0.2
0
0
Figure 2.
0.6 A"7,
t/)
E0.4
t_
t-o
0.2
t_0
0.4 0.8 1.2 1.6
Time (s)
Computed diameter-squared normalized byinitial diameter-squared (solid line) and
instantaneous gasification rate (dotted line)
for 1 mm ethanol droplet burning in air at 1arm.
0.65
" 0.55
0.45
e_
>
0.35oI...-
0.25
Figure 4.
°117Ji i i i i
0.2 0.4 0.6 0.8
Mass fraction ofwater inliquidphase
Total equilibrium vapor pressure above the
liquid ethanol/water mixture as a function of
water mass fraction in liquid phase at 340 K,a representative interface surface temperature
predicted by the model.


![Synthesis of new 7-azabicyclo[2.2.1]heptane derivatives](https://img.pdfslide.us/doc/110x75/628d64017e1f0679361739f7/synthesis-of-new-7-azabicyclo221heptane-derivatives.jpg)