Embed Size (px)
Citation preview
1. Introduction
An important step in developing the ac quantizedHall resistance (ac QHR) [1-10] as an intrinsic im-pedance standard based on the dc QHR [11-13] is tomeasure the dc QHR guideline properties [14] and thedc and ac QHR values without changing sample probelead contacts at the QHR device. (Otherwise guidelineproperties should be remeasured.) We show in the firstac QHR experiment at NIST that this can be accom-plished in a single cooldown using multiple connec-tions [15] to the device outside the sample probe. Thedevice was found to not be of standards-quality; so onlyguideline properties needed for this particular experi-ment were measured (shapes of the QHR plateaus andlongitudinal voltages Vx, contact resistances, longitudi-nal resistances at the Vx minima, dc QHR values for all
three quantum Hall probes sets at the Vx minima, andthe quadruple-series-connected dc QHR value at the Vx
minimum). All dc guideline properties could have beendetermined for a good device (including those formagnetic field reversal) using the external single-seriesand quadruple-series configurations. (Of course the dcguidelines are a necessary, but not sufficient, conditionof ac device suitability, and any future proposed acguidelines are yet another matter.)
The ac QHR values converged to the dc QHR valueunder proper conditions (which were external quadru-ple-series connections [16], four-terminal-pair (4TP)techniques [17,18], and interchanged 1:1 ratio meas-urements). We wanted to demonstrate convergence toabout ±1 part in 108 of the dc QHR, but poor deviceproperties limited the present uncertainty to ±1 part in107.
Volume 109, Number 4, July-August 2004Journal of Research of the National Institute of Standards and Technology
391
[J. Res. Natl. Inst. Stand. Technol. 109, 391-405 (2004)]
Initial NIST AC QHR Measurements
Volume 109 Number 4 July-August 2004
M. E. Cage, S. H. Shields, andA. Jeffery
National Institute of Standardsand Technology,Gaithersburg, MD 20899-8172
[email protected]@nist.gov
We demonstrate that dc quantized Hallresistance (dc QHR) guideline propertiesand dc and ac QHR values can bemeasured without changing sample probelead connections at the QHR device,and report ac QHR values that convergeto the dc QHR value when usingfour-terminal-pair ac QHR measurements.This was accomplished during onecooldown using single-series andquadruple-series connections outside thesample probe. The QHR was measuredfrom 0 Hz to 5500 Hz in 1:1 ratio at20 µA to ±1 part in 107 uncertainties witha poor-quality QHR device. A gooddevice would allow an order of magnitudesmaller uncertainties over this frequencyrange. We exchanged positions of theQHR device and reference resistor in thebridge and remeasured the resistance ratiosto remove dominant ac bridge effects.
Keywords: ac quantum Hall effect;dc quantum Hall effect; frequencydependences; multifrequency bridge;quadruple-series connections; single-seriesconnections.
Accepted: September 5, 2004
Available online: http://www.nist.gov/jres
2. QHR Device, Header, and Sample Probe
The only ac QHR device available was a LEP 175GaAs/AlGaAs heterostructure fabricated by theLaboratories d’Electronic Philips1 in France that welabeled ac1. K. C. Lee of NIST mounted it on oneof our custom-built headers using 100 µm diameterplatinum wires to avoid vibrational effects of accurrents in a magnetic field. The header, constructedfrom gold-patterned 1.6 mm (1/16") thick printedcircuit board, had a single ground plane over most of itsback surface to minimize wire-to-wire capacitances atthe device. (This matters because Eq. (55) of Ref. [16]predicts that the largest frequency-dependent correctionterm in quadruply-connected ac QHR measurements is–ω2CX′X′CX′X′RHRH, which involves the squares of: theangular frequency ω; the summed-total CX′X′ of thosewire-to-wire capacitances that have the quantum Hallvoltage across them; and the quantized Hall resistanceRH.) A single ground plane assures symmetry on mag-netic field reversal. Tests showed that this groundedback-plane reduced wire-to-wire capacitances, withonly slight increases in capacitances-to-shield, whereasa ground plane on the front surface of the headersignificantly increased capacitances-to-shield forsimilar reductions in wire-to-wire capacitance.
We predipped the eight semi-rigid coaxial cablesseveral times in liquid helium before sample probeassembly to minimize Teflon insulation flow duringcooldown. (B. W. Ricketts of the National MeasurementLaboratory in Australia cautioned us that differentialcompression when cooling the coaxial cables squeezesthe Teflon, causing it to flow during the first few cool-downs and thus stress solder joints at the coaxialsocket.)
Cernox thermometers sensitive to a mK were locat-ed above and below the device, which could only becooled to 1.5 K at maximum pumping rates (rather thanthe 1.3 K of our dc sample probes) because semi-rigidcoaxial cables have more thermal conduction.
3. Device Properties
We pumped the sample probe extensively to avoidtrapped gasses in the coaxial leads, and then cooled the
device slowly over two days to eliminate electron-holepair production in the device (which creates additionalelectrons in the two-dimensional fluid and a slowdownward drift in the magnetic field positions of QHRplateaus as the pairs recombine). The device was thenmaintained at or below 4.2 K for 3 months.
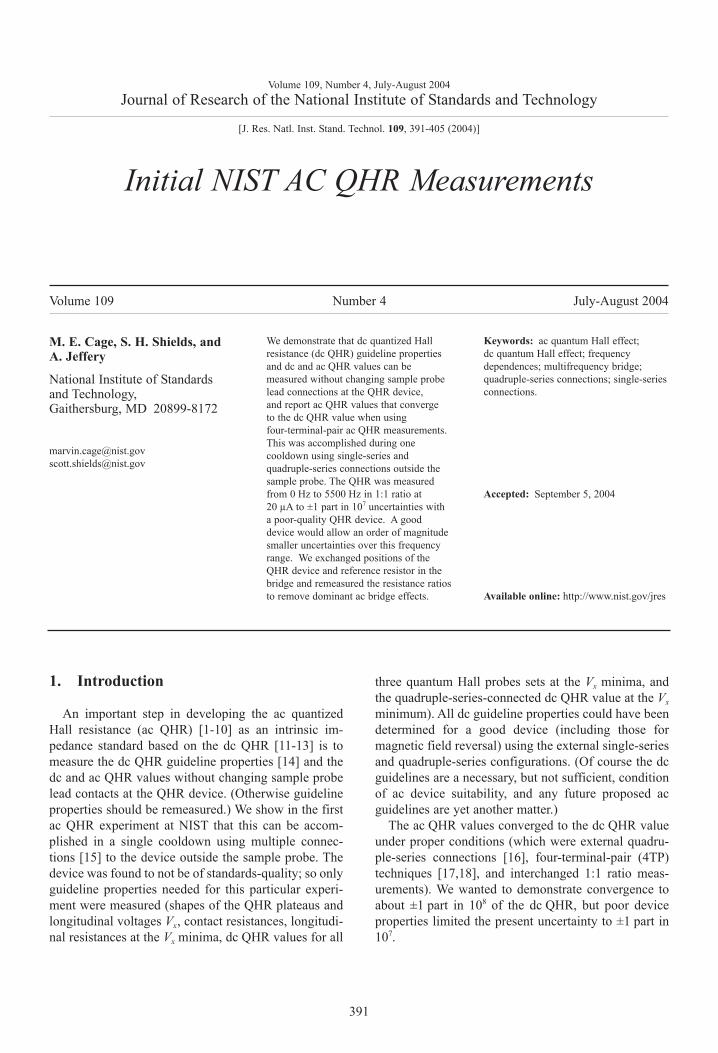
Figure 1 shows a magnetic field sweep for thecentral quantum Hall voltage probes VH(3,4) and thelongitudinal voltage probes Vx(2,6) at a I = 20.0 µA dcsource-drain current and T = 1.59 K temperature. (Thedevice source, drain, and potential probe contacts S′,D′, 1′ – 6′ are identified in Fig. 7. Primes refer to con-nections at the device contact pads, while unprimednumbers and letters refer to connections outside thesample probe.)
The device looks promising in this sweep. However,three-terminal contact resistance measurements atthe approximate currents that will pass througheach contact in the quadruple-series mode on thei = 2 (12 906.4 Ω) quantum Hall plateau at 8.3 T and1.58 K tell a different story: S′ = 9 Ω, D′ = 0.04 Ω, 1′ =115 Ω, 2′ = 238 Ω, 3′ = 1417 Ω, 4′ = 73 Ω, 5′ = 179 Ω,and 6′ = 7644 Ω after measuring the voltages with bothcurrent directions and subtracting lead resistances.Furthermore, the 7644 Ω potential contact 6′ exhibitedCorbino-like behavior: its contact resistance increasedwith decreasing current at small currents due to isolat-ed spikes into the two-dimensional electron fluid,rather than a uniform diffusion. Current circulatedaround the spikes, as well as along the device. Thatbehavior (pointed-out by K. C. Lee of NIST) wouldremain undetected if its contact resistance had beenmeasured at the 20.0 µA source-drain current, ratherthan the ≈ 0.01 µA quadruple-series current appropriate
392
Volume 109, Number 4, July-August 2004Journal of Research of the National Institute of Standards and Technology
1 Certain commercial equipment, instruments, or materials are iden-tified in this paper to foster understanding. Such identification doesnot imply recommendation or endorsement by the National Instituteof Standards and Technology, nor does it imply that the materialsor equipment identified are necessarily the best available for thispurpose.
Fig. 1. Magnetic field sweep for the central quantum Hall voltageprobes VH(3,4) and the longitudinal voltage probes Vx(2,6) at I =20.0 µA dc and T = 1.59 K. The magnetic flux density B is in tesla.Voltage probe numbers are identified in Fig. 7.
393
for that probe. It is important to measure contact resist-ances at the approximate multi-series connectioncurrents, and for each current direction. Resistances ofthe 1′, 3′, and 5′ potential contacts were also current-dependent, but in a more typical way: their resistancesincreased with increasing current.
The Corbino-like behavior of potential contact 6′created several problems: static voltages induced whenreversing dc current directions or changing ac bridgecables sometimes required minutes or hours to decay(making measurements time-consuming), and the QHRvalues RH = VH/I often fluctuated by about 1 part in 107
(1 × 10⁻⁷ RH) within a day or between days. A devicewith properties this poor would normally be immedi-ately discarded, but no others were available. Thefollowing measurements are intended only as indica-tors of what could be done with a good device.
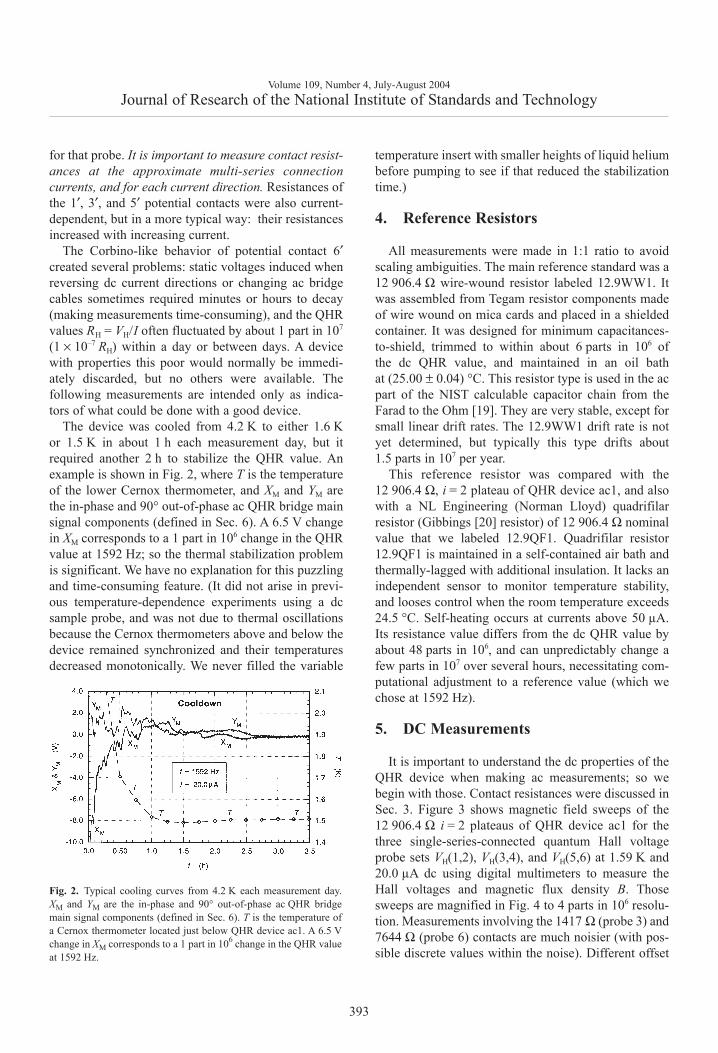
The device was cooled from 4.2 K to either 1.6 Kor 1.5 K in about 1 h each measurement day, but itrequired another 2 h to stabilize the QHR value. Anexample is shown in Fig. 2, where T is the temperatureof the lower Cernox thermometer, and XM and YM arethe in-phase and 90° out-of-phase ac QHR bridge mainsignal components (defined in Sec. 6). A 6.5 V changein XM corresponds to a 1 part in 106 change in the QHRvalue at 1592 Hz; so the thermal stabilization problemis significant. We have no explanation for this puzzlingand time-consuming feature. (It did not arise in previ-ous temperature-dependence experiments using a dcsample probe, and was not due to thermal oscillationsbecause the Cernox thermometers above and below thedevice remained synchronized and their temperaturesdecreased monotonically. We never filled the variable
temperature insert with smaller heights of liquid heliumbefore pumping to see if that reduced the stabilizationtime.)
4. Reference Resistors
All measurements were made in 1:1 ratio to avoidscaling ambiguities. The main reference standard was a12 906.4 Ω wire-wound resistor labeled 12.9WW1. Itwas assembled from Tegam resistor components madeof wire wound on mica cards and placed in a shieldedcontainer. It was designed for minimum capacitances-to-shield, trimmed to within about 6 parts in 106 ofthe dc QHR value, and maintained in an oil bathat (25.00 ± 0.04) °C. This resistor type is used in the acpart of the NIST calculable capacitor chain from theFarad to the Ohm [19]. They are very stable, except forsmall linear drift rates. The 12.9WW1 drift rate is notyet determined, but typically this type drifts about1.5 parts in 107 per year.
This reference resistor was compared with the12 906.4 Ω, i = 2 plateau of QHR device ac1, and alsowith a NL Engineering (Norman Lloyd) quadrifilarresistor (Gibbings [20] resistor) of 12 906.4 Ω nominalvalue that we labeled 12.9QF1. Quadrifilar resistor12.9QF1 is maintained in a self-contained air bath andthermally-lagged with additional insulation. It lacks anindependent sensor to monitor temperature stability,and looses control when the room temperature exceeds24.5 °C. Self-heating occurs at currents above 50 µA.Its resistance value differs from the dc QHR value byabout 48 parts in 106, and can unpredictably change afew parts in 107 over several hours, necessitating com-putational adjustment to a reference value (which wechose at 1592 Hz).
5. DC Measurements
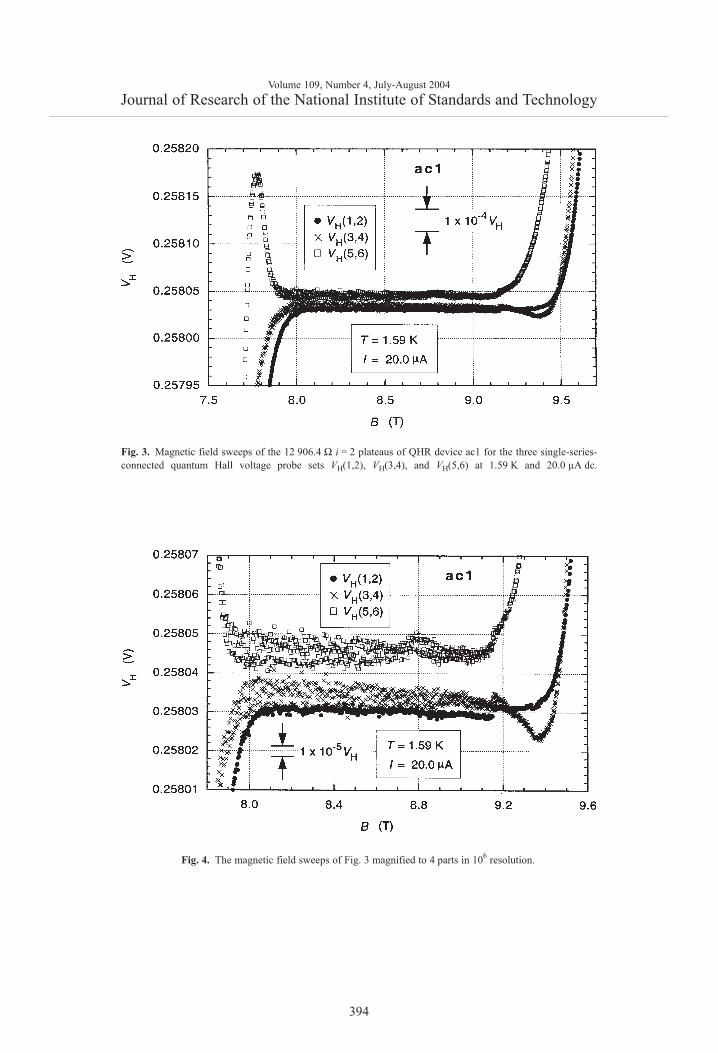
It is important to understand the dc properties of theQHR device when making ac measurements; so webegin with those. Contact resistances were discussed inSec. 3. Figure 3 shows magnetic field sweeps of the12 906.4 Ω i = 2 plateaus of QHR device ac1 for thethree single-series-connected quantum Hall voltageprobe sets VH(1,2), VH(3,4), and VH(5,6) at 1.59 K and20.0 µA dc using digital multimeters to measure theHall voltages and magnetic flux density B. Thosesweeps are magnified in Fig. 4 to 4 parts in 106 resolu-tion. Measurements involving the 1417 Ω (probe 3) and7644 Ω (probe 6) contacts are much noisier (with pos-sible discrete values within the noise). Different offset
Volume 109, Number 4, July-August 2004Journal of Research of the National Institute of Standards and Technology
Fig. 2. Typical cooling curves from 4.2 K each measurement day.XM and YM are the in-phase and 90° out-of-phase ac QHR bridgemain signal components (defined in Sec. 6). T is the temperature ofa Cernox thermometer located just below QHR device ac1. A 6.5 Vchange in XM corresponds to a 1 part in 106 change in the QHR valueat 1592 Hz.
394
Volume 109, Number 4, July-August 2004Journal of Research of the National Institute of Standards and Technology
Fig. 3. Magnetic field sweeps of the 12 906.4 Ω i = 2 plateaus of QHR device ac1 for the three single-series-connected quantum Hall voltage probe sets VH(1,2), VH(3,4), and VH(5,6) at 1.59 K and 20.0 µA dc.
Fig. 4. The magnetic field sweeps of Fig. 3 magnified to 4 parts in 106 resolution.
395
voltages of the three Hall probe sets probably arisefrom thermoelectric effects and are of no consequencesince we find later in this section that the three VH
values are comparable when including reverse-currentmeasurements.
Large voltage shifts (about 1 part in 105 of VH)appeared in all three Hall probe sets around 9.15 T inFig. 4. They probably resulted from an hourly readingof the liquid helium level of the variable temperatureinsert into which the sample probe is placed since areading occurred at that time. Liquid helium level read-ings were never made during subsequent measurementsafter daily cooldown from 4.2 K.
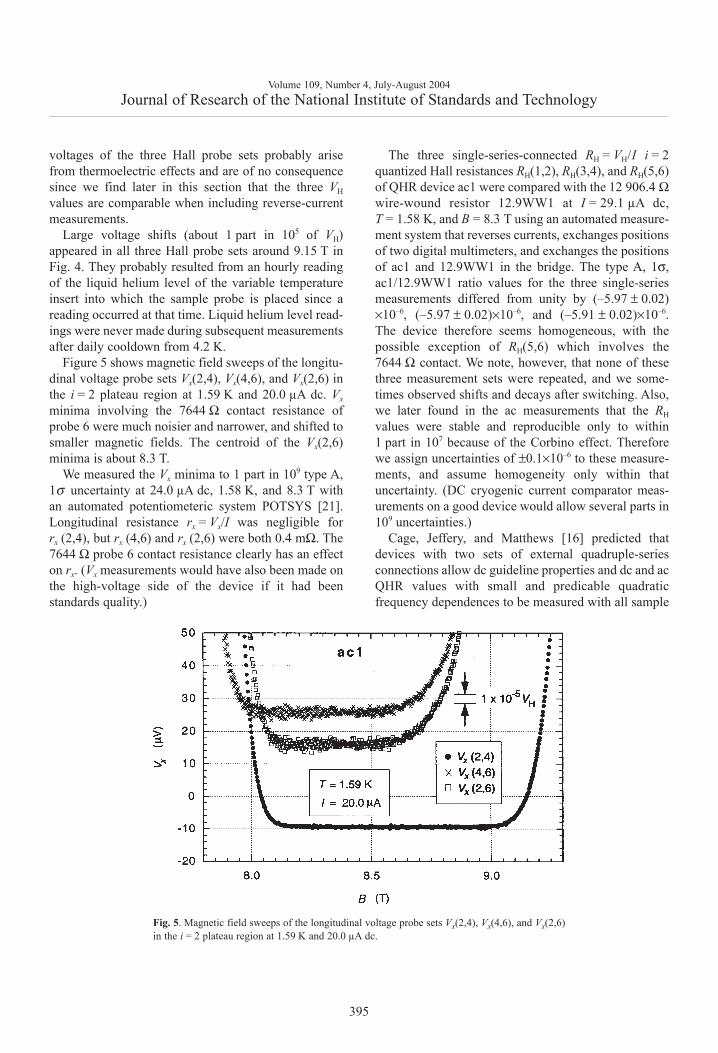
Figure 5 shows magnetic field sweeps of the longitu-dinal voltage probe sets Vx(2,4), Vx(4,6), and Vx(2,6) inthe i = 2 plateau region at 1.59 K and 20.0 µA dc. Vx
minima involving the 7644 Ω contact resistance ofprobe 6 were much noisier and narrower, and shifted tosmaller magnetic fields. The centroid of the Vx(2,6)minima is about 8.3 T.
We measured the Vx minima to 1 part in 109 type A,1σ uncertainty at 24.0 µA dc, 1.58 K, and 8.3 T withan automated potentiometeric system POTSYS [21].Longitudinal resistance rx = Vx/I was negligible forrx (2,4), but rx (4,6) and rx (2,6) were both 0.4 mΩ. The7644 Ω probe 6 contact resistance clearly has an effecton rx. (Vx measurements would have also been made onthe high-voltage side of the device if it had beenstandards quality.)
The three single-series-connected RH = VH/I i = 2quantized Hall resistances RH(1,2), RH(3,4), and RH(5,6)of QHR device ac1 were compared with the 12 906.4 Ωwire-wound resistor 12.9WW1 at I = 29.1 µA dc,T = 1.58 K, and B = 8.3 T using an automated measure-ment system that reverses currents, exchanges positionsof two digital multimeters, and exchanges the positionsof ac1 and 12.9WW1 in the bridge. The type A, 1σ,ac1/12.9WW1 ratio values for the three single-seriesmeasurements differed from unity by (–5.97 ± 0.02)×10–6, (–5.97 ± 0.02)×10–6, and (–5.91 ± 0.02)×10–6.The device therefore seems homogeneous, with thepossible exception of RH(5,6) which involves the7644 Ω contact. We note, however, that none of thesethree measurement sets were repeated, and we some-times observed shifts and decays after switching. Also,we later found in the ac measurements that the RH
values were stable and reproducible only to within1 part in 107 because of the Corbino effect. Thereforewe assign uncertainties of ±0.1×10⁻⁶ to these measure-ments, and assume homogeneity only within thatuncertainty. (DC cryogenic current comparator meas-urements on a good device would allow several parts in109 uncertainties.)
Cage, Jeffery, and Matthews [16] predicted thatdevices with two sets of external quadruple-seriesconnections allow dc guideline properties and dc and acQHR values with small and predicable quadraticfrequency dependences to be measured with all sample
Volume 109, Number 4, July-August 2004Journal of Research of the National Institute of Standards and Technology
Fig. 5. Magnetic field sweeps of the longitudinal voltage probe sets Vx(2,4), Vx(4,6), and Vx(2,6)in the i = 2 plateau region at 1.59 K and 20.0 µA dc.
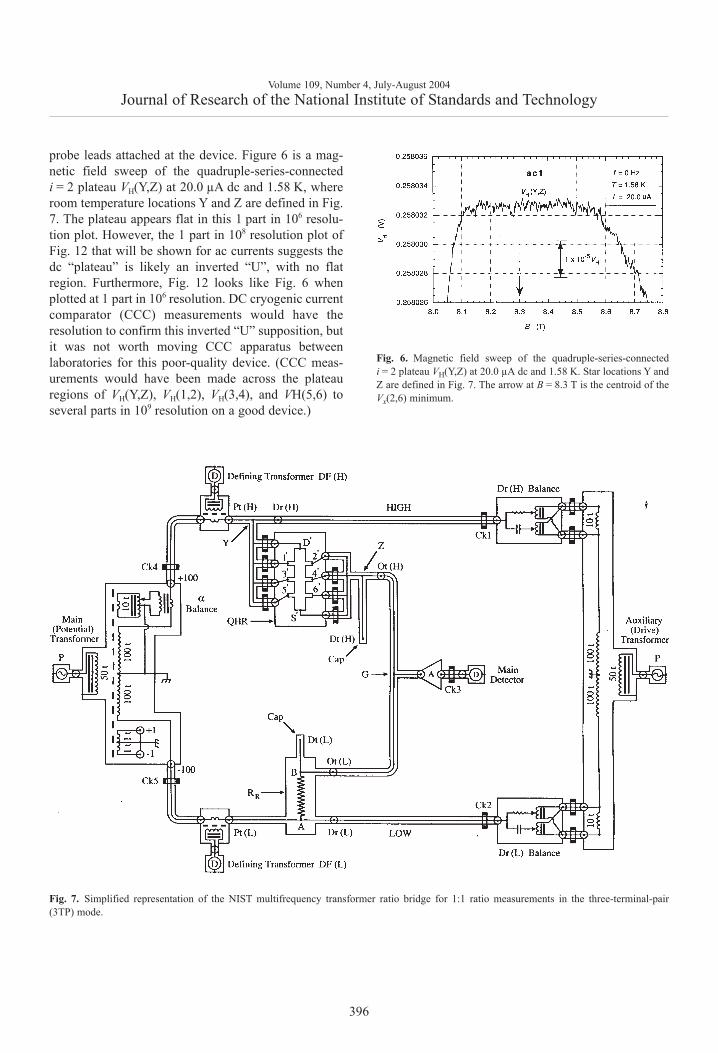
probe leads attached at the device. Figure 6 is a mag-netic field sweep of the quadruple-series-connectedi = 2 plateau VH(Y,Z) at 20.0 µA dc and 1.58 K, whereroom temperature locations Y and Z are defined in Fig.7. The plateau appears flat in this 1 part in 106 resolu-tion plot. However, the 1 part in 108 resolution plot ofFig. 12 that will be shown for ac currents suggests thedc “plateau” is likely an inverted “U”, with no flatregion. Furthermore, Fig. 12 looks like Fig. 6 whenplotted at 1 part in 106 resolution. DC cryogenic currentcomparator (CCC) measurements would have theresolution to confirm this inverted “U” supposition, butit was not worth moving CCC apparatus betweenlaboratories for this poor-quality device. (CCC meas-urements would have been made across the plateauregions of VH(Y,Z), VH(1,2), VH(3,4), and VH(5,6) toseveral parts in 109 resolution on a good device.)
396
Volume 109, Number 4, July-August 2004Journal of Research of the National Institute of Standards and Technology
Fig. 6. Magnetic field sweep of the quadruple-series-connectedi = 2 plateau VH(Y,Z) at 20.0 µA dc and 1.58 K. Star locations Y andZ are defined in Fig. 7. The arrow at B = 8.3 T is the centroid of theVx(2,6) minimum.
Fig. 7. Simplified representation of the NIST multifrequency transformer ratio bridge for 1:1 ratio measurements in the three-terminal-pair(3TP) mode.
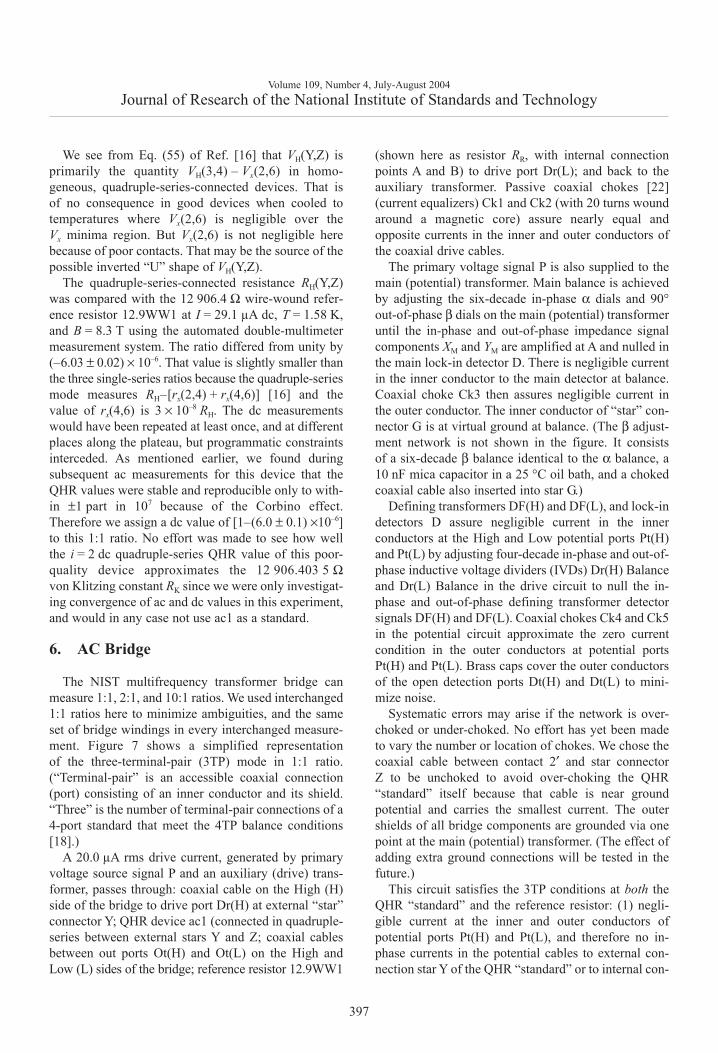
We see from Eq. (55) of Ref. [16] that VH(Y,Z) isprimarily the quantity VH(3,4) – Vx(2,6) in homo-geneous, quadruple-series-connected devices. That isof no consequence in good devices when cooled totemperatures where Vx(2,6) is negligible over theVx minima region. But Vx(2,6) is not negligible herebecause of poor contacts. That may be the source of thepossible inverted “U” shape of VH(Y,Z).
The quadruple-series-connected resistance RH(Y,Z)was compared with the 12 906.4 Ω wire-wound refer-ence resistor 12.9WW1 at I = 29.1 µA dc, T = 1.58 K,and B = 8.3 T using the automated double-multimetermeasurement system. The ratio differed from unity by(–6.03 ± 0.02) × 10–6. That value is slightly smaller thanthe three single-series ratios because the quadruple-seriesmode measures RH–[rx(2,4) + rx(4,6)] [16] and thevalue of rx(4,6) is 3 × 10⁻⁸ RH. The dc measurementswould have been repeated at least once, and at differentplaces along the plateau, but programmatic constraintsinterceded. As mentioned earlier, we found duringsubsequent ac measurements for this device that theQHR values were stable and reproducible only to with-in ±1 part in 107 because of the Corbino effect.Therefore we assign a dc value of [1–(6.0 ± 0.1) ×10–6]to this 1:1 ratio. No effort was made to see how wellthe i = 2 dc quadruple-series QHR value of this poor-quality device approximates the 12 906.403 5 Ωvon Klitzing constant RK since we were only investigat-ing convergence of ac and dc values in this experiment,and would in any case not use ac1 as a standard.
6. AC Bridge
The NIST multifrequency transformer bridge canmeasure 1:1, 2:1, and 10:1 ratios. We used interchanged1:1 ratios here to minimize ambiguities, and the sameset of bridge windings in every interchanged measure-ment. Figure 7 shows a simplified representationof the three-terminal-pair (3TP) mode in 1:1 ratio.(“Terminal-pair” is an accessible coaxial connection(port) consisting of an inner conductor and its shield.“Three” is the number of terminal-pair connections of a4-port standard that meet the 4TP balance conditions[18].)
A 20.0 µA rms drive current, generated by primaryvoltage source signal P and an auxiliary (drive) trans-former, passes through: coaxial cable on the High (H)side of the bridge to drive port Dr(H) at external “star”connector Y; QHR device ac1 (connected in quadruple-series between external stars Y and Z; coaxial cablesbetween out ports Ot(H) and Ot(L) on the High andLow (L) sides of the bridge; reference resistor 12.9WW1
(shown here as resistor RR, with internal connectionpoints A and B) to drive port Dr(L); and back to theauxiliary transformer. Passive coaxial chokes [22](current equalizers) Ck1 and Ck2 (with 20 turns woundaround a magnetic core) assure nearly equal andopposite currents in the inner and outer conductors ofthe coaxial drive cables.
The primary voltage signal P is also supplied to themain (potential) transformer. Main balance is achievedby adjusting the six-decade in-phase α dials and 90°out-of-phase β dials on the main (potential) transformeruntil the in-phase and out-of-phase impedance signalcomponents XM and YM are amplified at A and nulled inthe main lock-in detector D. There is negligible currentin the inner conductor to the main detector at balance.Coaxial choke Ck3 then assures negligible current inthe outer conductor. The inner conductor of “star” con-nector G is at virtual ground at balance. (The β adjust-ment network is not shown in the figure. It consistsof a six-decade β balance identical to the α balance, a10 nF mica capacitor in a 25 °C oil bath, and a chokedcoaxial cable also inserted into star G.)
Defining transformers DF(H) and DF(L), and lock-indetectors D assure negligible current in the innerconductors at the High and Low potential ports Pt(H)and Pt(L) by adjusting four-decade in-phase and out-of-phase inductive voltage dividers (IVDs) Dr(H) Balanceand Dr(L) Balance in the drive circuit to null the in-phase and out-of-phase defining transformer detectorsignals DF(H) and DF(L). Coaxial chokes Ck4 and Ck5in the potential circuit approximate the zero currentcondition in the outer conductors at potential portsPt(H) and Pt(L). Brass caps cover the outer conductorsof the open detection ports Dt(H) and Dt(L) to mini-mize noise.
Systematic errors may arise if the network is over-choked or under-choked. No effort has yet been madeto vary the number or location of chokes. We chose thecoaxial cable between contact 2′ and star connectorZ to be unchoked to avoid over-choking the QHR“standard” itself because that cable is near groundpotential and carries the smallest current. The outershields of all bridge components are grounded via onepoint at the main (potential) transformer. (The effect ofadding extra ground connections will be tested in thefuture.)
This circuit satisfies the 3TP conditions at both theQHR “standard” and the reference resistor: (1) negli-gible current at the inner and outer conductors ofpotential ports Pt(H) and Pt(L), and therefore no in-phase currents in the potential cables to external con-nection star Y of the QHR “standard” or to internal con-
397
Volume 109, Number 4, July-August 2004Journal of Research of the National Institute of Standards and Technology
nection point A of the reference resistor; (2) negligiblecurrent and voltage in the inner and outer conductors tothe main detector D; (3) the same current to/from theQHR “standard” and the reference resistor at connec-tion star G (where the inner conductor is at virtualground at balance); and (4) equal and opposite currentsin the inner and outer conductors of cables betweenexternal connection star Z of the QHR “standard” andinternal connection point B of the resistor. (In addition,detection ports Dt(H) and Dt(L) have no current sincethey are open-circuited. That meets part of the 4TPdefinition. However, ports Dt(H) and Dt(L) are not atground potential because of cable loses to star G.)
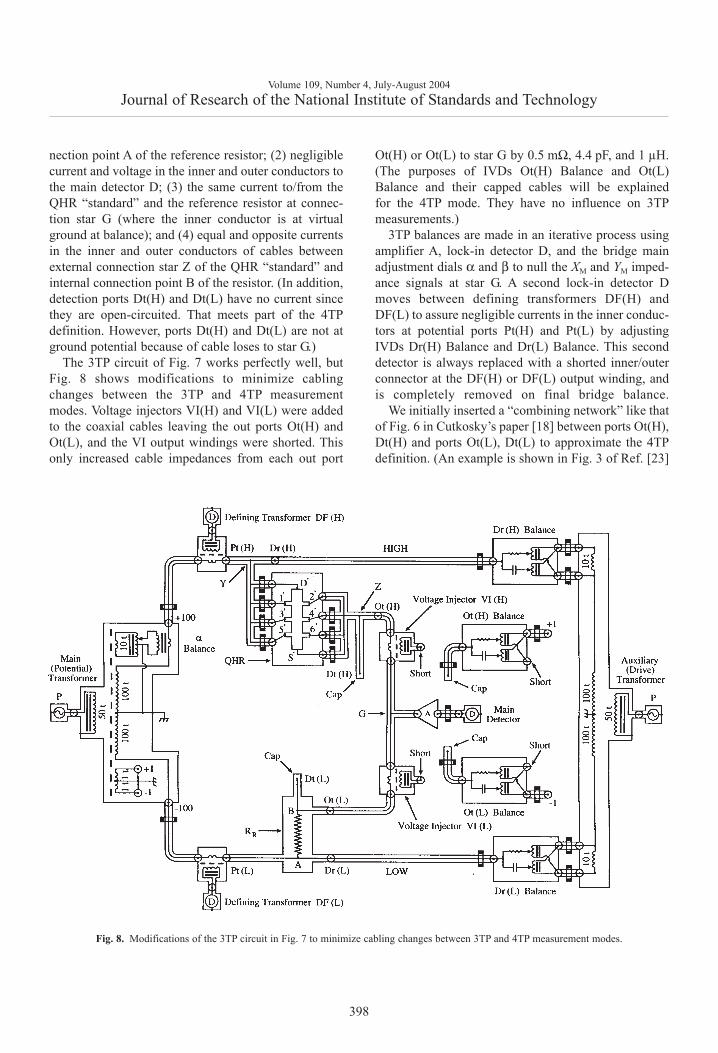
The 3TP circuit of Fig. 7 works perfectly well, butFig. 8 shows modifications to minimize cablingchanges between the 3TP and 4TP measurementmodes. Voltage injectors VI(H) and VI(L) were addedto the coaxial cables leaving the out ports Ot(H) andOt(L), and the VI output windings were shorted. Thisonly increased cable impedances from each out port
Ot(H) or Ot(L) to star G by 0.5 mΩ, 4.4 pF, and 1 µH. (The purposes of IVDs Ot(H) Balance and Ot(L)Balance and their capped cables will be explainedfor the 4TP mode. They have no influence on 3TPmeasurements.)
3TP balances are made in an iterative process usingamplifier A, lock-in detector D, and the bridge mainadjustment dials α and β to null the XM and YM imped-ance signals at star G. A second lock-in detector Dmoves between defining transformers DF(H) andDF(L) to assure negligible currents in the inner conduc-tors at potential ports Pt(H) and Pt(L) by adjustingIVDs Dr(H) Balance and Dr(L) Balance. This seconddetector is always replaced with a shorted inner/outerconnector at the DF(H) or DF(L) output winding, andis completely removed on final bridge balance.
We initially inserted a “combining network” like thatof Fig. 6 in Cutkosky’s paper [18] between ports Ot(H),Dt(H) and ports Ot(L), Dt(L) to approximate the 4TPdefinition. (An example is shown in Fig. 3 of Ref. [23]
398
Volume 109, Number 4, July-August 2004Journal of Research of the National Institute of Standards and Technology
Fig. 8. Modifications of the 3TP circuit in Fig. 7 to minimize cabling changes between 3TP and 4TP measurement modes.
for an earlier NIST bridge.) However, measurementerrors arose that were sometimes as large as 18 parts in106 under “proper” 4TP balance conditions usingdifferent internal resistance values of the combiningnetwork when measuring 10:1 resistance ratios.(Perhaps this resulted from using out-of-phase β signalinjection into a ground potential location of thecombining network, rather than into a location on thehigher potential side. This will be checked in future.)
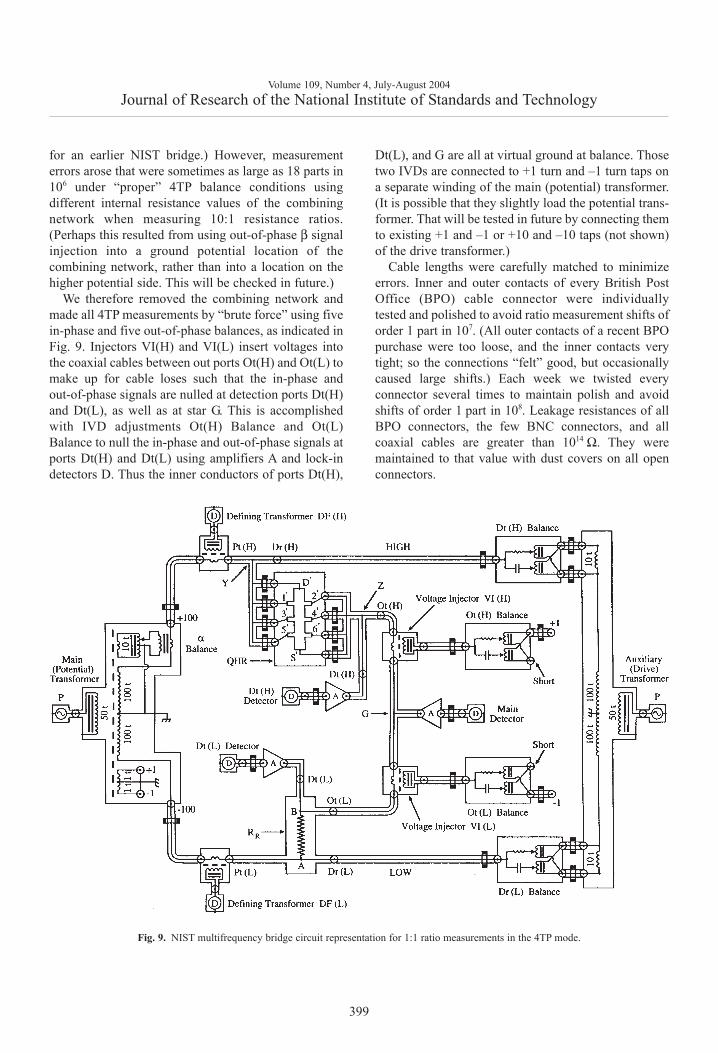
We therefore removed the combining network andmade all 4TP measurements by “brute force” using fivein-phase and five out-of-phase balances, as indicated inFig. 9. Injectors VI(H) and VI(L) insert voltages intothe coaxial cables between out ports Ot(H) and Ot(L) tomake up for cable loses such that the in-phase andout-of-phase signals are nulled at detection ports Dt(H)and Dt(L), as well as at star G. This is accomplishedwith IVD adjustments Ot(H) Balance and Ot(L)Balance to null the in-phase and out-of-phase signals atports Dt(H) and Dt(L) using amplifiers A and lock-indetectors D. Thus the inner conductors of ports Dt(H),
Dt(L), and G are all at virtual ground at balance. Thosetwo IVDs are connected to +1 turn and –1 turn taps on a separate winding of the main (potential) transformer.(It is possible that they slightly load the potential trans-former. That will be tested in future by connecting themto existing +1 and –1 or +10 and –10 taps (not shown)of the drive transformer.)
Cable lengths were carefully matched to minimizeerrors. Inner and outer contacts of every British PostOffice (BPO) cable connector were individuallytested and polished to avoid ratio measurement shifts oforder 1 part in 107. (All outer contacts of a recent BPOpurchase were too loose, and the inner contacts verytight; so the connections “felt” good, but occasionallycaused large shifts.) Each week we twisted everyconnector several times to maintain polish and avoidshifts of order 1 part in 108. Leakage resistances of allBPO connectors, the few BNC connectors, and allcoaxial cables are greater than 1014 Ω. They weremaintained to that value with dust covers on all openconnectors.
Volume 109, Number 4, July-August 2004Journal of Research of the National Institute of Standards and Technology
399
Fig. 9. NIST multifrequency bridge circuit representation for 1:1 ratio measurements in the 4TP mode.
4TP balances use the 3TP procedures listed above toobtain a preliminary main balance and null currentsat potential ports Pt(H) and Pt(L). Amplifier A andlock-in detector D, used for nulling the XM and YM
signals at main balance star G, is then sequentiallymoved to detector ports Dt(H) and Dt(L), and their in-phase and out-of-phase signals nulled by adjustingIVDs Ot(H) Balance and Ot(L) Balance. (Brass capscover any open outer conductors at ports Dt(H), Dt(L),and star G to minimize noise.)
It requires several iterations and some experience tosimultaneously null all three sets of low voltage in-phase and out-of-phase signals because the main,Ot(H), and Ot(L) balance adjustments interact.Although tedious to initially determine at eachfrequency, the bridge adjustment parameters arereproducible, and should provide a close approximationto ideal 4TP measurements.
The 4TP bridge, at balance, measures the ratio ofthe QHR “standard” (with its in-phase impedancecomponent defined between external connection starsY and Z) and the wire-wound resistor (defined between internal connection points A and B). (Figure 4 of theCage, Jeffery, and Matthews equivalent circuit model[16] defines the QHR “standard” at access ports Dr(H),Pt(H), Dt(H), and Ot(H). Dr(H), Dt(H), and Ot(H) arelocated on stars Y and Z. Pt(H) is separated from star Yby a small length of coaxial cable. The additionalimpedances from stars Y and Z to those four accessports have negligible effect on the in-phase componentof the ac QHR value in our bridge at 4TP balance.)
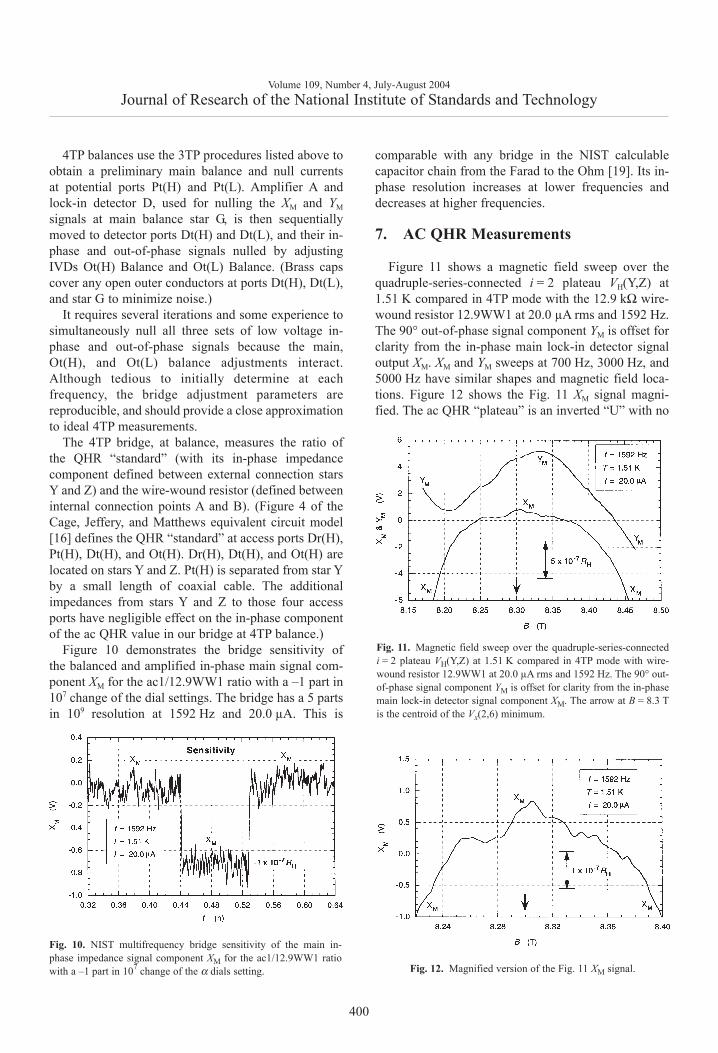
Figure 10 demonstrates the bridge sensitivity ofthe balanced and amplified in-phase main signal com-ponent XM for the ac1/12.9WW1 ratio with a –1 part in107 change of the dial settings. The bridge has a 5 partsin 109 resolution at 1592 Hz and 20.0 µA. This is
comparable with any bridge in the NIST calculablecapacitor chain from the Farad to the Ohm [19]. Its in-phase resolution increases at lower frequencies anddecreases at higher frequencies.
7. AC QHR Measurements
Figure 11 shows a magnetic field sweep over thequadruple-series-connected i = 2 plateau VH(Y,Z) at1.51 K compared in 4TP mode with the 12.9 kΩ wire-wound resistor 12.9WW1 at 20.0 µA rms and 1592 Hz.The 90° out-of-phase signal component YM is offset forclarity from the in-phase main lock-in detector signaloutput XM. XM and YM sweeps at 700 Hz, 3000 Hz, and5000 Hz have similar shapes and magnetic field loca-tions. Figure 12 shows the Fig. 11 XM signal magni-fied. The ac QHR “plateau” is an inverted “U” with no
400
Volume 109, Number 4, July-August 2004Journal of Research of the National Institute of Standards and Technology
Fig. 10. NIST multifrequency bridge sensitivity of the main in-phase impedance signal component XM for the ac1/12.9WW1 ratiowith a –1 part in 107 change of the α dials setting.
Fig. 11. Magnetic field sweep over the quadruple-series-connectedi = 2 plateau VH(Y,Z) at 1.51 K compared in 4TP mode with wire-wound resistor 12.9WW1 at 20.0 µA rms and 1592 Hz. The 90° out-of-phase signal component YM is offset for clarity from the in-phasemain lock-in detector signal component XM. The arrow at B = 8.3 Tis the centroid of the Vx(2,6) minimum.
Fig. 12. Magnified version of the Fig. 11 XM signal.
flat region. (As mentioned before in Sec. 5, it appearsjust as flat as the dc quadruple-series plateau of Fig. 6when plotted to that resolution.) The “peak” featurenear 8.3 T was reproducible, and occurs at the samemagnetic flux density as the Vx(2,6) minimum. We sus-pect it is due to the [VH – Vx(2,6)] aspect of quadruple-series measurements, and would not appear on plateausof good devices when cooled enough that Vx(2,6) wasnegligible. This feature may contribute to the ±1 part in107 fluctuations in the resistance ratio. AC bridge meas-urements were always made at the B = 8.3 T value usedfor dc measurements.
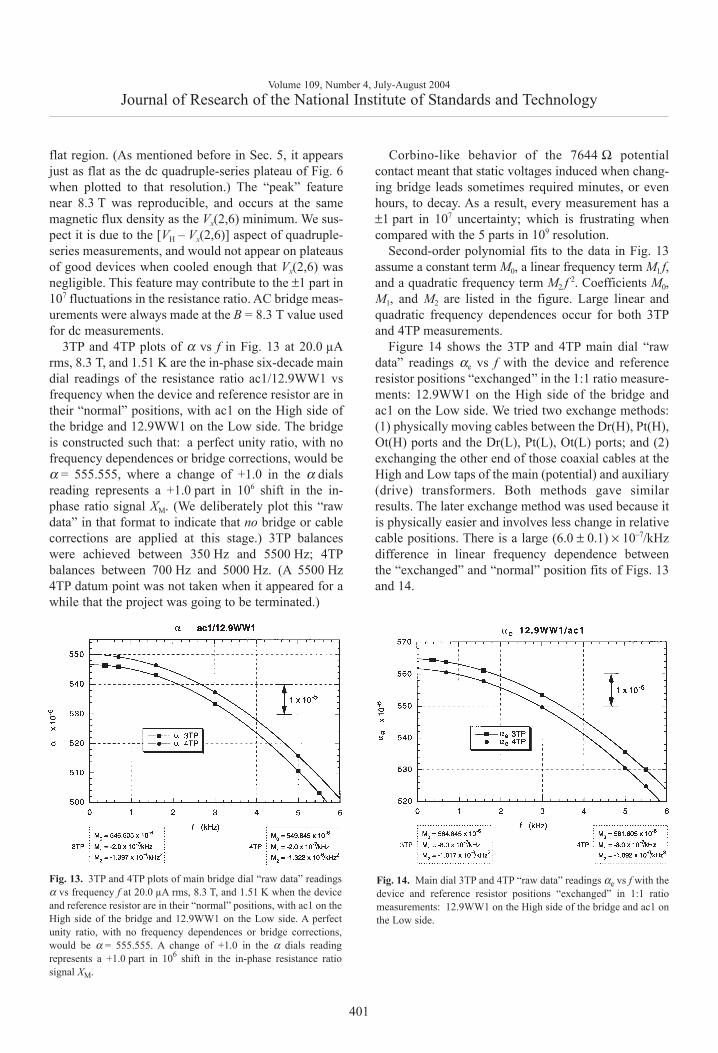
3TP and 4TP plots of α vs f in Fig. 13 at 20.0 µArms, 8.3 T, and 1.51 K are the in-phase six-decade maindial readings of the resistance ratio ac1/12.9WW1 vsfrequency when the device and reference resistor are intheir “normal” positions, with ac1 on the High side ofthe bridge and 12.9WW1 on the Low side. The bridgeis constructed such that: a perfect unity ratio, with nofrequency dependences or bridge corrections, would beα = 555.555, where a change of +1.0 in the α dialsreading represents a +1.0 part in 106 shift in the in-phase ratio signal XM. (We deliberately plot this “rawdata” in that format to indicate that no bridge or cablecorrections are applied at this stage.) 3TP balanceswere achieved between 350 Hz and 5500 Hz; 4TPbalances between 700 Hz and 5000 Hz. (A 5500 Hz4TP datum point was not taken when it appeared for awhile that the project was going to be terminated.)
Corbino-like behavior of the 7644 Ω potentialcontact meant that static voltages induced when chang-ing bridge leads sometimes required minutes, or even hours, to decay. As a result, every measurement has a±1 part in 107 uncertainty; which is frustrating whencompared with the 5 parts in 109 resolution.
Second-order polynomial fits to the data in Fig. 13assume a constant term M0, a linear frequency term M1 f,and a quadratic frequency term M2 f 2. Coefficients M0,M1, and M2 are listed in the figure. Large linear andquadratic frequency dependences occur for both 3TPand 4TP measurements.
Figure 14 shows the 3TP and 4TP main dial “rawdata” readings αe vs f with the device and referenceresistor positions “exchanged” in the 1:1 ratio measure-ments: 12.9WW1 on the High side of the bridge andac1 on the Low side. We tried two exchange methods:(1) physically moving cables between the Dr(H), Pt(H),Ot(H) ports and the Dr(L), Pt(L), Ot(L) ports; and (2)exchanging the other end of those coaxial cables at theHigh and Low taps of the main (potential) and auxiliary(drive) transformers. Both methods gave similarresults. The later exchange method was used because itis physically easier and involves less change in relativecable positions. There is a large (6.0 ± 0.1) × 10–7/kHzdifference in linear frequency dependence betweenthe “exchanged” and “normal” position fits of Figs. 13and 14.
Volume 109, Number 4, July-August 2004Journal of Research of the National Institute of Standards and Technology
401
Fig. 13. 3TP and 4TP plots of main bridge dial “raw data” readingsα vs frequency f at 20.0 µA rms, 8.3 T, and 1.51 K when the deviceand reference resistor are in their “normal” positions, with ac1 on theHigh side of the bridge and 12.9WW1 on the Low side. A perfectunity ratio, with no frequency dependences or bridge corrections,would be α = 555.555. A change of +1.0 in the α dials readingrepresents a +1.0 part in 106 shift in the in-phase resistance ratiosignal XM.
Fig. 14. Main dial 3TP and 4TP “raw data” readings αe vs f with thedevice and reference resistor positions “exchanged” in 1:1 ratiomeasurements: 12.9WW1 on the High side of the bridge and ac1 onthe Low side.
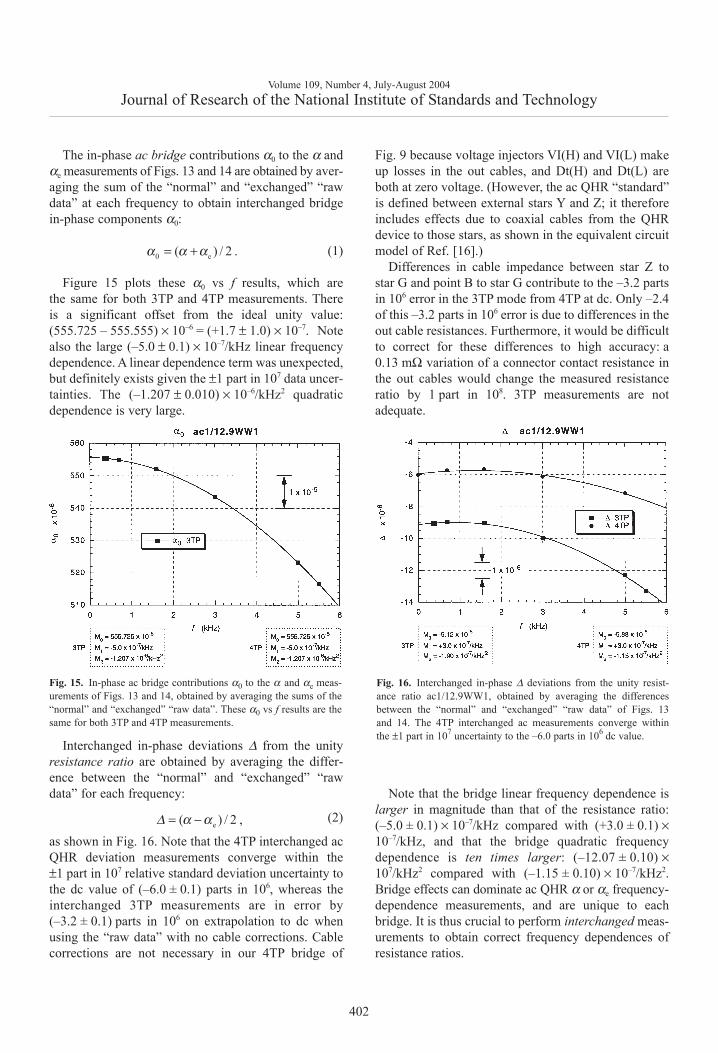
The in-phase ac bridge contributions α0 to the α andαe measurements of Figs. 13 and 14 are obtained by aver-aging the sum of the “normal” and “exchanged” “rawdata” at each frequency to obtain interchanged bridgein-phase components α0:
(1)
Figure 15 plots these α0 vs f results, which arethe same for both 3TP and 4TP measurements. Thereis a significant offset from the ideal unity value:(555.725 – 555.555) × 10–6 = (+1.7 ± 1.0) × 10–7. Notealso the large (–5.0 ± 0.1) × 10–7/kHz linear frequencydependence. A linear dependence term was unexpected,but definitely exists given the ±1 part in 107 data uncer-tainties. The (–1.207 ± 0.010) × 10–6/kHz2 quadraticdependence is very large.
Interchanged in-phase deviations ∆ from the unityresistance ratio are obtained by averaging the differ-ence between the “normal” and “exchanged” “rawdata” for each frequency:
(2)
as shown in Fig. 16. Note that the 4TP interchanged acQHR deviation measurements converge within the±1 part in 107 relative standard deviation uncertainty tothe dc value of (–6.0 ± 0.1) parts in 106, whereas theinterchanged 3TP measurements are in error by(–3.2 ± 0.1) parts in 106 on extrapolation to dc whenusing the “raw data” with no cable corrections. Cable corrections are not necessary in our 4TP bridge of
Fig. 9 because voltage injectors VI(H) and VI(L) makeup losses in the out cables, and Dt(H) and Dt(L) areboth at zero voltage. (However, the ac QHR “standard”is defined between external stars Y and Z; it thereforeincludes effects due to coaxial cables from the QHRdevice to those stars, as shown in the equivalent circuitmodel of Ref. [16].)
Differences in cable impedance between star Z tostar G and point B to star G contribute to the –3.2 partsin 106 error in the 3TP mode from 4TP at dc. Only –2.4of this –3.2 parts in 106 error is due to differences in theout cable resistances. Furthermore, it would be difficultto correct for these differences to high accuracy: a0.13 mΩ variation of a connector contact resistance inthe out cables would change the measured resistanceratio by 1 part in 108. 3TP measurements are notadequate.
Note that the bridge linear frequency dependence islarger in magnitude than that of the resistance ratio:(–5.0 ± 0.1) × 10–7/kHz compared with (+3.0 ± 0.1) ×10–7/kHz, and that the bridge quadratic frequencydependence is ten times larger: (–12.07 ± 0.10) ×107/kHz2 compared with (–1.15 ± 0.10) × 10–7/kHz2.Bridge effects can dominate ac QHR α or αe frequency-dependence measurements, and are unique to eachbridge. It is thus crucial to perform interchanged meas-urements to obtain correct frequency dependences ofresistance ratios.
Volume 109, Number 4, July-August 2004Journal of Research of the National Institute of Standards and Technology
402
0 e ( ) / 2 .= +α α α
Fig. 15. In-phase ac bridge contributions α0 to the α and αe meas-urements of Figs. 13 and 14, obtained by averaging the sums of the“normal” and “exchanged” “raw data”. These α0 vs f results are thesame for both 3TP and 4TP measurements.
e ( ) / 2 ,=∆ α − α
Fig. 16. Interchanged in-phase ∆ deviations from the unity resist-ance ratio ac1/12.9WW1, obtained by averaging the differencesbetween the “normal” and “exchanged” “raw data” of Figs. 13and 14. The 4TP interchanged ac measurements converge withinthe ±1 part in 107 uncertainty to the –6.0 parts in 106 dc value.
Fits to the data in Figs. 13 – 16 are excellent, and areself-consistent for all three terms of every polynomial:
2(M0)α0= (M0)α+(M0)αe
and 2(M0)∆ = (M0)α–(M0)αe
(3a)
2(M1)α0= (M1)α+(M1)αe
and 2(M1)∆ = (M1)α–(M1)αe
(3b)
2(M2)α0= (M2)α+(M2)αe
and 2(M2)∆ = (M2)α–(M2)αe.
(3c)
The measurement uncertainties are ±1 part in 107.Unfortunately the device characteristics preventedmeasurements to parts in 108. That would have rigor-ously tested the quality of fits and convergence to thedc value.
8. AC Quadrifilar Resistor Measurements
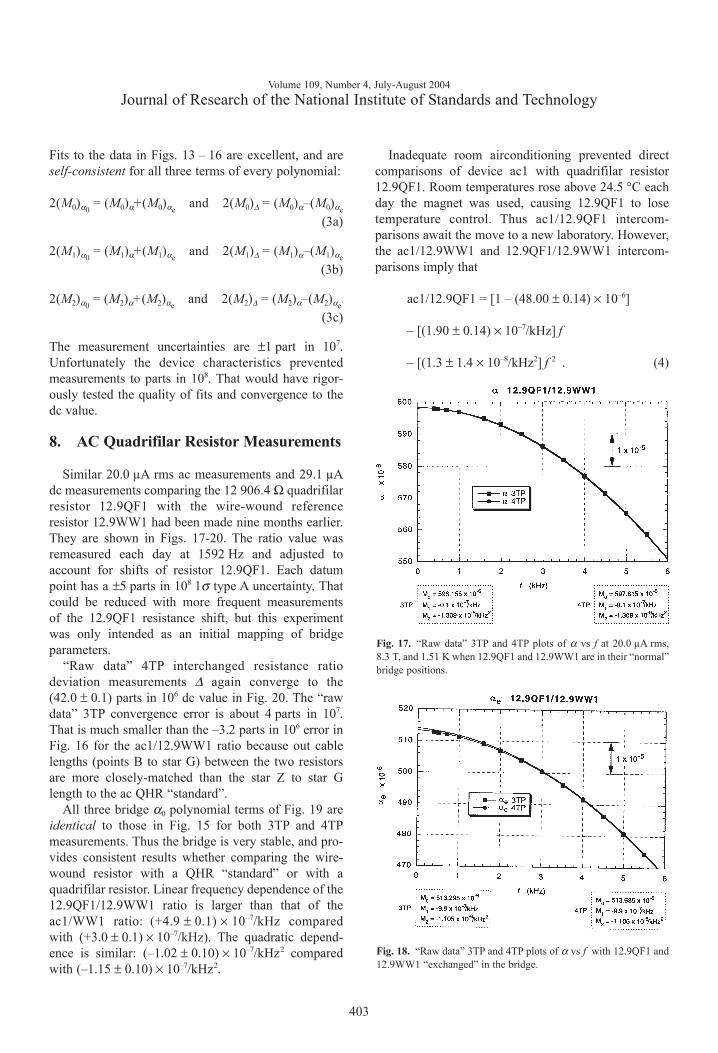
Similar 20.0 µA rms ac measurements and 29.1 µAdc measurements comparing the 12 906.4 Ω quadrifilarresistor 12.9QF1 with the wire-wound referenceresistor 12.9WW1 had been made nine months earlier.They are shown in Figs. 17-20. The ratio value wasremeasured each day at 1592 Hz and adjusted toaccount for shifts of resistor 12.9QF1. Each datumpoint has a ±5 parts in 108 1σ type A uncertainty. Thatcould be reduced with more frequent measurementsof the 12.9QF1 resistance shift, but this experimentwas only intended as an initial mapping of bridgeparameters.
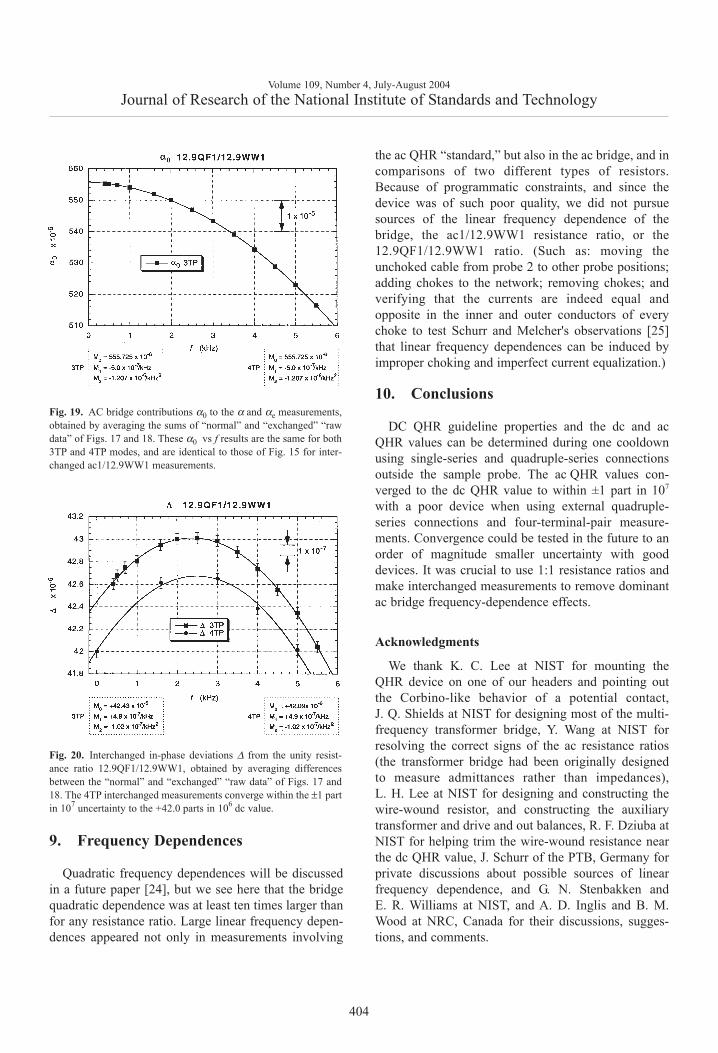
“Raw data” 4TP interchanged resistance ratiodeviation measurements ∆ again converge to the(42.0 ± 0.1) parts in 106 dc value in Fig. 20. The “rawdata” 3TP convergence error is about 4 parts in 107.That is much smaller than the –3.2 parts in 106 error inFig. 16 for the ac1/12.9WW1 ratio because out cablelengths (points B to star G) between the two resistorsare more closely-matched than the star Z to star Glength to the ac QHR “standard”.
All three bridge α0 polynomial terms of Fig. 19 areidentical to those in Fig. 15 for both 3TP and 4TPmeasurements. Thus the bridge is very stable, and pro-vides consistent results whether comparing the wire-wound resistor with a QHR “standard” or with aquadrifilar resistor. Linear frequency dependence of the12.9QF1/12.9WW1 ratio is larger than that of theac1/WW1 ratio: (+4.9 ± 0.1) × 10–7/kHz comparedwith (+3.0 ± 0.1) × 10–7/kHz). The quadratic depend-ence is similar: (–1.02 ± 0.10) × 10–7/kHz2 comparedwith (–1.15 ± 0.10) × 10–7/kHz2.
Inadequate room airconditioning prevented directcomparisons of device ac1 with quadrifilar resistor12.9QF1. Room temperatures rose above 24.5 °C eachday the magnet was used, causing 12.9QF1 to losetemperature control. Thus ac1/12.9QF1 intercom-parisons await the move to a new laboratory. However,the ac1/12.9WW1 and 12.9QF1/12.9WW1 intercom-parisons imply that
ac1/12.9QF1 = [1 – (48.00 ± 0.14) × 10–6]
– [(1.90 ± 0.14) × 10–7/kHz] f
– [(1.3 ± 1.4 × 10⁻⁸/kHz2] f 2 . (4)
Volume 109, Number 4, July-August 2004Journal of Research of the National Institute of Standards and Technology
403
Fig. 17. “Raw data” 3TP and 4TP plots of α vs f at 20.0 µA rms,8.3 T, and 1.51 K when 12.9QF1 and 12.9WW1 are in their “normal”bridge positions.
Fig. 18. “Raw data” 3TP and 4TP plots of α vs f with 12.9QF1 and12.9WW1 “exchanged” in the bridge.
9. Frequency Dependences
Quadratic frequency dependences will be discussedin a future paper [24], but we see here that the bridgequadratic dependence was at least ten times larger thanfor any resistance ratio. Large linear frequency depen-dences appeared not only in measurements involving
the ac QHR “standard,” but also in the ac bridge, and incomparisons of two different types of resistors.Because of programmatic constraints, and since thedevice was of such poor quality, we did not pursuesources of the linear frequency dependence of thebridge, the ac1/12.9WW1 resistance ratio, or the12.9QF1/12.9WW1 ratio. (Such as: moving theunchoked cable from probe 2 to other probe positions;adding chokes to the network; removing chokes; andverifying that the currents are indeed equal andopposite in the inner and outer conductors of everychoke to test Schurr and Melcher's observations [25]that linear frequency dependences can be induced byimproper choking and imperfect current equalization.)
10. Conclusions
DC QHR guideline properties and the dc and acQHR values can be determined during one cooldownusing single-series and quadruple-series connectionsoutside the sample probe. The ac QHR values con-verged to the dc QHR value to within ±1 part in 107
with a poor device when using external quadruple-series connections and four-terminal-pair measure-ments. Convergence could be tested in the future to anorder of magnitude smaller uncertainty with gooddevices. It was crucial to use 1:1 resistance ratios andmake interchanged measurements to remove dominantac bridge frequency-dependence effects.
Acknowledgments
We thank K. C. Lee at NIST for mounting theQHR device on one of our headers and pointing outthe Corbino-like behavior of a potential contact,J. Q. Shields at NIST for designing most of the multi-frequency transformer bridge, Y. Wang at NIST forresolving the correct signs of the ac resistance ratios(the transformer bridge had been originally designedto measure admittances rather than impedances),L. H. Lee at NIST for designing and constructing thewire-wound resistor, and constructing the auxiliarytransformer and drive and out balances, R. F. Dziuba atNIST for helping trim the wire-wound resistance nearthe dc QHR value, J. Schurr of the PTB, Germany forprivate discussions about possible sources of linearfrequency dependence, and G. N. Stenbakken andE. R. Williams at NIST, and A. D. Inglis and B. M.Wood at NRC, Canada for their discussions, sugges-tions, and comments.
Volume 109, Number 4, July-August 2004Journal of Research of the National Institute of Standards and Technology
404
Fig. 19. AC bridge contributions α0 to the α and αe measurements,obtained by averaging the sums of “normal” and “exchanged” “rawdata” of Figs. 17 and 18. These α0 vs f results are the same for both3TP and 4TP modes, and are identical to those of Fig. 15 for inter-changed ac1/12.9WW1 measurements.
Fig. 20. Interchanged in-phase deviations ∆ from the unity resist-ance ratio 12.9QF1/12.9WW1, obtained by averaging differencesbetween the “normal” and “exchanged” “raw data” of Figs. 17 and18. The 4TP interchanged measurements converge within the ±1 partin 107 uncertainty to the +42.0 parts in 106 dc value.
11. References
[1] J. Melcher, P. Warnecke, and R. Hanke, Comparison ofPrecision AC and DC Measurements with the Quantized HallResistance, IEEE Trans. Instrum. Meas. 42, 292-294 (1993).
[2] F. Delahaye, Accurate AC Measurements of the Quantized HallResistance from 1 Hz to 1.6 kHz, Metrologia 31, 367-373(1995).
[3] A. Hartland, B. P. Kibble, P. J. Rodgers, and J. Bohacek, ACMeasurements of the Quantized Hall Resistance, IEEE Trans.Instrum. Meas. 44, 245-248 (1995).
[4] B. M. Wood, A. D. Inglis, and M. Cote, Evaluation of the ACQuantized Hall Resistance, IEEE Trans. Instrum. Meas. 46,269-272 (1997).
[5] J. Bohacek, P. Svoboda, and P. Vasek, AC QHE-BasedCalibration of Resistance Standards, IEEE Trans. Instrum.Meas. 46, 273-275 (1997).
[6] B. M. Wood, A. D. Inglis, M. Cote, and R. B. Young, ImprovedAC Quantized Hall Measurements, IEEE Trans. Instrum. Meas.48, 305-308 (1999).
[7] S. W. Chua, A. Hartland, and B. P. Kibble, Measurement of theAC Quantized Hall Resistance, IEEE Trans. Instrum. Meas. 48,309-313 (1999).
[8] F. Delahaye, B. P. Kibble, and A. Zarka, Controlling AC Losesin Quantum Hall Effect Devices, Metrologia 37, 659-670(2000).
[9] J. Schurr, J. Melcher, A. von Campenhausen, G. Hein,F. -J. Ahlers, and K. Pierz, AC Behaviour and Loss Phenomenain Quantum Hall Samples, Metrologia 39, 2-12 (2002).
[10] J. Schurr, J. Melcher, A. von Campenhausen, and K. Pierz,Adjusting the Losses in an AC Quantum Hall Sample,Metrologia 39, 13-19 (2002).
[11] K. von Klitzing, G. Dorda, and M. Pepper, New Method forHigh-Accuracy Determination of the Fine-Structure ConstantBased on Quantized Hall Resistance, Phys. Rev. Lett. 45, 494-497 (1980).
[12] The Quantum Hall Effect, R. E. Prange and S. M. Girvin, eds.,Springer-Verlag, New York (1987) pp. 1-419.
[13] The Integral and Fractional Quantum Hall Effects, C. T. VanDegrift, M. E. Cage, and S. M. Girvin, eds., AmericanAssociation of Physics Teachers, College Park, Maryland(1991) pp. 1-116.
[14] F. Delahaye, Technical Guidelines for Reliable Measurementsof the Quantized Hall Resistance, Metrologia 26, 237-240(1989); F. Delahaye and B. Jeckelmann, Revised TechnicalGuidelines for Reliable DC Measurements of the QuantizedHall Resistance, Metrologia 40, 217-223 (2003).
[15] F. Delahaye, Series and Parallel Connection of MultiterminalQuantum Hall Effect Devices, J. Appl. Phys. 73, 7915-7920(1993).
[16] M. E. Cage, A. Jeffery, and J. Matthews, Equivalent ElectricalCircuit Representations of AC Quantized Hall ResistanceStandards, J. Res. Natl. Inst. Stand. Technol. 104 (6), 529-556(1999).
[17] R. D. Cutkosky, Four-Terminal-Pair Networks as PrecisionAdmittance and Impedance Standards, Commun. Electron. 70,19-22 (1964).
[18] R. D. Cutkosky, Techniques for Comparing Four-Terminal-PairAdmittance Standards, J. Res. Natl. Bur. Stand. (U.S.) 74C, 63-78 (1970).
[19] A. Jeffery, R. E. Elmquist, J. Q. Shields, L. H. Lee, M. E. Cage,S. H. Shields, and R. F. Dziuba, Determination of the von
Klitzing Constant and the Fine-Structure Constant Through aComparison of the Quantized Hall Resistance and the OhmDerived from the NIST Calculable Capacitor, Metrologia 35,83-96 (1998).
[20] D. L. H. Gibbings, A Design for Resistors of Calculablea.c./d.c. Resistance Ratio, Proc. IEE 110, 335-347 (1963).
[21] G. M. Reedtz and M. E. Cage, An Automated PotentiometricSystem for Precision Measurement of the Quantized HallResistance, J. Res. Natl. Bureau Stand. (U.S.). 92 (5), 303-310(1987).
[22] D. N. Homan, Applications of Coaxial Chokes to AC BridgeCircuits, J. Res. Natl. Bur. Stand. (U.S.) 72C, 161-165 (1968).
[23] A. Jeffery, J. Q. Shields, and L. H. Lee, An Easy-To-UseCombination Four-Terminal-Pair/Two-Terminal-Pair ACTransformer Bridge, J. Res. Natl. Inst. Stand. Technol. 103 (2),163-166 (1998).
[24] M. E. Cage, Quadratic Frequency Dependence of an AC QHRDevice, to be published.
[25] J. Schurr and J. Melcher, CPEM2002, Ottawa, Canada, June16-21 (2002) and private communication.
About the authors: M. E. Cage is a physicist andS. H. Shields a technician in what was the ElectricityDivision and is now the Quantum Electrical MetrologyDivision of the Electronics and Electrical EngineeringLaboratory of the National Institute of Standards andTechnology. A. Jeffery was a physicist in the ElectricityDivision and has now graduated from seminary school.The National Institute of Standards and Technologyis an agency of the Technology Administration,U.S. Department of Commerce.
Volume 109, Number 4, July-August 2004Journal of Research of the National Institute of Standards and Technology
405


![Information Security PRogram - ADOA-ASET | Arizona ... POLICY P8120... · Restrictions [NIST 800 53 AC-1] [NIST SP 800 53 PL-4(1)] Arizona Statewide Information Security STATEWIDE](https://img.pdfslide.us/doc/110x75/5b4d4d4d7f8b9a78228b5d6e/information-security-program-adoa-aset-arizona-policy-p8120-restrictions.jpg)