Embed Size (px)
Citation preview
IPA Analysis of Metabolomics Data Including Cross-Platform Integration with Transcriptomics Data from a Diabetic Mouse Model
Copyright 2009 Ingenuity Systems, Inc. Page 2
CONTENTS
Overview ........................................................................................................................................................................ 3
Introduction ................................................................................................................................................................... 3
Metabolomics Background ........................................................................................................................................ 3
Integration of Metabolomic and Transcriptomic data .............................................................................................. 5
The Ingenuity Platform .............................................................................................................................................. 5
Case Study Background ............................................................................................................................................. 5
Methods ........................................................................................................................................................................ 6
Establishing a Metabolite profile for db/db mice and identification of exploratory biomarkers .............................. 6
IPA-Metabolomics™ Analysis: .................................................................................................................................... 6
Metabolite Transformation ................................................................................................................................... 6
Transcriptomics data ......................................................................................................................................... 7
Results ........................................................................................................................................................................... 8
Metabolite mapping: ................................................................................................................................................. 8
Metabolite and Gene Mapping ............................................................................................................................... 11
Summary and Conclusions ........................................................................................................................................... 19
References ................................................................................................................................................................... 21
Copyright 2009 Ingenuity Systems, Inc. Page 3
OVERVIEW
Type 2 (or non insulin dependent) diabetes is one of the most common diseases in the western world, with over 150 million afflicted worldwide. Currently, none of the available animal models used to aid research into diagnostics and new anti-diabetic drugs reflect all disease aspects in man. More detailed model characterization compared to man is therefore essential to help make better decisions on animal testing.
Non-targeted metabolomics technologies have the potential for providing novel biomarkers of disease and drug efficacy and are increasingly being incorporated into biomarker exploration studies. Contextualization of metabolomics results is enhanced by integration with study data from other platforms such as transcriptomics, thus linking known metabolites and genes to relevant pathways and phenotypes, i.e. mapping genotype to phenotype.
In this white paper we have described NMR-based metabolomic and transcriptomic results from the db/db diabetic mouse, one of the most extensively studied animal models of severe type 2 diabetes. To assist with cross platform integration we have used IPA-Metabolomics™ analysis. IPA-Metabolomics is powered by the Ingenuity Knowledge Base, a repository of molecular interactions, regulatory events, signaling and metabolic pathways, and gene to phenotype associations.
The structures of 82 metabolites were identified that discriminated between the urines of diabetic db/db and control db/+ mice. Of these, 70 mapped to biological functions or pathways in IPA. Expected diabetes-related changes in lipid, gluconeogenesis, mitochondrial dysfunction and oxidative stress, and protein and amino acid metabolism were characterized by the metabolomic markers. Metabolites were also linked to changes in leptin, branched chain amino acid degradation, and vitamin metabolism.
Follow-up analytical and biological validation studies to verify both the identification and biological reproducibility of the results are essential to confirm initial findings from non-targeted metabolomics studies. In this work, the integration of metabolomics and transcriptomics data via IPA-Metabolomics has facilitated the contextualization of probable markers of processes in the db/db mice related to clinical manifestations of diabetes. This has provided useful input into protocol development for biomarker validation studies, highlighting metabolites that may reflect processes of interest, and focusing in on possible biomarkers.
INTRODUCTION
METABOLOMICS BACKGROUND
Biomarkers of disease, drug toxicity, and efficacy are increasingly needed in the preclinical and clinical setting for better evaluation of novel chemical entities, disease status, target validation, and treatment regimes (FDA 2004). Recent advances in technologies such as metabolomics, transcriptomics, and proteomics together with increased informatics support to analyze these data types, have greatly enhanced the screening for experimental
Copyright 2009 Ingenuity Systems, Inc. Page 4
biomarkers, encouraging more scientists to include these strategies in their investigations. Metabolomics is unique among these technologies in providing potential for exploring genotype-phenotype relationships (2, 3, 4, 5, 7, 8) and environmental influences (6, 8, 10) and may also reflect function more directly than gene and protein effects (7). Metabolomics technologies are currently experiencing an exponential increase in their incorporation into biological studies, with applications ranging from physiological genomics and potential lead target validation (2, 9) through mechanistic toxicology (11, 12, 13, 14) and clinical pharmacology (15), disease investigation (9, 16, 17, 18, 19), patient stratification (15, 20, 21, 22, 23), and ultimately personalized medicine (20, 24, 25). Included in this surge of metabolomic applications are also investigations of plant (26) and micro-organism/gut micro flora biochemistry (27, 28) and the impact of nutrition and the environment on human health (29, 30).
There is continuing debate within the metabolomics community concerning the terminology associated with the field (21, 31, 32, 35). The term ‘metabolome’ typically refers to all of the low molecular weight metabolites of biological origin that are present in a biological organism and represent the metabolic status of an organism at the time of sample collection (36, 37). The detectable small molecules in a biological matrix may arise from intermediates of metabolism, signaling molecules or endogenous metabolites altered by phase 1 and phase 2 transformations, or exogenous metabolites from the diet, environment, gut micro-flora or ingestion of drugs. Metabolomics is the study of some or all of these molecules (21, 36, 37, 73). For the purposes of mapping metabolites to tissue gene changes, as referred to in this article, the main discussion is focused on the endogenous components of the metabolome, although many transformed gut micro flora metabolites were also detected.
There are several terms used to describe studies of the metabolome (metabolomics, metabonomics, metabolic profiling and others; 21, 33) and whilst there are subtle differences in the definitions of these terms, they are in practice synonymous; therefore metabolomics is used in this article to encompass all.
Two distinct philosophies are applied to metabolomic studies depending on whether an existing hypothesis is being tested (targeted) or a more open investigation is on-going (non-targeted). Targeted approaches typically usually use standard clinical chemistry platforms or chromatography (either gas (GC) or liquid (LC)) coupled with a detector such as mass spectrometry (MS). The most popular platforms used for non-targeted metabolomics include nuclear magnetic resonances (NMR) spectroscopy and MS (34) although other forms of spectroscopy (Raman, infrared) have also been used (35). MS techniques often involve prior separation by chromatography to reduce variability caused by ion suppression. The data discussed in this article is non-targeted NMR-based metabolomics.
Extensive validation is required prior to an ‘omic-detected biomarker, or group of biomarkers, gaining acceptance for widespread use in the preclinical and clinical setting. In the first instance validation of a metabolomics-derived marker is usually analytical, working up a targeted assay on molecules originally highlighted by non-targeted approaches. However, a key part of subsequent validation is investigation of the biological context of the changes in the biomarker(s). To explore the biological relevance of metabolomic results it is necessary to integrate this data with associated study data to characterize effects across time, dose, disease severity, and where available in the context of associated gene changes. Interpretation of the integrated data in the context of high quality biological and chemical knowledge enhances follow-up work both by narrowing the focus to key pathways and also to provide some insight into the likely specificity of potential biomarkers.
Copyright 2009 Ingenuity Systems, Inc. Page 5
INTEGRATION OF METABOLOMIC AND TRANSCRIPTOMIC DATA
A major challenge in the integration of ‘omics data (transcriptomics, proteomics and metabolomics) is how best to compare and correlate these large datasets to provide the most meaningful biological context. A considerable amount of research is currently in progress in industrial and academic-based groups to address this challenge both at the data level, using statistical and chemometric methods, and at the biology level, using pathway analysis (39, 40, 41, 42, 43, 44). The latter approach uses extensive databases of metabolite and gene interactions to link known metabolites and genes to relevant pathways and phenotypes, i.e. mapping genotype to phenotype. In either case distinguishing and deconvoluting pharmacological, toxicological or disease effects that may all be relevant to a particular experiment can be particularly challenging.
THE INGENUITY PLATFORM
To assist with cross platform integration we have used IPA-Metabolomics ™ analysis to interpret transcriptomic and metabolomic data from a diabetic mouse study. IPA provides biological context to the metabolomics data, links metabolic changes to disease-relevant pathways and phenotypes and assists in the selection of a subset of metabolomic markers for further study. All metabolites and genes included in the mapping were selected based on statistical significance within the study and also consistency in significance and direction of metabolite or transcript changes across two studies.
IPA-Metabolomics is powered by the Ingenuity Knowledge Base, a repository of molecular interactions, regulatory events, signaling and metabolic pathways, and gene to phenotype associations that provide the building blocks for pathway construction. IPA contains millions of findings from the full text of the life sciences literature that describe relationships between chemicals, proteins, genes, complexes, cells, cellular components, tissues, drugs, cellular processes, diseases and clinical phenotypes. IPA also has extensive libraries of metabolic and cell signaling pathways, a robust up-to-date synonym library, and extensive contextual details, including species specificity, localization, mutations, epigenetic modifications, and experimental conditions. The structured, detailed content in the knowledge base enables researchers using IPA to analyze and interpret combined ‘omics data, visualize metabolite and gene interactions, and place data in a proper biological and chemical context.
CASE STUDY BACKGROUND
Type 2 (or non insulin dependent) diabetes is one of the most common diseases in the western world with over 150 million afflicted worldwide, many of whom are unaware that they have the disease (45). Complications of diabetes are predominantly associated with poorly-controlled levels of blood glucose and include micro and macro vascular disease leading to peripheral neuropathy, kidney and eye complications and coronary heart disease (74).
Animal models of diabetes are used to aid discovery of better disease diagnostics and for testing novel chemical entities that may have anti-diabetic activity (46). However none of the current animal models reflect all aspects of the disease so that more detailed elucidation of the underlying processes in the animal model compared to man are essential to help make better decisions on animal testing. In this study we have used NMR-based metabolomic and transcriptomic data from the db/db diabetic mouse, one of the most extensively studied animal models of severe type II diabetes (46).
Copyright 2009 Ingenuity Systems, Inc. Page 6
Db/db mice lack a functioning leptin receptor resulting in defective leptin-mediated signal transduction. This causes chronic overeating, obesity, severe hyperinsulinaemia and hyperglycemia, dyslipidemia and hyperphagia and other manifestations including kidney disease and fibrosis (45, 47, 48).
METHODS
ESTABLISHING A METABOLITE PROFILE FOR DB/DB MICE AND IDENTIFICATION OF EXPLORATORY BIOMARKERS
Data is taken from Connor et al 2008. Urine samples were collected over a 6 hour period from adult male db/db and db/+ mice at 8 weeks and again at 9 and 10 weeks of age (n=10 per group). Samples were buffered to pH 7 and NMR data acquired on a 700 MHz Bruker spectrometer using standard experiments (50). Spectra were then processed using standard metabolomics software (Bruker Topspin, Bruker Amix, and ACD) and analyzed by multivariate (MV) and univariate (UV) statistics. MV methods included principal components analysis (PCA), partial least squares (PLS) and PLS-discriminant analysis (PLS-DA). UV methods included ANOVA and post hoc tests, correlation and regression. Metabolites that were significantly different between db/db and db/+ mice across time were included in subsequent pathway mapping analysis.
NMR signals that were significant by either statistical method were then assigned initially with reference to standard databases of NMR spectra (database: HMDB (www.hmdb.ca) (51), Chenomx NMR Suite v4.0, GSK proprietary database, Bruker Amix Spectrabase) and then extensive follow-up experiments were performed. Follow-up experiments consisted of 1D and 2D NMR and LC/MS structure elucidation and addition of standards to the samples. Once metabolites had been assigned, several were noted to have arisen from gut micro flora. These were excluded from cross platform pathway mapping because no transcriptomics data was gathered from the gut micro flora in this experiment.
IPA-METABOLOMICS™ ANALYSIS:
METABOLITE TRANSFORMATION
Perhaps a unique and particularly challenging characteristic of metabolomics investigations is the tendency for intermediates/end products of metabolism to undergo further phase 1 or phase 2-type transformations or chemical reactions. There were several examples of this in the db/db metabolomics dataset (Table 1); isovalerylglycine was manually mapped as isovalerate and isovaleryl CoA, acknowledging that isovaleryl CoA is first hydrolyzed to the free acid and then conjugated to glycine prior to excretion. This process is common for most fatty acids, which are observed as phase 2 conjugates in urine, but potentially the free acid or CoA derivative in tissues.
Chemical modification of metabolites is also common for metabolic intermediates that are chemically very reactive. For example isocaproaldehyde, the product of cleavage of the side chain of cholesterol in the formation of C21 steroids, is quickly oxidized to its acid form, which then undergoes excretion as its glycine conjugate, isocaproylglycine. Metabolites (n=78) were mapped as their parent molecule using their KEGG (61), PubChem (http://pubchem.ncbi.nlm.nih.gov/)(62) and CAS (http://www.cas.org/)(63) identification number.
Copyright 2009 Ingenuity Systems, Inc. Page 7
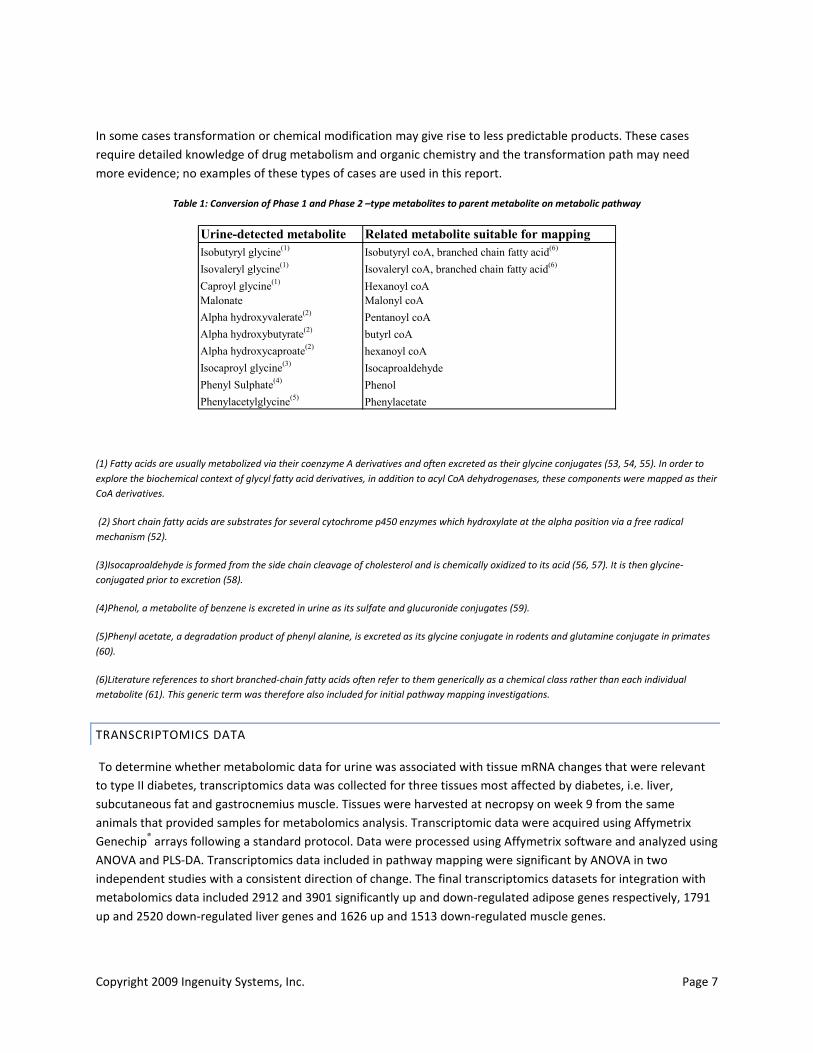
In some cases transformation or chemical modification may give rise to less predictable products. These cases require detailed knowledge of drug metabolism and organic chemistry and the transformation path may need more evidence; no examples of these types of cases are used in this report.
Table 1: Conversion of Phase 1 and Phase 2 –type metabolites to parent metabolite on metabolic pathway
Urine-detected metabolite Related metabolite suitable for mappingIsobutyryl glycine(1) Isobutyryl coA, branched chain fatty acid(6)
Isovaleryl glycine(1) Isovaleryl coA, branched chain fatty acid(6)
Caproyl glycine(1) Hexanoyl coAMalonate Malonyl coAAlpha hydroxyvalerate(2) Pentanoyl coAAlpha hydroxybutyrate(2) butyrl coAAlpha hydroxycaproate(2) hexanoyl coAIsocaproyl glycine(3) IsocaproaldehydePhenyl Sulphate(4) PhenolPhenylacetylglycine(5) Phenylacetate
(1) Fatty acids are usually metabolized via their coenzyme A derivatives and often excreted as their glycine conjugates (53, 54, 55). In order to explore the biochemical context of glycyl fatty acid derivatives, in addition to acyl CoA dehydrogenases, these components were mapped as their CoA derivatives.
(2) Short chain fatty acids are substrates for several cytochrome p450 enzymes which hydroxylate at the alpha position via a free radical mechanism (52).
(3)Isocaproaldehyde is formed from the side chain cleavage of cholesterol and is chemically oxidized to its acid (56, 57). It is then glycine-conjugated prior to excretion (58).
(4)Phenol, a metabolite of benzene is excreted in urine as its sulfate and glucuronide conjugates (59).
(5)Phenyl acetate, a degradation product of phenyl alanine, is excreted as its glycine conjugate in rodents and glutamine conjugate in primates (60).
(6)Literature references to short branched-chain fatty acids often refer to them generically as a chemical class rather than each individual metabolite (61). This generic term was therefore also included for initial pathway mapping investigations.
TRANSCRIPTOMICS DATA
To determine whether metabolomic data for urine was associated with tissue mRNA changes that were relevant to type II diabetes, transcriptomics data was collected for three tissues most affected by diabetes, i.e. liver, subcutaneous fat and gastrocnemius muscle. Tissues were harvested at necropsy on week 9 from the same animals that provided samples for metabolomics analysis. Transcriptomic data were acquired using Affymetrix Genechip® arrays following a standard protocol. Data were processed using Affymetrix software and analyzed using ANOVA and PLS-DA. Transcriptomics data included in pathway mapping were significant by ANOVA in two independent studies with a consistent direction of change. The final transcriptomics datasets for integration with metabolomics data included 2912 and 3901 significantly up and down-regulated adipose genes respectively, 1791 up and 2520 down-regulated liver genes and 1626 up and 1513 down-regulated muscle genes.
Copyright 2009 Ingenuity Systems, Inc. Page 8
RESULTS
METABOLITE MAPPING:
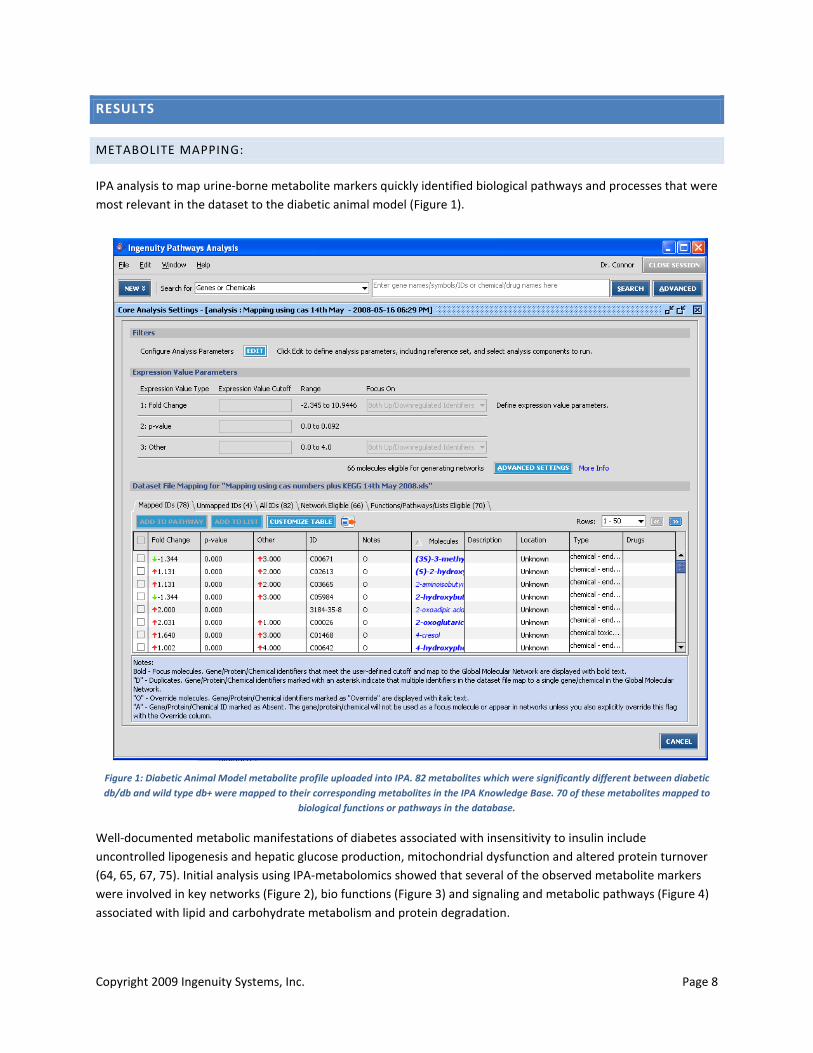
IPA analysis to map urine-borne metabolite markers quickly identified biological pathways and processes that were most relevant in the dataset to the diabetic animal model (Figure 1).
Figure 1: Diabetic Animal Model metabolite profile uploaded into IPA. 82 metabolites which were significantly different between diabetic db/db and wild type db+ were mapped to their corresponding metabolites in the IPA Knowledge Base. 70 of these metabolites mapped to
biological functions or pathways in the database.
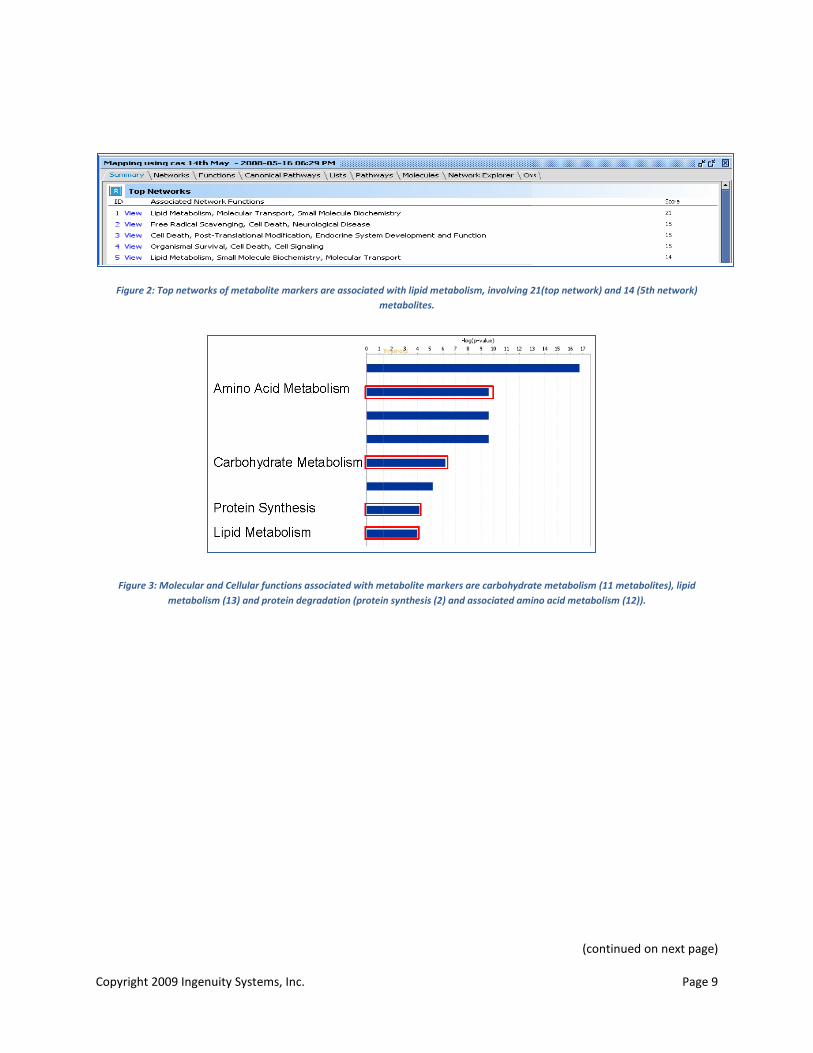
Well-documented metabolic manifestations of diabetes associated with insensitivity to insulin include uncontrolled lipogenesis and hepatic glucose production, mitochondrial dysfunction and altered protein turnover (64, 65, 67, 75). Initial analysis using IPA-metabolomics showed that several of the observed metabolite markers were involved in key networks (Figure 2), bio functions (Figure 3) and signaling and metabolic pathways (Figure 4) associated with lipid and carbohydrate metabolism and protein degradation.
Copyright 2009 Ingenuity Systems, Inc. Page 9
Figure 2: Top networks of metabolite markers are associated with lipid metabolism, involving 21(top network) and 14 (5th network) metabolites.
Figure 3: Molecular and Cellular functions associated with metabolite markers are carbohydrate metabolism (11 metabolites), lipid metabolism (13) and protein degradation (protein synthesis (2) and associated amino acid metabolism (12)).
(continued on next page)
Copyright 2009 Ingenuity Systems, Inc. Page 10
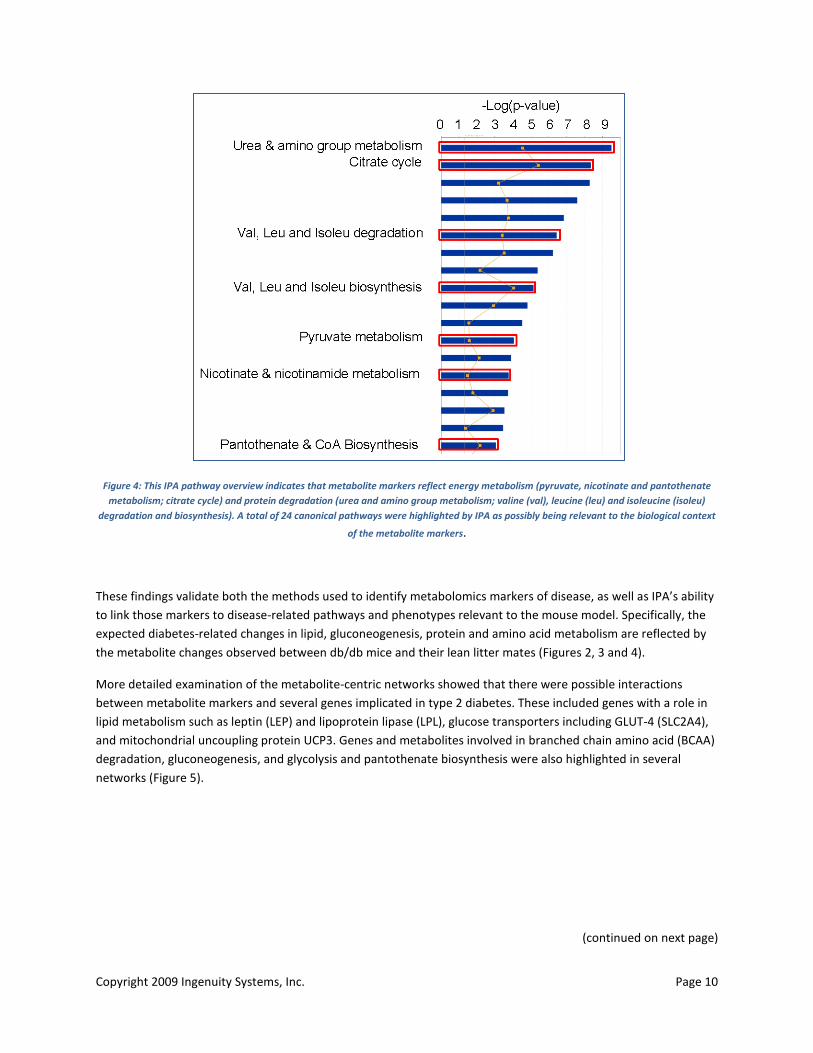
Figure 4: This IPA pathway overview indicates that metabolite markers reflect energy metabolism (pyruvate, nicotinate and pantothenate metabolism; citrate cycle) and protein degradation (urea and amino group metabolism; valine (val), leucine (leu) and isoleucine (isoleu)
degradation and biosynthesis). A total of 24 canonical pathways were highlighted by IPA as possibly being relevant to the biological context
of the metabolite markers.
These findings validate both the methods used to identify metabolomics markers of disease, as well as IPA’s ability to link those markers to disease-related pathways and phenotypes relevant to the mouse model. Specifically, the expected diabetes-related changes in lipid, gluconeogenesis, protein and amino acid metabolism are reflected by the metabolite changes observed between db/db mice and their lean litter mates (Figures 2, 3 and 4).
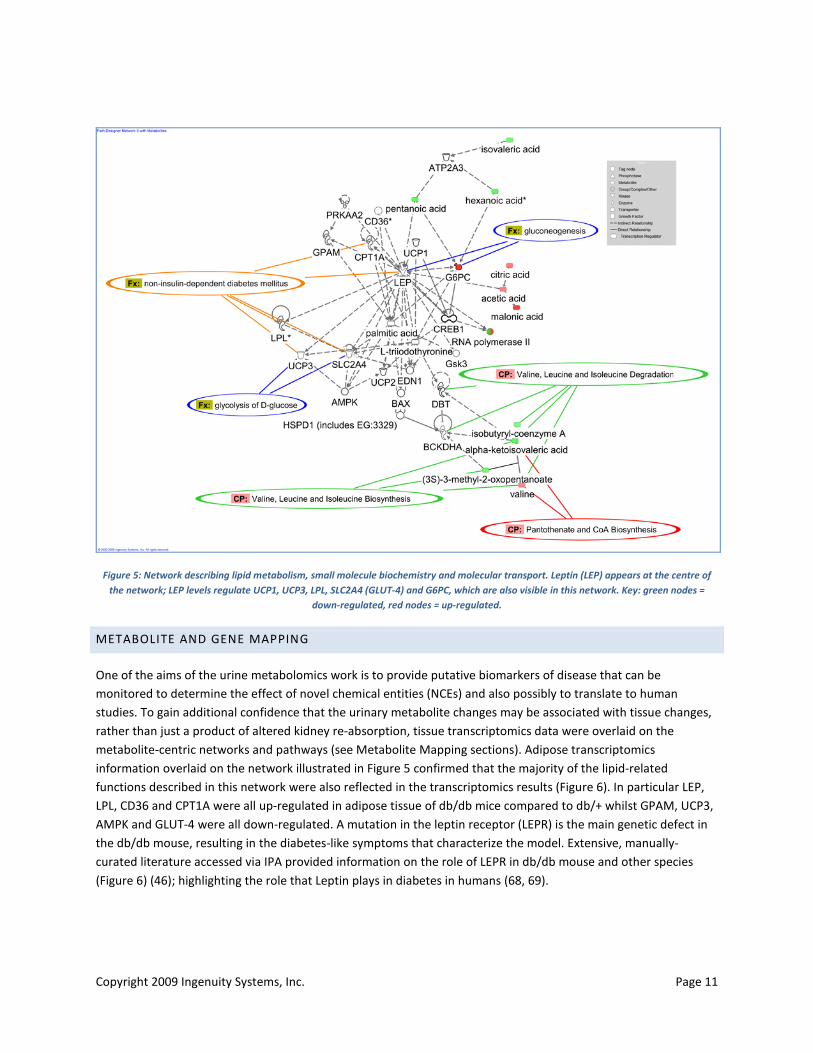
More detailed examination of the metabolite-centric networks showed that there were possible interactions between metabolite markers and several genes implicated in type 2 diabetes. These included genes with a role in lipid metabolism such as leptin (LEP) and lipoprotein lipase (LPL), glucose transporters including GLUT-4 (SLC2A4), and mitochondrial uncoupling protein UCP3. Genes and metabolites involved in branched chain amino acid (BCAA) degradation, gluconeogenesis, and glycolysis and pantothenate biosynthesis were also highlighted in several networks (Figure 5).
(continued on next page)
Copyright 2009 Ingenuity Systems, Inc. Page 11
Figure 5: Network describing lipid metabolism, small molecule biochemistry and molecular transport. Leptin (LEP) appears at the centre of the network; LEP levels regulate UCP1, UCP3, LPL, SLC2A4 (GLUT-4) and G6PC, which are also visible in this network. Key: green nodes =
down-regulated, red nodes = up-regulated.
METABOLITE AND GENE MAPPING
One of the aims of the urine metabolomics work is to provide putative biomarkers of disease that can be monitored to determine the effect of novel chemical entities (NCEs) and also possibly to translate to human studies. To gain additional confidence that the urinary metabolite changes may be associated with tissue changes, rather than just a product of altered kidney re-absorption, tissue transcriptomics data were overlaid on the metabolite-centric networks and pathways (see Metabolite Mapping sections). Adipose transcriptomics information overlaid on the network illustrated in Figure 5 confirmed that the majority of the lipid-related functions described in this network were also reflected in the transcriptomics results (Figure 6). In particular LEP, LPL, CD36 and CPT1A were all up-regulated in adipose tissue of db/db mice compared to db/+ whilst GPAM, UCP3, AMPK and GLUT-4 were all down-regulated. A mutation in the leptin receptor (LEPR) is the main genetic defect in the db/db mouse, resulting in the diabetes-like symptoms that characterize the model. Extensive, manually-curated literature accessed via IPA provided information on the role of LEPR in db/db mouse and other species (Figure 6) (46); highlighting the role that Leptin plays in diabetes in humans (68, 69).
Copyright 2009 Ingenuity Systems, Inc. Page 12
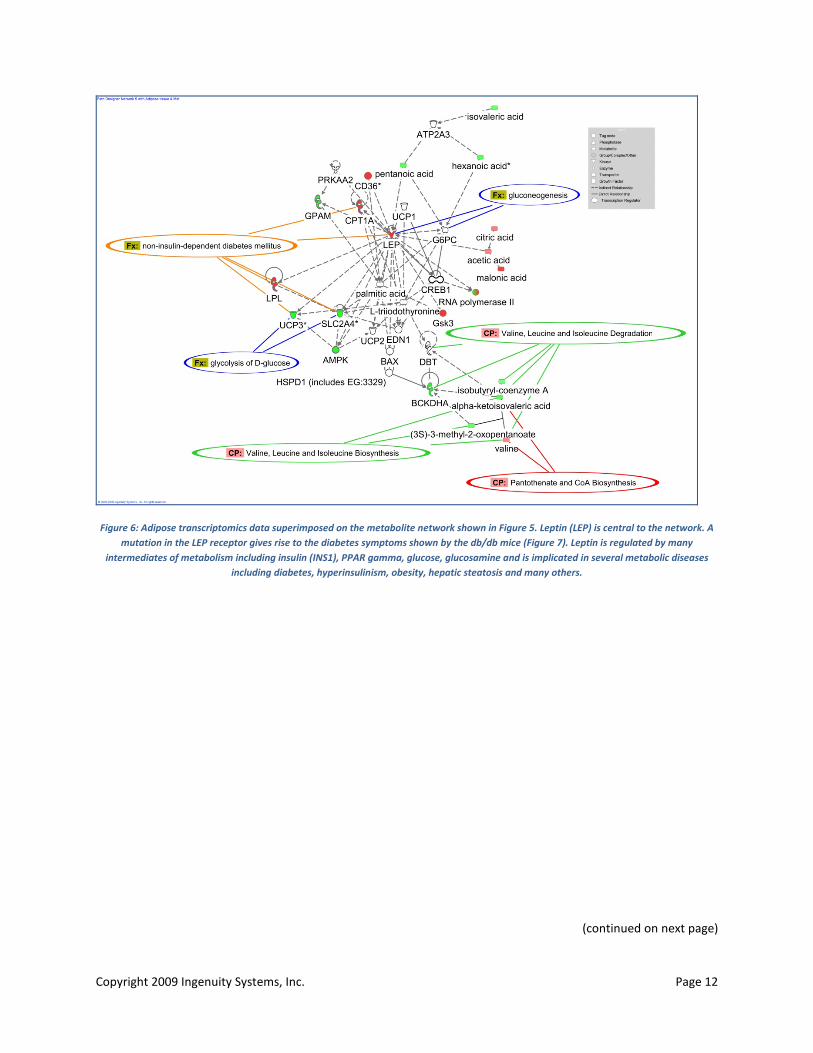
Figure 6: Adipose transcriptomics data superimposed on the metabolite network shown in Figure 5. Leptin (LEP) is central to the network. A mutation in the LEP receptor gives rise to the diabetes symptoms shown by the db/db mice (Figure 7). Leptin is regulated by many
intermediates of metabolism including insulin (INS1), PPAR gamma, glucose, glucosamine and is implicated in several metabolic diseases including diabetes, hyperinsulinism, obesity, hepatic steatosis and many others.
(continued on next page)
Copyright 2009 Ingenuity Systems, Inc. Page 13
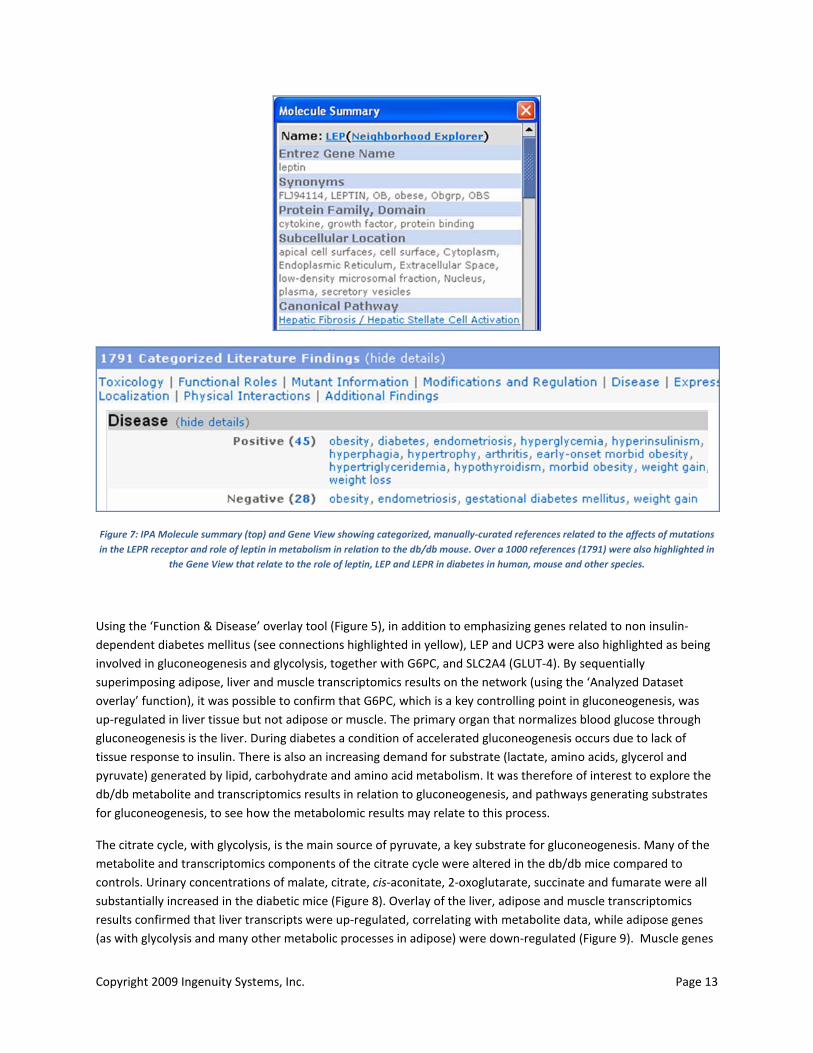
Figure 7: IPA Molecule summary (top) and Gene View showing categorized, manually-curated references related to the affects of mutations in the LEPR receptor and role of leptin in metabolism in relation to the db/db mouse. Over a 1000 references (1791) were also highlighted in
the Gene View that relate to the role of leptin, LEP and LEPR in diabetes in human, mouse and other species.
Using the ‘Function & Disease’ overlay tool (Figure 5), in addition to emphasizing genes related to non insulin- dependent diabetes mellitus (see connections highlighted in yellow), LEP and UCP3 were also highlighted as being involved in gluconeogenesis and glycolysis, together with G6PC, and SLC2A4 (GLUT-4). By sequentially superimposing adipose, liver and muscle transcriptomics results on the network (using the ‘Analyzed Dataset overlay’ function), it was possible to confirm that G6PC, which is a key controlling point in gluconeogenesis, was up-regulated in liver tissue but not adipose or muscle. The primary organ that normalizes blood glucose through gluconeogenesis is the liver. During diabetes a condition of accelerated gluconeogenesis occurs due to lack of tissue response to insulin. There is also an increasing demand for substrate (lactate, amino acids, glycerol and pyruvate) generated by lipid, carbohydrate and amino acid metabolism. It was therefore of interest to explore the db/db metabolite and transcriptomics results in relation to gluconeogenesis, and pathways generating substrates for gluconeogenesis, to see how the metabolomic results may relate to this process.
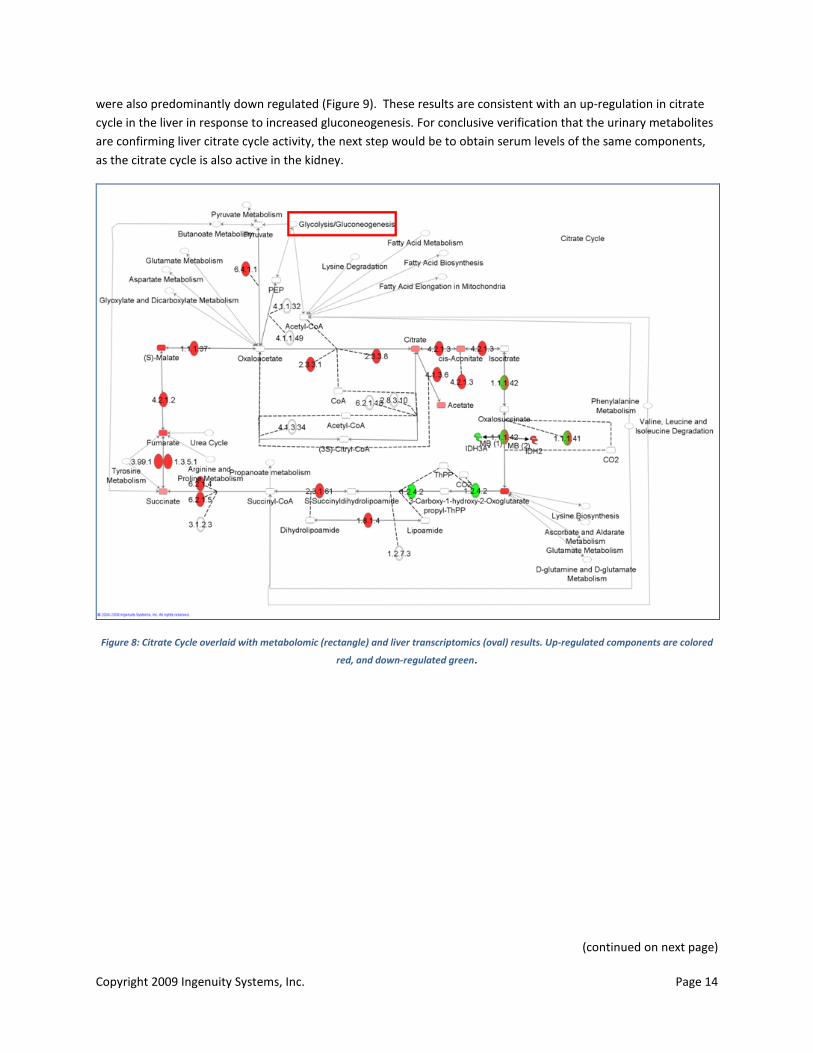
The citrate cycle, with glycolysis, is the main source of pyruvate, a key substrate for gluconeogenesis. Many of the metabolite and transcriptomics components of the citrate cycle were altered in the db/db mice compared to controls. Urinary concentrations of malate, citrate, cis-aconitate, 2-oxoglutarate, succinate and fumarate were all substantially increased in the diabetic mice (Figure 8). Overlay of the liver, adipose and muscle transcriptomics results confirmed that liver transcripts were up-regulated, correlating with metabolite data, while adipose genes (as with glycolysis and many other metabolic processes in adipose) were down-regulated (Figure 9). Muscle genes
Copyright 2009 Ingenuity Systems, Inc. Page 14
were also predominantly down regulated (Figure 9). These results are consistent with an up-regulation in citrate cycle in the liver in response to increased gluconeogenesis. For conclusive verification that the urinary metabolites are confirming liver citrate cycle activity, the next step would be to obtain serum levels of the same components, as the citrate cycle is also active in the kidney.
Figure 8: Citrate Cycle overlaid with metabolomic (rectangle) and liver transcriptomics (oval) results. Up-regulated components are colored
red, and down-regulated green.
(continued on next page)
Copyright 2009 Ingenuity Systems, Inc. Page 15
Adipose Muscle
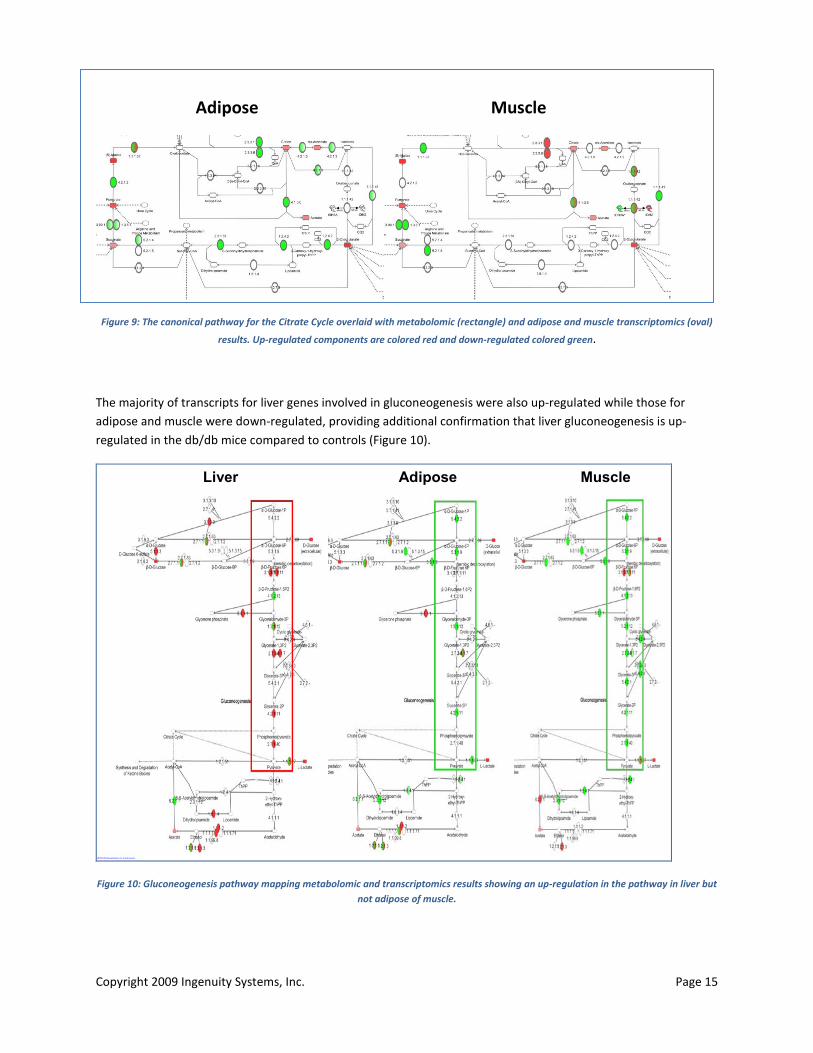
Figure 9: The canonical pathway for the Citrate Cycle overlaid with metabolomic (rectangle) and adipose and muscle transcriptomics (oval)
results. Up-regulated components are colored red and down-regulated colored green.
The majority of transcripts for liver genes involved in gluconeogenesis were also up-regulated while those for adipose and muscle were down-regulated, providing additional confirmation that liver gluconeogenesis is up-regulated in the db/db mice compared to controls (Figure 10).
Liver Adipose MuscleLiver Adipose Muscle
Figure 10: Gluconeogenesis pathway mapping metabolomic and transcriptomics results showing an up-regulation in the pathway in liver but not adipose of muscle.
Copyright 2009 Ingenuity Systems, Inc. Page 16
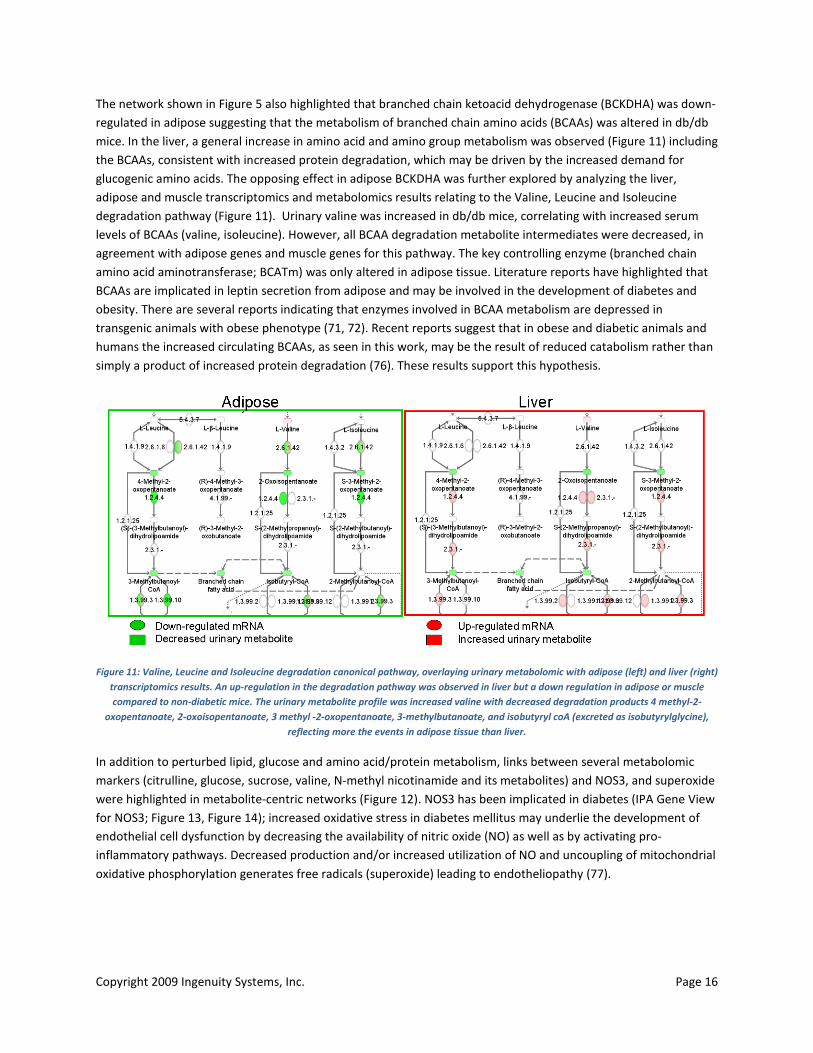
The network shown in Figure 5 also highlighted that branched chain ketoacid dehydrogenase (BCKDHA) was down-regulated in adipose suggesting that the metabolism of branched chain amino acids (BCAAs) was altered in db/db mice. In the liver, a general increase in amino acid and amino group metabolism was observed (Figure 11) including the BCAAs, consistent with increased protein degradation, which may be driven by the increased demand for glucogenic amino acids. The opposing effect in adipose BCKDHA was further explored by analyzing the liver, adipose and muscle transcriptomics and metabolomics results relating to the Valine, Leucine and Isoleucine degradation pathway (Figure 11). Urinary valine was increased in db/db mice, correlating with increased serum levels of BCAAs (valine, isoleucine). However, all BCAA degradation metabolite intermediates were decreased, in agreement with adipose genes and muscle genes for this pathway. The key controlling enzyme (branched chain amino acid aminotransferase; BCATm) was only altered in adipose tissue. Literature reports have highlighted that BCAAs are implicated in leptin secretion from adipose and may be involved in the development of diabetes and obesity. There are several reports indicating that enzymes involved in BCAA metabolism are depressed in transgenic animals with obese phenotype (71, 72). Recent reports suggest that in obese and diabetic animals and humans the increased circulating BCAAs, as seen in this work, may be the result of reduced catabolism rather than simply a product of increased protein degradation (76). These results support this hypothesis.
Figure 11: Valine, Leucine and Isoleucine degradation canonical pathway, overlaying urinary metabolomic with adipose (left) and liver (right) transcriptomics results. An up-regulation in the degradation pathway was observed in liver but a down regulation in adipose or muscle compared to non-diabetic mice. The urinary metabolite profile was increased valine with decreased degradation products 4 methyl-2-
oxopentanoate, 2-oxoisopentanoate, 3 methyl -2-oxopentanoate, 3-methylbutanoate, and isobutyryl coA (excreted as isobutyrylglycine), reflecting more the events in adipose tissue than liver.
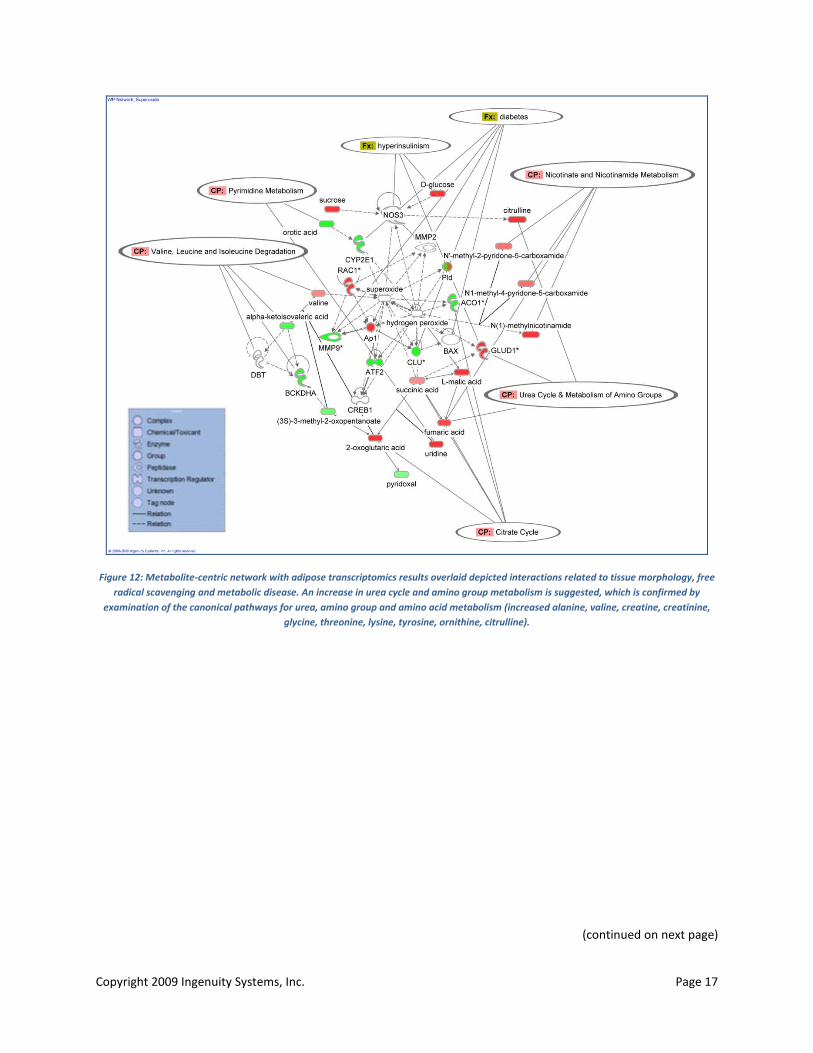
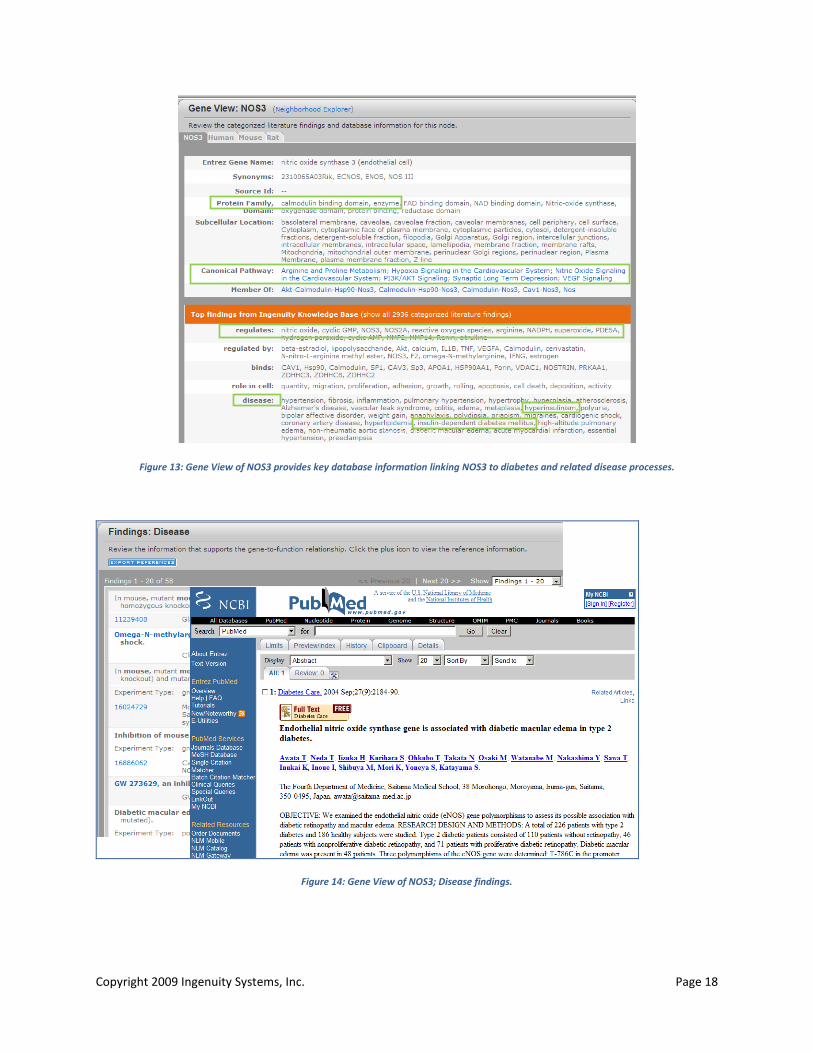
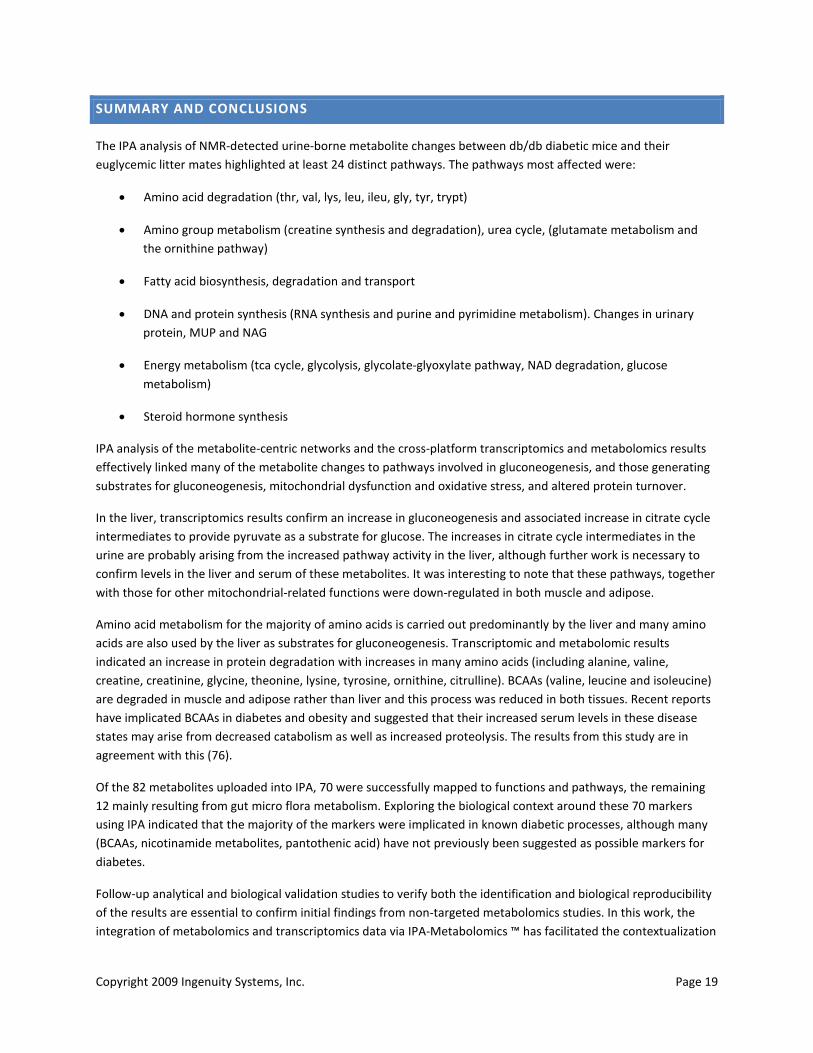
In addition to perturbed lipid, glucose and amino acid/protein metabolism, links between several metabolomic markers (citrulline, glucose, sucrose, valine, N-methyl nicotinamide and its metabolites) and NOS3, and superoxide were highlighted in metabolite-centric networks (Figure 12). NOS3 has been implicated in diabetes (IPA Gene View for NOS3; Figure 13, Figure 14); increased oxidative stress in diabetes mellitus may underlie the development of endothelial cell dysfunction by decreasing the availability of nitric oxide (NO) as well as by activating pro-inflammatory pathways. Decreased production and/or increased utilization of NO and uncoupling of mitochondrial oxidative phosphorylation generates free radicals (superoxide) leading to endotheliopathy (77).
Copyright 2009 Ingenuity Systems, Inc. Page 17
Figure 12: Metabolite-centric network with adipose transcriptomics results overlaid depicted interactions related to tissue morphology, free radical scavenging and metabolic disease. An increase in urea cycle and amino group metabolism is suggested, which is confirmed by
examination of the canonical pathways for urea, amino group and amino acid metabolism (increased alanine, valine, creatine, creatinine, glycine, threonine, lysine, tyrosine, ornithine, citrulline).
(continued on next page)
Copyright 2009 Ingenuity Systems, Inc. Page 18
Discover the Biology
Figure 13: Gene View of NOS3 provides key database information linking NOS3 to diabetes and related disease processes.
Proprietary and Confidential 1
Figure 14: Gene View of NOS3; Disease findings.
Copyright 2009 Ingenuity Systems, Inc. Page 19
SUMMARY AND CONCLUSIONS
The IPA analysis of NMR-detected urine-borne metabolite changes between db/db diabetic mice and their euglycemic litter mates highlighted at least 24 distinct pathways. The pathways most affected were:
x Amino acid degradation (thr, val, lys, leu, ileu, gly, tyr, trypt)
x Amino group metabolism (creatine synthesis and degradation), urea cycle, (glutamate metabolism and the ornithine pathway)
x Fatty acid biosynthesis, degradation and transport
x DNA and protein synthesis (RNA synthesis and purine and pyrimidine metabolism). Changes in urinary protein, MUP and NAG
x Energy metabolism (tca cycle, glycolysis, glycolate-glyoxylate pathway, NAD degradation, glucose metabolism)
x Steroid hormone synthesis
IPA analysis of the metabolite-centric networks and the cross-platform transcriptomics and metabolomics results effectively linked many of the metabolite changes to pathways involved in gluconeogenesis, and those generating substrates for gluconeogenesis, mitochondrial dysfunction and oxidative stress, and altered protein turnover.
In the liver, transcriptomics results confirm an increase in gluconeogenesis and associated increase in citrate cycle intermediates to provide pyruvate as a substrate for glucose. The increases in citrate cycle intermediates in the urine are probably arising from the increased pathway activity in the liver, although further work is necessary to confirm levels in the liver and serum of these metabolites. It was interesting to note that these pathways, together with those for other mitochondrial-related functions were down-regulated in both muscle and adipose.
Amino acid metabolism for the majority of amino acids is carried out predominantly by the liver and many amino acids are also used by the liver as substrates for gluconeogenesis. Transcriptomic and metabolomic results indicated an increase in protein degradation with increases in many amino acids (including alanine, valine, creatine, creatinine, glycine, theonine, lysine, tyrosine, ornithine, citrulline). BCAAs (valine, leucine and isoleucine) are degraded in muscle and adipose rather than liver and this process was reduced in both tissues. Recent reports have implicated BCAAs in diabetes and obesity and suggested that their increased serum levels in these disease states may arise from decreased catabolism as well as increased proteolysis. The results from this study are in agreement with this (76).
Of the 82 metabolites uploaded into IPA, 70 were successfully mapped to functions and pathways, the remaining 12 mainly resulting from gut micro flora metabolism. Exploring the biological context around these 70 markers using IPA indicated that the majority of the markers were implicated in known diabetic processes, although many (BCAAs, nicotinamide metabolites, pantothenic acid) have not previously been suggested as possible markers for diabetes.
Follow-up analytical and biological validation studies to verify both the identification and biological reproducibility of the results are essential to confirm initial findings from non-targeted metabolomics studies. In this work, the integration of metabolomics and transcriptomics data via IPA-Metabolomics ™ has facilitated the contextualization

Copyright 2009 Ingenuity Systems, Inc. Page 20
of probable markers of processes in the db/db mice related to clinical manifestations of diabetes. This has provided useful input into protocol development for biomarker validation studies, highlighting metabolites that may reflect processes of interest and focusing in on possible biomarkers.
Copyright 2009 Ingenuity Systems, Inc. Page 21
REFERENCES
1. FDA 2004: Challenge and opportunity on the critical path to new medical products. In: US FDA,
www.fda.gov/oc/initiatives/criticalpath/whitepaper.html. 2. Raamsdonk L M, Teusink B., Broadhurst D., et al: A functional genomics strategy that uses metabolome
data to reveal the phenotype of silent mutations. Nat. Biotech., 19(1), 45-50, 2001. 3. Fiehn O: Metabolomics – the link between genotypes and phenotypes. Plant Mol. Biol, 48, 155-171, 2002. 4. Van Der Greef J., Vehejj ER, Vogels J., Van Der Hejiden R, Davidov E, Naylor E., 2003. The role of
metabolomics in systems biology, a new vision for drug discovery and development, in Metabolic Profiling: Its Role in Biomarker Discovery and Gene Function Analysis. Boston: Kluwer Acad. Publ. p 170-198, 2003.
5. Griffin J L, Williams H. J. Sang E. Clarke K, Rae C, Nicholson J K: Metabolic Profiling of genetic disorders: a multi tissue 1H nuclear magnetic resonance spectroscopic and pattern recognition study into dystrophic tissue. Anal Biochem. 293(1), 16-21, (2001).
6. Connor SC, Wu W, Sweatman BC, Manini J, Haselden JN, Crowther DJ, and Waterfield CJ: Effects of feeding and body weight loss on the 1H-NMR-based urine metabolic profiles of male Wistar Han rats: implications for biomarker discovery. Biomarkers 2004, 9:156-179.
7. Barabasi AL, Oltvai ZN, Network biology: understanding the cell’s functional organisation. Nat. Rev. Genet, 5(2), 101-115, 2004.
8. Goodacre R, Vaidyanathan S, Dunn WB, Harrigan GG, and Kell DB: Metabolomics by numbers: Acquiring and understanding global metabolite data. Trends Biotechnol. 2004, 22:245-252.
9. Lindon, J.C., Holmes, E., Bollard, M.E., Stanley, E.G., and Nicholson, J.K. (2004) Metabolomics technologies and their applications in physiological monitoring, drug safety assessment and disease diagnosis. Biomarkers, 9, 1-31.
10. Nicholson JK, Holmes E, Lindon JC, Wilson ID: The challenges of modelling mammalian bio complexity. Nat Biotechnol 2004, 22:1268-1274.
11. Beckwith-Hall BM, Nicholson JK, Nicholls QW et al: Nuclear magnetic resonance spectroscopic and principal components analysis investigations into biochemical effects of three model hepatotoxins. Chem. Res. Toxicol., 11(4), 260-272, 1998.
12. Lindon JC., Keun HC., and Ebbels TMD et al The Consortium for Metabonomic Toxicology (COMET): aims activities and achievements. Pharmacogenomics, 6(7), 691-699, 2005.
13. Sinta G.: Trying to catch troublemakers with a metabolic profile, Science 310(5750), 965-966, 2005. 14. Dieterle E. Schlotterbeck G. Ross A, Nederhauser U. Senn H.: Application of metabonomics in a compound
ranking study in early drug development revealing drug-induced excretion of choline into urine. Chem Res. Toxicol., 19(9), 1175-1181, 2006.
15. Van Doorn, M., Vogels, J., Tas, A., van Hoogdalem, E.J., Burggraaf, J., Cohen, A., and van der Greef, J. (2006) Evaluation of metabolite profiles as biomarkers for the pharmacological effects of thiazolidinediones in Type 2 diabetes mellitus patients and healthy volunteers. British Journal of Clinical Pharmacology, 63, 562-574.
16. Wilcken B, Wiley V, Hammond J., Carpenter K: Screening newborns for inborn errors of metabolism by tandem mass spectrometry. N. Engl. J. Med., 348(23), 2304-2312, 2003.
17. Pan ZZ, Gu HW, Talaty N et al: Principal component analysis of urine metabolites detected by NMR and DESI-MS in patients with inborn errors of metabolism, Anal Bioanal Chem. 387(2), 539-549, 2007.
18. Brindle JT, Antti H, Holmes E et al: Rapid and non-invasive diagnosis of the presence and severity of coronary heart disease using 1H-NMR-based metabonomics. Nat. Med, 8(12), 1439-1444, 2003.
19. Holmes E, Trang TM, Huang JT et al: Metabolic Profiling of CSF: evidence that early intervention may impact on disease progression and outcome in schizophrenia. PL-S Med. 3(8), 1420-1428, 2006.
20. Clayton TA, London JC, Cloarec O et al: Pharmaco-metabonomic phenotyping and personalised drug treatment. Nature, 440(7087), 1073-1077, 2006.
Copyright 2009 Ingenuity Systems, Inc. Page 22
21. Keun HC and Athersuch TJ, Application of metabonomics in drug development, Pharmacogenomics 8(7), 741 2007.
22. Ala-Korpela M, Potential role of body fluid 1H NMR metabonomics as a prognostic and diagnostic tool, Expert Rev. Mol. Diagn., 7(6), 761-773, 2007.
23. Qiu Y, Rajagopalan D, Connor SC, Damian D, Zhu L, Handzel A, Hu G, Amanullah A, Bao S, Woody N, Maclean D, Lee K, Vanderwall D, Ryan T : Multivariate classification analysis of metabolomic data for candidate biomarker discovery in type 2 diabetes mellitus, Metabolomics, on-line first, August, 2008.
24. Ala-Korpela M., Sipola P, Kaski K. Characterization and molecular detection of atherothrombosis by magnetic resonance- potential tools for individual risk assessment and diagnostics, Ann. Med, 38, 322-336, 2006.
25. Nicholson JK, Holmes E., and Wilson ID: Gut microorganisms, mammalian metabolism and personalised health care. Nat Rev Microbiol, 3(5), 431-438 (2005).
26. Krishnan P., Kruger NJ, Ratcliffe RG: Metabolite fingerprinting and profiling in plants using NMR. J. Exp Bot, 56(410), 255-265, 2005.
27. Williams RE, Lenz EM, Lowden JS, Rantalainen M., Wilson ID.: The metabonomics of aging and development in the rat: an investigation into the effect of age on the profile of endogenous metabolites in the urine of male rats using 1H NMR and HPLC-TOF MS. Mol Biosyst, 1, 166-175, 2005.
28. Goodacre R., Vaidyanathan S, Dunn W.B., Harrigan GG, and Kell DB: Metabolomics by numbers: acquiring and understanding global metabolite data. Review, Trends in Biotechnology, 22(5), 2004.
29. Hall RD, Brouwer ID, Fitzgerald MA., Plant metabolomics and its potential application for human nutrition. Physiologia Plantarium, 132(2), 162-75, 2008.
30. Rezzi S, Ramadan Z, Fay LB, Kochhar S., Nutritional Metabonomics: applications and perspectives, Journal of Proteome Research, 6(2), 513-25, 2007.
31. Oliver SG, Winson MK, Kell DB, Baganz F. Trends Biotechnology, 1998, 16, 373-378 32. Nicholson JK, London JC, Holmes E. Xenobiotica 1999, 11, 1181-1189. 33. Ellis DI, Dunn WB, Griffin JL. Allwood JW and Goodacre R. : Metabolic Fingerprinting as a diagnostic tool,
Pharmacogenomics, 8(9), 1243-1266, 2007 34. Allwood JW, Ellis DI, Goodacre R.: Metabolomic technologies and their application to the study of plants
and plant-host interactions, Physiologia Plantaria, 132(2), 117-35, 2008. 35. Ellis DI, Goodacre R.: Metabolic fingerprinting in disease diagnosis: biomedical applications of infrared and
Raman spectroscopy. Analyst, 131, (8), 875-885, 2006. 36. Wishart DS et al, HMDB: the Human Metabolome Database. Nucleic Acids Research, 35, Database issue,
35, D521-6, 2007. 37. Kaddurah-Daouk R, Kristal BS, and Weinshilboum RM: Metabolomics: A global biochemical approach to
drug response and disease, Annu. Rev. Pharmacol. Toxicol, 48, 653-683, 2008 38. http://msi-workgroups.sourceforge.net/ 39. De Vos RC. Moco S. Lommen A. Keurentjes JJ. Bino RJ. Hall RD.: Untargeted large-scale plant
metabolomics using liquid chromatography coupled to mass spectrometry. Nature Protocols, 2(4):778-91, 2007.
40. Rezzi S. Ramadan Z. Fay LB. Kochhar S.: Nutritional metabonomics: applications and perspectives. Journal of Proteome Research. 6(2):513-25, 2007.
41. Jalanko A. Tyynela J. Peltonen L. From genes to systems: new global strategies for the characterization of NCL biology. Biochimica et Biophysica Acta. 1762(10):934-44, 2006.
42. Bylesjo M. Rantalainen M. Nicholson JK. Holmes E. Trygg J.: K-OPLS package: kernel-based orthogonal projections to latent structures for prediction and interpretation in feature space. BMC Bioinformatics. 9:106, 2008.
43. Gomase VS. Tagore S.: Toxicogenomics. Current Drug Metabolism. 9(3):250-4, 2008. 44. Phillips KP. Foster WG: Key developments in endocrine disrupter research and human health. Journal of
Toxicology & Environmental Health Part B: Critical Reviews. 11(3-4):322-44, 2008. 45. Ismail AA and Gill GV: The epidemiology of Type 2 diabetes and its current measurement. Bailliere's Best
Practice and Research in Clinical Endocrinology and Metabolism, 13 (2), p 197-220, 1999. 46. Chen D. and Wang MW : Development and application of rodent models for type 2 diabetes, Diabetes,
Obesity and Metabolism, 7, 307-317, 2005.
Copyright 2009 Ingenuity Systems, Inc. Page 23
47. Sharma, K., McCue, P., and Dunn, S.R.: Diabetic kidney disease in the db/db mouse. Am. J. Physiol. Renal Physiol., 284, 1138-1144, 2003.
48. Clee SM and Attie AD: The genetic landscape of type 2 diabetes in mice, Endocrine Reviews, 28(1), 48-83, 2007.
49. Connor SC, et al. Metabolomics studies of diabetes in the db/db mouse, in preparation, 2008. 50. Connor SC, Gray RA, Hodson, MP, Clayton NM, Haselden IP, Chessell IP and Bountra C: An NMR-based
metabolic profiling study of inflammatory pain using the FCA model, 3(1), 29-39, 2007. 51. Assignment databases: HMDB (www.hmdb.ca), Chenomx NMR Suite v4.0, GSK proprietary database,
Bruker Amix Spectrabase. 52. Cryle MJ, Ortiz de Montellano PR, De Voss JJ: Cyclopropyl containing fatty acids as mechanistic probes for
Cytochromes P450, J. Org. Chem., 70(7), 2455-2469, 2005. 53. Vockley J, and Ensenauer R: Isovaleric Acidemia: New Aspects of Genetic and Phenotypic Heterogeneity,
American Journal of Medical Genetics Part C (Seminars in Medical Genetics), 142C (2), 95-103, 2006. 54. Abdenur JE, Chamoles NA, Guinle AE, Schenone AB and Fuertes ANJ: J. Inher. Metab. Dis. 21, 624-630,
1998. 55. Rashed MS, Ozand PT, Bucknall MP and Little D: Diagnosis of inborn errors of metabolism from blood
spots by acylcarnitines and amino acids profiling using automated electrospray tandem mass spectrometry, Pediatric Research, 38 (3), 1995.
56. Hattori MA, Aquilano DR, Dufau ML: An early steroidogenic defect in hormone-induced Leydig cell desensitization, J. Steroid Biochem. 21 (3), 265-77, 1984.
57. Hall PF: Endocrinology of the Testis. In: Johnson AD, Gomes WR and Vandemark NL (Eds) the Testis. Academic Press, New York p 1-7, 1970.
58. Pitt JJ, Novel Glycine Conjugates in Medium-Chain Acyl-CoA Dehydrogenase Deficiency, J. Inher. Metab. Dis, 16, 392-398, 1993.
59. Costa C, Pupo C, Viscomi G, Catania S, Salemi M, Imperatore C, Modifications in the metabolic pathways of benzene in streptozotocin-induced diabetic rat, Arch Toxicol (1999), 73, 301-306, 1999.
60. Asaoka K, Enzymes that metabolize acyl-coenzyme A in the monkey- their distribution, properties and roles in an alternative pathway for the excretion of nitrogen, In J. Biochem., 23(4), 429-434, 1991.
61. Kanehisa, M., Araki, M., Goto, S., Hattori, M., Hirakawa, M., Itoh, M., Katayama, T., Kawashima, S., Okuda, S., Tokimatsu, T., and Yamanishi, Y.; KEGG for linking genomes to life and the environment. Nucleic Acids Res. 36, D480-D484 (2008).
62. PubChem (National Centre for Biotechnology Information) at www.ncbi.nlm.nih.gov. 63. The CAS REGISTRYSM Database, the source of CAS numbers for chemical entities at www.CAS.org. 64. Kaslauskaite, R and Fogelfield L, Insulin Therapy in type 2 diabetes. Disease-A-Month, 49(6), 377-420,
2003. 65. Duran-Sandoval D, Cariou B, Fruchart JC. Staels B., Potential regulatory role of the Biochimie, 87(1), 93-8,
2005.farnesoid X receptor in the metabolic syndrome. 66. Browlee M. The pathobiology of diabetic complications: a unifying mechanism. Diabetes. 54(6), 1615-25,
2005. 67. Aronson D, Hyperglycaemia and the pathobiology of diabetic complications. Advances in Cardiology, 45,
1-16, 2008. 68. Meller M, Qiu C, Vadachkoria S, Abetew DF, Luthy DA, Williams MA. Changes in placental adipocytokine
gene expression associated with gestational diabetes mellitus. Physiol Res 2006 Jan 01;55(5):501-12. 69. Fromenty B, Robin MA, Igoudjil A, Mansouri A, Pessayre D. The ins and outs of mitochondrial dysfunction
in NASH. Diabetes Metab 2004 Apr 01;30(2):121-38 70. Pengxiang She, Cynthia Van Horn, Tanya Reid, Susan M Hutson, Robert N Cooney and Christopher J Lynch.
Obesity-related elevations in plasma leucine are associated with alterations in enzymes involved in branched chain amino acid metabolism. Am J. Physiol Endocrinol Metabol, 293, 1552-1563. 2007.
71. Herman MA, Peroni OD, Kahn BB. Adipose-specific overexpression of Glut-4 causes hypoglycaemia by altering branched chain amino acid metabolism, Diabetes 55S: A311, 2006.
72. Nadler ST, Stoehr JP, Schueler KI, Tanimoto G, Yandell BS, Attie AD, The expression of adipogenic genes is decreased in obesity and diabetes mellitus. Proc Natl Acad Sci USA, 91, 11371-11376, 2000.
Copyright 2009 Ingenuity Systems, Inc. Page 24
73. Griffin JL. Nicholls AW. Metabolomics as a functional genomic tool for understanding lipid dysfunction in diabetes, obesity and related disorders. Pharmacogenomics. 7(7):1095-107, 2006
74. Brownlee M. The pathobiology of diabetic complications: a unifying mechanism. Diabetes. 54(6):1615-25, 2005 Jun.
75. She P. Van Horn C. Reid T. Hutson SM. Cooney RN. Lynch CJ. Obesity-related elevations in plasma leucine are associated with alterations in enzymes involved in branched-chain amino acid metabolism. American Journal of Physiology - Endocrinology & Metabolism. 293(6):E1552-63, 2007 Dec.
76. Awata T, Neda T, Iizuka H, Kurihara S, Ohkubo T, Takata N, Osaki M, Watanabe M, Nakashima Y, Sawa T, Inukai K, Inoue I, Shibuya M, Mori K, Yoneya S, Katayama S.Endothelial nitric oxide synthase gene is associated with diabetic macular edema in type 2 diabetes. Diabetes Care. 2004 Sep;27(9):2184-90.
77. Wilson ID. Plumb R. Granger J. Major H. Williams R. Lenz EM. Journal HPLC-MS-based methods for the study of metabonomics. Of Chromatography B: Analytical Technologies In The Biomedical & Life Sciences. 817(1):67-76, 2005 Mar 5.


![Review Article …Human Genome Project (HGP) [6, 7] and the concomitant emergence of ‘omics technologies, namely transcriptomics [8, 9], proteomics [10], and metabolomics [11, 12]](https://img.pdfslide.us/doc/110x75/6147fa77a830d0442101c907/review-article-human-genome-project-hgp-6-7-and-the-concomitant-emergence-of.jpg)