Embed Size (px)
Citation preview

IR3.3 v1.0
1
Public Information
INFSO-ICT-248523 BeFEMTO
IR3.3
Promising Interference and Radio Management Techniques for Indoor Standalone Femtocells
Contractual Date of Delivery to the CEC: M24
Actual Date of Delivery to the CEC: M24
Author(s): Antonio de Domenico, Rajarshi Mahapatra, Sylvie Mayrargue, Emilio Calvanese Strinati, Masood Maqbool, Massinissa Lalam, Mehrdad Shariat, Chrysovalantis Kosta, Atta U Quddus, Mehdi Bennis, Carlos H. Lima
Participant(s): CEA, SC, UniS, UOulu
Workpackage: WP3 – Radio Access for Stand-alone Femtocells
Estimated person months:
Security: PU
Nature: R
Version:
Total number of pages: 69
Abstract: This document summarizes the technical contributions carried out by Work Package 3 (WP3) over the course of the second year of the BeFEMTO project. These contributions deal with interference management techniques in the downlink and uplink for indoor standalone femtocells including power control and frequency portioning schemes. In addition, this interim report investigates the impact of MIMO techniques on heterogeneous femto and macro networks performance. At last, calibration results of the partners system level simulation are presented, in the static case (macro and femto) and in the dynamic case (macro), ensuring coherence between partners results.
Keyword list:
Interference Management, Macrocell, OFDMA, Spectrum Sharing, Standalone Femtocell, Power Control, Frequency Portioning, Radio Resource Management

IR3.3 v1.0
2
Public Information
Executive Summary Femtocells deployment represents an answer to the exponentially growing demand in terms of mobile services. Indeed, in addition to bring a better coverage for indoor users, they provide operators with a low cost means to offload traffic from a potentially overloaded macrocell network. However, their massive deployment comes with a number of technical challenges. Notably, the most important and detrimental problem facing femtocell networks is the presence of interference among neighboring femtocell networks, and between the femtocell network and the macrocell network. The Work Package (WP)3 of the BeFEMTO project, studies the means of mitigating this problem in the context of standalone femtocells , as opposed to networked femtocells, which are considered in WP4. This report presents the innovative concepts along with results of the research activities carried out during the second year of the BeFEMTO project within Work Package 3. Femtocells which operate in the same spectrum as macrocell users (MUEs) produce a cross-tier interference which degrades these latter users Quality of Service (QoS). Moreover, neighbour femtocells which belong to the same operators, may interfere with each other. The latter interference is known as co-tier interference. The innovations described in this report focus mostly on cross-tier interference. Several static frequency portioning schemes for the overlay macro network are envisaged and compared w.r.t to their performance in the macro network and in the underlay femto network. Another powerful tool to mitigate co-tier and cross-tier interference is dynamic power control. Various strategies are presented in this document. One of them combines partial spectrum splitting between femtos and macro with a dynamic power control that protects MUEs from femtocells interference. Power control is limited to those femtocells that are the worst interferers towards a given macro cell user. These femtocells are identified via a Self Organized Network (SON) type coordination procedure with the victim MUE. This first strategy aims to protect one given MUE, while the following protect any potentially present MUE. Another strategy takes advantage of the specificities of femtocells communications: they are short range, leading to a high quality downlink signal, and only few UEs locally compete for a large amount of spectrum resource. A novel scheduler allocates each femto-user (FUE) a larger number of spectral resources (Resource Blocks – RBs), with a reduced power per RB. Thus, co-tier as well as cross-tier interference are reduced, while FUE Quality of Service (QoS) is maintained. In the third method, a power control is applied on the downlink of a femto cell in order to maximize the femtocell throughput, while keeping the interference level while keeping the interference level below a certain threshold. In addition, cell edge FUEs use Successive Interference Cancellation (SIC) to cancel out macro cell interference. Another method is similar this time on the uplink, where a macro cell should be protected from interference created by FUEs. A FUE power control scheme is proposed, that relies on minimal coordination from the MeNB to operate. Then, a decision rule is depicted, in which macro users may connect to a nearby femtocell access point rather than the MeNB, basically if it saves energy. SIC is used to allow femto and macro users to share a common channel of the HeNB. Benefits of Multiple Input Multiple Output (MIMO) transmission on the 3GPP LTE performance are demonstrated by simulation.Results show that the BeFEMTO target value of 8bps/Hz is attainable with a 4x4 antenna configuration. Finally, Appendix A presents calibration results of the system level simulators used by each partner, thus enforcing the consistency and coherency of WP3 outputs. Static calibration of macrocell-only results was given in BeFEMTO D2.1 [29]. This appendix extends those results by adding the static calibration of different femtocell models. One dynamic calibration is also performed in a macrocell-only case, validating in particular the spatial channel model used.

IR3.3 v1.0
3
Public Information
Authors
Partner Name Phone / Fax / e-mail
CEA Antonio De Domenico Phone: +33 4 38 78 18 17 e-mail: [email protected] Emilio Calvanese Strinati Phone: +33 4 38 78 17 34 e-mail: [email protected] Rajarshi Mahapatra Phone +33 4 38 78 62 42 e-mail [email protected] Sylvie Mayrargue Phone: +33 4 38 78 62 42 e-mail: [email protected]
Sagemcom Masood Maqbool Phone: +33 1 57 61 13 63 e-mail: [email protected] Massinissa Lalam Phone: +33 1 57 61 13 41 e-mail: [email protected]
University of Oulu Mehdi Bennis Phone: +358 40 8241 742 Fax: +358 8 553 2845 e-mail: [email protected] Carlos H. Lima Phone: +358 40 8241 775 e-mail: [email protected]
University of Surrey Mehrdad Shariat Phone: +44 1483 689330 e-mail: [email protected] Chrysovalantis Kosta Phone: +44 1483 683430 e-mail: [email protected] Atta U. Quddus Phone: +44 1483 683787 Fax: +44 1483 686011 e-mail: [email protected]

IR3.3 v1.0
4
Public Information
Table of Contents
1. Introduction ................................................................................................. 8
2. Interference Management for Indoor Standalone Femtocells............... 10
2.1 Interference avoidance schemes ................................................................................................ 10
2.1.1 Conclusions and future work ............................................................................................ 12
2.2 Statistical Modelling of Macro-Femtocell Coexistence ............................................................ 14
2.2.1 Problem statement............................................................................................................. 14
2.2.2 Network Deployment Model............................................................................................. 14
2.2.3 SON coordination mechanisms......................................................................................... 15
2.2.4 Discovery of victim users.................................................................................................. 15
2.2.5 Statistical modelling of the aggregate CCI........................................................................ 16
2.2.6 Approximating the aggregate CCI at the tagged MUE .....................................................19
2.2.7 Numerical results .............................................................................................................. 20
2.2.8 Conclusions....................................................................................................................... 22
3. Decentralised Protocols for Resource Allocation.................................. 23
3.1 A RRM Scheduling Algorithm for Self-Organizing Femtocells ............................................... 23
3.1.1 System Model ................................................................................................................... 23
3.1.2 Ghost Femtocells: the Proposed Resource Allocation Algorithm..................................... 24
3.1.3 Simulation Results ............................................................................................................ 26
3.1.4 Conclusions and future work ............................................................................................ 28
3.2 RRM in Femtocell Downlink Exploiting Location Information ............................................... 28
3.2.1 System Model and Problem Definition............................................................................. 29
3.2.2 Interference Cartography and its Construction ................................................................. 31
3.2.3 Interference Classification and Dynamic Fractional Frequency Reuse............................. 32
3.2.4 RRM Technique among Femtocell Users for Standalone Femtocell ................................ 33
3.2.5 Simulation Results ............................................................................................................ 34
3.2.6 Conclusion ........................................................................................................................ 35
3.3 Successive Interference Cancellation on the UL of Femtocell Transmission............................ 36
3.3.1 Problem Statement ............................................................................................................ 36
3.3.2 Joint Power Control, Channel Assignment and Handover Mechanism ............................ 37
3.3.3 Successive Interference Cancellation................................................................................ 38
3.3.4 Numerical Results ............................................................................................................. 39
3.3.5 Conclusions....................................................................................................................... 42
4. Performance of Spatial Multiplexing for Heterogeneous Macro/Femto
Network in Sub-urban Environment ........................................................ 43

IR3.3 v1.0
5
Public Information
4.1 Close-Loop Spatial Multiplexing (CLSM)................................................................................ 43
4.2 Interference and Channel Model ............................................................................................... 44
4.2.1 Channel Realization .......................................................................................................... 44
4.2.2 Subcarrier SINR................................................................................................................ 44
4.2.3 Effective SINR.................................................................................................................. 44
4.3 System Model and Simulation Details ...................................................................................... 45
4.4 Analysis of Numerical Results .................................................................................................. 46
4.5 Conclusion................................................................................................................................. 47
5. Conclusion ................................................................................................ 48
6. Appendix A: System Level Calibration ................................................... 49
6.1 Static Calibration ....................................................................................................................... 49
6.1.1 Configuration Parameters.................................................................................................. 49
6.1.2 Methodology ..................................................................................................................... 55
6.1.3 Metrics of interest ............................................................................................................. 56
6.1.4 Results............................................................................................................................... 57
6.1.5 Conclusion ........................................................................................................................ 59
6.2 Dynamic Calibration ................................................................................................................. 60
6.2.1 Additional Configuration Parameters................................................................................ 60
6.2.2 Methodology ..................................................................................................................... 61
6.2.3 Metrics of interest ............................................................................................................. 61
6.2.4 Results............................................................................................................................... 62
6.2.5 Conclusion ........................................................................................................................ 64
7. References................................................................................................. 65

IR3.3 v1.0
6
Public Information
Table of Abbreviations Acronym Meaning 3G 3rd Generation 3GPP 3rd Generation Partnership Project 4G 4th Generation AR Activation Ratio BeFEMTO Broadband Evolved Femtocells BER Bit Error Rate BLER Block Error Rate BS Base Station BW Bandwidth CCI Co-Channel Interference CF Characteristic Function CLSM Closed Loop Spatial Multiplexing CQI Channel Quality indicator CRS Common Reference Symbol CSG Closed Subscriber Group dB Decibel DCI Downlink Control Information DER Dynamic Exclusion Region DFP Dynamic Frequency Planning DL Downlink eICIC enhanced Inter-Cell Interference Coordination eNB evolved Node B E-UTRA Evolved-Universal Terrestrial Radio Access FFR Fractional Frequency Reuse FFT Fast Fourier Transform FR Frequency Reuse FSM Femto-cell Spectrum Management FUE Femtocell User Equipment HeNB Home evolved Node B HetNet Heterogeneous Network IC Interference Cartography ICI Inter Carrier Interference IEEE Institute of Electrical and Electronics Engineers IFR Inverse Frequency Reuse ISD Inter Site Distance KPI Key Performance Indicator LC-RRM Local Cartography RRM LN Log Normal LTE Long-Term Evolution LTE-A Long-Term Evolution Advanced MBS Macro Base Station MCI Maximum Signal to Interference Ratio MCM Measurement Collection Module MIC Mean Instantaneous Capacity MIMO Multiple Input Multiple Output MGF Moment Generating Function MPP Marked Point Process MUE Macrocell User Equipment ML-MIMO Multi-User MIMO OFDM Orthogonal Frequency Division Multiplexing OFDMA Orthogonal Frequency Division Multiple Access PC Power Control PDF Probability Distribution Function PDSCH Physical Downlink Shared Channel

IR3.3 v1.0
7
Public Information
PHY Physical (Layer) PMI Precoding Matrix Indicator QAM Quadrature Amplitude Modulation QoS Quality of Service RB Resource Block REM Radio Environment Map RF Radio Frequency RI Rank Indicator RRM Radio Resource Management RV Random Variable SCME Spatial Channel Model Extended SFR Soft Frequency Reuse SIC Successive Interference Cancellation SINR Signal to Interference-plus-Noise Ratio SIC Successive Interference Cancellation SLN Shifted Log Normal SNR Signal to Noise Ratio SISO Single Input Single Output SON Self Organized Network SU-MIMO Single User MIMO TTI Time Transmit Interval UE User Equipment UL Uplink WiMAX Worldwide interoperability for Microwave Access WP Work Package

IR3.3 v1.0
8
Public Information
1. Introduction The emergence of new data and video services coupled with an increase in the number of user equipments such as smart-phones and tablets, has forced mobile operators to examine new ways for increasing coverage, boosting data rates and lowering capital and operating expenditures (CAPEX and OPEX) of their mobile networks. One approach for improving the poor macrocell indoor coverage and boosting the spectral efficiency has been the utilization of femtocells. The potential cost reduction combined with the prediction market growth make the femtocell concept a lucrative option for mobile operators. Recently, femtocells have been receiving a growing interest from both academia and industry. Femtocells are small cellular base stations which can be deployed in residential, enterprise, or outdoor areas. Femtocells connect several mobile phones to the operator’s network via an existing broadband connection (such as DSL or cable). Among the benefits provided by femtocells include boosting the spectral efficiency of the network, improving the poor macrocell indoor coverage, and offloading the macrocell network. Although femtocells provide several benefits for operators and users alike, their massive deployment comes with a number of technical challenges. Notably, the most important and detrimental problem facing femtocell networks is the presence of interference among neighboring femtocell networks, and between the femtocell network and the macrocell network. This report presents the innovative concepts along with results of the research activities carried out during the second year of the BeFEMTO project within Work Package 3. This document consists of four sections. An introduction is given in Section 1 summarizing the challenges addressed in this interim report along with different contributions. In Section 2, interference management approaches between unplanned indoor standalone femtocells and overlay macrocells are explored. The first method investigates the performance of different static interference avoidance scheme in a heterogeneous network comprising macro and femtocells: Soft Frequency Reuse (SFR), Fractional Frequency Reuse (FFR) and Inverse Frequency Reuse (IFR) are considered and compared with Frequency Reuse 1 (FR1) and Frequency Reuse 3 (FR3) as the main benchmarking schemes. In the second method, tools from stochastic geometry are used to characterize aggregate interference from femtocells towards a macro user (MUE). Then various strategies of power control and/or spectrum reuse are compared w.r.t. their impact on the MUE. Section 3 deals with the impact of decentralized approaches for radio resource allocation. First, a novel scheduler exploiting the wireless spectrum in a two tier-network is first proposed and evaluated showing its effectiveness in limiting interference to neighbour end-users in the downlink.This scheduler takes advantage of the specificities of femtocells communications: they are short range, leading to a high quality downlink signal, and only few UEs locally compete for a large amount of spectrum resource. The scheduler reduces the downlink transmission power per Resource Blocks (RB) that is required to obtain a target bit rate in femtocells and subsequently decrease the overall generated interference. In the second algorithm, a Radio Environment map (REM) is used as a Radio Resource Management (RRM) tool for the downlink of a femtocell: the Home evolved NodeB (HeNB) selects RBs, so as to satisfy femtocell user (FUE) QoS while protecting MUEs in its vicinity by keeping the interference level below a threshold. Cell-edge users are allocated RBs in "strong interference", i.e. interference caused by the MeNB can be cancelled out by Successive Interference Cancellation (SIC). The third algorithm aims to solve the dual problem of the previous one: this time the uplink (UL) of a macrocell should be protected from FUEs interference. A FUE power control scheme is proposed, that relies on minimal coordination from the MeNB to operate. Then, a decision rule is depicted, in which macro users connect to a nearby femtocell access point rather than the MeNB. SIC is used to allow femto and macro users to share a common channel of the HeNB. Section 4 presents the benefit of Multiple Input Multiple Output (MIMO) transmission on the 3GPP LTE performance. The MIMO scheme that is considered is Closed Loop Spatial Multiplexing (CLSM). Four different antenna configurations are compared: 1x1, 2x2, 4x2 and 4x4. Results show that the target value of 8bps/Hz is attainable with 4x4 antenna configuration. Finally, Appendix A presents calibration results of the system level simulators used by each partner, thus enforcing the consistency and coherency of WP3 outputs, Static calibration of macrocell-only results was given in BeFEMTO D2.1 [29]. This appendix extends those results by adding the static calibration of

IR3.3 v1.0
9
Public Information
different femtocell models. One dynamic calibration is also performed in a macrocell-only case, validating in particular the spatial channel model used.

IR3.3 v1.0
10
Public Information
2. Interference Management for Indoor Standalone Femtocells In order to successfully deploy the femtocell architecture, several challenges need to be addressed. Interference management is one of these major issues: femtocells which operate in the same spectrum as macrocell users produce a cross-tier interference which degrades these latter users Quality of Service (QoS). Moreover, neighbour femtocells which belong to the same operators, may interfere with each other. The latter interference is known as co-tier interference. In order to avoid cross-tier interference operators may (statically or dynamically) allocate different parts of the available spectral resource to macrocell and femtocell users. However, licensed spectrum is a scarce resource, and this solution is far from the operators spectral reuse targets. In co-channel deployments, HeNBs should dynamically select transmission power and spectral resource in order to mitigate both co-tier and cross-tier interferences. On the other hand, the increasing number of to-be deployed femtocells (150 millions of worldwide customers are estimated in 2012 [32]), coupled with their unplanned roll-outs, makes resource allocation a more challenging issue In this section, mainly cross-tier interference is addressed, first in section 2.1 with a static combination of frequency and power reuse, then in section 2.2 with various dynamic schemes of power control for the HeNBs, thus protecting neighbouring MUE QoS.
2.1 Interference avoidance schemes
In this section, we investigate the performance of different static interference avoidance schemes in a heterogeneous network comprising macro and femtocells. In particular, we evaluate the effect of two main system parameters, i.e. the activation ratio (AR) of the femtocells and inter-side distance (ISD) in macrocell network on the overall performance of the system. In this study, 5x5 grid has been used to model the femtocell. Here, we use cell throughput and 10th percentile of user throughput (reflecting deprived users’ performance) as the main performance metrics. Different static schemes are considered in this scenario including: Soft Frequency Reuse (SFR), Fractional Frequency Reuse (FFR) and Inverse Frequency Reuse (IFR). The aforementioned static schemes are compared with Frequency Reuse 1 (FR1) and Frequency Reuse 3 (FR3) as the main benchmarking schemes. As a brief recap, in SFR, cell space is divided into inner and outer regions. BS transmits with a greater power in the outer region as compared to the inner region. The available bandwidth in SFR is divided between the inner and outer regions in a way that bandwidth parts used in the outer regions of adjacent cells are orthogonal as shown in Figure 2-1 (right). However, there is no restriction that bandwidth part used in the outer region of a cell could not be reused in the center region of the adjacent cell. Like SFR, cell space in FFR is also divided into two regions: inner and outer. The available bandwidth is allocated to inner and outer regions in such a way that the former incorporates frequency reuse 1 while the latter applies frequency reuse 3 as can be seen in Figure 2-1 (left). As a result, this scheme does not require any power coordination across adjacent cells (sectors).

IR3.3 v1.0
11
Public Information
F0F0
F0 F0 F1F1
F0F0F2F2
F0F0F3F3
Frequency
highP a P= ⋅3
2low
aP P
−= ⋅
Po
wer
F3F3F0F0
F2F2F0F0
F1F1F0F0
Pow
er
Frequency
3highP P= ⋅
lowP P=
.c e
BEff FR
B B=
+3
.2
high
low
P aEff FR
P a
−= =
eB B
3c
BB =
cB
F3F3
F2F2
Cell Group
1
Cell Group
2
Cell Group
3
BS
F0F0
F0F0
F1F1
B
Tri-sectorized celllayout
Selective frequency re-use technique Selective power re-use technique
.high lowor P P P Eff FR= = ×
1 . 3Eff FR< <
Cell Group
1
Cell Group
3
1 3a< <
F0F0F0F0
F0 F0 F1F1
F0F0F2F2
F0F0F3F3
Frequency
highP a P= ⋅3
2low
aP P
−= ⋅
Po
wer
F3F3F0F0
F2F2F0F0
F1F1F0F0
Pow
er
Frequency
3highP P= ⋅
lowP P=
.c e
BEff FR
B B=
+3
.2
high
low
P aEff FR
P a
−= =
eB B
3c
BB =
cB
F3F3
F2F2
Cell Group
1
Cell Group
2
Cell Group
3
BSBS
F0F0
F0F0
F1F1
B
Tri-sectorized celllayout
Selective frequency re-use technique Selective power re-use technique
.high lowor P P P Eff FR= = ×
1 . 3Eff FR< <
Cell Group
1
Cell Group
3
1 3a< <
Figure 2-1: Example of FFR (left) and SFR (right) techniques
Invert Frequency Reuse (IFR) was originally reported in [18] for tri-sectorized sites and in [19] for six-sectorized sites. This algorithm can be seen as a combination of frequency reuse and power reuse. Compared with other reuse techniques this scheme focuses only on the strongest interference from the neighboring cells. The key idea is to increase the channel quality in cell borders by restricting the dominant interferer in each sub-cell (out of six) in a distributed way. Consequently, all surrounding sectors are to reduce their corresponding power (Prestr) on a certain frequency group leading to a better radio condition in all overlapping cell areas. To compensate the power reduction, the remaining power is distributed on non-restricted bandwidth to the level of Pnorm. This idea in tri-sectorized sites is exemplified in Figure 2-2 with seven adjacent sub-cells where the centre one forms the sector of interest.
…………
__F0F0
F0F0 F1F1 F2F2 F3F3 F4F4 F5F5 F6F6
7.
6Eff FR
β−=
__F1F1
__F6F6
Po
wer
Frequency
__F5F5
__F3F3
__F6F6
__F0F0
F0
F0F0
F0F0
F0F0
F0F0
F0
BSBSBSBS
BSBSBSBS
__F2F2
__F1F1
__F4F4
F3F3
F2F2
F6F6
F4F4
F5
F1
Cell Group
1
Cell Group
2
Cell Group
7
normP
restrP
Invert selective frequency/power re-use technique Example of this re-use technique among four tri-sectorized siteswith the center sector as the sector of interest
1 . 7 / 6Eff FR< <76norm
PP
β− ⋅=restrP Pβ= ⋅
F0F0 F1F1 F2F2 F3F3 F4F4 F5F5 F6F6
F0F0 F1F1 F2F2 F3F3 F4F4 F5F5 F6F6
…………
__F0F0
F0F0 F1F1 F2F2 F3F3 F4F4 F5F5 F6F6F0F0 F1F1 F2F2 F3F3 F4F4 F5F5 F6F6
7.
6Eff FR
β−=
__F1F1
__F6F6
Po
wer
Frequency
__F5F5
__F3F3
__F6F6
__F0F0
F0
F0F0
F0F0
F0F0
F0F0
F0
BSBSBSBS
BSBSBSBS
__F2F2
__F1F1
__F4F4
F3F3
F2F2
F6F6
F4F4
F5
F1
__F5F5__
F5F5__
F3F3__
F3F3
__F6F6__
F6F6
__F0F0
F0
F0F0
F0F0
F0F0
F0F0
F0
BSBSBSBSBSBSBSBS
BSBSBSBSBSBSBSBS
__F2F2
__F1F1
__F4F4
F3F3
F2F2
F6F6
F4F4
F5
F1
Cell Group
1
Cell Group
2
Cell Group
7
normP
restrP
Invert selective frequency/power re-use technique Example of this re-use technique among four tri-sectorized siteswith the center sector as the sector of interest
1 . 7 / 6Eff FR< <76norm
PP
β− ⋅=restrP Pβ= ⋅
F0F0 F1F1 F2F2 F3F3 F4F4 F5F5 F6F6F0F0 F1F1 F2F2 F3F3 F4F4 F5F5 F6F6
F0F0 F1F1 F2F2 F3F3 F4F4 F5F5 F6F6F0F0 F1F1 F2F2 F3F3 F4F4 F5F5 F6F6
Figure 2-2: Example of IFR
To evaluate the performance of different static algorithms, we initially model a system level simulation of 2-tier hexagonal layout for macrocells comprising tri-Sectorized eNodeBs with 500m inter site distance (ISD). The statistics are collected for a total of 100 snapshots assuming full buffer scenario where in each snapshot, a total of 10 UEs are uniformly dropped per cell. The femto blocks are deployed based on 5x5 grid model where different activation ratios are considered per grid at this stage.

IR3.3 v1.0
12
Public Information
Figure 2-3 and Figure 2-4 depict the performance of macrocell and femtocell, respectively in presence of static avoidance schemes as the AR (for femtocells) gradually increases from 20% to 60%. As can be seen, in case of femto network, the total cell throughput as well as 10th percentile user throughput is severely reduced due to the significant increase in co-tier interference where the 10th percentile user throughput reaches zero for ARs beyond 60%. However, the macrocell performance is not affected as much due to little impact on cross-tier interference. It is worth noting that the number of femto grids per each cell is fixed (equal to one) across all ARs in this scenario. Comparing different schemes in low AR regime, the IFR performs better in macrocell due to a better utilization of radio resources in this hybrid scheme whereas the FR3 scheme outperforms the rest for femtocell network. The superior performance of FR3 for femtocells is attributed to suppression of strong cross-tier interference from other neighbouring macro cells on part of spectrum per cell. However, in high levels of AR, all schemes perform similarly for the femtocell network and can not mitigate the impact of co-tier interference. As a result, more dynamic schemes are to be used along static schemes to mitigate the effect of co-tier interference in dense femto scenarios. Figure 2-5 and Figure 2-6 show the overall performance of system as the ISD of macrocell is reduced from 500 m to 200 m. The AR is set to 50% across all cases. In this scenario, changing the ISD affects both co-tier and cross tier interference as not only the femto deployment but also the macro deployment becomes denser. Therefore, the total cell throughput along with 10th percentile user throughput is reduced across both networks. Again, IFR scheme outperforms the rest in macrocell network while benchmarking FR3 leads in femtocell network.
2.1.1 Conclusions and future work In this section, we evaluated the impact of some system parameters on the overall performance of different static interference avoidance schemes where IFR and FR3 outperformed the other schemes for macro and femto networks in different cases, respectively. In future, more dynamic algorithms are studied to identify feasible and efficient trade-offs between performance gain versus complexity and signalling.
250 300 350 400 450 500 5508
9
10
11
12
13
14
15
16
17
FR1
FR3
SFR
FFR
IFR
FR1
FR3
SFR
FFR
IFRFR1
FR3
SFR
FFR
IFR
10th-ile user throughput (Kbps)
Ave
rage
cel
l thr
ough
put
(Mbp
s)
Performance of Macrocell Network
eNB FR1 A-20eNB FR3 A-20
eNB SFR A-20
eNB FFR A-20
eNB IFR A-20eNB FR1 A-40
eNB FR3 A-40
eNB SFR A-40
eNB FFR A-40
eNB IFR A-40eNB FR1 A-60
eNB FR3 A-60
eNB SFR A-60
eNB FFR A-60eNB IFR A-60
Figure 2-3: Performance of macrocell network in different ARs for femtocell

IR3.3 v1.0
13
Public Information
-20 0 20 40 60 80 100 120 140 1604
5
6
7
8
9
10
11
12
13
FR1
FR3
SFR FFRIFR
FR1
FR3
SFRFFRIFR
FR1FR3SFRFFRIFR
10th-ile user throughput (Kbps)
Ave
rage
cel
l thr
ough
put
(Mbp
s)
Performance of Femtocell Network
eNB FR1 A-20eNB FR3 A-20
eNB SFR A-20
eNB FFR A-20
eNB IFR A-20eNB FR1 A-40
eNB FR3 A-40
eNB SFR A-40
eNB FFR A-40
eNB IFR A-40eNB FR1 A-60
eNB FR3 A-60
eNB SFR A-60
eNB FFR A-60eNB IFR A-60
Figure 2-4: Performance of femtocell network in different ARs of itself
200 250 300 350 400 450 500 550 6008
9
10
11
12
13
14
15
16
17
FR1
FR3
SFR
FFR
IFRFR1
FR3
SFR
FFR
IFR
FR1
FR3
SFR
FFR
IFR
10th-ile user throughput (Kbps)
Ave
rage
cel
l thr
ough
put
(Mbp
s)
Performance of Macrocell Network
eNB FR1 D-500eNB FR3 D-500
eNB SFR D-500
eNB FFR D-500
eNB IFR D-500eNB FR1 D-300
eNB FR3 D-300
eNB SFR D-300
eNB FFR D-300
eNB IFR D-300eNB FR1 D-200
eNB FR3 D-200
eNB SFR D-200
eNB FFR D-200eNB IFR D-200
Figure 2-5: Performance of macrocell network in different ISD for macrocell

IR3.3 v1.0
14
Public Information
-5 -4 -3 -2 -1 0 1 2 3 4 54
4.5
5
5.5
6
6.5
7
7.5
8
8.5
FR1
FR3
SFRFFRIFR
FR1
FR3
SFRFFRIFR
FR1
FR3
SFRFFRIFR
10th-ile user throughput (Kbps)
Ave
rage
cel
l thr
ough
put
(Mbp
s)
Performance of Femtocell Network with FR1
eNB FR1 D-500eNB FR3 D-500
eNB SFR D-500
eNB FFR D-500
eNB IFR D-500eNB FR1 D-300
eNB FR3 D-300
eNB SFR D-300
eNB FFR D-300
eNB IFR D-300eNB FR1 D-200
eNB FR3 D-200
eNB SFR D-200
eNB FFR D-200eNB IFR D-200
Figure 2-6: Performance of femtocell network in different ISD for macrocell
2.2 Statistical Modelling of Macro-Femtocell Coexistence
2.2.1 Problem statement We investigate coordination mechanisms for controlling the co-channel interference generated by standalone femtocells in two-tier coexistence scenarios consisting of macrocells underlaid with femtocells. The rationale for employing such mechanisms is to opportunistically reuse resources without compromising ongoing transmissions on overlaid macrocells, while still guaranteeing Quality of Service in both tiers. Stochastic geometry is used to model network deployments, while the cumulants concept is utilized to characterize the probability distribution of the aggregate interference at the tagged receiver. To conduct our studies, we consider a shadowed fading channel model consisting of lognormal (LN) shadowing and Nakagami fading. In addition, various network algorithms, such as power control and frequency (re)allocation, are incorporated into the analytical framework. We then evaluate the performance of the proposed solutions in terms of outage probability and average spectral efficiency with respect to the tagged receiver.
2.2.2 Network Deployment Model We assess the DL of two-tier networks, wherein Macro Base Stations (MBSs) are underlaid with standalone HeNBs in closed access mode. The underlaid tier is composed of HeNBs uniformly scattered over the network deployment area, while we focus on a single reference eNB to address the overlaid tier. Each femtocell schedules a random FUE in every transmission interval, whereas the serving macrocell schedules a MUE during the same time – we assume that only one MUE is active per macrocell per transmission interval. Active femtocells constitute a homogeneous Poisson Point Process (PPP) Φ with densityλ . Then, the number of active femtocells in an arbitrary region R of area A is a Poisson Random Variable (RV) with parameterAλ . We assume that the fading effect as a random mark associated with each point of Φ . By virtue of the Marking theorem[4], the resulting process corresponds to a Marked
Point Process (MPP) with intensity )(xf Xλ . A MPP ~
Φ whose points belong to the stationary point
process Φ , is defined as: Φ∈=Φ δδ );,(~
x where δ is an element of the original PPP Φ .

IR3.3 v1.0
15
Public Information
Figure 2-7: The dynamic partial co-channel arrangement. In the priority part, MUEs have precedence over femtocells, whereas in the shared part both tiers transmit with equal priority
The 3GPP standardization body defines in [3] the partial co-channel configuration to accommodate two-tier networks operating in the Frequency Division Duplexing (FDD) mode whereby the available spectrum is divided into clear (”priority”) and shared parts as illustrated in Figure 2-7. By this configuration, the macrocell tier can operate on both parts, whereas the frequencies that standalone femtocells can use are restricted to shared part only. Herein, we introduce a dynamic partial co-channel implementation which also splits the spectrum into two parts, but instead of preventing femtocells from transmitting in the clear part, assigns distinct priorities to potential transmitters such that the macrocell tier has always precedence over HeNBs. In other words, to improve the frequency reuse, while still protecting the macrocell tier, the underlaid femtocells can operate in the clear part provided that no MUE is detected in their vicinity. Hereafter, to better reflect the macrocell precedence over femtocells in the clear part, we rename it as the priority part. In our investigations, the interfered (“tagged”) MUE operates in this priority part and sends a beacon signal when experiencing high interference. Regular reservation busy tones are used to dynamically allocate one resource block in each consecutive frame as long as previous packet is successfully received and the intended transmitter has still data to send. Regular busy tones also called busy bursts have been studied in a number of works such as in [28]. During the network setup, it is assumed that HeNBs access the priority part with probabilityϑ , and the shared part with probability ϑ−1 .
2.2.3 SON coordination mechanisms We discuss the SON strategies that allow femtocells to coordinate and mitigate interference. To set off the mechanism, we consider a triggering criterion based on the co-channel carrier receiver signal strength indicator (RSSI) measurement type: only if sensing the aggregate co-channel interference (CCI) above a predefined threshold, the victim MUE issues an in-band requesting signal to advertise its presence to surrounding HeNBs. Notice that to analyze the system performance it is sufficient to assume that the coordination procedure has been triggered by the tagged receiver and in order to maintain the analysis simple we do not implement that mechanism. To achieve that, the victim MUEs momentarily suspend their reception and transmit a requesting signal that surrounding interferers detect. Note that alternative performance indicators such as packet loss and packet delay are equally applicable as triggering criteria for the coordination mechanisms. By detecting the victim user’s request, interfering HeNBs carry out procedures to manage the CCI in a distributed manner, and as a result, they adjust their resource allocation.
2.2.4 Discovery of victim users The discovery of victim users plays a crucial role in the coordination procedures, so that interfering HeNBs coordinate only if they sense the requesting signal of the victim receiver. For a given coordination threshold, the victim MUE controls its reference signal transmit power to keep the coordination range small in order to only coordinate the set of dominant interferers, while still allowing interfering femtocells that are located farther away to reuse the spectrum. We note that the victim user transmits the requesting signal for triggering the coordination mechanism and payload over the same radio channel (in-band signaling). The event that interfering femtocells detect the requesting signal above the predefined
coordination threshold thρ is formulated as follows, thii xr ξα ≥− where α is the path loss exponent, ri

IR3.3 v1.0
16
Public Information
the distance between the victim MUE and the i-th femtocell, xi a scaling factor, reqthth p/ρζ = and
reqp is the transmit power of the requesting signal.
Based on the received power level of the requesting signal and a coordination threshold, femtocells independently split into two distinct coordinating groups, where each group can take distinct and independent actions to reduce the CCI. By coordination, it is always meant self-organization upon overhearing the MUE beacon.. It is also worth noting that any HeNB that has already triggered the coordination procedure ignores further requests that may occur while transactions related to the first request are still ongoing. There is no loss of generality in assuming the macrocell users (MUEs) that carry out the coordination procedures are in the priority part. The following indicator function,
≥=
−−
otherwise
xrifxr th
0
,1)(1
ξαα (2-1)
defines the first coordination region, which is denoted by 1R , and is composed of HeNBs that do detect
the victim receiver in their vicinity. Femtocells within this region constitute a MPP denoted by
≥Φ∈=Φ −
thp xrx ξδ ε|),(~
1,
~
. Similarly, femtocells in 2R , which do not detect the victim MUE,
form a process
<Φ∈=Φ −
thp xrx ξδ ε|),(~
2,
~
. Notice that the coordination regions1R and 2R are
disjoint and statistically independent by construction, therefore it follows immediately from the
Superposition theorem that 2,
~
1,
~~
ppp Φ∪Φ=Φ where p
~
Φ is the process that represents the whole
observation region.
2.2.5 Statistical modelling of the aggregate CCI We introduce an analytical framework to analyze the aggregate CCI, and to assess how the proposed coordination mechanisms perform in the two-tier networks under study. Stochastic geometry is used to model the network deployments and the cumulants concept is used to recover the distribution of the aggregate CCI [1][2] perceived by tagged receiver. In the context of pure cognitive networks, the cumulants approach is introduced in [1], and is recently revisited in [2]. To establish this analytical framework, we begin by applying Campbell’s theorem [1] to determine the Characteristic Function (CF)
of the distribution of the aggregate interference for the MPP ~Φ . In view of this, the aggregate
interference is computed as viewed by a tagged MUE located at the origin of the coordinates system. For the network configuration introduced the CF of the aggregated interference is
jwII eEw =Ψ )( (2-2)
where ∑Φ∈
=~
,
i
irpI corresponds to the total interference from the underlay femtocell tier. The
corresponding nth cumulant is obtained as follows,
0
)(ln1
=
Ψ
∂∂=
w
In
n
nn wxj
κ (2-3)
where 1−=j . The aggregate CCI is then approximated using equivalent LN and shifted log-normal
(SLN) distributions. The SLN approximation is motivated by the fact that the PDF of the aggregate interference is positively skewed. The PDF of an SLN RV Z is given by,
δπσσ
σµσ
>−
=−−−
zez
zfz
Z2
2
2
)log(
2)(
1)( (2-4)

IR3.3 v1.0
17
Public Information
whereδ is a shifting parameter, µ is the mean and σ is the standard deviation of the parameterized
Normal distribution. The PDF parameters are computed as follows
,1
,)1(
log2
1
,log
21
2
2
−−=
−=
=
τκ
κδ
ττκ
µ
τσ
(2-5)
where
2/32
3
)(κκς = ,
21
2ςν += and 1)1()1( 3/123/12 −−−+−+= νννντ
Hereafter, this analytical framework is applied to model various macro-to-femtocell coexistence scenarios and evaluate their system performance. Further, we discuss functionalities employed by HeNB to autonomously adjust their utilization of radio resources in each of those coexistence scenarios.
2.2.5.1 Full interference scenario
In this scenario, active femtocells transmit with the same fixed power levelp . This configuration
corresponds to the worst case scenario in our investigations. We apply Campbell’s theorem to determine
the distribution of the aggregate interference with respect to the MPP ~
Φ . The CF of the aggregate CCI
perceived by a tagged MUE at the origin is derived as
rdrdxxfxjwprw XRR
XI
M
m)()1)exp(2exp)( λπ α
−=Ψ ∫∫
− (2-6)
after which we write the nth cumulant as:
)()(
2
2
)(2
22
1
nX
nM
nm
n
XRR
nnn
Xn
xERRn
p
drdxxfxrpM
m
αα
α
αλπ
λπκ
−−
−
−−
=
= ∫∫
(2-7)
where )( nX xE yields the nth cumulant of the RV X corresponding to the channel fading.
2.2.5.2 Full interference with power control (PC)
In this uncoordinated scenario, femtocells perform PC so as to compensate the desired users’ channel attenuations. We assume a fixed number of FUEs uniformly distributed within each femtocell transmission range. Further, a random user is selected for transmission every transmission interval. In that case, the CF assumes the following form
rdrdxdppfxfxjwprw PXRR
XI
M
m)()()1)exp(2exp)( λπ α
−=Ψ ∫∫
− (2-8)
where )( pfP is the PDF of the distribution of the transmit power of interfering femtocells. The resulting
nth cumulant for this configuration is,
)()(
2
)(2
)(2
22
1
nX
nM
nm
nP
XRR
nnn
Xn
xERRn
pE
drdxxfxrpM
m
αα
α
αλπ
λπκ
−−
−
−−
=
= ∫∫
(2-9
where )( nP pE is the nth moment of the distribution of HeNBs’ transmit power. Considering that at each
transmission interval HeNBs schedule a random FUE within their coverage, the nth moment of the distribution of femtocells’ transmit power is

IR3.3 v1.0
18
Public Information
α
β αα
n
dd
ddpE
nm
nM
mM
nn
P +−
×−
=++
2
2)(
22
22 (2-10)
where α
β/1)(
pdM = defines HeNBs’ transmission range, 1=md m is the minimum separation distance
between FUEs and their serving femtocells and β is the minimum power level of the received signal
2.2.5.3 Opportunistic power control with discrete levels
Herein, after hearing the tagged receiver’s beacon, femtocells adjust their power based on their relative proximity to a tagged receiver. As a consequence, the aggregate CCI is reduced by simply limiting the power levels that coordinating femtocells can achieve. With discrete power levels, HeNBs need less signaling exchange, though link quality of already connected users might be degraded. As explained above, it is assumed that two regions are dynamically established around a tagged MUE based on the strength of its requesting signal and the coordinating threshold. Because of that, those HeNBs belonging
to R1 reduce their transmit power to a level pp <' , while femtocells in 2R , which have not sensed a
victim user, maintain the same transmit power p . After incorporating the concept of coordinating
regions and discrete power levels into the mathematical framework, the resulting characteristic functions for each one of the coordinating regions are derived in the following sections. In the first coordinating region femtocells adjust their transmit power to a predefined value (p -3dB) in
order to reduce the aggregate CCI at the requesting user. Therefore, we can write the CF of the CCI
generated by femtocells in 1R as follows,
rdrdxxrxfxrjwpw thXRR
XI
M
m)(1)()1)'exp(2exp)(
~ρλπ αα >
−=Ψ −−
∫∫ (2-11)
and the nth cumulant is,
∫ ∫
∫ ∫
−
∞ − +=
~
~
/1~
~
)/( 1
1
)()'(2
)()'(2
M
m
th
M
M
drdxxfxrp
drdxxfxrp
xRm X
nnn
RRm X
nnnn
ρ
ρ
ρ α
ρ
α
αλπ
λπκ
(2-12)
where αρρ mthm R~~
= and αρρ MthM R~~
=
In the second coordinating region, HeNBs actually do not detect the requesting user and hence keep
transmitting at the normal power levels (p in dBm). The CF of interfering femtocells in2R is expressed
as
rdrdxxrxfxrjwpw thX
R
RX
I
M
m
)(1)()1)'exp(2exp)(~
ρλπ αα <
−=Ψ −−∫∫ (2-13)
The corresponding nth cumulant is given by:
∫ ∫
∫ ∫
−
− +=
~
~/1
~
~
)/(
1
0
1
)()(2
)()(2
M
m
M
th
M M
drdxxfxrp
drdxxfxrp
R
xX
nnn
RRm X
nnnn
ρ
ρ ρ
α
ρ α
αλπ
λπκ
(2-14)
Finally, since both regions are independently marked, the resulting process in each region is also independent and still Poisson. Therefore, the additivity property of cumulants is respected, i.e.

IR3.3 v1.0
19
Public Information
)()()( 2
~
1
~
2
~
1
~
Φ+Φ=Φ+Φ nnn κκκ (2-15)
2.2.5.4 Dynamic exclusion regions (DER)
This strategy makes use of spectrum (re)allocation to reduce interference. After coordinating, HeNBs free the priority part altogether. The exclusion regions coverage are dynamically formed around a victim user and controlled by both the power strength of the requesting signal and the coordinating threshold. In the first coordination region and in accordance with this opportunistic strategy for spectrum usage, femtocells that have detected a victim user leave all frequency bands in the priority part currently assigned to the
tagged receiver. Therefore, after concluding the coordination procedure, femtocells in1R do not
contribute to the aggregate CCI experienced by the tagged receiver for the next resource block allocation. As a result, aggregate interference at the tagged receiver is generated only by remaining femtocells that do not detect the presence of a requesting user, since they belong to the second coordinating region.: As a
consequence, for a tagged MUE at the origin, the CF of the interference generated by femtocells in 2R is
computed and its corresponding cumulants. With this specific configuration, only HeNBs in2R
contribute to the total interference at the tagged receiver, since femtocells in 1R switch frequencies to
non-overlapping allocations. For that reason, the nth cumulant of the aggregate interference becomes
)()( 2
~
2
~
1
~
Φ=Φ+Φ nn κκ
2.2.5.5 Dynamic exclusion regions with PC
This solution combines the benefits of PC with the interference avoidance provided by DER. Then, femtocells located inside the DER switch to non-overlapping allocation, while remaining interferers transmit at power levels that are just enough to reach their desired FUE. Since this strategy relies on DERs to coordinate, femtocells in the first region do not contribute to the aggregate interference. Femtocells in the second coordinating region do not detect a victim user and only resort to PC to limit the interference they generate. We can thus write the CF for this coordinated scenario as follows,
rdrdxxrpfxfxrjwpw thPXRR
X
ppI
M
m
M
m)(1)()()1)'exp(2exp)(
~ρλπ αα >
−=Ψ −−
∫∫ ∫ (2-16)
The nth cumulant can be found in [4]. With this specific configuration, only HeNBs in 2R contribute to
the total interference at the tagged receiver, since femtocells in 1R switch frequencies to non-overlapping
allocations. For that reason, the nth cumulant of the aggregate interference becomes
)()( 2
~
2
~
1
~
Φ=Φ+Φ nn κκ
2.2.6 Approximating the aggregate CCI at the tagged MUE Figure 2-8 compares the complementary CDF of the CCI from Monte Carlo simulations with that from the LN and SLN approximations. In this example, an annulus observation region is defined around the
tagged receiver with mRm 1= and mRM 100= . Additionally, we set a high density of interferers with
1.0=λ HeNB/m2. The radio channel is affected by path loss with 3=α and LN shadowing with
6=dBσ dB. In the full interference case, all HeNBs transmit at fixed power level 10=p dBm. In the
discrete PC case with fixed levels, femtocells dwelling in the first coordination region transmit with 6' −= pp dB. To simplify computations, we consider that transmissions are affected by LN shadowing
wherein )2
1exp()( 22σnxE nX = . As can be seen from Figure 2-8, both LN and SLN approximations
match quite well with simulation results. PC indeed provides gains, because less power is radiated, even in uncoordinated scenarios where femtocells do not cooperate with each other. By using discrete power levels, dominant interferers lower their radiated power resulting in further aggregated interference reduction. Self-organization procedures carried out by femtocellsare also depicted in Figure 2-8, in which
a coordination threshold 40−=thρ dBm and an MUE requesting power 0=reqp dBm are used.
Comparing the aggregate CCI of uncoordinated and coordinated scenarios, we observe that the main

IR3.3 v1.0
20
Public Information
benefit of coordinating femtocells comes from avoiding dominant nearby interferers. Likewise the uncoordinated scenario, it is possible to achieve even greater gains by employing PC in conjunction with DERs in the coordinated deployments.
Figure 2-8: CCDF of the aggregate CCI experienced by the tagged MUE.
2.2.7 Numerical results The analytical framework previously established is used to assess the benefits of coordinating stand-alone femtocells. We evaluate the performance in terms of outage probability for increasing density of interfering femtocells. The coordination mechanisms are evaluated for the duration of a resource block allocation (transmission interval). The probability of being in outage is defined as )Pr( thγ<Γ where Γ is
the perceived Signal-to-Interference plus Noise Ratio (SINR) at a tagged receiver and thγ is the detection
threshold. The SINR distribution is given by the quotient of two independent log-normal RVs,
namely, 00
YeZ = , which is the power received from the tagged transmitter, and YeZ = is an equivalent
log-normal RV approximating the aggregate CCI at the tagged receiver.
Hence, ),(~ 2200 YYYYN σσµµ +−Γ in the logarithmic scale. We are aware that in an actual deployments a
victim MUE might be subject to less severe interference (lower number of surrounding femtocells), though the density of interfering HeNB is kept high to highlight gains achieved by the proposed coordination mechanisms. Figure 2-9 shows the outage probability for increasing r0–separation distance between a tagged receiver and its serving eNB. The QoS experienced by a tagged MUE significantly degrades by considering its serving MeNB increasingly farther. In the uncoordinated scenarios, PC has a pivotal role in maintaining interference at tractable levels even in high density deployments. For instance, a tagged user located 60 meters away from its serving eNB undergoes an improvement of nearly 200% on its outage probability when interfering HeNBs employ PC. By employing coordination procedures even greater gains are attained, though for the discrete PC strategy one has still to set a optimum transmit power so as to reach a trade-off between spectrum efficiency and remaining interference. For example, discrete PC with -6dB outperforms the standard PC, whereas with 6dB reduction it does not.

IR3.3 v1.0
21
Public Information
Figure 2-9: Outage probability experienced by a tagged MUE for increasing separation distances
between serving eNB ( thγ =0dB)
Yet an MUE benefit most from coordinating through DER, because dominant interferers that detected a requesting message switch to non-overlapping resource allocations. And DER with PC further improves
QoS of a victim user, since the aggregated contribution of femtocells in 2R is reduced. Figure 2-10 also
allows us to assess the performance of the coordination mechanisms in terms of the outage probability at the tagged MUE, but now regarding an increasing density of interfering femtocells. When the density of interfering femtocells within the observation region is increased, the aggregate CCI experienced by a victim user also increases, which confirms the cumulant formulations wherein the nth cumulant and density of interferers vary directly. Owing to guard zones established around victim users, DER-based solutions are less sensitive to higher densities and renders greater gains.

IR3.3 v1.0
22
Public Information
Figure 2-10: Outage probability experienced by a tagged MUE for increasing separation distances
between serving eNB ( 0r =10m, thγ =0dB)
2.2.8 Conclusions In this section, we have modelled the coexistence between macro and femtocell tiers using tools from stochastic geometry. Self-organization coordination strategies were examined pertaining to different scenarios. In future work we will extend the current framework to femto-to-femtocell coordination.
IR3.3 v1.0
23
Public Information
3. Decentralised Protocols for Resource Allocation As prevously discussed, Interference management remains one of the major issues concerning femto cells deployment: cross-tier and co-tier interference affect transmission in femto and macro cells. In the previous section, mainly cross–tier interference was addressed, via frequency partitioning and power use schemes. In this section, the issue of interference management is addressed via RRM, taking advantage of OFDMA flexibility in terms of frequency and power resource allocation. Decentralised protocols assuming the availability of local knowledge (that is not necessarily gained by sophisticated cognitive processing) may be an answer to it. These may lead to sub-optimal RRM solutions but nevertheless are better than rather having a blind (ignorant of macro network) resource allocation policy. In the following sub-sections, novel RRM protocols are proposed for radio resource allocation in the context of femtocells to address aforementioned challenges in standalone femtocells. In section 3.1, advantage is taken from the fact that in a femtocell only few users compete for a large amount of spectrum. This situation is exploited by a novel decentralized RRM, which maintains FUEs QoS, while protecting MUEs from detrimental interference. In section 3.2, a Radio Environment map (REM) is used as a RRM tool: HeNB selects RBs, so as to satisfy FUE QoS while protecting MUEs in its vicinity by keeping the interference level below a threshold. Cell-edge users are allocated RBs in "strong interference", i.e. interference caused by the MeNB can be cancelled out by SIC. Section 3.3 is the dual of section 3.2, since it considers the same problem (protection of the macro cell communication by assigning a threshold to the interference created by the FUEs), except this time the uplink (UL) is considered instead of the downlink (DL) like in 3.2.
3.1 A RRM Scheduling Algorithm for Self-Organizing Femtocells
Classically, researchers tried to develop bandwidth efficient schedulers to enable heterogeneous systems to coexist within the same bandwidth, thus limiting co-tier and cross-tier interference. However, the femtocell deployment requires a new paradigm because of two main reasons. First, femtocell users (Femto UEs) can benefit from a high quality DL signal enabled by short range communications characterizing femtocell deployments. Second, only few users locally compete for a large amount of frequency resource in a given femtocell. Therefore, a femtocell benefits from a huge amount of spectral/power resource. Hence, there is a need for designing a novel approach for reducing interference, improving the spectrum usage and communication robustness in face of undesired interference, and for limiting power consumption In this sub-section, we focus on achieving effective spectral reuse between macrocells and femtocells while guaranteeing the QoS of users served by both macro and femto base stations. We propose a novel resource management scheme that limits the overall interference per RB generated outside the coverage range of a femtocell while reducing the transmission power in each RB. This method does not involve any message exchange neither amongst neighbouring HeNBs nor amongst M-BS and HeNBs.
3.1.1 System Model We concentrate on femto-to-femto and femto-to-macro interference in LTE DL scenarios [13]. We consider a mobile wireless cellular network in which mobile terminals and base stations implement an Orthogonal Frequency Division Multiple Access (OFDMA) air interface based on 3GPP/LTE DL specifications. Each user is allocated one or several RBs in two consecutive slots, i.e., the Time Transmission Interval (TTI) is equal to two slots. We assume that femtocells are deployed according to the 3GPP grid urban deployment model [20]. This model represents a single floor building with 10 m x 10 m apartments placed next to each other in a 5 x 5 grid. The block of apartments belongs to the same region of a macrocell. Each HeNB can simultaneously serve up to 4 users. To consider a realistic case in which some apartments do not have femtocells, we use a system parameter dρ called a deployment ratio that indicates the percentage of apartments with a
femtocell. Furthermore, the 3GPP model includesaρ , another parameter called an activation ratio defined
as the percentage of active femtocells. If a femtocell is active, it will transmit with a certain power over data channels. Otherwise, it will transmit over the control channel.

IR3.3 v1.0
24
Public Information
Information Theoretic Limits in Non-Ergodic Block Fading Channels
We can characterize many delay-constrained communication systems such as OFDM systems as instances of a block fading channel. Since the momentary instance of the wireless channel has a finite number of states, the channel is non-ergodic and it admits a null Shannon capacity [21]. The information theoretical limit is established by defining an outage probability outP defined as the probability that the
instantaneous mutual information for a given fading instance is smaller than the spectral efficiency R associated with the transmitted packet: ),<),((= RIPP rout αγ (3-1) where ),( αγI is a random variable representing the instantaneous mutual information for a given fading
instance α and γ is the instantaneous Signal to Noise plus Interference Ratio (SINR). For an infinitely
large block length, outP is the lowest error probability that can be achieved by a channel encoder and
decoder pair. Therefore, when an outage occurs, the correct packet decoding is not possible, hence outP is
information theoretical bound on the packet error rate. To obtain outP , it is necessary to compute ),(αγI
associated with the current channel measurement on each group of RBs (M OFDM symbols x N subcarriers):
∑∑
⋅22
,1=1=
,1
=),( kkiij
N
j
M
iI
NMI σααγ (3-2)
where
∑∑−
qkji
A
qz
A
kkkiij AE
AAI ,,,
1=2
1=2
22, log
1)(log=,σα (3-3)
and ]2
[exp=2
22
,,, σ
αα zazaA
qijkijqkji
−−+− (3-4)
Note that Eq. (3-3) is derived from the work of Ungerboeck [22], where S is the size of the M-QAM modulation alphabet, a is the real or complex discrete signal transmitted vector, z are the Gaussian noise
samples with variance 2σ and Ez denotes expectation w.r.t. z.
3.1.2 Ghost Femtocells: the Proposed Resource Allocation Algorithm In our vision, femtocells should be "invisible" in terms of interference generated to neighbour cellular users. Nevertheless, femtocells deployment presents a very challenging issue: while HeNBs power consumption and interference range should be small, the coverage range at which UEs can meet their QoS constraints should be large. Based on this observation, we propose a novel RRM algorithm designed to strongly lower HeNBs DL transmission power. In our proposal, we take advantage of the unusual communication context of femtocells for which locally few UEs compete for a large amount of resources. We come out with a 7 steps RRM algorithm, the Ghost Femtocells ( ghostRRM ) that reduces transmission
energy by using available frequency resources. The detailed description of the proposed algorithm is as follows: Step 1: [Feedback to HeNB] Each Femto UE feedbacks to the HeNB its QoS constraints and the instantaneous Channel State Indicator (CSI) measurements. Step 2: [Computing Scheduling Matrices] According to the CSI measurements and the selected
scheduler algorithm, each HeNB computes scheduling metrics jiλ for every attached user i on every RB j.
We assume that ghostRRM implements a Proportional Fair based scheduler, that is
,/=1=
ki
K
k
ji
ji SINRSINR ∑λ (3-5)
where jiSINR represents the instantaneous channel condition of the RB j observed at user i and
ki
Kk SINR∑ 1= is the sum of SINRs of K RBs that have been already allocated to user i. ghostRRM uses the
values of this metric as the entries of the scheduling matrices TxM and RepM of dimensions

IR3.3 v1.0
25
Public Information
∑ ×=
fN
kRBk NN
1 where fN is the number of active HeNBs in the network, kN is the number of users
served by the femtocell k , and RBN is the number of available RBs. In a first phase, based on TxM , the
scheduler allocates to each user the minimum number of RBs that meets QoS and power constraints.
Then, in a second phase, the proposed scheduler sorts matrix RepM to allocate to the served users additional available RBs. These two phases are described below in Steps 3 and 5.
Step 3: [Scheduling] For each user to serve, the HeNB selects the minimum number of RBs that meets QoS and power constraints. It schedules in three iterative steps:
Step 3-a: The HeNB selects the best user-available RB pair (i,j) with the best metric in TxM .
Step 3-b: The overall available power at user i served by the HeNB k is kT
i NPP /=ˆ , where TP
and kN are the power budget and the number of users of the HeNB k, respectively. The controller
equally splits iP in the set of RBs allotted to user i iBR . Then, according to ( iBR ) and iP the algorithm
selects the highest possible Modulation and Coding Scheme ( iCSM ).
Step 3-c: Then, the HeNB estimates the sum of the Mutual Information I given by set iBR and
iCSM .
• When 0=I , the selected user-RB pair cannot be served in this scheduling period so the
values of the i-rows in both TxM and RepM are set to zero.
• When tgRI ≥ , user i is served. The values of the i-row in TxM and ),( jiM Rep are set to
zero and the values of the i-row in RepM are updated according to the scheduler rule (cf. Eq. (4.1.2)).
• If tgRI < , the user i is not served yet. The values ),( jiM Tx and ),( jiM Rep are set to zero
and the values of the i-rows in RepM and TxM are updated according to the scheduler rule (cf. Eq.
(4.1.2)). Moreover, ),( jkM Tx and ),( jkM Rep , where k ∈ iV , are set to zero.
Step 4: [MCS Scaling] Given the set of RBs ( iBR ) allocated to each served user i, the algorithm finds
the *MCS of the minimum order that meets the QoS target. If *MCS is different from iCSM , the MCS
of user i ( iMCS ) is set equal to *MCS . The goal of this process is twofold. First, it improves the
transmission robustness. Second, it reduces the padding thus improving the spectral efficiency. Step 5: [Spreading] The HeNB allocates unused RBs to spread the original message and improve the transmission robustness. Scheduling is done in three iterative steps:
Step 5-a: The scheduler selects the user-available RB pair (i,j) that has the best metric in RepM . Step 5-b: For each user-available RB pair (i,j), the algorithm checks the Mutual Information I
given by the entire set of RBs allocated to user i and iMCS :
• If tgRI < , additional RB would cause outage, hence the values of the row corresponding to
user I in RepM are set to zero.
• When tgRI ≥ , the original message is spread in the additional RB and ),( jiM Rep is set to
zero. Moreover the values of the i-row in RepM are updated according to the scheduler rule. Step 5-c: The scheduler process terminates when no more user-RB pairs are available.
Step 6: [Power Scaling] The algorithm estimates the SINR perceived at each served user and reduces the allocated transmission power to meet the SINR threshold given by the target packet error rate (PER) and the selected MCS.
Step 7: [Message Reception] Finally, each user collects the information received in each of its allotted RBs and combines these RBs using the Chase combining scheme [23]

IR3.3 v1.0
26
Public Information
3.1.3 Simulation Results In this section, we assess the effectiveness of the proposed scheme by comparing its performance with a reference algorithm (RRMclassic). In RRMclassic aims at maximizing the spectral efficiency of femtocells while minimizing the probability that users that belong to different cells access to same RBs. Thus, the RRMclassic attempts to limit the number of RBs allotted to each FUE;. Moreover, RRMclassic algorithm does not implement MCS and Power scaling (Steps 4 and 6 in RRMghost algorithm). RRM algorithms are compared in terms of the following energy cost function measured at both the macro and the femto tiers
]/[
,
,,
bitJT
PN
i
i
UE
jji
ji
UE
jji
i
∑
∑ ×=Γ (3-6)
where at TTI i, UEi , Ni,j, Pi,j, and Ti,j, are the number of active UEs in the (macro/femto) tier, the number of RBs allotted to the user j, the DL power associated to each of these RB, and the perceived throughput at the user j, respectively. We present simulation results for the system model and its parameters presented in Section 3.1.1. The results are averaged over 102 runs, each one made of 103 TTIs. At the beginning of each run, we independently generate the channel Rayleigh fading coefficients and randomly place HeNBs and femto UEs on the deployment grid. In each run, 2 blocks of apartments are randomly dropped in the macrocell area. Moreover, indoor M-UEs are randomly distributed in the apartments where HeNBs are not deployed. Note that in the presented simulations, we consider that all deployed HeNBs are active (ρa = 1) with four femto UEs per HeNB.
Figure 3-1 Average transmission cost at the macrocell versus power budget at each HeNB in
different femtocell deployment scenarios.
Figure 3-1 shows the performance at the macrocell as the energy cost function previously introduced versus the power budget PT at each HeNB. In the co-channel femtocell deployment, indoor MUE performance is limited by femto-to-macro interference. Some recent research introduced cooperation within M-BSs and HeNBs in order to coordinate the access to the radio medium and avoid the cross-tier interference [24]. However, following the 3GPP Release 10 baseline [25], we do not implement this

IR3.3 v1.0
27
Public Information
coordination in our system. Hence, the M-BS scheduler is not aware of the RBs exploited by the interfering HeNBs. When the M-BS assigns to an indoor user a RB that is used by a neighbour HeNB, this MUE can be exposed to a high level of interference. We aim to evaluate the effect of this interference on MUE when femtocells use the reference RRMclassic and the proposed RRMghost. To compare these algorithms, we have set the throughput target (Ttg) of MUEs and FUEs respectively equal to 300 and 600 kbit/s and considered three different femtocell deployment scenarios:
Scenario δL: low density — ρd = 0.3, circle marked curves. Scenario δA: medium density — ρd = 0.5, triangle marked curves. Scenario δH: high density — ρd = 0.8, plus marked curves.
Solid and dashed lines, respectively, correspond to the throughput of RRMclassic and RRMghost schemes. Note that, M-BS power is fixed in each allotted RB; therefore, differences of performance between the two approaches are only due to the experienced throughput (which depends on the perceived intereference) at MUEs. The results show how RRMghost strongly limits the impact of the femto-to-macro interference in all scenarios. For instance, under RRMclassic and considering a HeNB power budget of 20 mW, the proposed RRMghost gains up to 11%, 16%, and 15% Scenario δL, Scenario δM, and Scenario δH, respectively. This improvement comes from steps 4, 5, and 6 of the proposed scheme (MCS scaling, Spreading, and Power Scaling) that reduce the level of interference experienced in each RB by the M-UE. Note that, cross-tier interference increases with the density of femtocells; however, its impact is limited by using the proposed RRM algorithm. Nevertheless, when the deployment ratio is higher than a certain threshold the benefit given by the RRMghost decreases (cf. Scenario δM, and Scenario δH); this is due to the higher frequency reuse, which results in higher interference.
Figure 3-2 Average HeNB transmission cost vs. power budget at each HeNB in different traffic
scenarios
Figure 3-2 shows the average transmission cost at the femtocell as a function of the radiated power budget at the HeNB. We consider four different traffic scenarios:
Scenario Traf 1: Femto UE throughput target Ttg = 300 kbit/s, square marked curves. Scenario Traf 2: Femto UE throughput target Ttg = 600 kbit/s, circle marked curves. Scenario Traf 3: Femto UE throughput target Ttg = 1 Mbit/s, star marked curves.

IR3.3 v1.0
28
Public Information
Scenario Traf 4: Femto UE throughput target Ttg = 2 Mbit/s, diamond marked curves.
As previously mentioned, the M-BS does not implement power control scheme and its transmission cost Γ depends only on the interference perceived at the MUE; on the contrary, by using the proposed RRM scheme, HeNBs are able to improve their transmission cost by adapting their output power to the capacity demand. Therefore, performance at HeNBs depends on both the co-tier intereference and the used output power. Figure 3-2 shows that transmissions at HeNBs are much less power consuming (in terms of irradiated power) with respect to the M-BS transmissions. In fact, there is nearly a factor of 103 between Γ measured at the M-BS and Γ measured at HeNBs. Moreover, in Figure 3-2 we can observe that our algorithm limits the HeNB transmission cost in each considered scenario. For instance, considering a HeNB power budget equals to 10mW, RRMghost gains to 94%, 90%, 85%, and 75% in Scenario Traf.1, Scenario Traf.2, Scenario Traf.3, and Scenario Traf.4, respectively. Simulation results show also, that such a gain increases in lightly loaded scenarios, where lower MCS are required and our algorithm allow to strongly reducing the irradiated power.
3.1.4 Conclusions and future work Future 3GPP/LTE femtocells deployment is expected to be dense: a large population of potential interferers will need to share scarce frequency resources while few users will locally have access to a large amount of resources. Classical resource allocation and interference mitigation techniques cannot address the challenge of limiting interference between neighbour femtocells and maintaining a high level of reliability for macro UE communications. Even if we have not completely made femtocells invisible so that the communications in neighbour femtocells do not harm any user in the network, we have obtained some important results. We have designed RRMghost, a novel radio resource management scheme that efficiently uses the available wireless spectrum in a two-tier network. It limits the undesired effects of interference by reducing the radiated power (in each RB) required at femtocells to meet target QoS constraints. We have evaluated the effectiveness of the proposed scheme for different femtocells loads and different dense urban deployment scenarios based on the 3GPP/LTE specifications. Our simulation results show that RRMghost significantly improves communication reliability/cost for UEs associated with both the macro base station and femtocells.
3.2 RRM in Femtocell Downlink Exploiting Location Information
In this sub-section, we focus on the reduction of cross-tier interference via appropriate RRM techniques [33]. Due to fading and unplanned deployment, HeNBs need to change their transmitter parameters dynamically to minimize interference at neighbouring locations. Therefore, femtocell management should be distributed and self-organizing, so that HeNBs can successfully react to changes of the traffic and channel, and minimize interference [34]. In order to overcome the interference issues, several OFDMA-based RRM techniques have been proposed in literature [35]- [40]. In [35], authors allocate the available RBs to avoid interference among HeNBs and MBSs. Power control was used [36] for RRM to minimize the interference. [37] proposed a learning based mechanism for femtocell. In [38], authors proposed an adaptive interference management technique of OFDMA femtocell. There are several proposal to overcome the interference issue using FFR [41]- [45]. However, all these works minimize/avoid the interference among FUEs. In contrast to these, the present work proposes a RRM technique using the interference information at every location within the coverage area. The main objective of this work is to allocate radio resource among FUEs exploiting radio environment maps (REMs) [46]. We propose an interference-aware local cartography-based RRM (LC-RRM) technique for self-organized standalone HeNBs, where the HeNB system collects interference values measurements at FUEs locations for each RB. The proposed technique consists in a joint power and frequency RB allocation scheme that maximizes the FUE capacity, while keeping interference created at MUES within acceptable limit. In order to achieve this, we introduce the concept of interference cartography (IC) for better resource allocation. The interference cartography (discussed in 3.2.2) combines radio measurement data with user's location information and provides a complete view of the environment for autonomous decision making [47]. In our work, we use a spatial interpolation algorithm,

IR3.3 v1.0
29
Public Information
called Kriging interpolation, to estimate interference values at the unobserved location and make IC diagram for each RB of HeNB coverage area. Thereafter, these RBs are classified based on their interference values using classification technique at desired location. Then, appropriate transmit power is used on these classified RBs for transmission to maximize DL transmission capacity of FUEs, while the interference introduced to the MUE remains within a tolerable limit. The rest of this section is organized as follows. Section 3.2.1 describes the system model of the proposed LC-RRM technique along with analytical formulation. Section 3.2.2 presents the overview of interference cartography and analyses its formation in the context of present work. The interference classification and dynamic FFR scheme are described in Section 3.2.3. The power and subcarrier allocation mechanism of proposed LC-RRM technique is described in Section 3.2.4. Section 3.2.5 presents the simulation results.
3.2.1 System Model and Problem Definition We consider HeNBs, located within a hexagonal MeNB network that are using the same frequency band for communication in DL. Since the position of MUEs cannot be known (due to mobility for instance), we only assume that the positions of the MBSs as well as the position of the HeNBs are known. In this work, the network is based on the 3GPP/LTE DL specifications [48]. Each user is allocated one or several RBs during a time transmission interval (TTI). The overall channel gain is composed of a fixed distance-dependent path loss, a slowly varying component modelled by lognormal shadowing and Rayleigh fast fading with unit power. The received SINR on RB i of mk -th MUE of m-th MeNB can be expressed as
h
ihmki
H
h
ai
aaki
M
ma
mi
mmkim
kiPGPG
PG
mm
m
m
,1=
,
1
1=
2
,, =
∑∑ ++−
≠σ
β (3-7)
where ).(,
aarespmmki m
G is the channel gain between MUE mk and serving MeNB m (resp. MeNB a ) on
RB i , hmki m
G , the channel gain between MUE mk and neighbouring HeNB h on RB i . ).( arespmiP is the
transmit power on RB i by m-th (resp. a -th) MeNB. Similarly, hiP is the transmit power of
neighbouring HeNB h on RB i . M and H are the total number of MBSs and HeNBs respectively. 2σ is the white noise power spectral density. In case of a FUE, it is interfered by all MBSs and adjacent HeNBs. The received SINR of a FUE hk of
h -th HeNB on RB i can be similarly given by
b
ibbki
H
hb
mi
mhki
M
m
hi
hhkih
ki
PGPG
PG
hh
h
h
,
1
1=,
1=
2
,, =
∑∑−
≠++σ
β (3-8)
where ).(,
bbresphhki h
G is the channel gain between FUE hk and serving HeNB h (resp. b ), and mhki h
G , the
channel gain between FUE hk and MeNB m on RB i . In our channel model, the channel gain between
FUE hk and serving HeNB h is given by
hik
hk
hk
hk
hhki hhhhh
dPLG ζη ××)(=, (3-9)
where hkh
PL , hkh
η and hki h,ζ are the distance-dependant channel gain, the shadowing, and the fast fading
component that depends on the RB i for k -th user of h -th HeNB. In this work, we consider different pathloss models for MeNB and HeNB. From now on, we will concentrate on a particular HeNB h , and its associated FUEs. An FUE whose serving femto is h , will be denoted by k to alleviate notations. The transmission rate of FUE k is given by
),(= ,,,1=
hi
hhki
hkiki
N
ik PGRaC ∑ (3-10)
where N is the total number of RBs, kia , is the binary assignment variable and hkiR , is the Shannon
capacity of FUE k at i -th RB, expressed as
( )hkii
hki BR ,2, 1log= β+ (3-11)
where iB is the bandwidth of the RB i . As mentioned earlier, our objective is to allocate the appropriate
RBs to meet FUE's QoS with power an interference constraints. Thus, the optimization problem can be

IR3.3 v1.0
30
Public Information
formulated as follows
∑ ∑∑==
K
k
hi
hhki
hkiki
N
i
K
kk PGRaCOptimize
1,,,
1=1),(= (3-12))
Subject to mth
hi
H
h
hmki
ai
M
ma
aakiki IPGPGI
mmm≤+= ∑∑
=
−
≠= 1,
1
1,,
and
hth
bi
bbki
H
hb
mi
mhki
M
mki IPGPGI
ll
hl≤+ ∑∑
−
≠,
1
1=,
1=, =
0,1,0 ,1
,1=
∈≤≤ ∑ ∑=
kiTot
K
k
hiki
N
iaPPa
for any MUE mk belonging to MeNB m and for any FUE lk belonging to HeNB l , with l different
fromh . K is the number of FUEs per HeNB. mkiI , (resp.
hkiI , ) are interference terms (see
denominators of Eq (1) (resp. Eq. (2)). mthI and h
thI are the interference thresholds for these interferences
terms. Figure 3-3 shows the system model of the proposed LC-RRM technique. As shown in the figure, it consists of two main functional modules: IC manager and femtocell spectrum manager (FSM) with spectrum allocation module. The IC manager consists of measurement collection module (MCM) and IC database. MCM collects the available interference values for each RB at every current users. These interference values for each RB are then stored in the IC database. IC database adds interference values for any new location and updates the value for already existing locations. With this process, IC database is up-to-date at any point of given time. By gathering these interference values, IC manager makes the cartography diagram for each RB of its coverage area.
Figure 3-3:System model framework of LC-RRM technique
This IC diagram helps FSM module for resource allocation among FUEs. The FSM module, which can control several HeNBs or a standalone HeNB, assigns RBs with appropriate transmit power to users to satisfy QoS. Here, we consider resource allocation technique for a standalone HeNB. The RBs and transmit power are selected based on the interference at desired user location and the interference threshold limit at neighbouring locations. The interference threshold at a given receiver is the maximum interference level acceptable by the receiver (i.e. maximum level of interference that does not cause any quality of service degradation). Moreover, knowledge of the locations of MUEs may help to determine the corresponding interference threshold. It depends on the particular user with specific QoS and might differ for different users. The threshold value is very sensitive for different worst case MUE, discussed more in [49].

IR3.3 v1.0
31
Public Information
3.2.2 Interference Cartography and its Construction The interference cartography [47] is based on the aggregation of the interference information, measured by entities of several HetNet users at a central unit. The central unit combines these aggregated values with geo-localization information, and performs advanced signal processing techniques to render complete and reliable information. It provides a viable picture of the environment for efficient detection, analysis and decision by updating this information on a database, known as REM [50]. To achieve certain level of accuracy and reliability in measured data, large amounts of measurement data may be needed in constructing a cartography that relies only on reported measurements. Furthermore, with the rapidly increasing level of technological advances in digital signal processing, it is possible to implement efficient signal processing techniques that achieve high levels of accuracy and reliability with a small proportion of measurement data [46]
Figure 3-4: A typical interference cartography diagram for RB Id 10 and RB Id 30 with different FUEs in HeNB coverage area (10 × 10 meter). HeNB access point located at (90, 95). Star marks
represent the FUE locations. The unit of interference is dBm.
In our wireless network simulator, we use interference values of each RB at the current user's location as REM information. These interference values are used to form the IC database, whose size is limited to those RBs with characteristics provided by current users. Using IC database, IC manager estimates interference values at the desired location using spatial interpolation. The spatial interpolation is a statistical procedure that estimates missing values at unobserved locations within a given area, based on a set of available observations of a random field. This interpolation is mainly based on spatial autocorrelation. One such interpolation technique is Kriging interpolation technique [51], used in this work. In order to implement the interpolation, we consider the data set )((1),..., nyy are the realization of
a stochastic model with mean, (.)µ , and (symmetric) variance-covariance matrix, Σ . Given a sample of
size n , the best linear unbiased predictor of any unsampled point on the surface can be obtained by simple Kriging. To predict the attribute value at site x , )(x , which is not included in the sample,
compute:
)()(=)(~ 1 Ω−Σ+ − yyyyTCxxy µ (3-13)
where ))(),(((1)),...,),(((= nyxycovyxycovCT . Σ , as noted, is an nn× symmetric matrix with ),( ji -th
element equal to ))(),(( jyiycov , ( )Tnyy )((1),...,=yyyy , ( )Tn)((1),...,= µµΩ and )(xµ is the mean
evaluated at site x . The second term in (7) identifies the simple Kriging weights, 1−ΣTC , assigned to each data point, that yields the BLUP of the unknown attribute value. As shown in Figure 3-3, by accessing the interference values from IC database, IC manager makes the cartography diagram for each RB using Kriging interpolation of HeNB coverage area. Figure 3-4 shows

IR3.3 v1.0
32
Public Information
the IC diagram for two different RBs of a particular HeNB with two different numbers of FUEs. As shown in the figure, the interpolation algorithm estimates more accurately at the unobserved locations with larger database. The interference values are different for different RBs at a particular location. Using this constructed IC diagram, the RBs are split into different categories by interference classification scheme. These classified RBs are then being used to allocate to FUEs based on proposed dynamic FFR scheme, discussed in next section.
3.2.3 Interference Classification and Dynamic Fractional Frequency Reuse In the literature, some theoretical investigations propose to classify perceived interference at user into five regimes, namely noisy, weak, moderately weak, strong and very strong interference regimes [52]. In [53], the authors simplify interference classification which reduces the processing complexity in comparison to the other classification. These papers classify the interference into three regimes.
Noisy interference regime: The noisy regime corresponds to the most conventional way for processing interference, i.e., as thermal noise. If the perceived neighbour signal is too weak, then the interference can be processed as additional noise.
Strong interference regime: Here, interference is so strong that it causes no degradation in comparison to a scenario without interference. Such a regime is known in the literature as the very strong interference regime. One main advantage of this regime is that the optimal scheme can be used to decode the interfering data while treating information data as noise, then subtracting interference to the received signal and eventually decoding the information signal cleaned from interference. Interference is then cancelled out.
Jointly decoding regime: With this regime, perceived inter-cell interference is not strong enough to be decoded alone and not weak enough to be treated as noise; destination jointly decodes information and interference for recovering the information signal. This regime lies between noisy and strong interference regimes. The bounds of applicability of the three different regime with satisfaction the rate and power constraints with macrocell as a known interferer are given by (described in eq. (14) [53])
( )
( )
( )
+≥
+≤≤
⋅−
≤
⋅+
ij
jj
ii
ij
jj
j
j
jji
j
jj
jjii
f
AA
ceInterferenStrong
f
A
f
AfA
decodingJointly
f
AfA
Noisy
γγ
γ
γγ
γγ
γ
γγ
1
=
3.
1
=
2.
1=
1.
(3-14)
where ijiji ffAA γ,,,, and jγ are defined in [53].
The above classification is valid in the case of one interferer to the HeNBserved FUE. We thus assume in the sequel, that the FUE is interfered by one MeNB, which is the dominant interferer. Interference created by other MeNB if any, will be considered as noise. Having knowledge of the interference values, for a given location, RBs are classified according to the above classification and allocated to user based on our proposed dynamic FFR scheme. The general FFR scheme is very suitable for OFDMA-based systems, and has been used for interference mitigation, where the whole spectrum is divided into several subbands in frequency and time scale [11, 12]. Each sub-band is differently assigned to center zone and edge region of the cell. While reuse factor of the center zone is one, the edge region adopts a larger reuse factor. As a result, interference in the centre zone is removed, and interference in the edge region is substantially reduced. At the same time, system throughput is also enhanced. Most of the previous works are based on fixed FFR. In this work, we propose a dynamic FFR among femtocell users with reuse factor one, for both central and edge zone. In our proposed dynamic FFR scheme, we use the RBs of two categories, noisy and interference cancellation regime for allocation among users. The allocation of RBs are motivated by users location within HeNB coverage area. In our allocation scheme, we divided FUEs into two categories based on their location i.e. pathloss, central users and edge users. The proposed dynamic FFR uses the RBs in interference cancellation regime for edge user and the RBs in noisy interference regime for central users for allocation. The RBs in interference cancellation regime are used for edge user to mitigate higher

IR3.3 v1.0
33
Public Information
pathloss and shadowing effect. The shadowing effect cannot be anticipated by interpolation algorithm during the formation of cartography diagram. Therefore, there may be a possibility of incorrect estimation of interference values if a user is in the shadowing region, which will have a higher impact for high pathloss. In addition to this, the effect of other obstruction can also be mitigated by this kind of RB allocation. Indeed, the wrong estimation of interference can affect the power allocation, which may produce strong interference at the nearby MUEs. To mitigate this, we consider the RBs in interference cancellation regime for edge users. Since the interference will cancel out with an optimal decoding scheme, these RBs can be used for communicating to edge users. Using this dynamic FFR scheme, we will discuss the joint RBs and power allocation procedure in the next section.
3.2.4 RRM Technique among Femtocell Users for Standalone Femtocell Based on the above-mentioned assumptions, we will use the following procedure for allocating the RBs with proper transmit power to FUEs. The flowchart of the LC-RRM is described in Figure 3-5. The allocation module in Figure 3-3 uses location-based interference values from IC database and allocates the RBs to FUE with the help of FSM. At first, IC manager collects the interference values at the current scheduled users locations on each RB and stores them in the IC database. This operation happens periodically and IC manager refreshes the values in IC database. The refreshment happens whenever there is an update on power allocation, user activation, additional resource allocation etc. Using these values, IC manager forms the cartography diagram for each RB. When a new user wants to join the HeNB, IC manager uses IC diagram to determine the interference values of each RBs at user location. The standalone HeNB then classifies the RBs based on their interference values. Having knowledge of user location, the proposed dynamic FFR scheme chooses the RBs for possible allocation. On each chosen classified RB, HeNB selects transmit power in an iterative way. For each iteration, HeNB estimates interference values by producing IC diagram on each available RB at the neighbouring areas. During each iteration, HeNB checks the interference values produced at the nearby area, which should be under the threshold limit. The threshold limit is different for MUEs and FUEs. In both cases, it depends on current QoS condition. However, it also depends on the deployment scenario of MBSs and HeNBs and the receiver sensitivity of MUEs and FUEs. Thus, for each value of transmit power, IC manager forms IC diagram for extended coverage area, so that the possible interference values after transmission can be checked at the neighbouring HeNBs users and worst case MUEs [49] for interference limit. By this process, the RRM algorithm selects the transmit power for each available RB. The number of RBs are selected with best modulation and coding value to meet rate and power constraints. In this way, FSM with allocation module selects the transmission parameters for FUEs as well as keeps the interference at neighbouring area within the threshold limit.

IR3.3 v1.0
34
Public Information
Figure 3-5: Flow chart of the proposed LC-RRM technique
3.2.5 Simulation Results We benchmark the proposed algorithm by considering the network where MBSs and HeNBs share the same spectrum. The maximum power of MBSs and HeNBs are 46 and 10 dBm respectively. The HeNBs are deployed according to the 3GPP grid urban deployment model within a hexagonal structure of 19 MBSs with intersite distance of 500 m. Each MeHB transmits continuously and with maximum power. As a consequence, only a particular HeNB is simulated, while others are used for down-link interference generation only. In this model, a single floor building is considered, where 10 m x 10 m apartments are placed next to each other in a 5 x 5 grid. Each HeNB can simultaneously serve a maximum number of 4 users. The activation ratio of HeNBs is 20%.
Figure 3-6: Interference cartography diagram (25 × 25 meter) at before and after transmission for two different RBs. HeNB access point located at (90, 95). Star marks represent the FUE locations.
The unit of interference is dBm.

IR3.3 v1.0
35
Public Information
Figure 3-7: Average FUE throughput for central user and edge user in a particular HeNB.
Figure 3-8: Maximum average transmitted data rate of EUE versus interference introduced to the worst-case MUE.
Figure 3-6 shows the IC diagram of before and after transmission for two different RBs with two FUEs. As shown in the figure, interference values change after transmission due to power allocation on the RB. These values are different for different RBs at a particular location. These estimated interference values are being used for checking the interference threshold limit at neighbouring location. Based on these IC diagram, appropriate transmit power has been chosen for each RB, while the interference introduced to the MUE remains within a tolerable limit. Thus, with the help of IC diagram, LC-RRM technique selects appropriate transmit power on each RB. The average throughput of the proposed LC-RRM technique is shown on Figure 3-7 for central and edge users. As expected, the throughput for edge user is slightly lower than the central user at a particular HeNB transmit power due to the distance from HeNB access point. The figure also shows the comparison between with and without the proposed LC-RRM technique. The throughput gain is higher for edge user than for the central user due to our dynamic FFR scheme. In Figure 3-8, we plotted the average achievable transmission rate of FUE versus interference introduced to the worst-case MUE. Since HeNB does not have the knowledge of MUE location, we consider a worst-case MUE, co-located with FUE
3.2.6 Conclusion In this work, we proposed an interference-aware LC-RRM technique for standalone femtocell. Power

IR3.3 v1.0
36
Public Information
and RBs are allocated to FUEs efficiently by combining location information. It has been observed that the proposed technique is notably effective to improve the throughput of FUEs. The proposed LC-RRM technique provides the upper bound of the interference at the MUEs. In continuation to this study, we are working on the impact of RRM for MBSs and HeNBs, and other practical model providing user mobility with dynamic deployment of HeNBs etc. The proposed LC-RRM technique looks promising for femtocell network as well as cognitive radio network to minimize interference at the neighbouring locations. More studies in this area are being investigated further.
3.3 Successive Interference Cancellation on the UL of Femtocell Transmission
3.3.1 Problem Statement We develop a comprehensive methodology and evaluate the performance of the two-tier cellular network overlaid with femtocells during the UL. We propose a femtocell power control scheme that relies on minimal coordination with the cellular base station users. We use a simple interference sensing procedure in the femtocells to assign channels to femtocell users. We show that these two techniques alone yield beneficial gains for users in terms of power savings and for the network in terms of additional throughput. We then develop a decision rule in which macrocell users should join a nearby femtocell. Successive interference cancellation is used to allow a macrocell user and a femtocell user to share a common channel and UL to a femtocell access point. We show that these two additional techniques significantly improve the gains already realized from the power control and channel assignment scheme developed.
We consider the network’s UL bandwidth to be divided into cN orthogonal channels that are fully shared
between the two networks. In the context of this work, we consider a given channel to be a frequency slot as in a FDMA or ODFM system, however nothing prevents the system from allocating resources as time
slots in a TDMA system. We further assume that cNM = so that there is one MUE per channel and
then a random number of FUEs sharing the UL channel as well. For a MUE link to exist on a given
channel, we require a minimum SINR threshold of Mβ to be satisfied. A similar minimum threshold
Fβ must be satisfied for a FUE link to exist.
Figure 3-9: Topology illustrating the numerous distances and connections between nodes.
Finally, we assume that a given HeNB can only support a maximum of F links where each link must be on different channels. Due to the nature of the fully shared spectrum, the two networks will interfere with each other. To account for the interference from the FUEs to the MeNB, we assume that there exists a
margin Mκ in the SINR at the MeNB which determines how much interference is allowed at the MeNB.
We consider a similar margin Fκ to exist in the SINR at the HeNB. We assume the MeNB can tolerate
more interference than a given HeNB and thus make the assumption that FM κκ >> . Using our distance
based pathloss model, modeling the interference on the various links is equivalent to varying the pathloss exponent. For FUEs communicating with HeNBs, we use α for the pathloss exponent. We use an

IR3.3 v1.0
37
Public Information
exponent of γ for MUEs when they interfere with the HeNBs or when they connect to a nearby HeNB.
Finally, we use φ as the exponent for MUE links with the MeNB as well as the FUE interference to the
MeNB and other HeNBs.
3.3.2 Joint Power Control, Channel Assignment and Handover Mechanism Femto user power control is managed by the HeNB, however the process is aided by the MeNB. The value Mκ controls how much interference is allowed at the MeNB and is incorporated into the power
control that the MeNB performs for each MUE on their respective channel. We can see the effects of the power control in the MUE link by looking at the SNR of a given channel kC at the MeNB, where after
rearranging terms, gives a bound on the transmit power of MUEs as:
φ
φ
σβκ
βκσ
MBnMMT
MMn
MBT
dP
dP
M
M
2
2
≥
≥−
(3-15)
where MBd is the distance between a MUE and the MeNB and MTP is the transmit power of the MUE. If
we assume that MUEs transmit at the required minimum just found, then by looking at the SINR of a
given channel kC at the eNB and after rearranging terms
kMn
Mnk
MBT
I
I
dPM
≥−
≥+
−
)1(2
2
κσ
βσ
φ
(3-16)
we can upper bound the total amount of interference allowed on that channel in terms of Mκ . We know
however that kI is the sum interference from all femtocells on channel kC . If we divide kI by the
average number of femtocellsfN , we can calculate the amount of interference allowed per femtocell.
Furthermore, each channel in a given femtocell can only be used by a single FUE. Thus, the interference
at the MeNB from a given FUE on channel kC is simply φ−FBT dP
F. The amount of overhead for the MeNB
to learn FBd for every FUE in the network could be quite high. We can make a close approximation
however by assuming a worst case location for a FUE as being on the edge of the femtocell, closest to the MeNB. We illustrate this in Figure 3-9 where we show a femto user FU3 on the edge of HeNB2. Due to
the relative small size of the femtocell, we can approximate each FUE distance by fAB rd − , the
difference of the distance from the HeNB to the MeNB and the femtocell radius. Because the HeNBs are stationary, the overhead to know the distance to the HeNBs is low. Thus for any FUE in a given
femtocell, its own distance to the MeNB will always satisfy fABFB rdd −≥ . We can combine all of
these concepts with the interference bound and write:
fT
f
fABMnP
N
rd≥
−− φκσ ))(1(2
(3-17)
which is an upper bound on the transmit power of each FUE in the network for all kC channels. We
assume that the MeNB knows dAB for each femtocell and it knows fN , and thus can set a maximum
transmit power for each femtocell. Due to the fact that the total interference at the MeNB from all the
FUEs is constrained by Mκ , each MUE will always be able to satisfy its required SINR threshold when
connecting to the MeNB. Thus in terms of outage performance, a MUE has no reason to connect to a HeNB instead of the MeNB. However, depending on the operating point of the network, a MUE can achieve gains in terms of power savings if it were to connect to a nearby HeNB. We can define a decision rule in which each MUE can decide whether to access the MeNB or a nearby HeNB. With power savings
as the end goal, we can say that a given MUE on channel kC should connect to a nearby HeNB if the

IR3.3 v1.0
38
Public Information
transmit power needed to connect to the HeNB, denoted byATP , is less than the power needed to connect
to the MeNB, MTP . If we write the SINR at a femtocell access point on a given channel kC and rearrange
terms, we get:
γ
γ
σβκ
βκσ
MAnkMFTA
MFnk
MATA
dIP
I
dP
)( 2
2
+≥
≥+
−
(3-18)
which is a lower bound on the power needed to connect to the HeNB. Note that the bound is proportional
to the distance from the MUE to the HeNB, MAd , as well as the interference observed by the HeNB on
channel kC . Furthermore, the bound is scaled by Fκ for further robustness against any additional
interference the MUE-HeNB link may encounter. Thus if we define the decision rule for which a MUE
should connect to a HeNB as AM TT PP > and use the minimum powers derived above, after rearranging
terms we get:
2
2 )(
nM
MAnkFMB
dId
σκσκ γ
φ +> (3-19)
which gives the decision rule in terms of the network parameters, the interference at the HeNB on channel
kC , and the path-loss of the two different links. We assume that there is a mechanism in place in which
MUEs can either learn the distances of the two links or the path-loss of those links. Using the decision rule, MUEs can coordinate with a nearby HeNB to be admitted to the femtocell and be power controlled as if it were just another FUE. Recall however that a HeNB can only support F links and those links could be in use by the FUEs in the femtocell. As a solution, we propose that the MUE share one of the channels actively in use by a FUE. We intend for the sharing to be made possible through successive interference cancellation at the HeNB. We will give more details on this in the following sections. Each HeNB manages the channel assignment for the F femto users within its own femtocell. It is in the best interest of the FUEs in terms of power consumption and link outage to use the channels with the least amount of interference. To achieve this, we assume that if there is a MUE who wishes to join the
femtocell on a given channelkC , and if the SINR requirements for a FUE can be met on that channel, the
MUE should be assigned to kC . In doing so, the high power signal the MUE uses to get to the MeNB,
which causes high interference to the HeNB, can be lowered to a level that is manageable by the HeNB. It is important that HeNBs exploit the sharable channels whenever possible as the number of non-shared channels available for use in the femtocell may be less than the number of FUEs who desire a link. If there are FUEs who cannot be serviced by a shared channel with a MUE, we assume that HeNBs measure
the interference kI on a given channel kC . We assume each HeNB measures the interference on all of
the cN channels and orders them with respect to their interference powers. Thus without loss of
generality, we consider each HeNB to maintain a set of channels cNCCC >>> ...21 such that
cNIII <<< ...21 . Each HeNB can then assign the best non-shared channels to any of the users still
requiring a link. If there are no channels in which a FUE can establish a link with its HeNB, then the user does not receive a channel and is considered to be in outage.
3.3.3 Successive Interference Cancellation We utilize successive interference cancellation (SIC) as the means in which a MUE and a FUE can communicate with a femtocell access point in a multiple access manner. SIC has been shown as a feasible technique in OFDM networks for both uncoded and coded systems. The performance of SIC depends largely on the channel estimation of the interfering signal so that it can be successfully subtracted from the received signal. For our system, we intend the macrocell user to be the primary user and the femto user to be the interfering user. The FUE is located very close the HeNB and is often slow moving or stationary. Thus channel estimation for a femto user link should be highly accurate. Following the methodology in [54], both the FUE and MUE transmit simultaneously and the femtocell access point regenerates the interfering signal and subtracts it from the received signal. After decoding the FUE’s

IR3.3 v1.0
39
Public Information
signal, the femtocell access point can then decode the macro user’s signal. Using this strategy, we are able to achieve the joint decoding and both the MUE and FUE can achieve their desired SINR threshold while sharing a single channel.
3.3.4 Numerical Results We now present the simulation results for the architecture described above with the network parameters in Table 3-1. As a comparison, we show results for two schemes. The first scheme we consider is one that uses the femtocell user power control and channel assignment described above but does not allow a MUE to handover to the femtocell. We denote this scheme as PC. The second scheme we consider is one that incorporates the macrocell to femtocell handover enabled by the successive interference cancellation in addition to the power control and channel assignment as in the PC scheme. We label the second scheme as SIC for convenience. In Figure 3-10 we show the percentage of macro users that handover to a nearby femtocell versus the average number of femtocells per macrocell. We can immediately see that as femtocells are added to the network, a percentage of the MUEs does handover to the femtocells. When the average number of femtocells reaches ten, we can see that the percentage of handovers levels off at
about 30% and remains constant for the range of fN shown. Recall that the decision rule that determines
whether a MUE should handover to a FUE is a function of the interference at the HeNB as well as the
pathloss between the MUE and the HeNB. As fN increases, the number of femtocell users causing
interference in the network also increases which in turn should decrease the threshold of the decision rule. However, due to the constant value the handover percentage maintains suggests that the dominating factor of the threshold is not the interference but rather the pathloss of the channel. Due to the distance based pathloss model and the uniform distributions of the users, there will be an average pathloss realized per link in the network which will upperbound the probability of a handover occurring. If we were to change the value of γ , the pathloss exponent for the MUE-HeNB link, we would be able to realize different
values in the handover probability.
Table 3-1 Simulation Parameters

IR3.3 v1.0
40
Public Information
Figure 3-10: Average number of macro user handovers and their corresponding average power savings vs. the average number of femetocells per macrocell. SIC is used to allow for a macrocell
user and femtocell user to share a common channel.
We mentioned above that as macro users access a nearby HeNB rather than the MeNB, they will be able to lower their transmit power. Also in Figure 3-10, we plot the average transmit power savings for a macrocell user in the network versus the average number of femtocells. We can immediately notice that the shape of the power savings curve is identical to the curve for the percentage of macrocell user handovers that occur. Intuitively, this makes sense that the percentage savings will be proportional to the number of handovers. What is interesting to note however is the amount of savings that are realized. For the 30% handover probability, a corresponding 90% of power savings is realized. Thus, even though only a small percentage of the MUEs actually handover, the reduction in their transmit power is significant enough to realize large savings as a whole for the network. We have just shown that allowing MUEs to access a nearby HeNB rather than the MeNB can result in significant gains from the perspective of a given macrocell user. Gains are also realized from the FUEs perspective as well. As MUEs lower their transmit power to connect to a nearby HeNB, the amount of interference they cause to other femtocells also decreases. This will in turn increase the likelihood of FUEs in those other femtocells being able to establish a link. In Figure 3-11 we plot the average number of femtocell users who are able to maintain a link at the required SINR with their corresponding HeNB. We show curves for both the PC scheme without the handover process and the SIC scheme that allows the handover to occur. We can clearly see that the SIC scheme outperforms the PC scheme and at high
values of fN , large gains in the number of users served are realized. We also note that at smaller values
of fN , the PC scheme’s performance decays at a faster rate than SIC. Then around 25=fN , the two
schemes begin to decay at the same rate. As more femtocell users are served in the network, we will see additional gains in terms of network throughput. Recall that the M macro users are always guaranteed a
channel of at least an SINR level of Mβ from either the MeNB or a nearby HeNB. Thus, the macro user
component of the sum rate will always be equal to )1log( MM β+ whether or not the femtocell
network is present. Any gains in the sum rate will come from the additional FUE links that are being added to the network. Due to the interference management in the femtocells, femto user links are power
controlled to SINR levels of FF βκ . When calculating the rates of the links however, we consider that

IR3.3 v1.0
41
Public Information
the additional power used in the power control does not contribute any extra rate over the link. Thus, we can formally write the rate for a given femtocell user i as:
≤≤+
=otherwise
SINRifR FFFUFF
FUi
i,0
),1log( βκββ (3-20)
where FUEs are considered to be in outage if they cannot meet their required SINR. Having defined the
rate per femtocell user, and knowing that there are on average fN femtocells per macrocell and F femto
users per femtocell, we can write the sum rate gain as:
∑=+
=fFN
iiFU
Mgain R
MR
1)1log(
1
β (3-21)
where the gains from the femtocell component of the sum rate are calculated as a percentage of the sum rate of the macrocell user only network. We can derive an upper bound on the sum rate gain from the scenario that all FUEs in each femtocell are able to satisfy their required SINR threshold with their
corresponding femtocell access point. We know that there are on average fFN femtocell users per
macrocell, thus it is easy to show that the maximum sum rate gain satisfies the condition: max)1log( RFNR Ffgain =+< β (3-22)
where the upper bound is linear in the average number of femtocells per macrocell. In Figure 3-12 we plot the average sum rate gain of the network for the two schemes considered above. In addition, we plot the upper bound on the sum rate gain. We can immediately see that the SIC scheme outperforms the PC
scheme in terms of the sum rate gain achieved. As fN increases, we see that the amount of gain of the
SIC scheme over PC scheme also increases. We further note that the SIC scheme is significantly closer to
the maximum sum rate gain than the PC scheme for all values of 10>fN .
Figure 3-11: Average number of femtocell users who are served by their corresponding femtocell
access points versus the average number of femtocells per macrocell.

IR3.3 v1.0
42
Public Information
Figure 3-12: Average sum rate gain of a power control (PC) scheme that does not allow macro user
handover versus the same scheme that does allow macrocell user handover using SIC
3.3.5 Conclusions We have analyzed practical femtocell architecture and quantified both user level and network level gains that can be achieved. We developed a femtocell user power control scheme that relies on minimal coordination from the macrocell MeNB to operate. A channel sensing scheme was used to assign femtocell users with channels that exhibit low interference levels. Simulations show that this scheme achieves good performance in terms of sum rate gain and in the number of femto users served in the network. We then developed a decision rule in which macro users could connect to a nearby femtocell access point rather than the MeNB. We utilize successive interference cancellation to allow femto and macro users to share a common channel and connect simultaneously to the femtocell access point. Using this second scheme, we show that even more gains from both the user and network perspectives can be realized over the first scheme. Taking 35=fN as an example, 30% of macro users joined a nearby
femtocell which in turn yielded an average power savings of 90% per macro user, 30% more femtocell users being served by femto access points, and almost a 100% increase in the sum rate gain. Thus, with a relatively small change to the structure of the macrocell network, significant gains for both macrocell and femtocell users as well as the network as a whole can be realized.

IR3.3 v1.0
43
Public Information
4. Performance of Spatial Multiplexing for Heterogeneous Macro/Femto Network in Sub-urban Environment Spatial multiplexing is a prominent feature of MIMO systems in 3GPP LTE networks. In order to achieve higher number of spatial layers (for a given antenna configuration), higher SINR (signal to interference-plus-noise ratio) values are required. The wall penetration losses between a macro base station (MeNB) and an indoor user significantly affect the radio quality of these users. On the other hand, a femtocell network is equipped with low power base stations that are located indoor. Hence indoor users served by HeNBs are expected to experience higher SINR values and could be more probable to achieve higher number of spatial layers if configured with MIMO spatial multiplexing modes. In this section, we study the performance of heterogeneous femto/macro network characterized by a MIMO spatial multiplexing mode for various antenna configurations. We present the values of two key performance indicators (KPIs), namely average cell throughput and average spectral efficiency with full frequency reuse in both the macro and femto networks. We show how the objective of 8 bps/Hz spectral efficiency could be achieved in femto network by exploiting MIMO spatial multiplexing. The enhancement in performance as a result of spatial multiplexing in macro LTE networks has already been demonstrated in existing literature. Some references on the subject are: [5]–[8]. As for the performance analysis of spatial multiplexing in heterogeneous macro-femto network, some recent articles could be spotted. For example in [9], results for SU-MIMO (single user-MIMO) mode of LTE (which is one of the spatial multiplexing modes of LTE) are given. Authors have assumed reuse 1 in both macro and femto networks and have considered maximum of two femto cells per macro cell area. Authors of [10] have developed analytical models for the coverage evaluation in a two tier macro/femto network. Two spatial multiplexing modes, SU-MIMO and MU-MIMO (Multi-User MIMO), have been considered in this study. However, to simplify the analytical approach, authors have not considered shadowing in their model. Furthermore, they consider flat Rayleigh fading per subband. In this work we rely on Monte Carlo simulations to analyze the performance of spatial multiplexing mode (SU-MIMO) of LTE in a reuse 1 macro network with underlay femto network for different antenna configurations. The rest of the section is structured as follows. A brief introduction of closed loop spatial multiplexing mode of LTE (Rel. 8,9) is given in subsection 4.1. Details about wireless channel model, interference calculation and effective SINR computation are presented in section 4.2. In subsection 4.3, overall system description and simulation campaign parameters are introduced. Monte Carlo simulation results are discussed in subsection 4.4 followed by conclusion in subsection 4.5.
4.1 Close-Loop Spatial Multiplexing (CLSM)
Among the multiple spatial multiplexing modes specified in LTE (Rel. 8,9) [11], we focus on CLSM which is transmission mode 4 of LTE. In this transmission mode, independent data streams could be transmitted from each transmitting antenna. The maximum number of spatial streams is defined by min(Nt,Nr) where Nt and Nr are the number of transmit and receive antennas respectively. The UE sends the following three feedback (reflecting its radio environment) to the BS:
• CQI (channel quality indication) • PMI (precoding matrix indicator) • RI (rank indication)
where CQI specifies the modulation and coding scheme, PMI refers to the index of the codebook (a set of precoding matrices [12]) and RI indicates the maximum number of spatial layers that the UE could support. CQI and PMI are sent by the UE with the same periodicity, whilst RI is fed back with a period which is multiple of that of CQI/PMI. Furthermore, the CQI and PMI both could be frequency selective with a possible granularity to the level of a subband whereas RI is measured over wideband [12]. The elements of the transmission chain that involve CQI, PMI and RI feedbacks are shown in Figure 4-1. According to [12], whatever the antenna configuration may be, the maximum of two codewords can be transmitted simultaneously.

IR3.3 v1.0
44
Public Information
Figure 4-1 The elements in the transmission chain that implicate CQI, PMI and RI feedbacks at different stages.
4.2 Interference and Channel Model
4.2.1 Channel Realization The radio channel between a UE u and a (H)eNB b suffers from long-term as well as short-term
variations. The long-term propagation loss encompass the path loss ),( ubpl and the lognormal shadowing
( ))(),( ~ bubSh ~l σ0,N
. These components are computed according to the model 1 of [13]. Since the antenna
gain of the UE g(u) and that of (H)eNB g(b) are also fixed entities, we subtract the two from the propagation loss and the resultant long-term variations loss L(b,u) can be written as:
( ) ),(),()()(),(10log10 ub
shub
pbuub llggL −−+= (4.1)
where all the terms on the right hand side of the equation above are in dBs. The short-term part represents the fast fading. It is generated by using the MIMO SCME (spatial channel model extended) channel introduced in [14] which supports bandwidths higher than 5 MHz (since the bandwidth used in our system simulations is 10 MHz). For Doppler effect, a velocity of 3 km/h has been considered. As for power and delay profile, the urban macro (UMa) model has been taken into account. From the temporal representation, the frequency domain response is derived using FFT of size NFFT. The number of useful subcarriers N is bandwidth specific and can be referred from [15].
4.2.2 Subcarrier SINR Minimum mean square error (MMSE) receiver is applied on each subcarrier to detect each layer. Ignoring the fast fading gain associated with interfering (H)eNB, post-receiver SINR of subcarrier n for a UE u is calculated over every spatial layer transmitted.
4.2.3 Effective SINR Channel gains experienced by subcarriers are likely to be different over the whole band due to the small coherence bandwidth (inversely proportional to the delay spread) of the multipath channel. Hence, different subcarriers (and subbands) may suffer from different SINR and the error rates on these subcarriers may not be the same. Therefore, block error rate (BLER) of the coded block (transmitted over multiple subcarriers) cannot be obtained through direct averaging of these error rates. In order to obtain a single SINR value of multiple subcarriers that could correspond to this BLER, certain physical abstraction models are used. The resultant single value is called the effective SINR. In our System Level Simulations (SLS), we have used the physical abstraction model Mean Instantaneous Capacity (MIC) [16]. As for CQI, we have chosen “higher layer configured subband” reporting [12], so that the CQI for subband s is computed based on effective SINR. Each subband is comprised of NSc subcarriers. The set of subbands for which a UE has to send CQI reports back to (H)eNB is configured by Radio Resource Control (RRC). The instant of these reports is also set by RRC. In our simulations, we have considered a periodic reporting every five Transmission Time Interval (5ms).
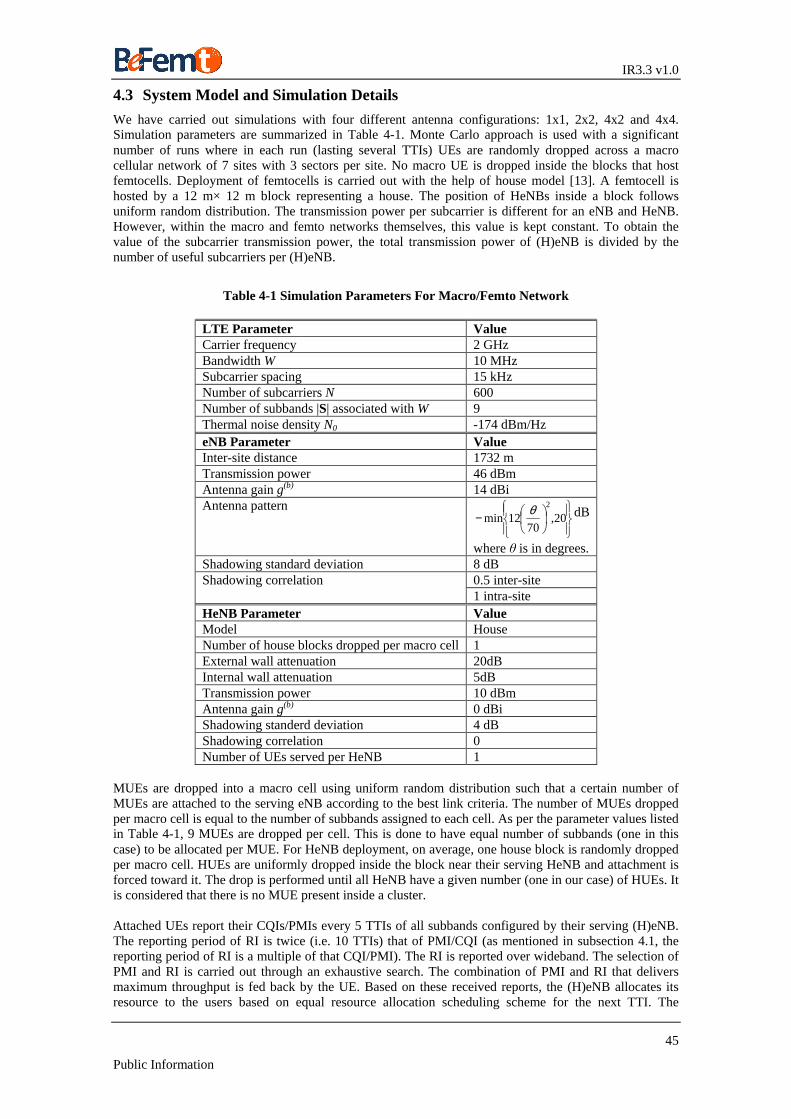
IR3.3 v1.0
45
Public Information
4.3 System Model and Simulation Details
We have carried out simulations with four different antenna configurations: 1x1, 2x2, 4x2 and 4x4. Simulation parameters are summarized in Table 4-1. Monte Carlo approach is used with a significant number of runs where in each run (lasting several TTIs) UEs are randomly dropped across a macro cellular network of 7 sites with 3 sectors per site. No macro UE is dropped inside the blocks that host femtocells. Deployment of femtocells is carried out with the help of house model [13]. A femtocell is hosted by a 12 m× 12 m block representing a house. The position of HeNBs inside a block follows uniform random distribution. The transmission power per subcarrier is different for an eNB and HeNB. However, within the macro and femto networks themselves, this value is kept constant. To obtain the value of the subcarrier transmission power, the total transmission power of (H)eNB is divided by the number of useful subcarriers per (H)eNB.
Table 4-1 Simulation Parameters For Macro/Femto Network
LTE Parameter Value Carrier frequency 2 GHz Bandwidth W 10 MHz Subcarrier spacing 15 kHz Number of subcarriers N 600 Number of subbands |S| associated with W 9 Thermal noise density N0 -174 dBm/Hz eNB Parameter Value Inter-site distance 1732 m Transmission power 46 dBm Antenna gain g(b) 14 dBi Antenna pattern
− 20,70
12min2θ dB
where θ is in degrees. Shadowing standard deviation 8 dB
0.5 inter-site Shadowing correlation 1 intra-site
HeNB Parameter Value Model House Number of house blocks dropped per macro cell 1 External wall attenuation 20dB Internal wall attenuation 5dB Transmission power 10 dBm Antenna gain g(b) 0 dBi Shadowing standerd deviation 4 dB Shadowing correlation 0 Number of UEs served per HeNB 1
MUEs are dropped into a macro cell using uniform random distribution such that a certain number of MUEs are attached to the serving eNB according to the best link criteria. The number of MUEs dropped per macro cell is equal to the number of subbands assigned to each cell. As per the parameter values listed in Table 4-1, 9 MUEs are dropped per cell. This is done to have equal number of subbands (one in this case) to be allocated per MUE. For HeNB deployment, on average, one house block is randomly dropped per macro cell. HUEs are uniformly dropped inside the block near their serving HeNB and attachment is forced toward it. The drop is performed until all HeNB have a given number (one in our case) of HUEs. It is considered that there is no MUE present inside a cluster. Attached UEs report their CQIs/PMIs every 5 TTIs of all subbands configured by their serving (H)eNB. The reporting period of RI is twice (i.e. 10 TTIs) that of PMI/CQI (as mentioned in subsection 4.1, the reporting period of RI is a multiple of that CQI/PMI). The RI is reported over wideband. The selection of PMI and RI is carried out through an exhaustive search. The combination of PMI and RI that delivers maximum throughput is fed back by the UE. Based on these received reports, the (H)eNB allocates its resource to the users based on equal resource allocation scheduling scheme for the next TTI. The

IR3.3 v1.0
46
Public Information
minimum scheduling unit is one subband. The scheduling of MUEs is carried out in a way that a subband is allocated to a UE which has the best channel quality on that subband while satisfying the condition that every UE gets equal number of subbands. However, equal resource allocation is not of that importance for the femto cells given the fact that each HeNB serves only one HUE at an instance and allocates all available subbands to it. We consider full buffer traffic model for both the HUE and MUE. The throughput calculation is derived from the effective SINR for each scheduled UE by using truncated Shannon bound, in adequation with the approach adopted in [17].
4.4 Analysis of Numerical Results
In this subsection, we present and discuss the results obtained through simulations. Since the amount of resources allocated per user is different for femto and macro networks, user throughput can not be used as a metric of comparison. In order to fairly compare all the scenarios, in Figure 4-2, we have presented the CDF of average spectral efficiency in bps/Hz that does not depend upon the amount of allocated resources per user. Comparing the results shown in the figure, it becomes evident that for all antenna configurations, average spectral efficiency of femto users is higher than that of macro users. This difference becomes more prominent when number of antennas at two ends (i.e. base station and user equipment) increases. The reason is that because of better radio conditions for femto users, they achieve higher number of spatial layers as compared to their counterparts in macro networks. The average values of spectral efficiency for different antenna configurations are given in Table 4-2. It can be observed that only CLSM, with 4x4 MIMO, results into an average spectral efficiency value (the only bold number in the figure) of more than 8 bps/Hz (target value set for BeFEMTO project).
0 5 10 15 200
0.1
0.2
0.3
0.4
0.5
0.6
0.7
0.8
0.9
1
Spectral Efficieny [bps/Hz]
Cum
ulat
ive
Dis
trib
utio
n F
unct
ion
(CD
F)
Femto 1x1Macro 1x1Femto 2x2Macro 2x2Femto 4x2Macro 4x2Femto 4x4Macro 4x4
Figure 4-2 CDF of spectral efficiency (bps/Hz) of both the macro and the femto under different
antenna configurations

IR3.3 v1.0
47
Public Information
0 20 40 60 80 100 120 140 1600
0.1
0.2
0.3
0.4
0.5
0.6
0.7
0.8
0.9
1
Cell Throughput [Mbps]
Cum
ulat
ive
Dis
trib
utio
n Fu
nctio
n (C
DF)
Femto 1x1Macro 1x1Femto 2x2Macro 2x2Femto 4x2Macro 4x2Femto 4x4Macro 4x4
Figure 4-3 CDF of cell throughput (Mbps) of both the macro and the femto under different antenna
configurations
Table 4-2 Comparison of Average Values of Different Key Performance Indicators (KPIs)
Parameter Antenna configuration
Macro cell Femtocell
1x1 12.8 34.6 2x2 20.5 62.6 4x2 24.3 68.1
Average cell throughput (Mbps)
4x4 36.5 123.5 1x1 1.3 3.8
2x2 2.2 7 4x2 2.6 7.6
Average spatial spectral efficiency (bps/Hz)
4x4 3.9 13.7 Thus, CDFs of average cell throughput for all antenna configurations are given in Figure 4-3. This figure provides the benchmark values for different antenna configurations for the femto as well as macro network. However, it should be kept in mind that these values correspond to suburban environment of macro and house model of femto. The average values of cell throughput for different antenna configurations are also given in Table 4-2.
4.5 Conclusion
In this section, we have shown the performance of a macro/femto network equipped with MIMO spatial multiplexing mode in a suburban environment. We have shown that for house model of femto, the target value of 8bps/Hz is attainable with 4x4 antenna configuration. We have also provided the benchmark values of spectral efficiencies and cell throughput for above mentioned scenarios. However, the feasibility of 4x4 antenna configuration is quite optimistic. Hence in the future, our objective is to reach the target value with lower antenna configurations through interference mitigation.

IR3.3 v1.0
48
Public Information
5. Conclusion In this deliverable, various methods targeting interference mitigation in the context of heterogeneous network with femto cells and a macrocell network overlay are presented. The impact of several static frequency portioning schemes applied to the overlay macro network are compared in terms of performance as well for the macro network as for the underlay femto network. System parameters were studied, such as the femtocells activation rate, and the macro cell inter site distance. In all cases, IFR and FR3 outperformed the other schemes for macro and femto networks . In the future, more dynamic algorithms will be studied to identify feasible and efficient trade-offs between performance gain versus complexity and signalling Another powerful tool to mitigate co-tier and cross-tier interference is dynamic power control. Various strategies were presented in this document. In the first one the macro and femtocell coexistence was modelled using tools from stochastic geometry with which the aggregate interference is characterized. Self-organization strategies were then examined leveraging on the concept of cumulants. The proposed statistical model approach matches very well the Monte Carlo simulations. Future work will look into further optimizing the transmission strategies in terms of power levels and frequency allocation. The second strategy consists in taking advantage of the specificities of femtocells communications: they are short range, leading to a high quality downlink signal, and only few UEs locally compete for a large amount of spectrum resource. A novel radio resource management scheme was proposed that limits the undesired effects of interference by increasing the number of RBs while reducing the radiated power (in each RB) required at femtocells to meet target QoS constraints. The effectiveness of the proposed scheme was evaluated for different femtocells loads and different dense urban deployment scenarios based on the 3GPP/LTE specifications. In a third method, power control is applied on the downlink of a femtocell in order to maximize the femtocell throughput, while keeping the interference level below a certain threshold. In addition, cell edge FUEs use Successive Interference Cancellation (SIC) to cancel out macro cell interference. The fourth method considers an uplink strategy, where a macrocell should be protected from interference created by FUEs. A FUE power control scheme is proposed, that relies on minimal coordination from the MeNB to operate. Then, a decision rule is depicted, in which macro users may connect to a nearby femtocell access point rather than the MeNB, basically if it saves energy. SIC is used to allow femto and macro users to share a common channel of the HeNB. Future work will look into the impact of imperfection of SIC on the overall performance. The benefits of Multiple Input Multiple Output (MIMO) transmission on the 3GPP LTE performance are demonstrated by simulation. Results show that the BeFEMTO target value of 8bps/Hz is attainable with a 4x4 antenna configuration. Finally, Appendix A presents calibration results of the system level simulators used by each partner, thus enforcing the consistency and coherency of WP3 outputs. Static calibration of macrocell-only results was given in BeFEMTO D2.1 [29]. This appendix extends those results by adding the static calibration of different femtocell models. One dynamic calibration is also performed in a macrocell-only case, validating in particular the spatial channel model used.

IR3.3 v1.0
49
Public Information
6. Appendix A: System Level Calibration In order to facilitate the comparison between the partners’ contributions, WP3 decides to trigger a calibration of the system level simulators used by each partner, thus enforcing the consistency and coherency of WP3 outputs. Static calibration of macrocell-only results was given in BeFEMTO D2.1 [29]. This section extends those results by adding the static calibration of different femtocell models. One dynamic calibration is also performed in a macrocell-only case, validating in particular the spatial channel model used.
6.1 Static Calibration
This subsection recalls the common deployment properties used for the static calibration as well as results from the WP3 partners. These assumptions are adapted from 3GPP TR 25.814 [13] and TR 36.814 (Model 1) [30] to meet BeFEMTO constraints.
6.1.1 Configuration Parameters
6.1.1.1 Layout and Deployment
Table 6-1: Macrocell layout
Macrocell network layout 3-sector sites either 19 of 7 sites (57 or 21 cells)
Site to site distance m500=R
Sector boresight 30,150,270°
Carrier frequency GHz2=cf
Wrap-around Yes
-1500 -1000 -500 0 500 1000 1500-1500
-1000
-500
0
500
1000
1500
01
2
34
5
67
8910
11
1213
14 1516
17
1819
20
2122
23
2425
26
2728
29
3031
32
3334
35
3637
38
3940
41
4243
44
4546
47
4849
50
5152
53
5455
56
meters
met
ers
LTE-like macrocell map
2 GHz
Figure 6-1: 19 sites (3 sectors) layout
eNB

IR3.3 v1.0
50
Public Information
-1000 -500 0 500 1000-1000
-500
0
500
1000
01
2
34
5
67
8910
11
1213
14 1516
17
1819
20
meters
met
ers
LTE-like macrocell map
2 GHz
Figure 6-2: 7 sites (3 sectors) layout
The following models are assumed for femtocell deployment.
Table 6-2: 5x5 Grid deployment
Femtocell model 5x5 Grid cf. Figure 6-3
Block dimensions 10m x 10m 25 blocks
Deployment distribution 1 per sector
HeNB deployment probability 0.2 Probability that a block contains a HeNB
HeNB deployment distribution uniform Inside a block, the HeNB is dropped according
to a uniform law
-600 -580 -560 -540
-290
-280
-270
-260
-250
-240
-230
-220
meters
met
ers
Figure 6-3: 5x5 Grid model

IR3.3 v1.0
51
Public Information
-1000 -500 0 500 1000-1000
-500
0
500
1000
01
2
34
5
67
8910
11
1213
14 1516
17
1819
20
meters
met
ers
LTE-like macrocell map
2 GHz
Figure 6-4: 7 sites (3 sectors) + 21 5x5 Grids (drop example)
Table 6-3: Dual-Stripes deployment
Femtocell model Dual-Stripes cf. Figure 6-5
Number of floors 6
Block dimensions 10m x 10m 40 blocks per floor
Deployment distribution 1 per sector
HeNB deployment probability 0.1 Probability that a block contains a HeNB
HeNB deployment distribution uniform Inside a block, the HeNB is dropped according
to a uniform law
-600 -580 -560 -540 -520 -500 -480 -460280
300
320
340
360
380
400
meters
met
ers
Figure 6-5: Dual-Stripes model

IR3.3 v1.0
52
Public Information
-1000 -500 0 500 1000-1000
-500
0
500
1000
01
2
34
5
67
8910
11
1213
14 1516
17
1819
20
meters
met
ers
LTE-like macrocell map
2 GHz
Figure 6-6: 7 sites (3 sectors) + 21 Dual-Stripes (drop example)
6.1.1.2 Base Stations and User Equipment
Table 6-4: Macrocell Base Station (eNB)
Tx 1
Rx 1
Boresight Antenna Gain dBi14max =G Include coupling loss
Antenna Front to Back Ratio dB252 =bfG
Angle spread for 3dB attenuation °=Θ 703dB
Antenna Gain )dB(eNBG cf. (6.1)
Total Power dBm46=TxP 43dBm when BW ≤ 5MHz
46/49dBm when BW > 5MHz
Forbidden Drop Radius m35=fR No mobile inside this radius
Let Θ be the angle between the sector and the mobile (eNB-UE) line of sight and the sector boresight,
the antenna gain in dB is given by:
( )
°≤Θ≤°−
ΘΘ−=Θ
180180
,12min 2
2
3max bf
dBeNB GGG
(6.1)
Θ
Boresight eNB
UE d

IR3.3 v1.0
53
Public Information
Table 6-5: Femtocell Access Point (HeNB)
Tx 1
Rx 1
Omni Antenna Gain dBi0 GHeNB = Include coupling loss
Total Power dBm10=TxP Maximum power investigated inside
BeFEMTO
Forbidden Drop Radius m2.0=fR No mobile inside this radius
Table 6-6: User Equipment (UE) parameters (both Macro and Femto)
Tx 1
Rx 2
Omni Antenna Gain dBi0=UEG Include coupling loss
Noise Figure dB9=NF
Outside block probability 0.0 Only for FUE deployment
6.1.1.3 Propagation Model
Table 6-7: General parameters
Total Bandwidth MHz10=BW 5/10/20/100MHz
Thermal Noise Density dBm/Hz1740 −=N
External Wall Attenuation dB20=extA Attenuation to consider when an external
wall is between a (H)eNB and a UE
Internal Wall Attenuation dB5=inA Attenuation to consider when an internal
wall is between a HeNB and a UE
Table 6-8: Macrocell parameters
UE is outside
)(log6.373.15)dB( 10 dPL += Pathloss
UE is inside
extAdPL ++= )(log6.373.15)dB( 10
d is the eNB-UE distance
in metres
Shadowing
Standard
Deviation
dB8=SD
The shadowing follows a
log-normal law
( ), SD~ SF 0)dB( N
Shadowing 1.0 Sectors from a same site

IR3.3 v1.0
54
Public Information
Correlation 0.5 Sectors from different sites
Shadowing
Autocorrelation 50m Optional
Table 6-9: 5x5 Grid parameters
UE is inside the 5x5grid
)(log3037)dB( 10 dPL +=
Pathloss
UE is outside the 5x5grid
extAdPL ++= )(log6.373.15)dB( 10
d is the HeNB-UE
distance in metres
Shadowing
Standard
Deviation
dB10=SD
The shadowing follows a
log-normal law
( ), SD~ SF 0)dB( N
Shadowing
Correlation 0 Between HeNBs
Shadowing
Autocorrelation 3m Optional
Table 6-10: Dual-Stripes parameters
UE is inside the same stripe
inn
n
indoorD
qAn
ddPL
++
++=
−++
46.01
2
,210
3.18
7.0)(log2046.38)dB(
UE is inside a different stripe
extinn
n
indoorD
AqAn
dddPL
23.18
7.0)(log6.373.15),(log2046.38max)dB(
46.01
2
,21010
+++
+++=
−++
UE is outside the stripe
extinn
n
indoorD
AqAn
dddPL
+++
+++=
−++
46.01
2
,21010
3.18
7.0)(log6.373.15),(log2046.38max)dB(
Pathloss
d is the HeNB-UE distance in metres
d2D,indoor is the HeNB-UE indoor distance in meters
n is the number of floors between the BS and the UE
q is the number of internal walls between the BS and the UE
Shadowing
Standard
Deviation
dB4=SD The shadowing follows a log-normal
law ( ), SD~ SF 0)dB( N
Shadowing
Correlation 0 Between HeNBs

IR3.3 v1.0
55
Public Information
Shadowing
Autocorrelation 3m Optional
6.1.2 Methodology
Table 6-11: Methodology parameters
Number of Runs 50
Number of femtocell cluster
per sector 1 In average.
Number of MUEs per Sector 10 In average. Attachment to a cell based on the best
received power
Number of HUEs per HeNB 1 Only for active HeNBs
For a given run:
• Macro UEs (MUEs) are dropped across the 2D-plan and attached to a sector (according to the pathloss or the receive power). The drop is performed until all sectors have a given number of MUEs. MUE can be dropped inside a 5x5 Grid or a Dual-Stripes.
-800 -600 -400 -200 0 200 400 600 800-1000
-800
-600
-400
-200
0
200
400
600
800
01
2
34
5
67
8910
11
1213
14 1516
17
1819
20
meters
met
ers
Run 0 - Mobile drop: v=indoor, o=outdoor
Figure 6-7: MUE attached to eNB according to the receive power without wrap-around (drop example)
• Home UEs (HUEs) are dropped near their serving HeNB with a given probability to be inside or outside the HeNB’s block. The drop is performed until all HeNBs have a given number of HUEs. For calibration purpose, the outside block probability was set to 0, so a HUE will always be dropped inside its HeNB’s block to reflect the 3GPP TR 36.814 assumptions [30].

IR3.3 v1.0
56
Public Information
490 500 510 520 530 540 550 560 570
320
330
340
350
360
370
380
390
400
3
meters
met
ers
Run 0 - Mobile drop: v=indoor, o=outdoor
Figure 6-8: HUE attached to HeNB (drop example: Grid 5x5, 1UE/HeNB)
The metrics of interest are collected every run and statistics are obtained accordingly.
6.1.3 Metrics of interest
6.1.3.1 G-factor
Let PL be the pathloss (including wall attenuation) in dB between a UE and a BS and G be the BS
antenna gain.
BS = eNB ( )Θ= eNBGG
BS = HeNB HeNBGG =
The long-term power received by a UE from a BS (BSi) is expressed in dB as
)()( UEBSSFPLGGPUEBSP iUETxi →−−++=→ (6.2)
where Θ is the angle between BS-UE line of sight and the sector boresight, d is the BS-UE distance and
)( UEBSSF i → is the (correlated) shadowing in dB between the BS and the UE. The G-factor is then
given by:
∑≠
+→→
=−
ijthermj
i
PUEBSP
UEBSPfactorG
)(
)(
(6.3)
where )( UEBSP k → is in mW and thermP is the thermal noise power given in mW by:
100
10 NFN
therm BWP+
= (6.4)
Note that the G-factor is independent of the number of antennas at both emission and transmission side.
6.1.3.2 Expected statistics
Mean, Median, 5-percantile and cumulative density function (cdf) of the G-factor in dB for MUEs and HUEs across the different runs.

IR3.3 v1.0
57
Public Information
6.1.4 Results The following tables depict the calibration results among WP3 partners for co-channel macrocell/femtocell deployment network based on an hexagonal 7 3-sector layout with wrap-around and a 10 MHz bandwidth. The results are presented for the 5x5 Grid and the Dual-Stripes thus covering the classical femtocell models.
6.1.4.1 5x5 Grid
System-Level Simulator Femtocell Calibration
Layout Hexagonal 7 3-sector sites with wrap-around - 21 5x5 Grids (20% deployment)Bandwidth 10MHzTransmit power 46dBm (Macro)
10dBm (Femto)
Macrocell G-factor (dB)CEA DOCOMO Sagemcom UOLU UniS AVERAGE
Average 5,88 5,29 4,54 4,44 5,31 5,09Median 5,17 4,01 3,63 3,21 5,02 4,21
5-percentile -4,17 -2,44 -3,48 -4,04 -3,99 -3,63
Femtocell G-factor (dB)CEA DOCOMO Sagemcom UOLU UniS AVERAGE
Average 3,85 4,59 4,02 3,46 3,46 3,88Median 3,38 3,54 3,81 3,07 2,53 3,26
5-percentile -17,32 -18,56 -20,27 -20,07 -17,67 -18,78
Macrocell
-0,2
0,0
0,2
0,4
0,6
0,8
1,0
-70 -60 -50 -40 -30 -20 -10 0 10 20 30 40 50 60 70
G-factor (dB)
CD
F
CEA
DOCOMO
Sagemcom
UOLU
UniS
Figure 6-9: CDF comparison of the macrocell G-factor among WP3 partners

IR3.3 v1.0
58
Public Information
Femtocell (5x5 Grid,20%)
0,0
0,1
0,2
0,3
0,4
0,5
0,6
0,7
0,8
0,9
1,0
-70 -60 -50 -40 -30 -20 -10 0 10 20 30 40 50 60 70
G-factor (dB)
CD
F
CEA
DOCOMO
Sagemcom
UOLU
UniS
Figure 6-10: CDF comparison of the femtocell G-factor among WP3 partners
6.1.4.2 Dual-Stripes
System-Level Simulator Femtocell Calibration
Layout Hexagonal 7 3-sector sites with wrap-around - 21 Dual-Stripes (10% deployment)Bandwidth 10MHzTransmit power 46dBm (Macro)
10dBm (Femto)
Macrocell G-factor (dB)CEA DOCOMO Sagemcom UOLU UniS AVERAGE
Average 5,52 4,64 4,37 4,84Median 4,57 3,37 3,16 3,70
5-percentile -2,83 -3,09 -3,99 -3,30
Femtocell G-factor (dB)CEA DOCOMO Sagemcom UOLU UniS AVERAGE
Average 12,28 12,23 11,38 11,96Median 12,21 12,05 11,16 11,80
5-percentile -6,18 -5,50 -5,19 -5,62

IR3.3 v1.0
59
Public Information
Macrocell
0,0
0,1
0,2
0,3
0,4
0,5
0,6
0,7
0,8
0,9
1,0
-70 -60 -50 -40 -30 -20 -10 0 10 20 30 40 50 60 70
G-factor (dB)
CD
F
DOCOMO
Sagemcom
UOLU
Figure 6-11: CDF comparison of the macrocell G-factor among WP3 partners
Femtocell (Dual-Stripes,10%)
-0,2
0,0
0,2
0,4
0,6
0,8
1,0
-70 -60 -50 -40 -30 -20 -10 0 10 20 30 40 50 60 70
G-factor (dB)
CD
F
DOCOMO
Sagemcom
UOLU
Figure 6-12: CDF comparison of the femtocell G-factor among WP3 partners
6.1.5 Conclusion The results seem to be inline among the partners, validating the layout and deployment assumptions as well as the pathloss equations for the various femtocell models: 5x5 Grids presents a high level of femto-to-femto interference, while the Dual-Stripes attenuates this effect due to the explicit modelling of the exact number of walls separating two HeNBs.

IR3.3 v1.0
60
Public Information
6.2 Dynamic Calibration
For dynamic system-level simulation, the fast fading over the time and the scheduling at each time transmit interval (TTI) are considered. These kind of simulations allow the testing and performance assessment of radio resource management algorithms. The same network configuration parameters as the ones used in the static case apply here. The only difference is that wrap-around can be turned-off to speed simulations. In such case, the 3 sectors of the central cell will be of interest, while the other sectors will be assumed to be fully loaded (maximum transmit power). The following parameters are given for an easy calibration phase within a simple SIMO context. Full buffer traffic model, truncated Shannon bound and Round-Robin scheduling (in a TDMA fashion, no need of feedback) have been preferred in order to limit the possible causes of misalignment among the partners.
6.2.1 Additional Configuration Parameters
6.2.1.1 Channel Model
Only the serving link channel should be accurately modelled using the following parameters:
Table 6-12: Channel Parameters
Model SCM cf. 3GPP TR 25.996 [31], table 5.1
Deployment Urban Macro UMa
Mean angle spread at BS 8°
Number of paths 6=N
Number of subpaths per path 20=M
Chip interval 684.3/1 −= eTc In second
Quantisation factor 16=Q
Line of sight Not considered
Antenna polarisation Not considered
6.2.1.2 Base Stations and User Equipment
Additional parameters are needed for the base stations (scheduling) and the user equipment (receiver).
Table 6-13: eNB and HeNB additional parameters
Scheduling Round Robin Time dimension for the allocation
Resource allocation per user Total Bandwidth 50RBs are allocated to one UE per TTI
Time transmit interval 1ms
Table 6-14: UE additional parameters
Antenna spacing 0.5 In wave length
Speed 3km/h
Receiver MRC / MMSE Perfect CSI at the receiver
Throughput estimation Truncated Shannon Bound cf. (6.5)
Traffic Full Buffer

IR3.3 v1.0
61
Public Information
6.2.2 Methodology The same methodology as previously is kept for each run regarding the drop method of the users. For one run, consecutive TTIs are generated and the channel of each serving link is updated accordingly to the SCM model, based on the user velocity.
6.2.3 Metrics of interest
When wrap-around is used, metrics should be gathered for all users.
6.2.3.1 Throughput estimation
Based on the SINR obtained through compression at the TTI t, the spectral efficiency (bits/s/Hz) of a scheduled user can be obtained using the truncated Shannon bound given by:
≤>+
=min
min2max
0
)1(log,min(
SINRSINR
SINRSINRSINR
t
tt
αηη (6.5)
where 6.0=α , 4.4max =η and 10)(min −=dBSINR for the DL.
-15 -10 -5 0 5 10 15 20 25 300
1
2
3
4
5
SINR(dB)
Spe
ctra
l effi
cien
cy η
(bi
ts/s
/Hz)
Shannon boundtruncated Shannon bound (DL)
Figure 6-13: Truncated Shannon bound in DL
The mobile throughput in bits/s is easily derived by multiplying the spectral efficiency by the allocated bandwidth B (in Hz).
Bmthpt tt η= (6.6)
Regarding compression, the Shannon capacity can be used to ease the computation. If )(nSINR denotes
the SINR computed on the subcarrier n then the compressed SINR is given by:
( )
= ∑
=
−N
n
nSINRIN
ISINR1
1 )(1
(6.7)
with the following compression function:
( ) ( )SINRSINRI += 1log2 (6.8)
6.2.3.2 Mobile throughput
The mobile throughput of the user equipment u is defined as the ratio between the sum of all the instantaneous throughputs computed using 0 and the number of TTIs per run T.
∑=
=T
tt umthpt
Tumthpt
1
)(1
)( (6.9)
The average mobile throughput is defined as the mobile throughput averaged over all mobiles U and averaged over all runs R.

IR3.3 v1.0
62
Public Information
∑=
=U
uavgUE umthpt
RUthpt
1, )(
1 (6.10)
6.2.3.3 Average cell throughput
The cell throughput of the base station c is defined as the sum of all mobile throughputs of all equipments attached to the base station cu.
∑
==
uc
ut umthptccthpt
1
)()( (6.11)
The average cell throughput is defined as the cell throughput averaged over all cells C and averaged over all runs R.
∑=
=C
uavgBS ccthpt
RCthpt
1, )(
1 (6.12)
6.2.3.4 Expected statistics
For the cell and the mobile throughput metrics, the mean (or average), the 5-percentile and the cdf are expected.
6.2.4 Results The following tables depicts the calibration results among WP3 partners for macrocell network only based on an hexagonal 19 3-sector layout with wrap-around and a 10 MHz bandwidth. System-Level Simulator Dynamic Macrocell Calibration
Layout Hexagonal 19 3-sector sites with wrap-aroundBandwidth 10MHzTransmit power 46dBm (Macro)Channel Model SCMUEs per cell 10Scheduler Round Robin, 1UE per TTI
Macrocell Throughput (Mbps)CEA DOCOMO Sagemcom UOLU UniS AVERAGE
Average 13,81 13,84 16,29 14,30 14,565-percentile 9,01 9,58 10,34 9,61 9,64
Mobile Throughput (Mbps)CEA DOCOMO Sagemcom UOLU UniS AVERAGE
Average 1,33 1,38 1,63 1,43 1,445-percentile 0,41 0,42 0,39 0,43 0,41
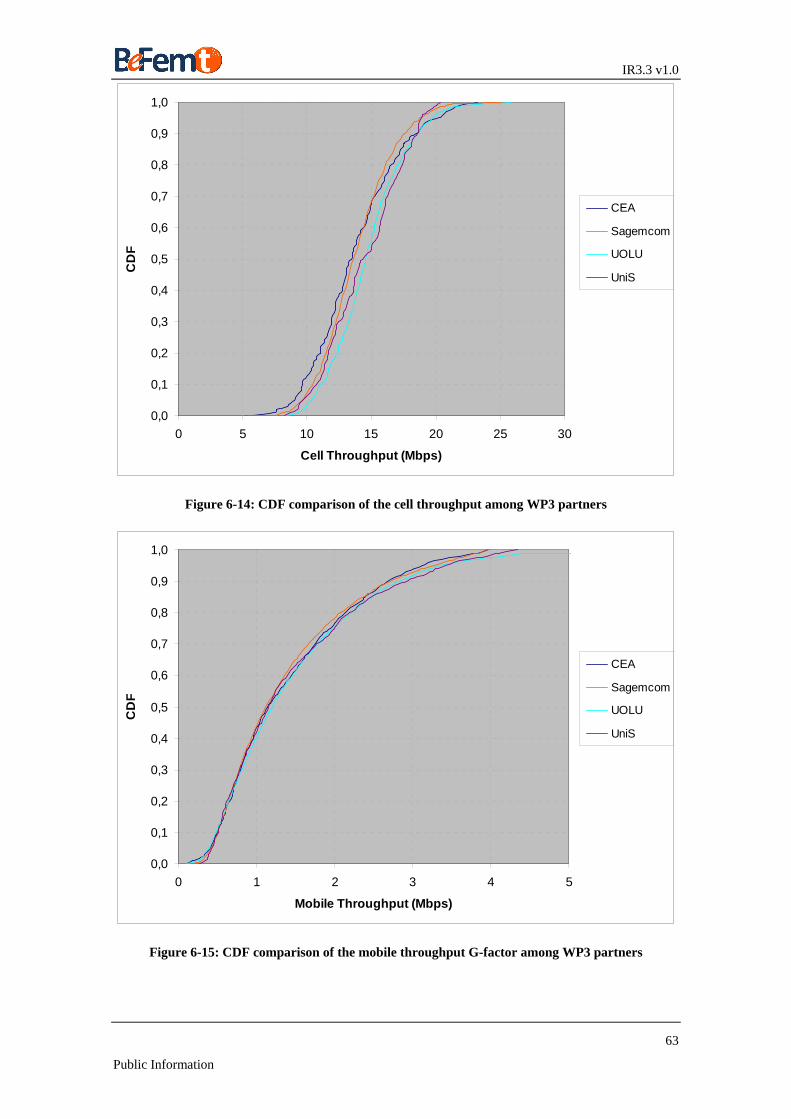
IR3.3 v1.0
63
Public Information
0,0
0,1
0,2
0,3
0,4
0,5
0,6
0,7
0,8
0,9
1,0
0 5 10 15 20 25 30
Cell Throughput (Mbps)
CD
F
CEA
Sagemcom
UOLU
UniS
Figure 6-14: CDF comparison of the cell throughput among WP3 partners
0,0
0,1
0,2
0,3
0,4
0,5
0,6
0,7
0,8
0,9
1,0
0 1 2 3 4 5
Mobile Throughput (Mbps)
CD
F
CEA
Sagemcom
UOLU
UniS
Figure 6-15: CDF comparison of the mobile throughput G-factor among WP3 partners
IR3.3 v1.0
64
Public Information
6.2.5 Conclusion Alignment in the CDF of the dynamic results is not as clear as for the static ones for the cell throughput, while the mobile throughput results seem to be more inline. Regarding the average values, they do not present a big deviation on both statistics among the partners. More particularly, 3 out of 4 are well aligned on average while one partner does present more optimistic values.

IR3.3 v1.0
65
Public Information
7. References [1] J. F. C. Kingman, Poisson Processes. Oxford University Press, 1993.
[2] A. Rabbachin, T. Q. Quek, H. Shin, and M. Z. Win, “Cognitive network interference,” IEEE JSAC, vol. 29, no. 2, February 2011.
[3] 3GPP TR 25.967, “Home Node B radio frequency RF requirements (FDD) (Release9),” v 9.0.0, May 2009.
[4] C. H. Lima, M. Bennis, M. Latva-aho, ”Coordination mechanisms for standalone femtocells in self-organizing deployments,” IEEE GLOBECOM 2011, Houston, USA.
[5] A. Ghosh, R. Ratasuk, B. Mondal, N. Mangalvedhe, and T. Thomas, “LTE-Advanced: Next-Generation Wireless Broadband Technology,” IEEE Transactions on Wireless Communications, June 2010.
[6] J. C. Ikuno, M. Wrulich, and M. Rupp, “System Level Simulation of LTE Networks,” in Proc. IEEE VTC Spring, May 2010.
[7] K. C. Beh, A. Doufexi, and S. Armour, “On the Performance of SU-MIMO and MU-MIMO in 3GPP LTE Downlink,” in Proc. of IEEE PIMRC, September 2009.
[8] Z. Bai, C. Spiegel, G. H. Bruck, P. Jung, M. Horvat, J. Berkmann, C. Drewes, and B. Gunzelmann, “On the Physical Layer Performance with Rank Indicator Selection in LTE/LTE-Advanced System,” in Proc. of IEEE PIMRC, September 2010.
[9] M. Simsek, T. Akbudak, B. Zhao, and A. Czylwik, “An LTE-Femtocell Dynamic System Level Simulator,” in Proc. of International ITG Workshop on Smart Antennas, February 2010.
[10] V. Chandrasekhar, M. Kountouris, and J. G. Andrews, “Coverage in Multi-Antenna Two-Tier Networks,” IEEE Transactions on Wireless Communications, October 2009.
[11] 3GPP TS 36.211, “Evolved universal terrestrial radio access network (E-UTRAN); physical channels and modulation (Release 9)”, v9.1.0., Mar. 2010.
[12] 3GPP TS 36.213, “Evolved Universal Terrestrial Radio Access (E-UTRA) Physical layer procedures (Release 9)”, v9.0.0, December 2010.
[13] 3GPP TR.25.814, “Physical Layer Aspects for Evolved UTRA (Release 7),” v7.1.0, September 2006.
[14] D. S. Baum, J. Hansen, G. D. Galdo, M. Milojevic, J. Salo, and P. Kysti, “An Interim Channel Model for Beyond-3G Systems Extending the 3GPP Spatial Channel Model (SCM),” in Proc. of IEEE VTC Spring, May 2005.
[15] 3GPP TS 36.214 “Evolved Universal Terrestrial Radio Access (E-UTRA); Physical layer; Measurements”, V10.0.0, Dec. 2010.
[16] K. Ramadas and R. Jain, “WiMAX System Evaluation Methodology,” WiMAX Forum, Tech. Rep., January 2007.
[17] Femto Forum, “Interference Management in OFDMA Femtocells,” Tech. Rep., March 2008. [Online]. Available: www.femtoforum.org
[18] 3GPP R1-050594, Alcatel, “Multi-cell Simulation Results for Interference Co-ordination in new OFDM DL”, TSG RAN WG1 LTE Ad Hoc on LTE, Sophia Antipolis, France Jun 2005
[19] 3GPP R1-050808, ETRI, “Inter-cell interference management in practical environments”, TSG RAN WG1 Meeting #42, London, UK, Sep , 2005
[20] 3GPP TSG-RAN4#51, Alcatel-Lucent, picoChip Designs, and Vodafone, “R4-092042, Simulation assumptions and parameters for FDD HeNB RF requirements,” May 2009.
[21] L.H. Ozarow, S. Shamai, and A.D. Wyner, “Information theoretic considerations for cellular mobile radio,” Transactions on Vehicular Technology, vol. 43, no. 2, pp. 359–378, may 1994.
[22] G. Ungerboeck, “Channel coding with multilevel/phase signals,” IEEE Transactions on Information Theory,, vol. 28, no. 1, pp. 55–67, January 1982.

IR3.3 v1.0
66
Public Information
[23] D. Chase, “Code Combining–A Maximum-Likelihood Decoding Approach for Combining an Arbitrary Number of Noisy Packets,” IEEE Transactions on Communications, vol. 33, no. 5, pp. 385–393, May 1985.
[24] B. Zubin, S. Andreas, A. Gunther, and H. Harald, “Dynamic Resource Partitioning for Downlink Femto-to-Macro-Cell Interference Avoidance,” EURASIP Journal on Wireless Communications and Networking, vol. 2010, 2010.
[25] 3GPP TSG-RAN1#62, “R1-105082, Way Forward on eICIC for non- CA based HetNets,” August 2010.
[26] 3GPP TS 36.240 v9.0.0 (2009-12), “Evolved Universal Terrestrial Radio Access Network (E-UTRAN); X2 general aspects and principles (Release 9)”
[27] BeFEMTO IR3.1, “State of the art and preliminary recommendations”, ICT 248523 FP7 BeFEMTO project, June 2010
[28] S. Sinanovic, G. Auer, H. Haas: Interference Analysis of Busy Burst Enabled Interference Avoidance. GLOBECOM 2010: 1-5
[29] BeFEMTO D2.1, “Description of baseline reference systems, use cases, requirements, evaluation and impact on business model”, ICT 248523 FP7 BeFEMTO project, December 2010.
[30] 3GPP TR 36.814, “Evolved Universal Terrestrial Radio Access (E-UTRA); Further advancements for E-UTRA physical layer aspects (Release 9)”, v9.0.0, March 2010.
[31] 3GPP TR 25.996, “Spatial channel model for Multiple Input Multiple Output (MIMO) simulations (Release 9)”, v9.0.0, December 2009.
[32] S. Carlaw, “Ipr and the potential effect on femtocell markets,” Femto- Cells Europe, ABIresearch, 2008
[33] S. Geirhofer, L. Tong, and B. M. Sadler, ``Interference-aware ofdma resource allocation: a predictive approach,'' IEEE Military Communications Conference, 2008 MILCOM 2008, pp. 1–7, Nov. 2008.
[34] P. Thulasiraman and X. Shen, ``Interference aware resource allocation in hybrid hierarchical wireless networks,'' Computer Networks (Elsevier), vol. 54, no. 13, pp. 2271-2280, Sep. 2010.
[35] D. L. Perez et al, ``OFDMA femtocells: a roadmap on interference avoidance,'' IEEE Communication Mag., Sept, 2009.
[36] Kulkarni, ``Radio Resource Management Considerations for LTE Femto Cells,'' ACM-SIGCOMM, 2010.
[37] M. Nazir et al, ``Learning based mechanisms for interference mitigation in self-organized femtocell networks'', Signals, Systems and Computers (ASILOMAR), 2010 Conference Record of the Forty Fourth Asilomar Conference on, 7-10 Nov. 2010.
[38] Ji-Hoon Yun and K.G. Shin, ``Adaptive interference management of OFDMA femtocells for co-channel deployment,'' IEEE Journal on Selected Areas in Communications, pp 1225-1241, June 2011.
[39] T. Weiss and F. K. Jondral, ``Spectrum pooling: an innovative strategy for the enhancement of spectrum efficiency,'' IEEE Commun. Mag., vol. 43, no. 3, pp. S8-S14, Mar. 2004.
[40] V. Kuppusamy and R. Mahapatra, ``Primary user detection in OFDM based MIMO cognitive radio,'' 3rd International Conf. Cognitive Radio Oriented Wireless Netw. Commun. (CrownCom 2008), pp. 1-5, 2008, Singapore.
[41] H. Lei, L. Zhang, X. Zhang, and D. Yang, ``A novel multi-cell OFDMA system structure using fractional frequency reuse,'' IEEE International Symposium on Personal, Indoor and Mobile Radio Communications (PIMRC), Sept. 2007.
[42] H.-C. Lee, D. C. Oh and Y. H. Lee, ``Mitigation of inter-femtocell interference with adaptive fractional frequency feuse,'' Communications (ICC), 2010 IEEE International Conference on , vol., no., pp.1-5, 23-27 May 2010.
[43] Ju Yong Lee et al, ``Interference analysis for femtocell deployment in OFDMA Systems Based on Fractional Frequency Reuse,'' IEEE Communications Letters,, pp April 2011.
IR3.3 v1.0
67
Public Information
[44] Taeyoung Lee et al, ``Resource allocation analysis in OFDMA femtocells using fractional frequency reuse,'' IEEE PIMRC 2010.
[45] Poongup Lee et al, ``Interference management in LTE femtocell systems using fractional frequency reuse,''Advanced Communication Technology (ICACT), 2010 The 12th International Conference onIssue Date : 7-10 Feb. 2010.
[46] Bruce Fette, Cognitive Radio Technology, Second Edition, 2009, Academic Press.
[47] Alaya-Feki et al ``Informed spectrum usage in cognitive radio networks Interference cartography,'' IEEE PIMRC 2008.
[48] 3GPP TSG RAN, ``3GPP TR.25814, Physical layer aspects for evolved UTRA (Release 7),'' v7.1.0, September 2006.
[49] J. Nasreddine, J. Riihijärvi, P. Mähönen, "Location-based adaptive detection threshold for dynamic spectrum access," in Proceedings of the IEEE Dynamic Spectrum Access Networks (DySPAN 2010), Singapore, April 2010.
[50] D2.1 State of the Art Review document, ``Flexible and spectrum-aware radio access through measurements and modeling in cognitive radio systems,'' FP7 ICT-248351 FARAMIR project
[51] D.G. Krige, ``A statistical approach to some basic mine valuation problems on the Witwatersrand,'' Journal of the Chemistry, Metal and Mining Society of South Africa, vol. 52, pp. 119-139, 1951.
[52] R.H. Etkin, D.N.C. Tse and H. Wang, ``Gaussian interference channel capacity to within one bit,'' IEEE Trans. Info. Theory, vol. IT-54, no. 12, pp. 5534--5562, Dec. 2008.
[53] C. Abgrall, E. Calvanese Strinati and J.C. Belfiore, ``Distributed power allocation for interference limited networks'', IEEE PIMRC 2010
[54] B. Kaufman, E. Erkip, J. Lilleberg, B. Aazhang, Femtocell Interference Mitigation Through Succes- sive Interference Cancellation and Cellular Handover,! 2011 IEEE International Conference on Communications: Workshop on Heterogeneous Networks (ICC), Kyoto, Japan, June 2011