Embed Size (px)
Citation preview

JORDAN
ASSESSMENT REPORT
MARCH 2017
WASH INFRASTRUCTURE & SERVICES
ASSESSMENT IN ZAATARI CAMP

1
WASH Infrastructure & Services Assessment in Zaatari Camp – March 2017
Zaatari camp water trucking service, Al Zaatari Refugee Camp, Jordan. REACH, 2017.
About REACH REACH is a joint initiative of two international non-governmental organisations - ACTED and IMPACT Initiatives - and the UN Operational Satellite Applications Programme (UNOSAT). REACH’s mission is to strengthen evidence-based decision making by aid actors through efficient data collection, management and analysis before, during and after an emergency. By doing so. REACH contributes to ensuring that communities affected by emergencies receive the support they need. All REACH activities are conducted in support to and within the framework of inter-agency aid coordination mechanisms. For more information please visit our website: www.reach-initiative.org. You can contact us directly at: [email protected] and follow us on Twitter @REACH_info.

2
WASH Infrastructure & Services Assessment in Zaatari Camp – March 2017
SUMMARY
Since 2011, a total of 656,170 Syrians have registered as refugees in Jordan; 79,937 of whom are currently registered in Zaatari camp, in Mafraq governorate.1 UNICEF is the lead agency for the WASH sector in Jordan, coordinating all related activities within the camp since it opened in 2012. ACTED, JEN and Oxfam have operated as key partners in the implementation of WASH activities in the camp, including delivery of treated water through a free water trucking service, the collection of waste water and solid waste, building and repair and maintenance of private WASH facilities, and hygiene promotion activities. Six years after the onset of the Syrian crisis, UNICEF, in coordination with these humanitarian organisations, has been shifting towards greater sustainability of programming. This is seen most evidently in the construction of the Zaatari Wastewater Network (WWN), which has connected every household in the camp to a common wastewater disposal system, and the simultaneous construction of private toilet facilities in each household, as a more cost-efficient and sustainable solution to WASH needs than communal facilities.
This research sought to evaluate the impact of the wastewater management project conducted by UNICEF and its implementing partners on sanitation and hygiene practices in Zaatari camp, and camp residents’ perception of the adequacy of this, so as to inform future programming. This survey was divided into two phases, the first of which aimed to a) identify primary household sources of drinking water; b) assess the prevalence and suitability of private WASH infrastructure across all households;2 c) record primary wastewater and solid waste disposal practices across all households in the camp; and d) gauge perceptions of adequacy of WASH repair and maintenance (R&M) services amongst the refugee community. To supplement the assessment of private WASH infrastructure, phase two monitored structural damage to communal sewage interceptor tanks in the camp and explored reasons for damage and community awareness of potential related hygiene risks. From 12 February to 5 March 2017, a team of two REACH Project Officers and 37 Syrian cash for workers (CfW)3 assessed 12,410 households, consisting of 15,165 cases 4, and a total of 68,221 individuals that were present in the camp at the time of data collection.5 As a first step, the state of communal sewage interceptor tanks6 was evaluated. Based on these results, key Informant (KI) interviews were conducted in each of the twelve districts of the camp on the 19th and 20th of March 2017. 7 They targeted particularly the blocks where Phase 1 concrete tanks have been the most damaged so as to understand the underlying reasons for these damages. This assessment showed that the WASH programming of UNICEF and partners in Zaatari has increased the number of households with private WASH infrastructure. This implies that the shift towards longer-term, sustainable WASH programming has been successful through the construction of a waste water network and private infrastructure that has covered the camp comprehensively and been positively perceived by beneficiaries. However, there are several key gaps that emerged. In order to achieve a greater impact in terms of sanitary situation in the camp, a greater effort to tackle issues of network blockages or tank overflowing needs to be made. As Key Informants reported that the households residing in their areas were not willing or able to pay for plumber to fix households connections and septic tank issues, another solution has to be found to maintain the WWN in good condition in the long term. Given that almost one quarter of households reported that they did not know the primary WASH actor in their district, expanding outreach and beneficiary communications would ensure greater transparency and facilitate the reporting of WASH related problems towards rectifying these issues.
1 UNHCR, Inter-agency information sharing portal, last updated 16 February 2017, accessed 9 March 2017. 2 Suitability of private toilets was based on household self-reporting on 5 criteria determined by UNICEF: a network connection/ Phase 1 concrete tank, impermeable flooring, a hand-washing facility and water drainage solution, and permanent walls or curtains. 3 The cash for work (CFW) scheme in Zaatari camp has been utilized since the camp was established in July 2012, as a means to provide incentives and capacity development to refugees who volunteer for various organisations in the camp. For this assessment, REACH recruited 39 cash for workers to complete this large-scale data collection exercise, who were then supervised by REACH field staff. 4 ‘Household’ is defined as either a single or a collection of shelters inhabited by a UNHCR registered case or multiple UNHCR registered cases who share resources. The head of household is defined as holding primary responsibility for household financial resources and decision-making. A ‘case is considered the principal family unit upon registration as a ‘person(s) of concern’ with UNHCR. 5 All households in the camp were approached. Where no respondent was available, a further two additional visits were conducted on different days and at different times to allow the opportunity to be included. 914 households in the camp were not able to be assessed after three attempts by enumerators. Findings are thus representative of the assessed camp population at the time of data collection, and are not necessarily reflective of the entire camp population. 6 These are prefabricated reinforced concrete (PRC) circular tanks. They are partitioned to allow solids to be trapped in one compartment and liquid (solid free) to over flow into the other chamber and into the network downstream. The interceptor tanks are of 8m3, 4m3 and 2.5m3 capacities. 7 Zaatari camp is divided into 12 districts, which are subdivided into blocks. The delineations were made with the purpose of designing a household address system, as well as drawing administrative boundaries for service delivery.

3
WASH Infrastructure & Services Assessment in Zaatari Camp – March 2017
Key Findings
DEMOGRAPHICS
Nearly all residents (99.3%) were residing in pre-fabricated caravans in Zaatari camp; 0.7% (91 households) of the recorded population were reported to be living in either mixed caravan and tent shelters (77), shelters constructed from metal sheeting (2) or tents only (12).
The camp population was composed of 56.9% children, aged 0 to 17 years. A slightly higher number of females than males were recorded: 51% versus 49%. However, 59% of households reported having a male head of household, and 41% a female head of household.
Single-occupant households represented around 4% of the total population.8 The mean reported household size was 5.5 persons. Demographics were fairly consistent across districts.
DRINKING WATER SUPPLY
Around two-thirds of households (67.8%) reported using the free water trucking from NGOs as their primary source of drinking water. However there were significant variations between districts, with the highest levels of free water trucking use recorded in District 8 and 9 (79.9% and 79.6% respectively) and the lowest in Districts 1 and 2 (55.3% and 57.2% respectively).
95% of residents not using free water trucking explained that they perceived the water to be of poor quality. PRIVATE WASH INFRASTRUCTURE
In this survey, 98.4% of the households reported having private toilets. This represents a 7.4 percentage point increase since the 2015 REACH population count in Zaatari9 The highest proportions of households with private toilets were recorded in Districts 1, 2 and 12. The lowest proportion was recorded in District 5, where 97.2% of households reported having private latrine facilities. This represents a further increase since 2015, when the highest proportions of households that reported having private toilets were in Districts 1 and 2 (97% in each).10
Of the households that reported not having a private toilet (1.6%), the vast majority (95.9%) reported using private toilets in the homes of friends, relatives, or neighbours, as an alternative.
The great majority (96.3%) of those who had a private toilet reported having one for the entire household. When analysed by household size, the number of private toilets increased according to the number of residents in the household. This is likely to be due to the fact that larger families have both greater resources and greater WASH facility needs.
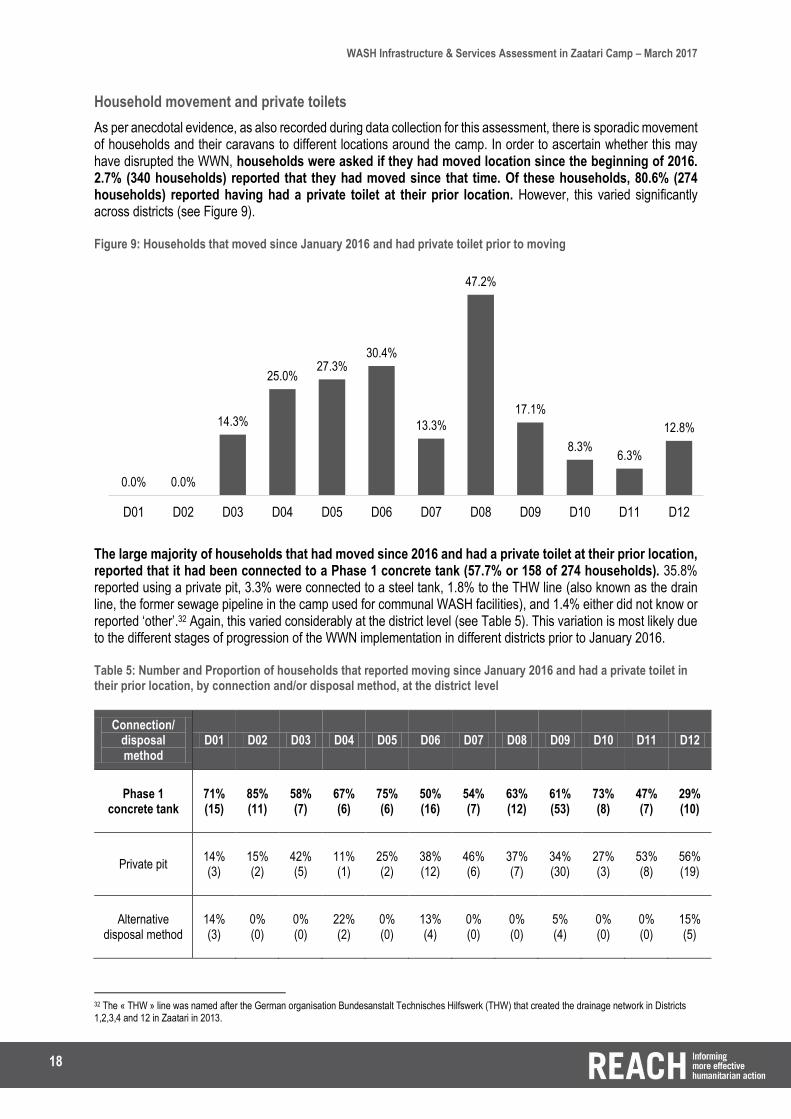
2.7% (340) of the households reported that they had moved inside the camp since January 2016. Four fifths (80.6%) of them reported that they had a private toilet in their shelter before moving.
PRIVATE WASH INFRASTRUCTURE SUITABILITY
Nearly all the households (99.5%) with private toilets reported that at least one of their toilets was connected to the WWN through a phase 1 concrete tank.
Overall, only 52.6% of the private toilets assessed met all five UNICEF determined criteria for suitable latrines. Therefore, 47.4% of toilets were unsuitable. Almost 30% of all private toilets did not meet standards of suitability because they did not have permanent walls or curtains.
69.1% of those with an unsuitable latrine had never come into contact with an NGO to upgrade it.
7.3% of the households reported having modified their original phase 1 concrete tank connections, most probably due to changes in the layout of their shelters or caravan expansion.
8 Household is defined as one or more cases living in a collective shelter or shelters who share resources. Single-occupant households refers to a shelter or collection of shelters with only one resident. 9 REACH Zaatari Population Count, December 2015. 10 The « oldest » district refers to Districts 1,2,3 and 12 ; that contain the largest proportion of the population who have been living in the camp for more than 2 years, as reported in the REACH, Zaatari Camp Population Count, December 2015.

4
WASH Infrastructure & Services Assessment in Zaatari Camp – March 2017
WASTE WATER AND SOLID WASTE DISPOSAL
99.4% of households reported generating waste water inside of their home. 89.8% of these reported disposing of their wastewater through a Phase 1 concrete tank. However, an additional 7% of the households reported disposing of their waste water by pouring it in the street although they mentioned having a Phase 1 concrete tank connection also.
86.4% of the households that reported having a connection to the Phase 1 concrete tanks perceived the connection to be sufficient. 8.2% of the households reported that since installation of and connection to the Phase 1 concrete tanks the sanitation situation had become either “worse” or “much worse”. The tank overflowing was the most frequently reported reason for this dissatisfaction (62.4% of the dissatisfied households). This indicates that tanks are exceeding capacity, and therefore pose public health risks that need to be addressed.
79.2% of households reported owning and using a washing machine.
99.6% of the households reported generating solid waste; 97.2% of these households reported using garbage bins to dispose of it, and 45.4% reported using NGO garbage collection services.11
COMMUNAL SEWAGE INTERCEPTOR TANKS DAMAGE
34.3% of the ventilation pipes and associated surface infrastructure of the WWN tanks assessed as part of this survey were found to be damaged. This varied considerably across districts. The lowest proportion of damaged tanks was reported in District 6 (9.1%) and the highest in District 12 (66.4%).
Key Informant Interviews (KIIs) revealed that the damage was primarily due to children playing with the pipes and breaking the ventilation covers. Intentional alterations were also made by residents when the capacity of original pipes was not considered sufficient or when residents enlarged their caravans or modified the layout of their shelter.
The great majority of the key informants interviewed (37 out of 43) were aware of the public health issues associated with damage or alterations made to the WWN infrastructure.
Key informants proposed that further alterations of WASH infrastructure could be prevented by limiting access (either by locking the ventilation cap or by building some kind of cover or fencing around the pipes).
Nearly all of the KIs reported that they and their communities would not be willing and/or able to pay for repairs to household connections and septic tank issues, the high price of the tools and spare parts being one of their main concerns.
REPAIR, MAINTENANCE, AND REPORTING
21.8% of households reported that they did not know the primary NGO providing WASH-related services in their districts.12 However, 77.5% of households correctly identified the primary WASH actor in their district. This was relatively consistent across the districts.
9% of households reported that they wanted to report a WASH issue in the last three months. Of these households 79.9% reported that they were able to report their issues. The most frequently reported issue at the camp level was desludging (72.3%). However, this varied considerably at the district level: from 84.5% of those reporting in District 2, compared to only 49% in District 10.
WASH services hotline was the most frequently reported channel for reporting WASH related issues (69%), followed by contacting a NGO field staff member (31.6%).
42.7% reported the response to be ‘inadequate’ or ‘very inadequate’. The majority explained that this was due to a lack of response (62.7%), followed by a lack of repairs of the damage or solution even though the NGO responded to the complaint (20.5%), and the excessive delay to the response (15.3%).
20.1% (217 households) of those that wanted to report an issue did not take any action in the end. The most frequently cited reason was they did not think that reporting the issue would be effective. Further, almost half of the respondents reported that they did not how and/or to whom they needed to report.
11 Multiple options could be selected. The term “Garbage bin” here does not distinguish between public and private bins. NGO collection services are dedicated to the collection of NGO bins (public bins). 12 Households were asked to identify the primary WASH actor in their district as either ACTED, JEN, or Oxfam, or ‘don’t know’.

5
WASH Infrastructure & Services Assessment in Zaatari Camp – March 2017
CONTENTS
SUMMARY ................................................................................................................................................. 2
Key Findings ..................................................................................................................................................... 3
List of Acronyms ............................................................................................................................................... 6
Geographical Classifications ............................................................................................................................. 6
List of Figures and Tables ................................................................................................................................. 6
INTRODUCTION .......................................................................................................................................... 8
METHODOLOGY ......................................................................................................................................... 9
Phase I .............................................................................................................................................................. 9
Phase II ............................................................................................................................................................. 9
Challenges and limitations .............................................................................................................................. 10
DEMOGRAPHICS .......................................................................................................................................11
KEY FINDINGS ..........................................................................................................................................14
Drinking Water Supply .................................................................................................................................... 14
Private WASH Infrastructure ........................................................................................................................... 16
Private WASH Infrastructure Suitability........................................................................................................... 19
Waste Water and Solid Waste Disposal ......................................................................................................... 25
Communal Sewage Interceptor Tanks ............................................................................................................ 27
Repair, Maintenance, and Reporting .............................................................................................................. 29
CONCLUSION ...........................................................................................................................................35
ANNEXES .................................................................................................................................................37
Annex 1: Household Questionnaire ................................................................................................................ 37

6
WASH Infrastructure & Services Assessment in Zaatari Camp – March 2017
List of Acronyms
ACTED Agency for Technical Cooperation and Development CFW Cash for Work JEN Japanese Emergency NGO KII Key Informant Interview ODK Open Data Kit R&M Repair and maintenance UNICEF United Nations Children’s Fund UNHCR United Nations High Commissioner for Refugees WASH Water, sanitation and hygiene WWN Waste Water Network
Geographical Classifications
Zaatari camp Syrian refugee camp located in al Mafraq governorate in northern Jordan District Zaatari camp is divided into 12 districts, which are subdivided into blocks
List of Figures and Tables
Figure 1: Assessed population figures................................................................................................................... 11
Figure 2: Size of assessed population, by district .................................................................................................. 11
Figure 3: Assessed population demographics, by age group and sex ................................................................. 12
Figure 4: Assessed households sizes ................................................................................................................... 12
Figure 5: Reported primary source of drinking water at the camp-level ................................................................ 14
Figure 6: Reported reasons for not using NGO water delivery services, by district ............................................... 15
Figure 7: Proportion of households reported to have a private toilet, by household size ...................................... 16
Figure 8: Reported alternative latrine of households without private toilets ........................................................... 17
Figure 9: Households that moved since January 2016 and had private toilet prior to moving ............................... 18
Figure 10: Proportion of private toilets that met overall suitability criteria .............................................................. 19
Figure 11: Proportion of private toilets that met overall suitability criteria, by district ............................................. 19
Figure 12: Proportion of household with an unsuitable toilet that reported having already contacted an NGO for an upgrade of their facilities, at the district level ......................................................................................................... 21
Figure 13: Proportion of households that reported a sufficient network connection .............................................. 22
Figure 14: Perceived impact of Phase 1 concrete tank connections on the household sanitation situation .......... 22
Figure 15: Frequency of reported reasons perceiving the sanitation situation to have worsened ......................... 23
Figure 16: Proportion of households that reported having modified their original Phase 1 concrete tank connections ........................................................................................................................................................... 24
Figure 17: Proportion of households by reported method of waste water disposal ............................................... 25
Figure 18: Proportion of households that reported owning and using a washing machine, at the district level ..... 25
Figure 19: Frequency of reported solid waste disposal methods used .................................................................. 26
Figure 20: Proportion of damaged tanks, by district .............................................................................................. 27
Figure 21: Proportion of households that were able to identify the WASH partner operating in their district ......... 29
Figure 22: Proportion of households that wanted to report a WASH issue in the last three months ..................... 30

7
WASH Infrastructure & Services Assessment in Zaatari Camp – March 2017
Figure 23: Proportion of households that wanted to report a WASH issue in the last three months and did, at the district level ............................................................................................................................................................ 31
Figure 24: Reasons for not reporting WASH-related issues .................................................................................. 31
Figure 25: Types of WASH-related issues reported in the last three months ........................................................ 32
Figure 26: Frequency of reporting method cited, by primary WASH NGO operator .............................................. 33
Figure 27: Reported satisfaction with response to reporting of WASH-related issue ............................................ 34
Table 1: Phase 1 question areas and units of assessment and analysis. ............................................................... 9
Table 3: Reported primary source of drinking water, by district ............................................................................. 14
Table 4: Number of private toilets reported per household .................................................................................... 16
Table 5: Reported type of alternative latrine used by those without private toilets, by district ............................... 17
Table 6: Number and Proportion of households that reported moving since January 2016 and had a private toilet in their prior location, by connection and/or disposal method, at the district level ................................................. 18
Table 7: Proportion of private toilets by suitability criteria met ............................................................................... 20
Table 8: Proportion of private toilets that met individual suitability criteria, at the district level .............................. 20
Table 9: Proportion of households with a network connection, by reported sufficiency, by district ........................ 22
Table 10: Proportion of households reporting the sanitation situation to have worsened and frequency of reported reasons for perceiving the sanitation situation to have worsened, at the district level ........................................... 23
Table 11: Frequency of reported type of damage, at the district level .................................................................. 27
Table 12: WASH partner by district of operation ................................................................................................... 29
Table 13: Proportion of households that accurately named the WASH partner operating in their district ............. 29
Table 14: Proportion of households that wanted to report a WASH issue in the last three months, at the district level ....................................................................................................................................................................... 30
Table 15: Proportion of households that reported a WASH-related issue and most frequently cited issue, at the district level ............................................................................................................................................................ 32
Table 16: Frequency of reporting method cited, at the district level ...................................................................... 33
Table 17: Frequency of the reported reasons of dissatisfaction with response to reporting .................................. 34

8
WASH Infrastructure & Services Assessment in Zaatari Camp – March 2017
INTRODUCTION
As of February 2017, 656.170 Syrian refugees were registered in Jordan13. According to UNHCR, 79,737 or 15% of them are registered in Zaatari camp14, in Mafraq governorate. UNICEF WASH sector lead, in coordination with other humanitarian organisations, provide critical WASH services in Zaatari camp, including delivery of safe drinking water, sewage and wastewater management, solid waste management, and provision, operation and maintenance of improved sanitation facilities. Given the protracted nature of the crisis and limited immediate prospects of Syrians returning, humanitarian agencies have endeavored to shift their approach from emergency-focused interventions to service provision through long-term, sustainable infrastructure and programming. In Zaatari camp, UNICEF and its implementing partners in the WASH sector – ACTED, JEN, and Oxfam – have done so through the construction of private WASH facilities in each household, connected to a newly developed common wastewater disposal system, known as the Zaatari Wastewater Network (WWN).15 Following the completion of the network at the end of 2016, UNICEF and REACH conducted a WASH Infrastructure & Services Assessment in Zaatari camp from 12 February to 5 March 2017. The primary objective of this assessment was to evaluate the impact of this wastewater management project as well as general WASH practices in the camp in order to inform future programming and provide recommendations on where further efforts should be made to improve the sanitary situation and private infrastructure of the camp. Furthermore, a population count was conducted as part of this assessment, with the aim of updating and revising water allocation for the camp, based on the current population distribution at the block level. The assessment consisted of two phases, the first of which aimed to assess sources of drinking water, private WASH infrastructure, waste water and solid waste disposal practices, and perceived adequacy of and engagement with WASH repair and maintenance (R&M) services, at the household level. For this phase, every available household in the camp16 was interviewed utilizing a structured questionnaire. Interviews were conducted by a team of trained Syrian refugees engaged as Cash for Workers (CFW)17 supervised by senior REACH field staff. The second phase of the assessment complemented the first by assessing communal sewage interceptor tanks to which the majority of households are now connected. It aimed to assess the state of communal sewage interceptor tanks, as well as identify specific locations where repair and maintenance was most needed. The assessment was conducted by a team of REACH enumerators using a short closed questionnaire recording damage at the location of each septic tank in the camp. In addition, Key Informant Interviews (KIIs) were carried out in areas where high levels of damage were recorded. This report provides a detailed description of the methodology, why it was chosen, and challenges and limitations related to the assessment, and then outlines key assessment findings, organised into the following sections:
1. Demographics 2. Drinking water supply 3. Private WASH infrastructure 4. Private WASH infrastructure suitability 5. Waste water and solid waste disposal 6. Communal sewage interceptor tanks damage 7. Repair, Maintenance, and Reporting
13 UNHCR, Inter-agency information sharing portal, last updated 16 February 2017, accessed 12 March 2017. 14 UNHCR, Inter-agency information sharing portal, last updated 16 February 2017, accessed 9 March 2017. 15 Partners aimed to construct approximately 1,110 HDPE tanks in nine districts of Zaatari. ACTED would construct 685 tanks in Districts 1, 2, 10, 11 and 12, while Oxfam would install 241 tanks in Districts 5 and 7, and JEN would construct 184 tanks in District 3 and 4. The IRD would also install a further 500 tanks in District 6, 8 and 9 but under the scope of a separate project. ACTED, JEN, UNICEF, Oxfam, Terms of Reference for Phase I Waste Water Network project in Zaatari Refugee Camp, 24 May 2015, accessed 12 March 2017. 16 Household is defined as one or more cases living in a collective shelter or shelters who share resources. 999 shelters visited and were unable to interview (due to reasons of inhabitants not wanting to be interviewed, no one eligible (18 or above) to interview, no one at home, or the shelter seeming uninhabited) 17 A total of 39 CFWs were recruited, which included 18 female and 21 male Syrians.

9
WASH Infrastructure & Services Assessment in Zaatari Camp – March 2017
METHODOLOGY
The assessment employed a mixed-methods approach, consisting of two phases of data collection that took place from 12 February to 5 March 2017. Data collection was completed by a mixed-sex team of Syrian cash for workers,18 who were trained on the data collection tools and supervised by a team of REACH field operations staff.
Phase I
A household survey was administered across all 12 districts of Zaatari camp. The survey tool was designed in consultation with UNICEF and shared with the WASH sector in Zaatari camp for technical review prior to being finalized. The survey consisted of questions relating to multiple WASH issues and services, most of which were asked at the household level, as outlined in the table below. Table 1: Phase 1 question areas and units of assessment and analysis.
Area of questioning Unit of assessment Aggregated unit of analysis
Population Demographics Individual Case, Household, Block, District, Camp
Primary water supply Household Block, District, Camp
Private WASH infrastructure Household Block, District, Camp
Private toilet suitability Toilet Household, Block, District, Camp
Generation and disposal of waste water and solid waste
Household Block, District, Camp
Satisfaction and engagement with R&M services Household Block, District, Camp
Enumerators visited every household unit in the camp to conduct an interview with the head of household, or if unavailable, with another household member aged 18 years or older.19 All data were recorded via Open Data Kit (ODK) collect, an Android-based smartphone application designed for mobile data collection. Up to three visits to each household were conducted, to ensure that all households had sufficient opportunity to be included in the assessment.20 The second visit was made after each block was completed, and the third following the completion of the first and second visits. This was all carried out within 3 weeks of data collection. Additionally, locational data were recorded, including the shelter’s GPS location up to a 6-meter range of accuracy, and the UNHCR-issued address of the shelter, which consists of the district number, block number, and assigned shelter number.21 Enumerators recorded all instances where the address painted on the shelter did not correspond to the district or block in which the shelter was physically located, which indicated that the occupants had moved their caravan from a different location in the camp. In these cases, the actual location of the shelter, and not the assigned address, was used for all analysis at the block, district, or camp level.
Phase II
Communal Sewage Interceptor Tanks Damage Survey
Phase II was designed to complement data collected about private WASH infrastructure at the household level in Phase I, and was conducted in parallel with the household survey. One cash for worker from each data collection
18 The cash for work (CFW) scheme in Zaatari camp has been utilized since the camp was established in July 2012, as a means to provide incentives and capacity development to refugees who volunteer for various organisations in the camp. For this assessment, REACH recruited 39 cash for workers to complete this large-scale data collection exercise. 19 For the purposes of this context and assessment, a “household” was defined as either a single or a collection of caravans inhabited by a UNHCR registered case or by multiple UNHCR registered cases who share resources. “Head of household” was defined as holding primary responsibility for household financial resources and decision-making. 20 Revisits were conducted systematically, with the second visit conducted once data collection in the entire district was completed, and the third visit conducted once all second visits across all districts had been completed, at alternating times of day (morning versus afternoon). 21 An addressing system was implemented by UNHCR in 2014, as part of their land management project.

10
WASH Infrastructure & Services Assessment in Zaatari Camp – March 2017
team was dedicated to assessing damage to visible, surface level communal sewage interceptor tanks in each block. This infrastructure consisted of ventilation pipes and caps, which are the only parts of the Phase 1 Concrete tanks that are above-ground, and the adjacent manholes and manhole covers. Infrastructure was identified in the field through REACH produced maps developed from the most up-to-date “as-built” data available from UNICEF and WASH partners. A specific survey tool was developed for Phase II, through which the enumerator recorded the GPS location of the septic tank, the tank number, whether caps or covers had been damaged or removed, and whether any other makeshift covers were being used in their stead, through the ODK application.
Key Informant Interviews (KIIs)
The communal sewage interceptor tanks damage survey was followed by a series of key informant interviews (KIIs) to contextualize and triangulate findings. Once all infrastructure was assessed, the REACH assessment team used the data to identify two to three blocks in each district which had the highest recorded instances of damage. REACH Project Assistants then visited these blocks and conducted key informant interviews with community members living in close proximity to damaged septic tanks. In addition to helping understand the reasons why camp residents may be altering or damaging the WASH infrastructure, these interviews enabled the collection of data on community awareness of health and hygiene risks related to WASH infrastructure damage, and capacity to independently fund repair and maintenance needs. A total of 44 KIIs were carried out, including 104 participants (42 female and 62 male).
Challenges and limitations
The primary challenges and limitations faced in this assessment are as follows: 1. Comprehensive assessment of the camp population. The number of individuals, cases, and
households recorded in the assessment is based on information reported by the households who were both available and willing to participate during the data collection period. 914 households in the camp were not able to be assessed after three attempts by enumerators, either because the shelter had no evidence of inhabitants, no adult household members were present, or the household declined to participate in the assessment.22 Therefore, findings are representative of the assessed camp population at the time of data collection, and are thus not necessarily reflective of the entire camp population.
2. Comprehensive assessment of WASH infrastructure and services.
i) Findings related to suitability of the toilets and Phase 1 concrete tank connections are based on households self-reporting data. To mitigate the risks of data errors or any bias in reporting, data validation checks were put in place: the questionnaire was made so as to verify that the number of toilets and of caravans reported by the respondents were coherent throughout the interview.
ii) The second phase of this assessment assessed the elements of the WWN visible above the ground (ventilation pipes and manhole covers), primarily through direct observation. KIIs were then conducted in every district, to contextualize and explain the damages and alterations that were observed. To ensure that the collected information was of the highest quality, three of the four project assistants conducting these interviews had worked on the waste water network during implementation and were therefore familiar with the infrastructure being assessed.
3. Movement of households during data collection. Enumerators observed high mobility of camp residents during data collection, with all teams noting multiple instances where households were moving their caravans to different locations in the camp while data collection was ongoing. An unavoidable limitation inherent in the Zaatari context, this mobility may result in households moving from the GPS location recorded during data collection, making locational data less reliable over an extended period of time and requiring recurring camp-wide assessments in the future to ensure up-to-date spatial data.
22 A household was deemed to have evidence of inhabitants through two means; i) identifying points of human belongings around the household (e.g. washing line and solar lamps), and ii) consulting neighbours as to whether the household is inhabited.

11
WASH Infrastructure & Services Assessment in Zaatari Camp – March 2017
DEMOGRAPHICS
This section of the report presents the main findings of the assessment with regards to population size and demographics, and is composed of: An overview of the assessed population at both the camp and district level; Demographic breakdown of the assessed population according to age, sex, sex of the head of case (HoC),
and average household size; A breakdown of observed shelter types in the camp.
Camp and District Population23
During this assessment 12,410 households were assessed, consisting of 15,165 cases, for a total of 68,221 individuals that were present in the camp at the time of data collection.24 Figure 1: Assessed population figures
However, it is important to note that the discrepancy with current UNHCR figures may be explained by the 914 households that were not able to be recorded in the assessment,25 although it is not possible to determine whether the individuals residing in the respective shelters have departed from the camp. Furthermore, with recent developments to facilitate access to and application for work and leave permits in the camp, residents may have been absent from the camp and in host communities during the day when data collection was occurring. The size of the recorded population in the assessment varied considerably across districts with the largest populations recorded in Districts 8 and 11, and the smallest in Districts 3 and 4 (see Figure 2).
Figure 2: Size of assessed population, by district
23 The figures set out below correspond to the number of individuals, cases or households recorded in the assessment and are not reflective of the entire camp population. 24 For the last population data collected in Zaatari by REACH, please see the REACH Zaatari Population Count, December 2015. 25 As mentioned in the ‘Methodology’ section, these households were not assessed for the following reasons: no-one was available to interview, no-one above the age of 18 was available to interview, the household declined to interview, or the shelter was seemingly uninhabited.
D01 D02 D03 D04 D05 D06 D07 D08 D09 D10 D11 D12 Total
5,537 6,432 4,166 4,007 5,086 6,634 5,916 7,929 4,811 5,496 7,892 5,115 68,221
12,410 households
15,165 cases
68,221 individuals
8.1%9.4%
6.1% 5.9%7.5%
9.7%8.7%
11.6%
7.1%8.1%
10.4%
7.5%

12
WASH Infrastructure & Services Assessment in Zaatari Camp – March 2017
Population Demographics
Of the total recorded population, 50.7% (34,590) were female and 49.3% (33,631) were male. These figures are consistent with UNHCR demographic figures at the time of the assessment (50.2% male and 49.8% female).26 Overall, 57% of the assessed population in this study were children, aged 0 to 17 years (29.1% boys and 27.9% girls) (see Figure 3). Figure 3: Assessed population demographics, by age group and sex
However, there was a larger female than male adult population (22.8% and 20.2% respectively). This discrepancy was largest amongst 25 to 39 years old (see Figure 3). This might be indicative of men from this age group leaving the camp in an attempt to find work in the host communities, and thus not being present in the camp at the time of the assessment. 59% of households were reported to be headed by a male, while 41% were headed by a female. The mean reported number of individuals per household was 5.5 persons and the median was 5. 27 82.1% of all households reported only one case as residing there, 14.3% were two case households, and 3.5% three or more cases. The proportion of households with a single inhabitant has increased slightly since the REACH population count in December 2015: from 3.9% to 4.1% of households. This figure varied slightly across districts, from 5.2% of households in Districts 7, 10 and 11, to 2.3% in District 12. Figure 4: Assessed households sizes
26 UNHCR, Inter-agency information sharing portal, last updated 16 February 2017, accessed 12 March 2017. 27 The ‘head of household’ is defined as holding primary responsibility for household financial resources and decision making.
4.1%
8.4%
24.2%
43.5%
19.8%
0% 5% 10% 15% 20% 25% 30% 35% 40% 45% 50%
1
2
3-4
5-7
8 plus
9.5%
11.9%
7.7%
5.6%
8.3%
5.1%
1.2%
0 to 4
5 to 11
12 to 17
18 to 24
25 to 39
40 to 59
60+
Male
8.9%
11.4%
7.6%
5.9%
9.7%
5.6%
1.6%
0 to 4
5 to 11
12 to 17
18 to 24
25 to 39
40 to 59
60+
Female

13
WASH Infrastructure & Services Assessment in Zaatari Camp – March 2017
At the camp level, these figures suggest a consistent trend from the 2015 population count, where an increase in single occupant households indicated that people or families were leaving the camp to benefit from better economic opportunities in the host communities, whilst one case member remained to collect camp assistance and protect the shelter from theft or damage.28 This trend may help explain differences with UNHCR population figures for Zaatari camp.
Shelter Type
Before assessing each household, data collectors recorded the type of shelter based on observation; almost the entire assessed population of the camp was residing in pre-fabricated caravans (99.3% or 12,319 households). This indicates an increase from 2015, when 97% of assessed households were reported to reside in caravans.29 The extensive use of pre-fabricated shelters across the camp is a result of the joint initiative of the Norwegian Refugee Council (NRC) and UNHCR to provide every household with a caravan in 2014-2015. Of the remaining 0.7% of households (91 households), 77 households (0.6%) were living in mixed caravan and tent shelters, 2 households (0.01%) resided in shelters constructed from metal sheeting, and 12 households (0.1%) were recorded as living in tents only.
28 REACH Zaatari Population Count, December 2015. 29 REACH Zaatari Population Count, December 2015.

14
WASH Infrastructure & Services Assessment in Zaatari Camp – March 2017
KEY FINDINGS
This section of the report provides key findings from both phase I and II of the assessment, and is composed of the following sections:
An assessment of sources of drinking water and perceptions of public drinking water services provided by NGOs;
An overview of private WASH infrastructure, and alternative latrines; An assessment of private WASH infrastructure suitability, including an analysis of the suitability of each
facility in the household and assessment of the perceived impact of Phase 1 concrete tank connections on the sanitation situation;
An overview of reported waste water and solid waste production and disposal at the household level; A quantitative and qualitative assessment of communal sewage interceptor tanks damage; An analysis of the camp residents perceived adequacy of WASH repair, maintenance and reporting
service.
Drinking Water Supply
In Zaatari camp, UNICEF WASH partners (ACTED, Oxfam and JEN) deliver 35 liters of water per person per day via free water trucking to block level water tanks. The water delivered is drawn from three internal boreholes in the camp, chlorinated at the treatmant plant, and then transported by trucks to water tanks throughout the camp. Water quantity and quality is checked daily by partners supply team. Approximately two-thirds of households (67.8%) reported using the free water trucking from NGOs as their primary source of drinking water and around one-third (32.1%) reported purchasing water from a private vendor (0.1% selected ‘other’). Figure 5: Reported primary source of drinking water at the camp-level
However, these findings varied considerably across districts. Over three quarters of households in Districts 8 and 9 (79.9% and 76.4% respectively) reported free water trucking from NGOs as their primary source of drinking water. In contrast, roughly half of the households in Districts 1 and 2 (55.3% and 57.2% respectively) reported using free water trucking (see Table 2). Table 2: Reported primary source of drinking water, by district
Water source D01 D02 D03 D04 D05 D06 D07 D08 D09 D10 D11 D12
Free water trucking 55% 57% 66% 72% 70% 64% 59% 80% 76% 68% 71% 75%
Purchased from a private vendor
45% 43% 34% 28% 30% 36% 41% 20% 23% 32% 29% 24%
Other 0% 0% 0% 0% 0% 0% 0% 0% 0% 0% 0% 1%
67.8% Free water trucking from NGOs
32.1% Purchased from private vendor

15
WASH Infrastructure & Services Assessment in Zaatari Camp – March 2017
Reported use of free water trucking as the primary source of drinking water increased with household size, with the largest households (5 to 7 members and 8 members or more) reporting this most frequently: 67.8% and 73.8% respectively, compared to 64.2% of households with 3 to 4 members. This suggests that larger households might primarily use free water trucking water due to financial constraints, as they cannot afford to buy bottled water for all of their households members.
Reported reasons for not using NGO-provided drinking water
Of the 32.2% households that reported not drinking the water provided by NGO trucking services, 95% explained that they perceived the water supplied to be of poor quality, 0.2% that the water delivery was late or inconsistent and only 0.1% reported that they did not receiving free water delivery (6.1% selected ‘other’). The perceived low quality of the water is thus the main reason why residents were not using free water trucking. The proportion of households that reported not using the free water delivery as main source of drinking water because of the bad quality of the water was consistent across the districts of the camp, with the exception of District 5, which was distinctly below the camp average (see Figure 6). Figure 6: Reported reasons for not using NGO water delivery services, by district
As the same standards and tests are applied to all of the water that comes from the boreholes, there is little prospect that these differences of perception are related to any real difference in water quality. Furthermore, 11% of households not using free-water trucking in District 5 reported that this was due to deliveries being late and/or inconsistent, suggesting that there may be a problem with service delivery in this particular area. However, with the exception of District 5, smaller differences across other districts are unlikely to be related to the way the water is promoted and delivered by the organisation within the district, as much of the service delivery is coordinated between and across districts. Although the vast majority of households reported relying on the public water supply for drinking water, communication with beneficiatiaries regarding water distribution should continue to address negative perceptions surrounding the public water supply and fears of potential health risks. As with the proportion of households that primarily used free-water trucking, these perceptions may also be related to the length of time spent in the camp, where households may have become tired of the chlorine taste. Furthermore, if household incomes are strengthened to the level of being able to afford private water supplies, this may have implication for the implementation of the UNICEF-planned water network, connecting all households to a public water system. For instance, many of these households may already have private water tanks, which could be connected to the network immediately, rather than installing new ones.
95% 95% 98% 96%89%
95%98%
94%96% 96% 95%
92%
0%
10%
20%
30%
40%
50%
60%
70%
80%
90%
100%
D01 D02 D03 D04 D05 D06 D07 D08 D09 D10 D11 D12
Perceived poor quality Delivery is late and/or inconsistent Not received Other

16
WASH Infrastructure & Services Assessment in Zaatari Camp – March 2017
Private WASH Infrastructure
Households with private toilets
The vast majority of households in the camp (98.4%) reported having at least one private toilet. This figure was consistent regardless of the gender of the head of the household. This was consistent across all the districts, although this was slightly higher than the camp average in District 1 (99.5%). This indicates an increase since 2015, when 91% of the households assessed in Zaatari camp reported having private toilets.30 Furthermore, at that time discrepancies between districts were identified and the highest proportion of households that reported having private toilets was recorded in Districts 1 and 2 (97% in each). In this survey, the highest proportions of households that reported having private toilets were reported in Districts 1,2 and 12. 31 When analysed by household size, the proportion of households with private toilets increased according to the number of residents in the household. At the camp level, that ranged from 92.2% of one-person households to 99.4% of households composed of 9 members or more. This is likely to be due to the fact that larger families have both greater resources and greater needs for private facilities (see Figure 7). Figure 7: Proportion of households reported to have a private toilet, by household size
Of all households, the vast majority reported having one private toilet (96.3%); 248 households (2% of the entire assessed population) reported having two toilets, and 17 households (0.1%) reported having three or more (see Table 3). Table 3: Number of private toilets reported per household
Number of private toilets per household Number of households Proportion of households
No private toilet 197 1.6%
1 11,948 96.3%
2 248 2.0%
3 or more 17 0.1%
At least 1 private toilet 12,213 98.4%
30 REACH, Zaatari Camp Population Count, December 2015. 31 The first residents of Zaatari camp have established themselves in Districts 1,2,3,11 and 12.
92.2%
94.6%
98.4%
99.3%
99.4%
1 member
2 members
3-4 members
5-7 members
8 + members

17
WASH Infrastructure & Services Assessment in Zaatari Camp – March 2017
As expected, the proportion of households with two, or three or more, private toilets increased with household size. 5.1% of households with 8 or more members had 2 toilets and 0.5% had three or more, compared to only 1.6% and 0% respectively of households with five to seven members. The highest numbers of households that reported having two toilets were found in District 12 and District 1 (4.1% and 3.5% respectively), while the lowest were identified in Districts 3 and 5 (1.1% and 1% respectively). Of the 12,213 households that reported having one or more private toilets, only 319 (2.6%) reported sharing this facility with another household.
Households without private toilets
Of the small proportion of the households (1.6%) that reported not having a private toilet, 69% reported using the private toilets of their friends or relatives’, and 26.9% reported using those of their neighbours’ (see Figure 8). Figure 8: Reported alternative latrine of households without private toilets
Across districts, there were noticeable differences in the type of alternative latrine used by the households that do not have their own private toilets. Core social support network seems to differ between districts, as households in Districts 2, 3, 9, 10 and 11 largely relied on friends and relatives to have access to private toilets while households in Districts 1 and 4 mainly relied on their neighbours. In Districts 6 and 12, a notable proportion of households that did not have private toilets reported using ‘other’ alternatives (16.7% or 8 households, and 28.6% or 5 households, respectively). Many of them reported using waste bags and disposing of them in the garbage, which highlights potential public health concerns. Table 4: Reported type of alternative latrine used by those without private toilets, by district
Alternative latrine
D01 D02 D03 D04 D05 D06 D07 D08 D09 D10 D11 D12
Private home of friend or relative
40% 92% 100% 47% 68% 39% 56% 72% 87% 85% 86% 43%
Private home of neighbour
60% 8% 0% 53% 32% 44% 44% 21% 13% 15% 14% 29%
Other 0% 0% 0% 0% 0% 17% 0% 8% 0% 0% 0% 29%
4% Other
27% Private home of neighbour
69% Private home of friend or relative
18
WASH Infrastructure & Services Assessment in Zaatari Camp – March 2017
Household movement and private toilets
As per anecdotal evidence, as also recorded during data collection for this assessment, there is sporadic movement of households and their caravans to different locations around the camp. In order to ascertain whether this may have disrupted the WWN, households were asked if they had moved location since the beginning of 2016. 2.7% (340 households) reported that they had moved since that time. Of these households, 80.6% (274 households) reported having had a private toilet at their prior location. However, this varied significantly across districts (see Figure 9). Figure 9: Households that moved since January 2016 and had private toilet prior to moving
The large majority of households that had moved since 2016 and had a private toilet at their prior location, reported that it had been connected to a Phase 1 concrete tank (57.7% or 158 of 274 households). 35.8% reported using a private pit, 3.3% were connected to a steel tank, 1.8% to the THW line (also known as the drain line, the former sewage pipeline in the camp used for communal WASH facilities), and 1.4% either did not know or reported ‘other’.32 Again, this varied considerably at the district level (see Table 5). This variation is most likely due to the different stages of progression of the WWN implementation in different districts prior to January 2016. Table 5: Number and Proportion of households that reported moving since January 2016 and had a private toilet in their prior location, by connection and/or disposal method, at the district level
Connection/ disposal method
D01 D02 D03 D04 D05 D06 D07 D08 D09 D10 D11 D12
Phase 1 concrete tank
71% (15)
85% (11)
58% (7)
67% (6)
75% (6)
50% (16)
54% (7)
63% (12)
61% (53)
73% (8)
47% (7)
29% (10)
Private pit 14% (3)
15% (2)
42% (5)
11% (1)
25% (2)
38% (12)
46% (6)
37% (7)
34% (30)
27% (3)
53% (8)
56% (19)
Alternative disposal method
14% (3)
0% (0)
0% (0)
22% (2)
0% (0)
13% (4)
0% (0)
0% (0)
5% (4)
0% (0)
0% (0)
15% (5)
32 The « THW » line was named after the German organisation Bundesanstalt Technisches Hilfswerk (THW) that created the drainage network in Districts 1,2,3,4 and 12 in Zaatari in 2013.
0.0% 0.0%
14.3%
25.0%27.3%
30.4%
13.3%
47.2%
17.1%
8.3%6.3%
12.8%
D01 D02 D03 D04 D05 D06 D07 D08 D09 D10 D11 D12

19
WASH Infrastructure & Services Assessment in Zaatari Camp – March 2017
Private WASH Infrastructure Suitability
Overall private toilet suitability
In order to assess the overall suitability of private WASH infrastructure, five individual UNICEF-determined criteria were set on each toilet. To be considered as suitable by UNICEF standards, private toilets must meet all 5 of the following criteria: a Phase 1 concrete tank or network connection, impermeable flooring (either concrete, ceramic tiles, plastic tiles, stones tiles or wooden panels), a handwashing facility (that can be either water source or water container that is used for hand washing), with handwashing water drainage, and permanent walls or curtains. 52.6% of toilets were reported to meet all five criteria, indicating that the toilet is suitable by UNICEF standards. 47.4% of toilets were therefore not suitable (see Figure 10). Figure 10: Proportion of private toilets that met overall suitability criteria
However, these figures varied considerably at the district level, ranging from 60.7% of toilets in District 5 determined to be suitable, to 40.7% in District 8 (see Figure 11). Figure 11: Proportion of private toilets that met overall suitability criteria, by district
As previously discussed in relation to water supply and overall proportion of households with private toilets, the variation in suitability may relate the length of time spent living in the camp, which in turn is linked to district of residence. The older districts in the camp, Districts 1, 2, 10, 11, and 12, had some of the highest levels of private toilet suitability, which may relate to having had a longer time to construct the facility.However, this does not fully explain why the highest proportion of suitable toilets is found in District 5, and what the exact reason for not meeting overall suitability criteria might be. In order to better understand this, the individual criteria were analysed.
52.6% suitable
47.4% not suitable
57.0% 55.6% 49.5%57.0% 60.7%
47.8% 47.9%40.7%
56.8% 55.8% 51.2%59.5%
43.0% 44.4% 50.5%43.0% 39.3%
52.2% 52.1%59.3%
43.2% 44.2% 48.8%40.5%
D01 D02 D03 D04 D05 D06 D07 D08 D09 D10 D11 D12
Suitable Not suitable
20
WASH Infrastructure & Services Assessment in Zaatari Camp – March 2017
Private toilet suitability criteria
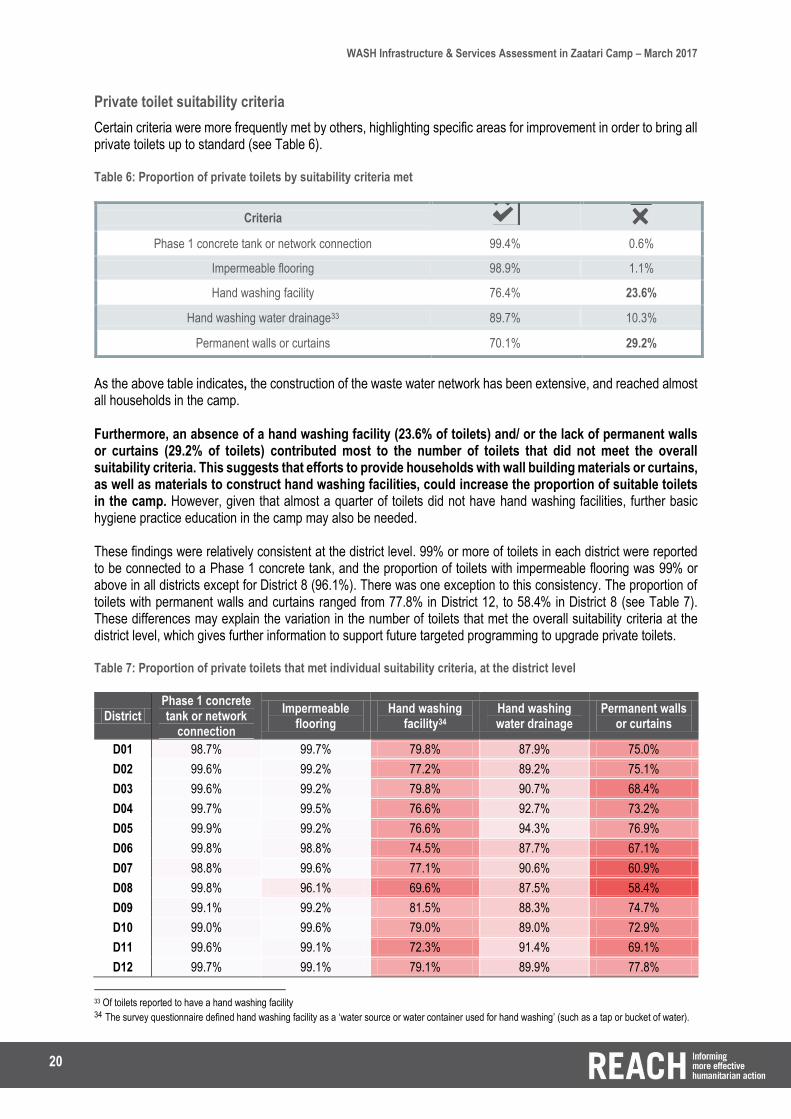
Certain criteria were more frequently met by others, highlighting specific areas for improvement in order to bring all private toilets up to standard (see Table 6). Table 6: Proportion of private toilets by suitability criteria met
Criteria
Phase 1 concrete tank or network connection 99.4% 0.6%
Impermeable flooring 98.9% 1.1%
Hand washing facility 76.4% 23.6%
Hand washing water drainage33 89.7% 10.3%
Permanent walls or curtains 70.1% 29.2%
As the above table indicates, the construction of the waste water network has been extensive, and reached almost all households in the camp. Furthermore, an absence of a hand washing facility (23.6% of toilets) and/ or the lack of permanent walls or curtains (29.2% of toilets) contributed most to the number of toilets that did not meet the overall suitability criteria. This suggests that efforts to provide households with wall building materials or curtains, as well as materials to construct hand washing facilities, could increase the proportion of suitable toilets in the camp. However, given that almost a quarter of toilets did not have hand washing facilities, further basic hygiene practice education in the camp may also be needed. These findings were relatively consistent at the district level. 99% or more of toilets in each district were reported to be connected to a Phase 1 concrete tank, and the proportion of toilets with impermeable flooring was 99% or above in all districts except for District 8 (96.1%). There was one exception to this consistency. The proportion of toilets with permanent walls and curtains ranged from 77.8% in District 12, to 58.4% in District 8 (see Table 7). These differences may explain the variation in the number of toilets that met the overall suitability criteria at the district level, which gives further information to support future targeted programming to upgrade private toilets. Table 7: Proportion of private toilets that met individual suitability criteria, at the district level
District Phase 1 concrete tank or network
connection
Impermeable flooring
Hand washing facility34
Hand washing water drainage
Permanent walls or curtains
D01 98.7% 99.7% 79.8% 87.9% 75.0%
D02 99.6% 99.2% 77.2% 89.2% 75.1%
D03 99.6% 99.2% 79.8% 90.7% 68.4%
D04 99.7% 99.5% 76.6% 92.7% 73.2%
D05 99.9% 99.2% 76.6% 94.3% 76.9%
D06 99.8% 98.8% 74.5% 87.7% 67.1%
D07 98.8% 99.6% 77.1% 90.6% 60.9%
D08 99.8% 96.1% 69.6% 87.5% 58.4%
D09 99.1% 99.2% 81.5% 88.3% 74.7%
D10 99.0% 99.6% 79.0% 89.0% 72.9%
D11 99.6% 99.1% 72.3% 91.4% 69.1%
D12 99.7% 99.1% 79.1% 89.9% 77.8%
33 Of toilets reported to have a hand washing facility 34 The survey questionnaire defined hand washing facility as a ‘water source or water container used for hand washing’ (such as a tap or bucket of water).

21
WASH Infrastructure & Services Assessment in Zaatari Camp – March 2017
Private toilet upgrades
The households that reported having an unsuitable toilet (i.e. not meeting one or more of the above mentioned criteria) were then asked if they had ever contacted an NGO to request an upgrade. For 69.1% of toilets that were determened to be unsuitable by UNICEF criteria, households had not contacted an NGO to upgrade the facility. However, this varied considerably at the district level (see Figure 12). Figure 12: Proportion of household with an unsuitable toilet that reported having already contacted an NGO for an upgrade of their facilities, at the district level
Reported engagement with NGOs regarding toilet upgrades was particularly low in the oldest districts of the camp (Districts 1,2,11 and 12); as well as in District 9. In District 1 and District 2 respectively 13.3% and 16.9% of the households with an unsuitable toilet reported having already contacted an NGO to updrade their facilities. By comparison, this proportion rose to 49.4% in District 6. This may again be due to the length of time that residents have been in the camp, and the age of the toilet. It may be that residents are unaware of the need or ability to request upgrades relating to wall and curtains and/or handwashing facilities, as well as to issues relating to core infrastructure and network connection. This implies that efforts to improve suitability of private WASH infrastructure, and potentially additional basic hygeine practice education, would be all the more relevant if they were focusing on these areas.
Phase 1 concrete tank connections
Although almost all toilets were reported to have suitable connections (i.e. Phase 1 concrete tanks), additional household level questions relating to perceived sufficiency of the connection, as well as modifications to the network, were asked to further ascertain the impact of the network on the camp, and any potential areas in need of repair and maintenance. Overall, 97.3% of households with toilets (11,884 in total) reported that they had a connection to a Phase 1 concrete tank and the waste water network. All questions regarding suffiency of and modifications to the household connection were therefore asked only to these households.
Sufficiency of connection
Of the 97.3% of the households that reported having a toilet and a connection to the Phase 1 concrete tanks, 86.6% reported that the connection was sufficient to meet household needs, and 13.4% that it was not (see Figure 13). However, this figure varied at the district level (see Table 8).
13.3% 16.9%
38.8% 39.8% 35.9%49.4%
43.7% 40.1%
18.8% 15.5% 16.4%23.5%
86.7% 83.1%
61.2% 60.2% 64.1%50.6%
56.3% 59.9%
81.2% 84.5% 83.6%76.5%
D01 D02 D03 D04 D05 D06 D07 D08 D09 D10 D11 D12
Contacted NGOs for updgrade Did not contact NGOs for an upgrade

22
WASH Infrastructure & Services Assessment in Zaatari Camp – March 2017
Figure 13: Proportion of households that reported a sufficient network connection
At the district level, the proportion of household that reported their connection to Phase 1 concrete tanks to be insufficient ranged from 10.8% (District 6) to 16.7% (District 3). Table 8: Proportion of households with a network connection, by reported sufficiency, by district
Districts D01 D02 D03 D04 D05 D06 D07 D08 D09 D10 D11 D12
Tank connection not sufficient
13% 14% 17% 14% 14% 11% 12% 15% 14% 13% 15% 12%
Tank connection sufficient
87% 86% 83% 86% 86% 89% 88% 85% 86% 87% 85% 88%
In order to better understand why households reported the connection to be sufficient or insufficient, and identify areas for targeted repair and maintenance services, households were asked to report on their perceived impact of the connection on their household sanitation situation (see Figure 14), and further explain the reason for any negative impact if reported (see Figure 15).
Perceived impact of Phase 1 concrete tank connections on sanitation situation
89.2% of the households perceived that the connection to Phase 1 concrete tanks ‘improved’ or ‘greatly improved’ their sanitation situation. However, 8.2% of the households (992) at the camp level believed that the connection to Phase 1 concrete tanks had a negative impact on the sanitation situation, making it either ‘worse’ or ‘much worse’ (see Figure 14). Almost one quarter of them were among the 13.4% of households that reported the connection to be insufficient. Figure 14: Perceived impact of Phase 1 concrete tank connections on the household sanitation situation
86.6% connection sufficient
13.4% connection insufficient
1.2%
7.0%
2.7%
57.0%
32.1%
Much worse
Worse
The same
Improved
Greatly improved

23
WASH Infrastructure & Services Assessment in Zaatari Camp – March 2017
The highest proportions of households that perceived the connection to have worsened the sanitation situation were recorded in District 1 (16.7% of households in the district) and in District 2 (11.4% of households in the district). In order to better understand these responses, all households that perceived the sanitation situation to be ‘worse’ or ‘much worse’ were asked to explain why.35 The most frequently reported reason for why households perceived the sanitation situation to be worse than before was that the septic tanks were overflowing (62.4%), followed by the vent smelling (52%), and thirdly, septic tank blockages (16.4%), as the below graph shows.36 Figure 15: Frequency of reported reasons perceiving the sanitation situation to have worsened
However, the frequency with which each issue was reported varied considerably across districts. Overflowing of septic tanks was most frequently raised in Districts 1, 2 and 6 (78%, 83.3% and 74.1% respectively). In contrast, 33.3% of households in District 11 who reported the sanitation situation to have worsened complained about overflows (see Table 9). Table 9: Proportion of households reporting the sanitation situation to have worsened and frequency of reported reasons for perceiving the sanitation situation to have worsened, at the district level
Districts
Proportion of households reporting
the sanitation situation as 'worse' or 'much
worse'
Septic tanks overflowing
Vent smelling
Septic tank
blockage Other
D01 16.7% 78.0% 49.4% 12.5% 0.6%
D02 11.4% 83.3% 34.1% 9.8% 2.3%
D03 9.3% 58.0% 60.9% 24.6% 0.0%
D04 6.8% 44.0% 60.0% 22.0% 6.0%
D05 6.3% 34.5% 67.3% 34.5% 3.6%
D06 10.0% 74.1% 44.8% 4.3% 5.2%
D07 5.0% 44.6% 66.1% 23.2% 0.0%
D08 5.2% 66.7% 52.8% 12.5% 0.0%
D09 9.2% 62.2% 51.2% 11.0% 7.3%
D10 4.3% 46.3% 48.8% 17.1% 4.9%
D11 6.2% 33.3% 61.5% 37.2% 2.6%
D12 8.0% 54.2% 60.4% 12.5% 2.1%
35 It is important to note that these findings are based on the reported perceptions of households, and not objective criteria. Furthermore, it may not be that the situation is worse than previously, but that continuing issues have led to dissatisfaction, which consequently leads households to report the situation as worse. 36 Multiple options could be selected.
62.4%
52.0%
16.4%
2.7%
Septic tanks overflowing Vent smelling Septic tank blockage Other

24
WASH Infrastructure & Services Assessment in Zaatari Camp – March 2017
These variations help explain the district level differences in reporting that the sanitation situation had worsened. As Table 9 shows, the districts with the highest proportion of households reporting the sanitation situation to have worsened correlate to the districts that reported overflowing issues most frequently. Furthermore, the high frequency of reporting overflowing issues in Districts 1 and 2 in particular, may be due to the density of the population in these areas, placing an additional strain on the network, resulting in the tanks overflowing. This is further supported by the correlation between household size and frequency of issue reported, as single-person households mostly complained about the bad smell of the vents while larger households mainly reported septic tank overflowing issues. Septic tank blockage was also significantly more reported by households having two or more members than any other household size. This indicates that across the camp, the tanks are exceeding capacity, thus posing public health risks that need to be addressed. This is all the more the case for the more densely populated districts and/or those characterized by larger average household sizes.
Connection modifications
7.3% of households reported having modified the original Phase 1 concrete tank connection. This figure varied at the district level, ranging from 2.4% in District 4 to 13.7% in District 9 (see Figure 16). During the KI interviews it appeared that intentional modifications of the communal sewage interceptor tanks made by residents were generally either related to change in the pipes’ size because the capacity of the initial ones was not big enough (resulting in overflowing, blocked or clogged pipes) or caravans’ enlargement /modification in the layout of the existing shelter. Figure 16: Proportion of households that reported having modified their original Phase 1 concrete tank connections
However, at the district level, households’ choice to modify the connection do not seem to be correlated with their reported satisfaction with the connection or with high rates of overflowing tanks. Consequently, it is likely that the primary reasons for alterations to the original Phase 1 concrete tank connections are modifications in the layout of the shelter or expansion of caravans.
6.9%
5.0%
10.5%
2.7%
7.9% 7.8%
4.0%
8.2%
13.7%
5.6%6.7%
9.4%
0%
5%
10%
15%
20%
D01 D02 D03 D04 D05 D06 D07 D08 D09 D10 D11 D12

25
WASH Infrastructure & Services Assessment in Zaatari Camp – March 2017
Waste Water and Solid Waste Disposal
Waste water production and disposal
Nearly all households (99.4%) reported generating waste water inside of their home on a daily basis. This figure was consistent across the camp districts. The proportion of households that reported producing waste water on daily basis increases with the size of the households, ranging from 96.3% for single-person households to 99.8% for households composed of 8 members or more. Households that produced grey water were then asked to report how they disposed of it. The most frequently reported method of disposal was a connection to a Phase 1 concrete tank only, with 96.8% of households reporting this method of disposal. However, 7% of households reported both using their connection to the Phase 1 concrete tank and pouring grey water onto the street. An additional 2.1% reported pouring grey water onto the street only, for a total 9.1% of households disposing of their grey water in this way (see Figure 17). Figure 17: Proportion of households by reported method of waste water disposal37
At the camp-level, 79.2% of the households reported having and using a washing machine, although notable differences emerged at the district level. For example, the oldest districts in the camp reported the highest level of ownership and usage of washing machine: 88% of the households assessed in District 1 and 86% in District 2 (see Figure 18). Figure 18: Proportion of households that reported owning and using a washing machine, at the district level
37 Multiple options could be selected.
89.8% Phase 1 concrete tank
7% Phase 1 concrete tank and pour on the street
2.1% pour on street only
1.1% other
88% 86%82%
77%72%
78% 77%
68%
78% 80% 82%86%
D01 D02 D03 D04 D05 D06 D07 D08 D09 D10 D11 D12

26
WASH Infrastructure & Services Assessment in Zaatari Camp – March 2017
Owning and using a washing machine also varied significantly by household size. Only 28.6% of the single-member households reported owning a washing machine, compared to 90.4% of the households composed of 8 members or more.
Solid waste production and disposal
As with wastewater production, nearly all households (99.6%) reported producing solid waste inside their homes, and this figure remained consistent across all districts. Of the households who produced solid waste, 97.2% reported disposing of their solid waste in garbage bins and 45.4% reported using the garbage collection service provided by NGOs.38 Only 3 households (0.02%) reported burning garbage. Figure 19: Frequency of reported solid waste disposal methods used
38 Multiple options could be selected. Due to the way the question was asked, it is not possible to specify whether participants that selected ‘use of garbage bins’ were using private household or public bins. However, a distinction was made between general disposal of waste in garbage bins, and use of garbage collection services by NGOs, for which there was significant overlap.
45.4%
97.2%
Garbage collection provided by NGOs
Use of garbage bins

27
WASH Infrastructure & Services Assessment in Zaatari Camp – March 2017
Communal Sewage Interceptor Tanks
During the UNICEF-REACH WASH Infrastructure & Services Assessment in Zaatari Camp, data was collected regarding every Phase 1 concrete septic tank that was installed in the camp between January and June 2016 as part of the Zaatari Wastewater Network (ZWWN) construction project. The tanks come in three sizes: 2m3 4m3, and 8m3. On average, a single tank supports the wastewater disposal of around five households. As the tanks are buried underground, only the elements of the tank visible above ground (ventilation pipes and manhole covers) were assessed. 2,762 tanks out of the 2903 present in the camp were assessed and recorded in total. Based on the findings, one to two blocks in each district that were found to have the highest number of damaged ventilation pipes were then selected for follow-up Key Informant (KI) interviews with residents living near the damaged tanks.
Damage to communal sewage interceptor tanks
37.5% of the surveyed tanks (1036 tanks) did not have any manholes. Of the 62.5% (1726) of assessed tanks with manholes, only nine (0.9%) were found to be without their covers. Of the 2762 tanks assessed as part of this assessment, 34.3% (946) were found to be damaged. The proportion of damaged tanks varied significantly between districts. The proportion of tanks found to be damaged ranged from 9.1% in District 6, to 66.4% in District 12 (see Figure 20). Figure 20: Proportion of damaged tanks, by district
The most frequently reported type of damage at the camp level was the removal of metal caps (91%). This is also the case at the district level, ranging from 73.5% in District 6 to 100% in Districts 1, 2, 10 and 11. ‘Ventilation pipe and surrounding area damaged or missing’ was also frequently cited in District 6 (35.3%) and District 9 (28.6%). Further, the presence of rock or soil down the pipes was frequently observed in Districts 11 (29.8%) and 12: 29.8% and 15.7% respectively (see Table 10). Table 10: Frequency of reported type of damage, at the district level
District D01 D02 D03 D04 D05 D06 D07 D08 D09 D10 D11 D12
Removal of metal caps
100% 100% 99% 100% 99% 74% 100% 98% 76% 100% 98% 100%
Rock or soil down vent pipes
0% 0% 0% 1% 3% 0% 1% 0% 0% 0% 30% 16%
Ventilation pipe and surrounding area
damaged or missing
0% 0% 1% 0% 1% 35% 0% 3% 29% 0% 0% 0%
45.7%
24.6%
57.9%
37.3% 35.4%
9.1%
41.6%
21.4% 23.3%20.2%
54.5%
66.4%
D01 D02 D03 D04 D05 D06 D07 D08 D09 D10 D11 D12
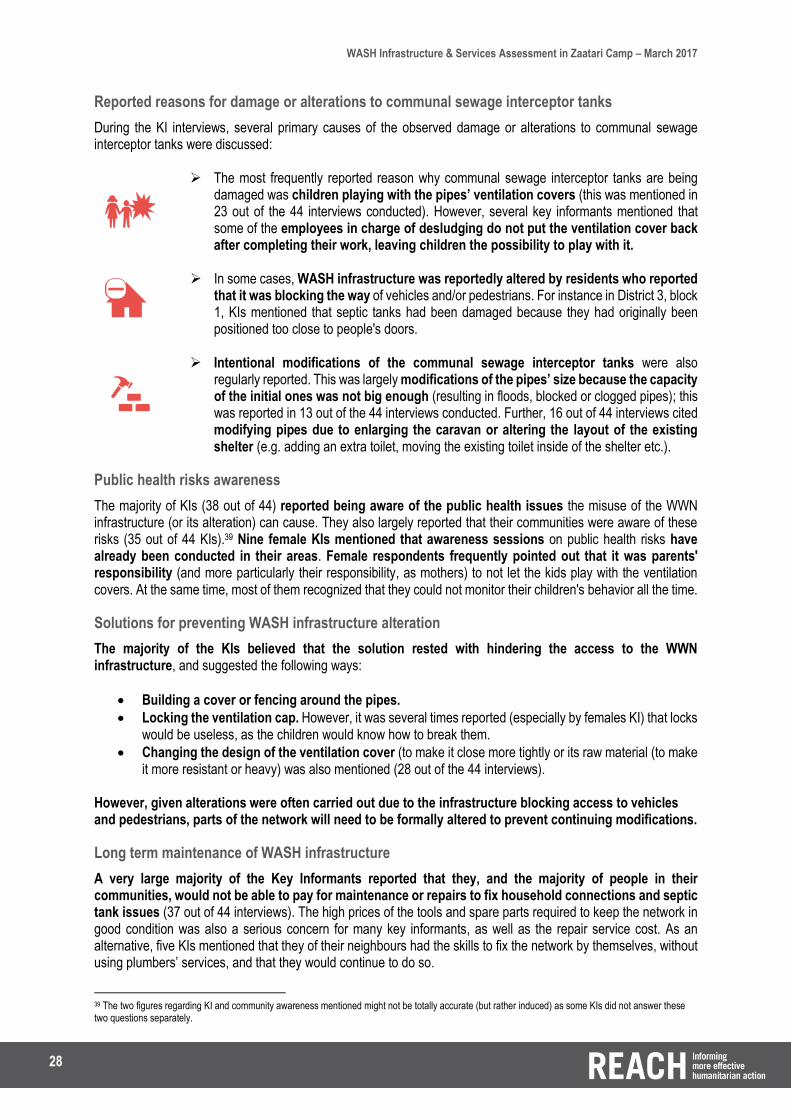
28
WASH Infrastructure & Services Assessment in Zaatari Camp – March 2017
Reported reasons for damage or alterations to communal sewage interceptor tanks
During the KI interviews, several primary causes of the observed damage or alterations to communal sewage interceptor tanks were discussed:
The most frequently reported reason why communal sewage interceptor tanks are being damaged was children playing with the pipes’ ventilation covers (this was mentioned in 23 out of the 44 interviews conducted). However, several key informants mentioned that some of the employees in charge of desludging do not put the ventilation cover back after completing their work, leaving children the possibility to play with it.
In some cases, WASH infrastructure was reportedly altered by residents who reported that it was blocking the way of vehicles and/or pedestrians. For instance in District 3, block 1, KIs mentioned that septic tanks had been damaged because they had originally been positioned too close to people's doors.
Intentional modifications of the communal sewage interceptor tanks were also regularly reported. This was largely modifications of the pipes’ size because the capacity of the initial ones was not big enough (resulting in floods, blocked or clogged pipes); this was reported in 13 out of the 44 interviews conducted. Further, 16 out of 44 interviews cited modifying pipes due to enlarging the caravan or altering the layout of the existing shelter (e.g. adding an extra toilet, moving the existing toilet inside of the shelter etc.).
Public health risks awareness
The majority of KIs (38 out of 44) reported being aware of the public health issues the misuse of the WWN infrastructure (or its alteration) can cause. They also largely reported that their communities were aware of these risks (35 out of 44 KIs).39 Nine female KIs mentioned that awareness sessions on public health risks have already been conducted in their areas. Female respondents frequently pointed out that it was parents' responsibility (and more particularly their responsibility, as mothers) to not let the kids play with the ventilation covers. At the same time, most of them recognized that they could not monitor their children's behavior all the time.
Solutions for preventing WASH infrastructure alteration
The majority of the KIs believed that the solution rested with hindering the access to the WWN infrastructure, and suggested the following ways:
Building a cover or fencing around the pipes.
Locking the ventilation cap. However, it was several times reported (especially by females KI) that locks would be useless, as the children would know how to break them.
Changing the design of the ventilation cover (to make it close more tightly or its raw material (to make it more resistant or heavy) was also mentioned (28 out of the 44 interviews).
However, given alterations were often carried out due to the infrastructure blocking access to vehicles and pedestrians, parts of the network will need to be formally altered to prevent continuing modifications.
Long term maintenance of WASH infrastructure
A very large majority of the Key Informants reported that they, and the majority of people in their communities, would not be able to pay for maintenance or repairs to fix household connections and septic tank issues (37 out of 44 interviews). The high prices of the tools and spare parts required to keep the network in good condition was also a serious concern for many key informants, as well as the repair service cost. As an alternative, five KIs mentioned that they of their neighbours had the skills to fix the network by themselves, without using plumbers’ services, and that they would continue to do so.
39 The two figures regarding KI and community awareness mentioned might not be totally accurate (but rather induced) as some KIs did not answer these two questions separately.

29
WASH Infrastructure & Services Assessment in Zaatari Camp – March 2017
Repair, Maintenance, and Reporting
In Zaatari camp, three primary actors support UNICEF in carrying out WASH services and activities, each with their own designated districts of operation (see Table 11). In each district, the WASH partners provide repair and maintenance services, including a reporting hotline for WASH related issues, as well as conducting hygiene promotion campaigns. Table 11: WASH partner by district of operation
Recognition of WASH service providers
In assessing the understanding and willingness of camp residents to engage with NGOs and seek assistance for WASH related repairs and maintenance, households were asked to identify the designated WASH actor in their district of residence. Over three quarters of households (77.5%) correctly identified the primary WASH service providor in their area. However, although only 0.7% identified the wrong NGO, 21.8% of households reported that they did not know. The proportion of households that correctly identified the primary WASH service provider in their district ranged from 73.5% in District 9, to 82.1% in District 6 (see Table 12). Figure 21: Proportion of households that were able to identify the WASH partner operating in their district
Table 12: Proportion of households that accurately named the WASH partner operating in their district
District D01 D02 D03 D04 D05 D06 D07 D08 D09 D10 D11 D12
Correctly identified the primary WASH
actor 77.6% 73.8% 76.9% 77.8% 74.9% 82.1% 79.4% 77.4% 73.5% 77.4% 77.6% 78.9%
WASH partner District of operation
ACTED 1, 2, 9, 10, 11 and 12
JEN 3, 4 and 5
Oxfam 6, 7 and 8
0.7% identified the wrong NGO
77.5% accurately named the WASH partner operating in their district
21.8% did not know the WASH partner operating in their district
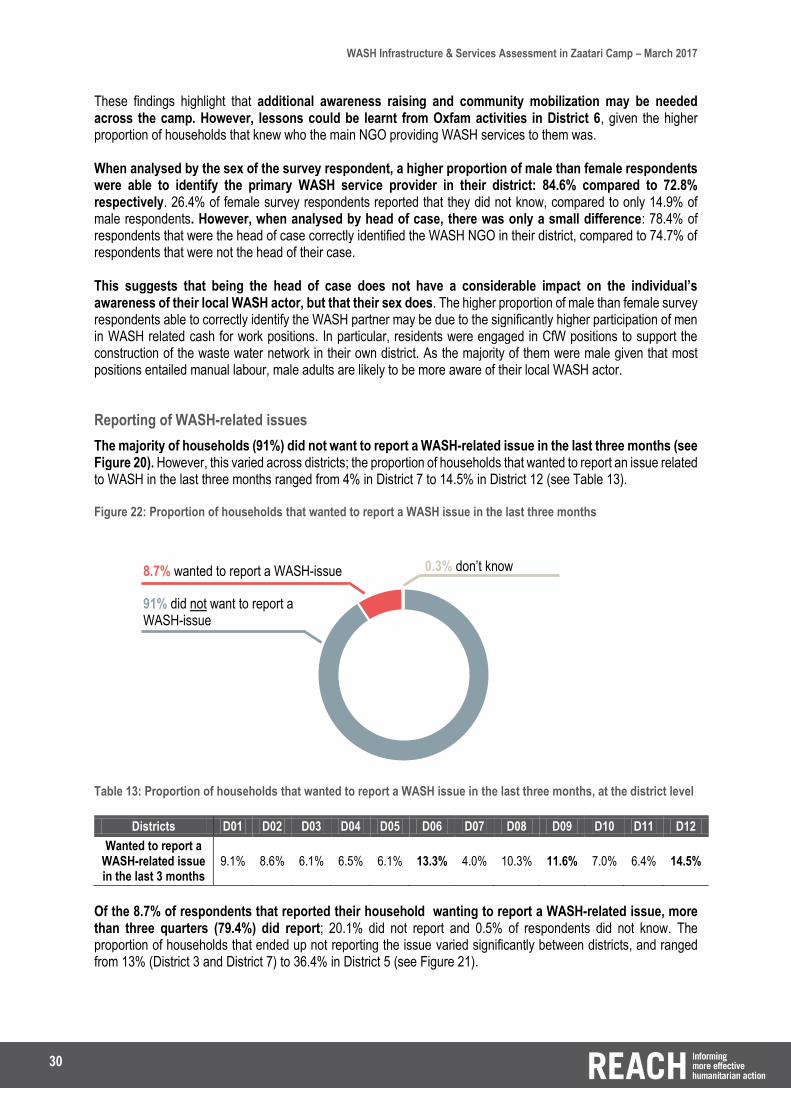
30
WASH Infrastructure & Services Assessment in Zaatari Camp – March 2017
These findings highlight that additional awareness raising and community mobilization may be needed across the camp. However, lessons could be learnt from Oxfam activities in District 6, given the higher proportion of households that knew who the main NGO providing WASH services to them was. When analysed by the sex of the survey respondent, a higher proportion of male than female respondents were able to identify the primary WASH service provider in their district: 84.6% compared to 72.8% respectively. 26.4% of female survey respondents reported that they did not know, compared to only 14.9% of male respondents. However, when analysed by head of case, there was only a small difference: 78.4% of respondents that were the head of case correctly identified the WASH NGO in their district, compared to 74.7% of respondents that were not the head of their case. This suggests that being the head of case does not have a considerable impact on the individual’s awareness of their local WASH actor, but that their sex does. The higher proportion of male than female survey respondents able to correctly identify the WASH partner may be due to the significantly higher participation of men in WASH related cash for work positions. In particular, residents were engaged in CfW positions to support the construction of the waste water network in their own district. As the majority of them were male given that most positions entailed manual labour, male adults are likely to be more aware of their local WASH actor.
Reporting of WASH-related issues
The majority of households (91%) did not want to report a WASH-related issue in the last three months (see Figure 20). However, this varied across districts; the proportion of households that wanted to report an issue related to WASH in the last three months ranged from 4% in District 7 to 14.5% in District 12 (see Table 13). Figure 22: Proportion of households that wanted to report a WASH issue in the last three months
Table 13: Proportion of households that wanted to report a WASH issue in the last three months, at the district level
Districts D01 D02 D03 D04 D05 D06 D07 D08 D09 D10 D11 D12
Wanted to report a WASH-related issue in the last 3 months
9.1% 8.6% 6.1% 6.5% 6.1% 13.3% 4.0% 10.3% 11.6% 7.0% 6.4% 14.5%
Of the 8.7% of respondents that reported their household wanting to report a WASH-related issue, more than three quarters (79.4%) did report; 20.1% did not report and 0.5% of respondents did not know. The proportion of households that ended up not reporting the issue varied significantly between districts, and ranged from 13% (District 3 and District 7) to 36.4% in District 5 (see Figure 21).
8.7% wanted to report a WASH-issue 0.3% don’t know
91% did not want to report a WASH-issue

31
WASH Infrastructure & Services Assessment in Zaatari Camp – March 2017
Figure 23: Proportion of households that wanted to report a WASH issue in the last three months and did, at the district level
These findings suggest that the majority of households that wanted to report a WASH-related issue did so. The lowest rate of reporting was recorded in District 5. Reasons for not reporting were analysed to better understand the reasons for this variation.
Reasons for not reporting a WASH-related issue
Of the households that responded that they wanted to report an issue, 20.1% (217 households) did not. When asked why they did not report, the most frequently cited reasons was that they did not think that reporting the issue would be effective (38.2%), followed by lack of knowledge of how to report an issue (30%) and not being aware of the responsible NGO operating in their districts (17.5%), (see Figure 24).40
Figure 24: Reasons for not reporting WASH-related issues
Combined with findings showing that a quarter of households did not know the primary WASH operator in their district (Figure 21), this implies that NGOs need to improve their awareness raising and visibility with regards to who and where to report WASH-related issues.
40 Multiple options could be selected.
38.2%
30.0%
17.5%13.4%
4.1%
Did not think reportingthe issue would be
effective
Did not know how toreport the issue
Did not know theresponsible NGO for
their district
Fixed the issue bythemselves
Other
84.9% 83.2% 87.0%79.6%
63.6%
81.0%87.0%
78.5% 80.2%75.0% 74.4% 77.4%
14.0% 15.8%13.0%
20.4%
36.4%
19.0%13.0%
21.5% 17.9% 25.0% 24.4% 22.6%
1.1% 1.0% 1.9% 1.2%
D01 D02 D03 D04 D05 D06 D07 D08 D09 D10 D11 D12
Did report the issue Did not report the issue Don't know

32
WASH Infrastructure & Services Assessment in Zaatari Camp – March 2017
WASH-related issues reported
Of the total number of households assessed, 6.9% (855 households) wanted to report a WASH-related issue in the last three months and reported doing so. When asked the reason for making a report, almost three quarters (72.3%) cited issues relating to desludging (see Figure 25).41 Figure 25: Types of WASH-related issues reported in the last three months
At the district level, desludging was consistently the most commonly reported issue, although the frequency with which it was reported did vary, from 49% of reports in District 10 to 84.5% of reports in District 2 (see Table 14). The high frequency of reporting desludging issues in Districts 1 and 2 may be explained by anecdotal evidence from WASH actors about the difficulties in accessing tanks for desludging in these areas due to the population density and narrow pathways between houses limiting access to desludging trucks. Table 14: Proportion of households that reported a WASH-related issue and most frequently cited issue, at the district level
41 Multiple options could be selected.
72.3%
14.3%9.1% 8.5%
4.1%
Desludging Drinking water related waste water networkconnection
maintenance
Other No toilet/ Unsuitabletoilet
Districts Number of
households
Proportion of households that wanted to report
an issue
Proportion of households that wanted to report an issue, and did
Most frequently cited issue reported
D1 1027 9.1% 7.7% Desludging 79.7%
D2 1174 8.6% 7.2% Desludging 84.5%
D3 754 6.1% 5.3% Desludging 70.0%
D4 753 6.5% 5.2% Desludging 56.4%
D5 900 6.1% 3.9% Desludging 57.1%
D6 1190 13.3% 10.8% Desludging 84.4%
D7 1138 4.0% 3.5% Desludging 65.0%
D8 1452 10.3% 8.1% Desludging 76.9%
D9 916 11.6% 9.3% Desludging 72.9%
D10 935 7.3% 5.5% Desludging 49.0%
D11 1302 6.3% 4.7% Desludging 62.3%
D12 869 14.3% 11.0% Desludging 67.7%

33
WASH Infrastructure & Services Assessment in Zaatari Camp – March 2017
Reporting mechanisms
At the camp level, the WASH services hotline was the most frequently cited channel through which complaints were made (69%). This was followed by contacting a NGO field staff member (31.6%), and community gatherings (2.3%).42 The WASH services hotline was consistently cited as the most frequently used method of reporting in all districts, with the exception of District 7, where 52.5% of households used the WASH services hotline, and 55% reported to NGO field staff (see Table 15). Table 15: Frequency of reporting method cited, at the district level
When analysed by primary WASH actor in the district, there were notable variations in the frequencies of reporting methods cited. Although the WASH services hotline was the primary method cited, regardless of WASH actor, Oxfam districts cited use of NGO field staff as a reporting mechanism more frequently than other NGO operated districts (see Figure 26). This may be explained by different community outreach methods used by different organisations, where Oxfam may more frequently employ direct community mobilization efforts than its counterparts. Figure 26: Frequency of reporting method cited, by primary WASH NGO operator
42 Multiple options could be selected.
Districts WASH services
hotline NGO field staff
Community gatherings
Other
D01 83.5% 19.0% 0.0% 0.0%
D02 79.8% 22.6% 2.4% 2.4%
D03 77.5% 22.5% 0.0% 0.0%
D04 79.5% 17.9% 0.0% 5.1%
D05 62.9% 37.1% 5.7% 5.7%
D06 68.0% 31.3% 3.1% 3.1%
D07 52.5% 55.0% 5.0% 5.0%
D08 61.5% 39.3% 3.4% 5.1%
D09 65.9% 32.9% 0.0% 5.9%
D10 72.5% 33.3% 0.0% 3.9%
D11 60.7% 37.7% 4.9% 1.6%
D12 65.6% 32.3% 3.1% 4.2%
71.5%
29.2%
1.8% 3.1%
73.7%
25.4%
1.8% 3.5%
63.2%
37.9%
3.5% 4.2%
WASH services hotline NGO field staff Community gatherings Other
ACTED JEN Oxfam

34
WASH Infrastructure & Services Assessment in Zaatari Camp – March 2017
Satisfaction with reporting mechanisms
Of those households that reported a WASH-related issue in the last three months, 43.2% considered the response received from the NGO as ‘very adequate’ or ‘adequate’ (see Figure 27). However, a comparable proportion of respondents (42.7%) reported that the response was either ‘inadequate’ or ‘very inadequate. Figure 27: Reported satisfaction with response to reporting of WASH-related issue
The proportion of households who found the response to be ‘very adequate’ or ‘adequate’ varied at the district level, ranging from 28.6% (District 5) to 52.5% (District 3). Similarly, the proportion of households who reported the response as either ‘inadequate’ or ‘very inadequate’ fluctuated from 39.2% (District 1) to 60% (District 5 and District 7). Findings do not suggest that reported satisfaction is related to either the primary WASH actor in the district, or the method of reporting. In every district the most frequently reported reason for why residents were dissatisfied was the lack of response to the issue they reported (62.7%). Frequencies varied significantly between districts however. Interestingly, this figure varied from 29.4% to 76.1% within the districts managed by JEN and from 47.5% to 79.16% within the districts where Oxfam operates (see Table 16). Long delays in receiving an answer was also frequently cited as a justification for dissatisfaction with the reporting process. Once again this varied between districts. This suggests that satisfaction with reponse to reports made varies considerably at the district level, but does not seem to be related to the method of reporting or the primary WASH actor. Rather, greater efforts to improve response mechanisms, and consistency in responses, are needed across the camp. Table 16: Frequency of the reported reasons of dissatisfaction with response to reporting
District Lack of response to the reported issue
NGO responded to the report but did not
repair the damage/ provide a solution
Response to reported issue was excessively delayed
Quality of the solution was inadequate
Other
D01 71.0% 12.9% 9.7% 6.5% 0%
D02 66.7% 11.1% 22.2% 0% 0%
D03 29.4% 47.1% 17.6% 5.9% 0%
D04 57.1% 7.1% 35.7% 0% 7.1%
D05 76.2% 14.3% 14.3% 4.8% 0%
D06 47.5% 23.7% 25.4% 8.5% 0%
D07 79.2% 16.7% 4.2% 0% 0%
D08 62.8% 20.9% 20.9% 4.7% 0%
D09 61.8% 32.4% 11.8% 2.9% 0%
D10 66.7% 22.2% 3.7% 7.4% 0%
D11 73.3% 20.0% 10.0% 0% 0%
D12 65.8% 15.8% 7.9% 15.8% 0%
15.2%
27.5%
13.9%
31.9%
11.2%
Very inadequate
Inadequate
Somewhat adequate
Adequate
Very adequate
35
WASH Infrastructure & Services Assessment in Zaatari Camp – March 2017
CONCLUSION
This report sought to inform WASH actors in Zaatari camp by evaluating the impact of the recently implemented wastewater management project, as well as broader WASH practices and activities, and residents’ knowledge and perception of them. In order to strengthen future programming, the census-level survey conducted for Phase I endeavored to provide insight on a range of WASH activities, including evaluating the districts in greatest need of network maintenance to improve the sanitation situation, identifying households with unsuitable private toilets that required upgrades to meet WASH sector standards, and highlighting the areas in which WASH partners would benefit from expanding outreach and improving beneficiary communication. The findings from Phase 2 have allowed for a more in-depth analysis, by assessing the communal sewage interceptor tanks and giving context to observed damage, with implications for both technical maintenance and repair needs of the network, and the more general sanitation and hygiene situation in the camp. In addition to supporting WASH actors, this assessment provided a demographic profile of the camp to update population figures and characteristics that underpin the work of the wider humanitarian community in Zaatari. Since the last REACH population count in 2015, Zaatari has seen a decline in population, although it still remains the largest refugee camp in Jordan. The demographics of sex and age recorded from the assessed population indicate that the population is predominantly young, aged 0 to 17 years (56.9% of the recorded population) and relatively even across gender (51% female and 49% male). Gender composition discrepancies were highest for the age category of 25-39 years old. This might indicate a trend in younger and working aged men leaving the camp in an attempt to find employment opportunities in host communities. This could be the result of the simplification of the work permit application process, in line with the livelihoods component of the Jordan Compact,43 and the streamlining of work and leave permits for residents of the camp.
This research found that nearly all households (99.3%) are residing in pre-fabricated caravans in Zaatari camp, indicating the near universal success of NRC and UNHCR’s joint initiative to provide every household with a caravan by 2015. Only 0.7% (91) of households reported living in either mixed caravan and tent shelters, shelters constructed from metal sheeting or tents only. Anecdotal evidence indicates that movement of households across the camp has reduced in recent years, and may well be due to the provision of more permanent shelters and infrastructure. This in turn has positive implications for WASH programming, as the relative stability helps to ensure and maintain coverage, as well as long-term sustainability for the WWN. Efforts to provide each household with private WASH infrastructure, in parallel to the waste water network construction, have shown continuous improvements and successes over time. 98.4% of the households reported having private toilets in this survey, representing a 7.4 points increase since 2015; the alternative type of latrines used by households that do not have private toilets in their homes indicated that these households similarly relied on private infrastructure, of either their relatives or neighbours. There were notable differences with regard to WASH facilities ownership and use of WASH-related services at the district level, particularly for the oldest inhabited districts (Districts 1, 2, 3, 11 and 12). The highest levels of private toilet ownership and private toilet suitability were both reported in Districts 1 and 2. Furthermore, the proportion of households in Districts 1 and 2 that reported purchasing water from private vendors was well above the average of the camp. These findings may be explained by the fact that these districts had a longer period over which to construct private WASH infrastructure. Regarding the water supply, around two-thirds of households reported using the free water trucking from NGO as their primary source of drinking water. However, significant variations between districts have been reported and a large proportion of households in Districts 1, 2 and 7 are reportedly used to purchasing drinking water from a private vendor. The majority (95%) of households who reported not using free water trucking explained that they perceived the water to be of poor quality, above other reasons (e.g. availability or quality of the service offered). To get a deeper understanding of differences in drinking water behaviour between districts and residents’ clean water needs, further research is needed. Collecting further information on drinking water
43 The ‘Jordan Compact’ presented at the 2016 London conference sets out a series of major commitments aimed at improving the resilience of refugee and host communities, focusing mainly on livelihoods and education.

36
WASH Infrastructure & Services Assessment in Zaatari Camp – March 2017
behaviour would be all the more relevant in that it would support the next step of the WWN project towards achieving greater sustainability: the construction of the water network. In addition to providing almost complete private toilet coverage for the camp, the waste water network project succeeded in connecting nearly all households with private toilets; 99.5% of households having private toilets reported that at least one of their toilets was connected to the WWN through the Phase 1 concrete tanks. Furthermore, almost all were connected exclusively to septic tanks. When asked to rate the impact of the connection to Phase 1 concrete tanks, 89.2% of households perceived it to have “improved” or “greatly improved” the sanitation situation of the camp and a very large majority of the households (86.4%) reported that their connection to the Phase 1 concrete was sufficient. By improving the sanitation situation of the camp, construction of the WWN and of private toilet facilities have raised the living standards of the beneficiaries and made a significant step towards sustainability of WASH services in the camp. Nonetheless, there is a need for further maintenance to the network, as a small minority of households reported general dissatisfaction with their connections, or a decline in the sanitation situation. The most reported reason for this was problems with overflowing and blockages. Furthermore, 7.3% of the households reported having modified their original Phase 1 concrete tank connection. Through the KI interviews, this was frequently explained with a need to increase the capacity of the connection as the original pipes were too small, leading to overflowing. Dissatisfaction may also be linked to the observed damage of communal sewage interceptor tanks to which all Phase I concrete tanks are connected. 34.3% of the communal tanks assessed were found to be damaged, mainly due to the loss of metal caps on ventilation pipes. Restricting the access to the WWN infrastructure, or changing the design of the ventilation cover are initiatives that could be undertaken to hinder further WASH infrastructure alteration or damage, in order to maintain the sanitation situation in the camp. Although the construction of the WWN is now complete and has so far achieved its overriding objective: offering a sustainable solution to residents’ WASH needs, it would still need to be gradually adapted to residents’ needs. Further to the repair and maintenance needs of the network connections, upgrading private WASH infrastructure would also need to be considered in future programming. When evaluating the overall suitability of private toilets, according to WASH sector standards, just over half (52.6%) of the private toilets assessed could be determined suitable.44 While the very large majority of the households reported having an impermeable flooring (98.9%) and disposing of water from a hand-washing area (76.4%), as many as 30% of households reported having no permanent wall or curtain. Therefore, to increase the percentage of suitable toilets in the camp, efforts should be directed predominantly towards providing materials to construct permanent walls or curtains for those that did not have them. However, implementing repairs and maintenance would necessitate an improvement of community outreach and services. Firstly, of those who reported having an unsuitable latrine, the majority (69.1%) had never come into contact with an NGO to upgrade their facilities. Secondly, although WASH partners were overall well known by the households in the districts where they operate, 21.8% of the households were not able to identify the NGO providing WASH-related services in their areas. This indicates that WASH partners could increase visibility and improve beneficiary communication to ensure that residents are aware of whom they should contact with regard to WASH services. In order to support actors in better targeting their services, this assessment found that the WASH services hotline was the most frequently used channel for reporting WASH-related issues, (69%) and desludging was the most frequently reported issue (72.3%). However, 20.1% of the 1077 households that wanted to report any WASH issue in the last three months, ended up not doing so. The most frequently cited reason was that they did not think that reporting the issue would be effective. WASH implementing partners would therefore be more effective if they focused their efforts on being more reactive to handling complaints.
44 To be considered as suitable according to the UNICEF standards, private toilets had to dispose of: a concrete tank or network connection, an impermeable flooring, a handwashing facility accompanied with a water drainage and permanent wall or curtain.

37
WASH Infrastructure & Services Assessment in Zaatari Camp – March 2017
ANNEXES
ANNEX 1: HOUSEHOLD QUESTIONNAIRE
UNICEF-REACH Private WASH Infrastructure Assessment in Zaatari Camp Phase 2 Quantitative Tool
1) Record GPS coordinates of the structure
2) Insert your team leader’s code and your number.
- A(1-12)
- B(1-12)
- C(1-12)
- D(1-12)
- E(1-12) 3) Record district number (dropdown menu 1-12)
4) Record Block number (dropdown menu 1-24)
5) Record HH number
- Cannot tell from observation alone
6) In what type of shelter does the respondent live
(based on observation)
- Caravan
- Tent
- Mixture of both caravan and tent
7) Is there a household member willing to participate
in this survey?(Participant should be 18 or above)
- Yes
- No
[If No, skip to the end of survey]
Demographics
8) Record ProGres case number
9) What is the sex of the respondent?
- Male
- Female
10) What is the sex of the head of HH?
- Male
- Female
11) How many cases live in your household?
12) Record case ID for each case living in the household
13) How many individuals are in each case (looped with
Q11)?
14) What is the sex and age for each member of the
case (looped with Q12)
Private structures with toilet on premise
15) Does your structure have a private toilet on premise?
- Yes
- No
16) [If no to 15] What alternative latrine do you use?
- Private home – neighbour’s home
- Private home – friend or relative’s home
- Public WASH centre
- Other, please specify _____
If No, skip to Q22 after Q16
If yes to Q15:
17) How many toilets do you have?
- Select number 1-4
18) Do you share this toilet with another household in the camp?
- Yes
- No
- Don’t know
19) What is your private toilet connected to?
- Private pit
- Septic tank (PRC)
- Steel tank
- THW
- Other, please specify _____
- Don’t know
20) [If Septic tank (PRC) in Q19] Have you modified
your connection to the septic tank (PRC)?
- Yes
- No
21) [If Septic tank (PRC) in Q19] Is your current
connection sufficient to meet your household
needs?
- Yes
- No
22) [If Septic tank (PRC) in Q19] What has been the
impact of your connection to a septic tank (PRC) in
terms of your sanitation situation?
- Much worse
- Worse
- The same
- Improve
- Greatly improved
23) [If ‘Much worse’ or ‘worse’ in Q22] Why? (Select all
that apply)
- Septic tanks overflowing
- Septic tank blockage
- Vent smelling
- Other, please specify ____
Toilet suitability (if yes to 15) 24) What is the primary material that is used for the
flooring in the toilet area?
- Ceramic tiles
- Plastic tiles

38
WASH Infrastructure & Services Assessment in Zaatari Camp – March 2017
- Stone tiles
- Plastic sheeting
- Concrete - Wooden panels - Dirt (no flooring material) - Don’t know - Other ___________________________
25) Is the toilet area shielded on four sides by permanently installed walls or curtains? (Hint: if curtains are put-up and taken down as and when someone needs the toilet then this does not count as permanently installed)
- Yes
- No
- Don’t know
26) Inside the toilet area is there a water reservoir or water container that is used for hand washing? (This can be a tap or bucket of water)
- Yes
- No
- Don’t know
27) Do you have a drainage system in place that allows hand washing water to exit the toilet area?
- Yes
- No
- Don’t know
28) [If any of 23-26 is answered no] Have you been
contacted by an NGO to upgrade your toilet?
- Yes
- No
- Don’t know
29) Have you moved since January 1, 2016?
- Yes
- No
30) [If yes to 29] What was your previous address? - Address: ___________
31) [If yes to 29] Did your previous structure have a
private toilet on the premise?
- Yes - No
32) [If yes to 29] At the time of moving, what was your private toilet connected to?
- Private pit
- Septic tank (PRC)
- Steel tank
- THW
- Other, please specify _____
- Don’t know
Wastewater and solid waste disposal
33) Is grey water produced during the course of the day inside your structure? (hint: water not from a toilet, water coming from washing the dishes and/or cleaning the clothes, etc.)
- Yes
- No
- Don’t know
34) [If yes to 33] How do you dispose of this grey water?
- Private pit
- Septic tank (PRC)
- Steel tank
- THW
- Other, please specify _____
- Don’t know
35) Does your household possess and use a washing machine?
- Yes
- No
- Don’t know
36) Is solid waste produced inside of your structure? (hint: any type of garbage, refuse, or waste)?
- Yes
- No
- Don’t know
37) [If yes to 36] How do you dispose of this waste?
- Garbage collection provided by NGOs
- Burning garbage
- Disposing at another location, specify
_____
- Other, please specify _____
- Don’t know
Water supply
38) What is the primary source of drinking water in your household?
- Purchased from a private vendor
- Free water trucking from NGOs
- Other, please specify _____
39) [If not ‘Free water trucking from NGOs’] Why do you not use free water provided by trucks for drinking?
- Bad quality
- Water delivery is late / inconsistent
- I do not receive free water delivery
- Other, please specify
Adequacy of WASH R&M services
40) Who is the designated NGO providing WASH services in your district?
- ACTED
- JEN
- Oxfam
- IRD
- Don’t know
- Other ___________________________
41) Have you or someone in your household felt the need to report an issue about WASH services in the last 3 months?
- Yes
- No
- Don’t know

39
WASH Infrastructure & Services Assessment in Zaatari Camp – March 2017
42) If yes to Q41] Did you or someone in your household report the issue?
- Yes
- No
- Don’t know
43) [If yes to Q41], did your complaint relate to:
- Water deliveries
- Desludging
- Solid waste collection
- Other ______________
44) [If yes to Q42] How was the issue reported?
- WASH services hotline
- NGO field staff member
- Community gathering
- Other, please specify
45) [If yes to Q42] How would you rate your satisfaction with the response to your issue?
- Very adequate
- Adequate
- Somewhat adequate
- Inadequate
- Very inadequate
- Don’t know
46) If inadequate or very inadequate, why? (select all that apply)
- Lack of response to the reported issue
- Response to reported issue was
excessively delayed
- NGO responded to the report but did not
repair the damage
- Quality of repair was inadequate
- Other, please specify _____
47) [If no to 42] Why did your household not report the issue?
- Did not know the responsible NGO for my
district
- Did not know how to report the issue
- Fixed the issue ourselves
- Did not think reporting the issue would be
effective
- Other, please specify _____
48) How often does your tank get desludged?
- Every day
- Once a week
- Once every two weeks
- Once a month
- Don’t know
49) Has your tank ever overflowed?
- Yes
- No
- Don’t know
50) [If yes to 49] How often has this happened?
- Once
- 2-5 times
- More than 5 times
51) How confident are you that your tank will get desludged before it overflows?
- Very confident
- Confident
- Somewhat confident
- Unconfident
- Very unconfident