Embed Size (px)
Citation preview
For more information visit: www.infrastructure.govt.nz
INFRASTRUCTURE EVIDENCE BASE
Energy Sector
February 2014

EVIDENCE BASE: ENERGY SECTOR
For more information visit: www.infrastructure.govt.nz
EVIDENCE BASE Energy Sector February 2014
Introduction
Infrastructure is a crucial part of the New Zealand economy. It supports the day to day activities of New Zealanders, helps to improve
living standards for all, and can be a driver for economic growth. As such, it is vital it is managed as well as possible. The National
Infrastructure Plan 2011 sets out a long term vision for New Zealand’s infrastructure and seeks to provide a common direction for how
we plan, fund, build and use all economic and social infrastructure.
A significant constraint identified in the National Infrastructure Plan 2011 was the lack of information about asset condition and
performance to allow more informed decisions and efficient and effective investment. A key part of the National Infrastructure Unit’s
(NIU) work programme over the past two years has been to develop a more robust Evidence Base to address this constraint. In
particular, publishing the Evidence Base enables a discussion identifying the significant issues for New Zealand infrastructure and
options to respond to these. Discussion of these will underpin the NIU’s work programme over 2014, through to the release of the next
National Infrastructure Plan in 2015.
The Evidence Base draws together work on performance indicators (the current state of the infrastructure), scenario and trend analysis
(the future pressures or drivers of demand), the national resilience picture, and the first 10-year Capital Intentions Plan (what is known
about indicative future spend).
This document forms the substantive component of the Evidence Base for
the energy sector, defined by NIU as the generation, transmission,
distribution and availability for use of electricity, gas, and oil. It follows from
the overview document, which can be found on the NIU’s website. It draws
information from the performance indicators, scenario and trend analysis,
and resilience assessment.
Where data has been provided, this is publically available information, and
has been provided with permission of the information owner.
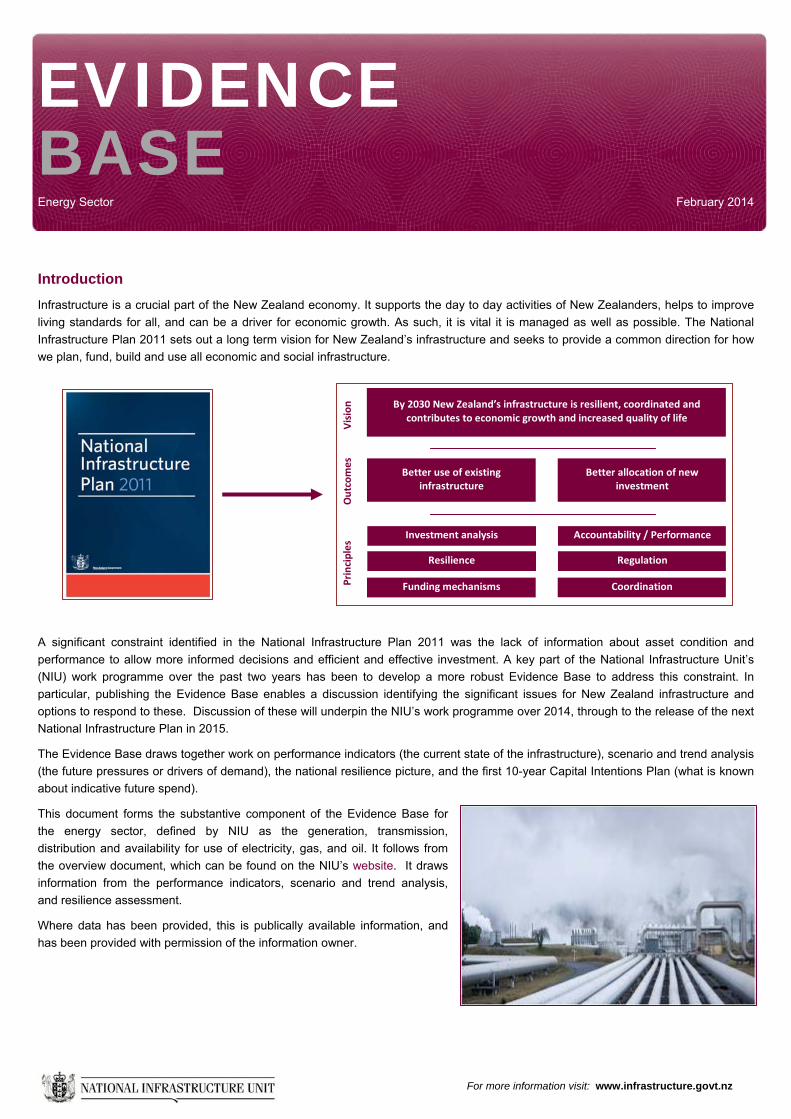
By 2030 New Zealand’s infrastructure is resilient, coordinated and contributes to economic growth and increased quality of life
Vision
Outcomes
Better use of existing infrastructure
Better allocation of new investment
Principles
Accountability / Performance
Regulation
Coordination
Investment analysis
Funding mechanisms
Resilience

EVIDENCE BASE: ENERGY SECTOR
2
Overview messages
The overall condition of energy networks is seen as good; quality is generally above targets, with sufficient service availability and
adequate management. However there are challenges for each of the energy systems; electricity, gas and oil.
In electricity, the generation mix is changing with the increase in geothermal and wind capacity, while the role of thermal (coal and gas)
is transitioning from base-load and mid-merit to peaking generation. Appropriate plant and fuel supply contracts will be key to meeting
the flexibility requirements of the electricity market in future. In addition, ensuring contractual commitments are made regarding thermal
fuel supplies beyond 2014 is important, and is an area of risk currently.
Recent investments in the national grid (Transpower) now provide significant capacity margins in most areas but needs to remain
cognisant of shifting electricity supply and demand through the country. Supply reliability of electricity distributors continues to show a
trend of improvement (2008–13) but varies widely between distributors, with some having a significantly larger number of interruptions
and a significantly longer duration of interruptions.
In addition, the outlook for electricity distribution businesses is challenging due to a variety of reasons. These include a dynamic and
changing market, with increasing level of investment uncertainty going forwards; ageing assets; consumers’ increasing supply quality
expectations; and emerging technologies such as household scale photovoltaic generation, which may reduce demand projections.
Adapting to technology changes and shifting focus to customer control and managing demand will be crucial to responding to these
challenges.
In oil, although there is little infrastructure redundancy built into the system, with 70% of the fuel consumed in New Zealand each year
processed by a single refinery, NZ has options for responding to domestic supply emergencies affecting supply pinch points. Storage
capacity in the South Island is reported to be reaching capacity, and further investment may be required to avoid supply-side risk if
demand grows or older infrastructure is not maintained. Due to the quality of NZ’s crude oil production it is largely exported with very
little processed onshore. Standards across the oil system are in accordance with international best practice.
In gas, transmission capacity, including into Auckland, is generally considered to be sufficient for short-to-medium term supply/demand
scenarios. The next step-change in investment is likely to be associated with a significant new gas find. At times LPG (a product of gas
production) has been intermittently exported in relatively small quantities but otherwise all gas is consumed onshore. Production is from
numerous fields with distribution by grid network in the North Island and various LPG networks in the South Island.
In addition, there are opportunities relating to energy efficiency and demand side management to improve utilisation of energy
infrastructure.
Context
The energy sector comprises large scale network assets including 12,000km of high voltage transmission lines, 2,500km of high
pressure gas transmission pipelines and 16,800km of regional gas distribution systems. NZ’s only oil refinery produces around 70% of
the fuel consumed in NZ each year, and a single pipeline carries over 30% of national fuel demand from the refinery to Auckland.
For both electricity and gas, NZ is self sufficient in terms of production and supply, whereas for oil it is almost completely dependent on
imports. Electricity generated is substantially from renewable sources and for the balance is dependent on gas and coal supplies which
tend to be subject to on-going supply uncertainty.
The majority of energy companies are privately owned and operated, and the electricity and gas distribution sectors are subject to
Commerce Commission price-quality regulation.
There are multiple interdependencies with other sectors, such as transport, and a growing reliance on telecommunications and data
flows.
EVIDENCE BASE: ENERGY SECTOR
3
What do we have?
Electricity
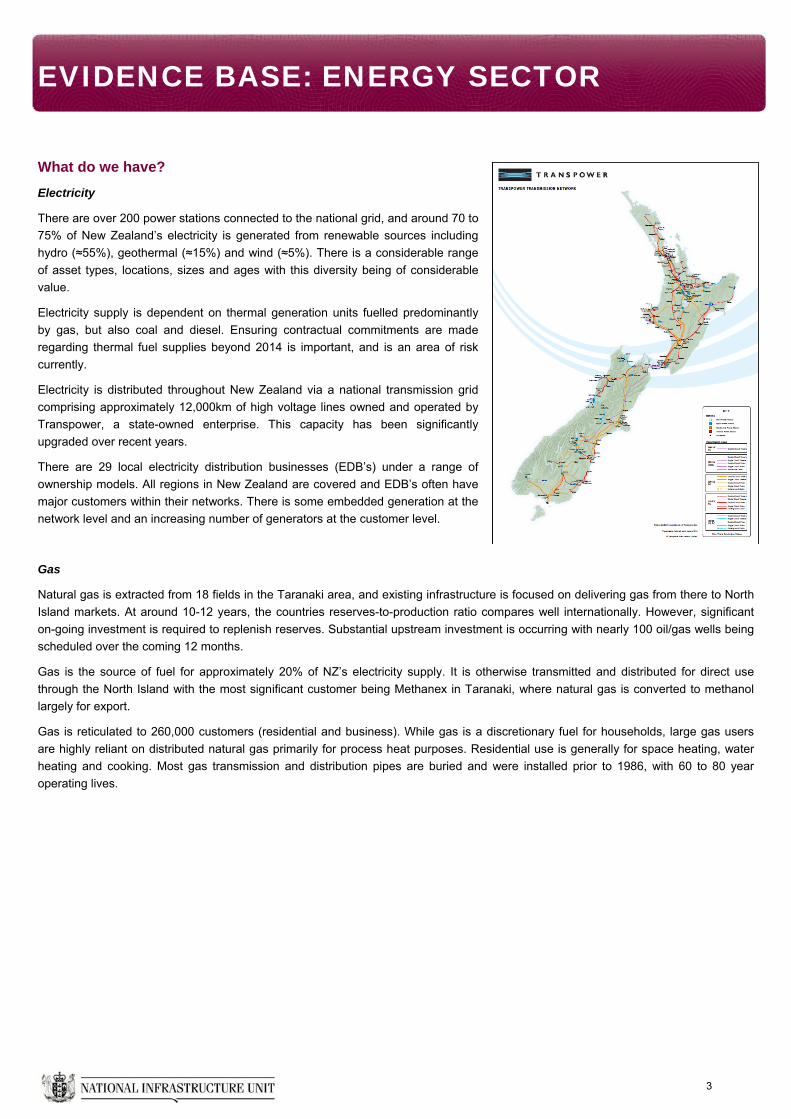
There are over 200 power stations connected to the national grid, and around 70 to
75% of New Zealand’s electricity is generated from renewable sources including
hydro (≈55%), geothermal (≈15%) and wind (≈5%). There is a considerable range
of asset types, locations, sizes and ages with this diversity being of considerable
value.
Electricity supply is dependent on thermal generation units fuelled predominantly
by gas, but also coal and diesel. Ensuring contractual commitments are made
regarding thermal fuel supplies beyond 2014 is important, and is an area of risk
currently.
Electricity is distributed throughout New Zealand via a national transmission grid
comprising approximately 12,000km of high voltage lines owned and operated by
Transpower, a state-owned enterprise. This capacity has been significantly
upgraded over recent years.
There are 29 local electricity distribution businesses (EDB’s) under a range of
ownership models. All regions in New Zealand are covered and EDB’s often have
major customers within their networks. There is some embedded generation at the
network level and an increasing number of generators at the customer level.
Gas
Natural gas is extracted from 18 fields in the Taranaki area, and existing infrastructure is focused on delivering gas from there to North
Island markets. At around 10-12 years, the countries reserves-to-production ratio compares well internationally. However, significant
on-going investment is required to replenish reserves. Substantial upstream investment is occurring with nearly 100 oil/gas wells being
scheduled over the coming 12 months.
Gas is the source of fuel for approximately 20% of NZ’s electricity supply. It is otherwise transmitted and distributed for direct use
through the North Island with the most significant customer being Methanex in Taranaki, where natural gas is converted to methanol
largely for export.
Gas is reticulated to 260,000 customers (residential and business). While gas is a discretionary fuel for households, large gas users
are highly reliant on distributed natural gas primarily for process heat purposes. Residential use is generally for space heating, water
heating and cooking. Most gas transmission and distribution pipes are buried and were installed prior to 1986, with 60 to 80 year
operating lives.
EVIDENCE BASE: ENERGY SECTOR
4
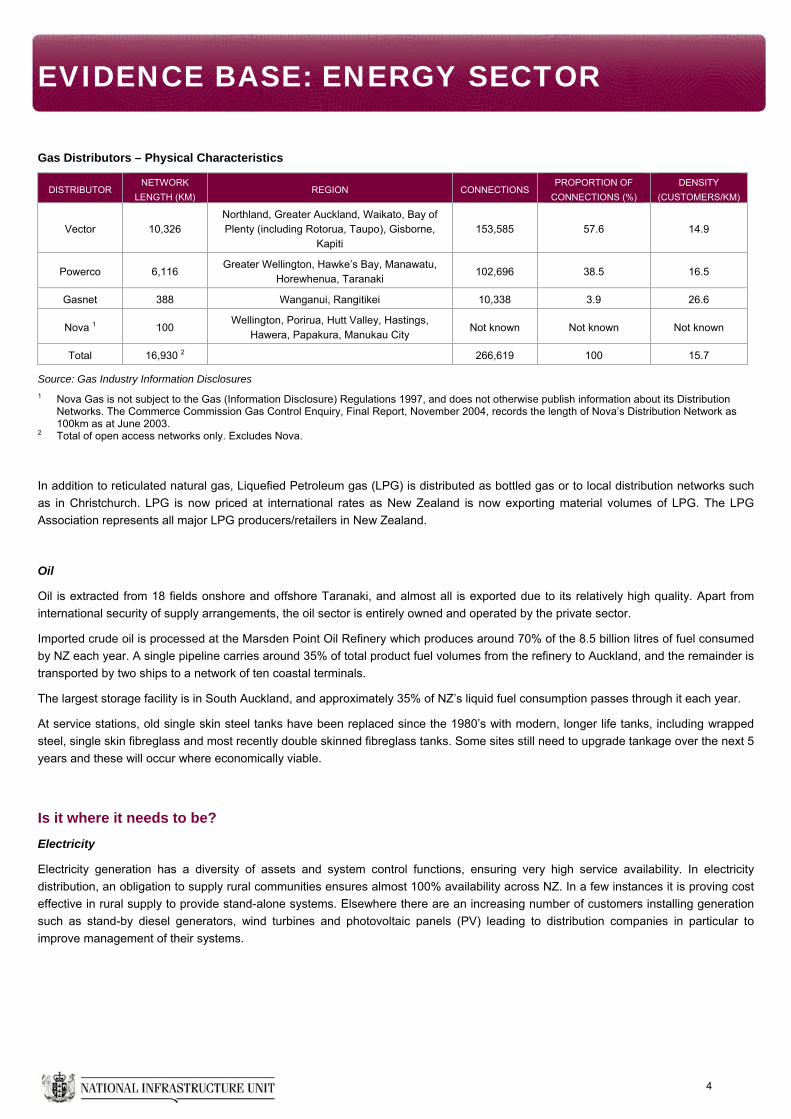
Gas Distributors – Physical Characteristics
DISTRIBUTOR NETWORK
LENGTH (KM) REGION CONNECTIONS
PROPORTION OF
CONNECTIONS (%)
DENSITY
(CUSTOMERS/KM)
Vector 10,326 Northland, Greater Auckland, Waikato, Bay of Plenty (including Rotorua, Taupo), Gisborne,
Kapiti 153,585 57.6 14.9
Powerco 6,116 Greater Wellington, Hawke’s Bay, Manawatu,
Horewhenua, Taranaki 102,696 38.5 16.5
Gasnet 388 Wanganui, Rangitikei 10,338 3.9 26.6
Nova 1 100 Wellington, Porirua, Hutt Valley, Hastings,
Hawera, Papakura, Manukau City Not known Not known Not known
Total 16,930 2 266,619 100 15.7
Source: Gas Industry Information Disclosures
1 Nova Gas is not subject to the Gas (Information Disclosure) Regulations 1997, and does not otherwise publish information about its Distribution Networks. The Commerce Commission Gas Control Enquiry, Final Report, November 2004, records the length of Nova’s Distribution Network as 100km as at June 2003.
2 Total of open access networks only. Excludes Nova.
In addition to reticulated natural gas, Liquefied Petroleum gas (LPG) is distributed as bottled gas or to local distribution networks such
as in Christchurch. LPG is now priced at international rates as New Zealand is now exporting material volumes of LPG. The LPG
Association represents all major LPG producers/retailers in New Zealand.
Oil
Oil is extracted from 18 fields onshore and offshore Taranaki, and almost all is exported due to its relatively high quality. Apart from
international security of supply arrangements, the oil sector is entirely owned and operated by the private sector.
Imported crude oil is processed at the Marsden Point Oil Refinery which produces around 70% of the 8.5 billion litres of fuel consumed
by NZ each year. A single pipeline carries around 35% of total product fuel volumes from the refinery to Auckland, and the remainder is
transported by two ships to a network of ten coastal terminals.
The largest storage facility is in South Auckland, and approximately 35% of NZ’s liquid fuel consumption passes through it each year.
At service stations, old single skin steel tanks have been replaced since the 1980’s with modern, longer life tanks, including wrapped
steel, single skin fibreglass and most recently double skinned fibreglass tanks. Some sites still need to upgrade tankage over the next 5
years and these will occur where economically viable.
Is it where it needs to be?
Electricity
Electricity generation has a diversity of assets and system control functions, ensuring very high service availability. In electricity
distribution, an obligation to supply rural communities ensures almost 100% availability across NZ. In a few instances it is proving cost
effective in rural supply to provide stand-alone systems. Elsewhere there are an increasing number of customers installing generation
such as stand-by diesel generators, wind turbines and photovoltaic panels (PV) leading to distribution companies in particular to
improve management of their systems.
EVIDENCE BASE: ENERGY SECTOR
5
Gas
There is good coverage of the North Island for gas distribution. In the
South Island there are a number of discrete LPG networks and otherwise
bottled gas is available throughout the country. Major industrial
consumers such as Fonterra and New Zealand Steel are generally well
served, providing a baseload of demand. Storage capacity within the
pipelines (“line pack”) meets intra-day fluctuations in demand. The GIC is
actively working through concerns with gas pipeline capacity, particularly
north of Huntly into the Waikato, Auckland and Northland area.
Oil
There are currently no known issues with oil availability, although there
are some concerns with storage capacity at certain regional locations and
reduction of service in remote areas and on tourist routes.
What quality is it?
The overall quality and service availability appear good in this sector.
Electricity
In electricity, forced outages for the generation, transmission and distribution are mostly below target maximums and availability is
above targets; however, there are known vulnerabilities to hazards, such as wind and storm events as well as earthquakes. In
generation, some assets are over 100 years old, and there is an on-going need to upgrade components to meet international standards
and ensure operational capability. However, overall asset condition is assessed as good.
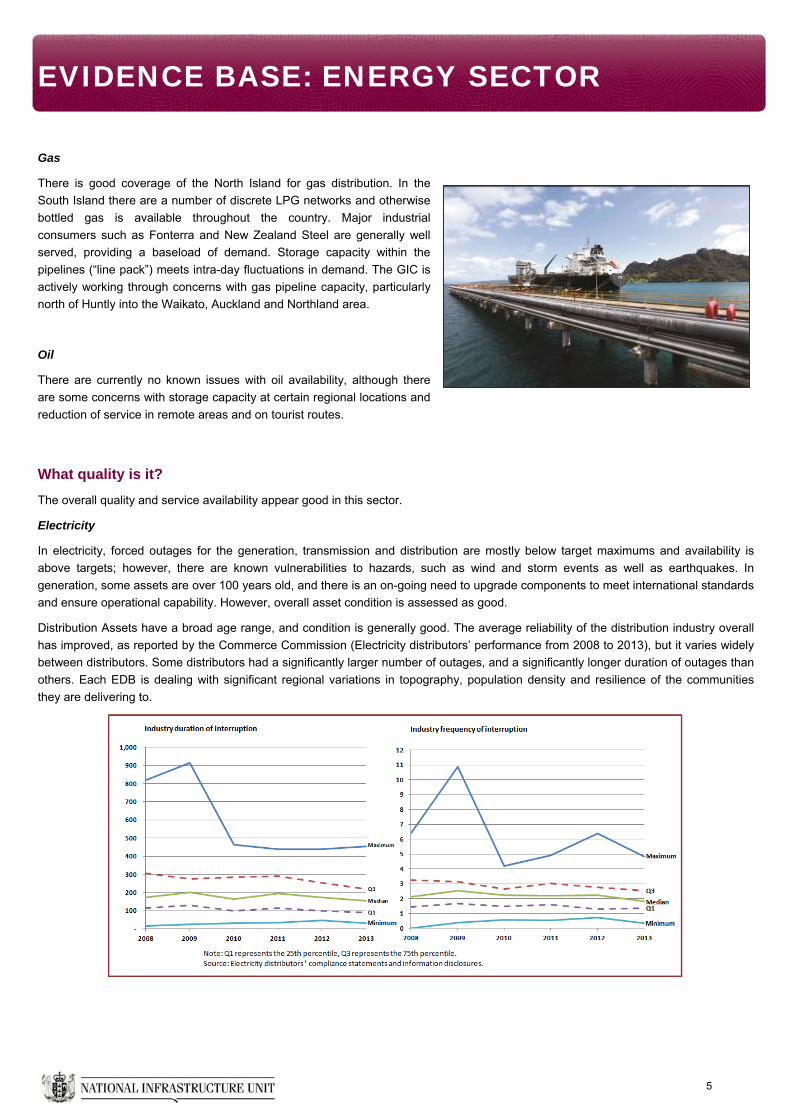
Distribution Assets have a broad age range, and condition is generally good. The average reliability of the distribution industry overall
has improved, as reported by the Commerce Commission (Electricity distributors’ performance from 2008 to 2013), but it varies widely
between distributors. Some distributors had a significantly larger number of outages, and a significantly longer duration of outages than
others. Each EDB is dealing with significant regional variations in topography, population density and resilience of the communities
they are delivering to.
EVIDENCE BASE: ENERGY SECTOR
6
Delivered power quality is becoming an increasing issue with reducing tolerance of appliances and customers able to monitor power
quality. Generally, distribution networks rely on 1970/80’s technology, which will struggle to transition to much more active networks
with distributed generation, smart meters, electric vehicles and other changes. Generally voltage is the issue rather than frequency.
In transmission, Transpower’s Asset Management Plans and Strategies were the subject of independent review in 2010 resulting in a
range of recommendations, primarily related to achieving compliance with PAS55 standards. Transpower is in the process of
addressing these.
Under Part 4 of the Commerce Act 1986, the Commerce Commission sets information disclosure requirements for the 29 electricity
distribution businesses (EDB’s) and Transpower, as well as price-quality paths for 17 of the EDB’s and Transpower. Disclosures
include condition, quality, capacity and asset management plan information, and can be found on the Commerce Commissions
website.
Gas
The “New Zealand Gas Story” issued by the GIC in February 2013 (available on their website) notes: “overall processing facilities’
operational reliability record is strong”.
In gas transmission, assets are generally well maintained, reaching international standards under health and safety regulations. These
regulations include requirements for management plans to address pipeline risks, including those created by challenging geologies
along North Island transmission routes. Transmission from Taranaki is dominantly via the Maui pipeline and otherwise via Vector’s
pipeline network. The Maui Gas Outage of 2011 has highlighted vulnerabilities for a pipeline that has had high levels of reliability for
over 30 years.
Applying to the total gas sector there are a large number of acts, regulations, standards, codes of practice and guidelines governing the
quality of gas sector installations as well as the quality of the natural gas being distributed and used. Health and safety is an important
element of these. Foremost among these is the Gas Act 1992 and the amendments of 2004 together with the Gas Regulations 1993.
The sector therefore meets relatively stringent delivered gas quality requirements and networks are designed and operated to high
standards.
Commerce Commission information disclosure requirements, which are similar to those for EDB’s, provide information on gas pipeline
reliability.
Oil
The oil sector must meet stringent and comprehensive fuel quality standards in particular to meet international standards as required
by vehicle and aircraft manufacturers. In order to achieve this, the sector has a range of operational, monitoring, testing and reporting
procedures in place. Under the Consumer Guarantees Act, goods that are normally bought for personal use must be of an acceptable
quality, "fit for purpose", free of minor defects and safe. These guarantees apply to fuel. Under the Fair Trading Act, companies can't
misrepresent the qualities of a product they sell, so all fuel must be correctly labelled such as “Unleaded 91”.
Regulations governing important properties of petrol and diesel, for protecting consumers and the environment, are the Engine Fuel
Specifications Regulations 2008 (Regulations). These regulations describe the most important performance properties of fuel, such as
the octane number, and they specify limits for components that could harm you, your vehicle or the environment. These components
include aromatics, lead and sulphur.
Under the national fuel quality monitoring scheme, Trading Standards (part of the Ministry of Business, Innovation and Employment),
organises testing of petrol and diesel samples to ensure oil companies are complying with the regulations. Testing under the scheme
concentrates on the fuel’s most critical properties, such as octane number, benzene level, contaminants, aromatics, water in diesel,
and sulphur content. Motorists fund the fuel quality monitoring scheme through the petroleum fuels monitoring levy (PFML).
The delivered quality of oil is therefore very high and the oil delivery system including operation and maintenance must be to high
standards particularly for health and safety reasons.
EVIDENCE BASE: ENERGY SECTOR
7
What Capacity is it at?
Considering energy in general, the small size of the New Zealand market leads to relatively dynamic supply and demand balances with
susceptibility to step-changes in demand. The contribution one company can make is material. As the service sector contribution to
GDP increases, the correlation of energy demand growth to GDP growth appears to be declining.
Electricity
A significant portion of NZ’s thermal electricity generation fleet currently only has committed fuel supply to the end of 2014. Assuming
extended thermal fuel supply contracts are secured, electricity generation appears to have appropriate headroom capacity available,
with a range of options to meet changing demand over time and “N-1 contingency” to accommodate short term unplanned plant
outages (N-1 refers to the system at all times being able to manage should the biggest single risk occur).
However, the generation mix may not be appropriate in the future, particularly with large thermal generation units needing long start up
times and increasingly being called upon for ramp up, ramp down operation with deleterious effects on asset lifetimes. Thermal
generation plays a key role by providing support at times of low hydro inflows, low wind generation and supporting seasonal demand
profiles (e.g. high demand in the winter when hydro inflows are low). This role is also contingent on securing flexibility in gas supply
contracts to accommodate such variations in demand, an issue which is partially addressed by the Ahuroa gas storage facility, but is
implicitly at odds with gas producers’ desires for constant production.
Electricity transmission and distribution capacity is under active management, with a need to be prepared for additions to urban areas,
either due to densification or urban spread. In addition to Commerce Commission requirements on EDB’s, the Electricity Authority is an
independent Crown entity responsible for the efficient operation of the electricity market with oversight of the system from generation
through to customer service. Transpower publishes an Annual Planning Report which details the status of all projects that Transpower
considers possible over the next 15 years. The latest is 2013, and the report ensures a transparent and comprehensive understanding
including generation assumptions and distribution network assumptions, and more particularly provides assurance at a national and
regional level of sufficient capacity.
An issue that needs to be considered is the gap between peak and trough demand. An increasing gap may lead to increasing price
differentials on a daily basis, and the sector will need to consider opportunities to better manage peaks in order to delay capacity
investment and gain better use of existing assets. The recent upgrade of the High Voltage Direct Current transmission line from
Benmore in the South Island to Haywards in the North Island has acted to mitigate this effect, with improved ability to manage daily
demand movements.
Capacity can in part be addressed by demand-side management. Transpower is currently assuming this role by default at the national
level and various EDB and others initiatives are contributing at the regional and local level. A demand-side market is emerging but a
number of technical, market and contractual barriers exist.
Gas
There is some confidence in on-going gas supply, with the presence of Methanex in the market being a good indicator of the overall
situation (currently operating its three production trains). The number of gas fields operating means gas supply capacity is now more
certain than it was 10 years ago, but the nature of the market means escalating levels of uncertainty beyond the next three to five year
window.
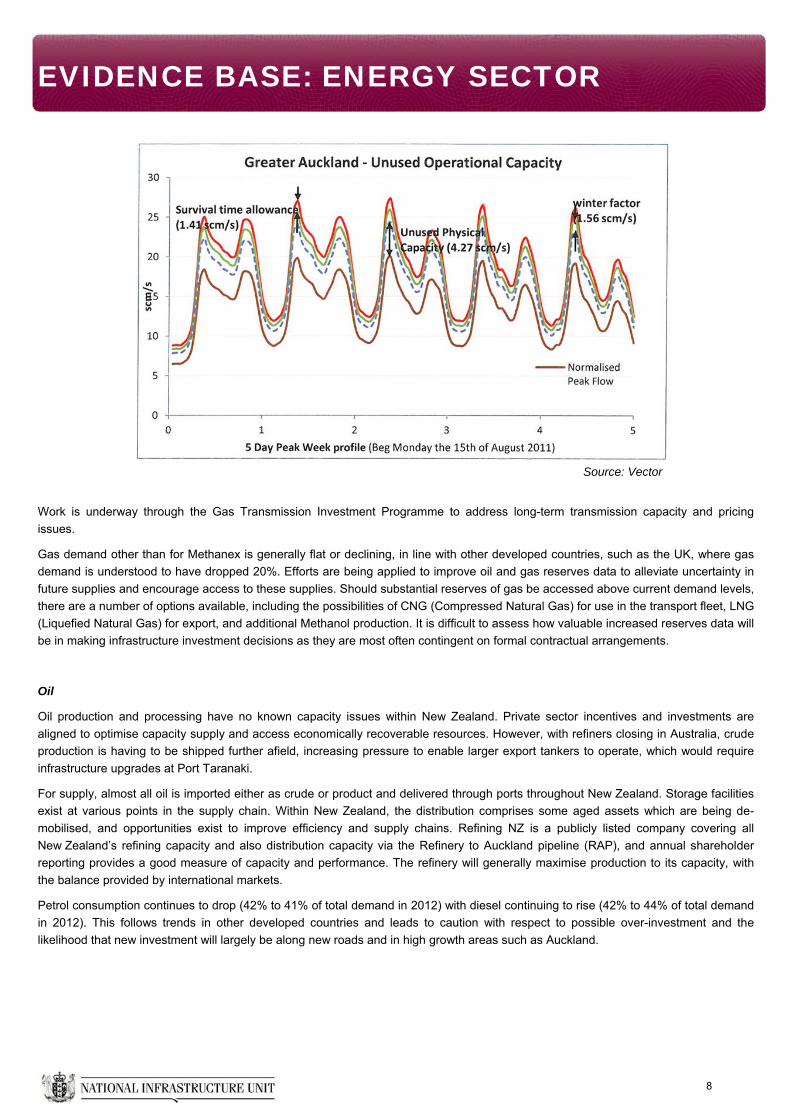
Gas transmission pipelines have confirmed capacity to handle peak demand for at least another year, the primary pressure point being
the Vector pipeline to Auckland. The Gas Industry Company (GIC) is active in advancing this matter. Vector have published a revised
methodology for determining the capacity available for reservation (commercially available firm capacity) and, with changing demand, a
significant amount of capacity has been freed up. The graph below is on Vector’s website and shows the unused “operational” capacity
(i.e. that which could be contracted on a firm basis).
EVIDENCE BASE: ENERGY SECTOR
8
Work is underway through the Gas Transmission Investment Programme to address long-term transmission capacity and pricing
issues.
Gas demand other than for Methanex is generally flat or declining, in line with other developed countries, such as the UK, where gas
demand is understood to have dropped 20%. Efforts are being applied to improve oil and gas reserves data to alleviate uncertainty in
future supplies and encourage access to these supplies. Should substantial reserves of gas be accessed above current demand levels,
there are a number of options available, including the possibilities of CNG (Compressed Natural Gas) for use in the transport fleet, LNG
(Liquefied Natural Gas) for export, and additional Methanol production. It is difficult to assess how valuable increased reserves data will
be in making infrastructure investment decisions as they are most often contingent on formal contractual arrangements.
Oil
Oil production and processing have no known capacity issues within New Zealand. Private sector incentives and investments are
aligned to optimise capacity supply and access economically recoverable resources. However, with refiners closing in Australia, crude
production is having to be shipped further afield, increasing pressure to enable larger export tankers to operate, which would require
infrastructure upgrades at Port Taranaki.
For supply, almost all oil is imported either as crude or product and delivered through ports throughout New Zealand. Storage facilities
exist at various points in the supply chain. Within New Zealand, the distribution comprises some aged assets which are being de-
mobilised, and opportunities exist to improve efficiency and supply chains. Refining NZ is a publicly listed company covering all
New Zealand’s refining capacity and also distribution capacity via the Refinery to Auckland pipeline (RAP), and annual shareholder
reporting provides a good measure of capacity and performance. The refinery will generally maximise production to its capacity, with
the balance provided by international markets.
Petrol consumption continues to drop (42% to 41% of total demand in 2012) with diesel continuing to rise (42% to 44% of total demand
in 2012). This follows trends in other developed countries and leads to caution with respect to possible over-investment and the
likelihood that new investment will largely be along new roads and in high growth areas such as Auckland.
Source: Vector
EVIDENCE BASE: ENERGY SECTOR
9
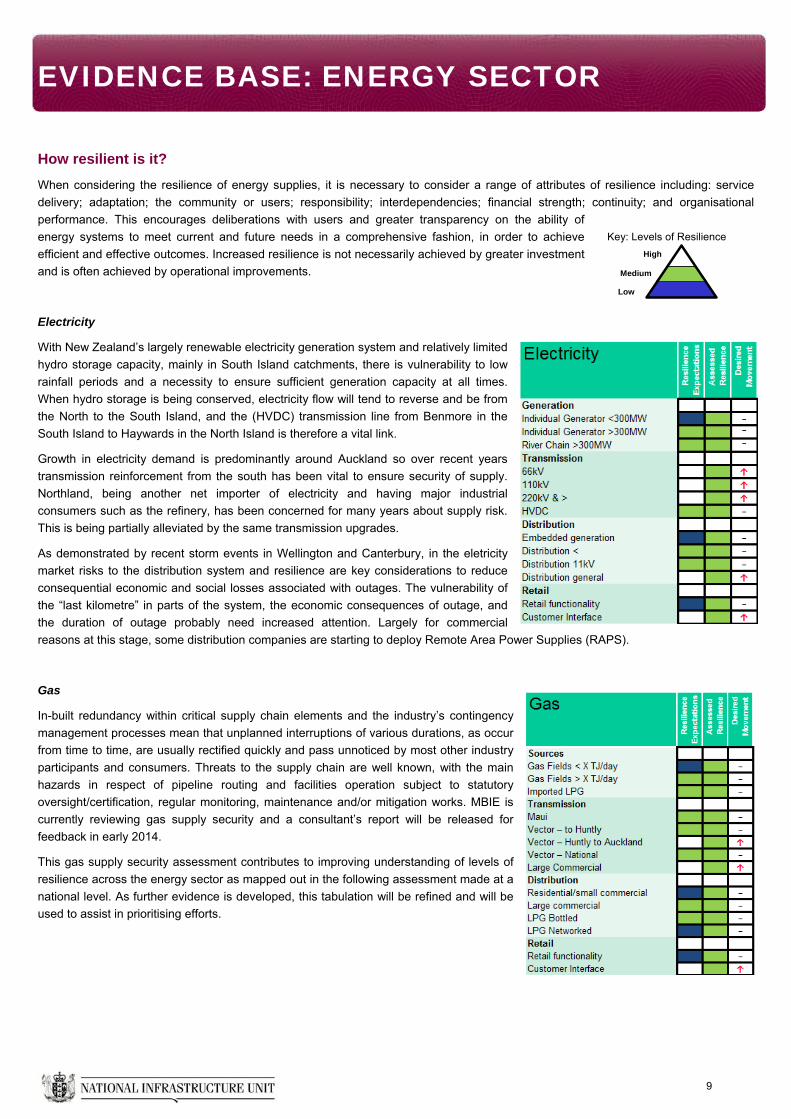
How resilient is it?
When considering the resilience of energy supplies, it is necessary to consider a range of attributes of resilience including: service
delivery; adaptation; the community or users; responsibility; interdependencies; financial strength; continuity; and organisational
performance. This encourages deliberations with users and greater transparency on the ability of
energy systems to meet current and future needs in a comprehensive fashion, in order to achieve
efficient and effective outcomes. Increased resilience is not necessarily achieved by greater investment
and is often achieved by operational improvements.
Electricity
With New Zealand’s largely renewable electricity generation system and relatively limited
hydro storage capacity, mainly in South Island catchments, there is vulnerability to low
rainfall periods and a necessity to ensure sufficient generation capacity at all times.
When hydro storage is being conserved, electricity flow will tend to reverse and be from
the North to the South Island, and the (HVDC) transmission line from Benmore in the
South Island to Haywards in the North Island is therefore a vital link.
Growth in electricity demand is predominantly around Auckland so over recent years
transmission reinforcement from the south has been vital to ensure security of supply.
Northland, being another net importer of electricity and having major industrial
consumers such as the refinery, has been concerned for many years about supply risk.
This is being partially alleviated by the same transmission upgrades.
As demonstrated by recent storm events in Wellington and Canterbury, in the eletricity
market risks to the distribution system and resilience are key considerations to reduce
consequential economic and social losses associated with outages. The vulnerability of
the “last kilometre” in parts of the system, the economic consequences of outage, and
the duration of outage probably need increased attention. Largely for commercial
reasons at this stage, some distribution companies are starting to deploy Remote Area Power Supplies (RAPS).
Gas
In-built redundancy within critical supply chain elements and the industry’s contingency
management processes mean that unplanned interruptions of various durations, as occur
from time to time, are usually rectified quickly and pass unnoticed by most other industry
participants and consumers. Threats to the supply chain are well known, with the main
hazards in respect of pipeline routing and facilities operation subject to statutory
oversight/certification, regular monitoring, maintenance and/or mitigation works. MBIE is
currently reviewing gas supply security and a consultant’s report will be released for
feedback in early 2014.
This gas supply security assessment contributes to improving understanding of levels of
resilience across the energy sector as mapped out in the following assessment made at a
national level. As further evidence is developed, this tabulation will be refined and will be
used to assist in prioritising efforts.
High
Medium
Low
Key: Levels of Resilience
EVIDENCE BASE: ENERGY SECTOR
10
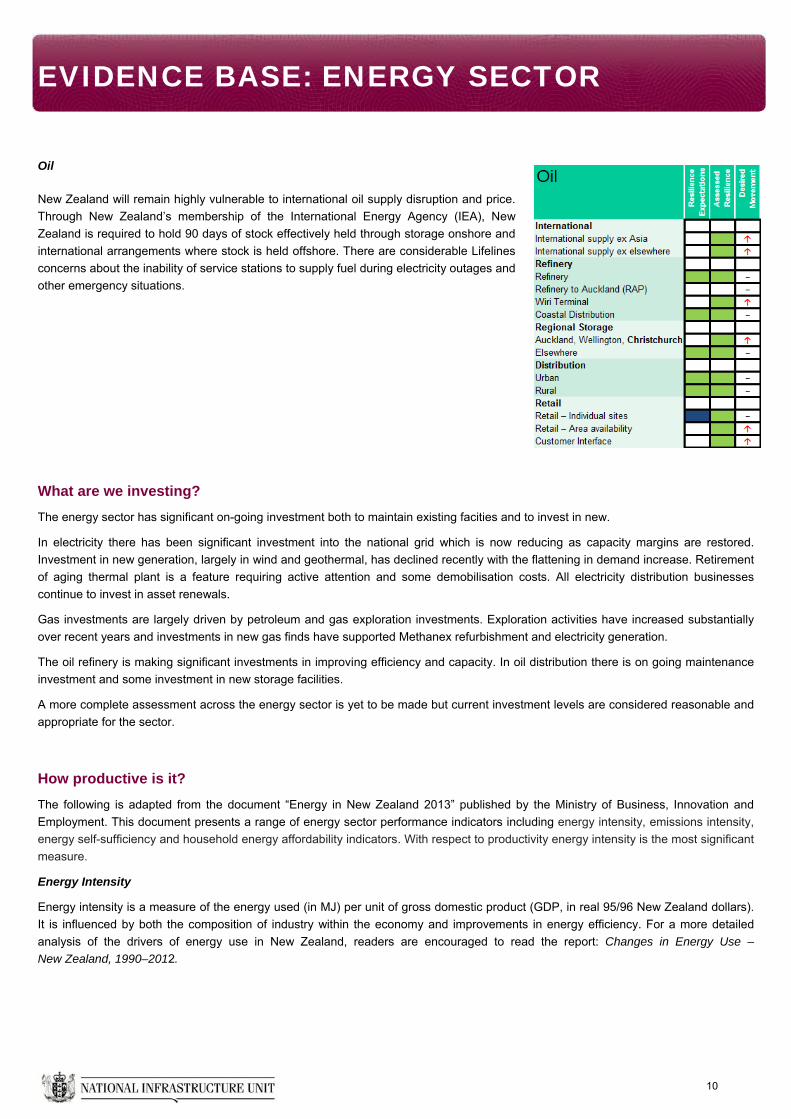
Oil
New Zealand will remain highly vulnerable to international oil supply disruption and price.
Through New Zealand’s membership of the International Energy Agency (IEA), New
Zealand is required to hold 90 days of stock effectively held through storage onshore and
international arrangements where stock is held offshore. There are considerable Lifelines
concerns about the inability of service stations to supply fuel during electricity outages and
other emergency situations.
What are we investing?
The energy sector has significant on-going investment both to maintain existing facities and to invest in new.
In electricity there has been significant investment into the national grid which is now reducing as capacity margins are restored.
Investment in new generation, largely in wind and geothermal, has declined recently with the flattening in demand increase. Retirement
of aging thermal plant is a feature requiring active attention and some demobilisation costs. All electricity distribution businesses
continue to invest in asset renewals.
Gas investments are largely driven by petroleum and gas exploration investments. Exploration activities have increased substantially
over recent years and investments in new gas finds have supported Methanex refurbishment and electricity generation.
The oil refinery is making significant investments in improving efficiency and capacity. In oil distribution there is on going maintenance
investment and some investment in new storage facilities.
A more complete assessment across the energy sector is yet to be made but current investment levels are considered reasonable and
appropriate for the sector.
How productive is it?
The following is adapted from the document “Energy in New Zealand 2013” published by the Ministry of Business, Innovation and
Employment. This document presents a range of energy sector performance indicators including energy intensity, emissions intensity,
energy self-sufficiency and household energy affordability indicators. With respect to productivity energy intensity is the most significant
measure.
Energy Intensity
Energy intensity is a measure of the energy used (in MJ) per unit of gross domestic product (GDP, in real 95/96 New Zealand dollars).
It is influenced by both the composition of industry within the economy and improvements in energy efficiency. For a more detailed
analysis of the drivers of energy use in New Zealand, readers are encouraged to read the report: Changes in Energy Use –
New Zealand, 1990–2012.
EVIDENCE BASE: ENERGY SECTOR
11
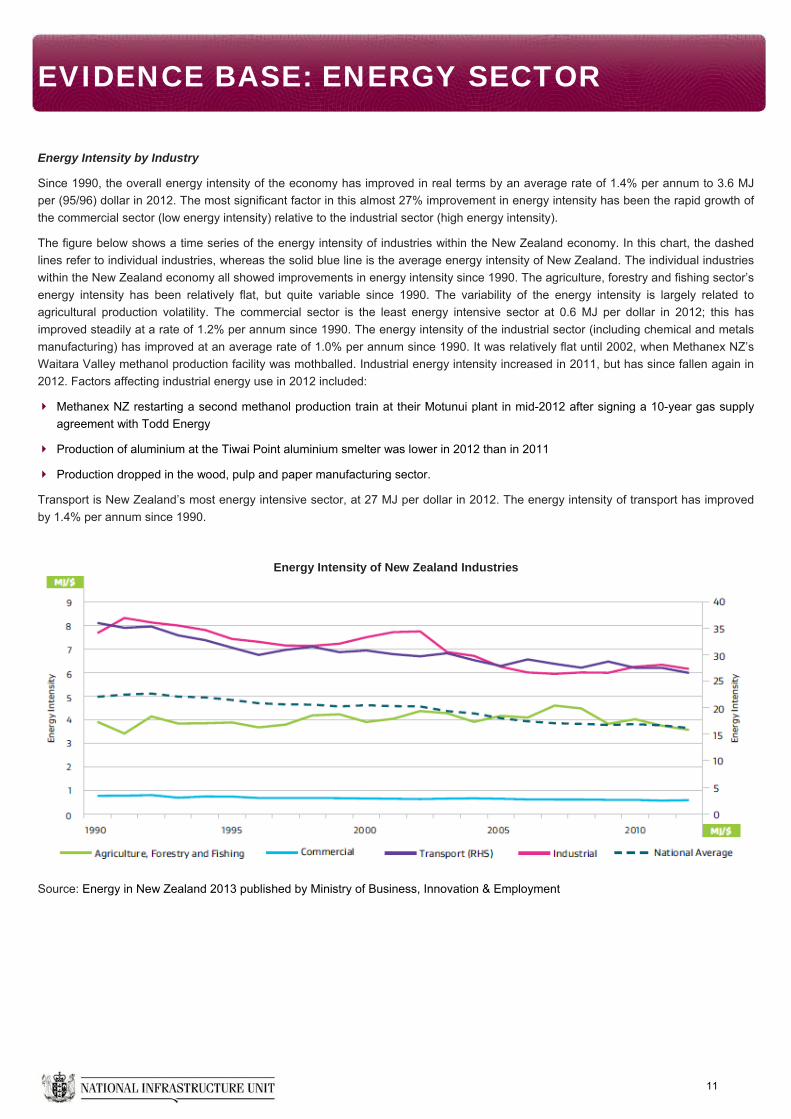
Energy Intensity by Industry
Since 1990, the overall energy intensity of the economy has improved in real terms by an average rate of 1.4% per annum to 3.6 MJ
per (95/96) dollar in 2012. The most significant factor in this almost 27% improvement in energy intensity has been the rapid growth of
the commercial sector (low energy intensity) relative to the industrial sector (high energy intensity).
The figure below shows a time series of the energy intensity of industries within the New Zealand economy. In this chart, the dashed
lines refer to individual industries, whereas the solid blue line is the average energy intensity of New Zealand. The individual industries
within the New Zealand economy all showed improvements in energy intensity since 1990. The agriculture, forestry and fishing sector’s
energy intensity has been relatively flat, but quite variable since 1990. The variability of the energy intensity is largely related to
agricultural production volatility. The commercial sector is the least energy intensive sector at 0.6 MJ per dollar in 2012; this has
improved steadily at a rate of 1.2% per annum since 1990. The energy intensity of the industrial sector (including chemical and metals
manufacturing) has improved at an average rate of 1.0% per annum since 1990. It was relatively flat until 2002, when Methanex NZ’s
Waitara Valley methanol production facility was mothballed. Industrial energy intensity increased in 2011, but has since fallen again in
2012. Factors affecting industrial energy use in 2012 included:
Methanex NZ restarting a second methanol production train at their Motunui plant in mid-2012 after signing a 10-year gas supply
agreement with Todd Energy
Production of aluminium at the Tiwai Point aluminium smelter was lower in 2012 than in 2011
Production dropped in the wood, pulp and paper manufacturing sector.
Transport is New Zealand’s most energy intensive sector, at 27 MJ per dollar in 2012. The energy intensity of transport has improved
by 1.4% per annum since 1990.
Energy Intensity of New Zealand Industries
Source: Energy in New Zealand 2013 published by Ministry of Business, Innovation & Employment
EVIDENCE BASE: ENERGY SECTOR
12
How well are we managing it?
In general, there is a high level of information disclosure and oversight from MBIE, the Energy Efficiency and Conservation Authority
(EECA), and Statistics New Zealand. Reporting obligations on many sector participants also contribute to high levels of transparency.
MBIE has live energy information available on its website and regularly publishes the Energy in New Zealand (previously Energy Data
File) and Energy Outlook: http://www.med.govt.nz/sectors-industries/energy/energy-modelling/publications/energy-in-new-zealand-
2013
Electricity
Effective sector management is in place, but it is recognised that on-going monitoring of arrangements is necessary to ensure that it is
relevant and appropriate. Competition appears healthy in both the generation and retail markets. Electricity transmission and
distribution is a monopoly market.
Dominant in sector oversight are the Ministry of Business Innovation and Employment (MBIE) Infrastructure & Resource Markets; the
Electricity Authority; the Commerce Commission for information disclosure and price-quality paths; and Transpower as system
operator.
The Electricity Authority (Authority) is an independent Crown entity responsible for the efficient operation of the New Zealand electricity
market. Although independent, the Authority is required to have regard to Government Policy Statements and must pursue the
statutory objective set for it in the Electricity Industry Act 2010 (Act) to promote competition in, reliable supply by, and the efficient
operation of, the electricity industry for the long-term benefit of consumers.
Gas
Again, competition appears relatively healthy in this market and governance arrangements with a co-regulatory body are proving
effective. There will always be tensions in gas supply due to the discrete nature of gas fields, their varying characteristics, the relatively
small New Zealand demand and the lumpy investment decisions on both the demand and supply side.
The Gas Industry Company (GIC) is the gas industry body, responsible for developing downstream industry governance arrangements
that ensure gas (including natural gas and LPG) is delivered safely, efficiently and reliably to new and existing customers. The GIC is a
special-purpose industry-owned company and co-regulator. It works closely with other regulatory bodies whose responsibilities also
include the gas industry: Worksafe NZ for energy safety; MBIE for oversight of the co-regulatory model and consumer protection; and
the Commerce Commission for information disclosure and price-quality paths. It is required to meet objectives in Part 4A of the Gas Act
1992 and Government Policy Statements. Its strategy is to optimise gas’s contribution to New Zealand.
For gas, as for electricity, technical, health and safety regulations are the responsibility of MBIE. MBIE is currently undertaking a review
of gas sector supply risks.
The Gas Association (GANZ) represents companies and organisations in the gas sector involved in the transportation and trading of
gas. GANZ represents interests across the major pipelines, networks, GMS, and below the meter to equipment suppliers and
installation. GANZ’s prime focus is on the safety and technical aspects of the natural gas industry.
Oil
Appropriate sector management is in place but it is recognised that on-going monitoring of arrangements is necessary. MBIE has
primary sector oversight at the government policy level and has recently led work on assessing oil security. This has resulted in
Cabinet decisions on Measures to Improve Domestic Oil Security and also confirmation of International Energy Agency (IEA)
obligations for international security purposes. MCDEM oversees communication and coordination arrangements and readiness
activities for oil supply during civil emergencies. International standard health, safety and environmental obligations lead to high quality
operations and management. Liquid fuel prices are substantially determined by international pricing and increasing price volatility is
expected.
EVIDENCE BASE: ENERGY SECTOR
13
The oil refinery is a tolling facility with users able to direct source product from offshore markets or process crude through the refinery.
It must therefore be price competitive. There is active competition in oil distribution and retailing with indications of rising distribution
and retail margins. The total delivered price of liquid fuels is dominated by the international oil price component.
There are four major oil companies operating in the NZ market with healthy competition evident in the retail market, for example the
availability of discounting through associations with supermarket chains and other loyalty programs. There are continuing concerns
around the reduction in the numbers of service stations.
What future trends and scenarios may impact energy infrastructure?
As part of the development of the Evidence Base for New Zealand’s infrastructure, the NIU has undertaken an investigation into future
pressures placing demand on our infrastructure for a range of plausible scenarios: a central scenario (best estimate of future
infrastructure demand), an upside scenario (high infrastructure demand) and a downside scenario (low infrastructure demand).
Each scenario has an associated set of projections of future infrastructure demand. The NIU has not produced any new models or
forecasts in this regard. Rather, we rely upon existing sector forecasts where applicable and relevant. In the energy sector, our analysis
primarily relies upon extensive modelling and forecasting completed by MBIE and Transpower.
The full results of our scenario modelling investigation have been published in a separate document available on the NIU website, but
relevant extracts for the Energy sector are reproduced below.
Implications for energy infrastructure in the central scenario
The implications for our energy infrastructure in the central scenario are drawn primarily from modelling completed by MBIE (Energy
Outlook: Reference Scenarios 2011, Energy Outlook: Insights 2013) and by Transpower (Transmission Tomorrow and Transmission
Tomorrow: Enduring Grid).
The key pressures in the central scenario are related to trends in peak load and base load (and the ratio between the two), spatial
distribution of future demand and the mix of installed generation types.
Based on the assumptions for the central scenario, the modelling completed by MBIE and Transpower suggests the following
implications for our energy infrastructure:
Electricity demand will grow on average by 1.1% per annum through 2040
Increased irrigation and the use of heat pumps will continue to boost summer energy demand. Irrigation, in particular, will increase
the utilisation of the grid on the east coast of the South Island
There is an ongoing need for the backbone grid from Roxburgh to Otahuhu and its capacity will need to increase over time
Additional capacity for the regional connections to the backbone grid is less certain with more variation between scenarios. For the
regional connections, newer technology options for better utilising the grid, such as extracting more capacity from the existing lines
or the use of demand-side management, have added value
There is likely to be significant investment required in geothermal plants (with their share of electricity generation projected to grow
from 14% in 2012 to between 21% and 29% in 2040)
Demand for wind power will increase modestly, although its relative cost in comparison to other electricity sources will continue to
constrain its growth
Geothermal and wind power can make only a minimal contribution to meeting peak demand. As such, future investment will be
necessary to establish flexible peaking capacity, demand management initiatives and/or energy storage options
Demand for gas is expected to remain relatively steady and will continue to come from price sensitive users such as petrochemical
manufacturing facilities and power generators, as well as from other industrial, commercial and residential users. A sufficient level
of exploration is expected to ensure supply is available to meet demand
EVIDENCE BASE: ENERGY SECTOR
14
Both the extraction and export of oil from Taranaki and the import of oil are expected to continue along current trends; and
The central scenario incorporates high uncertainty (and relatively low impacts) from new technologies such as electric vehicles and
household photovoltaic panels due to their cost differentials in comparison to other options
Further, Transpower’s analysis found that the type, location, size and timing of generation development are the greatest sources of
uncertainty. Generation development will occur in response to demand as well as the type of fuels that are available. With a substantial
amount of energy generation resources potentially available in New Zealand, it is difficult to predict where and when this development
might occur.
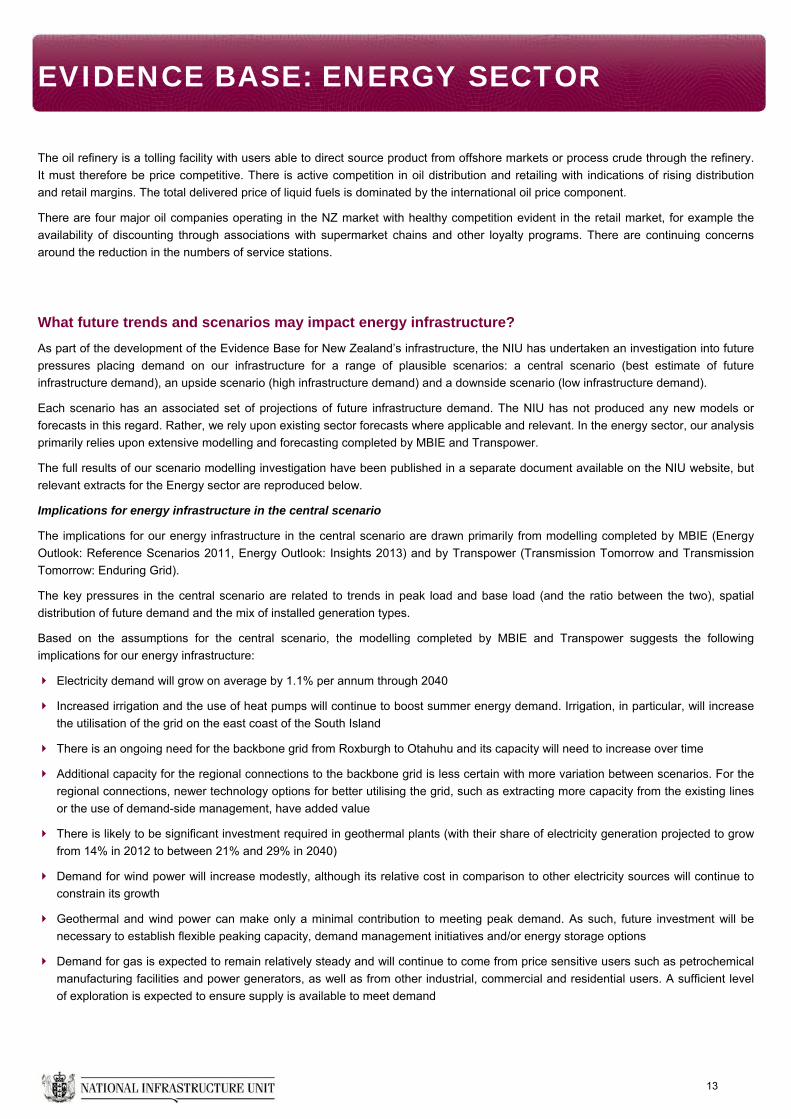
On balance, MBIE estimate that $14 billion in new generation investment will be needed by 2030. Estimates for electricity demand and
generation are reproduced below:
Grid level electricity demand by scenario Electricity generation by scenario
Source: Ministry of Business, Innovation & Employment (2013)
Heavy industry in New Zealand
With a relatively small population by global standards, demand on our infrastructure can be heavily influenced by industrial activities
such as forestry, and steel and aluminium processing. In New Zealand, these industries are concentrated in a small number of
locations and in a small number of firms that are exposed to global markets. Forestry is concentrated in the north of the North Island,
steel processing south-east of Auckland and aluminium processing in Southland. Accordingly, fluctuation in demand has the potential
to occur at point sources and in discontinuous steps rather than gradual trends.
For example, since 2004, the wood processing industry’s energy demand has declined rapidly by over 30% from its peak (MBIE, 2013).
More recently, the future of aluminium production in New Zealand has been called into question. With about 15% of the country’s
electricity supply used by the Tiwai Point aluminium smelter, the potential impact on infrastructure is considerable.
Overall, we assume a gradual decline of heavy industry in New Zealand in the central scenario. The upside scenario assumes a return
to peak demand, while the downside scenario assumes an accelerated decline of heavy industry. However, we do not speculate on the
future of specific heavy industries. Nonetheless, careful infrastructure planning is required to ensure we are prepared for step changes
in demand created by heavy industry – on the upside or the downside.
EVIDENCE BASE: ENERGY SECTOR
15
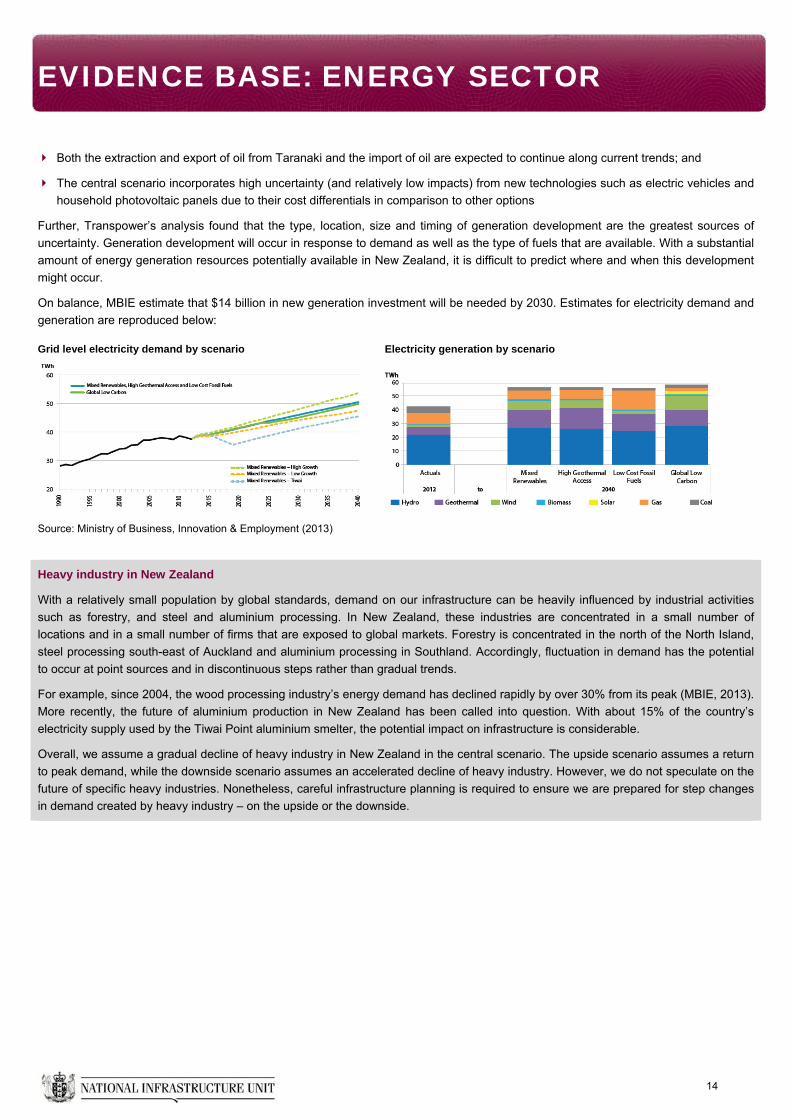
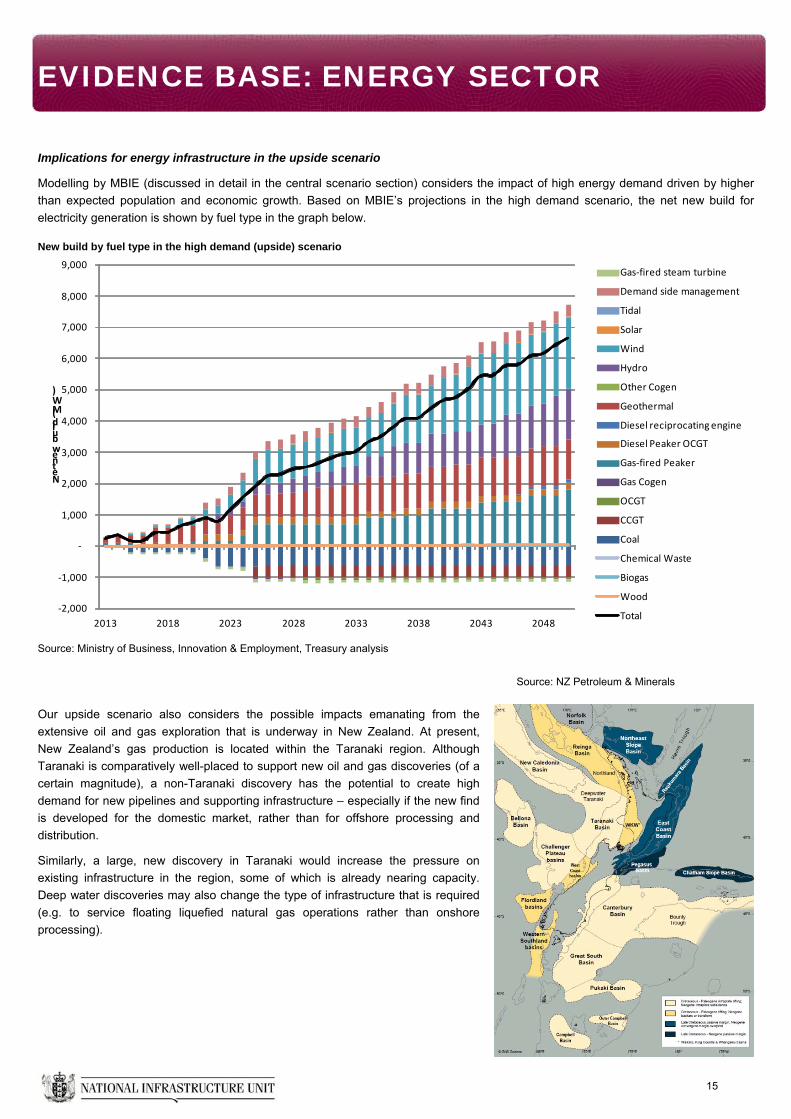
Implications for energy infrastructure in the upside scenario
Modelling by MBIE (discussed in detail in the central scenario section) considers the impact of high energy demand driven by higher
than expected population and economic growth. Based on MBIE’s projections in the high demand scenario, the net new build for
electricity generation is shown by fuel type in the graph below.
New build by fuel type in the high demand (upside) scenario
‐2,000
‐1,000
‐
1,000
2,000
3,000
4,000
5,000
6,000
7,000
8,000
9,000
2013 2018 2023 2028 2033 2038 2043 2048
Net new build (MW)
Gas‐fired steam turbine
Demand side management
Tidal
Solar
Wind
Hydro
Other Cogen
Geothermal
Diesel reciprocating engine
Diesel Peaker OCGT
Gas‐fired Peaker
Gas Cogen
OCGT
CCGT
Coal
Chemical Waste
Biogas
Wood
Total
Source: Ministry of Business, Innovation & Employment, Treasury analysis
Source: NZ Petroleum & Minerals
Our upside scenario also considers the possible impacts emanating from the
extensive oil and gas exploration that is underway in New Zealand. At present,
New Zealand’s gas production is located within the Taranaki region. Although
Taranaki is comparatively well-placed to support new oil and gas discoveries (of a
certain magnitude), a non-Taranaki discovery has the potential to create high
demand for new pipelines and supporting infrastructure – especially if the new find
is developed for the domestic market, rather than for offshore processing and
distribution.
Similarly, a large, new discovery in Taranaki would increase the pressure on
existing infrastructure in the region, some of which is already nearing capacity.
Deep water discoveries may also change the type of infrastructure that is required
(e.g. to service floating liquefied natural gas operations rather than onshore
processing).
EVIDENCE BASE: ENERGY SECTOR
16
It is difficult to predict the location, timing and likelihood of a significant discovery. However, given the extent of New Zealand’s
petroleum basins, the probably of such an event occurring cannot be entirely discounted – especially with the current upswing in
exploration activity.
Should a major oil or gas discovery occur, new or upgraded transport links, water infrastructure and social infrastructure will also be
required to support the development – a clear example that demonstrates the interdependence of our infrastructure networks.
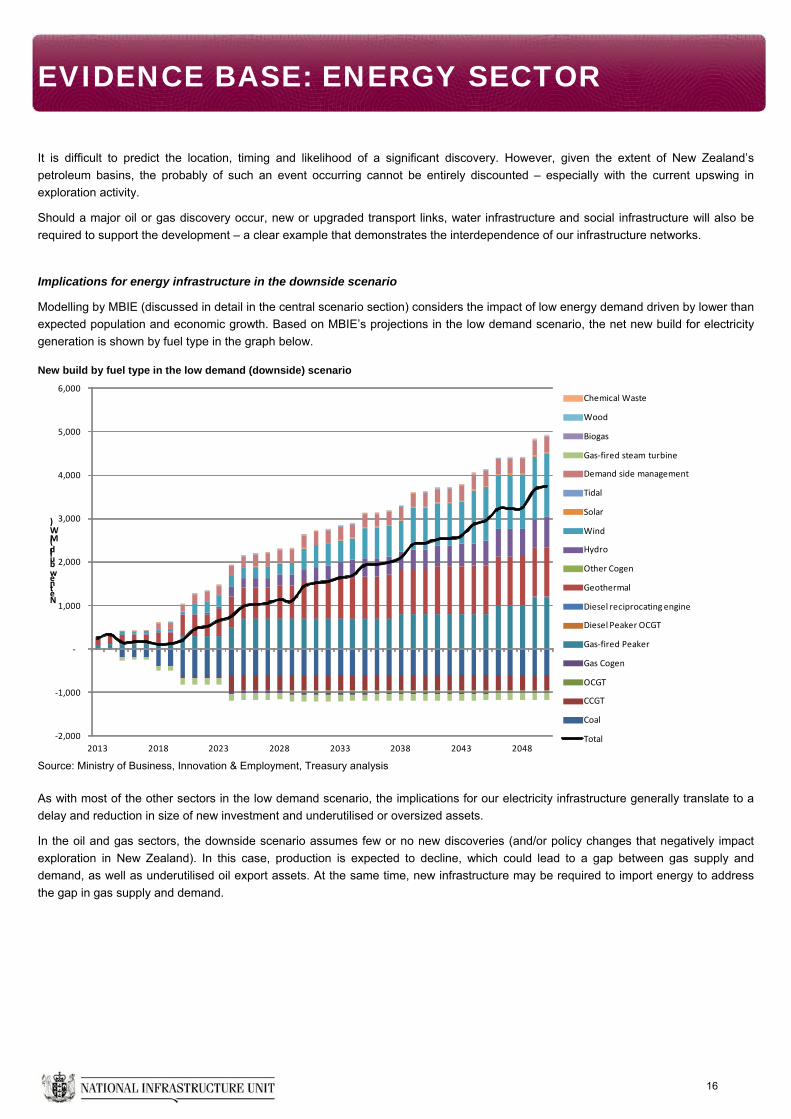
Implications for energy infrastructure in the downside scenario
Modelling by MBIE (discussed in detail in the central scenario section) considers the impact of low energy demand driven by lower than
expected population and economic growth. Based on MBIE’s projections in the low demand scenario, the net new build for electricity
generation is shown by fuel type in the graph below.
New build by fuel type in the low demand (downside) scenario
‐2,000
‐1,000
‐
1,000
2,000
3,000
4,000
5,000
6,000
2013 2018 2023 2028 2033 2038 2043 2048
Net new build (MW)
Chemical Waste
Wood
Biogas
Gas‐fired steam turbine
Demand side management
Tidal
Solar
Wind
Hydro
Other Cogen
Geothermal
Diesel reciprocating engine
Diesel Peaker OCGT
Gas‐fired Peaker
Gas Cogen
OCGT
CCGT
Coal
Total
Source: Ministry of Business, Innovation & Employment, Treasury analysis
As with most of the other sectors in the low demand scenario, the implications for our electricity infrastructure generally translate to a
delay and reduction in size of new investment and underutilised or oversized assets.
In the oil and gas sectors, the downside scenario assumes few or no new discoveries (and/or policy changes that negatively impact
exploration in New Zealand). In this case, production is expected to decline, which could lead to a gap between gas supply and
demand, as well as underutilised oil export assets. At the same time, new infrastructure may be required to import energy to address
the gap in gas supply and demand.
EVIDENCE BASE: ENERGY SECTOR
17
Sources
Gas Information Disclosures. The Commerce Commission has published information disclosure requirements for gas pipeline services
under Part 4 of the Commerce Act 1986. http://www.comcom.govt.nz/regulated-industries/gas-pipelines/
Electricity Information Disclosures. Suppliers of electricity lines services are subject to information disclosure regulations under Part 4
of the Commerce Act 1986. http://www.comcom.govt.nz/regulated-industries/electricity/
Vector Rotowaro-North Capacity Determination (2012) http://www.vector.co.nz/sites/vector.co.nz/files/Rotowaro-
North%20Capacity%20Determination%2028%20November_0.pdf
Ministry of Business, Innovation & Employment. (2011). Energy outlook: Reference scenarios and sensitivity analysis.
Ministry of Business, Innovation & Employment. (2013). Regional economic activity report.
Ministry of Business, Innovation & Employment. (2013). New Zealand's energy outlook: Electricity insight.
Ministry of Business, Innovation & Employment (2013). Energy in New Zealand 2013
Transpower. (2011). Transmission tomorrow.
Transpower. (2011). Transmission tomorrow: Enduring grid.