Embed Size (px)
Citation preview
Infrastructure Development in India
1
By
Dr.V.Deepa Nair
Deputy Director &
Associate Professor, CUDS,
DR MCRHRD IAP
Roads
• India has one of the largest road networks in the world,
aggregating to 3.34 million km.
• The country‟s road network consists of Expressways,
National Highways, State Highways, Major District Roads,
Other District Roads and Village Roads.
• The road network, as on December 2007, comprises
66,590 km of National Highways, 128,000 km of State
Highways, 470,000 km of Major District Roads and about
2.65 million km of other District and Rural Roads.
• National Highways comprise only about 2 percent of the
total length of roads and carry about 40 percent of the total
traffic across the length and breadth of the country.
2

• The National Highways Development Project
(NHDP), the largest highway project ever
undertaken by the country, is being implemented
by the National Highway Authority of India (NHAI).
• NHDP Phase I & II envisage 4/6 laning of about
14,279 km of National Highways, at a total
estimated cost of Rs.650 million (at 2004 prices).
• These two phases comprise of Golden
Quadrilateral (GQ), North-South and East-West
Corridors, Port Connectivity and other projects.
3
Ports
• India‟s coastline of 7,517 km. is added with 13 major ports
and 187 non-major ports.
• Of the non-major ports, around 60 are handling traffic.
• The total traffic carried by both the major and minor ports
during 2005-06 was estimated at around 570 million
tonnes.
• The 12 major ports carry about 3/4th of the total traffic,
• The annual aggregate cargo handling capacity of major
ports increased from 397.5 million tonnes per annum
(MTPA) in 2004-05 to 456.20 MTPA in 2005-06, with the
average turnaround time increasing marginally from 3.4
days to 3.5 days in 2005-06.
4

Airports
5
• 11 international airports 114 domestic airports
• 20%annual growth • Passenger traffic crossed 100 million
passengers p.a. • Cargo traffic to grow at over 20% p.a. over
the next five years - Inbound traffic also on rise due to trade and investment
• Maintenance, Repair and Overhaul (MRO) growing in a big way
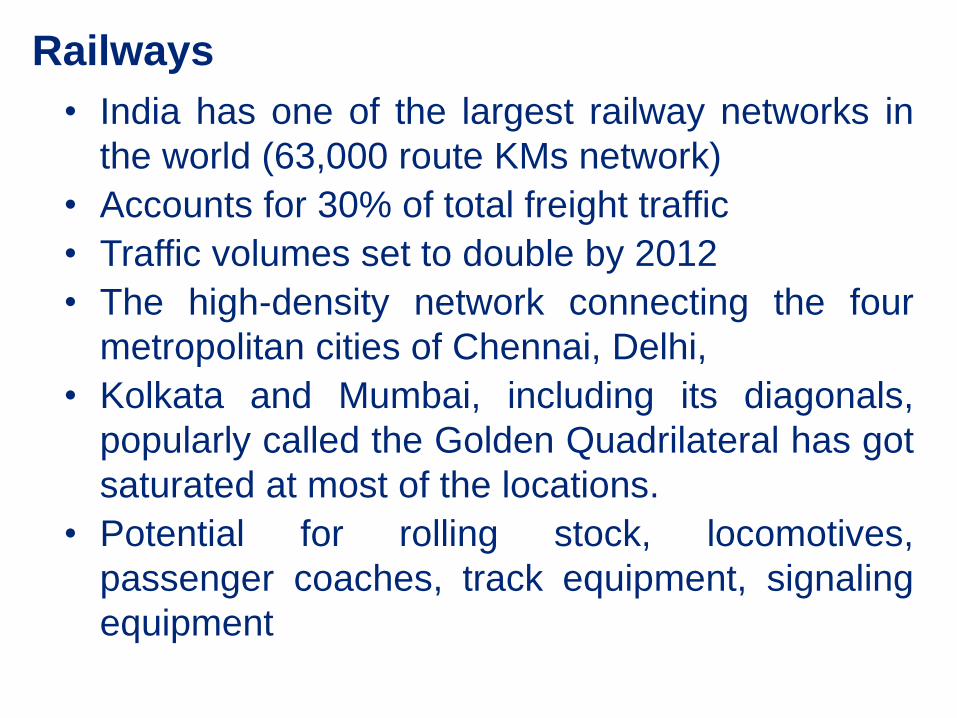
• India has one of the largest railway networks in
the world (63,000 route KMs network)
• Accounts for 30% of total freight traffic
• Traffic volumes set to double by 2012
• The high-density network connecting the four
metropolitan cities of Chennai, Delhi,
• Kolkata and Mumbai, including its diagonals,
popularly called the Golden Quadrilateral has got
saturated at most of the locations.
• Potential for rolling stock, locomotives,
passenger coaches, track equipment, signaling
equipment
Railways

Power
• Since independence, generating capacity has
increased from 1362 to over 100,000 MW
• However there are widespread shortages of power
in almost all parts of the country.
• Inadequate inter-regional transmission links;
• Inadequate and ageing sub-transmission &
distribution network leading to power cuts and local
failures/faults;
• Large scale theft and skewed tariff structure;
• Slow pace of rural electrification;
• Inefficient use of electricity by the end consumer.
7

Status of Urban Infrastructure
• The growth of population has put urban infrastructure and services under severe strain.
• Smaller cities have found it particularly difficult to cope with the increasing demands on services because of inadequate financial resources.
• Urban areas in India, present a grim picture with regard to availability of basic infrastructure.

India: Projected Urban Population
62.4 78.9 109159
217286
372
473
583
700
820
0
200
400
600
800
1000
1951 1961 1971 1981 1991 2001 2011 2021 2031 2041 2051
Po
pu
lati
on
(M
illi
on
s)
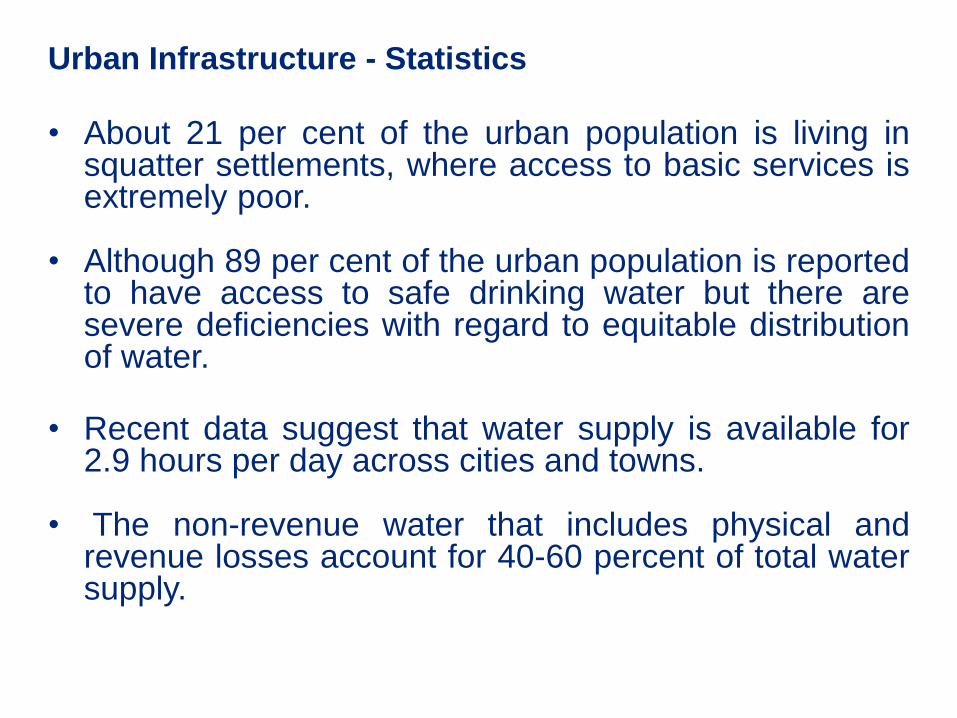
Urban Infrastructure - Statistics
• About 21 per cent of the urban population is living in squatter settlements, where access to basic services is extremely poor.
• Although 89 per cent of the urban population is reported to have access to safe drinking water but there are severe deficiencies with regard to equitable distribution of water.
• Recent data suggest that water supply is available for 2.9 hours per day across cities and towns.
• The non-revenue water that includes physical and revenue losses account for 40-60 percent of total water supply.

• About 30 to 50 percent households do not have sewerage connections and Less than 30 percent of total waste water is treated.
• Solid waste systems are severally stressed. Average per capita generation of waste is estimated at 0.4 kg per capita per day in cities ranging from 1 lakh to 50 lakh population and the garbage collection efficiency ranges between 50 to 90 per cent of the solid waste generated.
• City roads are inadequate for traffic requirements, leading to congestion and fast deterioration in quality of roads due to excess loads.
• The state of services reflects the deterioration in the quality of city environments.
12
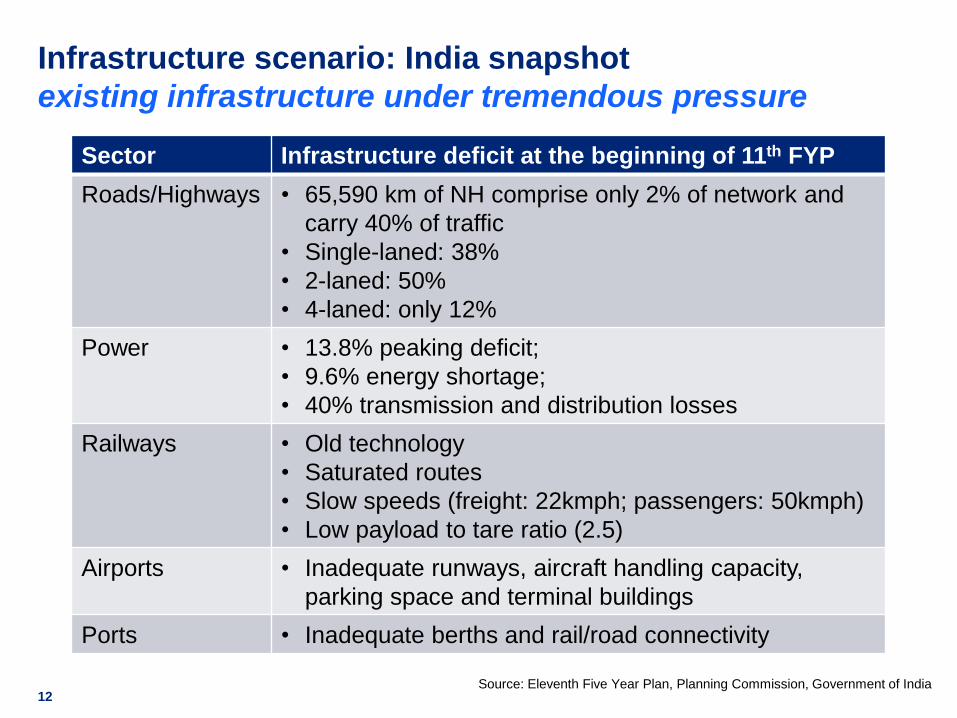
Infrastructure scenario: India snapshot
existing infrastructure under tremendous pressure
Sector Infrastructure deficit at the beginning of 11th FYP
Roads/Highways • 65,590 km of NH comprise only 2% of network and
carry 40% of traffic
• Single-laned: 38%
• 2-laned: 50%
• 4-laned: only 12%
Power • 13.8% peaking deficit;
• 9.6% energy shortage;
• 40% transmission and distribution losses
Railways • Old technology
• Saturated routes
• Slow speeds (freight: 22kmph; passengers: 50kmph)
• Low payload to tare ratio (2.5)
Airports • Inadequate runways, aircraft handling capacity,
parking space and terminal buildings
Ports • Inadequate berths and rail/road connectivity
Source: Eleventh Five Year Plan, Planning Commission, Government of India
13
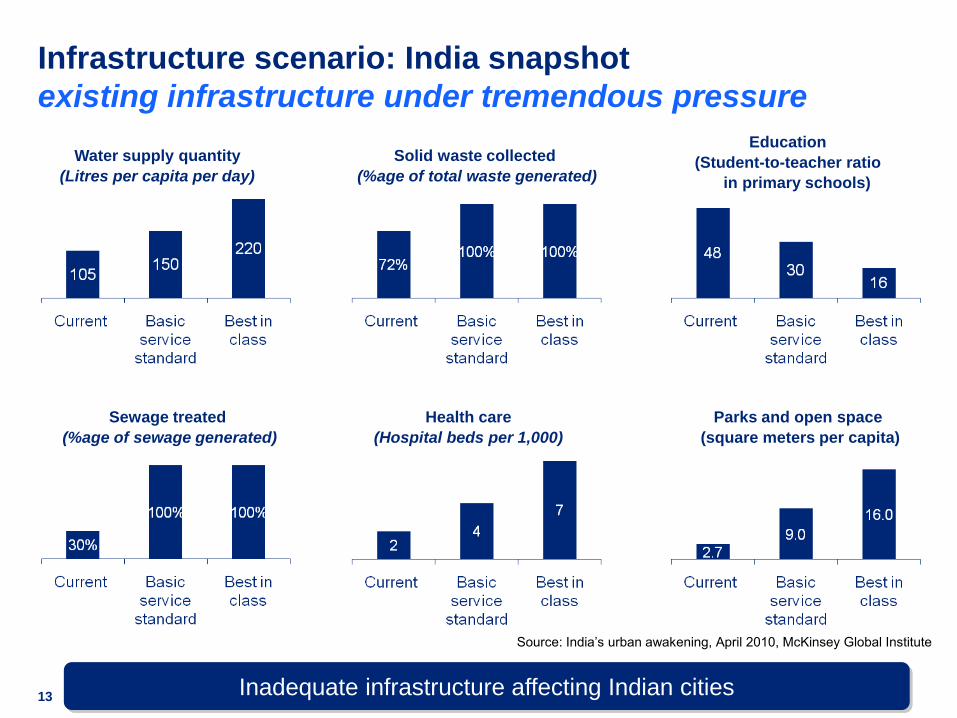
Infrastructure scenario: India snapshot
existing infrastructure under tremendous pressure
Water supply quantity
(Litres per capita per day)
Sewage treated
(%age of sewage generated)
Solid waste collected
(%age of total waste generated)
Health care
(Hospital beds per 1,000)
Education
(Student-to-teacher ratio
in primary schools)
Parks and open space
(square meters per capita)
Source: India‟s urban awakening, April 2010, McKinsey Global Institute
Inadequate infrastructure affecting Indian cities
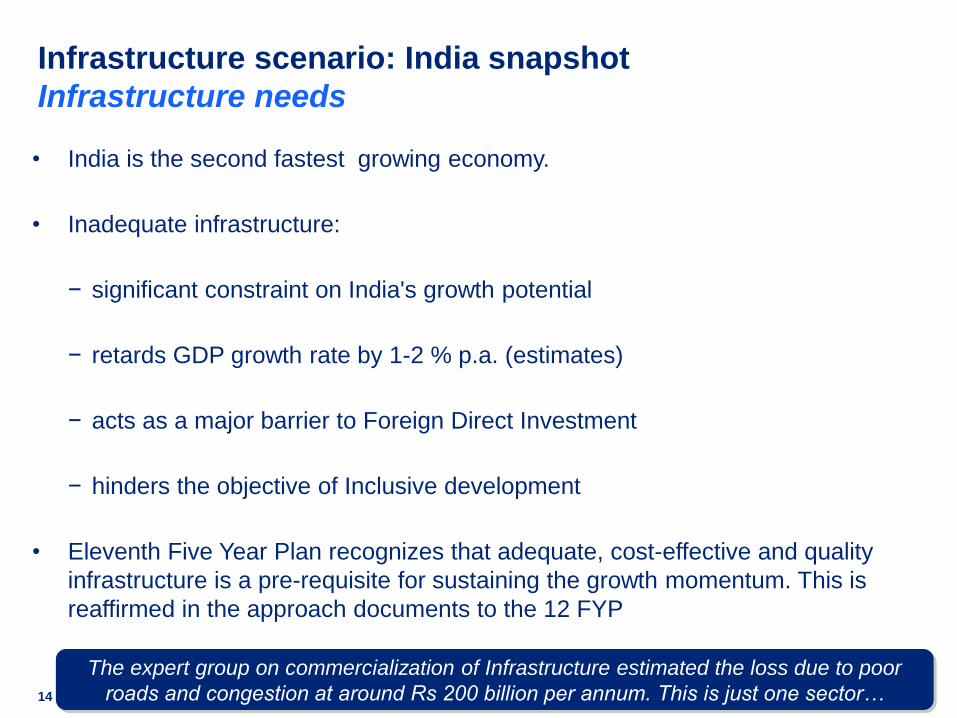
• India is the second fastest growing economy.
• Inadequate infrastructure:
− significant constraint on India's growth potential
− retards GDP growth rate by 1-2 % p.a. (estimates)
− acts as a major barrier to Foreign Direct Investment
− hinders the objective of Inclusive development
• Eleventh Five Year Plan recognizes that adequate, cost-effective and quality
infrastructure is a pre-requisite for sustaining the growth momentum. This is
reaffirmed in the approach documents to the 12 FYP
14
The expert group on commercialization of Infrastructure estimated the loss due to poor
roads and congestion at around Rs 200 billion per annum. This is just one sector…
Infrastructure scenario: India snapshot
Infrastructure needs
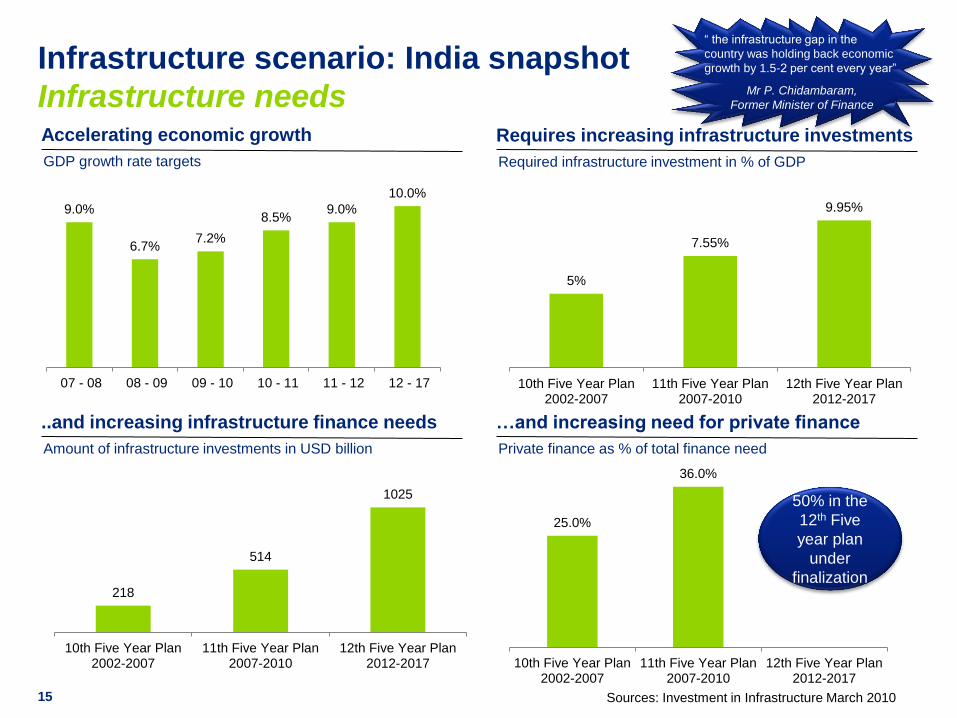
25.0%
36.0%
10th Five Year Plan2002-2007
11th Five Year Plan2007-2010
12th Five Year Plan2012-2017
9.0%
6.7% 7.2%
8.5% 9.0%
10.0%
07 - 08 08 - 09 09 - 10 10 - 11 11 - 12 12 - 17
218
514
1025
10th Five Year Plan2002-2007
11th Five Year Plan2007-2010
12th Five Year Plan2012-2017
15
Accelerating economic growth
GDP growth rate targets
Requires increasing infrastructure investments
Required infrastructure investment in % of GDP
..and increasing infrastructure finance needs
Amount of infrastructure investments in USD billion
…and increasing need for private finance
Private finance as % of total finance need
5%
7.55%
9.95%
10th Five Year Plan2002-2007
11th Five Year Plan2007-2010
12th Five Year Plan2012-2017
Sources: Investment in Infrastructure March 2010
“ the infrastructure gap in the
country was holding back economic
growth by 1.5-2 per cent every year”
Mr P. Chidambaram,
Former Minister of Finance
Infrastructure scenario: India snapshot
Infrastructure needs
50% in the
12th Five
year plan
under
finalization

16
Projected Investment in
Infrastructure X Plan XI Plan
Sectors US $ billion Share (%) US $ billion Share (%)
Electricity (incl. NCE) 72.96 33.49 166.63 32.42
Roads and Bridges 36.22 16.63 78.54 15.28
Telecommunication 25.84 11.86 64.61 12.57
Railways (incl. MRTS) 29.91 13.73 65.45 12.73
Irrigation (incl. Watershed) 27.88 12.80 63.33 12.32
Water Supply and Sanitation 16.20 7.44 35.93 6.99
Ports 3.52 1.61 22.00 4.28
Airports 1.69 0.78 7.74 1.51
Storage 1.20 0.55 5.59 1.09
Gas 2.43 1.11 4.21 0.82
Total US $ billion 217.86 100
514.04 100
Rs. crore 871,445 2,060,193
17
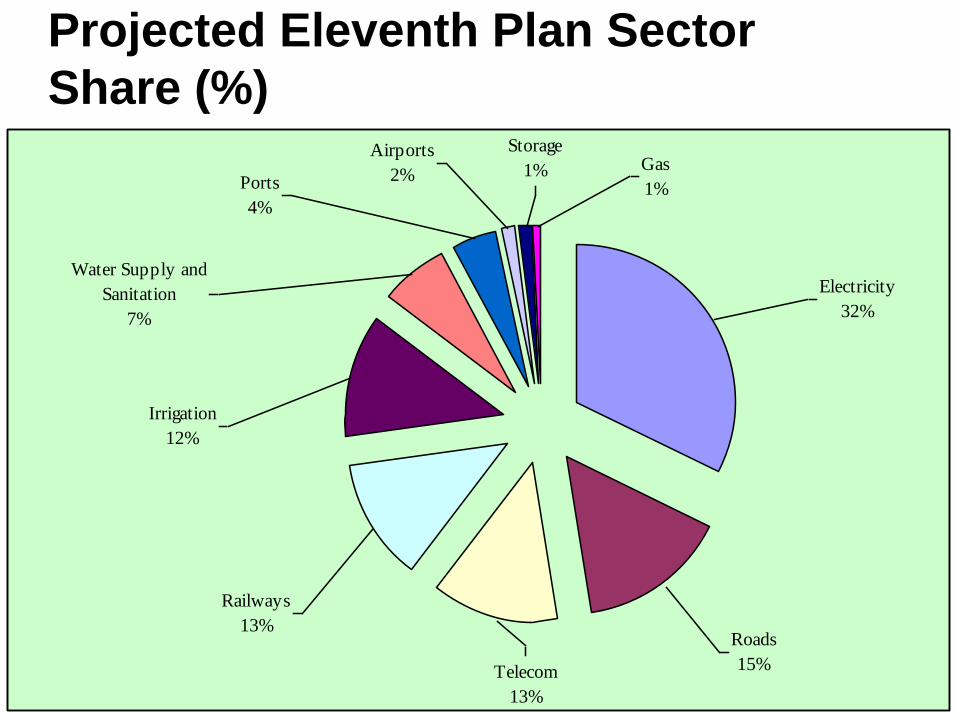
Projected Eleventh Plan Sector
Share (%)
Electricity
32%
Roads
15%Telecom
13%
Railways
13%
Irrigation
12%
Water Supply and
Sanitation
7%
Ports
4%
Airports
2%Gas
1%
Storage
1%

18
Infrastructure scenario: India snapshot
Infrastructure needs: bridging the gap
“Investment gap”
• Gap between existing and required infrastructure
• Improving the availability of infrastructure by increased investment in the infrastructure assets
• As per the 11th Five year plan, the gross capital formation (GCF) in infrastructure should rise as a share of GDP from 5% in 2006-07 to 9% by the end of the plan period (2011-12)
“Efficiency gap”
• Need to enhance quality of service, minimum acceptable standards of service
Options to bridge the gap
Traditional public procurement
Public Private Partnerships (PPPs)
Privatisation
PPPs are an option to supplement scarce public resources and improving efficiencies
without necessarily transferring ownership to the private sector

• „Bharat Nirman‟ Programme to develop rural infrastructure at an estimated cost of Rs. 1,74,000 crore (~US$40 billion)
• Jawhar Lal Nehru Urban Renewal Mission
–Rs. 100,000 crore (US$22 billion) • Country wide rural connectivity programme
to link all unconnected village having population of 500 with fair weather road undertaken
Recent Infrastructure Initiatives

Introduction to PPP Understanding PPP Concepts and Principles

Objectives of the Training Module
To introduce the basic concepts and rationale for PPPs
21
Basic concepts of PPPs (What is PPP?)
Key Concepts • Definition of PPPs
• Common characteristics
• PPPs in comparison with traditional public procurement
• Common myths and concerns related to PPPs
Rationale for PPPs (Why PPP?)
Key Concepts • Potential advantages of PPPs
• Possible concerns of PPPs
How to do PPP?
Key Concepts • Common PPP models
• Critical success factors across PPP Life cycle
• Common pitfalls to avoid
Pedagogical
Tools
• Case examples explaining different PPP modal variants

Introducing PPP
Structure of the Training
22
Effective and
Efficient
Delivery of
Public Services How to do PPP? Understanding the Common
PPP models and Critical
Success Factors
What is PPP? Understanding the Characteristics
of PPPs, common myths &
concerns
Why PPP? Understanding the Rationale
for PPPs

Introducing PPP

What is PPP?
Basic concepts of PPPs (What is PPP?)
Key Concepts • Definition of PPPs
• Common characteristics
• PPPs in comparison with traditional public procurement
• Common myths and concerns related to PPPs
What is PPP?
Defining PPPs
25
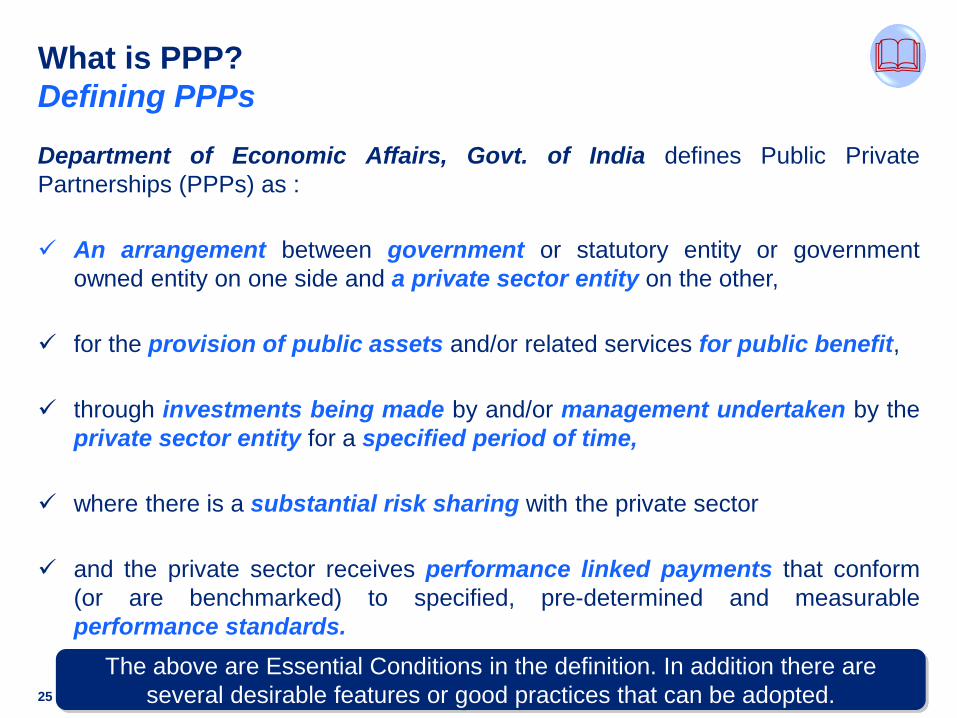
Department of Economic Affairs, Govt. of India defines Public Private
Partnerships (PPPs) as :
An arrangement between government or statutory entity or government
owned entity on one side and a private sector entity on the other,
for the provision of public assets and/or related services for public benefit,
through investments being made by and/or management undertaken by the
private sector entity for a specified period of time,
where there is a substantial risk sharing with the private sector
and the private sector receives performance linked payments that conform
(or are benchmarked) to specified, pre-determined and measurable
performance standards.
The above are Essential Conditions in the definition. In addition there are
several desirable features or good practices that can be adopted.
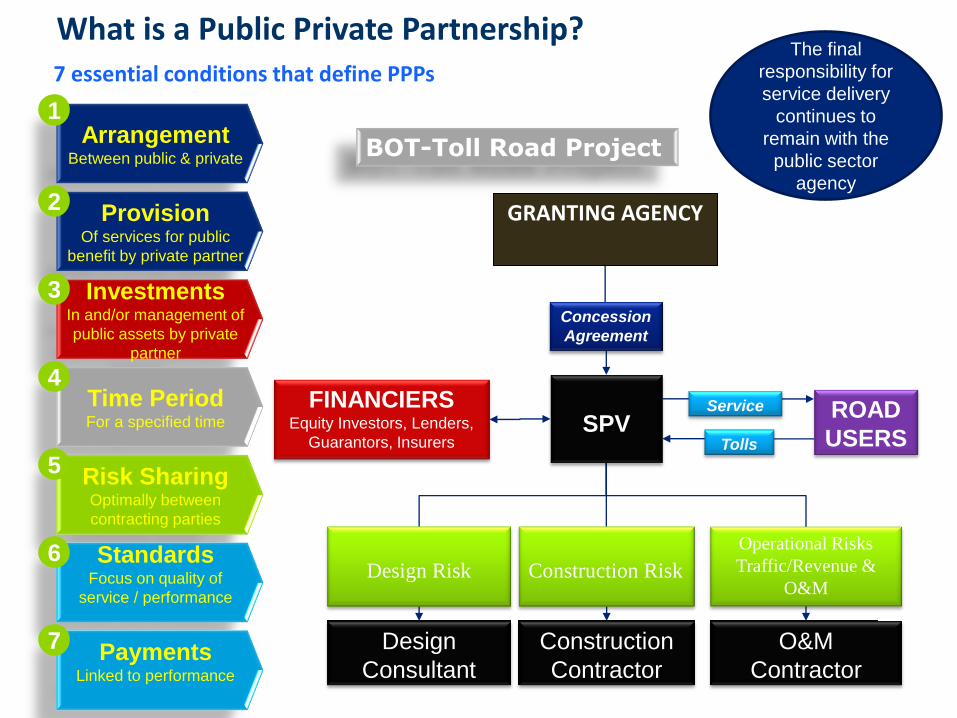
What is a Public Private Partnership? 7 essential conditions that define PPPs
Arrangement Between public & private
Provision Of services for public
benefit by private partner
Investments In and/or management of
public assets by private
partner
Time Period For a specified time
Risk Sharing Optimally between
contracting parties
Standards Focus on quality of
service / performance
Payments Linked to performance
1
2
3
4
5
6
7
The final
responsibility for
service delivery
continues to
remain with the
public sector
agency
FINANCIERS Equity Investors, Lenders,
Guarantors, Insurers
Operational Risks
Traffic/Revenue &
O&M
BOT-Toll Road Project
GRANTING AGENCY
FINANCIERS Equity Investors
Lenders, Guarantors Insurers
CONSTRUCTION CONTRACTOR CONTRACTOR
DESIGN CONSULTANT
Risk Risk Demand, Traffic, Demand, Traffic,
SPV ROAD
USERS
Equity Investors
Design
Consultant
Construction
Contractor
O&M
Contractor
Concession
Agreement
Design Risk
Construction Risk
Tolls
Service

What is PPP?
An alternative procurement option
27
• PPP is only one of the several options available for procuring infrastructure.
• PPPs should not be seen as a replacement of the traditional public
procurement.
• PPP should be applied only where it can provide better value for money for the
public at large.
• PPPs recognize that both the public sector and the private sector have their
own strengths.
• PPPs attempt to balance the strengths of both parties, to create a win-win
combination.
PPP is not a panacea to all our infrastructure requirements. It is a tool that
should be considered along with other options of procurement.
The final
responsibility for
service delivery
continues to
remain with the
public sector
agency
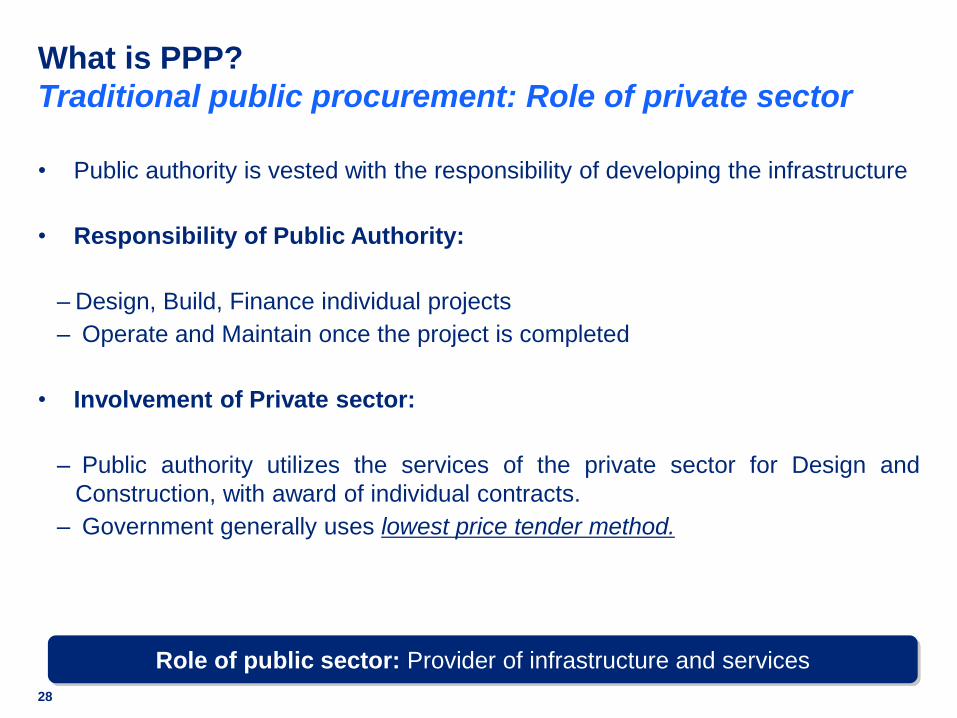
What is PPP?
Traditional public procurement: Role of private sector
• Public authority is vested with the responsibility of developing the infrastructure
• Responsibility of Public Authority:
‒ Design, Build, Finance individual projects
‒ Operate and Maintain once the project is completed
• Involvement of Private sector:
‒ Public authority utilizes the services of the private sector for Design and
Construction, with award of individual contracts.
‒ Government generally uses lowest price tender method.
28
Role of public sector: Provider of infrastructure and services

29
What is PPP?
Comparison: Traditional public procurement and PPP
PPP:The public sector procures a service, not an asset, from the private sector.
Characteristic Traditional public procurement PPP
Focus Procuring Assets Procuring Services
Project
management
Public sector is responsible for all
project management roles
Private sector manages overall
project - design, construction,
operations and maintenance.
Focus on project life cycle
expected to bring efficiency.
Service Delivery Public sector directly responsible
for service delivery to users
Private sector directly responsible
for service delivery to users
Financing
Public sector responsible for
financing the project. Thus
financing impacted by budgetary
allocations and then actual
disbursements
Private sector may contribute
finance through debt and equity
issuances
Risk Sharing Public sector bears all project
risks. Risk sharing limited to the
extent of warranties.
Risks allocated to parties which
can manage them most efficiently
Contractual
Arrangement
Short term, generally segregated
contracts for asset creation (BOQ
based) and maintenance.
Long term contracts- Public
sector/users pay for services linked
to performance.

Why PPP?
30
Value for money achieved by PPPs is often debated
Availability of Private sector finance (most commonly cited reason):
Through PPPs governments can leverage private sector finances to
meet the infrastructure needs.
Achieving greater Value for Money through Efficiency gains:
In principle, PPPs can improve VfM by:
• Incentivising On-Time and Within-Budget delivery
• Optimising the Life cycle costs
• Providing an opportunity to innovate
• Optimizing the risk allocation
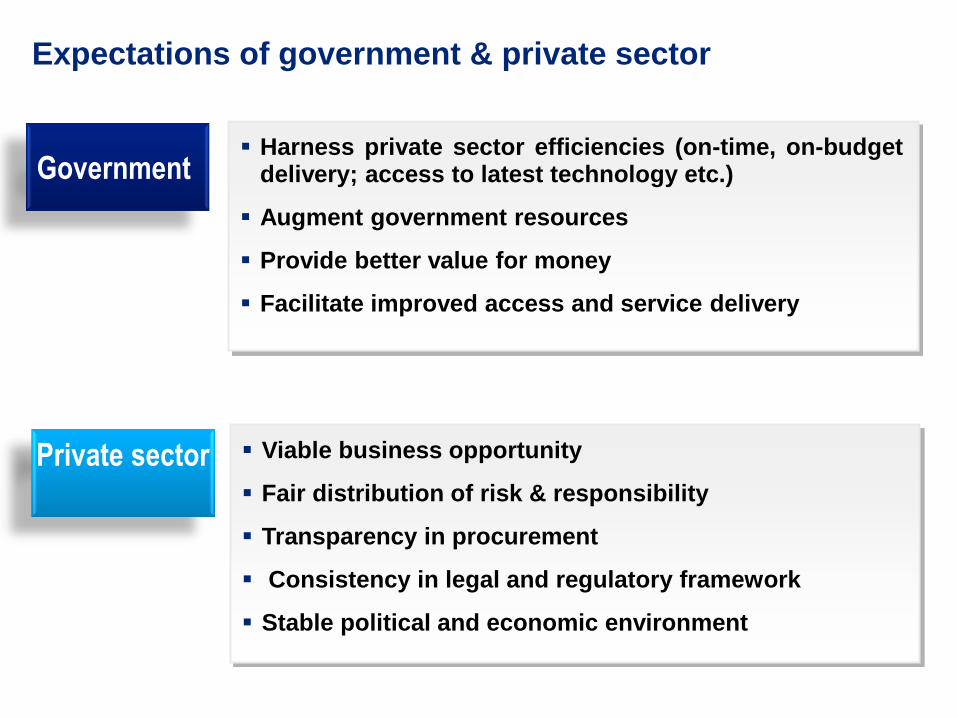
Government
Private sector
Expectations of government & private sector
Harness private sector efficiencies (on-time, on-budget delivery; access to latest technology etc.)
Augment government resources
Provide better value for money
Facilitate improved access and service delivery
Viable business opportunity
Fair distribution of risk & responsibility
Transparency in procurement
Consistency in legal and regulatory framework
Stable political and economic environment

PPPs: Common Myths/Concerns
Myth/Concern Clarification
• Profit motive of private
sector is incompatible with
the service motive of
public sector
No. The key is to harness private sector‟s profit
motive, by incentivizing them to provide better quality
service and earn reasonable return.
• PPPs increase user tariffs Not Necessarily. When appropriate safeguards like
effective regulation and/or adequate competition are in
place.
However in sectors where existing tariffs are
inadequate to cover costs of specified level of service
tariffs may initially require some upward adjustment.
Over time efficiency gains expected to rationalize
tariffs.
• Money for PPPs comes
from private sector
“pockets”
Initially, YES. But private sector would make those
investments provided they can recover those
investments either from users or the government with
reasonable return.
• Once a private sector
partner is brought in, there
is little or no role for the
public sector
No. Public sector‟s role changes from direct
involvement in construction and service provision, to
ensuring that the PPP delivers value for money for the
government and better services for users.
How to do PPP?
How to do PPP?
Key Concepts • Common PPP models
• Critical success factors across PPP Life cycle
• Common pitfalls to avoid
Pedagogical
Tools
• Case examples explaining different PPP modal variants

How to do PPP?
The essence is partnership
34
To deliver a project or a service traditionally provided by the
public sector Purpose of
Partnership
To allow each party to do what they do best so as to provide
greater value for money for the public at large Principle of
Partnership
The public sector role is redefined as one of facilitator and
enabler, rather than being involved in direct management or
delivery of services.
Role in
Partnership
The type of partnership or the choice of PPP Structures is
limitless and depends on the extent of risk and responsibility
transfer to the private party.
Type of
Partnership
The key is to structure a win-win arrangement

How to do PPP?
Understanding the common PPP Models
35
• Even under Traditional Procurement Private sector has been involved in
developing the infrastructure
• PPP provides another procurement option by increasing the involvement of
the Private sector by transferring more responsibility and risk.
• Choice of partnership structure (PPP Models) is limitless and depends on the
extent of risk and responsibility transfer
• There is no one generic or best PPP model.
• PPP Structure is tailored to meet the specific requirements of the project.
PPPs come in various shapes and sizes...

Health
Educatio
n
Urban
Transport
PPPs come in many shapes and sizes
Power
Roads
Airports
Ports
Railways
Terminals
Water/Sewerage
Solid Waste
Transport
(Metro/BRTS)
Parking Lots
Generation
Transmission
Distribution
• Designing
• Building
• Financing
• Own
• Operation
• Maintenance
• Transfer
Across many infrastructure sectors…
Facilities Mgmt.
Service Delivery
Facilities Mgmt
Clinical
Services
Diagnostics
Private Sector can participate through….
In several ways/forms… • Performance/management contracts
• Leases
• Concessions (BOT, BOOT, BOO, DBFO, etc..)

Key Aspects defining the PPP Mode
• Does the PPP involve building new assets to provide the service
(capital expenditure project), or are the required services for operations
and management only?
• Which roles will the private sector carry out? For example, who will
provide finance? Who will design and construct?
• Who will take ownership of the assets?
• What will be the duration of the PPP contract?
• How are the various project risks allocated between the private and
public partners?
• What will be the major revenue source for the project? For example, will
it be from charges to users (direct tolls), or payment from Government
(e.g.,annuity)?
• Is demand for the infrastructure service expected to be stable over the
period of the contract?
37

Distinguishing features of the forms of PPPs
Key
parameter
Different Types of PPPs
Contracts Concessions
Manageme
nt
Lease Area BOT
(User Fee)
BOT
(Annuity)
Responsib
ility
Asset
Ownership
Public Public Public Public &
Private
Public &
Private
Incremental
Capex
Public Private
Private Private Private
O&M Private Private Private Private Private
Ris
k
Construction NA Private Private Private Private
Finance NA Private Private Private Private
O&M Private Private Private Private Private
Demand Public Private Private Private Public
Case study/ E.g. Latur Water
Supply
Columbia
Hospital
Macau Water
Supply / Delhi
power distn.
Interstate bus
terminal
(Dehradun)
NHAI Annuity
Concessions

Management Contract. Latur water supply project
Objective: To improve water supply in Latur
Project
Structure:
Ten year Management
Contract with LWMC (SPV) in
June 2008 for operation,
maintenance and repairs of all
assets and resources
Ownership
of asset:
Ownership continued to rest
with public agency
O&M Responsibility of concessionaire
Construction /
Finance:
Management contract only – operation of existing assets only.
The concessionaire did not have any ownership on the assets
Commercial
arrangement
All operation & maintenance responsibilities with the
concessionaire. Under the provisions of the contract LWMC
(the SPV) collected water tariffs from users, and in turn paid a
fixed monthly fee to MJP
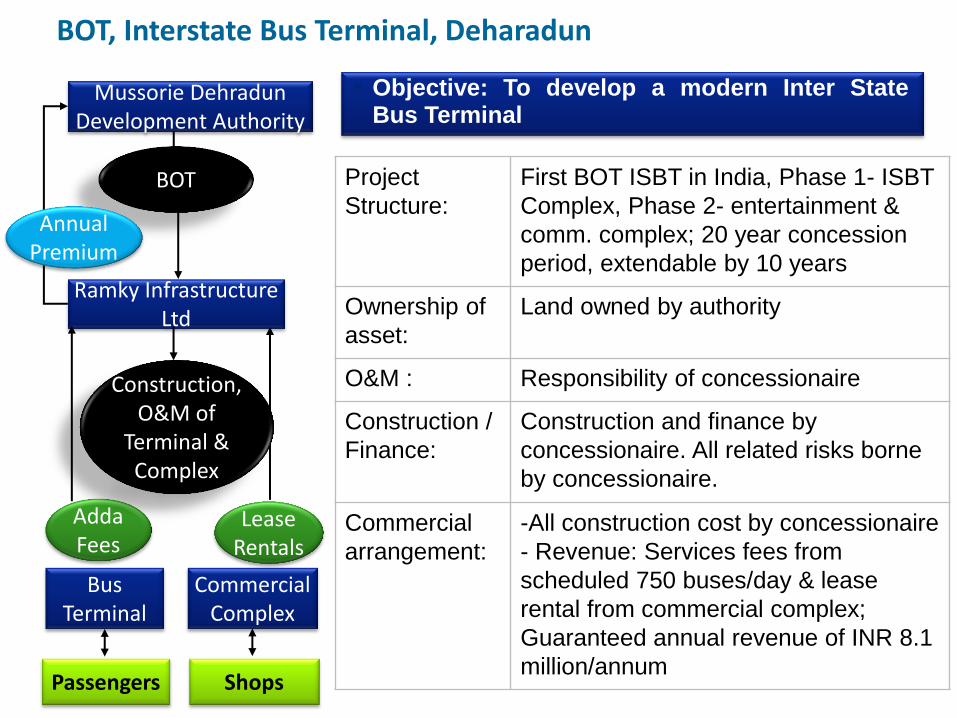
BOT, Interstate Bus Terminal, Deharadun
Objective: To develop a modern Inter State Bus Terminal
Mussorie Dehradun Development Authority
Commercial Complex
Ramky Infrastructure Ltd
Lease Rentals
Bus Terminal
Adda Fees
BOT
Annual Premium
Construction, O&M of
Terminal & Complex
Shops Passengers
Project
Structure:
First BOT ISBT in India, Phase 1- ISBT
Complex, Phase 2- entertainment &
comm. complex; 20 year concession
period, extendable by 10 years
Ownership of
asset:
Land owned by authority
O&M : Responsibility of concessionaire
Construction /
Finance:
Construction and finance by
concessionaire. All related risks borne
by concessionaire.
Commercial
arrangement:
-All construction cost by concessionaire
- Revenue: Services fees from
scheduled 750 buses/day & lease
rental from commercial complex;
Guaranteed annual revenue of INR 8.1
million/annum

DBOOT, desalination of Sea water, Chennai
Objective: To augment the scarce water supply by establishing a 100 MLD (Million Liters Per Day) seawater desalination plant
Chennai Metropolitan Water Supply & Sewerage Board (CMWSSB)
Private Partners (IVRCL & Befesa Agua)
Desalinated
Sea Water
Users
Desal water charges
DBOOT / Concession
Asset: Plant for Desalination
Desal Water
Water
Charges
Project
Structure:
CMWSSB entered into a Bulk Water
Purchase Agreement with a Special
Purpose Vehicle for 25 years
Ownership of
asset:
Ownership of concessionaire during
concession period
O&M : Responsibility of concessionaire
Design
/Construction /
Finance:
Design, construction and finance by
concessionaire. All related risks
borne by concessionaire.
Commercial
arrangement:
Long term bulk water purchase
agreement between concessionaire
and CMWSSB
Other
arrangements:
-Uninterrupted power supply ensured
to concessionaire
-Supply of raw water for treatment
responsibility of CMWSSB
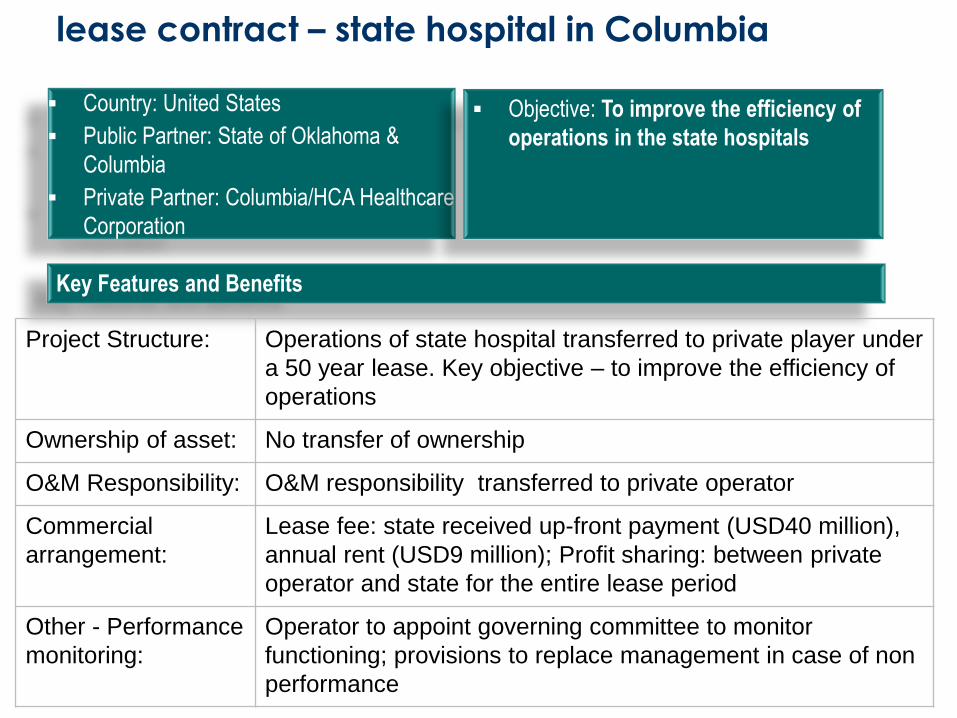
Country: United States
Public Partner: State of Oklahoma &
Columbia
Private Partner: Columbia/HCA Healthcare
Corporation
Key Features and Benefits
Objective: To improve the efficiency of
operations in the state hospitals
lease contract – state hospital in Columbia
Project Structure: Operations of state hospital transferred to private player under
a 50 year lease. Key objective – to improve the efficiency of
operations
Ownership of asset: No transfer of ownership
O&M Responsibility: O&M responsibility transferred to private operator
Commercial
arrangement:
Lease fee: state received up-front payment (USD40 million),
annual rent (USD9 million); Profit sharing: between private
operator and state for the entire lease period
Other - Performance
monitoring:
Operator to appoint governing committee to monitor
functioning; provisions to replace management in case of non
performance

Country: China
Public Partner: Civic and Municipal Affairs
Bureau, Office for Infrastructure
Development
Private Partner: Sino-French Holdings
Key Features and Benefits
Objective: To improve the coverage and
efficacy of water supply in Macau by
involving international companies and
using better technology
(Area) concession, water supply in Macau
Project Structure: Concession contract for 25 years granted to pvt. operator
Ownership of asset: No transfer of ownership
O&M Responsibility: O&M responsibility transferred to private operator
Construction /
Finance:
Works undertaken by pvt. Operator - Private player invested
in upgrading water treatment plants, replacing faulty meters,
replacing major pipelines and introduce control systems
Commercial
arrangement:
Source of income for operator was water user‟s fee.
Annual revision of the tariff was done based on the total costs
incurred but due to efficiencies and economies of scale, a
lower tariff was charged to consumers.
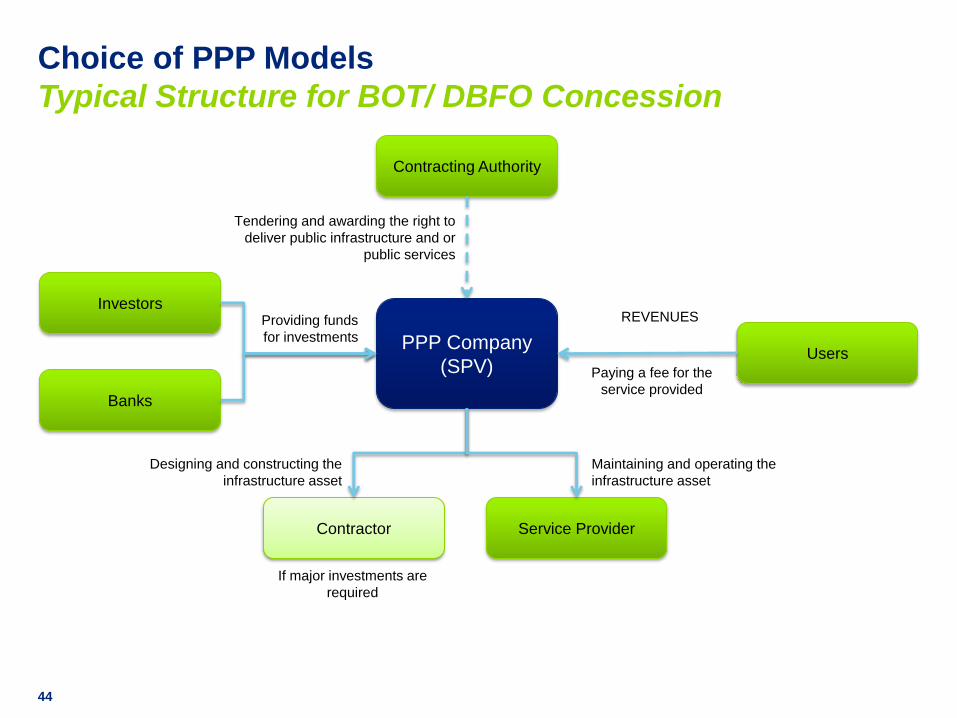
Choice of PPP Models
Typical Structure for BOT/ DBFO Concession
44
PPP Company
(SPV)
Contracting Authority
Users
Investors
Banks
Contractor Service Provider
Tendering and awarding the right to
deliver public infrastructure and or
public services
Paying a fee for the
service provided
Maintaining and operating the
infrastructure asset
Designing and constructing the
infrastructure asset
Providing funds
for investments
If major investments are
required
REVENUES

Choice of PPP Models
Typical Structure for BOT (Annuity) Concession
45
PPP Company
(SPV)
Contracting Authority
Investors
Banks
Contractor Service Provider
Tendering and awarding the right to
deliver public infrastructure and or
public services
Paying a fee for the
service provided
Maintaining and operating the
infrastructure asset
Designing and constructing the
infrastructure asset
Providing funds
for investments
If major investments are
required
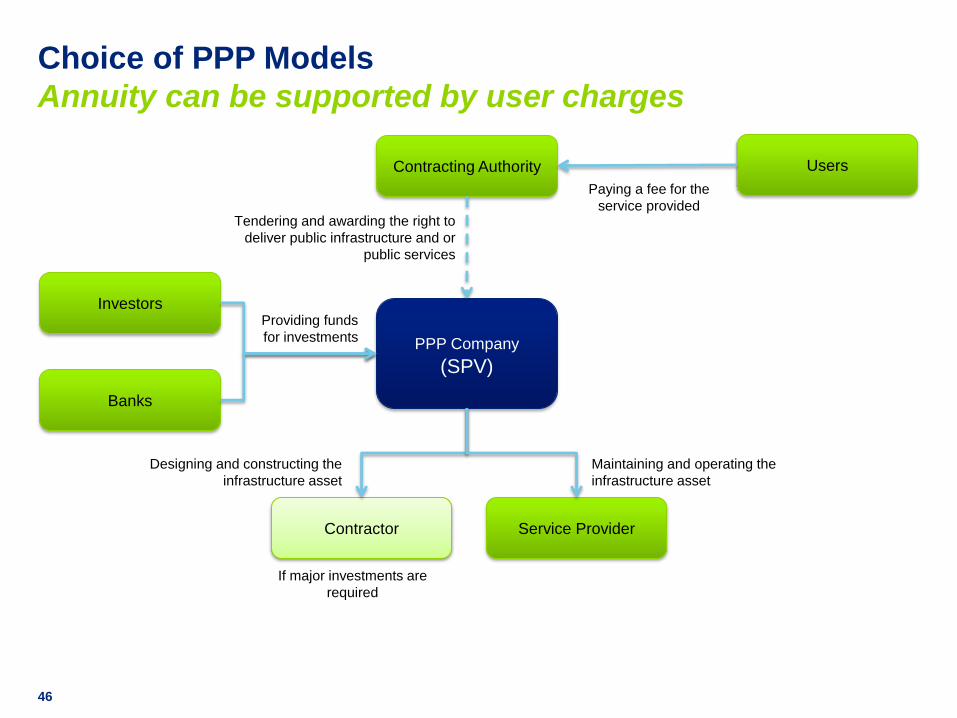
Choice of PPP Models
Annuity can be supported by user charges
46
PPP Company
(SPV)
Contracting Authority Users
Investors
Banks
Contractor Service Provider
Tendering and awarding the right to
deliver public infrastructure and or
public services
Paying a fee for the
service provided
Maintaining and operating the
infrastructure asset
Designing and constructing the
infrastructure asset
Providing funds
for investments
If major investments are
required

Choice of PPP Models:
Summing up
47
Design Build Operate & maintain Finance Own
• Key is to structure the relationship between the parties
• PPP model should allow each party to do what they do best so as to ensure
that public services and infrastructure are provided in the most efficient manner
• The nomenclature used to describe the PPP Models is not standardized
• Familiarization with the concept is more important than understanding the terms

How to do PPP?
Critical success factors
48 Source: Vickram Cuttaree, The World Bank, Key success factors for PPP based on International Experience
1) Careful planning of PPP project
2) Solid revenue and cost estimations
3) User willingness to pay and communication plan
4) Extensive feasibility study with use of PPP experts
5) Compliance with contractual agreement
6) Strong Legal and Regulatory Framework
7) Strong Institutions with appropriate resources
8) Competitive and transparent procurement
9) Mitigation and flexibility in managing macro-risks
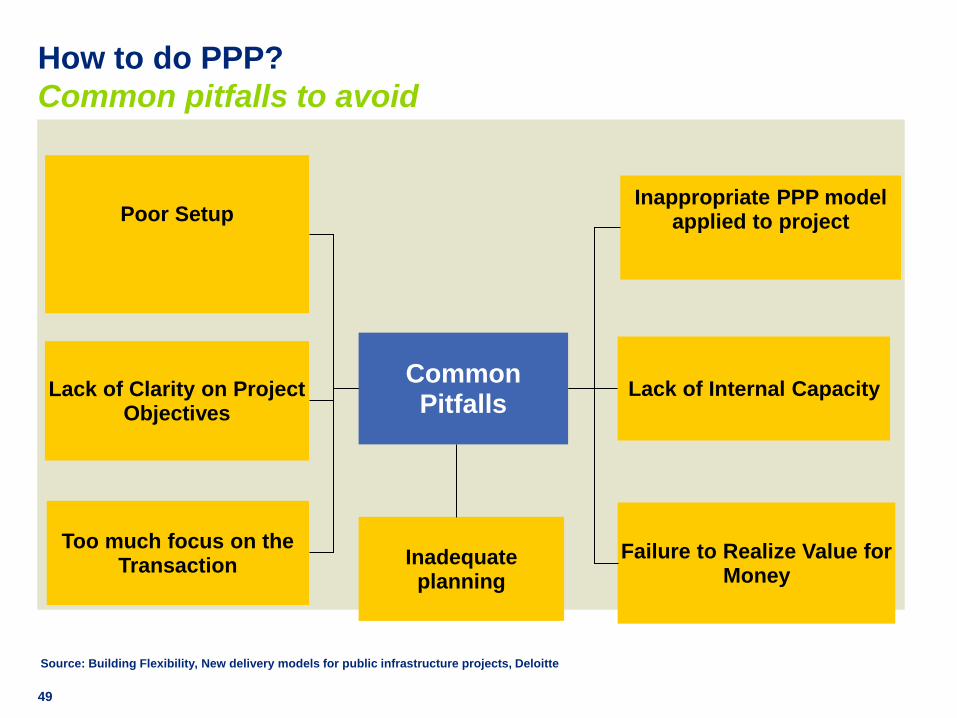
How to do PPP?
Common pitfalls to avoid
49
Common Pitfalls
Poor Setup
Inappropriate PPP model applied to project
Too much focus on the Transaction
Failure to Realize Value for Money
Lack of Clarity on Project Objectives
Lack of Internal Capacity
Inadequate planning
Source: Building Flexibility, New delivery models for public infrastructure projects, Deloitte

Legal and Regulatory Framework
Diverse legislation applicable to a particular sector/activity-
• Laws governing various sectors like the Electricity Act,
2003; the Telecom Regulatory Authority of India Act, 1997;
the National Highways Authority of India Act, 1988;
Municipal laws of various States;
• Laws governing normal commercial transactions like the
Contract Act, 1872; the Sale of Goods Act, 1930; the
negotiable Instruments Act, 1881; the Companies Act,
1956; the Foreign Exchange Management Act, 1999; the
Competition Act, 2002;
• Laws for recognition and enforcement of rights and
obligations like the Specific Relief Act, 1963, the Code of
Civil Procedure, 1908, the Arbitration and Conciliation Act,
1996.
50
• Binding rulings and instruments issued by a regulatory
authorities include –
• regulations,
• practice directions,
• licenses,
• quality of supply standards,
• tariff orders,
• performance standards,
• safety standards,
• environmental issues,
• and case-specific orders.
51

Thank You


![Smallislands - IPCC · Smallislands Chapter16 690 combination of factors, including poor public health practices, inadequate infrastructure, poor waste management practices, increasingglobaltravel,andchangingclimaticconditions.[16.4.5]](https://img.pdfslide.us/doc/110x75/5ebeb43c93de2461a67638c1/smallislands-ipcc-smallislands-chapter16-690-combination-of-factors-including.jpg)