Embed Size (px)
Citation preview

H E A LT H W E A LT H C A R E E R
I N F R A S T R U C T U R E A P R I M E RA U G U S T 2 0 1 6


2 0 1 6 M E R C E R I N V E S T M E N T S P O I N T O F V I E W 1
C O N T E N T S
S U M M A R Y ................................................................................ Page 2
I N T R O D U C T I O N .................................................................... Page 3
S E C T O R O V E R V I E W ............................................................ Page 4
I N V E S T M E N T P E R S P E C T I V E ........................................... Page 6
Revenue Structures and Risk Drivers .................................................. 6
Other Risk Drivers ................................................................................. 8
Valuation Trends .................................................................................. 11
E N V I R O N M E N T A L , S O C I A L A N D G O V E R N A N C E C O N C E R N S ............................................ Page 12
T H E M E C H A N I C S O F I N F R A S T R U C T U R E I N V E S T I N G ................................... Page 13
Building a Portfolio ............................................................................. 13
Cash Flow Management ...................................................................... 16
Valuation ............................................................................................. 16
Fees .................................................................................................... 16
The J-Curve ......................................................................................... 17
Investment Modes .............................................................................. 18
Liquidity............................................................................................... 19
Tolerance for Complexity ................................................................... 20
Governance ........................................................................................ 20
Due Diligence ...................................................................................... 21
Access ................................................................................................. 21
Return and Risk Outcomes ................................................................. 22
Benchmarking ..................................................................................... 24
T H E O P T I M A L U S E O F I N F R A S T R U C T U R E ............ Page 25
G L O S S A R Y O F I N F R A S T R U C T U R E T E R M S ............ Page 26

I N F R A S T R U C T U R E — A P R I M E R2
Infrastructure is an asset class that continues to gain greater acceptance from institutional investors. Against this, it is often oversimplified and/or poorly understood by institutional investors at the expense of effective investment in the asset class. This house view aims to define the types of assets that represent infrastructure and discusses how to invest in the asset class effectively. To be a successful long-term investor in unlisted infrastructure (the primary focus of this paper) requires an appreciation of the range of alternatives across the asset class, detailed upfront due diligence of investments made and effective portfolio diversification. At the same time, there are many ways to invest, including options for overcoming the governance burden that building a direct-fund program can pose, and investors should consider their own circumstances and preferences before deciding how to proceed.
S U M M A R Y

2 0 1 6 M E R C E R I N V E S T M E N T S P O I N T O F V I E W 3
Infrastructure is an asset class that emerged in the mid-1990s and has continued to gain greater acceptance from institutional investors. Infrastructure is generally considered with other private market asset classes, such as private equity and real estate, with which it shares certain characteristics. Often, where infrastructure investment is prominent, it originated as a part of private equity or real estate. The risk/return profile of infrastructure assets differs from private equity businesses. Unlike private equity, where the achievement of returns is often predicated on achieving growth and business transformation, the investment case underpinning many infrastructure investments centers around their potential to deliver a longer and more predictable stream of distributions. Infrastructure assets are distinct from real estate because the assets are operating businesses, although underlying real estate may be a component of an infrastructure asset’s overall value.
I N T R O D U C T I O N
Infrastructure investments center around their potential to deliver a longer and more predictable stream of distributions.
I N F R A S T R U C T U R E — A P R I M E R4
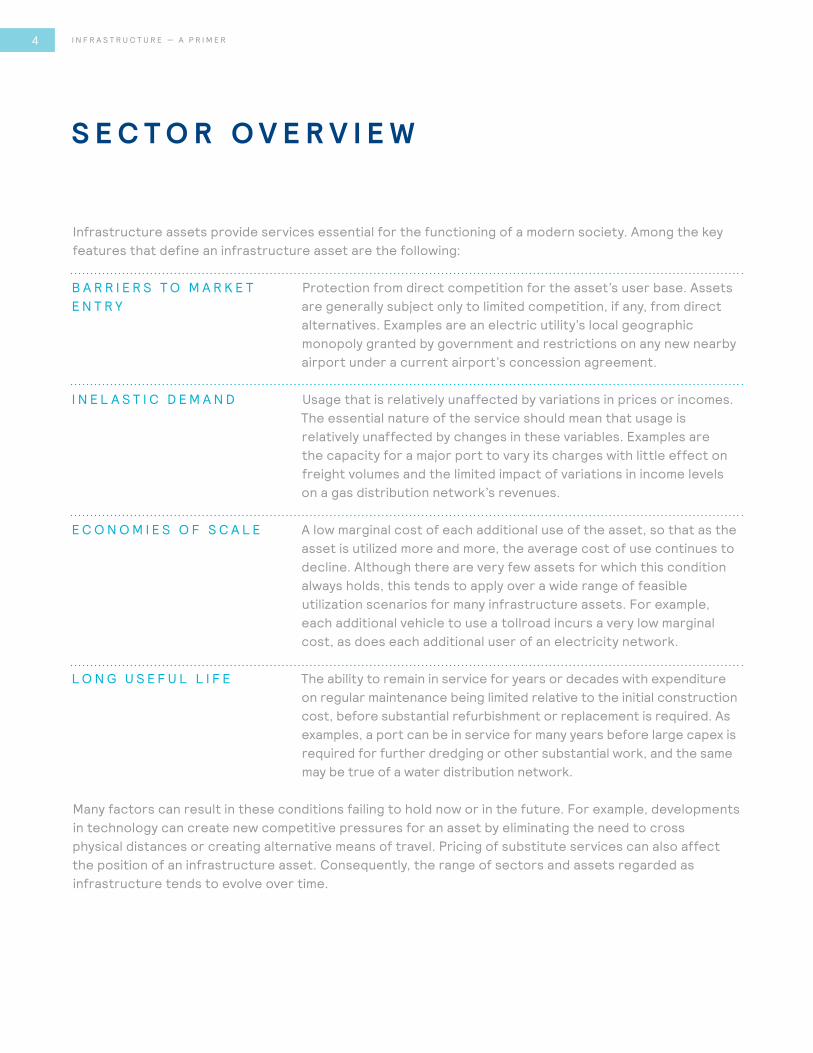
Infrastructure assets provide services essential for the functioning of a modern society. Among the key features that define an infrastructure asset are the following:
S E C T O R O V E R V I E W
Protection from direct competition for the asset’s user base. Assets are generally subject only to limited competition, if any, from direct alternatives. Examples are an electric utility’s local geographic monopoly granted by government and restrictions on any new nearby airport under a current airport’s concession agreement.
B A R R I E R S T O M A R K E T E N T R Y
Usage that is relatively unaffected by variations in prices or incomes. The essential nature of the service should mean that usage is relatively unaffected by changes in these variables. Examples are the capacity for a major port to vary its charges with little effect on freight volumes and the limited impact of variations in income levels on a gas distribution network’s revenues.
I N E L A S T I C D E M A N D
A low marginal cost of each additional use of the asset, so that as the asset is utilized more and more, the average cost of use continues to decline. Although there are very few assets for which this condition always holds, this tends to apply over a wide range of feasible utilization scenarios for many infrastructure assets. For example, each additional vehicle to use a tollroad incurs a very low marginal cost, as does each additional user of an electricity network.
E C O N O M I E S O F S C A L E
The ability to remain in service for years or decades with expenditure on regular maintenance being limited relative to the initial construction cost, before substantial refurbishment or replacement is required. As examples, a port can be in service for many years before large capex is required for further dredging or other substantial work, and the same may be true of a water distribution network.
L O N G U S E F U L L I F E
Many factors can result in these conditions failing to hold now or in the future. For example, developments in technology can create new competitive pressures for an asset by eliminating the need to cross physical distances or creating alternative means of travel. Pricing of substitute services can also affect the position of an infrastructure asset. Consequently, the range of sectors and assets regarded as infrastructure tends to evolve over time.
2 0 1 6 M E R C E R I N V E S T M E N T S P O I N T O F V I E W 5
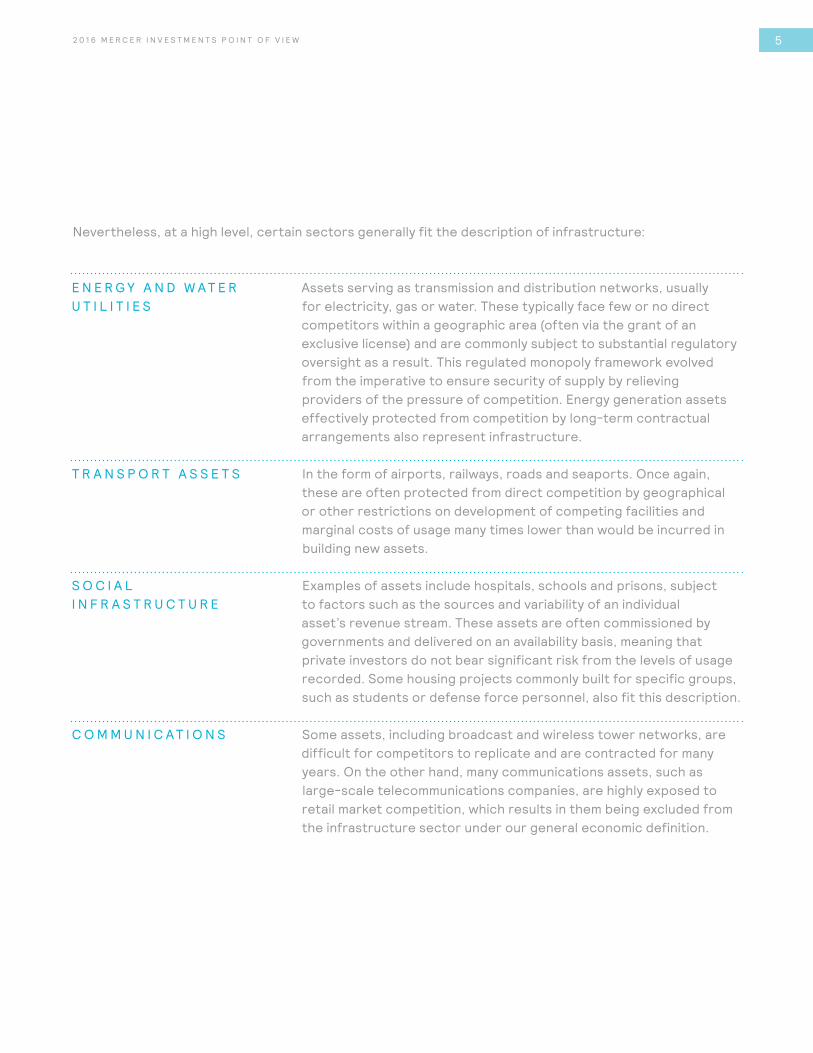
Nevertheless, at a high level, certain sectors generally fit the description of infrastructure:
Assets serving as transmission and distribution networks, usually for electricity, gas or water. These typically face few or no direct competitors within a geographic area (often via the grant of an exclusive license) and are commonly subject to substantial regulatory oversight as a result. This regulated monopoly framework evolved from the imperative to ensure security of supply by relieving providers of the pressure of competition. Energy generation assets effectively protected from competition by long-term contractual arrangements also represent infrastructure.
E N E R G Y A N D W A T E R U T I L I T I E S
T R A N S P O R T A S S E T S In the form of airports, railways, roads and seaports. Once again, these are often protected from direct competition by geographical or other restrictions on development of competing facilities and marginal costs of usage many times lower than would be incurred in building new assets.
Examples of assets include hospitals, schools and prisons, subject to factors such as the sources and variability of an individual asset’s revenue stream. These assets are often commissioned by governments and delivered on an availability basis, meaning that private investors do not bear significant risk from the levels of usage recorded. Some housing projects commonly built for specific groups, such as students or defense force personnel, also fit this description.
S O C I A L I N F R A S T R U C T U R E
Some assets, including broadcast and wireless tower networks, are difficult for competitors to replicate and are contracted for many years. On the other hand, many communications assets, such as large-scale telecommunications companies, are highly exposed to retail market competition, which results in them being excluded from the infrastructure sector under our general economic definition.
C O M M U N I C A T I O N S

I N F R A S T R U C T U R E — A P R I M E R6
I N V E S T M E N T P E R S P E C T I V E
Infrastructure assets typically share some similar financial characteristics:
Highly visible and predictable revenues, whether because of regulation, contractual agreements or relatively unchanging usage patterns under a wide range of economic scenarios. The different types of revenue profiles are discussed below.
S T E A D Y R E V E N U E P R O F I L E
Operating expenses comprising a low percentage of asset revenues, with the result that EBITDA margins are high (commonly in the range of 50%–80%) when compared to many other commercially operated businesses. This provides assets substantial financial flexibility with which to manage items, including capital expenditure (capex) and interest costs.
H I G H E B I T D A M A R G I N
“Lumpy” capex profiles whereby spend is often project-based and irregular, which contrasts with many businesses that have more steady, ongoing needs.
C A P E X
Infrastructure assets commonly sustain relatively high debt levels because of their steady revenue streams, high EBITDA margins and predictable capex profiles. This is often reflected in EBITDA multiples with debt that is higher than the debt that is associated with other businesses.
L E V E R A G E A N D I N T E R E S T C O S T S
Some assets have more inflation linkage than others, which is predominantly a function of underlying revenue specifications under concession or usage agreements, regulatory frameworks or the like.
R E V E N U E S T R U C T U R E S A N D R I S K D R I V E R SInfrastructure assets are commonly defined in terms of their revenue streams:
These are the most predictable revenue streams. Provided that an asset is in the required condition and made available (in a manner consistent with criteria specified in the concession agreement), under this revenue structure private investors will receive the projected revenue from the counterparty that commissioned the asset. If the asset is not adequately maintained or available, revenues are subject to abatements that result in revenue reductions according to a schedule contained within the agreed terms. Social infrastructure assets often have availability-based revenue streams.
A V A I L A B I L I T Y

2 0 1 6 M E R C E R I N V E S T M E N T S P O I N T O F V I E W 7
Under this structure assets are subject to government regulation of matters such as consumer prices, economic returns earned by investors and the quality of the service provided by the assets. Energy and water utilities are typically regulated, but details of the regulation can vary substantially between jurisdictions, with direct consequences for revenue and cash flow.
R E G U L A T E D
Assets can benefit from steady revenue streams as a result of contracts signed for the service provided. These contracts are typically with private-sector counterparties, bringing consequent counterparty credit risk. Indeed, for some of these assets, counterparty credit risk may be the most material risk. Underlying contract structures vary by asset but tend to provide an increased degree of revenue visibility relative to a per-use charging structure (returned to below). Assets used in energy generation, energy storage and communications are examples that are commonly highly contracted.
C O N T R A C T E D
These revenue streams vary with asset usage. Transportation assets are commonly financed by user charges that are incurred for every instance of use. Assets such as toll roads, seaports and airports commonly levy charges for usage that are minor compared with the overall cost of usage to the consumer (after taking account of all costs faced by users). Some assets, such as metropolitan airports, are exposed only to relatively limited fluctuations in patronage levels under a wide range of scenarios, whereas others, such as regional airports, are more highly exposed. Whereas some assets are exposed to broad GDP and population growth rates, others are more exposed to trends within certain user segments, such as the leisure travel market, which can be cyclical because of the discretionary nature of leisure travel.
P A T R O N A G E ( U S A G E )
Revenue streams are dependent on current market prices for their services. Power-generation facility revenues that are uncontracted are typically merchant-based. Merchant revenue is the most variable of all the above streams.
M E R C H A N T

I N F R A S T R U C T U R E — A P R I M E R8
O T H E R R I S K D R I V E R SSome other major factors commonly increase or lower an infrastructure asset’s risk profile, relative to that of essentially similar assets:
Are necessarily elevated because of the high profile nature of many assets. Shifts in regulation and policy pose opportunities (increased privatization, greater scope for private financing and a pipeline of new projects in some regions) but also threats (adverse changes to regulation, tariff and concession adjustments).
P O L I T I C A L A N D R E G U L A T O R Y R I S K S
Offers the prospect of elevated equity returns, but if it is not sized and more generally aligned with the earnings profile of the asset itself, it can introduce a heightened risk of substantial losses for investors. An asset’s capacity to service its debt under a wide range of plausible operating conditions, and interest rate and exchange rate scenarios, is critical. In addition, where refinancing risk exists it should be mitigated through actions such as diversifying debt maturities, well in advance of any financing becoming critical.
L E V E R A G E
A further determinant of risk profile is the stage of asset maturity:
Are those where development plans have not yet been advanced materially, although the project sponsor has taken the in-principle or policy decision to proceed with the development. Consequently, there are typically risks with regard to satisfying planning- approval requirements.
Are those for which plans have been developed and approved, but construction is yet to begin. Consequently, the construction phase remains, with risks that are peculiar to that phase, before the asset will become operational. Even after operations begin, initial revenues may be uncertain for volume-dependent assets because of the “ramp-up risk” associated with early usage levels.
E A R LY S T A G E G R E E N F I E L D A S S E T S
L A T E - S T A G E G R E E N F I E L D A S S E T S
Are currently operating, revenue-generating businesses that may still have scope to expand further with the aid of significant capex, but any expansion would be expected to be incremental to the existing business rather than represent new business activities.
B R O W N F I E L D A S S E T S

2 0 1 6 M E R C E R I N V E S T M E N T S P O I N T O F V I E W 9
Assets are commonly grouped according to their overall risk profile, as illustrated in Figure 1. In general, infrastructure assets exhibit less risk than typical private equity investments in companies engaged in greater competition, with less predictable revenues and costs. Infrastructure assets exhibit greater operating risk than many forms of real estate, because the former are operating businesses, but also tend to be less exposed to the direct effects of market cycles, at least insofar as direct revenues are concerned. Nevertheless, it is difficult to make definitive statements in this regard given the diversity of both asset classes.
Infrastructure assets exhibit less risk than private equity investments and display greater operating risk than many forms of real estate.
F I G U R E 1 : I N F R A S T R U C T U R E R I S K P R O F I L E
R I S K P R O F I L E T Y P E O F A S S E T S R E T U R N S
Core Brownfield assets in social infrastructure; regulated utilities; mature toll roads in stable economies; some mature airports in developed countries; monopolistic contracted assets with long-term contract profiles and high renewal rates
Focus on income
Core Plus Brownfield plus some growth
Less monopolistic contracted assets and patronage assets that have a material growth or expansion orientation
Mix of income plus growth
Opportunistic Development and/or emerging markets
Assets in emerging markets; assets in construction (greenfield) phase; assets that are highly growth-oriented and more akin to private equity
Focus on growth
I N F R A S T R U C T U R E — A P R I M E R10
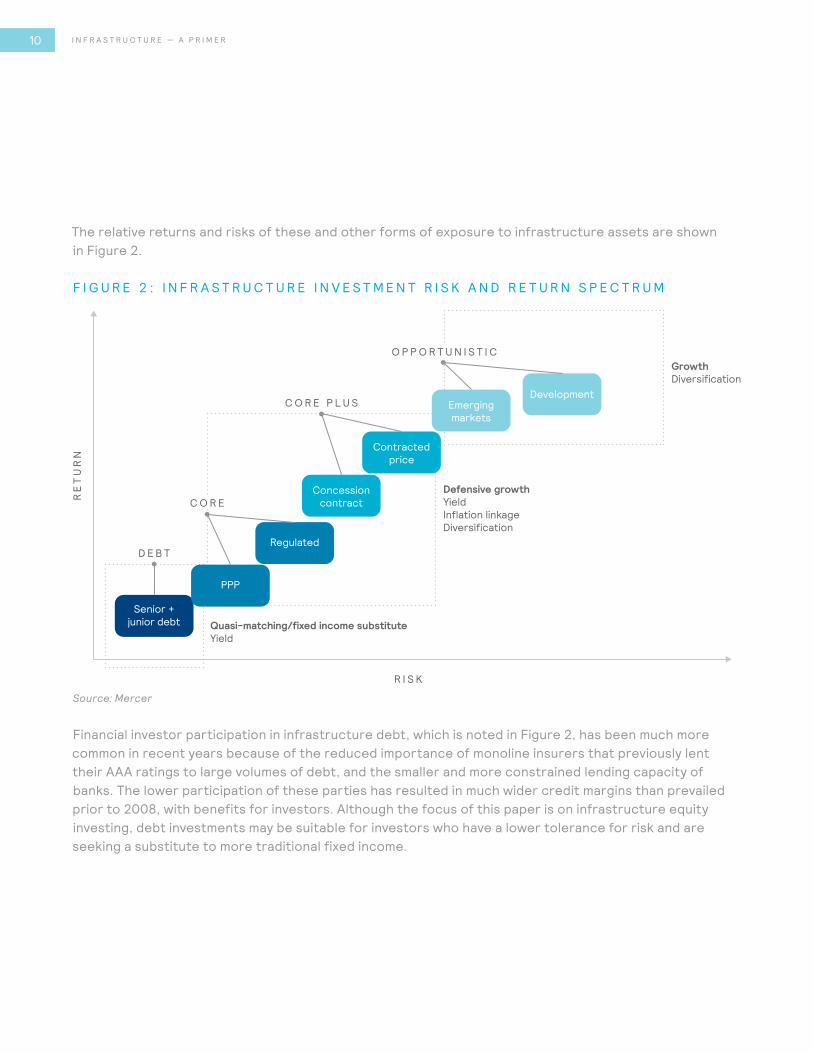
The relative returns and risks of these and other forms of exposure to infrastructure assets are shown in Figure 2.
F I G U R E 2 : I N F R A S T R U C T U R E I N V E S T M E N T R I S K A N D R E T U R N S P E C T R U M
Senior + junior debt
PPP
Regulated
Concessioncontract
Contractedprice
Emergingmarkets
Development
D E B T
C O R E
C O R E P L U S
O P P O R T U N I S T I C
RE
TU
RN
R I S K
Quasi-matching/fixed income substituteYield
Defensive growthYieldInflation linkageDiversification
GrowthDiversification
Source: Mercer
Financial investor participation in infrastructure debt, which is noted in Figure 2, has been much more common in recent years because of the reduced importance of monoline insurers that previously lent their AAA ratings to large volumes of debt, and the smaller and more constrained lending capacity of banks. The lower participation of these parties has resulted in much wider credit margins than prevailed prior to 2008, with benefits for investors. Although the focus of this paper is on infrastructure equity investing, debt investments may be suitable for investors who have a lower tolerance for risk and are seeking a substitute to more traditional fixed income.

2 0 1 6 M E R C E R I N V E S T M E N T S P O I N T O F V I E W 11
V A L U A T I O N T R E N D SAlthough Enterprise Value (EV)-to-EBITDA valuation multiples have their weaknesses, they are commonly reported as a consequence of their dominance within the broader private markets asset class. Across sectors — and time periods that reflect the evolution of the market leading up to, and in the wake of, the global financial crisis — transaction multiples have seen some moderation in recent years, particularly in transportation assets but also in utilities. Figure 3 shows charts based on public and private transaction data from a range of sources.
F I G U R E 3 : AV E R A G E E B I T D A M U LT I P L E S F O R O E C D C O U N T R I E S
0
5
1 0
1 5
2 0
2 5
0
2
4
6
8
1 0
1 2
1 4
1 6
1 8
2 0
0
5
1 0
1 5
2 0
2 5
P R E 2 0 0 2
AirportsSeaports Roads
0 3.8 13.7 15.4 19.0 19.7 15.7 16.7 14.4 18.1 16.2 13.2
2 0 0 2 – 2 0 0 7 2 0 0 8 – 2 0 1 1 2 0 1 2 – 2 0 1 5 P R E 2 0 0 2
ElectricityGas Water
11.3 11.1 8.8 10.2 10.2 10.4 9.6 10.8 9.4 9.6 9.6 9.4
2 0 0 2 – 2 0 0 7 2 0 0 8 – 2 0 1 1 2 0 1 2 – 2 0 1 5
0
4
2
8
6
1 2
1 0
1 6
1 4
2 0
1 8
Transportation Energy and water
Sources: S&P Capital IQ, supplemented by Mercer market research
OECD = Organisation for Economic Co-operation and Development
I N F R A S T R U C T U R E — A P R I M E R12
ESG issues are very important for infrastructure assets because these are commonly physical assets with large community impacts, and consequently they need to be operated in a professional and transparent manner. The issues are frequently major determinants of the long-term performance of an infrastructure investment and need to be addressed in the investment case. Environmental and social impacts are also commonly important to the level of community support an asset enjoys, which is in turn an important factor influencing its long-term outlook. ESG issues should be among those monitored at the board level, where major investors are usually represented.
E N V I R O N M E N TA L , S O C I A L A N D G O V E R N A N C E C O N C E R N S

2 0 1 6 M E R C E R I N V E S T M E N T S P O I N T O F V I E W 13
T H E M E C H A N I C S O F I N F R A S T R U C T U R E I N V E S T I N G
A successful portfolio construction needs to define geographic allocation; asset revenue and risk profile; acceptable vintage and manager concentration.
B U I L D I N G A P O R T F O L I OEarly in the investment process, an investor should design a portfolio plan that is expected to be consistent with the investor’s infrastructure risk and return objectives, noting that these should, in turn, be consistent with the broader portfolio’s objectives. This should be defined in terms of allocations to factors such as geography, asset revenue profile, asset risk profile, and acceptable vintage and manager concentration, each of which is discussed separately in this paper. A cash flow and investment pacing analysis should also be developed to guide the build-out over time. Once the preferred portfolio and broad investment plan have been defined in these terms, the types of investments to be targeted can be identified. Investments should be made in a consistent, disciplined manner over several years, with allowance for returns of capital and the need for replenishment. This is a complex process and should not be approached without external assistance by any but the most sophisticated and well-resourced investors.
Commitments may be to funds, separate accounts, co-investments and/or standalone direct investments, as discussed further later in this paper. For most investors the implementation and management of an infrastructure portfolio allocation involve a constant process of adding to the portfolio to maintain the exposure. The resources required to do this can be substantial, and this tends to be a key consideration in determining the best route for implementation. Some large plan sponsors manage their portfolios in-house, whereas most others opt to outsource implementation to third parties. Below we outline key risk factors investors should be aware of and potential mitigation tools.
Vintage YearThe timing of investments has an impact on outcomes. That is why diversification by vintage year, the year of investment inception, is important. Macroeconomic conditions, asset pricing, capital market issues and other trends can influence the success of a strategy initiated at a specific point in time. Diversification across time is likely to improve the odds of success.

I N F R A S T R U C T U R E — A P R I M E R14
One important element of vintage year diversification is the disciplined, steady deployment of capital. Market timing can be a challenging and fraught process in the private markets space, both in theory (lagged and imperfect information flows) and in practice (lumpy opportunity set). To build and maintain an allocation are also difficult with only episodic participation. For these reasons, a consistent programmatic approach is likely to be the most successful over the long term.
Manager ConcentrationSpecific factors associated with individual managers can also be material sources of investment risk that need to be managed carefully in any infrastructure investment portfolio — and, more generally, any private markets portfolio. Manager-specific risk exposures are more pronounced in a private markets context because investments acquired cannot easily be liquidated nor managers easily terminated. Among the more prominent manager-specific risks in a private markets context are the following:
• Key-person risk. That is, dependence on a small number of senior individuals responsible for strategy formation and/or execution.
• Wider team turnover and succession management risk. Turnover is generally de-stabilizing and implies corporate memory loss, the loss or erosion of counterparty relationships built up historically and, often, deterioration in the way a firm is perceived by others in the market. All are often negative for a manager’s ability to continue with the successful execution of an established investment strategy.
• Business risk. Other factors can also contribute to the destabilization of an asset management organization — for example, the withdrawal of support from a corporate sponsor or the occurrence of a particular event that tarnishes the reputation thereof. Again, the occurrence of such events can undermine the effectiveness of the firm as an asset manager going forward, to the detriment of investors.
Investors can implement various contractual elements within investment documents to mitigate some of these risks (for example, key person provisions and minimum sponsor commitments to individual funds within Limited Partnership Agreements). However, in our view one of the most effective mitigants of all is diversification. Diversification by manager is an important feature of most consistently successful portfolios.

2 0 1 6 M E R C E R I N V E S T M E N T S P O I N T O F V I E W 15
Investment StrategyThe investment strategies pursued by underlying managers will be an important determinant of final portfolio risk, and commonalities of approach across managers will, in turn, inject commonalities of risk exposure into the final portfolio established. Key strategy elements include the following:
• Geography. Generally, more developed markets offer more stable and dependable political and legal frameworks, through which the rule of law can be more readily relied upon, and currencies with well-established and liquid forward markets. Conversely, developing markets can leave investors more exposed to these risks, increasing the reliance on effective local partnering and currency bets. Specific geographies can also carry risks that will be common across assets — for example, interest rates and regulatory cycles. Individual managers often concentrate on specific geographies where they have developed a local network and degree of specialization.
• Sector. As discussed in the section “Investment Perspective” (page 6), there are a range of different infrastructure sectors, each with their own earnings drivers and risk characteristics. Specific managers will tend to focus on particular sectors where they have developed expertise.
• Asset management approach. Managers differ in the level of direct responsibility they assume for asset management versus their reliance on asset-level company management teams. The suitability of a manager’s approach to its targeted assets is an important consideration, because some assets require more active management than others.
Again, effective portfolio construction seeks to target a mix of strategies that are aligned to the targeted risk and return profile and other investment characteristics1 for the portfolio as a whole and achieve an appropriate degree of diversification on a look-through basis.
1 For example currency, cash yield, and investment duration.

I N F R A S T R U C T U R E — A P R I M E R16
C A S H F L O W M A N A G E M E N TThe ongoing management of a diversified portfolio involves providing capital to fund new investments and the receipt of returns of capital upon the sale or realization of a portfolio asset. Capital calls issued by funds are typically due upon five to 10 days’ notice. A closed-end fund’s capital calls will be issued irregularly over its three-to-five-year investment period. Thereafter, further capital calls will be issued mainly for follow-on investments, fees and expenses. Investors should hold adequate capital in relatively liquid securities to keep frictional costs to a minimum.
V A L U A T I O NPeriodic fund valuations are supplied by managers to investors. Valuations of individual underlying assets should be updated in a timely manner by managers. Under the most rigorous valuation processes, the full range of material assumptions and inputs underlying asset valuations is usually updated annually by an external valuation agent (for example, a leading accounting firm) commissioned by the manager to provide assurance of a high level of independence and impartiality. Valuers commonly use financial models and additional company information supplied by the manager. Against this, and more typically, managers will tend to strike their own asset valuations, which are reviewed at a higher level as part of annual fund account auditing processes.
F E E SInfrastructure fee structures are typically similar to other private markets asset classes but higher than most traditional listed asset classes. A typical fund will charge management fees on either committed capital or invested capital during the investment period. After the investment period, most funds will levy fees on either net invested capital (after allowing for capital returns from redemptions and partial redemptions) or net asset value. Most funds also levy performance fees, which are due if performance exceeds a hurdle rate, and the terms may allow for full catch-up of fees that would have been due to the manager if the hurdle rate had been exceeded

2 0 1 6 M E R C E R I N V E S T M E N T S P O I N T O F V I E W 17
in every period, or they may allow for only partial or no catch-up. The exact provisions can make a significant difference to the overall fee burden. Open-ended funds (more common in markets such as Australia and across some lower risk-focused global strategies) present particular challenges for structuring performance fee arrangements. These funds commonly calculate performance fees based on returns achieved over a rolling multi-year period.
T H E J - C U R V EIn the early years of a fund, the gross returns from a portfolio are often not sufficient to offset fully the fee burden borne by investors. As a result, the net returns are often negative during the earliest portion of a fund’s life. Mapping the IRR2 over time produces a curve that is shaped like the letter J. The “J-curve” is important to understand because negative returns may be had in the short term, as fees are paid and capital has not yet been meaningfully deployed and/or expected investment performance recognized.
The J-curve effect is common across most private market asset classes and is, to a large extent, an inevitable aspect of private market investing in closed-end funds. Against this, investors have various options to help ameliorate this in practice.
One effective way to combat the J-curve is to tap the secondary market to add exposure to more mature funds. Another option is to include open-ended funds within the investment program, although this is generally advisable only for investors with a very long investment horizon given the indeterminate lives thereof. A further option available to larger investors is to co-invest directly in selected assets that a fund invests in, which can involve reduced fees depending on terms agreed with individual managers. An allocation to such assets (by investors with the size and sophistication to tolerate these) in the early years of a program can help offset the potential early impact of new closed-ended commitments on reported returns.
2 Investment performance is measured mainly by internal rate of return (IRR) rather than time-weighted return (TWR) because the former has the advantage that it captures the gain relative to the amount invested and because capital is deployed and paid back over a period of time.

I N F R A S T R U C T U R E — A P R I M E R18
I N V E S T M E N T M O D E SThere is no scope to invest in unlisted infrastructure in a truly passive, indexed manner. Many investors commit to a small number of funds (perhaps as few as one). However, substantial underperformance (or outperformance) is possible, and the illiquid nature of the investments makes an early exit difficult, if not impossible, to achieve. The primary protection against potential underperformance is sufficient due diligence prior to making any investment, combined with effective portfolio construction and diversification.
Funds are typically structured as limited partnerships, and the investment manager determines the timing of the contributions and distributions of capital. Closed-ended funds do not offer redemption provisions. Although open-ended funds do, any redemptions are completed on a best endeavors basis and commonly are achieved only over 12–24 months. A secondary market for such investments exists, but the selling costs (primarily valuation discounts) may be uncomfortably high and the strength of the obligations on managers to sell assets to help fund redemption requests varies with underlying fund terms. Closed-ended funds offer relative simplicity in that they will be wound up after a pre-determined term of typically 10–15 years, with potential term extensions thereafter, at the option of the general partner and, in some cases, limited partners. At the same time, there are also funds (including some debt funds) with significantly longer terms, and there are also a limited number of open-ended funds in the market that have no specified end date.
Investors can leverage the expertise of their managers by co-investing in assets alongside funds to which they have committed. Co-investments can be an important way for larger and more sophisticated investors to expand a portfolio by allocating more to particularly attractive assets. However, investors should understand why a manager is seeking co-investors. If, for example, the manager is offering co-investment in order to pursue an asset it considers carries greater risk than the manager would usually pursue, but still constrain its own fund’s exposure thereto, investors need to take this into account in their co-investment decision. Managers generally do not disclose the track record of co-investments they have sourced, on the grounds that these investments reflect their investors’ rather than their own decisions. Investors considering co-investments should be aware of this and should have internal or independent external resources to analyze these proposals from managers thoroughly.

2 0 1 6 M E R C E R I N V E S T M E N T S P O I N T O F V I E W 19
Separately managed accounts (SMAs) are gaining more favor with very large investors who prefer to access the expertise of managers but do not wish to hold their investments within a commingled fund structure. In this way, investors can have full control over the most important decisions regarding their investment, such as if and when to sell as well as the management terms negotiated with the manager. Managers commonly set minima for equity SMAs of US$500 million or more, albeit lower minima are common in the case of infrastructure debt.
Generally, SMAs will be required to rank behind pre-existing pooled funds raised by managers under formal firm-wide allocation policies in place. In considering any manager appointment, investors should receive confirmation of the manager’s process for allocating investments to vehicles and investors.
Many direct infrastructure investments have also been completed by highly sophisticated and large financial investors. Investors considering these options, as with any other modes of investment, are likely to record consistently better outcomes if their due diligence is as rigorous as possible.
L I Q U I D I T YA lack of liquidity in unlisted infrastructure poses a challenge for some potential investors. Timelines for the sale of stakes in unlisted assets can vary substantially and commonly need to be lengthy in order to identify the most attractive counterparties. A typical fund will have an investment period of three to five years, during which the capital will be contributed for new investments on demand. Proceeds from realizations are returned to investors at the discretion of the manager of the fund, subject to the governing documents.
If an investor in a fund requires liquidity, the primary option is to sell on the secondary market. Such transactions may occur at net asset value for top fund managers, but less-well-known managers or less-well-funded interests will often sell at a discount to carrying value. During the global financial crisis, sales of the latter types of interests might have required a discount of as much as 50%, but in a bull market, high-quality assets will sell at minor discounts (if at all) to net asset value.

I N F R A S T R U C T U R E — A P R I M E R20
T O L E R A N C E F O R C O M P L E X I T YInfrastructure investing is complex from both governance and operational standpoints. Keeping a portfolio invested requires regular investment decisions to commit new capital to replace those investments that are being realized. This requires some meaningful organizational commitment to the process of investing in the asset class. Understanding one’s governance bandwidth can help determine the appropriate investment mode. Investors with low tolerance for complexity may consider fund-of-fund and advisory options that enable acquisition of a diversified portfolio of high-quality infrastructure exposures while relying on specialists to select the individual infrastructure funds for investment.
Another area of complexity that may also be addressed through delegation is the operational overhead associated with managing the portfolio. A single fund will generate a significant number of capital calls and distributions over its life. A typical fund will issue two to four capital calls per year during its investment period and may issue separate calls for management fees. Distributions tend to be more numerous than calls, as partial liquidity events for an investment are common. Valuations are provided 30 to 60 days after the end of a quarter. Audits are made more complex due to the lack of market pricing for the assets.
G O V E R N A N C E Infrastructure investors must have access to sufficient resources to manage a portfolio. This may require staff to research potential investments and monitor existing ones. Pursuing investments will have a cost for travel and legal expenses. Meanwhile, the importance of governance at the individual fund level is commonly overlooked, with insufficient attention paid to the effective negotiation of investor rights via side letters and direct fund documentation, and the subsequent effective enforcement thereof. The use of funds-of-funds as a form of outsourced implementation is typically driven by such governance considerations.
If one requires a specialist advisor, this can have a meaningful cost as well. Besides capital costs, a time commitment is necessary. Investment committees need to allocate sufficient time for reviewing the investments or for creating alternative approval processes.
Infrastructure investing is complex from both governance and operational standpoints.

2 0 1 6 M E R C E R I N V E S T M E N T S P O I N T O F V I E W 21
The flexibility to make decisions between formal board meetings is an important aspect of dealing effectively with the portfolio management challenges posed by illiquid asset investing. Some investors do not have the governance bandwidth to implement investment programs that require such a time commitment, or they are otherwise uncomfortable with delegating such decisions to a sub-committee or internal staff. The result has been a growth in the number and variety of outsourced implementation options.
D U E D I L I G E N C EAfter effective diversification, a thorough due diligence process generally is the most effective form of risk mitigation in private markets. Due diligence should be both a quantitative and a qualitative process. The pattern recognition of having reviewed many similar investments, targeting fundamentally similar infrastructure assets, is important for being an effective analyst. The analysis that separates the great opportunity from the merely good and that is able to uncover potentially fatal flaws in a well-crafted investment proposal is usually based on insights and judgment of the investment professionals involved.
A C C E S S One area where new investors in funds are at a disadvantage versus those that have been investing in the asset class for a long time is access to higher-quality fund managers. Managers that have been successful performers across multiple funds have limited need to seek new investors. Existing investors in their prior funds are often willing to fill whatever capacity becomes available. The easiest solution to such a situation is to hire an advisor to assist in gaining access or to outsource implementation to an advisor or fund-of-funds manager to gain access to high-performing managers. The alternative route is to seek out tomorrow’s high-performing manager that is accessible today, chip away at access to “closed” fund managers one finds highly appealing, and be able to react quickly when opportunities arise to add such firms to one’s portfolio. Keeping the quality bar high for adding new managers is very important. Dipping into the pool of second- or third-tier managers and hoping for better results is generally a poor strategy.
I N F R A S T R U C T U R E — A P R I M E R22
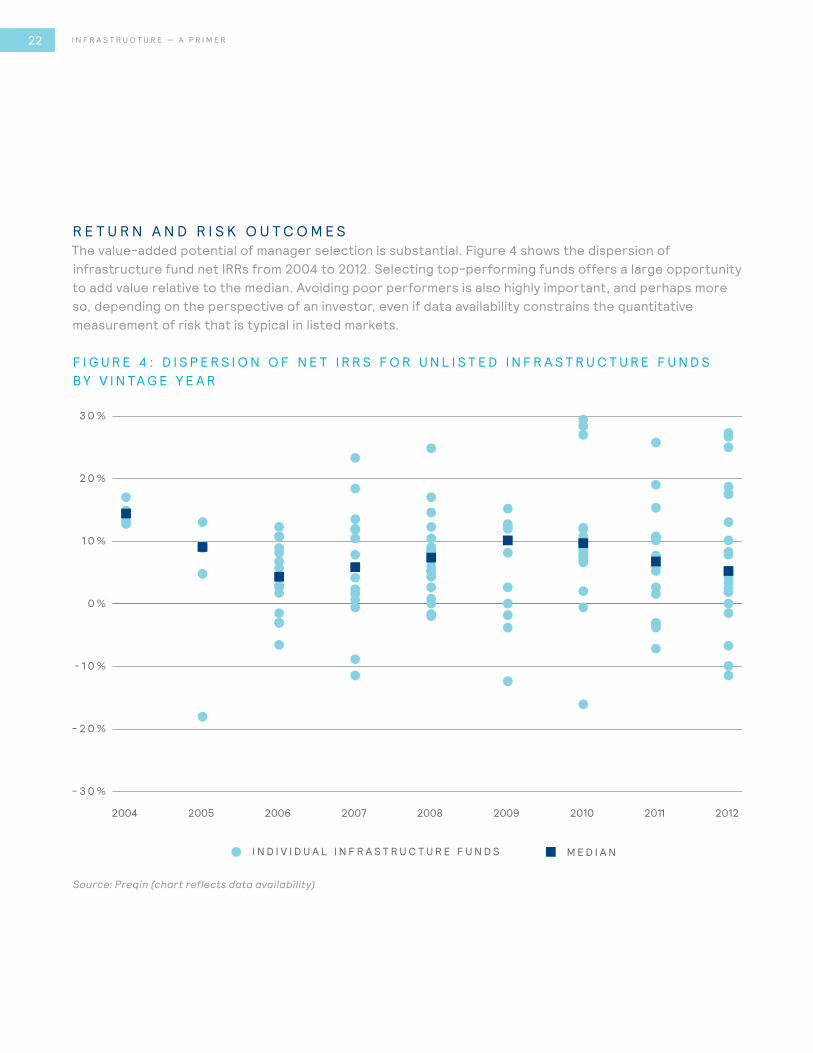
R E T U R N A N D R I S K O U T C O M E SThe value-added potential of manager selection is substantial. Figure 4 shows the dispersion of infrastructure fund net IRRs from 2004 to 2012. Selecting top-performing funds offers a large opportunity to add value relative to the median. Avoiding poor performers is also highly important, and perhaps more so, depending on the perspective of an investor, even if data availability constrains the quantitative measurement of risk that is typical in listed markets.
F I G U R E 4 : D I S P E R S I O N O F N E T I R R S F O R U N L I S T E D I N F R A S T R U C T U R E F U N D S B Y V I N TA G E Y E A R
- 2 0 %
- 3 0 %
- 1 0 %
0 %
2 0 %
1 0 %
3 0 %
I N D I V I D U A L I N F R A S T R U C T U R E F U N D S M E D I A N
2004 2005 2006 2007 2008 2009 2010 2011 2012
Source: Preqin (chart reflects data availability)

2 0 1 6 M E R C E R I N V E S T M E N T S P O I N T O F V I E W 23
The compound annual return of unlisted infrastructure has been impressive, as shown in Figure 5. This cohort comprises Australian domiciled managers, for whom some of the longest track record information is available globally. As open-ended funds, the cohort members are also required to set net asset values at least annually based on independently sourced asset valuations.
F I G U R E 5 : A N N U A L I Z E D R E T U R N S O F A S S E T C L A S S E S O V E R 2 1 Y E A R S
0
2
4
6
8
1 0
1 2
1 4
0
4
2
6
8
1 2
1 0
1 4
A U S T R A L I A NU N L I S T E D
I N F R A S T R U C T U R E
A U S T R A L I A NE Q U I T I E S
A U S T R A L I A NB O N D S
A U S T R A L I A NC A S H
A U S T R A L I A NL I S T E D
P R O P E R T Y
A U S T R A L I A ND I R E C T
P R O P E R T Y
G L O B A LE Q U I T I E S ( H )
G L O B A LB O N D S ( H )
Sources: Barclays, Bloomberg, Mercer, FTSE, MSCI, S&P3
3 Mercer Unlisted Infrastructure Index, S&P/ASX 300 (All Ordinaries before 1/4/2000), Bloomberg AusBond Composite Bond, Bloomberg AusBond Bank Bill Index, S&P/ASX 300 A-REIT TR, Mercer Unlisted Property (GAV), FTSE Developed Core Infrastructure 50/50 Hedged Net (UBS Global Infrastructure & Utilities 50/50 TR Hedged before 1/4/2015), MSCI World ex-Australia Hedged A$ and Barclays Capital Global Aggregate Hedged A$

I N F R A S T R U C T U R E — A P R I M E R24
B E N C H M A R K I N GThere is little agreement among investors regarding the most appropriate way to benchmark an infrastructure equity portfolio . There are forward-looking benchmarks, such as projected inflation plus a margin, or the long-term government bond yield plus a margin. The former is more common. Investors would, at the same time, acknowledge that actual investment returns are not expected to move in line with the Consumer Price Index (CPI) or the bond yield other than over the long run.
Backward-looking benchmarks used to assess actual performance include actual fund returns collated by a provider such as Preqin, listed infrastructure indices (noting there are several), as well as those based on actual CPI or bond returns plus a margin. In practice, the choice of benchmark typically is determined by a trade-off between direct relevance and ease of use. The most relevant benchmark for a given investment or a portfolio is generally viewed to be the returns achieved by a selection of the most comparable funds, but consistently obtaining this information can be difficult.
As a practical matter, Mercer Private Markets favors the use of the following when benchmarking returns:
• Benchmarks that are tailored to individual portfolios given their objectives and composition, in light of the wide variation observed across portfolios
• To the extent that individual funds are benchmarked, use of direct peer group comparisons against constituents of the same vintage cohort
• A listed infrastructure index comprising stocks of a broadly similar nature to those being targeted by the strategy in question (subject to acknowledging the listed market beta of these indices, making them an imperfect proxy for unlisted investing) — importantly, Mercer Private Markets measures the performance thereof in the form of a Public Market Equivalent, effectively simulating the IRR that would have resulted from the cash flows associated with the specific unlisted investment being benchmarked had they instead been invested in the listed index
There is little agreement regarding the most appropriate way to benchmark an infrastructure equity portfolio.

2 0 1 6 M E R C E R I N V E S T M E N T S P O I N T O F V I E W 25
Infrastructure offers the potential to add diversification to a portfolio. A well-managed infrastructure program can deliver exposure to assets that in most circumstances are lowly correlated with traditional asset classes.
Infrastructure assets are distinct from others in private markets as a consequence of their risk profile. The size of an allocation within an overall portfolio is often constrained first and foremost by portfolio liquidity requirements in combination with any preferences to invest in other illiquid assets also. Investors have many ways to gain access to these assets, and the appropriate modes for doing so vary with individual investor circumstances. Specialist knowledge of infrastructure assets and investment modes is important to building a successful portfolio, beginning with a detailed plan for portfolio development before individual investments are contemplated. Portfolio diversification, in a variety of respects, and initial due diligence by experienced analysts are key mitigants of investment risk associated with infrastructure, as in other parts of private markets.
T H E O P T I M A L U S E O F I N F R A S T R U C T U R E
An infrastructure program has a low correlation with traditional asset classes, implying a distinct risk profile than other private markets.
I N F R A S T R U C T U R E — A P R I M E R26
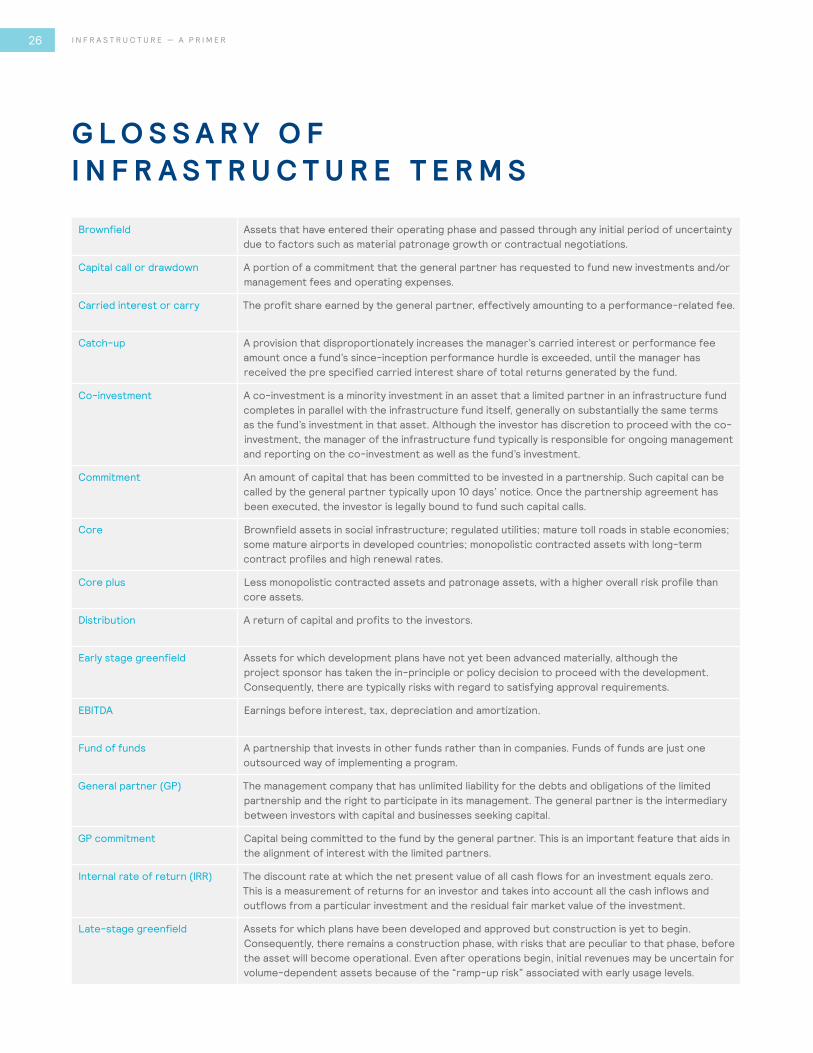
G L O S S A R Y O F I N F R A S T R U C T U R E T E R M S
Brownfield Assets that have entered their operating phase and passed through any initial period of uncertainty due to factors such as material patronage growth or contractual negotiations.
Capital call or drawdown A portion of a commitment that the general partner has requested to fund new investments and/or management fees and operating expenses.
Carried interest or carry The profit share earned by the general partner, effectively amounting to a performance-related fee.
Catch-up A provision that disproportionately increases the manager’s carried interest or performance fee amount once a fund’s since-inception performance hurdle is exceeded, until the manager has received the pre specified carried interest share of total returns generated by the fund.
Co-investment A co-investment is a minority investment in an asset that a limited partner in an infrastructure fund completes in parallel with the infrastructure fund itself, generally on substantially the same terms as the fund’s investment in that asset. Although the investor has discretion to proceed with the co-investment, the manager of the infrastructure fund typically is responsible for ongoing management and reporting on the co-investment as well as the fund’s investment.
Commitment An amount of capital that has been committed to be invested in a partnership. Such capital can be called by the general partner typically upon 10 days’ notice. Once the partnership agreement has been executed, the investor is legally bound to fund such capital calls.
Core Brownfield assets in social infrastructure; regulated utilities; mature toll roads in stable economies; some mature airports in developed countries; monopolistic contracted assets with long-term contract profiles and high renewal rates.
Core plus Less monopolistic contracted assets and patronage assets, with a higher overall risk profile than core assets.
Distribution A return of capital and profits to the investors.
Early stage greenfield Assets for which development plans have not yet been advanced materially, although the project sponsor has taken the in-principle or policy decision to proceed with the development. Consequently, there are typically risks with regard to satisfying approval requirements.
EBITDA Earnings before interest, tax, depreciation and amortization.
Fund of funds A partnership that invests in other funds rather than in companies. Funds of funds are just one outsourced way of implementing a program.
General partner (GP) The management company that has unlimited liability for the debts and obligations of the limited partnership and the right to participate in its management. The general partner is the intermediary between investors with capital and businesses seeking capital.
GP commitment Capital being committed to the fund by the general partner. This is an important feature that aids in the alignment of interest with the limited partners.
Internal rate of return (IRR) The discount rate at which the net present value of all cash flows for an investment equals zero. This is a measurement of returns for an investor and takes into account all the cash inflows and outflows from a particular investment and the residual fair market value of the investment.
Late-stage greenfield Assets for which plans have been developed and approved but construction is yet to begin. Consequently, there remains a construction phase, with risks that are peculiar to that phase, before the asset will become operational. Even after operations begin, initial revenues may be uncertain for volume-dependent assets because of the “ramp-up risk” associated with early usage levels.

2 0 1 6 M E R C E R I N V E S T M E N T S P O I N T O F V I E W 27
Limited partner (LP) An investor in a limited partnership.
Limited partnership A vehicle whose participants consist of the general partner that manages the infrastructure fund and the limited partners that have committed capital to the fund.
Limited partnership agreement (LPA)
Governing legal agreement for a limited partnership. It specifies the rights and responsibilities of the limited partners and the general partner.
Management fee Fees due to the general partner. Fees are typically calculated as a percentage of committed capital during the investment period and a percentage of remaining capital thereafter.
Opportunistic Assets in emerging markets; assets in construction (greenfield) phase; assets that are highly growth-oriented and more akin to typical private equity investments.
Net IRR % The net IRR earned by an LP to date after management fees and carry. The IRR is based on the realized cash flows, including fees and the valuation of the remaining interest in the partnership.
Preferred return or hurdle Specified return the limited partners receive before the general partner begins to be paid its carried interest. Preferred returns range from 6% to 10%, with most funds having an 8% preferred return.
Secondary Acquiring existing interests in a infrastructure fund from an existing limited partner. Secondary transactions may also consist of direct investments in assets acquired from the original holders.
I M P O R TA N T N O T I C E S
References to Mercer shall be construed to include Mercer LLC and/or its associated companies.
© 2016 Mercer LLC. All rights reserved.
Information contained herein has been obtained from a range of third party sources. While the information is believed to be reliable, Mercer has not sought to verify it independently. As such, Mercer makes no representations or warranties as to the accuracy of the information presented and takes no responsibility or liability (including for indirect, consequential or incidental damages) for any error, omission or inaccuracy in the data supplied by any third party.
No investment decision should be made based on this information without first obtaining appropriate professional legal, tax and accounting advice and considering your circumstances.
Investing involves risk. The value of your investment will fluctuate over time and you may gain or lose money.
MMC Securities LLC is a registered broker dealer and an SEC registered investment adviser. Securities offered through MMC Securities; member FINRA/SIPC, main office: 1166 Avenue of the Americas, New York, New York 10036. Variable insurance products distributed through Marsh Insurance & Investments LLC; and Marsh Insurance Agency & Investments in New York. Mercer, Mercer Investment Consulting, LLC, Mercer Investment Management, Inc., Guy Carpenter, Oliver Wyman, Marsh and Marsh & McLennan Companies are affiliates of MMC Securities.
Download a guide on key index definitions.

For further information, please contact your local Mercer office or visit our website at:www.mercer.com
© 2016 Mercer LLC. All rights reserved. 21735-IC 130716w