Embed Size (px)
Citation preview

Infrasound detector for Apatity group
Asming V.E., Kola Regional Seismological Center,
Apatity, Russia

Layout of Apatity seismic and infrasound groups

Let Fsi - i-th band-pass filtered sample of sensor s i - index of a sample, i=1,Nsamples
s - index of a sensor, s=1,Nsensors
Consider a plain wave arriving from backazimuth andand with an angle to the day surface (tangage angle).
The time delays of the wave arrivals to the array’s sensors are ts(, ) = (Xscos + Yssin) cos / vsound
Expressed in numbers of samples, the delays are is (, ) =Round(ts/h)
Beamforming-style detector of acoustic signals

Consider two kinds of beams for each (, )
stationsN
sisi
FstationsNi
As1
1
sisis
i FMaxM
a) Average beam
b) Maximal beam
In idealized case when (, ) are true parameters of an incident plain wave, all sensors have the same response and there are no noise and signal attenuation due to relief Ai=Mi, otherwise Ai < Mi

Basically we may use the ratio Ai/Mi for detection but there may be uncertainties when M are small. To avoid this we use window averaging of Ai and Mi :
aver
aver
N
iNjij AA
1)1(
aver
aver
N
iNjij MM
1)1(
j
jj MAR
- has a meaning of coherency between recordings at different sensors and can beused as a detector
BUT: amplitudes of a signal can be different at different sensors(up to 1.5 times). The differences depend on a directionof a wave propagation. Probably due to relief.
This can diminish the ratio Rj. If we take smaller values for threshold we significantly increase a number of false alarms.
norm
norm
N
Njjis
siNormsi
F
FF
,
To avoid this we use the following “trick” : we calculate “normalized” recordings
where Nnorm>>Naver
And by NormsiF we compute
NormjR as described above

If to use NormjR as a detector
a new source of false alarms appears when pieces of recordings of very different amplitudes have high coherency
Finally, we decided to use ratios R calculated by both normalizedand non-normalized data. And the detector appeared to be:
NormNormj TrR TrR j
where NormTrTr typically 0.6-0.65 versus 0.75-0.8
and
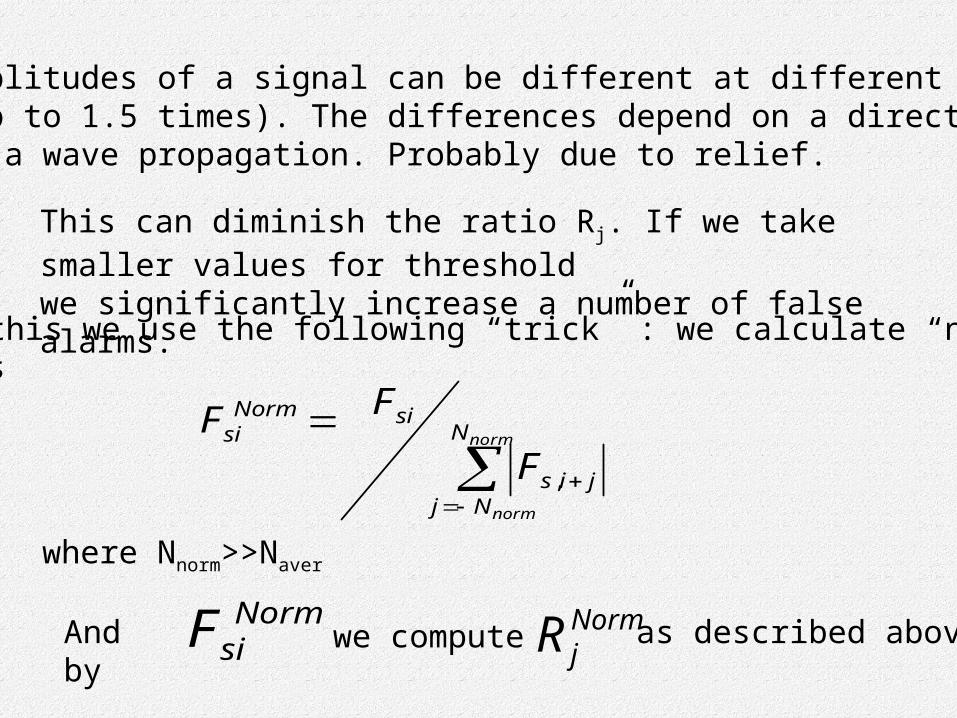
The detector described above does not use amplitudes
Indeed, weak but obviously true events do exist

To separate events by signal-to-noise ratio we implement astatistical algorithm to noise level estimation by average amplitude
jA
Estimated noise level

Implementation for Apatity array
A PC program which can process CSS 3.0 data or a data streamfrom Apatity array

Band-pass filter : 1-5 HzLength of averaging Naver : 20 samples (0.5 sec)Length of normalizing Nnorm : 100 samples (2.5 sec)Tangage angles () : 0, 20, 40, 60 degreesAzimuth angles () : 0-359 degrees, step 1Threshold for initial ratio : 0.6Threshold for norm ratio : 0.75
The detector parameters

Results for 01.12.2005-22.12.20052263 events

464 events with SNR>15
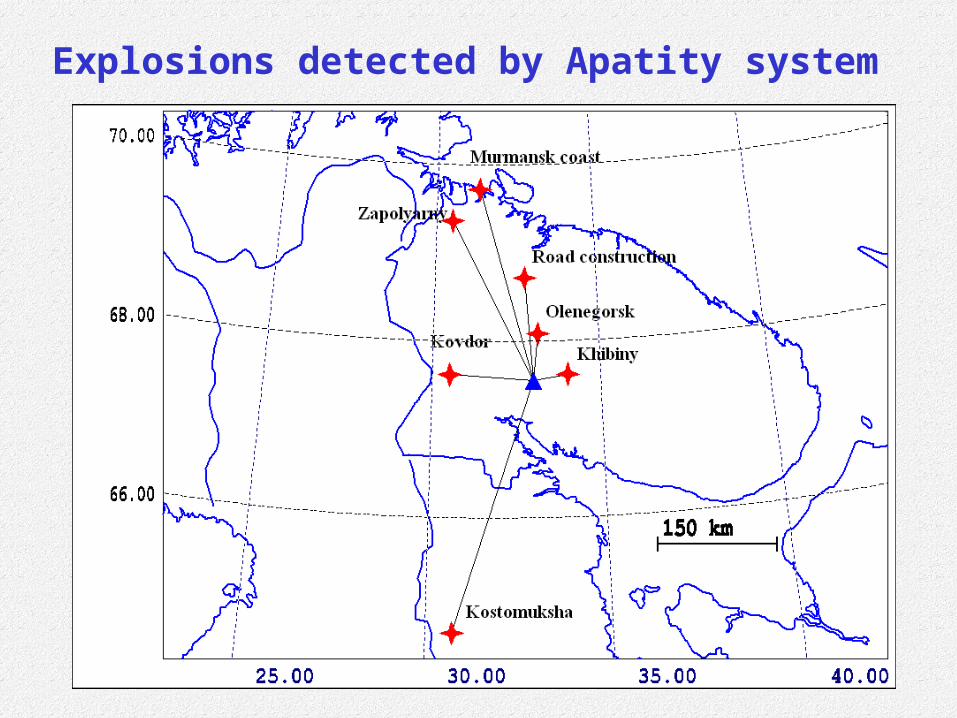
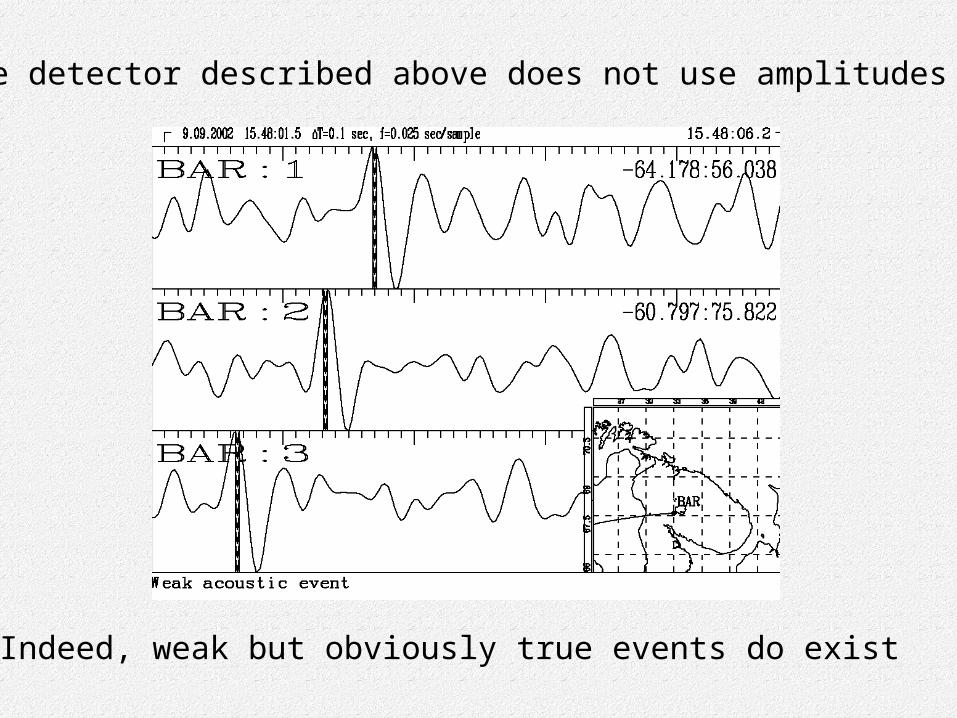
Explosions detected by Apatity system

Typical wave forms of infrasound events
Event from South, band-pass filtered 1-5 Hz

One of the strongest events (SNR=216)

Weak but obviously true event, filtered 1-5 Hz (SNR=10)
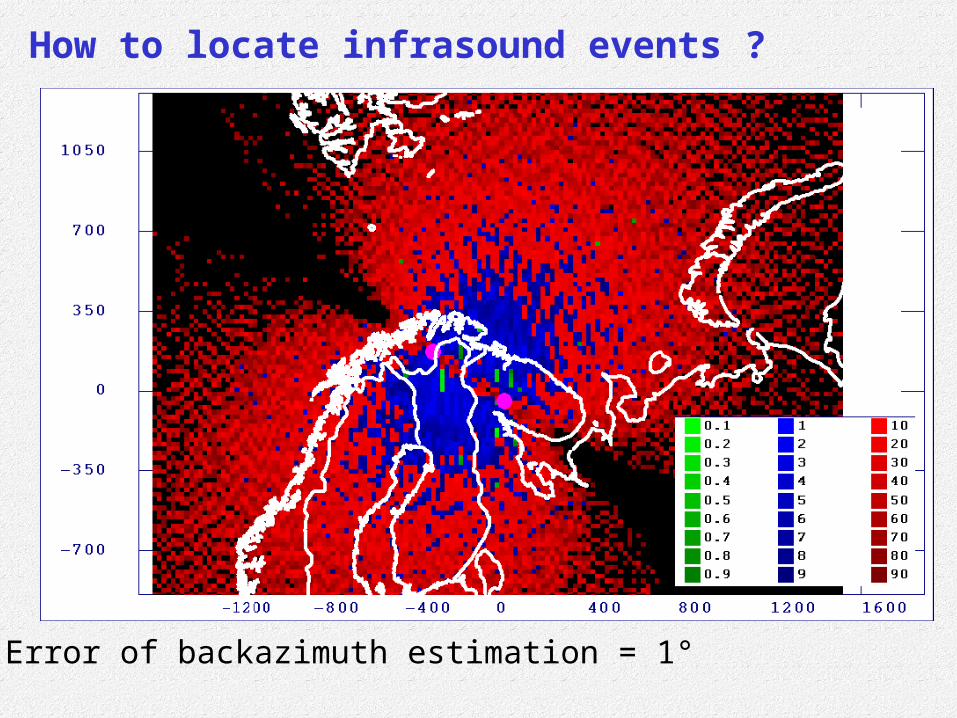
How to locate infrasound events ?
Error of backazimuth estimation = 1°

Error of backazimuth estimation = 2°