Embed Size (px)
Citation preview
Infrared Spectroscopy
! General Theory of IR Spectroscopy
! Overview of the IR spectrometer
! Signal Intensity in an IR Spectrum
! Location of Peaks in an IR Spectrum
! Guide to Analyzing an IR Spectrum
General Theory of IR Spectroscopy Sample IR Spectrum:
! Covalent bonds are not static.
General Theory of IR Spectroscopy
! Nearly any compound possessing covalent bonds will absorb certain frequencies of electromagnetic radiation from the infrared region of the electromagnetic spectrum.
! IR absorption is quantized. This means only select energies are absorbed by a particular molecule.
! Since different molecules absorb different sets of energies, different molecules have different (distinguishable) IR spectra.
General Theory of IR Spectroscopy
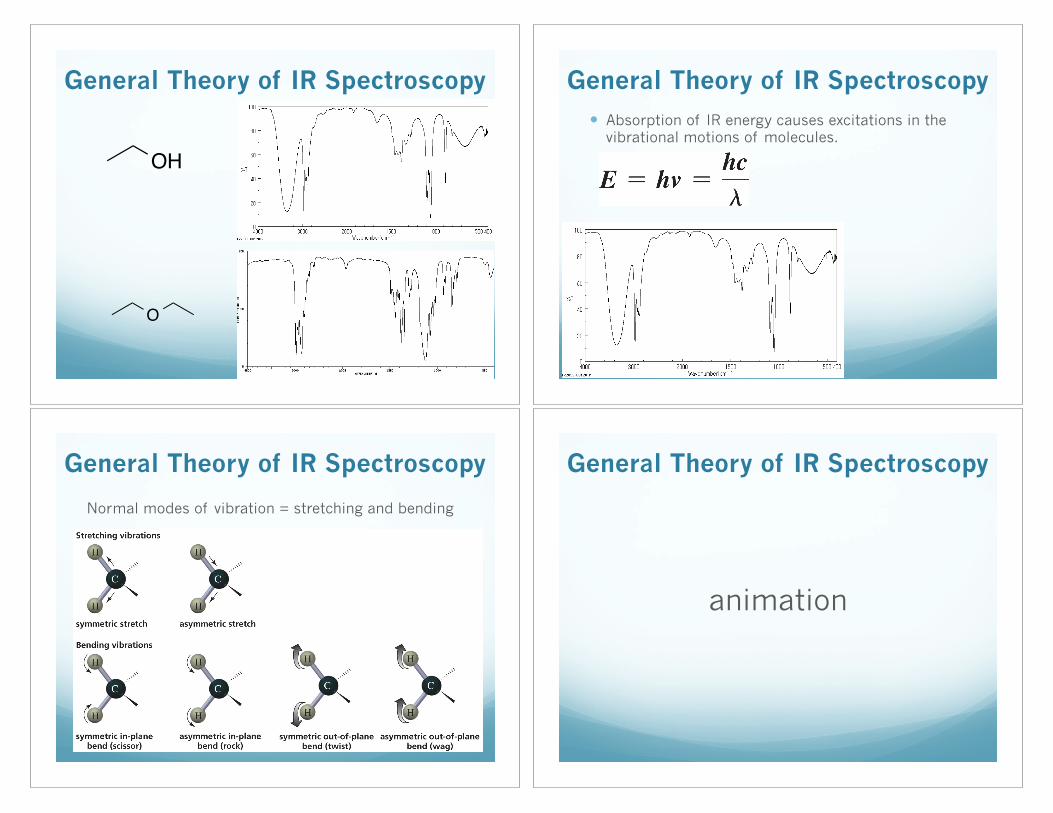
General Theory of IR Spectroscopy
OH
O
! Absorption of IR energy causes excitations in the vibrational motions of molecules.
General Theory of IR Spectroscopy
General Theory of IR Spectroscopy
Normal modes of vibration = stretching and bending
General Theory of IR Spectroscopy
animation
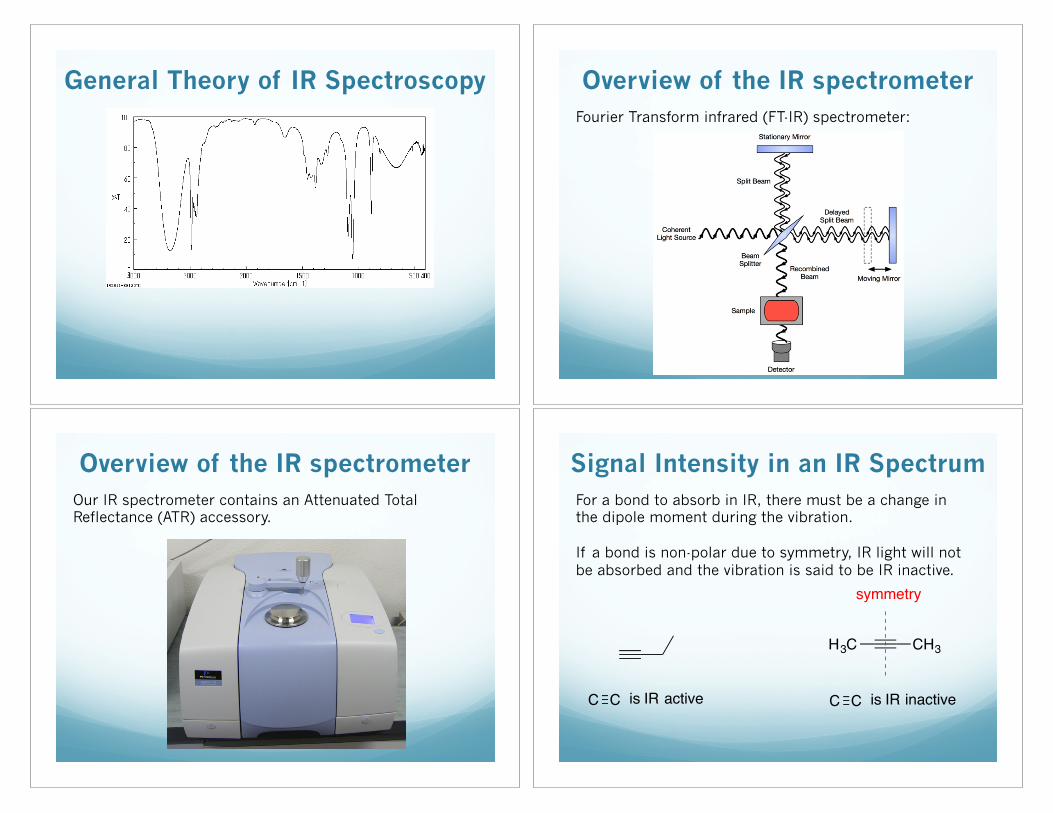
General Theory of IR Spectroscopy Overview of the IR spectrometer Fourier Transform infrared (FT-IR) spectrometer:
Overview of the IR spectrometer Our IR spectrometer contains an Attenuated Total Reflectance (ATR) accessory.
Signal Intensity in an IR Spectrum For a bond to absorb in IR, there must be a change in the dipole moment during the vibration. If a bond is non-polar due to symmetry, IR light will not be absorbed and the vibration is said to be IR inactive.
H3C CH3
CC is IR inactive
symmetry
CC is IR active
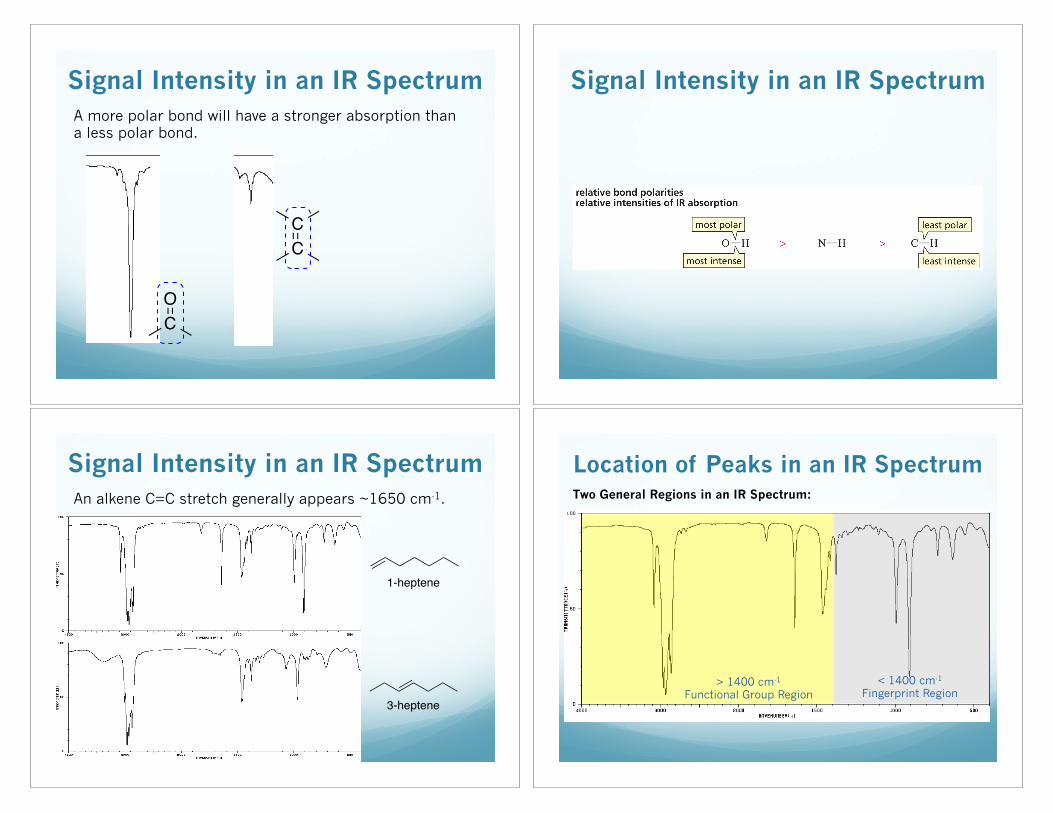
Signal Intensity in an IR Spectrum A more polar bond will have a stronger absorption than a less polar bond.
CO
CC
Signal Intensity in an IR Spectrum
Signal Intensity in an IR Spectrum An alkene C=C stretch generally appears ~1650 cm-1.
1-heptene
3-heptene
Location of Peaks in an IR Spectrum
< 1400 cm-1
Fingerprint Region > 1400 cm-1
Functional Group Region
Two General Regions in an IR Spectrum:
Location of Peaks in an IR Spectrum
Z – H single bond
stretches
More Specific Regions in an IR Spectrum:
Bending vibrations
Single bond stretches
Double bond stretches
Triple bond stretches
400 1000 1500 2000 2500 4000 cm-1
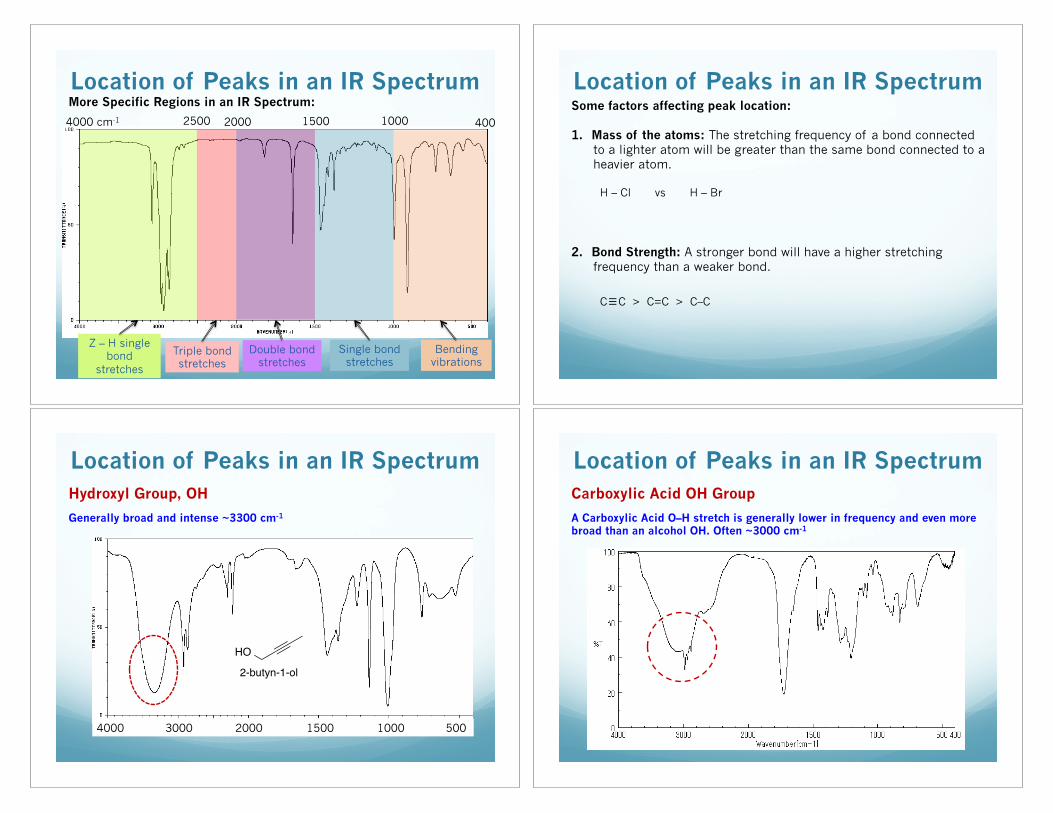
Location of Peaks in an IR Spectrum Some factors affecting peak location: 1. Mass of the atoms: The stretching frequency of a bond connected
to a lighter atom will be greater than the same bond connected to a heavier atom.
2. Bond Strength: A stronger bond will have a higher stretching
frequency than a weaker bond.
H – Cl vs H – Br
C�C > C=C > C–C
Location of Peaks in an IR Spectrum Hydroxyl Group, OH
Generally broad and intense ~3300 cm-1
4000 3000 2000 1500 1000 500
HO
2-butyn-1-ol
Location of Peaks in an IR Spectrum Carboxylic Acid OH Group
A Carboxylic Acid O–H stretch is generally lower in frequency and even more broad than an alcohol OH. Often ~3000 cm-1
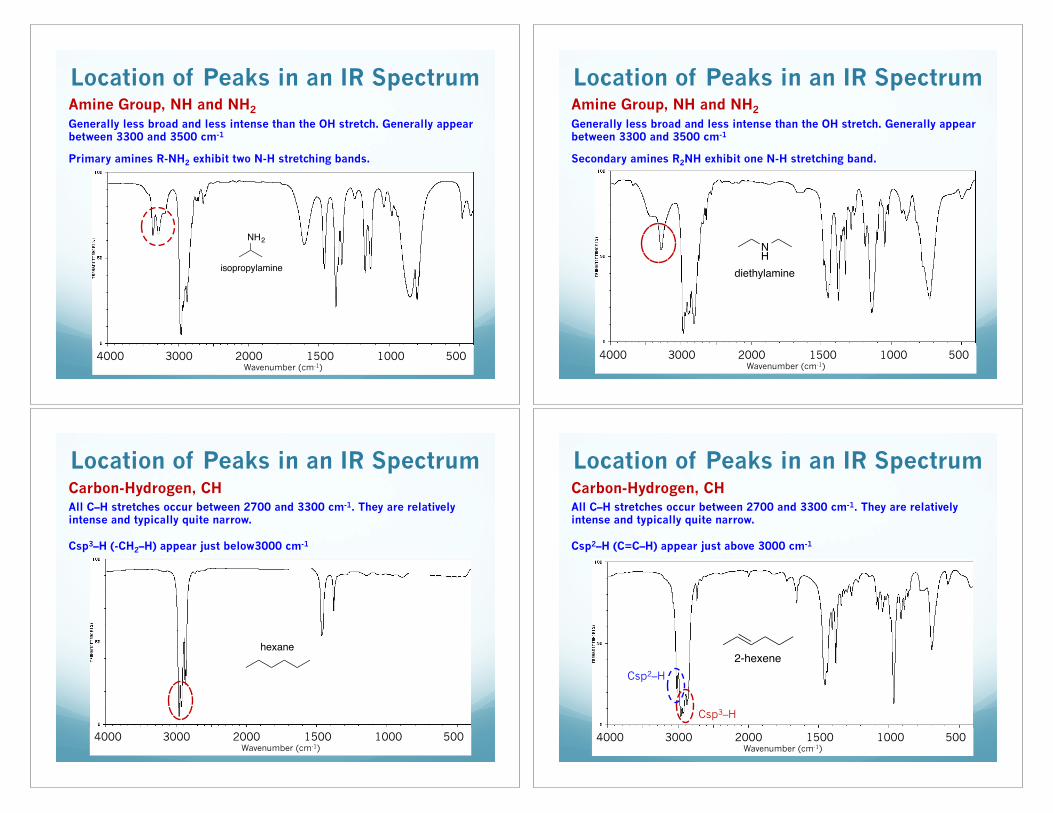
Location of Peaks in an IR Spectrum Amine Group, NH and NH2 Generally less broad and less intense than the OH stretch. Generally appear between 3300 and 3500 cm-1
Primary amines R-NH2 exhibit two N-H stretching bands.
4000 3000 2000 1500 1000 500 Wavenumber (cm-1)
NH2
isopropylamine
Location of Peaks in an IR Spectrum Amine Group, NH and NH2 Generally less broad and less intense than the OH stretch. Generally appear between 3300 and 3500 cm-1
Secondary amines R2NH exhibit one N-H stretching band.
4000 3000 2000 1500 1000 500 Wavenumber (cm-1)
NH
diethylamine
Location of Peaks in an IR Spectrum Carbon-Hydrogen, CH All C–H stretches occur between 2700 and 3300 cm-1. They are relatively intense and typically quite narrow. Csp3–H (-CH2–H) appear just below3000 cm-1
4000 3000 2000 1500 1000 500 Wavenumber (cm-1)
hexane
Location of Peaks in an IR Spectrum Carbon-Hydrogen, CH All C–H stretches occur between 2700 and 3300 cm-1. They are relatively intense and typically quite narrow. Csp2–H (C=C–H) appear just above 3000 cm-1
4000 3000 2000 1500 1000 500 Wavenumber (cm-1)
Csp3–H
Csp2–H
2-hexene
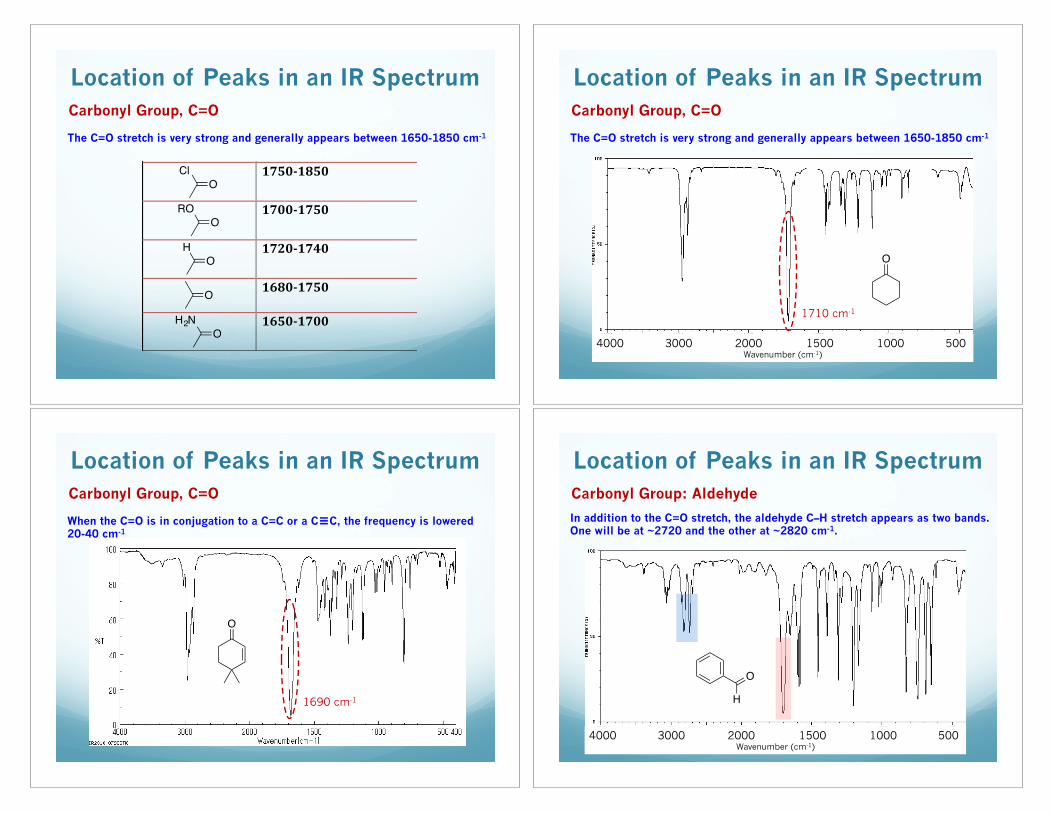
Location of Peaks in an IR Spectrum Carbonyl Group, C=O
The C=O stretch is very strong and generally appears between 1650-1850 cm-1
Characteristic*Infrared*Absorption*Frequencies**
Structural*Unit* Wavenumber,*cm=1* Special*Features*
!3200=3600*(s,*br)* *
!
3300=3500*(m)* R2N%H!=!one!IR!stretch!RNH2!=!two!IR!stretches!
!~3300*(s)* *
!2850=2960*(m)* Look!for!Csp3—H!stretches!just!
below!3000!cm%1!
H%C%H!bending!just!above!1400!cm%1!
%CH3!bending!just!below!~1400!cm%1!
!3000=3100*(m)* Look!for!Csp2%H!stretches!just!above!
3000!cm%1!
!2200=2300*(s)* *
!~2150*(v)* *
Carbonyl*Groups*
!
1650=1850*(s)* Variable!depending!on!the!carbonyl!functionality!(see!below)!
!
1750=1850* !
!
1700=1750* Also!look!for!strong!Csp2—O!stretch!between!1200!and!1300!cm%1!
*
1720=1740* Also!look!for!aldehyde!C—H!stretches!at!~2720!and!~2820!cm%1!
!1680=1750* Generally!around!1720!cm%1;!
Decreased!when!in!conjugation!
!
1650=1700* !
!1600=1700*(v)* !
!
1450=1600*(v)* Look!for!2!or!3!peaks!in!this!region!generally!at!~1600,!~1500,!and!<1500!cm%1!
!Csp3—O:*1000=1100*(m)*Csp2—O:*1200=1300*(s)*
!
** Absorption!strength!abbreviations:!s!=!strong,!m!=!medium,!w!=!weak,!v!=!variable* *
O H
N H NH
H
C H
C H
C H
C N
C C
O
OCl
ORO
OH
O
OH2N
C C
O C
Location of Peaks in an IR Spectrum Carbonyl Group, C=O
The C=O stretch is very strong and generally appears between 1650-1850 cm-1
4000 3000 2000 1500 1000 500 Wavenumber (cm-1)
O
1710 cm-1
Location of Peaks in an IR Spectrum Carbonyl Group, C=O
When the C=O is in conjugation to a C=C or a C�C, the frequency is lowered 20-40 cm-1
1690 cm-1
O
Location of Peaks in an IR Spectrum Carbonyl Group: Aldehyde
In addition to the C=O stretch, the aldehyde C–H stretch appears as two bands. One will be at ~2720 and the other at ~2820 cm-1.
4000 3000 2000 1500 1000 500 Wavenumber (cm-1)
O
H
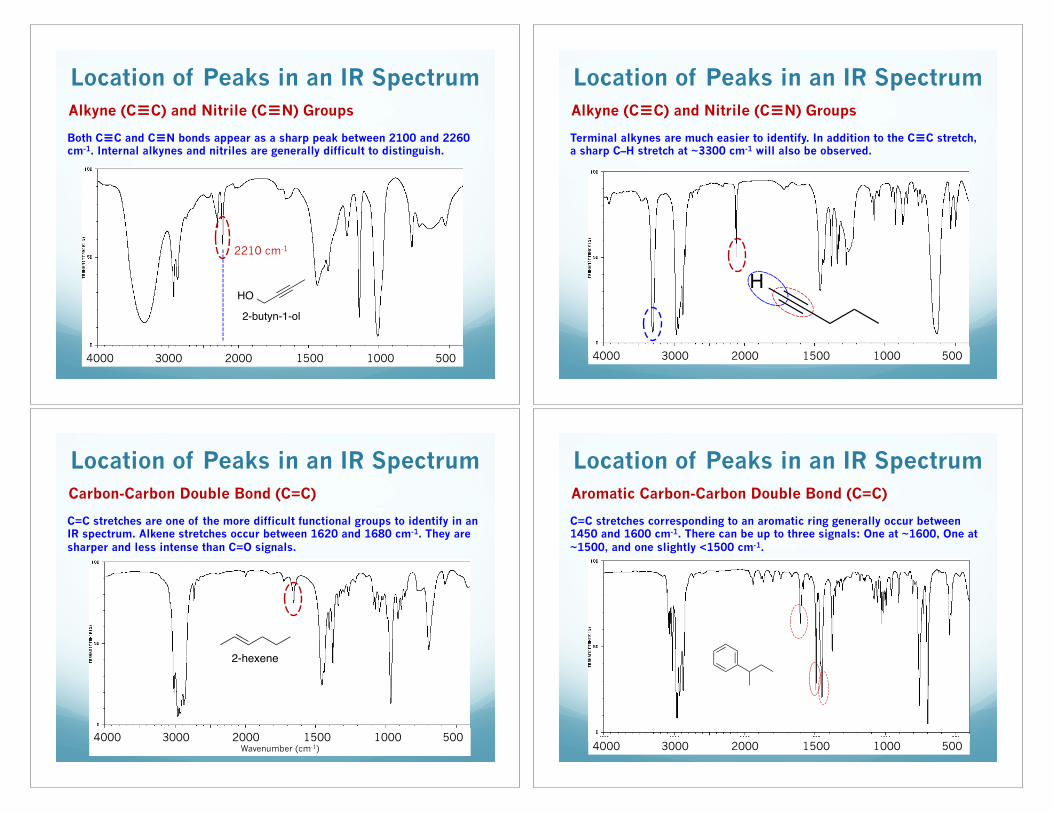
Location of Peaks in an IR Spectrum Alkyne (C�C) and Nitrile (C�N) Groups
Both C�C and C�N bonds appear as a sharp peak between 2100 and 2260 cm-1. Internal alkynes and nitriles are generally difficult to distinguish.
4000 3000 2000 1500 1000 500
HO
2-butyn-1-ol
2210 cm-1
Location of Peaks in an IR Spectrum Alkyne (C�C) and Nitrile (C�N) Groups
Terminal alkynes are much easier to identify. In addition to the C�C stretch, a sharp C–H stretch at ~3300 cm-1 will also be observed.
4000 3000 2000 1500 1000 500
H
Location of Peaks in an IR Spectrum Carbon-Carbon Double Bond (C=C)
C=C stretches are one of the more difficult functional groups to identify in an IR spectrum. Alkene stretches occur between 1620 and 1680 cm-1. They are sharper and less intense than C=O signals.
4000 3000 2000 1500 1000 500 Wavenumber (cm-1)
2-hexene
Location of Peaks in an IR Spectrum Aromatic Carbon-Carbon Double Bond (C=C)
C=C stretches corresponding to an aromatic ring generally occur between 1450 and 1600 cm-1. There can be up to three signals: One at ~1600, One at ~1500, and one slightly <1500 cm-1.
4000 3000 2000 1500 1000 500
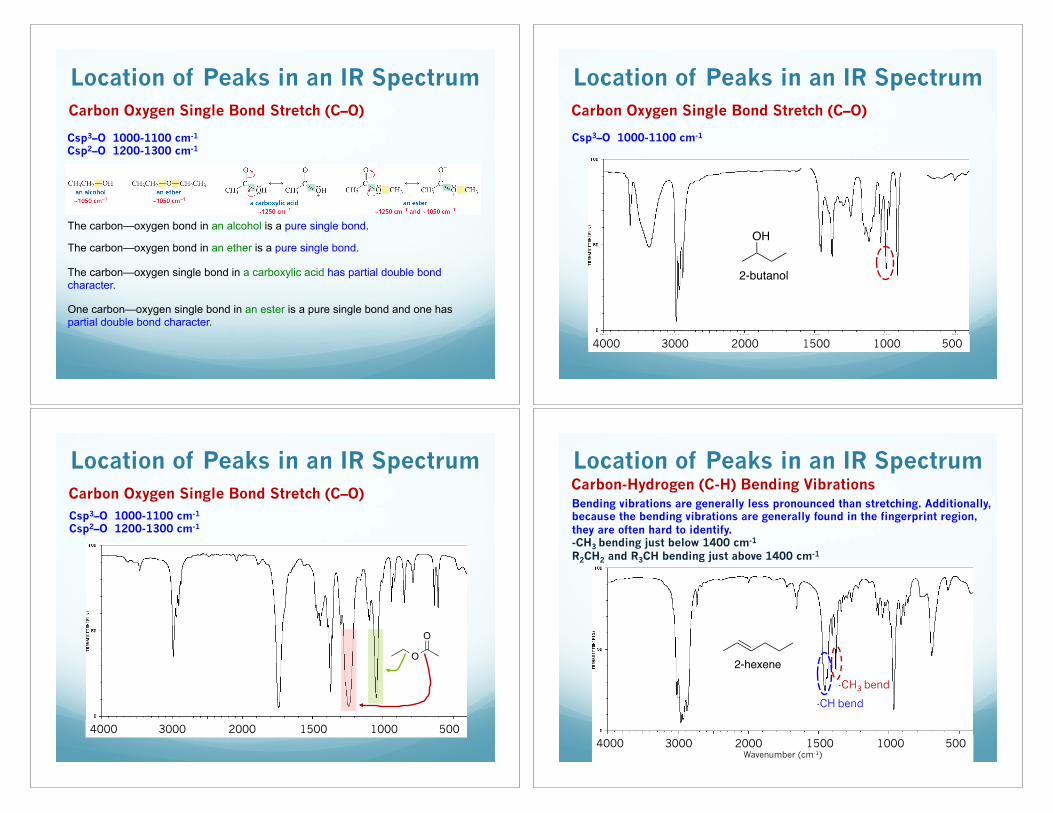
Location of Peaks in an IR Spectrum Carbon Oxygen Single Bond Stretch (C–O)
The carbon—oxygen bond in an alcohol is a pure single bond.
The carbon—oxygen bond in an ether is a pure single bond. The carbon—oxygen single bond in a carboxylic acid has partial double bond character.
One carbon—oxygen single bond in an ester is a pure single bond and one has partial double bond character.
Csp3–O 1000-1100 cm-1
Csp2–O 1200-1300 cm-1
Location of Peaks in an IR Spectrum Carbon Oxygen Single Bond Stretch (C–O)
4000 3000 2000 1500 1000 500
OH
2-butanol
Csp3–O 1000-1100 cm-1
Location of Peaks in an IR Spectrum Carbon Oxygen Single Bond Stretch (C–O) Csp3–O 1000-1100 cm-1
Csp2–O 1200-1300 cm-1
4000 3000 2000 1500 1000 500
O
O
Location of Peaks in an IR Spectrum Carbon-Hydrogen (C-H) Bending Vibrations Bending vibrations are generally less pronounced than stretching. Additionally, because the bending vibrations are generally found in the fingerprint region, they are often hard to identify. -CH3 bending just below 1400 cm-1
R2CH2 and R3CH bending just above 1400 cm-1
4000 3000 2000 1500 1000 500 Wavenumber (cm-1)
2-hexene
-CH bend
-CH3 bend
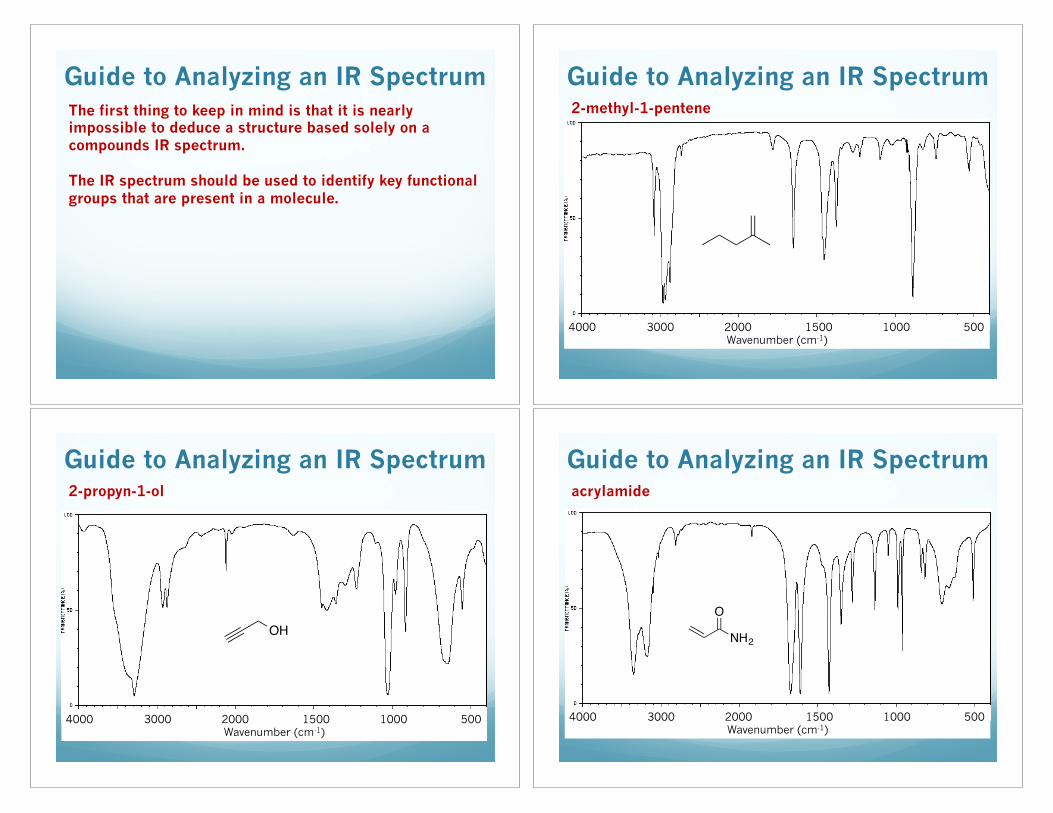
Guide to Analyzing an IR Spectrum The first thing to keep in mind is that it is nearly impossible to deduce a structure based solely on a compounds IR spectrum. The IR spectrum should be used to identify key functional groups that are present in a molecule.
Guide to Analyzing an IR Spectrum 2-methyl-1-pentene
4000 3000 2000 1500 1000 500 Wavenumber (cm-1)
Guide to Analyzing an IR Spectrum 2-propyn-1-ol
4000 3000 2000 1500 1000 500 Wavenumber (cm-1)
OH
Guide to Analyzing an IR Spectrum acrylamide
4000 3000 2000 1500 1000 500 Wavenumber (cm-1)
O
NH2
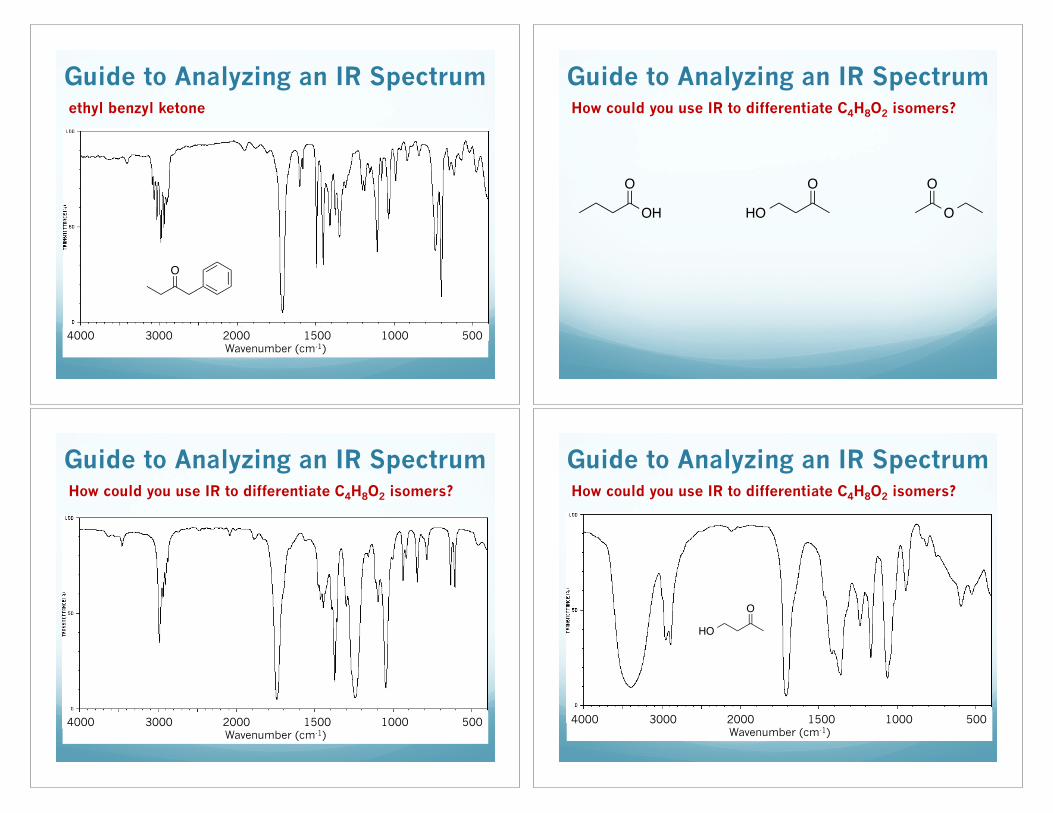
Guide to Analyzing an IR Spectrum ethyl benzyl ketone
4000 3000 2000 1500 1000 500 Wavenumber (cm-1)
O
Guide to Analyzing an IR Spectrum How could you use IR to differentiate C4H8O2 isomers?
O
OH
O
HO
O
O
Guide to Analyzing an IR Spectrum How could you use IR to differentiate C4H8O2 isomers?
4000 3000 2000 1500 1000 500 Wavenumber (cm-1)
Guide to Analyzing an IR Spectrum How could you use IR to differentiate C4H8O2 isomers?
4000 3000 2000 1500 1000 500 Wavenumber (cm-1)
O
HO
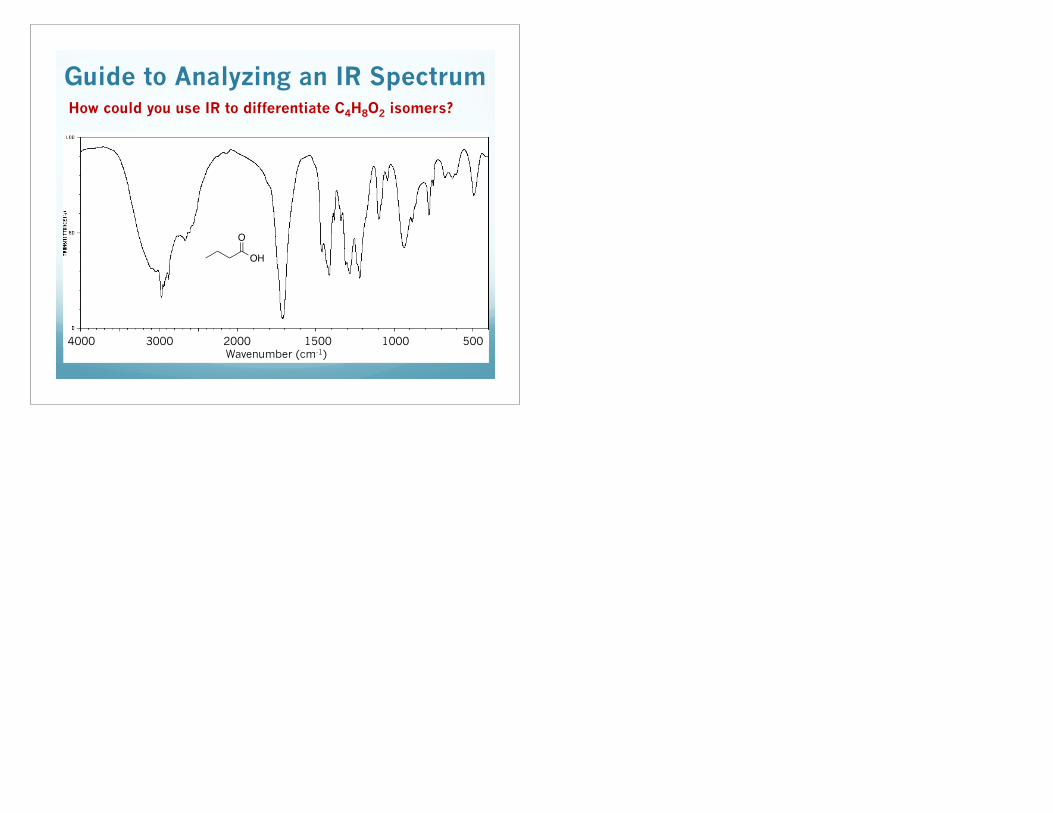
Guide to Analyzing an IR Spectrum How could you use IR to differentiate C4H8O2 isomers?
4000 3000 2000 1500 1000 500 Wavenumber (cm-1)
O
OH