Embed Size (px)
Citation preview

JOURNAL OF CATALYSIS 102, 207-215 (1986)
Infrared Spectroscopic Study of NO Reduction by H2 on Supported Gold Catalysts
J. Y. LEE AND J. SCHWANK
Department of Chemical Engineering, The Uniuersity of Michigan, Ann Arbor. Michigan 48109-2136
Received October 11, 1984; revised July 1, 1986
In siru Fourier transform infrared spectroscopy is used to study the reduction of NO by HI on Au/SiO* and AuiMgO catalysts. On these catalysts, large differences in selectivity toward Nz formation had been found depending on the nature of the support. These differences are correlated with transient infrared spectral features which appear during reaction. NO by itself does not give rise to a band attributable to NO adsorbed on Au, however, exposure of supported Au to NO renders the catalyst unable to adsorb CO. Preadsorbed CO, on the other hand, is displaced from the Au catalysts by NO. 0 1986 Acadcmlc Press, Inc.
INTRODUCTION technique for probing catalyst surfaces, to investigate the adsorption characteristics of
Gold is generally a poor hydrogenation Au/SiOz and Au/MgO, and to obtain the catalyst due to its weak interaction with mechanistic details of the above reactions molecular hydrogen. However, in a com- on these catalysts. The additional informa- prehensive kinetic study carried out by tion could then be combined with existing Galvagno and Parravano (I ), supported kinetic data to provide better explanations gold catalysts were found to be surprisingly of the experimental results. active for the reduction of NO by Hz. Ap- parently, a massive support effect was at work, leading to dramatic differences in se- EXPEKlMENTAL
lectivity toward N2 formation according to According to the kinetic study of the following overall reactions: Galvagno and Parravano (I ), the selectivity
2 NO + 2 H2 + 2 I-i:0 + N1 (I) for N2 formation in NO + II? was generally low on AulSiO? but high on Au/MgO. Con-
2 NO + 5 Hz 4 2 HZ0 t- 2 NH3 (2) sequently, two Au catalysts, supported on Si0~ and MgO, respectively, were used in
Reaction (1) predominated on Au/MgO and this study to represent the two extreme Au/AlzOj, whereas reaction (2) was the cases of N2 selectivity. The preparation main reaction on Au/SiOz. The authors methods and the characterization data for proposed for Au/MgO and Au/A1203 and these catalysts are summarized in Table 1. increased electron back-donation from the It should be noted that a bimodal distribu- catalyst to the adsorbed NO which would tion of Au particles is present on both cata- weaken the N-O bond and thereby facili- lysts. Neutron activation analysis indicated tate the dissociation of NO. On Au/Si02, that, except for a trace amount of Cl (10.02 on the other hand, an associative adsorp- wt%), the catalysts were essentially free of tion of NO followed by hydrogenation into impurities, particularly those of other NH3 was postulated. metals.
The present work follows up on this pre- One hundred milligrams of powdered cat- vious study and uses in siren IR, a proven alyst was pressed into a l-in. pellet and
207 0021-9517186 $3.00
Copynghl Q 198b by Academx Press, Inc. All rights of reproduction in any form reserved.

208 LEE AND SCHWANK
TABLE I
Preparation and Characterization of Supported Au Catalysts
wt% Au Preparation method Precursor salt Average
particle size (TEM)
Au/MgO Au/SiO*
3.46 6.02 Impregnation Cation exchange
HAuQ 8Ok
Au(en) Cl, 400 x0
Average particle size (WAXS)
80k 400 ‘40
L? Bimodal size distribution.
placed in a high vacuum, IR cell (all Pyrex glass) equipped with NaCl windows and grease-free Teflon vacuum stopcocks. The IR cell was connected to a gas supply sys- tem capable of blending and metering different proportions of gases. Only the highest purity gases obtainable from commercial sources were used in this study. To prevent the last trace of impuri- ties in the gas feed from entering the IR cell, a molecular sieve trap cooled in a slurry of dry ice and acetone was placed immediately ahead of the cell.
The cell contained two separate cham- bers; a front chamber for monitoring the gas phase composition and a back chamber for accommodating the catalyst pellet. The back chamber could be heated up to 623 K. Each of these chambers could be evacuated inde- pendently by a combination of diffusion and mechanical pumps. Liquid-N2 traps were installed at strategic locations to prevent oil vapors from entering the IR cell. A typical experiment would begin with the evacua- tion of the IR cell, followed by the isolation of the back chamber. The front chamber was then filled with 30 Torr (1 Torr = 133.3 N me2) of either CO or NO. This procedure allowed the purity of the gases to be checked by their IR spectra. The gas in the front chamber was then expanded through a Teflon stopcock into the back chamber. After the pressures in both chambers were equalized, the back chamber was isolated and the front chamber was evacuated. Sub- sequent reconnection of the chambers al-
lowed IR spectra of the gas phase and the adsorbed molecules to be obtained sepa- rately by scanning the front and the back chamber.
After an evacuation to remove most of the moisture and the volatile impurities from the catalyst pellet, the pellet was pre- treated at 473 K in 50 Torr of flowing H2 for 2 h. It was then cooled to room temperature in HZ atmosphere.
All IR spectra were collected on a Digilab FTS-20 FTIR spectrometer at a spectral resolution of 1 cm-l.
RESULTS AND DISCUSSION
Ideally, for an in situ IR study of a reac- tion to be informative, the reactive forms of the adsorbed reactant molecules must be IR active, so that the progress of reaction can be followed closely by observing the changes in the IR spectra of the adsorbed species. However, in the reactions between NO and H2 over supported Au, this ideality is quite difficult to achieve as will be indi- cated later.
The exposure of both Au/MgO and Au/ Si02 to 30 Torr of NO at room temperature did not produce any IR band that could be assigned to NO chemisorption on Au. The same conclusion was also true at other tem- peratures (298-603 K). The spectra did not show any adsorbed species except for a weak band at 1629 cm-l on Au/SiOz. This band could easily be removed by evacua- tion and was due to NO adsorption on Si02. The band assignment was confirmed by adsorbing NO on blank Si02 which had been pretreated the same way as the cata- lysts. Exposure of NO to similarly pre- treated blank MgO failed to result in any detectable chemisorbed species in the spec- tral region of interest.
In view of the absence of IR active ad- sorbed NO species on Au, it was decided to check the adsorption capability of Au in these catalysts by adsorbing other gases. CO was selected for this purpose because previous work (2-9) had consistently indi-

INFRARED STUDY OF NO REDUCTION ON SUPPORTED Au 209
2300 2250 2200 2150 2100 2050 2000 WAVENUMBERS
FIG. 1. Absorbance IR spectra (in arbitrary units) of (a) CO adsorption on reduced Au/Si02, (b) CO ad- sorption on unreduced Au/SiOz.
cated that CO at partial pressures of several Torrs could adsorb on Au at room tempera- ture, producing a single IR band in the range of 2120-2080 cm-‘. Both Au&i02 and Au/MgO that had previously been ex- posed to NO were found to lose their ability for CO readsorption, even after the cata- lysts were subjected to evacuation followed by H2 pretreatment at 473 K for 2 h. The only way to restore the CO chemisorption capability of Au was to treat the NO ex- posed catalysts in Hz at 603 K for 2 h.
In order to elucidate this phenomenon further, fresh catalyst pellets were used and exposed first to CO before NO adsorption. These experiments were conducted to com- pare the relative strengths of adsorption of CO and NO on the Au surface.
Chemisorption of CO
Figure 1 (spectrum a) shows the infrared spectrum obtained after exposing a hydro- gen pretreated Au/SiOZ pellet to 30 Tot-r of CO. In addition to the clearly resolved rota- tional fine structure of gas-phase CO, a strong, single band with the absorption maximum at about 2060 cm-’ was observed. Decreasing the gas-phase pressure to 5 Torr reduced the intensity of this band signifi- cantly. Upon evacuation of the gas phase to lop5 Tot-r, the band disappeared com-
pletely. This indicates that the adsorption of CO on Au/SiOz is reversible at room temperature. However, the fact that the band appeared at much lower wavenum- bers compared to the CO gas phase implies that we were dealing with a chemisorbed, rather than physically adsorbed CO spe- cies. Furthermore, there was a slight shift (3-5 cm-‘) to higher wavenumber when the surface coverage was reduced. This shift, which is opposite in direction to group VIII metals, is typical for group IB metals (10). While the strength of adsorption and the coverage dependent band shifts were char- acteristic for Au, the observed CO band po- sition on the reduced Au/SiOz pellet was significantly lower than the previously re- ported wavenumbers (2-9). In view of this rather unusual band position, an unreduced Au/SiOz pellet was exposed to CO. A band was found at 2175 cm-’ (Fig. 1, spectrum b), in perfect agreement with the results on unreduced Au obtained by Kavtaradze and Sokolova (5) and Yates (8). This band could easily be removed by evacuation. The pellet was then reduced in situ by HZ, following precisely the procedure used by Yates (8). The band at 2060 cm-’ was im- mediately reproduced after readsorbing CO on the reduced Au/SiOz catalyst.
Figure 2 shows the infrared spectra of
22.0 WAVENUMBERS
FIG. 2. Transmission IR spectra (in arbitrary units) of CO adsorption on reduced Au/MgO. (a) 15 Torr, (b) 5 Torr, (c) <I Torr.
210 LEE AND SCHWANK
CO chemisorbed on Au/MgO as a function of gas phase CO pressure. At a pressure higher than 15 Torr, a broad band at around 2040 cm-i appeared, comprising a high fre- quency shoulder at 2060 cm-l and addi- tional shoulder at wavenumbers lower than 2000 cm-i. As the pressure was reduced, the band at 2040 cm-’ decreased in inten- sity much faster than that of the high fre- quency band at 2060 cm-‘, and the low fre- quency shoulders developed into a doublet with maxima at 1970 and 1940 cm-’ (Figs. 2b and c). After evacuation at 10m5 Tort-, all the bands disappeared completely. A small shift to higher wavenumber with decreasing CO coverage, which is typical for group IB metals, was again observed for the high fre- quency band. As in the case of Au/SiOz, the band positions were significantly lower than the previously reported values.
The appearance of the two low frequency shoulders may be assigned to bridge- bonded or multiply bonded adsorbed CO species. A more in-depth discussion of these features is presented elsewhere (40).
There are a number of reasons for IR bands of adsorbed species to appear at lower wavenumbers than expected. Parti- cle size effects alone do not seem to be a dominant factor. Although vco usually de- creases with the decrease in metal particle size for group VIII metals, the reverse trend has been observed for Cu, a group IB metal (11). Furthermore, there was a large difference in the average Au particle size between the two supported Au catalysts of this study and yet vco on both catalysts were shifted almost equally to wavenum- bers much lower than that expected from an extended Au surface.
In the IR study of CO adsorption on Au electrodes (12), the CO stretching fre- quency was found to vary as a function of the electrode potential. In addition, the lin- early adsorbed species could be completely transformed into the bridged species when the electrode was adequately polarized. By analogy, the oxide support in the Au cata- lysts may possess a similar function as the
3 &
.A+
2300 2200 2100 2600 1960 iSi30 &O 4
WAVENUMBERS
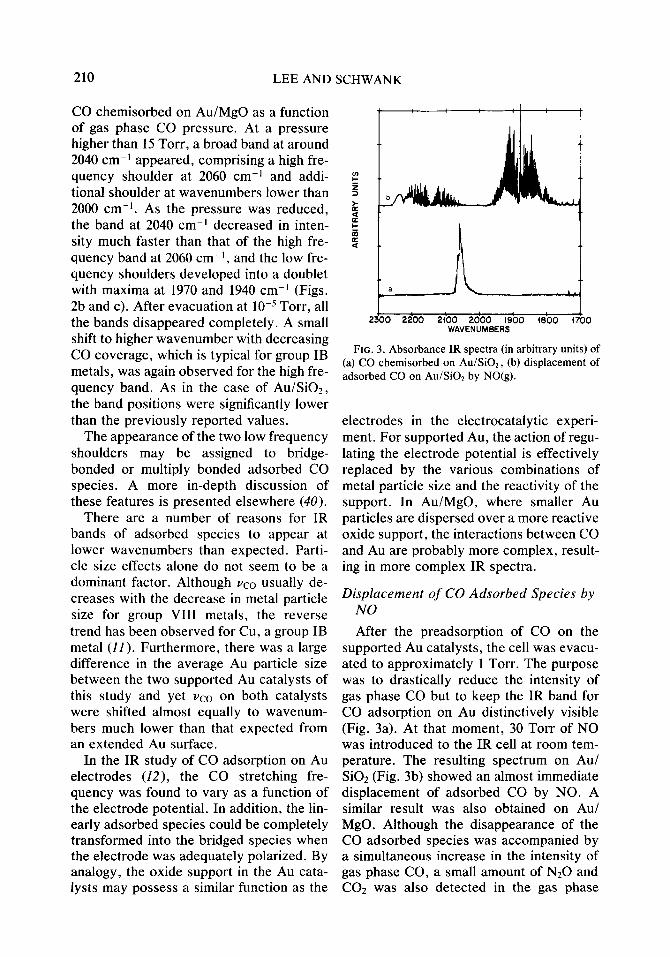
FIG. 3. Absorbance IR spectra (in arbitrary units) of (a) CO chemisorbed on Au/Si02, (b) displacement of adsorbed CO on Au/Si02 by NO(g).
electrodes in the electrocatalytic experi- ment. For supported Au, the action of regu- lating the electrode potential is effectively replaced by the various combinations of metal particle size and the reactivity of the support. In Au/MgO, where smaller Au particles are dispersed over a more reactive oxide support, the interactions between CO and Au are probably more complex, result- ing in more complex IR spectra.
Displacement of CO Adsorbed Species by NO
After the preadsorption of CO on the supported Au catalysts, the cell was evacu- ated to approximately 1 Torr. The purpose was to drastically reduce the intensity of gas phase CO but to keep the IR band for CO adsorption on Au distinctively visible (Fig. 3a). At that moment, 30 Torr of NO was introduced to the IR cell at room tem- perature. The resulting spectrum on Au/ Si02 (Fig. 3b) showed an almost immediate displacement of adsorbed CO by NO. A similar result was also obtained on Au/ MgO. Although the disappearance of the CO adsorbed species was accompanied by a simultaneous increase in the intensity of gas phase CO, a small amount of N20 and COZ was also detected in the gas phase

INFRARED STUDY OF NO REDUCTION ON SUPPORTED Au 211
spectrum containing both NO and CO. However, the overall spectrum was still de- void of IR features attributable to NO ad- sorption on Au.
The appearance of N20 and CO2 was the result of a Au-catalyzed reaction between CO and NO. According to Cant and Fred- rickson (13), the reaction could only pro- ceed to a limited extent because its rate is inhibited by N20 in the products. These ob- servations, together with the preponder- ance of gas phase CO after introduction of NO led us to believe that only part of the adsorbed CO was removed by the reaction between CO and NO. The majority of CO was physically displaced from the catalyst surface simply because the affinity of Au for NO is stronger than that for CO. An evacuation after the displacement experi- ment did not restore the capability of Au to readsorb CO. Instead, a H2 treatment at 603 K for 2 h was necessary to regenerate the catalysts. This indicates that a strongly bound surface species was left on Au after the exposure to NO. Whatever the nature of this species might be, its IR spectrum was not detectable under our experimental conditions.
Generally, NO adsorption on metals gives rise to IR bands in the range 2100- 1700 cm-’ (14-17). However, to the best of our knowledge there is no previous report concerning the IR spectrum of NO on Au in the literature.
There are several possible explanations for the absence of a NO band on Au in the region 2100-1700 cm-l. First, a small NO coverage below the detection limits of IR can be ruled out as an explanation because the entire Au surface was incapacitated for CO readsorption after the exposure to NO. This indicates that the coverage of NO was at least as extensive as that of CO and the latter had been shown to produce detect- able IR bands. Second, the adsorbed spe- cies could be a linear species with very low extinction coefficient. This is rather un- likely in view of the more polar nature of NO and the relatively large extinction coef-
ficient of gas phase NO. Third, NO could be adsorbed parallel to the Au surface. The N=O stretch in this configuration is IR in- active according to the metal-surface selec- tion rules (18). Finally, NO might undergo dissociative chemisorption on the Au sur- face. Although this is not conceived as probable according to the prediction of Bro- den et al. (19), the rule was generalized without any data on Au. Furthermore, an exception to the rule has already been found in the case of Cu, where dissociative chemisorption of NO could occur even at a low temperature of 80 K (20, 21). In gen- eral, dissociative chemisorption of NO de- pends strongly on coverage, temperature, and nature of metal. Thermal desorption spectra suggest that residual oxygen adat- oms from NO dissociation are difficult to remove from metal surfaces, often requir- ing very high temperatures for desorption (22, 23).
In summary, although the adsorbed spe- cies of NO on Au was not detected by IR spectroscopy, its presence was verified by the inhibiting effect of NO on CO readsorp- tion, and by the reaction between CO and NO at room temperature, which formed a detectable amount of NzO and COz. Since N20 formation probably requires the pair- ing of molecularly adsorbed NO and nitro- gen adatoms (24), some NO dissociation on Au seems to occur under the experimental conditions. The dissociative chemisorption probably proceeded via an adsorption pre- cursor in which the NO axis was parallel to the surface. Such an adsorption mode is IR inactive according to the metal-surface se- lection rule (28).
In Situ IR Study of NO Reduction by Hz
For the in situ IR study of the reactions between NO and HZ, a mixture of NO in excess H2 at a total pressure of about 100 Torr was exposed to the catalyst pellet in the IR cell (90 cm3) at room temperature. The cell was then heated up slowly to 573 K. When pure SiOZ or pure MgO pellets that had been pretreated in the same man-
212 LEE AND SCHWANK
2200 is00 (600 1400 WAVENUMBERS
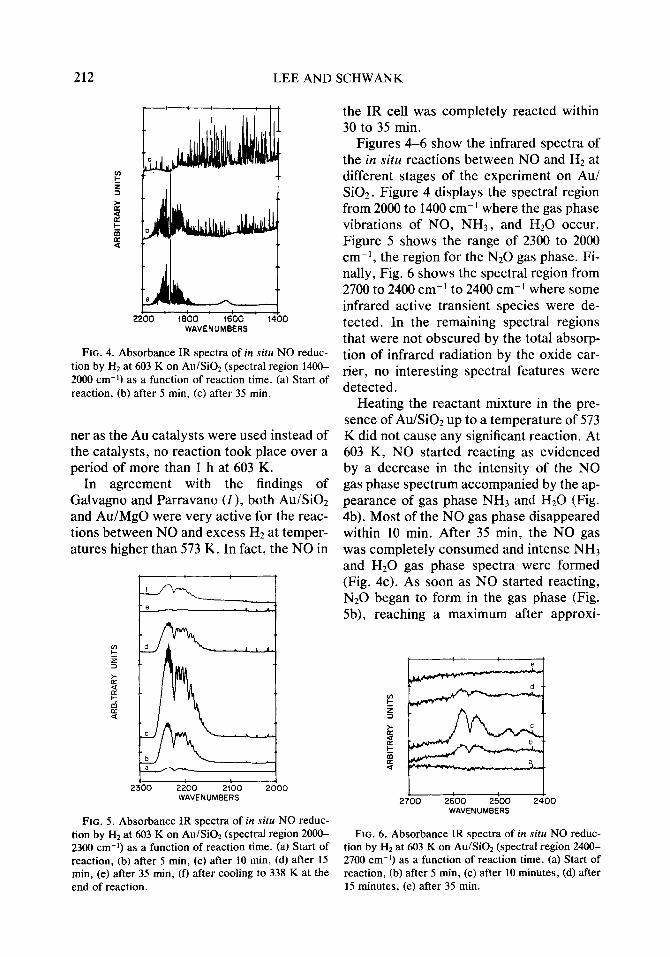
FIG. 4. Absorbance IR spectra of in situ NO reduc- tion by H2 at 603 K on Au/Si02 (spectral region 1400- 2000 cm-i) as a function of reaction time. (a) Start of reaction, (b) after 5 min, (c) after 35 min.
ner as the Au catalysts were used instead of the catalysts, no reaction took place over a period of more than 1 h at 603 K.
In agreement with the findings of Galvagno and Parravano (I), both Au&O1 and Au/MgO were very active for the reac- tions between NO and excess HZ at temper- atures higher than 573 K. In fact, the NO in
2300 2200 2100 2000 WAVENUMBERS
FIG. 5. Absorbance IR spectra of in situ NO reduc- tion by Hz at 603 K on Au/Si02 (spectral region 2000- 2300 cm-i) as a function of reaction time. (a) Start of reaction, (b) after 5 min, (c) after IO mitt, (d) after 15 min, (e) after 35 mm, (f) after cooling to 338 K at the end of reaction.
the IR cell was completely reacted within 30 to 35 min.
Figures 4-6 show the infrared spectra of the in situ reactions between NO and HZ at different stages of the experiment on Au/ Si02. Figure 4 displays the spectral region from 2000 to 1400 cm-’ where the gas phase vibrations of NO, NH3, and H20 occur. Figure 5 shows the range of 2300 to 2000 cm-l, the region for the N20 gas phase. Fi- nally, Fig. 6 shows the spectral region from 2700 to 2400 cm-’ to 2400 cm-’ where some infrared active transient species were de- tected. In the remaining spectral regions that were not obscured by the total absorp- tion of infrared radiation by the oxide car- rier, no interesting spectral features were detected.
Heating the reactant mixture in the pre- sence of Au/SiOz up to a temperature of 573 K did not cause any significant reaction. At 603 K, NO started reacting as evidenced by a decrease in the intensity of the NO gas phase spectrum accompanied by the ap- pearance of gas phase NH3 and Hz0 (Fig. 4b). Most of the NO gas phase disappeared within 10 min. After 35 min, the NO gas was completely consumed and intense NH3 and Hz0 gas phase spectra were formed (Fig. 4~). As soon as NO started reacting, N20 began to form in the gas phase (Fig. 5b), reaching a maximum after approxi-
1 1 2700 2600 2500 2400
WAVENUMBERS
FIG. 6. Absorbance IR spectra of in siru NO reduc- tion by Hz at 603 K on Au/Si02 (spectral region 2400- 2700 cm-‘) as a function of reaction time. (a) Start of reaction, (b) after 5 min, (c) after 10 minutes, (d) after 15 minutes, (e) after 35 min.

INFRARED STUDY OF NO REDUCTION ON SUPPORTED Au 213
mately 10 min (Fig. 5~). Then, the intensity of the N20 gas phase spectrum began to decrease (Fig. 5d). There seems to be a cor- relation between the decrease in the N20 intensity and the depletion of NO in the gas phase. After 35 min, no detectable quantity of N20 remained in the gas phase (Fig. 5e). The growth and the decay of N20 suggests that N20 was an intermediate product in the reduction of NO by HZ on these Au cat- alysts. However, when the reaction tem- perature was lowered to 338 K at the end of the reaction, a small amount of N20 reap- peared, possibly an indication of an equilib- rium condition between N20 and NHJ H20. N20 was not detected in the kinetic study of Galvagno and Parravano (I) but that could be due to a longer residence time used in their reactor. Indeed, Otto et al. (see references cited in (23)) found that the reduction of N20 by H2 was faster than the reduction of NO by Hz. However, the reac- tion did not proceed until all the NO had been consumed.
The background infrared spectrum of the Au/SiOz sample showed no infrared band in the region of 2700 to 2400 cm-’ after expo- sure to the NO/H2 mixture at 298 K (Fig. 6a). With the onset of the reaction at 603 K, some transient infrared spectral features appeared (Fig. 6b). After 10 min of reac- tion, these spectral features reached a max- imum in intensity (Fig. 6c) followed by a gradual decrease in intensity (Fig. 6d) and a total disappearance after 35 minutes at 603 K (Fig. 6e). Cooling to room temperature did not recreate any of these species. The growth and the decay of these species ap- pears to parallel that of NzO, except for the reappearance of N20 upon cooling at the end of the reaction. Before attempting an assignment of the infrared bands in the re- gion of 2700 to 2400 cm-‘, the results ob- tained on Au/MgO will be discussed.
Au/MgO gave similar results compared to Au/SiO*, namely a depletion of NO at 603 K after 10 min, appearance of NH3 and Hz0 bands, and growth and decay of N20. However, there was no spectral feature
whatsoever observed in the range of 2700 to 2400 cm-‘. This difference between Au/ MgO and Au/SiOz rules out that the appear- ance of bands in the region of 2700 to 2400 cm-’ was due to adsorption of NzO on the catalyst.
It seems likely that the presence of these transient spectral features on Au/SiOz in the region 2700-2400 cm-’ was related to the high selectivity of this catalyst to pro- duce NH3. On the Au/MgO catalyst, which has high selectivity for Nz formation, these transient species were either absent or present in a concentration below the detec- tion limit.
The identification of the transient species at 2700-2400 cm-’ is extremely difficult, for the fact that the oxides and particularly the hydrides of N2 are not strong absorbers of IR radiation in this region of interest. An analogy with the IR spectra of hydroxyl amines is also absent. Although resem- blance with some of the minor features of the higher oxides of N2 (NzO.+, N,Os) was noted (25), the more prominent features which are characteristic of these oxides were absent from our spectra. Further- more, these nitrogen oxides are thermally unstable compounds that could not possibly exist at the reaction temperature. It is equally improbable that these highly oxi- dized products of Nz could be formed under the net reducing atmosphere used in the NO + Hz reactions.
The IR spectra of adsorbed molecules of common oxides and hydride of nitrogen in- cluding hydroxylamines (24) also failed to provide a good match for the transient spe- cies. Regardless of this, we are still inclined to consider the transient species as a precur- sor to NH3 formation because it was only detected on Au/SiOz, the Au catalyst noted for its selectivity towards NH3 formation. However, the composition of the transient species is conceivably more complicated than the NH, species that were suggested for the NO/H2 reaction on Ru (26).
The reaction mechanism for the reduc- tion of NO by HZ is usually system-specific

214 LEE
II- Llctlve species *t 2400 -2700 an-’
AND SCHWANK
FIG. 7. Proposed reaction pathways of the H2 reduc- tion of NO on Au catalysts. The subscripts “s” de- note adsorbed species.
and cannot be generalized for all metal cat- alysts. Kokes (27) initially proposed that the reaction proceeds through an adsorbed HNO complex, which can either decom- pose to N20 or hydrogenate directly to NH3. The same intermediate or its oligo- mers were also postulated by several other authors (28, 29). Echigoya et al. (30) sug- gested that most of the N2 is formed by the decomposition of N20 which is a reaction intermediate. All of the above mechanistic formulations tacitly assumed the associa- tive chemisorption of NO. Recent views (24,26, 31, 32), however preferred a disso- ciative chemisorption of NO, whereby the surface nitrogen atoms can either pair up with other nitrogen containing species on the surface to form N20 or N2, or undergo hydrogenation to the end product of NH3 via a series of NH, intermediates. The for- mation of N2 by the decomposition of NH3 or the reaction between NO and NH3 are usually not considered as major reaction paths.
Generally, the reactions between NO and HZ over catalytic surfaces are very com- plex, and numerous reaction intermediates and mechanisms have been proposed. While the present study, in agreement with previous work (I), confirms the influence of the support of the selectivity of Au cata- lysts, it does not allow us to arrive at defini- tive conclusions with regards to the reac- tion mechanism. However, based on the combination of past and current experimen- tal data, the following reaction scheme (Fig. 7) is given as a phenomenological ex- planation.
Although the dissociative chemisorption of NO has not been established in the litera- ture, it is the most probable explanation for the formation of N20 under the reaction conditions and also in the reaction between NO and CO at room temperature. Although the dissociation of molecular Hz is difficult on Au (33), it is not totally impossible at the temperature used in the NO + H2 reaction (34). Indeed, Galvagno and Parravano (I ) had reported that both Au/SiOz and Au/ MgO were more active in Hz-D* exchange at 573 K than in the reduction of NO by H2 at the same temperature. Furthermore, the activity of Au/SiOz was about an order of magnitude higher than that of Au/MgO. A more efficient activation of H2 on Au/SiOZ seems to be the main reason for this cata- lyst to form NH3 preferentially in the reac- tions between NO and HZ. There does not seem to be any difference in the modes of NO chemisorption (i.e., associative vs dis- sociative) on Au when the support is SiOZ or MgO. This is a totally different view- point from the original hypothesis of Galvagno and Parravano (1).
It has to be emphasized that the high ac- tivity of Au/MgO and Au/Si02 for this reac- tion is rather surprising considering the low catalytic activity of metallic gold. One might be tempted to argue that traces of other metals, rather than gold, are responsi- ble for the observed activity. However, the effect is so massive that a considerable amount of impurities would be required to justify the observed activity. Careful analy- sis of the catalysts, using atomic absorp- tion, neutron activation analysis and photo- electron spectroscopy did not reveal any significant metal impurity. In fact, the only significant impurity found was 0.02 wt% of chlorine in the case of Au/MgO. The same Au/MgO catalyst was proven to be totally inactive in the hydrogenolysis of cyclopro- pane up to a temperature of 623 K (35). Similarly, Au/SiOz was totally inactive for ethane hydrogenolysis up to 503 K (36). This lack of activity indicates the absence of group VIII metal impurities such as rho- dium, palladium or iridium. Furthermore,

INFRARED STUDY OF NO REDUCTION ON SUPPORTED Au 215
blank experiments were carried out on SiOZ and MgO pellets at different times in be- tween experiments with gold. These blank runs showed quite convincingly that there was no extraneous or internal source of im- purities in our infrared cell.
This leads to the conclusion that an inter- action of gold with oxide supports can, un- der certain conditions, modify the chemis- try of bulk gold. One might suggest that the active sites in the Au/MgO and Au/SiOz catalysts are not necessarily zero-valent metallic gold. Indeed, EXAFS data for Au/ MgO catalysts indicated the presence of highly dispersed gold carrying a formal charge of + 1 in addition to metallic gold (37, 38). This result is supported by trans- mission electron microscopy on Au/MgO, showing a large fraction of highly dispersed gold particles together with large particles. Similarly, a Mossbauer study on supported gold catalysts indicated an s-electron den- sity at the gold nucleus lower than that of the gold metal (39).
REFERENCES
1. Galvagno, S., and Parravano, G., J. Catal. 55, 178 (1978).
2. Bradshaw, A. M., and Pritchard, J., Proc. R. Sot. London Ser. A 316, 169 (1970).
3. Kottke, M. L., Greenler, R. G., and Tompkins, H. G., Surf. Sci. 32, 23 1 (1972).
4. Chesters, M. A., Pritchard, J., and Sims, M. L., in “Adsorption-Desorption Phenomena” (F. Ricca, Ed.), p. 277. Academic Press, New York, 1972.
5. Kavtaradze, N. N., and Sokolova, N. P., Russian J. Phys. Chem. 36, 1529 (1962).
6. Guerra, C. R., and Schulman, J. H., Surf. Sci. 7, 229 (1967).
7. Guerra, C. R., J. Co/bid Interface Sci. 29, 229 (1969).
8. Yates, D. J. C., J. Colloid Interface Sci. 29, 194 (1969).
9. Schwank, J., Parravano, G., and Gruber, H. L., J. Catal. 61, 19 (1980).
10. Sheppard, N., and Nguyen, T. T., in “Advances in Infrared and Raman Spectroscopy” (R. J. H. Clark and R. E. Hester, Eds.), Vol. 5, p. 67. Heyden, London, 1978.
Il. Ponec, V., “Catalysis” (Specialist Periodical Re- port), Vol. 5, p. 48. Royal Chem. Sot., London, 1982.
12. Beden, B., Bewick, A., Kunimatsu, K., and Lamy, C., J. Electroanal. Gem. 142, 345 (1982).
13. Cant, N. W., and Fredrickson, P. W., J. Catal. 37, 531 (1975).
14. Little, L. H., “Infrared Spectra of Adsorbed Spe- cies.” Academic Press, New York/London, 1966.
15. Basila, M. R., Appl. Spectrosc. Rev. 1, 361 (1968).
16. Shelef, M., and Kummer, J. T., Chem. Eng. Progr. Symp. Ser. 67, 74 (1971).
17. Busca, G., and Lorenzelli, V., J. Catal. 72, 303 (1981).
18. Pearce, H. A., and Sheppard, N., Surf. Sci. 59, 205 (1976).
19. Broden, G., Rhodin, T. N., Bucker, C., Benbow, B., and Hurych, Z., Sut$ Sci. 59, 593 (1966).
20. Matloob, M. H., and Roberts, M. W., J. Chem. Sot. Faraday Trans. I 73, 1393 (1977).
21. Johnson, D. W., Matloob, M. H., and Roberts, M. W., J. Chem. Sot. Faraday Trans. 1 75, 2143 (1979).
22. Egelhoff, W. F., Jr., “The Chemical Physics of Solid Surfaces and Heterogeneous Catalysis,” Vol. 4, p. 397. Elsevier, Amsterdam, 1982.
23. Harrison, B., Wyatt, M., and Gough, K. G., in “Catalysis” (Specialist Periodical Report), Vol. 5, p. 127. Royal Chem. Sot., London, 1982.
24. Otto, K., and Yao, H. C., J. Catal. 66, 229 (1980). 25. Pierson, R. H., Fletcher, A. D., and Gantz, E. St.
C., Anal. Chem. 28, 1218 (1956). 26. Davydov, A. A., and Bell, A. T., J. Catal. 49, 345
(1977). 27. Kokes, R. J., J. Phys. Chem. 70, 296 (1966). 28. Tretyakov, N. E., and Filimonov, V. N., Kinet.
Kutal. 11, 989 (1969). 29. Gonzalez, R. D., and Audette, D. E., J. Catal. 17,
116 (1970). 30. Echigoya, E., Niiyama, H., and Ebitani, A., Nip-
pon Kogaku Kaishi, 222 (1974). 31. Otto, K., and Shelef, M., J. Phys. Chem. Neue
Folge. 86, 308 (1973). 32. Uchida, M., and Bell, A. T., J. Catal. 60, 204
(1979). 33. Schwank, J., Gold Bull. 16, 103 (1983). 34. Wise, H., and Sancier, K. M., J. Catal. 2, 149
(1963). 35. Galvagno, S., Schwank, J., and Parravano, G., J.
Cafal. 61, 223 (1980). 36. Galvagno, S., Schwank, J., Parravano, G., Gar-
bassi, F., Marzi, A., and Tauszik, G. R., J. Catal. 69, 283 (1981).
37. Bassi, I. W., Lytle, F. W., and Parravano, G., J. Catal. 42, 139 (1976).
38. Bassi, I. W., Garbassi, F., Vlaic, G., Marzi, A., Tauszik, G. R., Cocco, G., Galvagno, S., and Par- ravano, G., J. Catal. 65, 405 (1980).
39. Detgass, W. N., Boudart, M.. and Parravano, G., J. Phys. Chrm. 72, 3563 (1968).
40. Lee, J. Y., Ph.D. thesis. The University of Michi- gan, 1985.