Embed Size (px)
Citation preview
Infrared Spectra and Photochemistry of Matrix-Isolated Pyrrole-2-carbaldehyde
Barbara Michela Giuliano,* Igor Reva, and Rui FaustoDepartment of Chemistry, UniVersity of Coimbra, 3004-535 Coimbra, Portugal
ReceiVed: NoVember 23, 2009; ReVised Manuscript ReceiVed: January 13, 2010
Monomeric pyrrole-2-carbaldehyde (P2C) was isolated in low-temperature argon and xenon matrices, and itsUV-induced photochemistry was studied. The structures of the reagent as well as the reaction photoproductswere characterized by FTIR spectroscopy. Interpretation of the experimental results was assisted by theoreticalcalculations carried out at the MP2 and DFT (B3LYP) levels with the 6-311++G(d,p) basis set. The compoundcan assume two conformations, cis and trans, regarding the orientation of the N-C-CdO dihedral angle.The cis form is the conformational ground state, being more stable than the trans by ca. 15 kJ mol-1. Therelative stability of the two conformers was analyzed based on the comparison of their structures and usingthe natural bond orbital method. In agreement with the calculations, only the signature of the cis conformerwas found in the experimental FTIR spectra of matrix-isolated P2C monomers. UV irradiation (λ > 235 nm)readily converts the cis-P2C into the trans-P2C form, and a photostationary equilibrium is established wherethe [cis]/[trans] ratio is ca. 3.3:1 in both Ar and Xe. Upon prolonged irradiation, P2C slowly undergoesphotolysis to [pyrrole + CO]. In matrices, pyrrole and CO form associates of different geometry, whichcould be characterized based on their vibrational signatures.
Introduction
Pyrroles are known as common building blocks of manychemical systems of biological interest. Porphyrins (e.g., heme),chlorophylls, and bilanes (e.g., bilirubin) are well-knownexamples of tetrapyrrole compounds in which the pyrrole ringsare interconnected in a cyclic or linear way.
Over the past decades, enormous progress has been achievedin the chemistry of synthetic porphyrins. One possible compo-nent to build porphyrins with unsubstituted meso positions,which was originally used by Fischer and Gleim in one of thefirst syntheses of porphine,1 is pyrrole-2-carbaldehyde (P2C).2
Understanding of the rotational isomerism in simple prototypemolecules, like P2C, can be important in their syntheticapplications. CdO and N-H groups as they occur in P2C, inthe R position, are characteristic of amino acid residues inpeptides, and the dimer structure of P2C has been discussed inthe context of the peptide �-sheet motif.3 This similaritystimulates further interest to P2C and its conformationalproperties.
Previous experiments in the gas phase, by microwavespectroscopy4 and infrared in supersonic jet expansion,3 and insolutions5-7 as well as theoretical investigations3,5,8 showed thatP2C adopts the conformation where the N-C-CdO dihedralangle is in the cis orientation (Figure 1). The trans conformerhas a high relative energy, and its equilibrium population atroom temperature was estimated to be very low, ,1%.3 Indeed,the experimental observation of the trans conformation of P2Chas not been previously reported. However, in similar molecules,like 3-pyridinecarbaldehyde in the gas phase,9 and a series ofaromatic aldehydes isolated in cryogenic argon matrices,10,11
internal rotation of the aldehyde group has been shown to takeplace upon UV excitation. For these matrix-isolated molecules,the photoproduced minor conformers could be successfullytrapped in the matrix and characterized.10,11
One of the objectives of the present work was the experi-mental characterization of the P2C conformers, with emphasison its minor form. The method of matrix isolation in solidifiedinert gases combined with infrared spectroscopy is one of themost appropriate experimental techniques for such studies.Application of this method allowed us to photochemicallygenerate the minor trans conformer of P2C in cryogenic matricesand undertake its experimental characterization. Theoreticalaspects of the conformational structure of P2C are addressedin this work too. In the course of this study, P2C was found toundergo UV-induced photodecomposition. The products ofphotolysis were characterized by infrared spectroscopy, and theresults were interpreted with the aid of methods of theoreticalchemistry.
Experimental and Computational Methods
A commercial sample of P2C (Aldrich, 98%) was usedwithout further purification.
Matrices were prepared by codeposition of vapors of P2C(kept at room temperature) with a large excess of the matrixgas (argon N60 or xenon N48; both obtained from Air Liquide)onto the CsI optical substrate of the cryostat kept at 10 and 30K for Ar and Xe matrices, respectively. An APD Cryogenics
* To whom correspondence should be addressed. E-mail: [email protected].
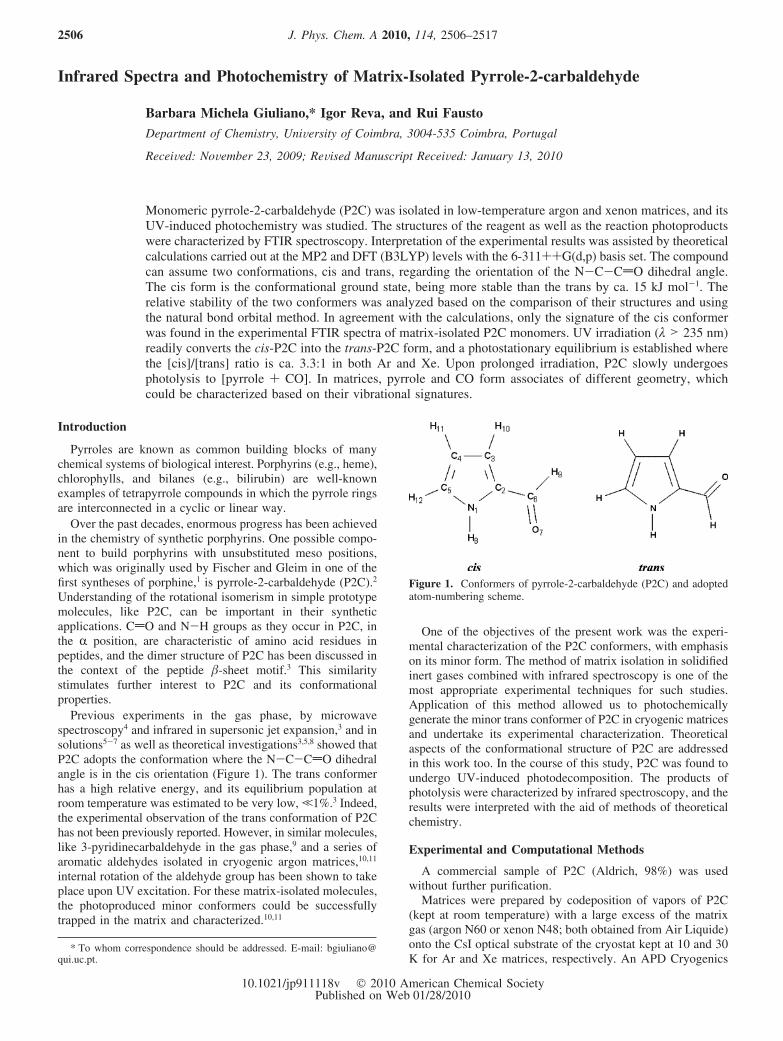
Figure 1. Conformers of pyrrole-2-carbaldehyde (P2C) and adoptedatom-numbering scheme.
J. Phys. Chem. A 2010, 114, 2506–25172506
10.1021/jp911118v 2010 American Chemical SocietyPublished on Web 01/28/2010

closed-cycle helium refrigeration system with a DE-202Aexpander was used in all experiments, the temperature beingmeasured directly at the sample holder by a silicon diodetemperature sensor, connected to a digital controller (ScientificInstruments, model 9650-1), with an accuracy of 0.1 K. Thematrices were irradiated using a series of long-pass optical filtersthrough a quartz or KBr external window of the cryostat usinga 200 W output power of a Hg(Xe) lamp (Oriel, Newport).
The IR spectra were recorded using a Nicolet 6700 Fouriertransform infrared spectrometer, equipped with a deuteratedtriglycine sulfate (DTGS) detector and a Ge/KBr beam splitter,with 0.5 cm-1 spectral resolution. The instrument was purgedby a stream of dry air to remove water and CO2 vapors.
The quantum chemical calculations were performed withGaussian 0312 at the DFT and MP2 levels of theory using thestandard 6-311++G(d,p) basis set.13 In the DFT calculations,the three-parameter density functional B3LYP, which includesBecke’s gradient exchange correction14 and the Lee, Yang, andParr correlation functional,15 was used. Vibrational spectra werecalculated at the same levels of theory, the calculated wave-numbers being later on scaled down using appropriate scalefactors in order to correct for vibrational anharmonicity, basisset truncation, and the neglected part of electron correlation.The transition-state structure and energy barrier for conforma-tional interconversion were obtained using the synchronoustransit-guided quasi-Newton (STQN) method.16 Natural bondorbital (NBO) analysis was performed using NBO 3, asimplemented in Gaussian 03, for both cis- and trans-P2Cconformers in order to shed light on the dominant orbitalinteractions in each form.
Normal coordinate analysis was undertaken in the internalcoordinates space, as described by Schachtschneider and Mor-timer,17 using the optimized geometries and harmonic forceconstants resulting from the DFT calculations. The internalcoordinates used in this analysis were defined as recommendedby Pulay et al.18
Results and Discussion
Geometries and Relative Energies of Conformers. Figure1 shows the geometries of the cis and trans conformers of P2Ctogether with the adopted atom-numbering scheme. Bothminimum energy structures possess a planar geometry with Cs
symmetry. The optimized geometrical parameters obtained forthe two conformers are given in Table S1 (Supporting Informa-tion).
In agreement with the previously reported studies,3-8 the DFTcalculations yielded the cis conformer considerably more stablethan the trans form (∆G298(trans - cis) ) 14.7 kJ mol-1),predicting that its abundance in the gas-phase equilibriumconformational mixture at room temperature should be 99.7%.The calculated energy barrier for cis f trans conversion wasfound to be 65.2 kJ mol-1 (50.5 kJ mol-1 in the reversedirection).
From the energetic point of view, the two conformers of P2Cdiffer essentially in the stabilizing interaction between the bonddipoles associated with the N-H and CdO bonds. These dipolesare in a nearly antiparallel orientation in the cis conformer andcontribute strongly to its stabilization. Such interaction is absentin the trans conformer, where it is replaced by a weakerstabilizing interaction between the N-H and aldehyde C-Hbond dipoles. Note that these interactions are affected by theextension of the electron delocalization within the molecule(Figure 2). Accordingly, it has been proposed that theirimportance in P2C is amplified by the extensive electron
delocalization involving the pyrrole ring and the carbaldehydesubstituent resulting from the great π-electron-donating abilityof the ring nitrogen atom.3
Comparison of geometries of the two conformers supportsthe proposed interpretation for their relative energies. Forexample, the CdO and C2-C3 bonds are longer and theC2-C6 bond is shorter in the cis than in the trans conformer(122.08, 139.23, and 144.52 pm in cis vs 121.53, 139.04, and144.90 pm in trans; see Table S1 (Supporting Information)),testifying to the delocalization within the π system from thepyrrole ring to the carbonyl group (see Figure 2). Moreover,analysis of the intramolecular Coulombic interactions leads tothe same conclusion. The calculated atomic polar tensor (APT)charges19 are shown in Table 1. The main dipole-dipoleinteraction between the ring and the carbaldehyde group occursbetween the N-H moiety of the ring (for both forms) and CdO(cis) or C-H (trans) bond dipole of the CHO group. In bothconformers these dipoles are antiparallel and stabilizing, but inthe cis form this stabilizing interaction is much stronger than
Figure 2. (A and B) Mesomeric structures assuming π-electrondelocalization from the nitrogen atom to the carbaldehyde moiety. (C)Dominant canonical form, where such delocalization does not occur.
TABLE 1: Atomic charges (atomic polar tensor, APT, andnatural bond orbital, NBO, types) of Cis and TransConformers of P2C Obtained from the B3LYP/6-311++G(d,p) Calculations
charges
APT NBO
atom (typeand number) cis trans cis trans
N1 –0.254 –0.198 –0.503 –0.509C2 –0.376 –0.370 0.005 0.005C3 0.112 0.084 –0.215 –0.205C4 –0.191 –0.201 –0.294 –0.284C5 0.001 –0.016 0.010 –0.003C6 1.079 1.109 0.379 0.379O7 –0.822 –0.819 –0.569 –0.541H8 0.261 0.243 0.423 0.406H9 –0.046 –0.080 0.118 0.096H10 0.080 0.093 0.219 0.231H11 0.073 0.072 0.219 0.219H12 0.083 0.083 0.208 0.207
Matrix-Isolated Pyrrole-2-carbaldehyde J. Phys. Chem. A, Vol. 114, No. 7, 2010 2507
in the trans form as it follows from the analysis of the calculatedcharges (See Table 1).
A more detailed and powerful analysis of the electronic-typeinteractions within a molecule can be performed using thenatural bond orbital (NBO) approach.20 It allows for insight intoorbital interactions resulting from the second-order perturbationtheory analysis of the Fock matrix.20,21 According to this method,orbital interaction energies, E(2), between filled and emptyNBOs (including non-Lewis extra valence Rydberg orbitals) areobtained from the second-order perturbation approach
where Fij2 is the Fock matrix element between i and j NBO
orbitals, εj and εi are the energies of the acceptor and donorNBOs, and qi is the occupancy of the donor orbital.
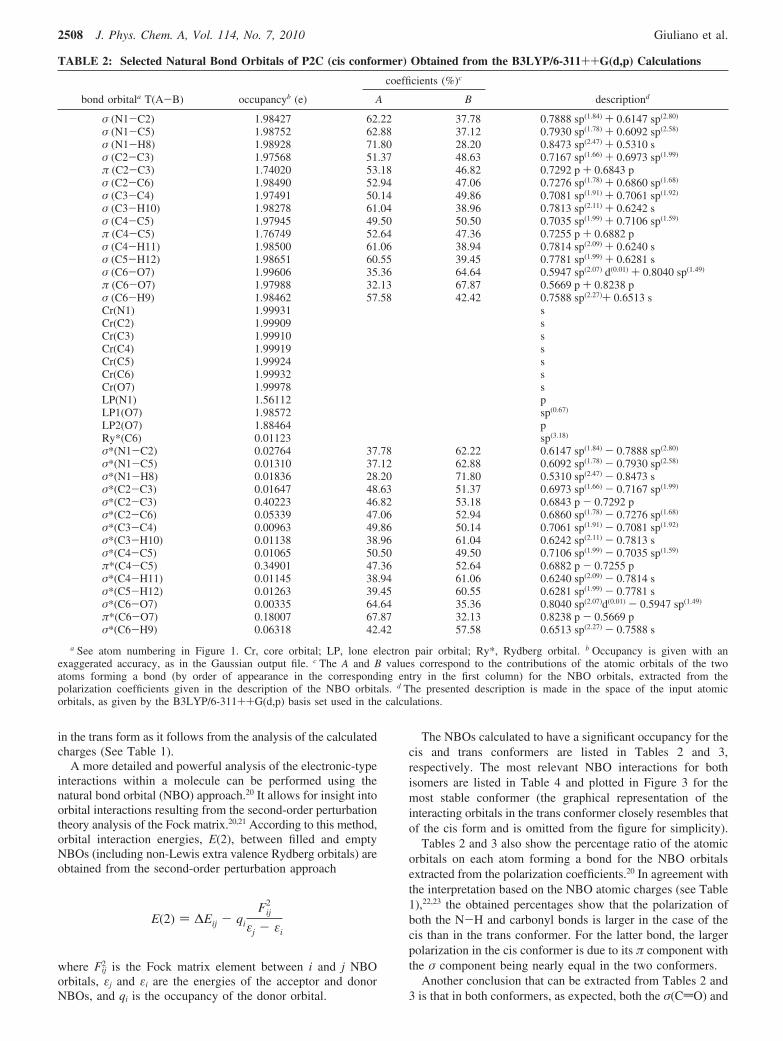
The NBOs calculated to have a significant occupancy for thecis and trans conformers are listed in Tables 2 and 3,respectively. The most relevant NBO interactions for bothisomers are listed in Table 4 and plotted in Figure 3 for themost stable conformer (the graphical representation of theinteracting orbitals in the trans conformer closely resembles thatof the cis form and is omitted from the figure for simplicity).
Tables 2 and 3 also show the percentage ratio of the atomicorbitals on each atom forming a bond for the NBO orbitalsextracted from the polarization coefficients.20 In agreement withthe interpretation based on the NBO atomic charges (see Table1),22,23 the obtained percentages show that the polarization ofboth the N-H and carbonyl bonds is larger in the case of thecis than in the trans conformer. For the latter bond, the largerpolarization in the cis conformer is due to its π component withthe σ component being nearly equal in the two conformers.
Another conclusion that can be extracted from Tables 2 and3 is that in both conformers, as expected, both the σ(CdO) and
TABLE 2: Selected Natural Bond Orbitals of P2C (cis conformer) Obtained from the B3LYP/6-311++G(d,p) Calculations
coefficients (%)c
bond orbitala T(A-B) occupancyb (e) A B descriptiond
σ (N1-C2) 1.98427 62.22 37.78 0.7888 sp(1.84) + 0.6147 sp(2.80)
σ (N1-C5) 1.98752 62.88 37.12 0.7930 sp(1.78) + 0.6092 sp(2.58)
σ (N1-H8) 1.98928 71.80 28.20 0.8473 sp(2.47) + 0.5310 sσ (C2-C3) 1.97568 51.37 48.63 0.7167 sp(1.66) + 0.6973 sp(1.99)
π (C2-C3) 1.74020 53.18 46.82 0.7292 p + 0.6843 pσ (C2-C6) 1.98490 52.94 47.06 0.7276 sp(1.78) + 0.6860 sp(1.68)
σ (C3-C4) 1.97491 50.14 49.86 0.7081 sp(1.91) + 0.7061 sp(1.92)
σ (C3-H10) 1.98278 61.04 38.96 0.7813 sp(2.11) + 0.6242 sσ (C4-C5) 1.97945 49.50 50.50 0.7035 sp(1.99) + 0.7106 sp(1.59)
π (C4-C5) 1.76749 52.64 47.36 0.7255 p + 0.6882 pσ (C4-H11) 1.98500 61.06 38.94 0.7814 sp(2.09) + 0.6240 sσ (C5-H12) 1.98651 60.55 39.45 0.7781 sp(1.99) + 0.6281 sσ (C6-O7) 1.99606 35.36 64.64 0.5947 sp(2.07) d(0.01) + 0.8040 sp(1.49)
π (C6-O7) 1.97988 32.13 67.87 0.5669 p + 0.8238 pσ (C6-H9) 1.98462 57.58 42.42 0.7588 sp(2.27)+ 0.6513 sCr(N1) 1.99931 sCr(C2) 1.99909 sCr(C3) 1.99910 sCr(C4) 1.99919 sCr(C5) 1.99924 sCr(C6) 1.99932 sCr(O7) 1.99978 sLP(N1) 1.56112 pLP1(O7) 1.98572 sp(0.67)
LP2(O7) 1.88464 pRy*(C6) 0.01123 sp(3.18)
σ*(N1-C2) 0.02764 37.78 62.22 0.6147 sp(1.84) - 0.7888 sp(2.80)
σ*(N1-C5) 0.01310 37.12 62.88 0.6092 sp(1.78) - 0.7930 sp(2.58)
σ*(N1-H8) 0.01836 28.20 71.80 0.5310 sp(2.47) - 0.8473 sσ*(C2-C3) 0.01647 48.63 51.37 0.6973 sp(1.66) - 0.7167 sp(1.99)
σ*(C2-C3) 0.40223 46.82 53.18 0.6843 p - 0.7292 pσ*(C2-C6) 0.05339 47.06 52.94 0.6860 sp(1.78) - 0.7276 sp(1.68)
σ*(C3-C4) 0.00963 49.86 50.14 0.7061 sp(1.91) - 0.7081 sp(1.92)
σ*(C3-H10) 0.01138 38.96 61.04 0.6242 sp(2.11) - 0.7813 sσ*(C4-C5) 0.01065 50.50 49.50 0.7106 sp(1.99) - 0.7035 sp(1.59)
π*(C4-C5) 0.34901 47.36 52.64 0.6882 p - 0.7255 pσ*(C4-H11) 0.01145 38.94 61.06 0.6240 sp(2.09) - 0.7814 sσ*(C5-H12) 0.01263 39.45 60.55 0.6281 sp(1.99) - 0.7781 sσ*(C6-O7) 0.00335 64.64 35.36 0.8040 sp(2.07)d(0.01) - 0.5947 sp(1.49)
π*(C6-O7) 0.18007 67.87 32.13 0.8238 p - 0.5669 pσ*(C6-H9) 0.06318 42.42 57.58 0.6513 sp(2.27) - 0.7588 s
a See atom numbering in Figure 1. Cr, core orbital; LP, lone electron pair orbital; Ry*, Rydberg orbital. b Occupancy is given with anexaggerated accuracy, as in the Gaussian output file. c The A and B values correspond to the contributions of the atomic orbitals of the twoatoms forming a bond (by order of appearance in the corresponding entry in the first column) for the NBO orbitals, extracted from thepolarization coefficients given in the description of the NBO orbitals. d The presented description is made in the space of the input atomicorbitals, as given by the B3LYP/6-311++G(d,p) basis set used in the calculations.
E(2) ) ∆Eij - qi
Fij2
εj - εi
2508 J. Phys. Chem. A, Vol. 114, No. 7, 2010 Giuliano et al.
π(CdO) bonding orbitals are strongly polarized, this polarizationbeing opposite regarding the corresponding antibonding orbitals.
Interestingly, the occupancy of the π*(CdO) orbital is largerin the cis (0.180 e) than in the trans (0.172 e) form, clearlyrevealing the most important π-electron charge delocalizationfrom the pyrrole ring toward the carbonyl bond. This point willbe considered in more detail below.
The descriptions of the NBOs associated with the carbonylgroup show that in both conformers the carbonyl carbon atom,as expected, is sp2 hybridized, with the hybrid orbital formingthe σ bond with C2 having a larger s character compared tothose forming both the σ bond with the carbonyl oxygen andthe C-H bond. Moreover, in the two conformers, the carbonyloxygen atom is sp hybridized, with one of the two hybridorbitals forming the σ(CdO) bond and the other being occupiedby a lone pair of electrons while the two p orbitals form theπ(CdO) bond and accommodate the second lone electron pair.The occupancy of the sp-hybrid lone-pair orbital of the carbonyloxygen is relatively high (1.986 and 1.985 e in the cis and transforms, respectively), while that of the second lone-pair orbital
TABLE 3: Selected Natural Bond Orbitals of P2C (trans conformer) Obtained from the B3LYP/6-311++G(d,p) Calculations
coefficients (%)c
bond orbitalaT(A-B) occupancyb (e) A B descriptiond
σ (N1-C2) 1.98580 62.56 37.44 0.7909 sp(1.81) + 0.6119 sp(2.84)
σ (N1-C5) 1.98769 63.06 36.94 0.7941 sp(1.78) + 0.6078 sp(2.60)
σ (N1-H8) 1.98961 70.95 29.05 0.8423 sp(2.53) + 0.5390 sσ (C2-C3) 1.97316 51.46 48.54 0.7174 sp(1.64) + 0.6967 sp(2.00)
π (C2-C3) 1.74180 54.01 45.99 0.7349 p + 0.6782 pσ (C2-C6) 1.98469 52.88 47.12 0.7272 sp(1.77) + 0.6865 sp(1.64)
σ (C3-C4) 1.97465 49.96 50.04 0.7068 sp(1.92) + 0.7074 sp(1.91)
σ (C3-H10) 1.98199 61.58 38.42 0.7848 sp(2.08) + 0.6198 sσ (C4-C5) 1.97936 49.40 50.60 0.7028 sp(1.99) + 0.7114 sp(1.58)
π (C4-C5) 1.76635 51.74 48.26 0.7193 p + 0.6947 pσ (C4-H11) 1.98478 61.06 38.94 0.7814 sp(2.10) + 0.6240 sσ (C5-H12) 1.98647 60.51 39.49 0.7779 sp(1.98) + 0.6284 sσ (C6-O7) 1.99573 35.39 64.61 0.5949 sp(2.02)d(0.01) + 0.8038 sp(1.46)
π (C6-O7) 1.97997 33.01 66.99 0.5746 p + 0.8185 pσ (C6-H9) 1.98527 56.67 43.33 0.7528 sp(2.38) + 0.6583 sCr(N1) 1.99933 sCr(C2) 1.99908 sCr(C3) 1.99908 sCr(C4) 1.99919 sCr(C5) 1.99924 sCr(C6) 1.99933 sCr(O7) 1.99977 sLP(N1) 1.57426 pLP1(O7) 1.98548 sp(0.68)
LP2(O7) 1.87594 pRy*(C6) 0.01172 sp(5.41)d(0.11)
σ*(N1-C2) 0.02500 37.44 62.56 0.6119 sp(1.81) - 0.7909 sp(2.84)
σ*(N1-C5) 0.01292 36.94 63.06 0.6078 sp(1.78) - 0.7941 sp(2.60)
σ*(N1-H8) 0.01828 29.05 70.95 0.5390 sp(2.53) - 0.8423 sσ*(C2-C3) 0.01943 48.54 51.46 0.6967 sp(1.64) - 0.7174 sp(2.00)
σ*(C2-C3) 0.39118 45.99 54.01 0.6782 p - 0.7349 pσ*(C2-C6) 0.05509 47.12 52.88 0.6865 sp(1.77) - 0.7272 sp(1.64)
σ*(C3-C4) 0.00965 50.04 49.96 0.7074 sp(1.92) - 0.7068 sp(1.91)
σ*(C3-H10) 0.01100 38.42 61.58 0.6198 sp(2.08) - 0.7848 sσ*(C4-C5) 0.01078 50.60 49.40 0.7114 sp(1.99) - 0.7028 sp(1.58)
π*(C4-C5) 0.35449 48.26 51.74 0.6947 p - 0.7193 pσ*(C4-H11) 0.01155 38.94 61.06 0.6240 sp(2.10) - 0.7814 sσ*(C5-H12) 0.01264 39.49 60.51 0.6284 sp(1.98) - 0.7779 sσ*(C6-O7) 0.00330 64.61 35.39 0.8038 sp(2.02)d(0.01) - 0.5949 sp(1.46)
π*(C6-O7) 0.17244 66.99 33.01 0.8185 p - 0.5746 pσ*(C6-H9) 0.07086 43.33 56.67 0.6583 sp(2.38) - 0.7528 s
a See atom numbering in Figure 1. Cr, core orbital; LP, lone electron pair orbital; Ry*, Rydberg orbital. b Occupancy is given with anexaggerated accuracy, as in the Gaussian output file. c The A and B values correspond to the contributions of the atomic orbitals of the twoatoms forming a bond (by order of appearance in the corresponding entry in the first column) for the NBO orbitals, extracted from thepolarization coefficients given in the description of the NBO orbitals. d The presented description is made in the space of the input atomicorbitals, as given by the 6-311++G(d,p) basis set used in the calculations.
TABLE 4: Stabilization Energies for Selected NBO Pairs AsGiven by Second Order Perturbation Theory Analysis of theFock Matrix in the NBO Basis for P2C (conformers cis andtrans) Obtained from the B3LYP/6-311++G(d,p)Calculationsa
E(2)b
pair name donor NBO acceptor NBO cis trans
A π(C2-C3) π*(C4-C5) 77.91 81.59B π(C4-C5) π*(C2-C3) 89.70 90.54C LP(N1) π*(C2-C3) 149.16 136.40D LP(N1) π*(C4-C5) 170.37 162.21E π(C2-C3) π*(C6-O7) 104.06 96.99F LP2(O7) σ*(C2-C6) 68.91 70.96G LP2(O7) σ*(C6-H9) 91.88 98.32
a See atom numbering in Figure 1. See Figure 3 where orbitalsA-G for the cis conformer are shown graphically. LP, lone electronpair orbital. b Energies in kJ mol-1.
Matrix-Isolated Pyrrole-2-carbaldehyde J. Phys. Chem. A, Vol. 114, No. 7, 2010 2509
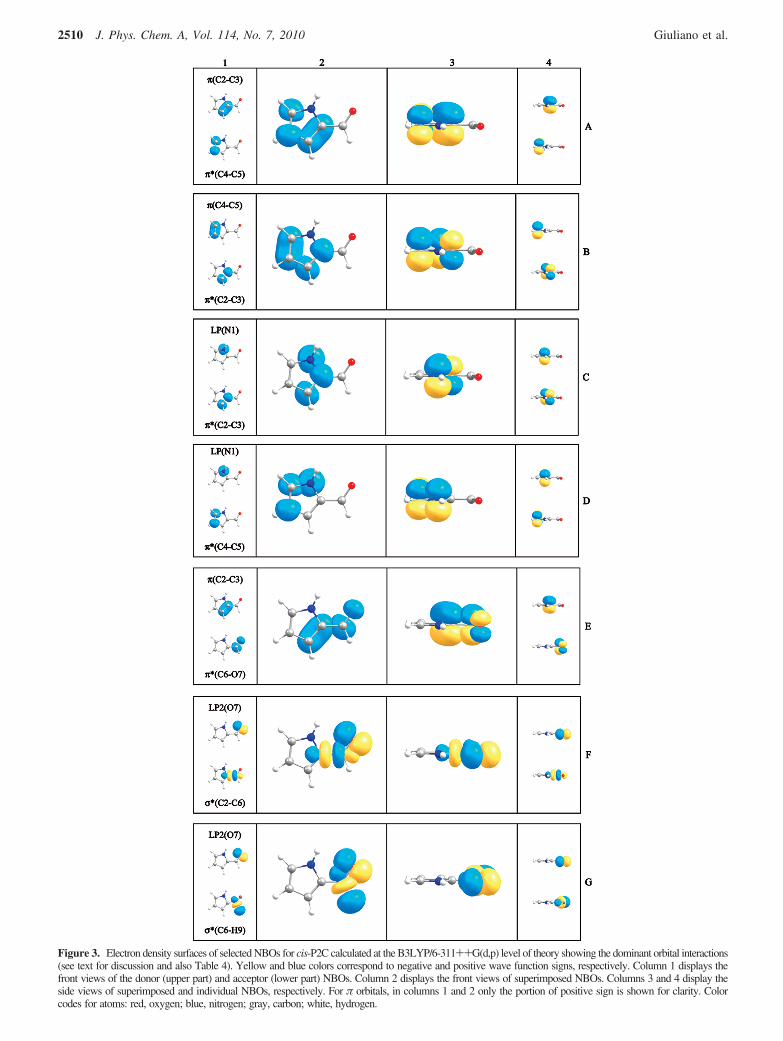
Figure 3. Electron density surfaces of selected NBOs for cis-P2C calculated at the B3LYP/6-311++G(d,p) level of theory showing the dominant orbital interactions(see text for discussion and also Table 4). Yellow and blue colors correspond to negative and positive wave function signs, respectively. Column 1 displays thefront views of the donor (upper part) and acceptor (lower part) NBOs. Column 2 displays the front views of superimposed NBOs. Columns 3 and 4 display theside views of superimposed and individual NBOs, respectively. For π orbitals, in columns 1 and 2 only the portion of positive sign is shown for clarity. Colorcodes for atoms: red, oxygen; blue, nitrogen; gray, carbon; white, hydrogen.
2510 J. Phys. Chem. A, Vol. 114, No. 7, 2010 Giuliano et al.
is comparatively low and considerably larger in the cis than inthe trans conformer (1.884 vs 1.875 e), indicating that the latterorbital is involved in charge back-donation and that this effectis more important in trans than cis. As discussed below, thisback-donation occurs in the direction of both the C2-C6 bondand, predominantly, C-H aldehyde bond. The relative impor-tance of the oxygen lone electron pair p orbital for the σ*(C-H)orbital back-donation is also revealed by its relative occupanciesin the two conformers (0.063 e in cis vs 0.070 e in trans; seeTables 2 and 3).
As shown in Table 4, the most important NBO interactionsin both P2C conformers are of the same type. However, theirrelative importance is significantly different. The interactionsassociated with the π system are clearly more important for thecis than for the trans form, whereas the opposite trend is foundfor NBO interactions associated with the σ system.
The greater importance of the π-type interactions in cis is inagreement with the more relevant π-electron delocalization inthis form already pointed out above and extracted from thestructural data, atomic charges, and NBO descriptions andpolarizations. Orbital interactions of types A and B in Table 4reflect the delocalization over the carbon atoms of the pyrrolering, those of types C and D between the nitrogen lone electronpair and the carbon ring atoms, and, finally, that of type Ebetween the C2-C3 bond of the pyrrole ring and the carbonylgroup (see also Figure 3). On the whole, these interactions showthe larger importance of the mesomeric structures A and B (seeFigure 2) in cis- than in trans-P2C. As extracted from Table 4(lines A-E, inclusive), the π-system stabilizing energy in thecis form is larger than in the trans form by 23.47 kJ mol-1.
On the other hand, the σ-type NBO interactions (F and G inTable 4) are slightly greater in trans- than in cis-P2C. Thisshows that the back-donation from the oxygen lone electronpairs (specifically the p-type lone pair; LP2) to the C2-C6 bondand, in particular, to the C-H aldehyde bond is more importantin trans- than in cis-P2C. This back-donation effect is wellknown and was described long ago as the most important effectleading to the observed elongation of a C-H bond connectedto a carbonyl moiety as well as to its reduced C-H stretchingfrequency (e.g., in aldehydes and formic acid derivatives).24-26
The reasons for the slightly greater importance of this effect intrans-P2C compared to cis-P2C were not fully understood, butone possibility is that it is, at least partially, a consequence ofthe closest proximity between the oxygen and the aldehydehydrogen atoms in the trans conformer, where the OdCH angleis smaller than in the cis form (120.27° vs 121.17°). Thedifference in the value of this angle in the two conformers is,however, small enough to lead us to present such a hypothesisjust as a tentative one.
Interestingly, the energy difference in the seven main stabiliz-ing NBO interactions in cis- and trans-P2C shown in Table 4amounts to 14.98 kJ mol-1, i.e., it matches very well thecalculated electronic energy difference (at the B3LYP level oftheory) between the two conformers (∆E) 16.1 kJ mol-1),providing strong evidence of the prevalence of strictly electronicfactors for the relative stability of the two conformers.
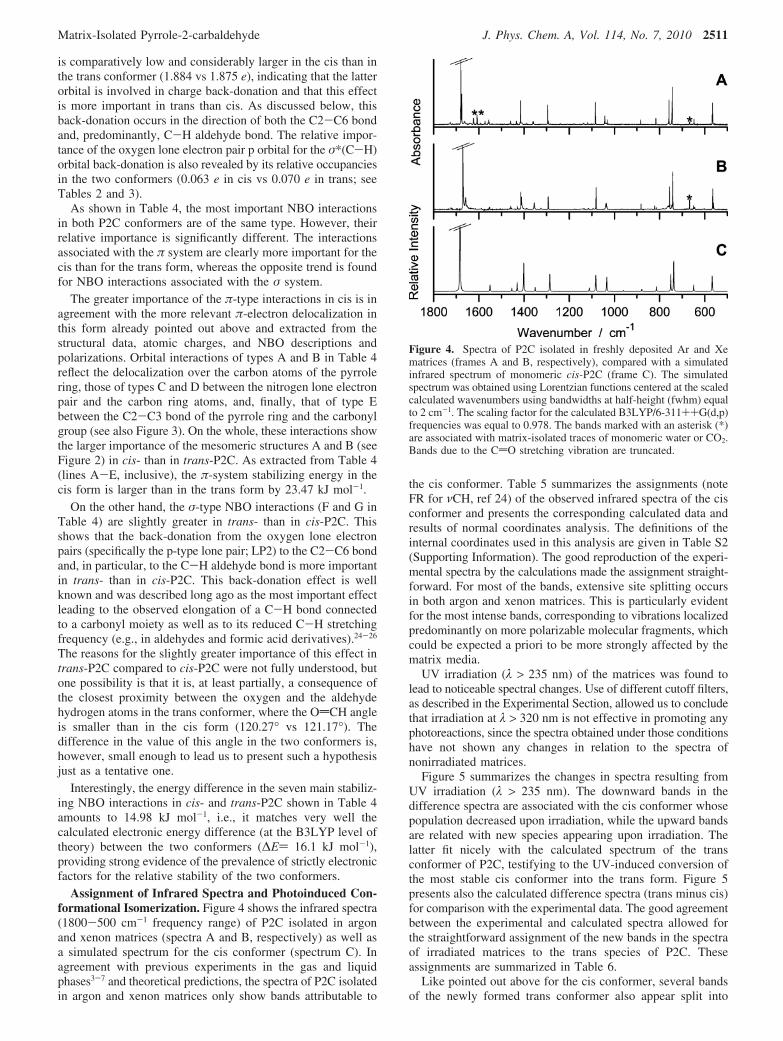
Assignment of Infrared Spectra and Photoinduced Con-formational Isomerization. Figure 4 shows the infrared spectra(1800-500 cm-1 frequency range) of P2C isolated in argonand xenon matrices (spectra A and B, respectively) as well asa simulated spectrum for the cis conformer (spectrum C). Inagreement with previous experiments in the gas and liquidphases3-7 and theoretical predictions, the spectra of P2C isolatedin argon and xenon matrices only show bands attributable to
the cis conformer. Table 5 summarizes the assignments (noteFR for νCH, ref 24) of the observed infrared spectra of the cisconformer and presents the corresponding calculated data andresults of normal coordinates analysis. The definitions of theinternal coordinates used in this analysis are given in Table S2(Supporting Information). The good reproduction of the experi-mental spectra by the calculations made the assignment straight-forward. For most of the bands, extensive site splitting occursin both argon and xenon matrices. This is particularly evidentfor the most intense bands, corresponding to vibrations localizedpredominantly on more polarizable molecular fragments, whichcould be expected a priori to be more strongly affected by thematrix media.
UV irradiation (λ > 235 nm) of the matrices was found tolead to noticeable spectral changes. Use of different cutoff filters,as described in the Experimental Section, allowed us to concludethat irradiation at λ > 320 nm is not effective in promoting anyphotoreactions, since the spectra obtained under those conditionshave not shown any changes in relation to the spectra ofnonirradiated matrices.
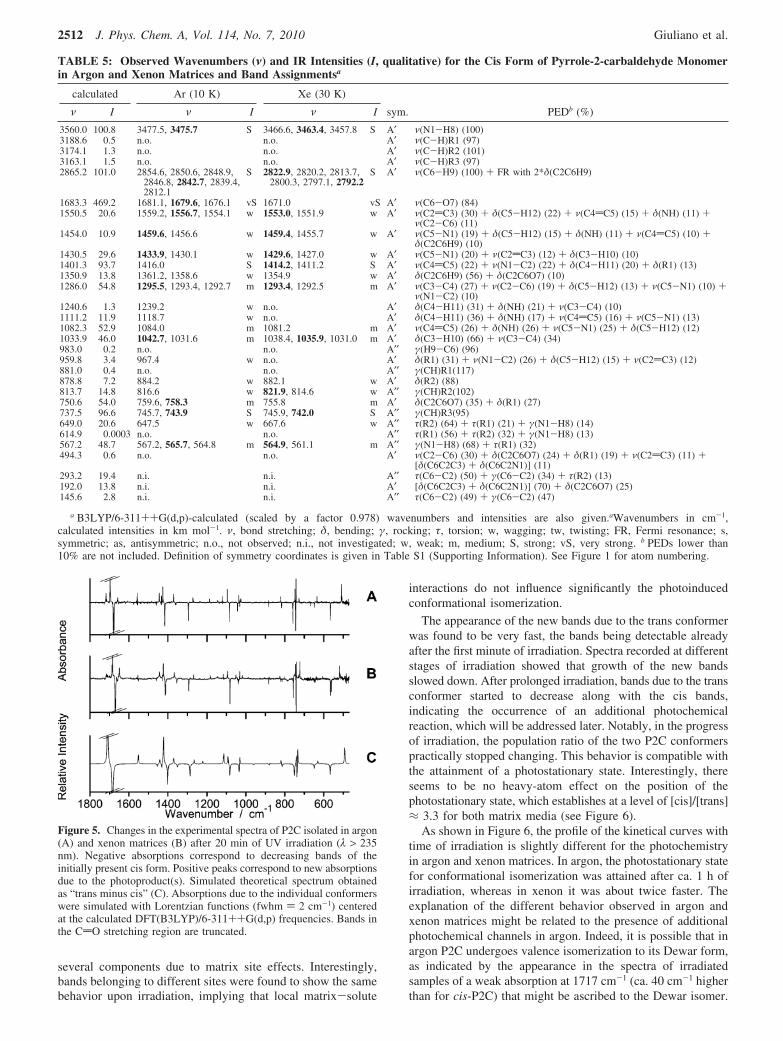
Figure 5 summarizes the changes in spectra resulting fromUV irradiation (λ > 235 nm). The downward bands in thedifference spectra are associated with the cis conformer whosepopulation decreased upon irradiation, while the upward bandsare related with new species appearing upon irradiation. Thelatter fit nicely with the calculated spectrum of the transconformer of P2C, testifying to the UV-induced conversion ofthe most stable cis conformer into the trans form. Figure 5presents also the calculated difference spectra (trans minus cis)for comparison with the experimental data. The good agreementbetween the experimental and calculated spectra allowed forthe straightforward assignment of the new bands in the spectraof irradiated matrices to the trans species of P2C. Theseassignments are summarized in Table 6.
Like pointed out above for the cis conformer, several bandsof the newly formed trans conformer also appear split into
Figure 4. Spectra of P2C isolated in freshly deposited Ar and Xematrices (frames A and B, respectively), compared with a simulatedinfrared spectrum of monomeric cis-P2C (frame C). The simulatedspectrum was obtained using Lorentzian functions centered at the scaledcalculated wavenumbers using bandwidths at half-height (fwhm) equalto 2 cm-1. The scaling factor for the calculated B3LYP/6-311++G(d,p)frequencies was equal to 0.978. The bands marked with an asterisk (*)are associated with matrix-isolated traces of monomeric water or CO2.Bands due to the CdO stretching vibration are truncated.
Matrix-Isolated Pyrrole-2-carbaldehyde J. Phys. Chem. A, Vol. 114, No. 7, 2010 2511
several components due to matrix site effects. Interestingly,bands belonging to different sites were found to show the samebehavior upon irradiation, implying that local matrix-solute
interactions do not influence significantly the photoinducedconformational isomerization.
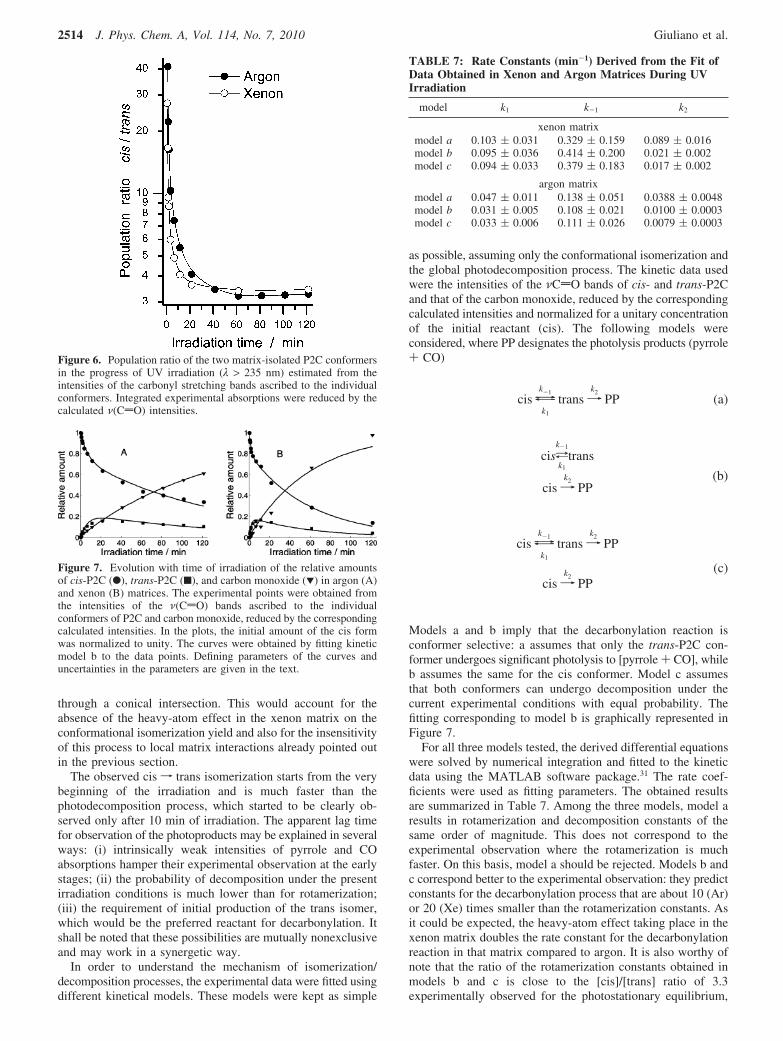
The appearance of the new bands due to the trans conformerwas found to be very fast, the bands being detectable alreadyafter the first minute of irradiation. Spectra recorded at differentstages of irradiation showed that growth of the new bandsslowed down. After prolonged irradiation, bands due to the transconformer started to decrease along with the cis bands,indicating the occurrence of an additional photochemicalreaction, which will be addressed later. Notably, in the progressof irradiation, the population ratio of the two P2C conformerspractically stopped changing. This behavior is compatible withthe attainment of a photostationary state. Interestingly, thereseems to be no heavy-atom effect on the position of thephotostationary state, which establishes at a level of [cis]/[trans]≈ 3.3 for both matrix media (see Figure 6).
As shown in Figure 6, the profile of the kinetical curves withtime of irradiation is slightly different for the photochemistryin argon and xenon matrices. In argon, the photostationary statefor conformational isomerization was attained after ca. 1 h ofirradiation, whereas in xenon it was about twice faster. Theexplanation of the different behavior observed in argon andxenon matrices might be related to the presence of additionalphotochemical channels in argon. Indeed, it is possible that inargon P2C undergoes valence isomerization to its Dewar form,as indicated by the appearance in the spectra of irradiatedsamples of a weak absorption at 1717 cm-1 (ca. 40 cm-1 higherthan for cis-P2C) that might be ascribed to the Dewar isomer.
TABLE 5: Observed Wavenumbers (ν) and IR Intensities (I, qualitative) for the Cis Form of Pyrrole-2-carbaldehyde Monomerin Argon and Xenon Matrices and Band Assignmentsa
calculated Ar (10 K) Xe (30 K)
ν I ν I ν I sym. PEDb (%)
3560.0 100.8 3477.5, 3475.7 S 3466.6, 3463.4, 3457.8 S A′ ν(N1-H8) (100)3188.6 0.5 n.o. n.o. A′ ν(C-H)R1 (97)3174.1 1.3 n.o. n.o. A′ ν(C-H)R2 (101)3163.1 1.5 n.o. n.o. A′ ν(C-H)R3 (97)2865.2 101.0 2854.6, 2850.6, 2848.9,
2846.8, 2842.7, 2839.4,2812.1
S 2822.9, 2820.2, 2813.7,2800.3, 2797.1, 2792.2
S A′ ν(C6-H9) (100) + FR with 2*δ(C2C6H9)
1683.3 469.2 1681.1, 1679.6, 1676.1 vS 1671.0 vS A′ ν(C6-O7) (84)1550.5 20.6 1559.2, 1556.7, 1554.1 w 1553.0, 1551.9 w A′ ν(C2dC3) (30) + δ(C5-H12) (22) + ν(C4dC5) (15) + δ(NH) (11) +
ν(C2-C6) (11)1454.0 10.9 1459.6, 1456.6 w 1459.4, 1455.7 w A′ ν(C5-N1) (19) + δ(C5-H12) (15) + δ(NH) (11) + ν(C4dC5) (10) +
δ(C2C6H9) (10)1430.5 29.6 1433.9, 1430.1 w 1429.6, 1427.0 w A′ ν(C5-N1) (20) + ν(C2dC3) (12) + δ(C3-H10) (10)1401.3 93.7 1416.0 S 1414.2, 1411.2 S A′ ν(C4dC5) (22) + ν(N1-C2) (22) + δ(C4-H11) (20) + δ(R1) (13)1350.9 13.8 1361.2, 1358.6 w 1354.9 w A′ δ(C2C6H9) (56) + δ(C2C6O7) (10)1286.0 54.8 1295.5, 1293.4, 1292.7 m 1293.4, 1292.5 m A′ ν(C3-C4) (27) + ν(C2-C6) (19) + δ(C5-H12) (13) + ν(C5-N1) (10) +
ν(N1-C2) (10)1240.6 1.3 1239.2 w n.o. A′ δ(C4-H11) (31) + δ(NH) (21) + ν(C3-C4) (10)1111.2 11.9 1118.7 w n.o. A′ δ(C4-H11) (36) + δ(NH) (17) + ν(C4dC5) (16) + ν(C5-N1) (13)1082.3 52.9 1084.0 m 1081.2 m A′ ν(C4dC5) (26) + δ(NH) (26) + ν(C5-N1) (25) + δ(C5-H12) (12)1033.9 46.0 1042.7, 1031.6 m 1038.4, 1035.9, 1031.0 m A′ δ(C3-H10) (66) + ν(C3-C4) (34)983.0 0.2 n.o. n.o. A′′ γ(H9-C6) (96)959.8 3.4 967.4 w n.o. A′ δ(R1) (31) + ν(N1-C2) (26) + δ(C5-H12) (15) + ν(C2dC3) (12)881.0 0.4 n.o. n.o. A′′ γ(CH)R1(117)878.8 7.2 884.2 w 882.1 w A′ δ(R2) (88)813.7 14.8 816.6 w 821.9, 814.6 w A′′ γ(CH)R2(102)750.6 54.0 759.6, 758.3 m 755.8 m A′ δ(C2C6O7) (35) + δ(R1) (27)737.5 96.6 745.7, 743.9 S 745.9, 742.0 S A′′ γ(CH)R3(95)649.0 20.6 647.5 w 667.6 w A′′ τ(R2) (64) + τ(R1) (21) + γ(N1-H8) (14)614.9 0.0003 n.o. n.o. A′′ τ(R1) (56) + τ(R2) (32) + γ(N1-H8) (13)567.2 48.7 567.2, 565.7, 564.8 m 564.9, 561.1 m A′′ γ(N1-H8) (68) + τ(R1) (32)494.3 0.6 n.o. n.o. A′ ν(C2-C6) (30) + δ(C2C6O7) (24) + δ(R1) (19) + ν(C2dC3) (11) +
[δ(C6C2C3) + δ(C6C2N1)] (11)293.2 19.4 n.i. n.i. A′′ τ(C6-C2) (50) + γ(C6-C2) (34) + τ(R2) (13)192.0 13.8 n.i. n.i. A′ [δ(C6C2C3) + δ(C6C2N1)] (70) + δ(C2C6O7) (25)145.6 2.8 n.i. n.i. A′′ τ(C6-C2) (49) + γ(C6-C2) (47)
a B3LYP/6-311++G(d,p)-calculated (scaled by a factor 0.978) wavenumbers and intensities are also given.aWavenumbers in cm-1,calculated intensities in km mol-1. ν, bond stretching; δ, bending; γ, rocking; τ, torsion; w, wagging; tw, twisting; FR, Fermi resonance; s,symmetric; as, antisymmetric; n.o., not observed; n.i., not investigated; w, weak; m, medium; S, strong; vS, very strong. b PEDs lower than10% are not included. Definition of symmetry coordinates is given in Table S1 (Supporting Information). See Figure 1 for atom numbering.
Figure 5. Changes in the experimental spectra of P2C isolated in argon(A) and xenon matrices (B) after 20 min of UV irradiation (λ > 235nm). Negative absorptions correspond to decreasing bands of theinitially present cis form. Positive peaks correspond to new absorptionsdue to the photoproduct(s). Simulated theoretical spectrum obtainedas “trans minus cis” (C). Absorptions due to the individual conformerswere simulated with Lorentzian functions (fwhm ) 2 cm-1) centeredat the calculated DFT(B3LYP)/6-311++G(d,p) frequencies. Bands inthe CdO stretching region are truncated.
2512 J. Phys. Chem. A, Vol. 114, No. 7, 2010 Giuliano et al.
However, in xenon matrix, the spectroscopic results indicatethat photochemical formation of the Dewar P2C valence isomeris suppressed. These observations are in agreement with thephotochemistry of benzene in argon and xenon matrices. Forbenzene isolated in argon matrix, photochemical production ofbenzvalene, fulvene, and Dewar benzene valence isomers wasreported, whereas no isomerization reactions were observed inxenon matrix.27 The additional photochemical channel in argonmight then compete with the conformational isomerization anddelay the establishment of the photostationary state.
A final comment on the conformational isomerization pro-cesses shall be made. After irradiation of the matrices, annealingexperiments were carried out in order to verify if the photo-chemically formed trans conformer would convert back to themost stable cis form in the dark. The matrices were thenannealed up to 30 (Ar) or 60 K (Xe), but no conversion fromthe trans to the cis conformer was found to take place. Thisresult confirms that once it is produced, the trans conformer isthermally stable in the matrix media (because the energy barrierfor its conversion to the cis form is high enough, over 50 kJmol-1, to preclude thermal isomerization). The fact that the transform is stable in a matrix opens perspectives of successfulexperiments where the isomerization reactions can be induced
by selective infrared excitation of the conformers and theirrelative amount in the matrix fully controlled in this way. Suchexperiments were recently carried out successfully in ourlaboratory for hydroxyacetone,28 where the barrier to theconformational isomerization is much lower (about 5 kJ mol-1
only) yet the photoproduced isomer is thermally stable.Photolysis. Prolonged UV irradiation of the matrix-isolated
P2C leads to its decomposition into pyrrole and CO. Thephotolytic decarbonylation was observed in both argon andxenon matrices but was more efficient in the latter. After ca.120 min of irradiation (λ > 235 nm) the photolysis consumedca. 60% of the original reactant in argon matrix, while in xenonmatrix ca. 90% of P2C was decomposed. This observed heavy-atom effect on the photolysis suggests the participation of theT1 state in the process, which is well known to be involved inthe R cleavage in ketones and aldehydes.29-32 Indeed, thephotolysis of the compound after prolonged irradiation mostprobably occurs predominantly through homolytic cleavage ofthe C2-C6 bond in the T1 surface, after intersystem crossingfollowing excitation to S1. It has to be noted, instead, that thephotoinduced conformational isomerization above discussedmost probably occurs in the S1 state or partially in the S1
potential-energy surface with relaxation to the ground state
TABLE 6: Observed Wavenumbers (ν) and IR Intensities (I, qualitative) for the Trans Form of Pyrrole-2-carbaldehydeMonomer in Argon and Xenon Matrices and Band Assignmentsa
calculated Ar (10 K) Xe (30 K)
ν I ν I ν I sym PEDb (%)
3568.7 75.0 3487.4, 3484.5 m 3469.5, 3468.0 m A′ ν(N1-H8) (100)3189.9 0.8 n.o. n.o. A′ ν(C-H)R1 (97)3182.4 0.02 n.o. n.o. A′ ν(C-H)R2 (90)3167.3 1.8 n.o. n.o. A′ ν(C-H)R3 (92)2781.3 153.2 2766.8, 2756.3 S 2750.9 S A′ ν(C6-H9) (100)1709.1 419.8 1698.2, 1696.6, 1695.1 vS 1686.6, 1684.3 vS A′ ν(C6-O7) (86)1551.3 56.8 1557.7 m 1553.2 m A′ ν(C2dC3) (31) + ν(C4dC5) (17) + δ(NH) (16) + ν(C2-C6) (12)1441.5 19.4 1445.0, 1444.0 w 1443.1 w A′ ν(C5-N1) (28) + δ(C5-H12) (22) + ν(C3-C4) (18)1429.3 10.4 1432.8 w n.o A′ δ(C2C6H9) (24) + ν(N1-C2) (22) + δ(NH) (18) + ν(C2dC3)
(16)1422.1 123.2 1425.6 S 1423.9 S A′ ν(C4dC5) (23) + δ(C2C6H9) (14) + ν(C2-C6) (13) + δ(R1) (10)
+ ν(C2dC3) (10) + δ(C5-H12) (10)1370.2 25.6 1370.3 w 1367.7, 1366.2 w A′ δ(C2C6H9) (36) + ν(C3-C4) (15) + δ(C4-H11) (13) +
ν(C4dC5) (11)1265.0 20.0 1271.1, 1267.5 w 1268.3 w A′ δ(C3-H10) (32) + ν(C3-C4) (21) + ν(C5-N1) (13) + ν(C2-C6)
(10) + δ(C4-H11) (10)1221.0 12.9 n.o. n.o A′ ν(N1-C2) (32) + δ(NH) (16)1112.9 52.6 n.o. 1115.5 m A′ δ(C5-H12) (37) + ν(C5-N1) (32) + δ(NH) (21)1091.9 35.5 1095.5 w 1094.9 w A′ ν(C4dC5) (39) + δ(C4-H11) (19) + ν(C5-N1) (11)1030.8 41.9 1035.8 w 1031.7 w A′ δ(C3-H10) (39) + ν(C3-C4) (32) + δ(C4-H11) (22)981.3 0.01 n.o. n.o. A′′ γ(H9-C6) (96)959.3 0.8 n.o. n.o. A′ δ(R1) (30) + ν(C2dC3) (20) + ν(N1-C2) (17) + δ(C4-H11)
(11)892.5 1.4 n.o. n.o. A′′ γ(CH)R1 (113)876.4 7.5 881.8 w n.o. A′ δ(R2) (89)819.7 17.0 820.5 w 825.5 w A′′ γ(CH)R2 (99)740.0 64.9 748.5, 747.2 m 745.0 m A′ δ(C2C6O7) (36) + δ(R1) (28) + ν(C2-C6) (10)733.6 79.4 742.4, 741.4 m 740.0 m A′′ γ(CH)R3 (95)630.6 14.9 635.3 w 638.9 w A′′ τ(R2) (86) + τ(R1) (10)609.1 2.2 n.o. n.o. A′′ τ(R1) (97) + τ(R2) (11)492.6 73.1 509.6, 508.8, 506.8 m 518.8 m A′′ γ(N1-H8) (92)486.7 2.1 n.o. n.o. A′ ν(C2-C6) (30) + δ(C2C6O7) (24) + δ(R1) (19) + ν(C2dC3) (11)
+ [δ(C6C2C3) + δ(C6C2N1)] (11)246.8 7.0 n.i. n.i. A′′ τ(C6-C2) (50) + γ(C6-C2) (34) + + τ(R2) (13)200.0 5.6 n.i. n.i. A′ [δ(C6C2C3) + δ(C6C2N1)] (70) + δ(C2C6O7) (25)150.4 1.2 n.i. n.i. A′′ τ(C6-C2) (49) + γ(C6-C2) (47)
a B3LYP/6-311++G(d,p)-calculated (scaled by a factor 0.978) wavenumbers and intensities are also given.aWavenumbers in cm-1,calculated intensities in km mol-1. ν, bond stretching; δ, bending; γ, rocking; τ, torsion; w, wagging; tw, twisting; s, symmetric; as,antisymmetric; n.o., not observed; n.i., not investigated; w, weak; m, medium; S, strong; vS, very strong. b PEDs lower than 10% are notincluded. Definition of symmetry coordinates is given in Table S1 (Supporting Information). See Figure 1 for atom numbering.
Matrix-Isolated Pyrrole-2-carbaldehyde J. Phys. Chem. A, Vol. 114, No. 7, 2010 2513
through a conical intersection. This would account for theabsence of the heavy-atom effect in the xenon matrix on theconformational isomerization yield and also for the insensitivityof this process to local matrix interactions already pointed outin the previous section.
The observed cis f trans isomerization starts from the verybeginning of the irradiation and is much faster than thephotodecomposition process, which started to be clearly ob-served only after 10 min of irradiation. The apparent lag timefor observation of the photoproducts may be explained in severalways: (i) intrinsically weak intensities of pyrrole and COabsorptions hamper their experimental observation at the earlystages; (ii) the probability of decomposition under the presentirradiation conditions is much lower than for rotamerization;(iii) the requirement of initial production of the trans isomer,which would be the preferred reactant for decarbonylation. Itshall be noted that these possibilities are mutually nonexclusiveand may work in a synergetic way.
In order to understand the mechanism of isomerization/decomposition processes, the experimental data were fitted usingdifferent kinetical models. These models were kept as simple
as possible, assuming only the conformational isomerization andthe global photodecomposition process. The kinetic data usedwere the intensities of the νCdO bands of cis- and trans-P2Cand that of the carbon monoxide, reduced by the correspondingcalculated intensities and normalized for a unitary concentrationof the initial reactant (cis). The following models wereconsidered, where PP designates the photolysis products (pyrrole+ CO)
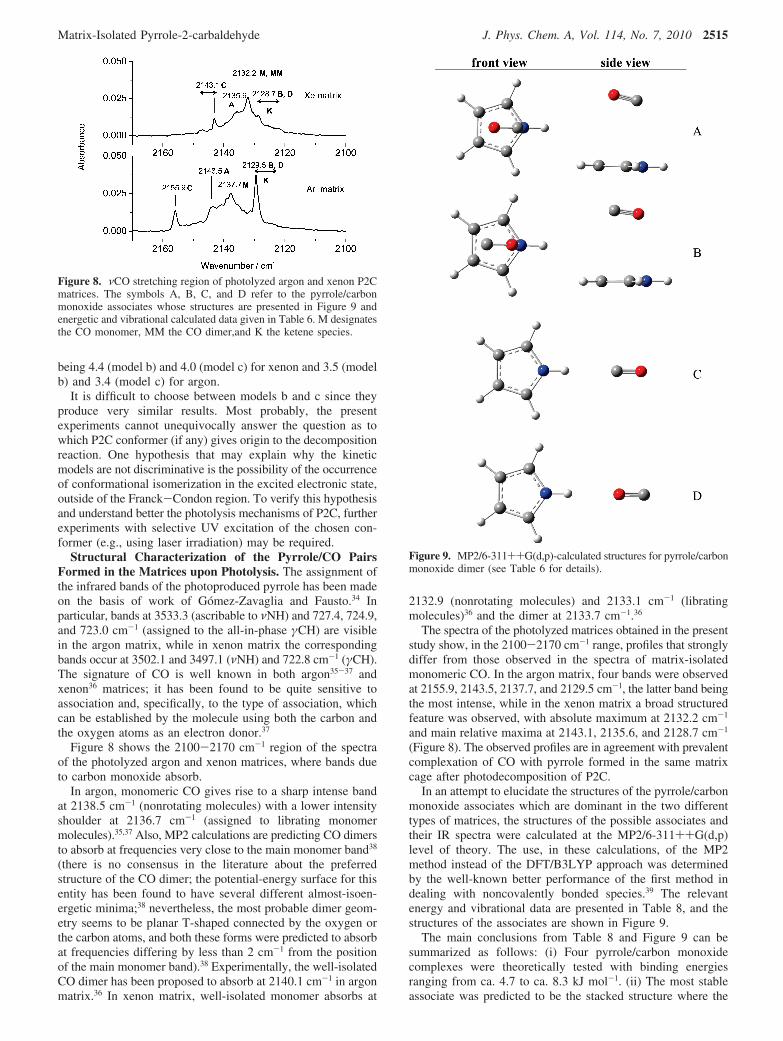
Models a and b imply that the decarbonylation reaction isconformer selective: a assumes that only the trans-P2C con-former undergoes significant photolysis to [pyrrole + CO], whileb assumes the same for the cis conformer. Model c assumesthat both conformers can undergo decomposition under thecurrent experimental conditions with equal probability. Thefitting corresponding to model b is graphically represented inFigure 7.
For all three models tested, the derived differential equationswere solved by numerical integration and fitted to the kineticdata using the MATLAB software package.31 The rate coef-ficients were used as fitting parameters. The obtained resultsare summarized in Table 7. Among the three models, model aresults in rotamerization and decomposition constants of thesame order of magnitude. This does not correspond to theexperimental observation where the rotamerization is muchfaster. On this basis, model a should be rejected. Models b andc correspond better to the experimental observation: they predictconstants for the decarbonylation process that are about 10 (Ar)or 20 (Xe) times smaller than the rotamerization constants. Asit could be expected, the heavy-atom effect taking place in thexenon matrix doubles the rate constant for the decarbonylationreaction in that matrix compared to argon. It is also worthy ofnote that the ratio of the rotamerization constants obtained inmodels b and c is close to the [cis]/[trans] ratio of 3.3experimentally observed for the photostationary equilibrium,
Figure 6. Population ratio of the two matrix-isolated P2C conformersin the progress of UV irradiation (λ > 235 nm) estimated from theintensities of the carbonyl stretching bands ascribed to the individualconformers. Integrated experimental absorptions were reduced by thecalculated ν(CdO) intensities.
Figure 7. Evolution with time of irradiation of the relative amountsof cis-P2C (b), trans-P2C (9), and carbon monoxide (1) in argon (A)and xenon (B) matrices. The experimental points were obtained fromthe intensities of the ν(CdO) bands ascribed to the individualconformers of P2C and carbon monoxide, reduced by the correspondingcalculated intensities. In the plots, the initial amount of the cis formwas normalized to unity. The curves were obtained by fitting kineticmodel b to the data points. Defining parameters of the curves anduncertainties in the parameters are given in the text.
TABLE 7: Rate Constants (min-1) Derived from the Fit ofData Obtained in Xenon and Argon Matrices During UVIrradiation
model k1 k-1 k2
xenon matrixmodel a 0.103 ( 0.031 0.329 ( 0.159 0.089 ( 0.016model b 0.095 ( 0.036 0.414 ( 0.200 0.021 ( 0.002model c 0.094 ( 0.033 0.379 ( 0.183 0.017 ( 0.002
argon matrixmodel a 0.047 ( 0.011 0.138 ( 0.051 0.0388 ( 0.0048model b 0.031 ( 0.005 0.108 ( 0.021 0.0100 ( 0.0003model c 0.033 ( 0.006 0.111 ( 0.026 0.0079 ( 0.0003
cis {\}k-1
k1
trans98k2
PP (a)
cisak1
k-1
trans
cis98k2
PP(b)
cis {\}k-1
k1
trans98k2
PP
cis98k2
PP(c)
2514 J. Phys. Chem. A, Vol. 114, No. 7, 2010 Giuliano et al.
being 4.4 (model b) and 4.0 (model c) for xenon and 3.5 (modelb) and 3.4 (model c) for argon.
It is difficult to choose between models b and c since theyproduce very similar results. Most probably, the presentexperiments cannot unequivocally answer the question as towhich P2C conformer (if any) gives origin to the decompositionreaction. One hypothesis that may explain why the kineticmodels are not discriminative is the possibility of the occurrenceof conformational isomerization in the excited electronic state,outside of the Franck-Condon region. To verify this hypothesisand understand better the photolysis mechanisms of P2C, furtherexperiments with selective UV excitation of the chosen con-former (e.g., using laser irradiation) may be required.
Structural Characterization of the Pyrrole/CO PairsFormed in the Matrices upon Photolysis. The assignment ofthe infrared bands of the photoproduced pyrrole has been madeon the basis of work of Gomez-Zavaglia and Fausto.34 Inparticular, bands at 3533.3 (ascribable to νNH) and 727.4, 724.9,and 723.0 cm-1 (assigned to the all-in-phase γCH) are visiblein the argon matrix, while in xenon matrix the correspondingbands occur at 3502.1 and 3497.1 (νNH) and 722.8 cm-1 (γCH).The signature of CO is well known in both argon35-37 andxenon36 matrices; it has been found to be quite sensitive toassociation and, specifically, to the type of association, whichcan be established by the molecule using both the carbon andthe oxygen atoms as an electron donor.37
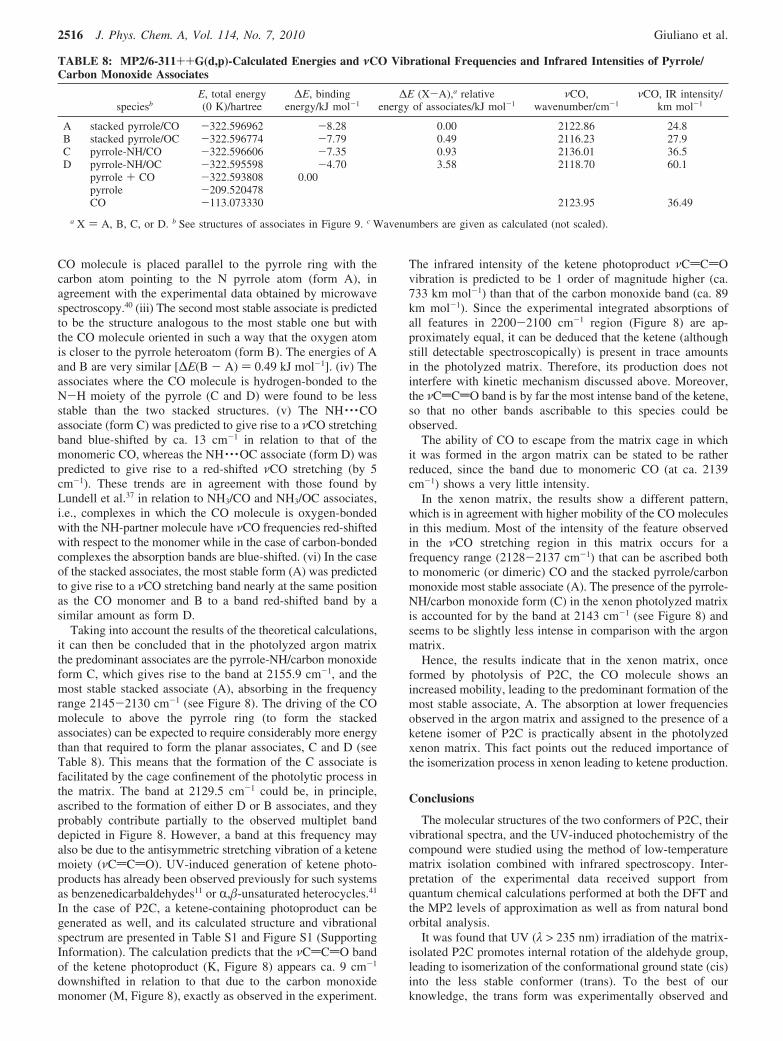
Figure 8 shows the 2100-2170 cm-1 region of the spectraof the photolyzed argon and xenon matrices, where bands dueto carbon monoxide absorb.
In argon, monomeric CO gives rise to a sharp intense bandat 2138.5 cm-1 (nonrotating molecules) with a lower intensityshoulder at 2136.7 cm-1 (assigned to librating monomermolecules).35,37 Also, MP2 calculations are predicting CO dimersto absorb at frequencies very close to the main monomer band38
(there is no consensus in the literature about the preferredstructure of the CO dimer; the potential-energy surface for thisentity has been found to have several different almost-isoen-ergetic minima;38 nevertheless, the most probable dimer geom-etry seems to be planar T-shaped connected by the oxygen orthe carbon atoms, and both these forms were predicted to absorbat frequencies differing by less than 2 cm-1 from the positionof the main monomer band).38 Experimentally, the well-isolatedCO dimer has been proposed to absorb at 2140.1 cm-1 in argonmatrix.36 In xenon matrix, well-isolated monomer absorbs at
2132.9 (nonrotating molecules) and 2133.1 cm-1 (libratingmolecules)36 and the dimer at 2133.7 cm-1.36
The spectra of the photolyzed matrices obtained in the presentstudy show, in the 2100-2170 cm-1 range, profiles that stronglydiffer from those observed in the spectra of matrix-isolatedmonomeric CO. In the argon matrix, four bands were observedat 2155.9, 2143.5, 2137.7, and 2129.5 cm-1, the latter band beingthe most intense, while in the xenon matrix a broad structuredfeature was observed, with absolute maximum at 2132.2 cm-1
and main relative maxima at 2143.1, 2135.6, and 2128.7 cm-1
(Figure 8). The observed profiles are in agreement with prevalentcomplexation of CO with pyrrole formed in the same matrixcage after photodecomposition of P2C.
In an attempt to elucidate the structures of the pyrrole/carbonmonoxide associates which are dominant in the two differenttypes of matrices, the structures of the possible associates andtheir IR spectra were calculated at the MP2/6-311++G(d,p)level of theory. The use, in these calculations, of the MP2method instead of the DFT/B3LYP approach was determinedby the well-known better performance of the first method indealing with noncovalently bonded species.39 The relevantenergy and vibrational data are presented in Table 8, and thestructures of the associates are shown in Figure 9.
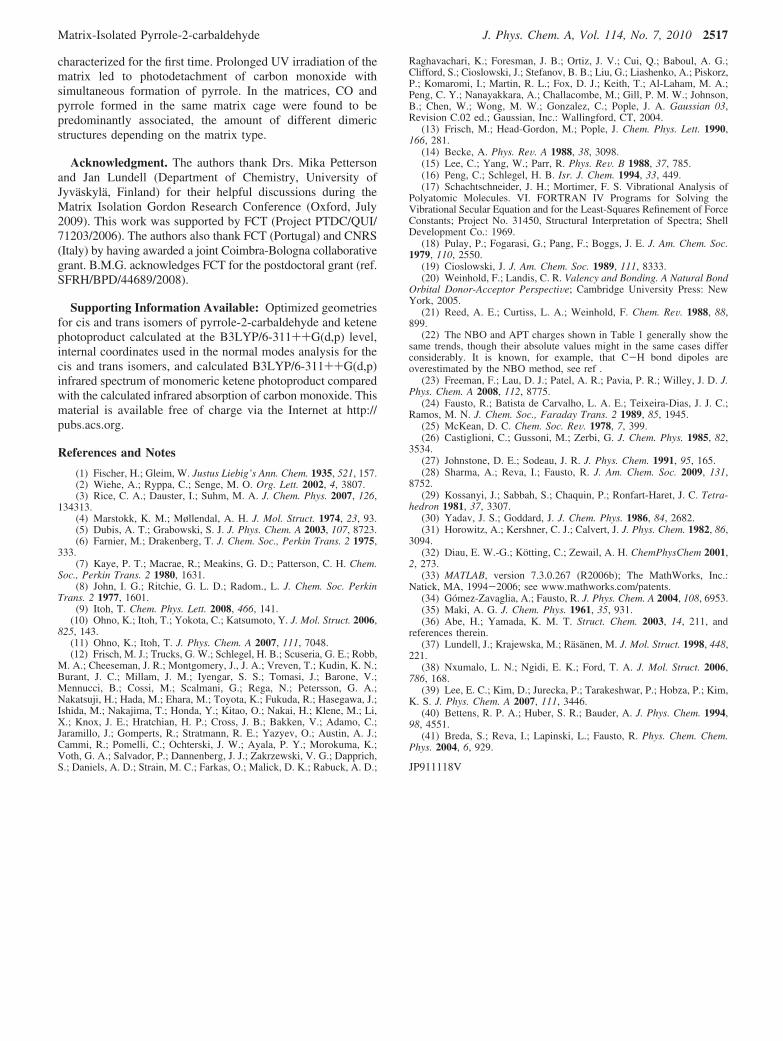
The main conclusions from Table 8 and Figure 9 can besummarized as follows: (i) Four pyrrole/carbon monoxidecomplexes were theoretically tested with binding energiesranging from ca. 4.7 to ca. 8.3 kJ mol-1. (ii) The most stableassociate was predicted to be the stacked structure where the
Figure 8. νCO stretching region of photolyzed argon and xenon P2Cmatrices. The symbols A, B, C, and D refer to the pyrrole/carbonmonoxide associates whose structures are presented in Figure 9 andenergetic and vibrational calculated data given in Table 6. M designatesthe CO monomer, MM the CO dimer,and K the ketene species.
Figure 9. MP2/6-311++G(d,p)-calculated structures for pyrrole/carbonmonoxide dimer (see Table 6 for details).
Matrix-Isolated Pyrrole-2-carbaldehyde J. Phys. Chem. A, Vol. 114, No. 7, 2010 2515
CO molecule is placed parallel to the pyrrole ring with thecarbon atom pointing to the N pyrrole atom (form A), inagreement with the experimental data obtained by microwavespectroscopy.40 (iii) The second most stable associate is predictedto be the structure analogous to the most stable one but withthe CO molecule oriented in such a way that the oxygen atomis closer to the pyrrole heteroatom (form B). The energies of Aand B are very similar [∆E(B - A) ) 0.49 kJ mol-1]. (iv) Theassociates where the CO molecule is hydrogen-bonded to theN-H moiety of the pyrrole (C and D) were found to be lessstable than the two stacked structures. (v) The NH · · ·COassociate (form C) was predicted to give rise to a νCO stretchingband blue-shifted by ca. 13 cm-1 in relation to that of themonomeric CO, whereas the NH · · ·OC associate (form D) waspredicted to give rise to a red-shifted νCO stretching (by 5cm-1). These trends are in agreement with those found byLundell et al.37 in relation to NH3/CO and NH3/OC associates,i.e., complexes in which the CO molecule is oxygen-bondedwith the NH-partner molecule have νCO frequencies red-shiftedwith respect to the monomer while in the case of carbon-bondedcomplexes the absorption bands are blue-shifted. (vi) In the caseof the stacked associates, the most stable form (A) was predictedto give rise to a νCO stretching band nearly at the same positionas the CO monomer and B to a band red-shifted band by asimilar amount as form D.
Taking into account the results of the theoretical calculations,it can then be concluded that in the photolyzed argon matrixthe predominant associates are the pyrrole-NH/carbon monoxideform C, which gives rise to the band at 2155.9 cm-1, and themost stable stacked associate (A), absorbing in the frequencyrange 2145-2130 cm-1 (see Figure 8). The driving of the COmolecule to above the pyrrole ring (to form the stackedassociates) can be expected to require considerably more energythan that required to form the planar associates, C and D (seeTable 8). This means that the formation of the C associate isfacilitated by the cage confinement of the photolytic process inthe matrix. The band at 2129.5 cm-1 could be, in principle,ascribed to the formation of either D or B associates, and theyprobably contribute partially to the observed multiplet banddepicted in Figure 8. However, a band at this frequency mayalso be due to the antisymmetric stretching vibration of a ketenemoiety (νCdCdO). UV-induced generation of ketene photo-products has already been observed previously for such systemsas benzenedicarbaldehydes11 or R,�-unsaturated heterocycles.41
In the case of P2C, a ketene-containing photoproduct can begenerated as well, and its calculated structure and vibrationalspectrum are presented in Table S1 and Figure S1 (SupportingInformation). The calculation predicts that the νCdCdO bandof the ketene photoproduct (K, Figure 8) appears ca. 9 cm-1
downshifted in relation to that due to the carbon monoxidemonomer (M, Figure 8), exactly as observed in the experiment.
The infrared intensity of the ketene photoproduct νCdCdOvibration is predicted to be 1 order of magnitude higher (ca.733 km mol-1) than that of the carbon monoxide band (ca. 89km mol-1). Since the experimental integrated absorptions ofall features in 2200-2100 cm-1 region (Figure 8) are ap-proximately equal, it can be deduced that the ketene (althoughstill detectable spectroscopically) is present in trace amountsin the photolyzed matrix. Therefore, its production does notinterfere with kinetic mechanism discussed above. Moreover,the νCdCdO band is by far the most intense band of the ketene,so that no other bands ascribable to this species could beobserved.
The ability of CO to escape from the matrix cage in whichit was formed in the argon matrix can be stated to be ratherreduced, since the band due to monomeric CO (at ca. 2139cm-1) shows a very little intensity.
In the xenon matrix, the results show a different pattern,which is in agreement with higher mobility of the CO moleculesin this medium. Most of the intensity of the feature observedin the νCO stretching region in this matrix occurs for afrequency range (2128-2137 cm-1) that can be ascribed bothto monomeric (or dimeric) CO and the stacked pyrrole/carbonmonoxide most stable associate (A). The presence of the pyrrole-NH/carbon monoxide form (C) in the xenon photolyzed matrixis accounted for by the band at 2143 cm-1 (see Figure 8) andseems to be slightly less intense in comparison with the argonmatrix.
Hence, the results indicate that in the xenon matrix, onceformed by photolysis of P2C, the CO molecule shows anincreased mobility, leading to the predominant formation of themost stable associate, A. The absorption at lower frequenciesobserved in the argon matrix and assigned to the presence of aketene isomer of P2C is practically absent in the photolyzedxenon matrix. This fact points out the reduced importance ofthe isomerization process in xenon leading to ketene production.
Conclusions
The molecular structures of the two conformers of P2C, theirvibrational spectra, and the UV-induced photochemistry of thecompound were studied using the method of low-temperaturematrix isolation combined with infrared spectroscopy. Inter-pretation of the experimental data received support fromquantum chemical calculations performed at both the DFT andthe MP2 levels of approximation as well as from natural bondorbital analysis.
It was found that UV (λ > 235 nm) irradiation of the matrix-isolated P2C promotes internal rotation of the aldehyde group,leading to isomerization of the conformational ground state (cis)into the less stable conformer (trans). To the best of ourknowledge, the trans form was experimentally observed and
TABLE 8: MP2/6-311++G(d,p)-Calculated Energies and νCO Vibrational Frequencies and Infrared Intensities of Pyrrole/Carbon Monoxide Associates
speciesbE, total energy(0 K)/hartree
∆E, bindingenergy/kJ mol-1
∆E (X-A),a relativeenergy of associates/kJ mol-1
νCO,wavenumber/cm-1
νCO, IR intensity/km mol-1
A stacked pyrrole/CO -322.596962 -8.28 0.00 2122.86 24.8B stacked pyrrole/OC -322.596774 -7.79 0.49 2116.23 27.9C pyrrole-NH/CO -322.596606 -7.35 0.93 2136.01 36.5D pyrrole-NH/OC -322.595598 -4.70 3.58 2118.70 60.1
pyrrole + CO -322.593808 0.00pyrrole -209.520478CO -113.073330 2123.95 36.49
a X ) A, B, C, or D. b See structures of associates in Figure 9. c Wavenumbers are given as calculated (not scaled).
2516 J. Phys. Chem. A, Vol. 114, No. 7, 2010 Giuliano et al.
characterized for the first time. Prolonged UV irradiation of thematrix led to photodetachment of carbon monoxide withsimultaneous formation of pyrrole. In the matrices, CO andpyrrole formed in the same matrix cage were found to bepredominantly associated, the amount of different dimericstructures depending on the matrix type.
Acknowledgment. The authors thank Drs. Mika Pettersonand Jan Lundell (Department of Chemistry, University ofJyvaskyla, Finland) for their helpful discussions during theMatrix Isolation Gordon Research Conference (Oxford, July2009). This work was supported by FCT (Project PTDC/QUI/71203/2006). The authors also thank FCT (Portugal) and CNRS(Italy) by having awarded a joint Coimbra-Bologna collaborativegrant. B.M.G. acknowledges FCT for the postdoctoral grant (ref.SFRH/BPD/44689/2008).
Supporting Information Available: Optimized geometriesfor cis and trans isomers of pyrrole-2-carbaldehyde and ketenephotoproduct calculated at the B3LYP/6-311++G(d,p) level,internal coordinates used in the normal modes analysis for thecis and trans isomers, and calculated B3LYP/6-311++G(d,p)infrared spectrum of monomeric ketene photoproduct comparedwith the calculated infrared absorption of carbon monoxide. Thismaterial is available free of charge via the Internet at http://pubs.acs.org.
References and Notes
(1) Fischer, H.; Gleim, W. Justus Liebig’s Ann. Chem. 1935, 521, 157.(2) Wiehe, A.; Ryppa, C.; Senge, M. O. Org. Lett. 2002, 4, 3807.(3) Rice, C. A.; Dauster, I.; Suhm, M. A. J. Chem. Phys. 2007, 126,
134313.(4) Marstokk, K. M.; Møllendal, A. H. J. Mol. Struct. 1974, 23, 93.(5) Dubis, A. T.; Grabowski, S. J. J. Phys. Chem. A 2003, 107, 8723.(6) Farnier, M.; Drakenberg, T. J. Chem. Soc., Perkin Trans. 2 1975,
333.(7) Kaye, P. T.; Macrae, R.; Meakins, G. D.; Patterson, C. H. Chem.
Soc., Perkin Trans. 2 1980, 1631.(8) John, I. G.; Ritchie, G. L. D.; Radom., L. J. Chem. Soc. Perkin
Trans. 2 1977, 1601.(9) Itoh, T. Chem. Phys. Lett. 2008, 466, 141.
(10) Ohno, K.; Itoh, T.; Yokota, C.; Katsumoto, Y. J. Mol. Struct. 2006,825, 143.
(11) Ohno, K.; Itoh, T. J. Phys. Chem. A 2007, 111, 7048.(12) Frisch, M. J.; Trucks, G. W.; Schlegel, H. B.; Scuseria, G. E.; Robb,
M. A.; Cheeseman, J. R.; Montgomery, J., J. A.; Vreven, T.; Kudin, K. N.;Burant, J. C.; Millam, J. M.; Iyengar, S. S.; Tomasi, J.; Barone, V.;Mennucci, B.; Cossi, M.; Scalmani, G.; Rega, N.; Petersson, G. A.;Nakatsuji, H.; Hada, M.; Ehara, M.; Toyota, K.; Fukuda, R.; Hasegawa, J.;Ishida, M.; Nakajima, T.; Honda, Y.; Kitao, O.; Nakai, H.; Klene, M.; Li,X.; Knox, J. E.; Hratchian, H. P.; Cross, J. B.; Bakken, V.; Adamo, C.;Jaramillo, J.; Gomperts, R.; Stratmann, R. E.; Yazyev, O.; Austin, A. J.;Cammi, R.; Pomelli, C.; Ochterski, J. W.; Ayala, P. Y.; Morokuma, K.;Voth, G. A.; Salvador, P.; Dannenberg, J. J.; Zakrzewski, V. G.; Dapprich,S.; Daniels, A. D.; Strain, M. C.; Farkas, O.; Malick, D. K.; Rabuck, A. D.;
Raghavachari, K.; Foresman, J. B.; Ortiz, J. V.; Cui, Q.; Baboul, A. G.;Clifford, S.; Cioslowski, J.; Stefanov, B. B.; Liu, G.; Liashenko, A.; Piskorz,P.; Komaromi, I.; Martin, R. L.; Fox, D. J.; Keith, T.; Al-Laham, M. A.;Peng, C. Y.; Nanayakkara, A.; Challacombe, M.; Gill, P. M. W.; Johnson,B.; Chen, W.; Wong, M. W.; Gonzalez, C.; Pople, J. A. Gaussian 03,Revision C.02 ed.; Gaussian, Inc.: Wallingford, CT, 2004.
(13) Frisch, M.; Head-Gordon, M.; Pople, J. Chem. Phys. Lett. 1990,166, 281.
(14) Becke, A. Phys. ReV. A 1988, 38, 3098.(15) Lee, C.; Yang, W.; Parr, R. Phys. ReV. B 1988, 37, 785.(16) Peng, C.; Schlegel, H. B. Isr. J. Chem. 1994, 33, 449.(17) Schachtschneider, J. H.; Mortimer, F. S. Vibrational Analysis of
Polyatomic Molecules. VI. FORTRAN IV Programs for Solving theVibrational Secular Equation and for the Least-Squares Refinement of ForceConstants; Project No. 31450, Structural Interpretation of Spectra; ShellDevelopment Co.: 1969.
(18) Pulay, P.; Fogarasi, G.; Pang, F.; Boggs, J. E. J. Am. Chem. Soc.1979, 110, 2550.
(19) Cioslowski, J. J. Am. Chem. Soc. 1989, 111, 8333.(20) Weinhold, F.; Landis, C. R. Valency and Bonding. A Natural Bond
Orbital Donor-Acceptor PerspectiVe; Cambridge University Press: NewYork, 2005.
(21) Reed, A. E.; Curtiss, L. A.; Weinhold, F. Chem. ReV. 1988, 88,899.
(22) The NBO and APT charges shown in Table 1 generally show thesame trends, though their absolute values might in the same cases differconsiderably. It is known, for example, that C-H bond dipoles areoverestimated by the NBO method, see ref .
(23) Freeman, F.; Lau, D. J.; Patel, A. R.; Pavia, P. R.; Willey, J. D. J.Phys. Chem. A 2008, 112, 8775.
(24) Fausto, R.; Batista de Carvalho, L. A. E.; Teixeira-Dias, J. J. C.;Ramos, M. N. J. Chem. Soc., Faraday Trans. 2 1989, 85, 1945.
(25) McKean, D. C. Chem. Soc. ReV. 1978, 7, 399.(26) Castiglioni, C.; Gussoni, M.; Zerbi, G. J. Chem. Phys. 1985, 82,
3534.(27) Johnstone, D. E.; Sodeau, J. R. J. Phys. Chem. 1991, 95, 165.(28) Sharma, A.; Reva, I.; Fausto, R. J. Am. Chem. Soc. 2009, 131,
8752.(29) Kossanyi, J.; Sabbah, S.; Chaquin, P.; Ronfart-Haret, J. C. Tetra-
hedron 1981, 37, 3307.(30) Yadav, J. S.; Goddard, J. J. Chem. Phys. 1986, 84, 2682.(31) Horowitz, A.; Kershner, C. J.; Calvert, J. J. Phys. Chem. 1982, 86,
3094.(32) Diau, E. W.-G.; Kotting, C.; Zewail, A. H. ChemPhysChem 2001,
2, 273.(33) MATLAB, version 7.3.0.267 (R2006b); The MathWorks, Inc.:
Natick, MA, 1994-2006; see www.mathworks.com/patents.(34) Gomez-Zavaglia, A.; Fausto, R. J. Phys. Chem. A 2004, 108, 6953.(35) Maki, A. G. J. Chem. Phys. 1961, 35, 931.(36) Abe, H.; Yamada, K. M. T. Struct. Chem. 2003, 14, 211, and
references therein.(37) Lundell, J.; Krajewska, M.; Rasanen, M. J. Mol. Struct. 1998, 448,
221.(38) Nxumalo, L. N.; Ngidi, E. K.; Ford, T. A. J. Mol. Struct. 2006,
786, 168.(39) Lee, E. C.; Kim, D.; Jurecka, P.; Tarakeshwar, P.; Hobza, P.; Kim,
K. S. J. Phys. Chem. A 2007, 111, 3446.(40) Bettens, R. P. A.; Huber, S. R.; Bauder, A. J. Phys. Chem. 1994,
98, 4551.(41) Breda, S.; Reva, I.; Lapinski, L.; Fausto, R. Phys. Chem. Chem.
Phys. 2004, 6, 929.
JP911118V
Matrix-Isolated Pyrrole-2-carbaldehyde J. Phys. Chem. A, Vol. 114, No. 7, 2010 2517


![Shadrack J. Adjogri, Peter A. Ajibade, Opeoluwa O. Oyedeji ......Substituents effect on the electronic structure, spectra and photochemistry of [Ru (NH3) 5 (Py-X)] 2+ complexes. Inorg](https://img.pdfslide.us/doc/110x75/5f7b82d500794a7dfe428454/shadrack-j-adjogri-peter-a-ajibade-opeoluwa-o-oyedeji-substituents.jpg)